Article

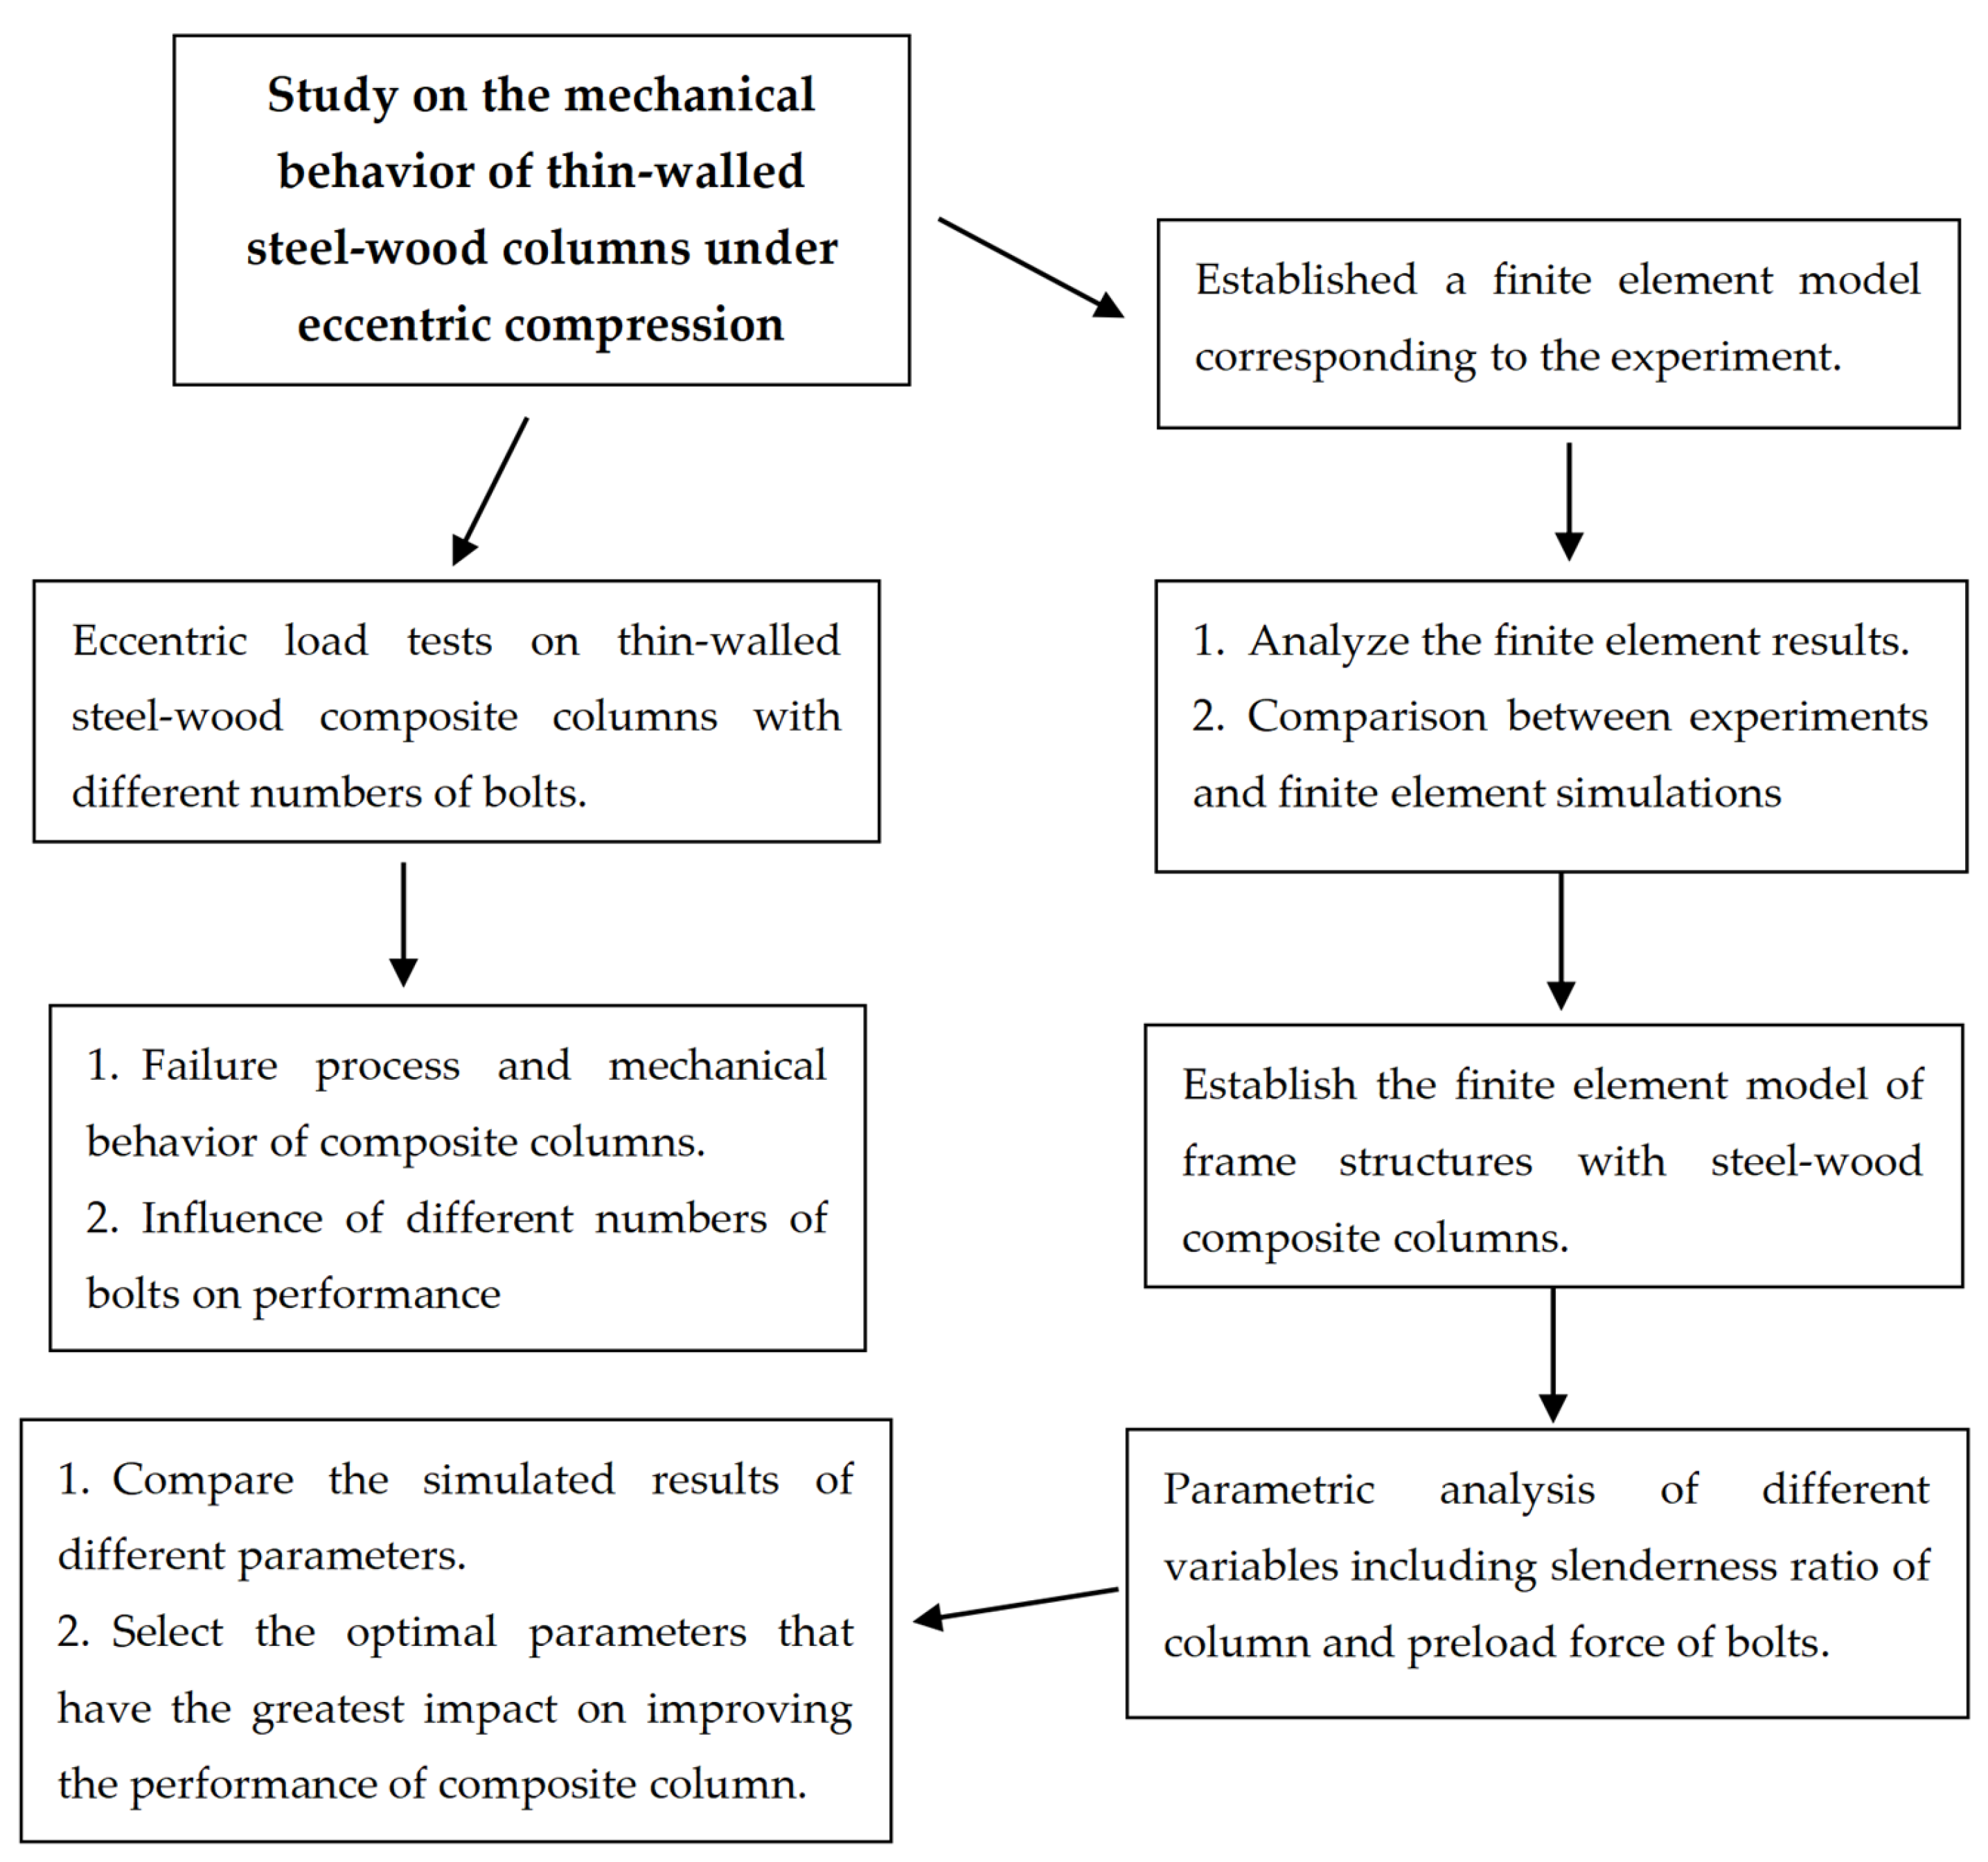
Experiment and Finite Element Research on Mechanical Performance of Thin-Walled Steel–Wood Composite Columns Under Eccentric Compression

1
Department of Civil Engineering, Jiangsu University of Science and Technology, Changhui Road, Dantu District, Zhenjiang 212100, China
2
Guizhou Zhongjian Weiye Construction (Group) Co., Ltd., Kaili 556000, China
3
Department of Civil Engineering, Kaili University, Kaiyuan Road, Economic Development Zone, Kaili 556011, China
*
Authors to whom correspondence should be addressed.
Buildings 2025, 15(12), 2114; https://doi.org/10.3390/buildings15122114
Submission received: 8 May 2025 / Revised: 7 June 2025 / Accepted: 9 June 2025 / Published: 18 June 2025
(This article belongs to the Section Building Structures)

Abstract

:
In order to conduct an in-depth and exhaustive investigation into the mechanical properties of steel tubes filled with wood, a thin-walled steel–wood composite column was elaborately designed. The damage progression, failure mode, and mechanical performance of this column under eccentric compression were systematically investigated through both experimental research and finite element simulations. The impacts of different numbers of bolts on the mechanical properties of the composite column were minutely analyzed, and the test results of composite columns were compared with the pure steel pipe column under the same experimental conditions. It was clearly observed that the pure thin-walled steel pipe specimen was highly susceptible to elastic instability under eccentric compression, and the high-strength and high-ductility potential of structural steel was not fully developed. However, after filling with wood and applying bolt restraints, the greater the number of bolts in the specimen of thin-walled steel–wood composite column under the identical eccentricity condition, the higher the ultimate load-bearing capacity. Specifically, the ultimate load-bearing capacity of the columns filled with wood increased by 77.78–114% in comparison with that of the pure steel pipe column. Through a meticulous comparison between the test and finite element analysis results, the error was ascertained to be in the range of 4.9–11.1%. In addition, filling the thin-walled steel tube with wood and restraining it with bolts can effectively enhance the lateral deformation resistance of the specimens, and the reduction rate of lateral deflection exceeded 50%. Moreover, the greater the number of filling bolts, the smaller the strain of components subjected to the eccentric compression occurred, and the better the mechanical properties.

1. Introduction

In the context of the rapid progress of infrastructure construction in China and the substantial energy consumption within the construction industry, there is an extremely urgent necessity to select a novel type of building material to substitute the traditional reinforced concrete [1,2]. Wood, as a renewable, lightweight, and environmentally friendly material, notably exhibits excellent thermal insulation characteristics. Nevertheless, it inherently possesses the numerous internal flaws [3,4,5]. On the other hand, steel is homogeneous, highly malleable, efficient in production and manufacturing processes, and demonstrates commendable seismic performance [6,7,8,9,10,11]. The integration of these two materials can effectively play a role in complementing each other. In recent years, a substantial number of scholars have carried out in-depth research on similar combinations of materials. These investigations convincingly demonstrate that the design schemes of multi-material constraints not only significantly boost the ultimate load-bearing capacity of structural members but also remarkably enhance the ductility index. As a result, these members become more dependable and secure when subjected to external loads, thereby furnishing practical and viable solutions for engineering applications.
Laiyun et al. [12] utilized GFRP panels and lattice webs wrapped around wooden square columns to form a completely new member and investigated its damage characteristics. The experimental results showed that increasing the number of layers of GFRP panels can improve the load-bearing capacity and stiffness of the member. However, too many panels may reduce its stiffness.
Satheeskumar et al. [13] modeled a timber-infilled steel tubular column (TIST column) by using finite element computation software and verified the performance of TIST columns in comparison to that of concrete. The test results verified the performance of TIST columns, which showed a maximum increase of 60% in load-bearing capacity and 65% in ductility compared to concrete-filled steel tubular columns.
Hu et al. [14] conducted axial compression tests on steel–wood composite columns bonded by H-sections and glued plywood. The results showed that the length of the column had the greatest influence on the mechanical properties of composite columns.
Yang et al. [15] conducted the static push-out tests on 48 members composed of I-beams and glued plywood. The results showed that the magnitude of ultimate bearing capacity increased with the increase in bolt diameter and decreased with the increase in bolt spacing.
Qiao et al. [16] investigated the axial compressive behavior of square timber-filled steel tube (TFST) stub columns, and test results showed that the TFST columns have higher strength and ductility compared with the hollow steel tube columns or the bare timber columns.
Ghazijahani et al. [17] constructed a steel tube concrete skeleton by filling circular and cruciform wood columns with steel tubes and constructing them with timber. Then, CFRP cloth was applied to the exterior of steel tube. The results in the axial compressive tests showed that the damage mode of the combined timber columns with CFRP restraints was plastic buckling damage, and their ductility and load-bearing capacity were significantly improved.
Heinisuo et al. [18] and Wu et al. [19] proposed the design solutions of steel–wood combined beams. Each of their studies showed that the combined steel–timber beams had both higher flexural stiffness and higher compressive load-bearing capacity.
Fubin et al. [20] proposed an innovative composite sandwich structure by combining GFRP skins, cold-formed profiled steel plates and a lightweight balsa wood core. Three-point bending tests were carried out on 11 specimens. The results showed that the load-bearing capacity of the newly proposed composite structure was increased by 68–194% and 53–83% at the normal service limit state and load-bearing capacity limit state, respectively, when compared to specimens without cold-formed profiled steel plate reinforcement.
Vogiatzis et al. [21] investigated the effect of each performance parameter on the response of the wood–steel shear wall system through finite element simulation. It was found that the thickness of the slab wall had a significant effect on the initial stiffness and the peak load-bearing capacity, while changing this parameter may not change the failure mode of the system.
Similarly, recent studies on desert sand concrete-filled steel tube (DS-CFST) members highlight their potential for sustainable construction. Sadat et al. [22,23] investigated axially loaded rectangular and circular DS-CFST stub columns, revealing that higher desert sand replacement ratios marginally reduce confinement efficiency and ultimate capacity, though steel strength and cross-sectional properties remain the dominant design factors. Their proposed simplified formulas demonstrated strong predictive accuracy and reliability. Zhang et al. [24] examined flexural behavior, confirming that desert sand replacement has negligible effects on bending capacity, further supporting the structural viability of DS-CFST members.
It can be observed that in recent years, numerous scholars have proposed various composite materials and conducted research on their specific mechanical performance. Regarding the steel–wood composite structures, existing studies primarily focus on the systematic research of axial compression performance, optimization of flexural capacity and ductility, and the interfacial mechanism of steel–wood connections. However, the investigation on the eccentric compression behavior of steel–wood composite columns remains incomplete, with research in this area still in its infancy. The integration of theoretical models with engineering specifications is yet to be fully established, necessitating future expansion towards multiple loading conditions, long-term performance, and standardization.
This study innovatively proposed a thin-walled steel–wood composite column utilized to strength and improve the mechanical performance of steel pipe in the building structure located in the high-intensity seismic area. By combining experimental and finite element simulation methods, the mechanical behavior and failure process of this composite column under eccentric loading were investigated, contributing to filling the existing gap in the literature. Additionally, this study provided certain reference for research on the synergistic behavior between Chinese fir timber and steel.
To explore the failure mode and mechanical property of this composite column under typical unidirectional eccentric loading, thin-walled steel–wood composite column specimens with varying parameters were designed based on the existing research. These specimens were constructed by filling timber inside the thin-walled steel tubes and strengthening the connection with bolts to enhance the synergistic interaction between steel and timber. Through a well-designed experimental program, the eccentric compression capacity and failure process of each specimen were obtained. The load-bearing capacity and deformation ability of composite columns with different bolt configurations were compared under eccentric loading, and their performance was contrasted with that of pure steel columns with the identical cross-sections. Finally, an effective finite element model of the thin-walled steel–wood composite column was established using the software of ABAQUS V6.11. Through simulation analysis, information such as the deformation process, stress distribution, and failure mode under eccentric loading was derived and validated against experimental data, confirming the accuracy and rationality of the finite element simulation. Finally, a parametric analysis was conducted to evaluate the impact of the slenderness ratio of the column and bolt pretension on the mechanical performance of the composite column, providing a more comprehensive understanding of the factors influencing the compression-bending behavior of steel–timber composite columns. The technical roadmap is illustrated in Figure 1.

2. Experimental Setup and Design of Test Specimens
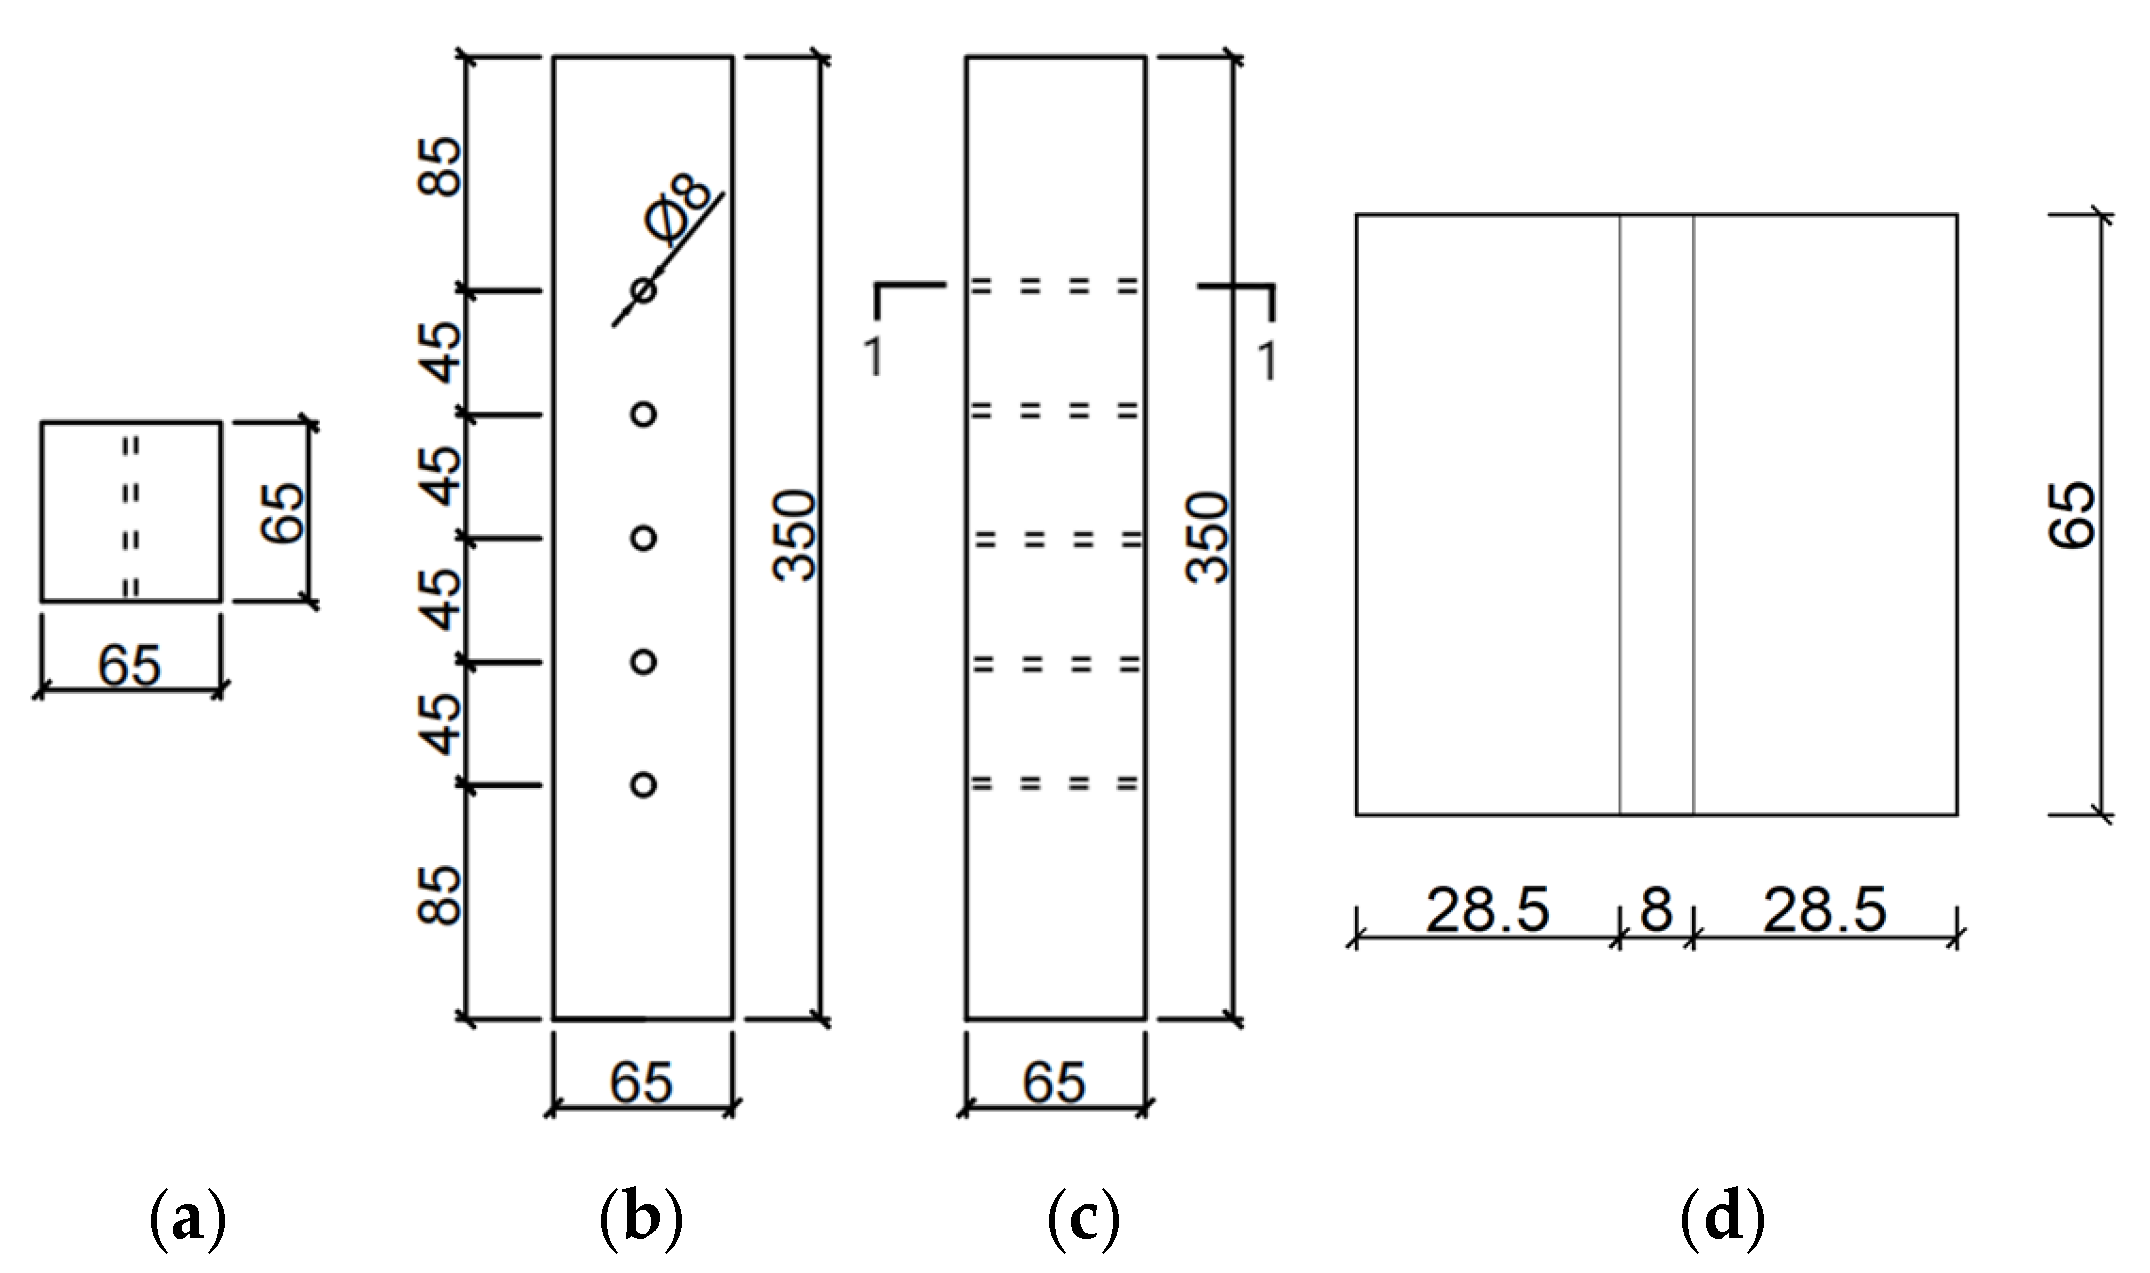
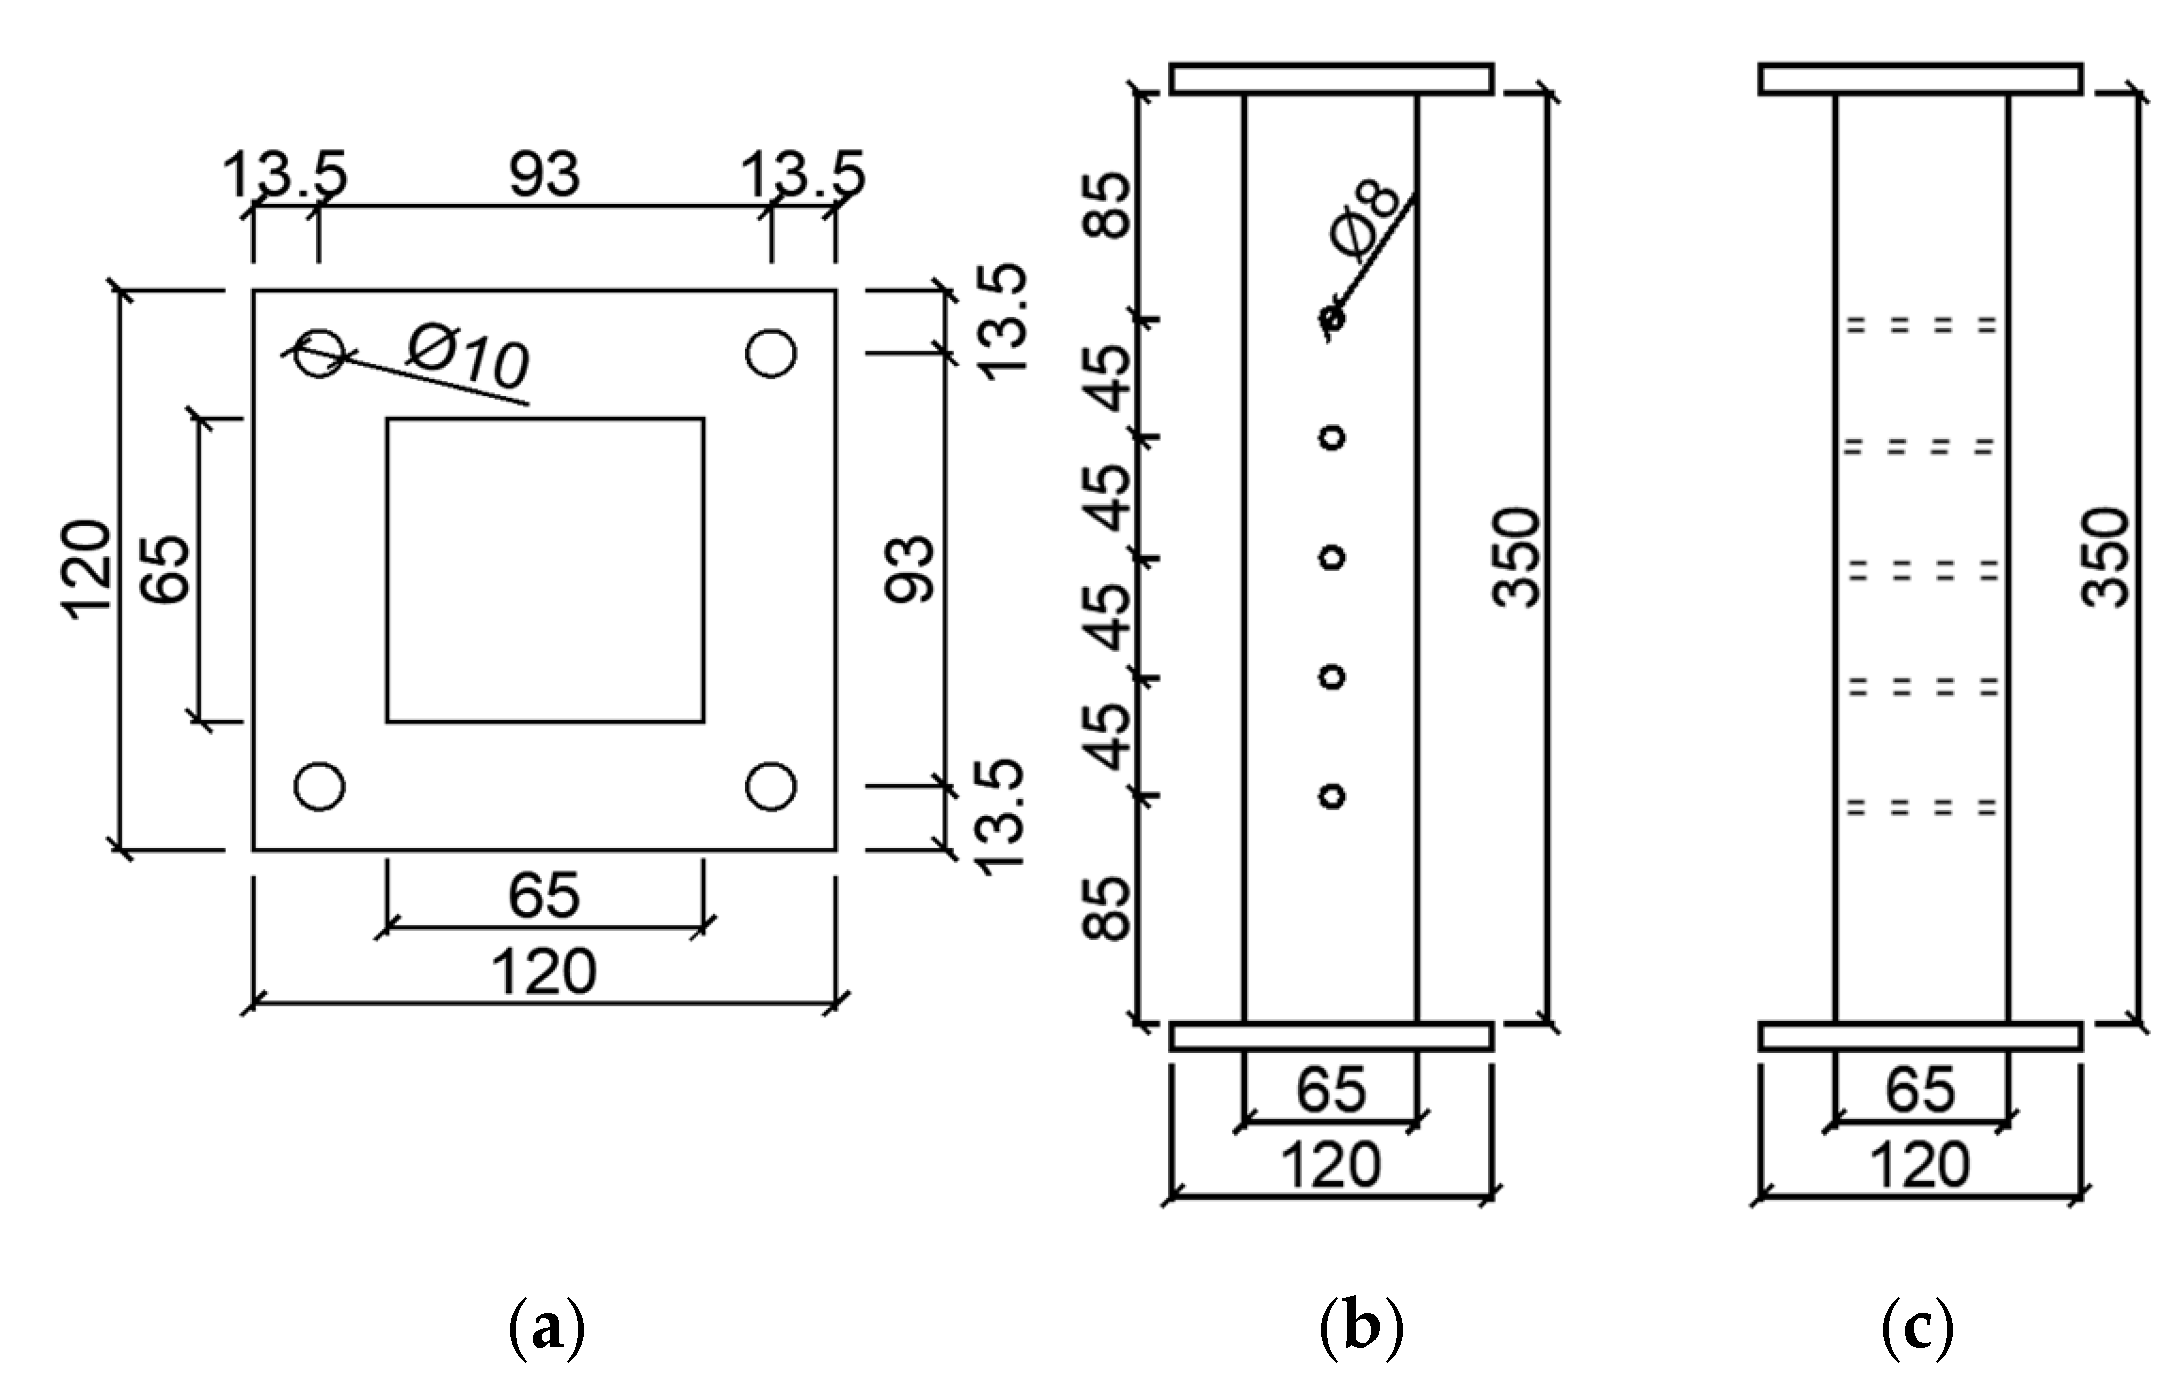
2.1. Specimen Size

In order to comprehensively explore the influence of wood filling on the mechanical properties of the composite column, this experimental design was focused on making a comparison between the composite column filled with wood and a pure steel pipe. Simultaneously, specimens with different numbers of bolts were meticulously prepared to thoroughly study the impact of varying bolt quantities on the synergistic performance and eccentric load-bearing capacity between the steel and the wood within the composite column. In total, there were three specimens. Each specimen had dimensions of 350 × 65 × 65 mm, with the 1.5 mm thickness of steel pipe. The compression eccentricity was set at 60 mm. A drilling machine was employed to drill holes in the wooden column, and the diameter of each wooden hole was 8 mm.
Drilling equipment was initially utilized to create corresponding bolt holes in the timber columns and thin-walled steel tubes in accordance with the designed dimensions. Subsequently, the timber columns were precisely aligned and positioned within the thin-walled steel tubes, ensuring that the cross-sections of the timber columns and the thin-walled steel tubes were perfectly flush at both the top and bottom. Washers were then placed at the bolt holes, followed by the installation of high-strength bolts. Finally, the bolts were tightened with a wrench to complete the assembly of the specimen. The design drawing of the assembled thin-walled steel–timber composite member is illustrated in Figure 2.
The design parameters of each specimen are presented in Table 1. Specifically, specimen G1 was a pure steel tube, whereas specimens G2 and G3 were steel–wood composite members with the different connecting numbers of bolts. In these two composite specimens, the steel tubes were filled with wood and fastened by bolts with a bolt spacing of 45 mm. To be more detailed, specimen G2 was secured by 3 bolts, while specimen G3 was fastened by 5 bolts. For the purpose of illustration, taking the specimen G3 as an example, the dimensional three-view drawing and a cross-sectional view of the wood block are shown in Figure 3, the dimensional three-view drawing of the steel pipe is shown in Figure 4, and the three-dimensional and dimensional three-view drawing of fixed groove is presented in Figure 5.

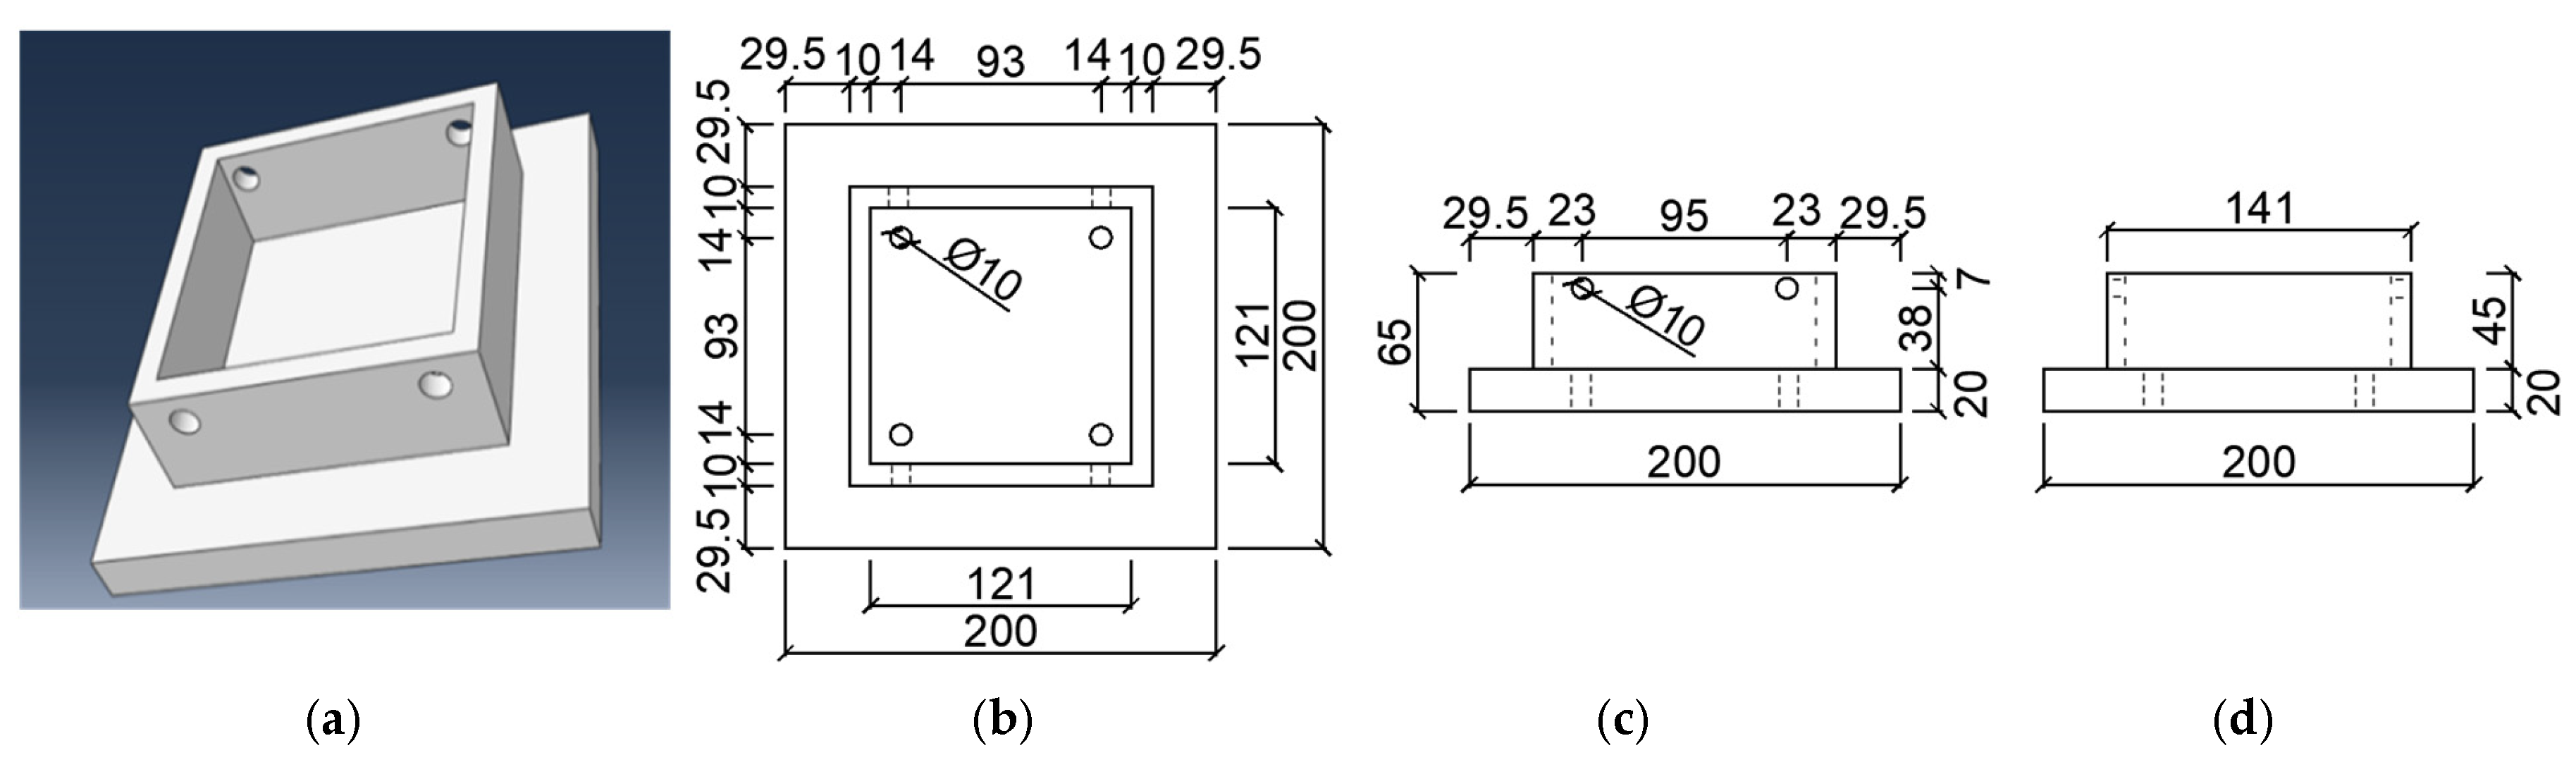
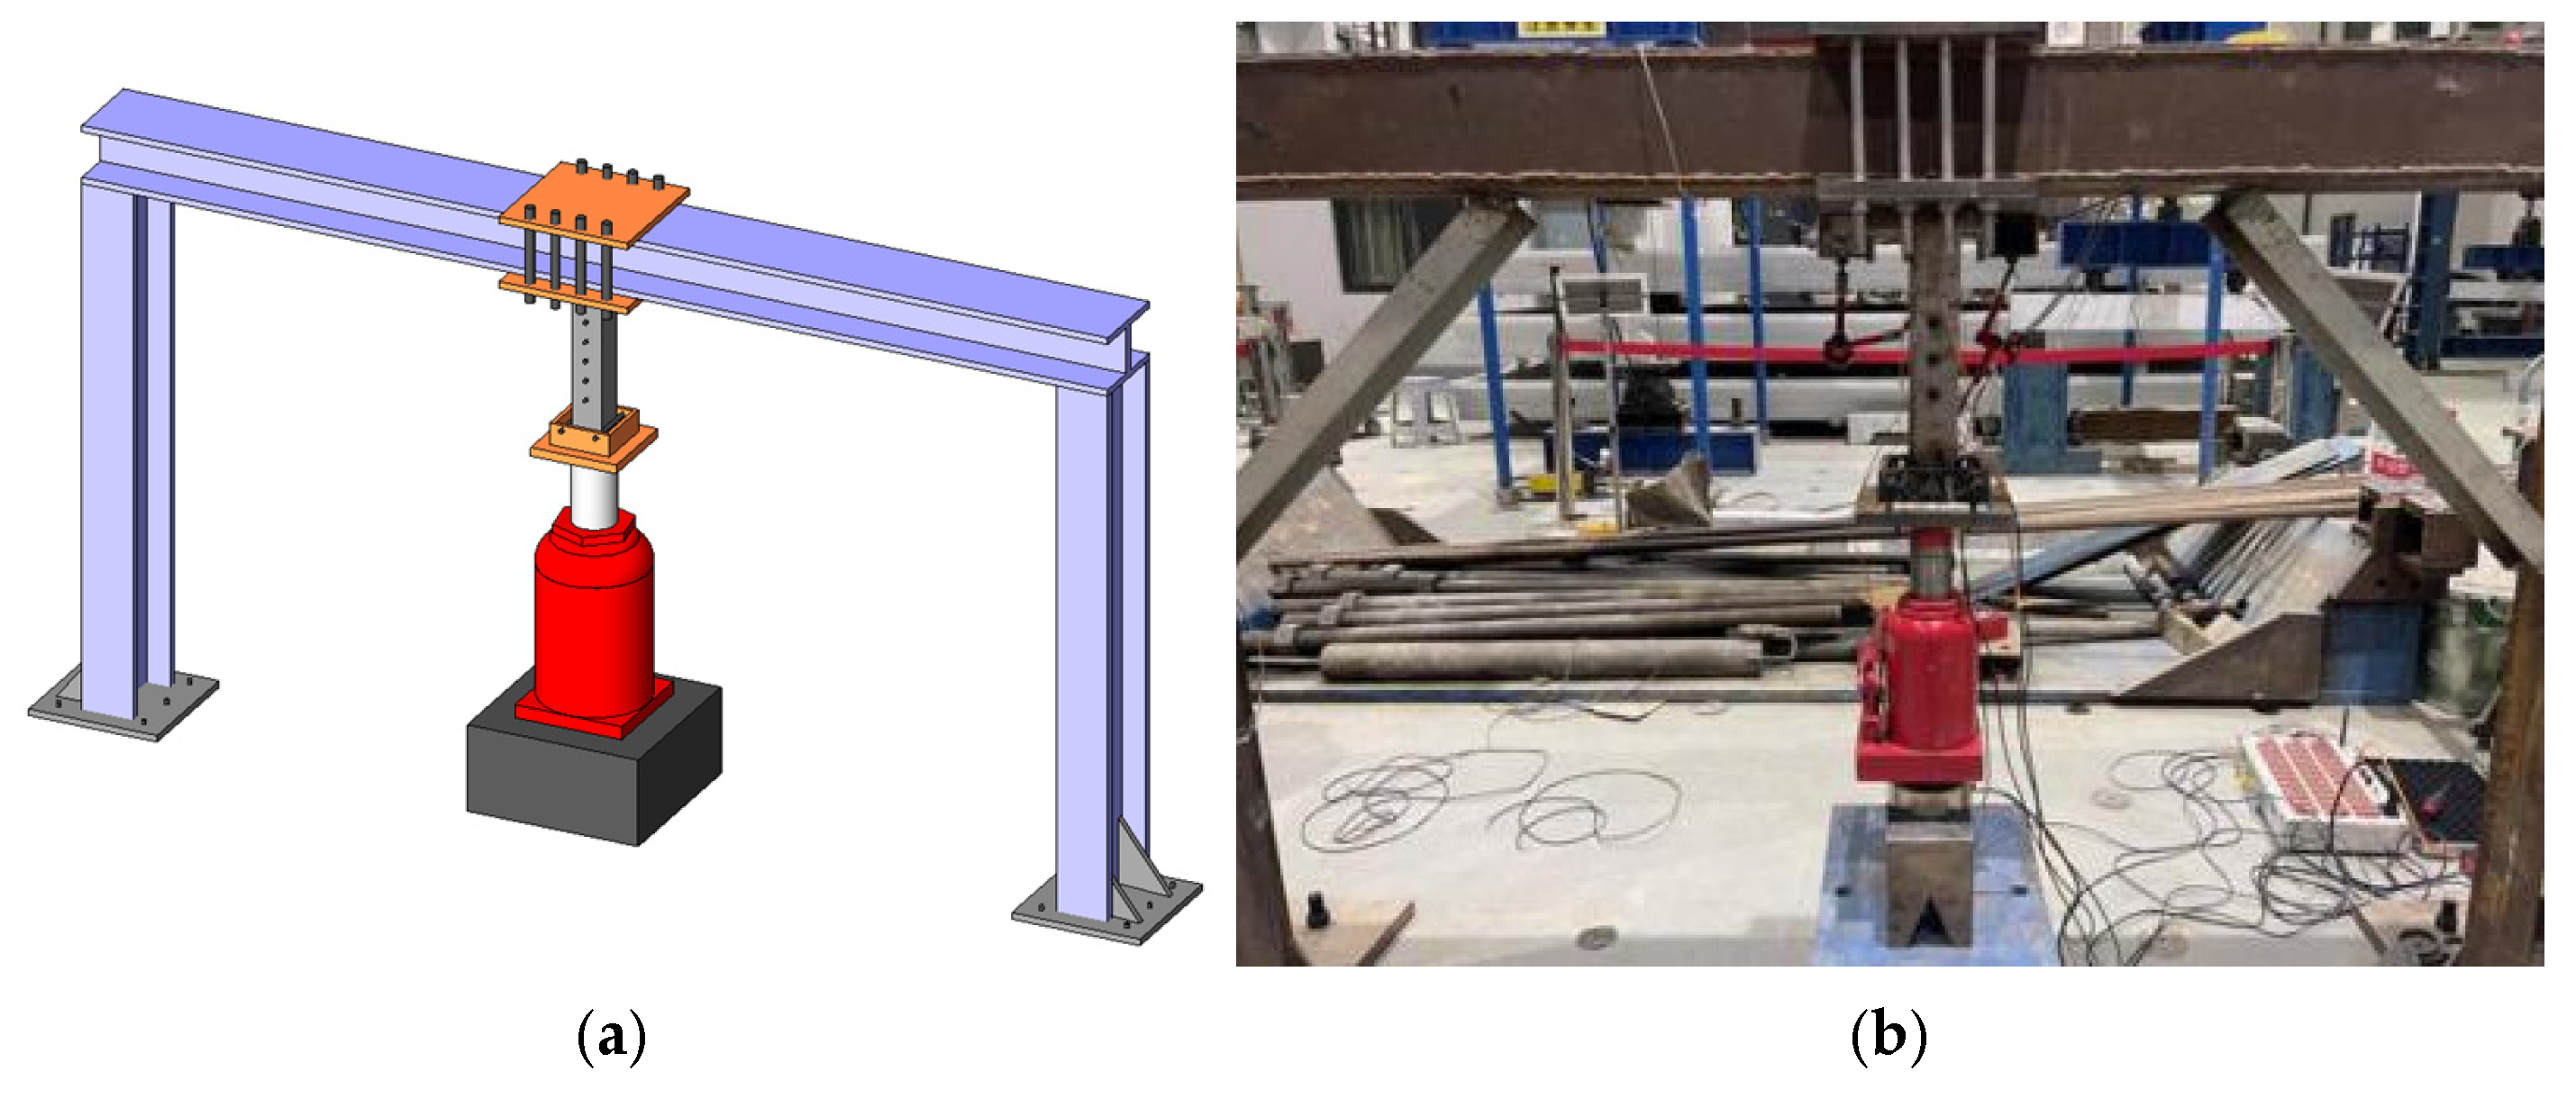
2.2. Loading Device and Test Material

This experiment focused on comprehensively studying the mechanical properties of the thin-walled steel–wood composite column under eccentric compression. After the wooden column was precisely placed in the thin-walled steel pipe, the upper and lower ends of the composite column were welded to the fixed plate. To ensure excellent force transmission between the member and the reaction frame and prevent the member from sliding or falling during loading, fixed grooves were added at the upper and lower ends to further constrain the member. The fixed end of the specimen was connected to the fixed device via a clamp slot, which was then bolted and suspended from the reaction frame. The reaction frame was fixed to the ground with bolt rods. The loading-end steel plate was perforated, and the eccentric loading device was bolted in place. A jack applied upward pressure to conduct an eccentric compression test with one end fixed and one end in a cantilever state. The eccentricity of the loading point was controlled by adjusting the jack position. During the test, the specimen’s ultimate load-bearing capacity, strain, displacement, and deformation were accurately recorded.
In this test, the type of wood adopted was fir (Dantu District Xincheng Shuxin Building Materials Business Department, Zhenjiang, China). The steel employed was Q235B steel. The bolts utilized were high-strength bolts of class 8.8, with a diameter of 8 mm and a screw length of 50 mm. Washers were equipped at both ends of the bolts. In the test, natural synthetic rubber was applied to affix the strain gauge. A three-dimensional view of the simulated setup and on-site test diagram are presented in Figure 6. The loading location and the direction of eccentric loading are depicted in Figure 7.

2.3. Arrangement of Strain Gauges and Displacement Meters

In order to accurately measure the strain distribution of cold-formed thin-walled steel–wood composite column during the test, strain gauges were placed at the upper and lower ends of the column’s compression and tension sides. A displacement meter was installed at the middle of the column to measure lateral deflection, and another was mounted on the loading plate to record test displacement. It was crucial that the displacement meter on the loading plate was vertically aligned with the loading position. In order to effectively prevent the stiffener at the loading end of the column from buckling under the eccentric load during the test, which could lead to the lateral slippage of the displacement meter and thereby affect the test data, the displacement meter at the loading end of column needed to be shifted upward for installation. The arrangements of strain gauges and displacement gauges for the specimen are presented in Figure 8 and Figure 9. The static strain acquisition instrument was employed to collect and analyze the data recorded by the strain gauge during the test. The displacement of specimen was measured by three displacement gauges with the specific type of YHD-100 displacement sensors.

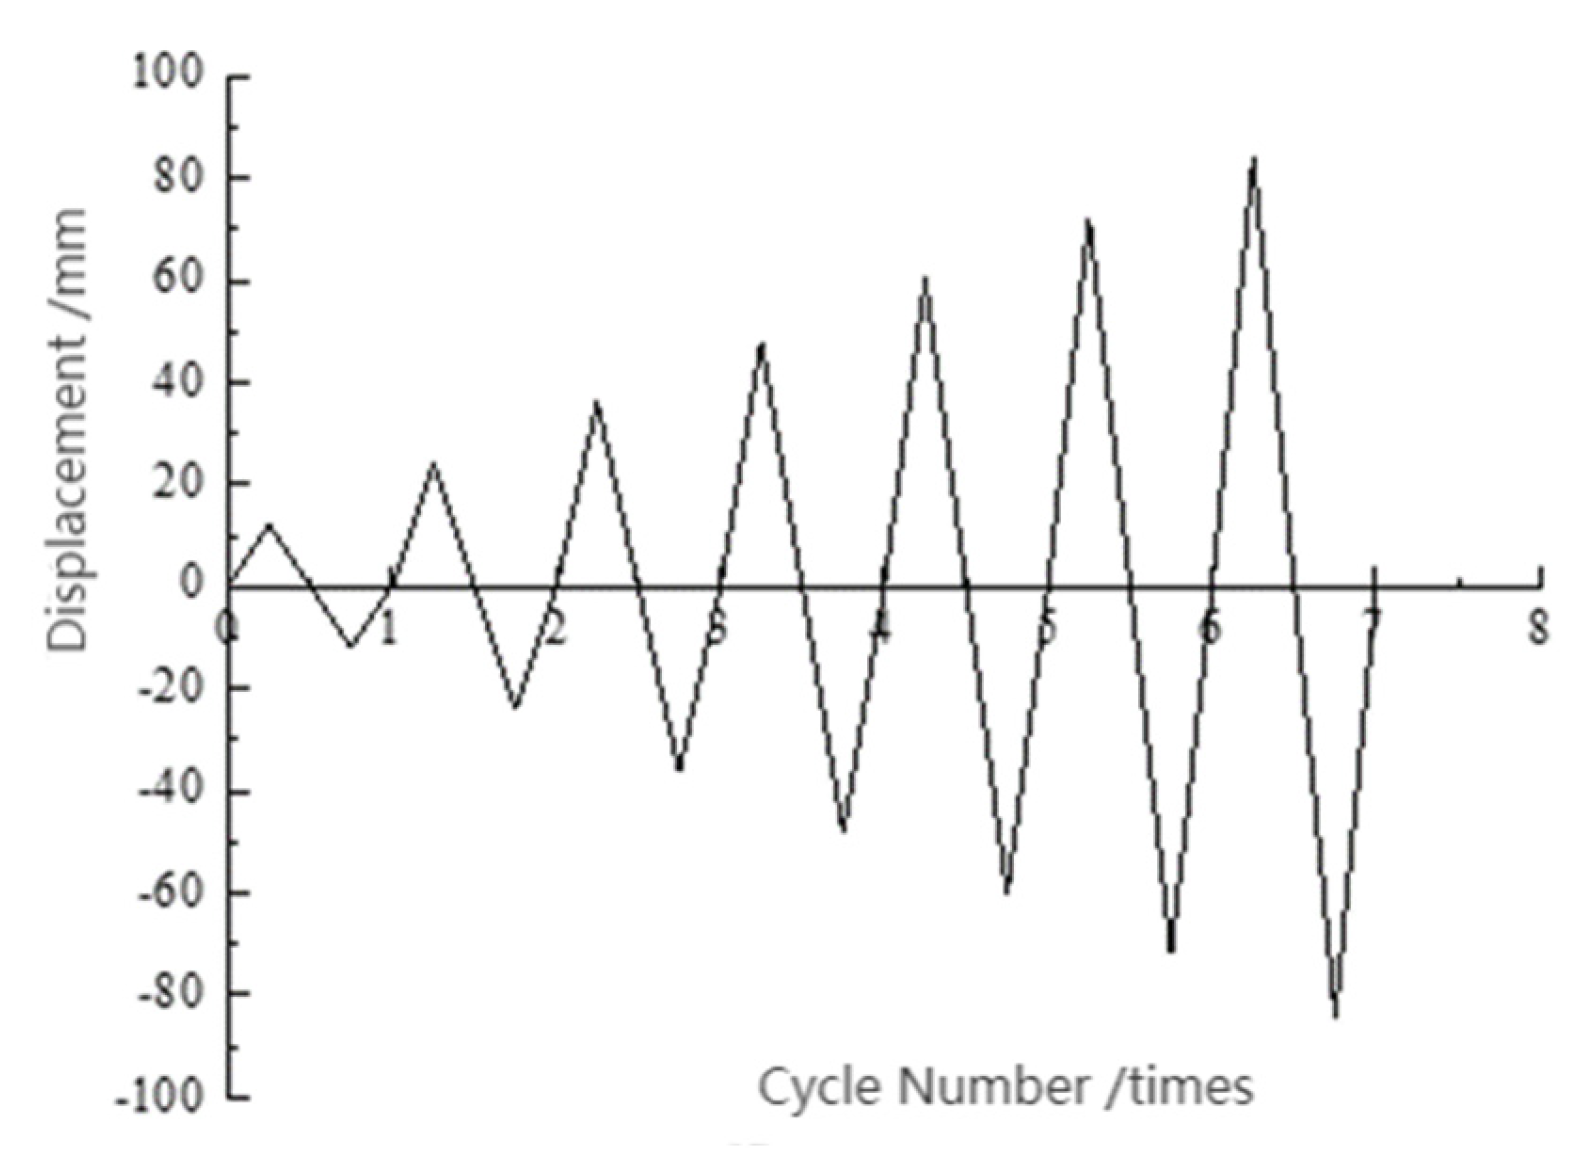
2.4. Loading Program

Based on the finite element simulation results before test, in order to determine the loading system, 1/10 of the ultimate bearing capacity derived from the simulation, specifically 0.5 kN, was selected as the limit value for pre-loading. Subsequently, the eccentric loading was implemented in accordance with the outcomes of the finite element simulation. The test was loaded by means of a jack, which was positioned on the head of the pressure sensor. Prior to loading, the display of the sensor must be zeroed to eliminate the pressure value generated by the self-weight of the jack.
At the pre-loading stage, the loading level for the specimen was set at 0.5 kN, and the duration was maintained for 1 min. The pre-loading process was conducted to ensure complete contact between the jack and the loading plate and also to check whether other equipment was operating properly. Subsequently, the load was unloaded to zero.
At the formal loading stage, the loading level was set at 0.5 kN prior to the yielding of the steel pipe and was decreased to 0.2 kN subsequent to the yielding. The duration for each loading step was sustained for 2 min. When an extremely large displacement occurs with an extremely small applied force, or when the force can no longer be applied, the loading process was terminated.

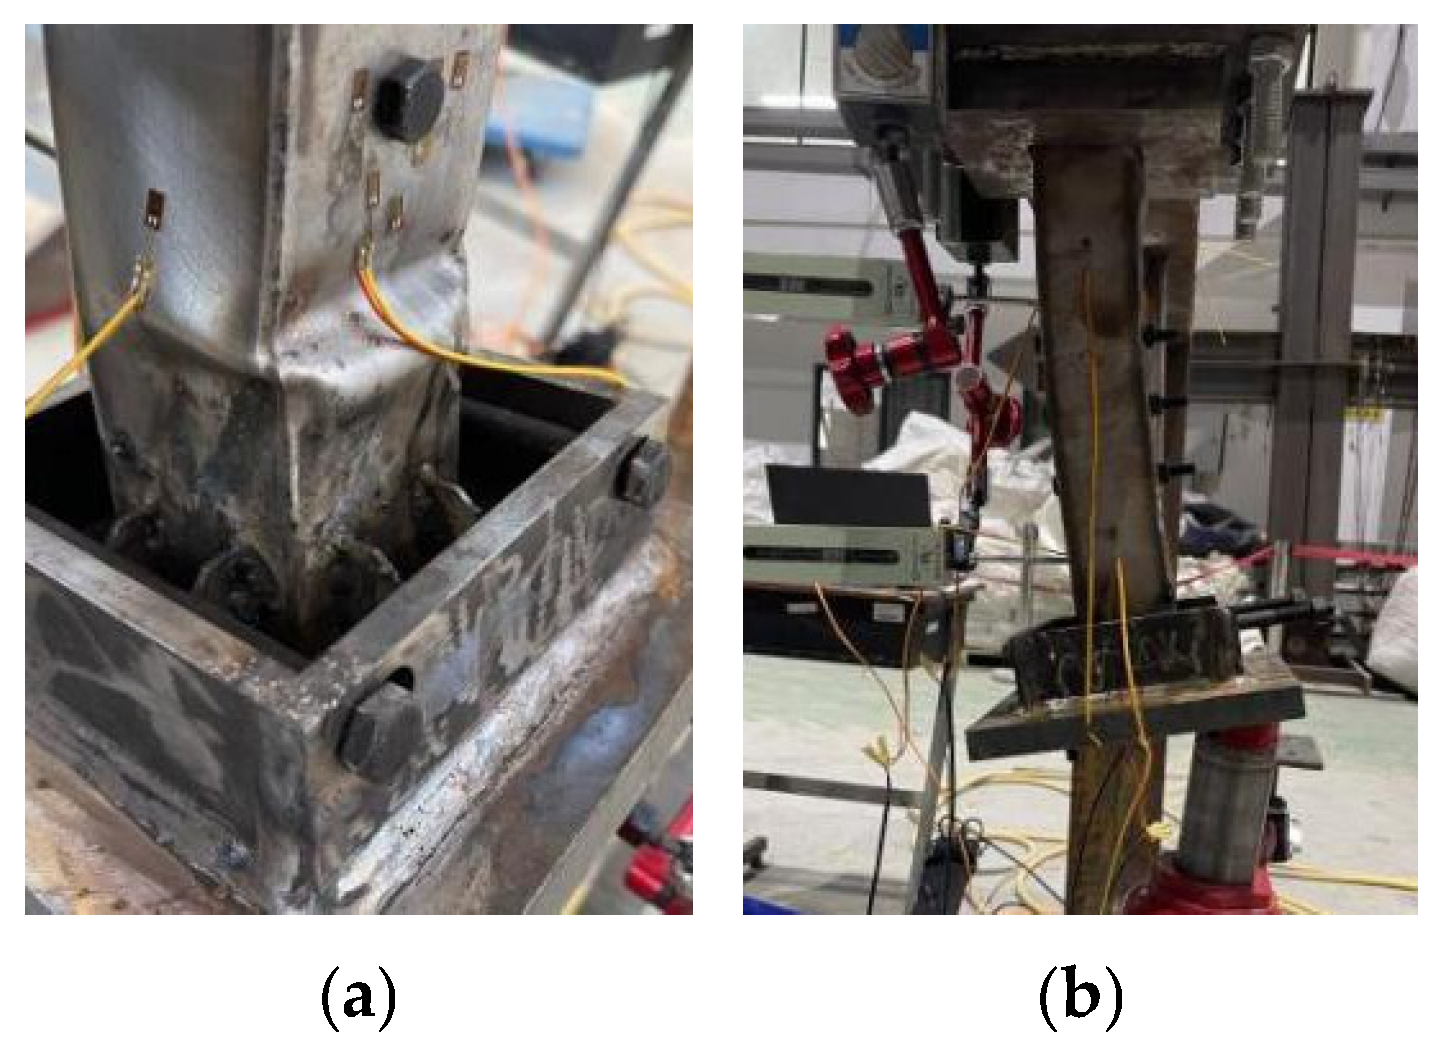
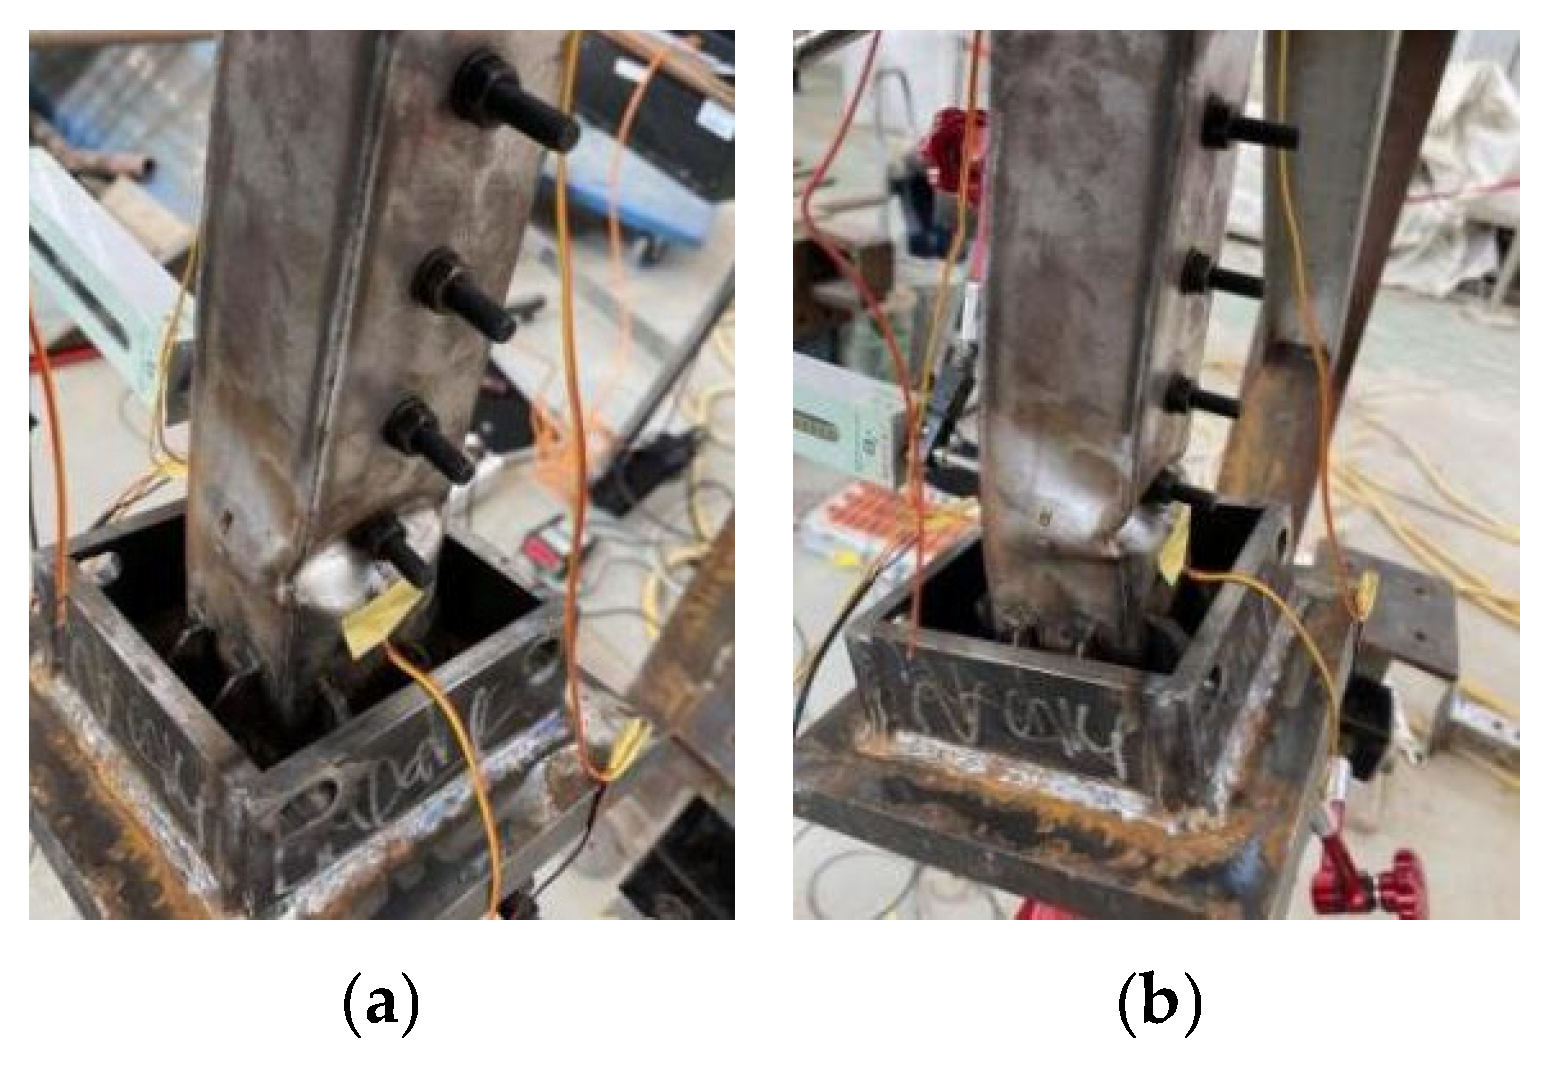
2.5. Test Phenomenon and Damage Pattern

The bending tests under eccentric compression loads were conducted, respectively, on pure thin-walled steel columns and thin-walled steel–wood composite columns. A specimen was considered damaged when either a negligible force caused significant displacement or the force could not be increased despite remarkable deformation of specimen. At this juncture, both the loading test and recording data were terminated, and the deformation phenomenon was carefully observed.
(1)
Eccentric compression test of specimen G1
Specimen G1 represents a pure thin-walled steel column. At the initial stage of loading, there was no conspicuous change in the specimen. When the load was increased to 28 kN, a slight bulge emerged at the lower end and both sides of the specimen exhibited depression, as depicted in Figure 10a. When the load reached 36 kN, the lower end of the specimen underwent obvious buckling deformation, the steel pipe sustained damage, and the load could not be further increased, as shown in Figure 10b.
(2)
Eccentric compression test of G2 specimen
Specimen G2 was a thin-walled steel–wood composite column with 3 bolts at 45 mm spacing. Prior to test loading, the bolts were tightened by applying pre-stress. When a load of 40 kN was applied, the entire specimen showed no remarkable change and remained in the elastic stage. When the load was incremented to 52 kN, the specimen emitted a slight wood-cracking sound, which was intermittent. A slight bulge appeared at the joint of the lower end of the specimen, but the overall component remained upright, as depicted in Figure 11a. When the load was further increased to 64 kN, the specimen continuously emitted a cracking sound, and the intensity of sound kept increasing. The lower end of the steel column exhibited obvious outward bulging, the lower end experienced obvious tilting, the data of the pressure sensor dropped sharply, and further loading became impossible, as shown in Figure 11b.
(3)
Eccentric compression test of specimen G3
Specimen G3 was a thin-walled steel–wood composite column with 5 bolts at 45 mm spacing. When a load of 50 kN was applied, there was no conspicuous change on the surface of the entire specimen, while a faint tearing sound could be heard from within the specimen. When the load was incremented to 66 kN, the specimen emitted a cracking sound, a slight bulge emerged at the lower end of the specimen, and the lower end of steel pipe commenced to undergo lateral bending, with the phenomenon becoming increasingly distinct, as depicted in Figure 12a. When the load was further increased to 77 kN, the cracking sound emanated from the specimen kept intensifying, and obvious torsional deformation occurred at the bottom bolt. As the load continued to rise, the interior of the specimen entered a state of plastic deformation, a bulge appeared on the tension side of the thin-walled steel tube, and the lower end of the specimen experienced a notable offset. The pressure sensor acquisition instrument indicated that further loading was not feasible, as shown in Figure 12b.

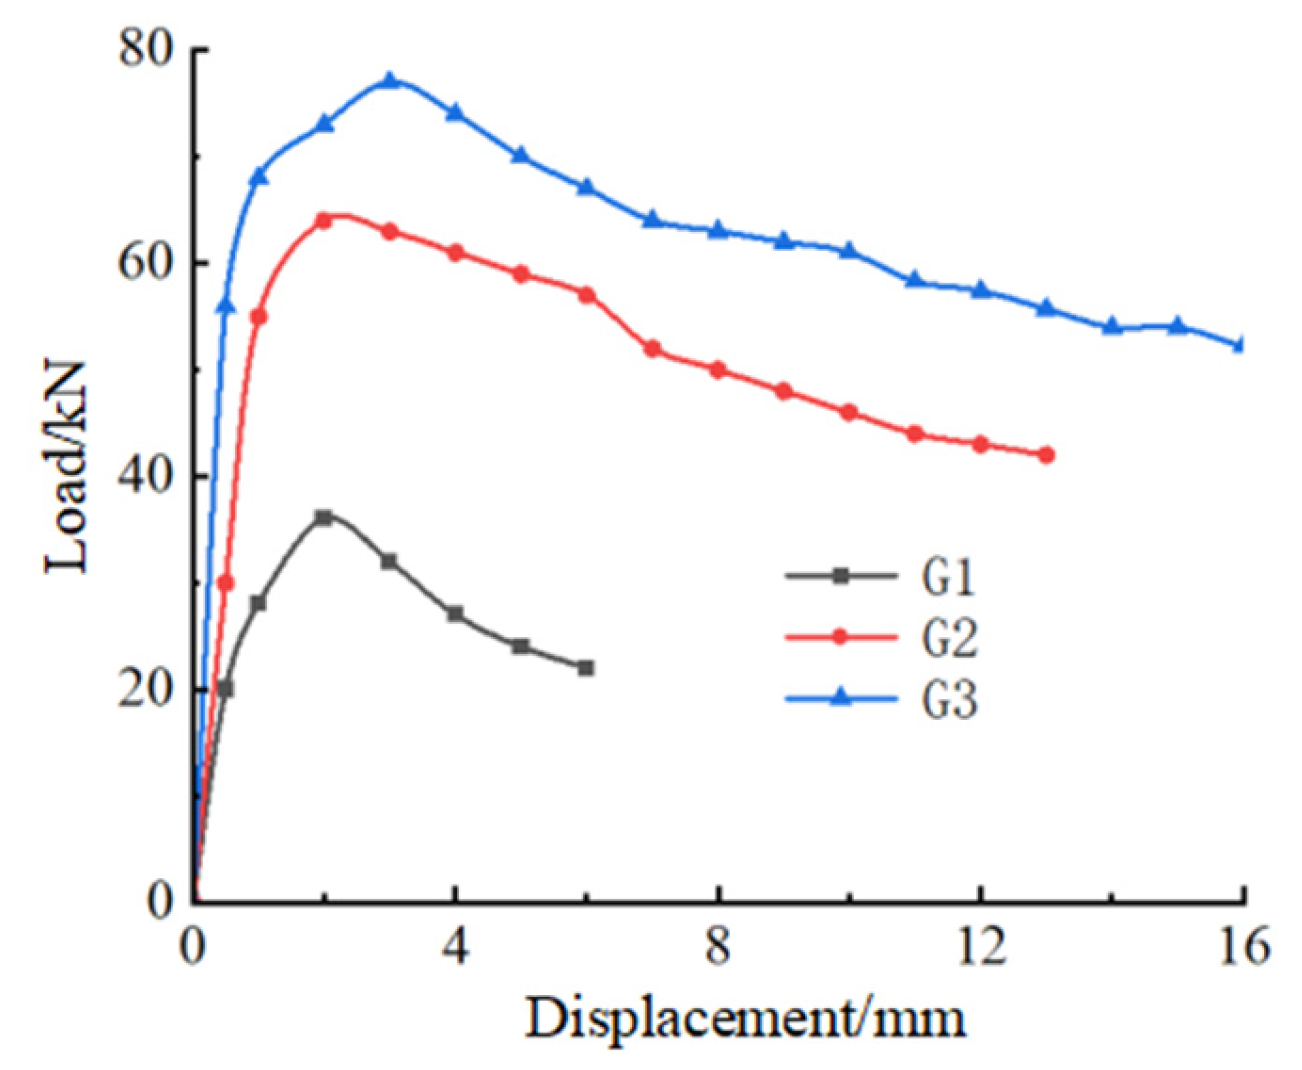
2.6. Analysis of Test Results
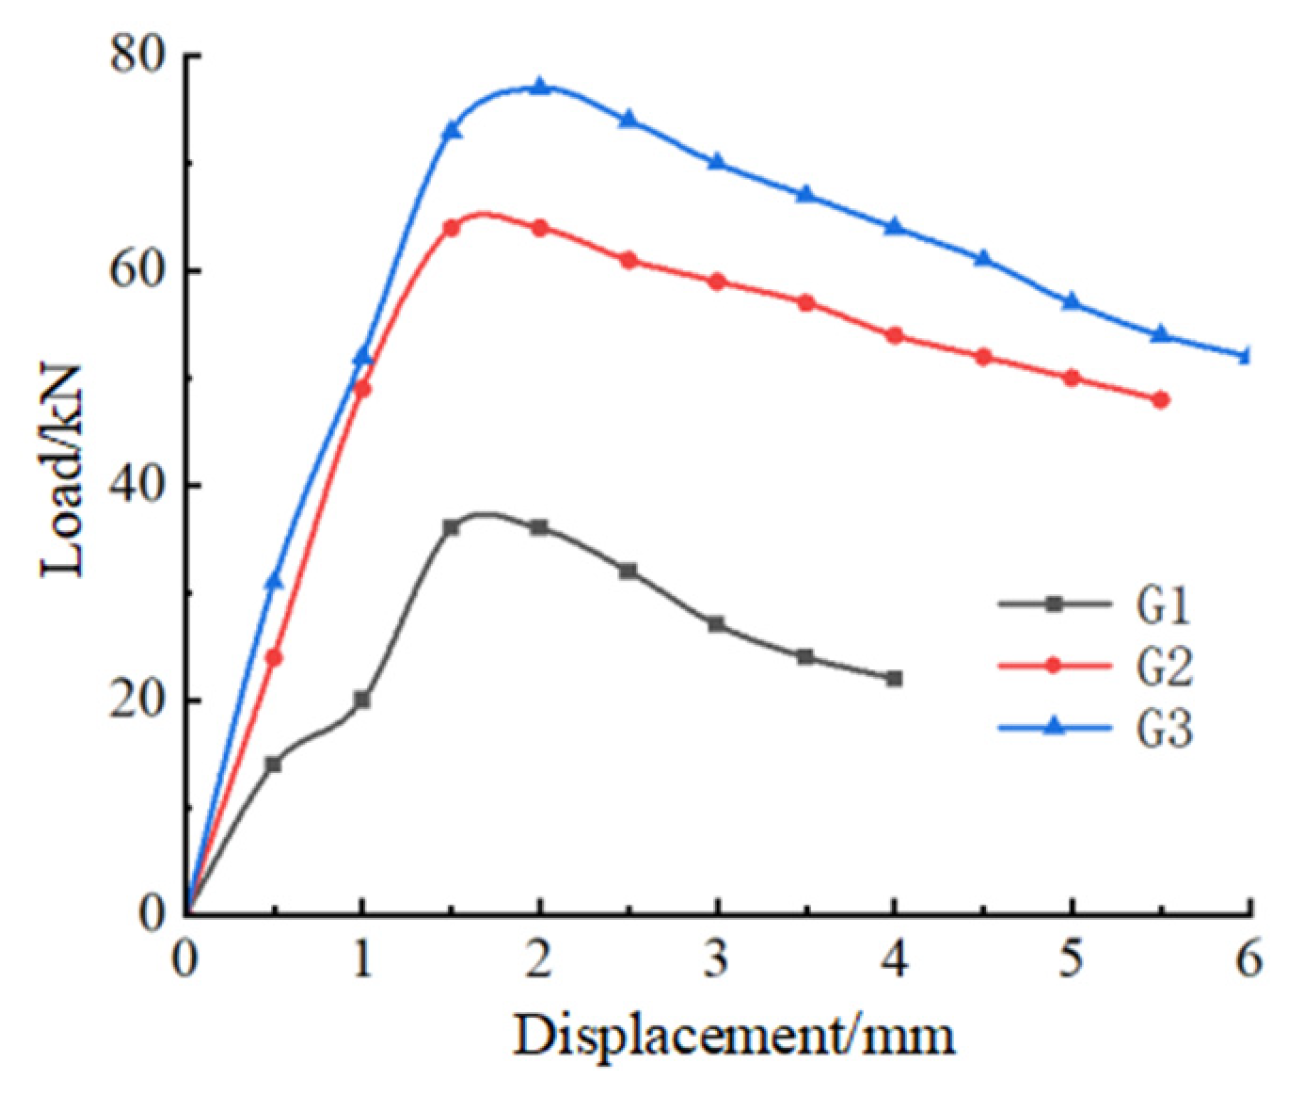
(1)
Load–vertical displacement curves of specimens
A displacement gauge was arranged on the loading top plate. When the jack was exerting the load, the vertical displacement could be accurately obtained by carefully reading the data from the displacement gauge. The data of the applied load was precisely read through the pressure sensor. Based on these accurately acquired data, the load-displacement curves of all specimens were plotted, as shown in Figure 13.
As illustrated in Figure 13, the ultimate load-bearing capacities of the pure steel pipe specimen G1, the composite specimen G2 with 3 bolts, and the composite specimen G3 with 5 bolts were 36 kN, 64 kN, and 77 kN, respectively. Under the condition of an eccentricity of 60 mm, when compared with the specimen G2, the ultimate load-bearing capacity of the specimen G3 increased by 20.31%. This clearly demonstrated that increasing the number of bolts could effectively enhance the eccentric load-bearing capacity of the steel–wood composite column. Moreover, the ultimate load-bearing capacities of the thin-walled steel–wood composite columns with 3 bolts and 5 bolts were 77.78% and 114% higher than that of the pure steel pipe column, respectively. Evidently, both wood infilling and bolt restraint significantly improve the eccentric load-bearing capacity of the thin-walled steel columns.
(2)
Load–lateral deflection curves of specimens
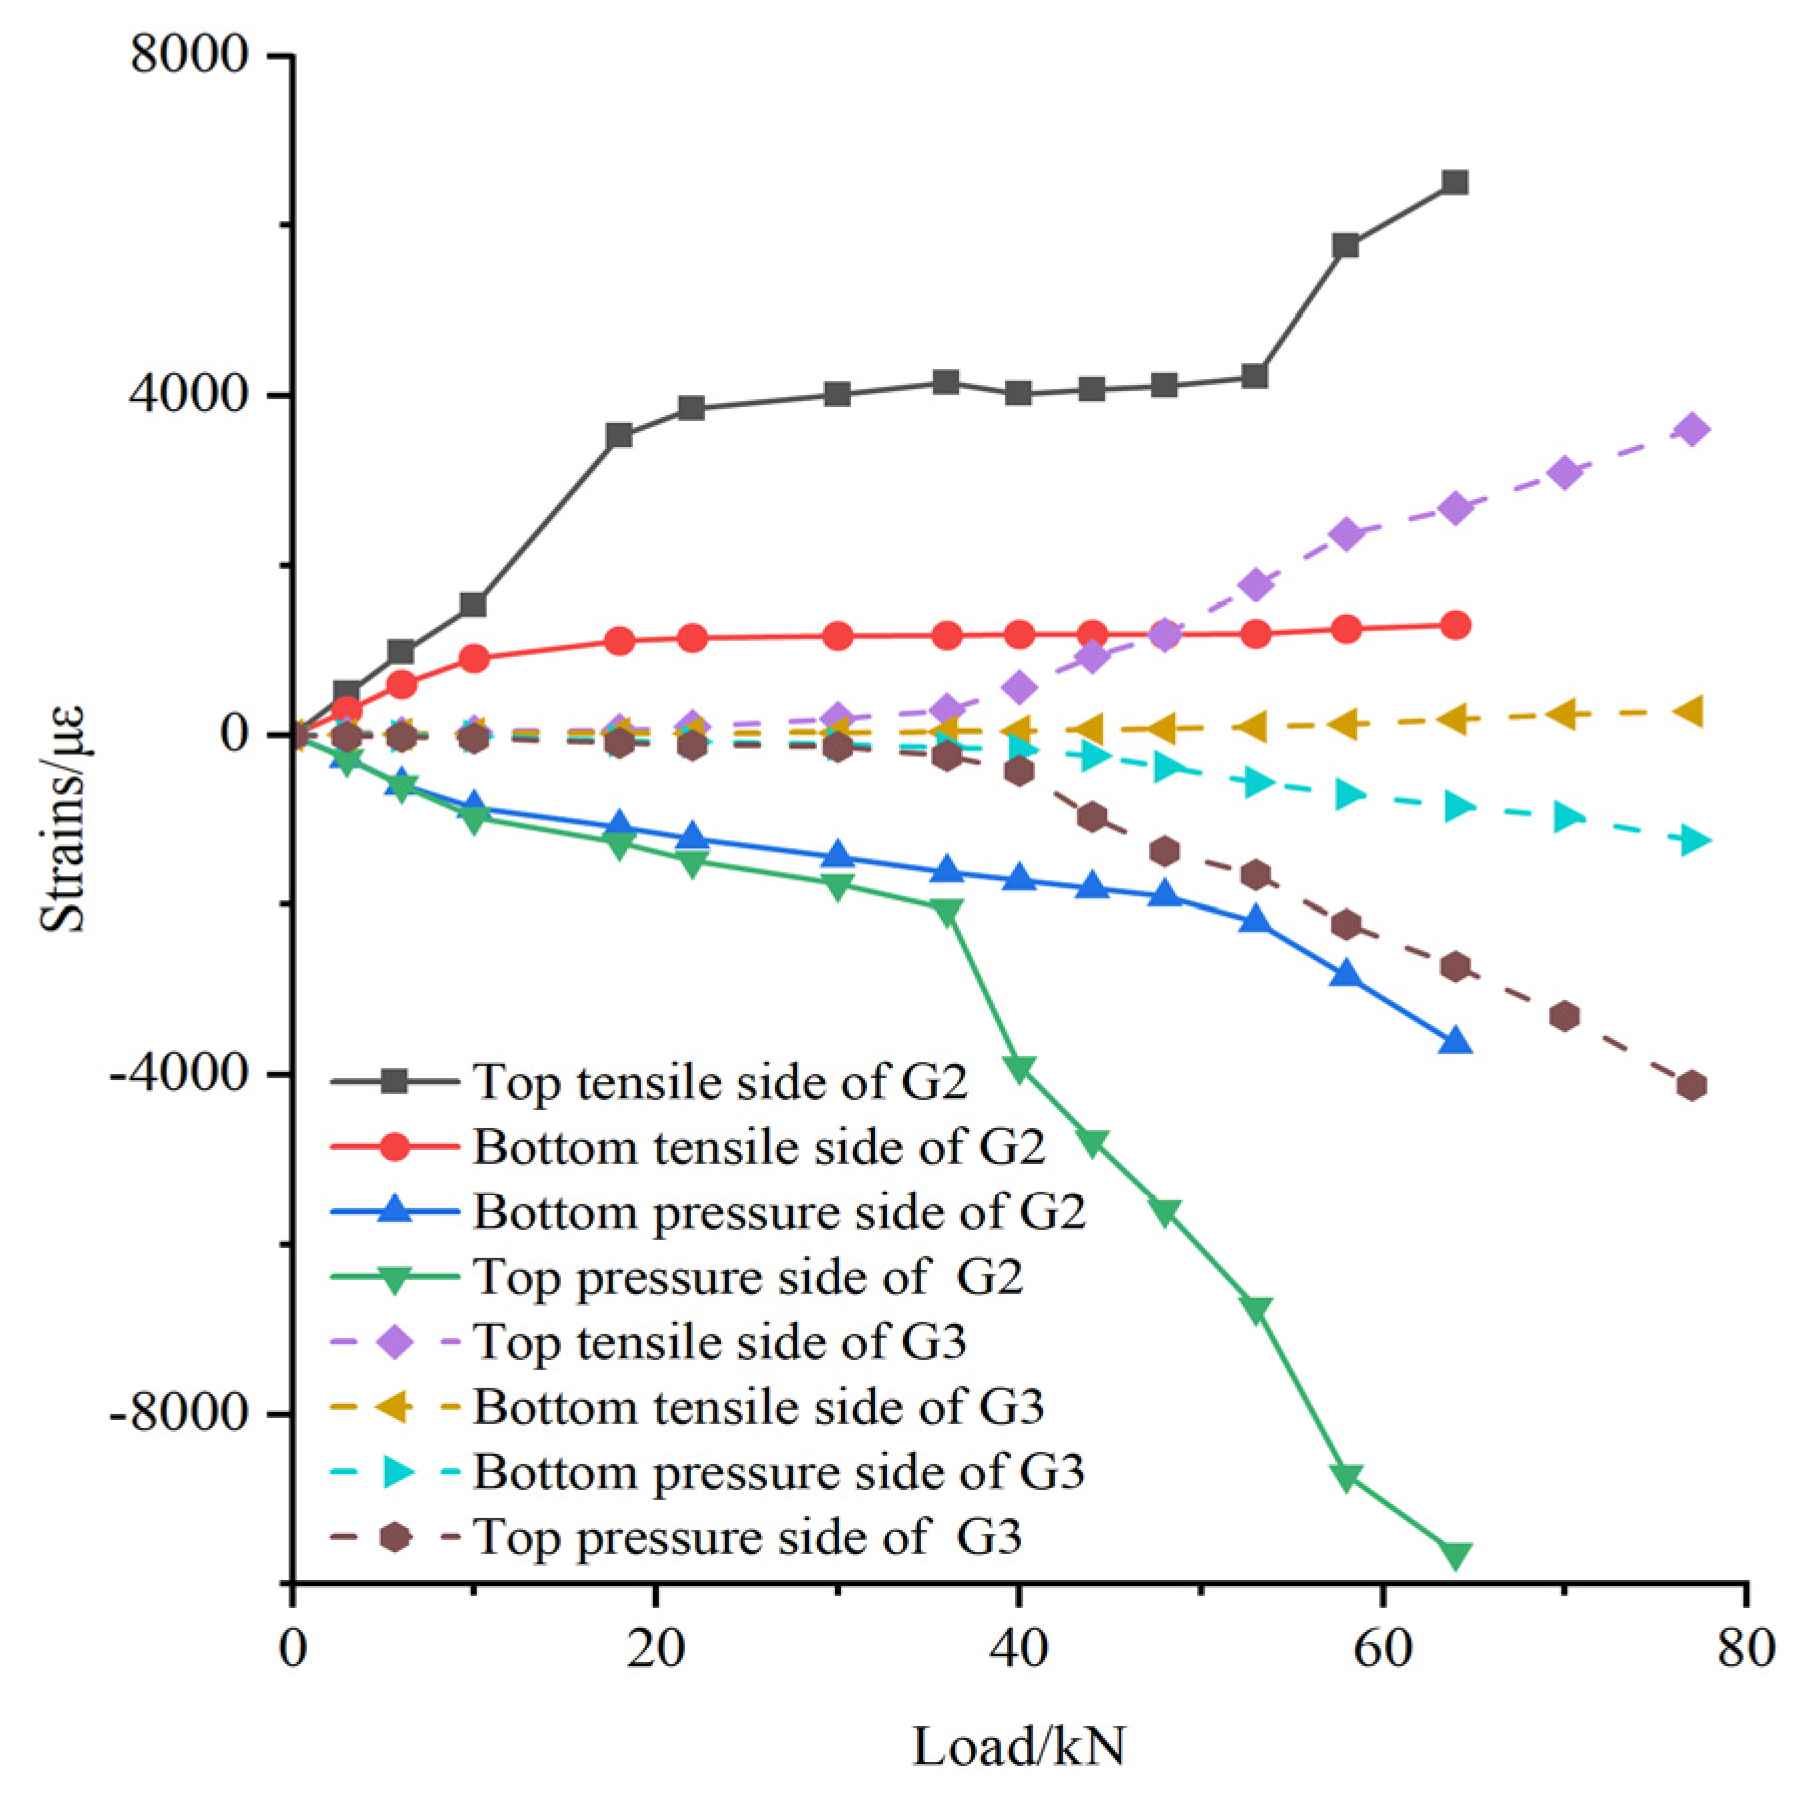
Lateral displacement meters were installed at the top and the middle of the columns for each specimen to measure the changes in the lateral deflection during the test process. Using the measured lateral deflections and corresponding load values, load–lateral deflection curves were plotted in Figure 14 and the critically representative results from the measured data were listed in Table 2. It can be concluded from Table 2 that the mutual restraining effect of the wood filling and the bolts between the wooden part and the steel pipe could effectively enhance the specimen’s capacity to resist lateral deformation. Moreover, the filling of wood exerted a more remarkable enhancement on the column’s ability to withstand lateral deformation.
(3)
Load–strain curves of specimens
The main objective of this test was to investigate the mechanical properties of steel–wood composite columns. For this purpose, only the load–strain data of G2 and specimen G3 were measured to explore the impacts of different numbers of bolts on the composite columns. Strain gauges were, respectively, attached to the upper and lower ends of column in the tensile and compressive zones of the steel tube. Then, the load–strain curves of the specimens were plotted based on the actual measured strain values and the corresponding measured loads, as depicted in Figure 15.
Under the same load eccentricity, when the number of bolts was 3, the strain value started to increase right from the initial applied load. The strain in the tension zone at the bottom of the column developed in a linear pattern. As the load gradually increased, the specimen reached its yield load, and the strain values in all parts of the specimen G2 increased sharply. When the number of bolts was 5, the strain value showed little variation at the initial applied load and only began to increase when the load reached a certain magnitude. The strain in the tension zone at the bottom of the column also developed linearly. With the continuous increase in the load, the specimen reached its yield load, and the strain values in each part of the specimen G3 kept rising.
The maximum load borne by specimen G2 was 64 kN, and the maximum tensile and compressive strains at the top of the column were 6500 με and −9630 με, respectively. However, the maximum load of specimen G3 was 77 kN, and the maximum tensile and compressive strains were 3610 με and −4120 με, respectively. The maximum tensile and compressive strains of specimen G2 were 80.06% and 133.74% higher than those of specimen G3, respectively. It could be observed that, under the same eccentricity condition, compared with the specimens with three bolts, the strain of the specimens with five bolts was smaller and exhibited a more favorable development trend. Particularly when the eccentric load was less than 40 kN, the strain of specimen G3 remained at a relatively low level, whereas the strain of specimen G2 was relatively large.

3. Finite Element Analysis of Thin-Walled Steel–Wood Composite Column

In order to obtain more accurate numerical solutions, various methods such as the finite element modeling, finite difference method [25], and Bessel multi-step method [26] can be referred to. In this study, finite element simulation was used: components including wood, thin-walled steel tubes, bolts, and fixed plates were individually modeled and assembled according to design drawings to form thin-walled steel–wood composite column specimens. During modeling, each component was dimensioned strictly based on the design parameters in the specimen’s detailed size table to ensure the model dimensions matched the test specimens.

3.1. Definition of Material Properties of Finite Element Model

In the finite element simulation, the steel constitutive relationship was defined based on the Mises yield criterion and kinematic hardening rule. The simulated steel was Q235 with a yield strength of 235 MPa, Young’s modulus of 210 GPa, and Poisson’s ratio of 0.3. The bolt had a yield strength of 640 MPa, Young’s modulus of 210 GPa, and Poisson’s ratio of 0.3. The wood was simplified as an orthotropic, continuously homogeneous material. Factors such as wood knots, fiber gaps, and cracks that could affect the results were neglected, and the simplified ontological relationship is shown in Figure 16.
In the finite element numerical simulation of ABAQUS V6.11, there are many methods to define materials with orthogonal anisotropy. In this study, engineering constants are selected to define the properties of wood, namely E1, E2, E3, μ1, μ2, μ3, G12, G23, and G13, to represent the elastic parameters in each direction. The specific values of these nine variables refer to the wood mechanical property tests conducted by Shi Ang, a member of our research group, the elastic parameters of the wood are presented in Table 3. The properties of wood are defined as orthogonal anisotropic materials, and the mechanical properties of wood vary in different directions (transverse and longitudinal). Therefore, it is necessary to establish a default coordinate system of the system and specify a new direction for the local material direction of the wood, so as to simulate the differences in mechanical properties exhibited by the wood in different directions during the calculation process.
The Hill criterion [27] is a widely used theoretical model for describing the plastic behavior of materials, especially for anisotropic materials such as wood and metal sheets. In the mechanics of wood, the Hill criterion predicts the plastic deformation and failure behavior of wood under different loading conditions. The Hill criterion was selected to define the plasticity of wood, and its formula is defined as follows:
σ = [ F 11 ( σ 1 σ 2 ) 2 + F 22 ( σ 2 σ 3 ) 2 + F 33 ( σ 1 σ 3 ) 2   + 2 N 12 τ 12   2 + 2 N 23 τ 23 2 + 2 N 13 τ 13 2 ] 1 2
  F i i = 1 2 1 R k k 2 + 1 R j j 2 1 R i i 2 i = 1 , 2 , 3 j = 2 , 3 , 1 k = 3 , 2 , 1
N i j = 3 2 τ 0 2 τ i j = 3 2 1 R i j 2 i j = 1 , 2 , 3
R i j = σ i j σ 0 , i f   i = j σ i j τ 0 , i f   i j
R 11 = σ 11 σ 0 ,     R 22 = σ 22 σ 0 ,     R 33 = σ 33 σ 0 ,     R 12 = σ 12 τ 0 ,     R 13 = σ 13 τ 0 ,     R 23 = σ 23 τ 0
  τ 0 =   σ 0   3
where:
  • Fij (i = 1, 2, 3) and Nij (i ≠ j = 1, 2, 3) are constants; 1—longitudinal, 2—radial, 3—tangential; Rij—yield ratio; σii—normal yield stress; σij—tangential yield stress; σ0—custom yield stress.
Based on the material plasticity test parameters, the average values were adopted: σ11 = 25 MPa, σ22 = 1.5 MPa, σ33 = 1.5 MPa, σ0 = 25 MPa, R11 = 1, R22 = 0.06, R33 = 0.06, R12 = 0.12, R13 = 0.12, and R23 = 0.12. The statistical data are presented in Table 4.

3.2. Establishment of the Finite Element Model

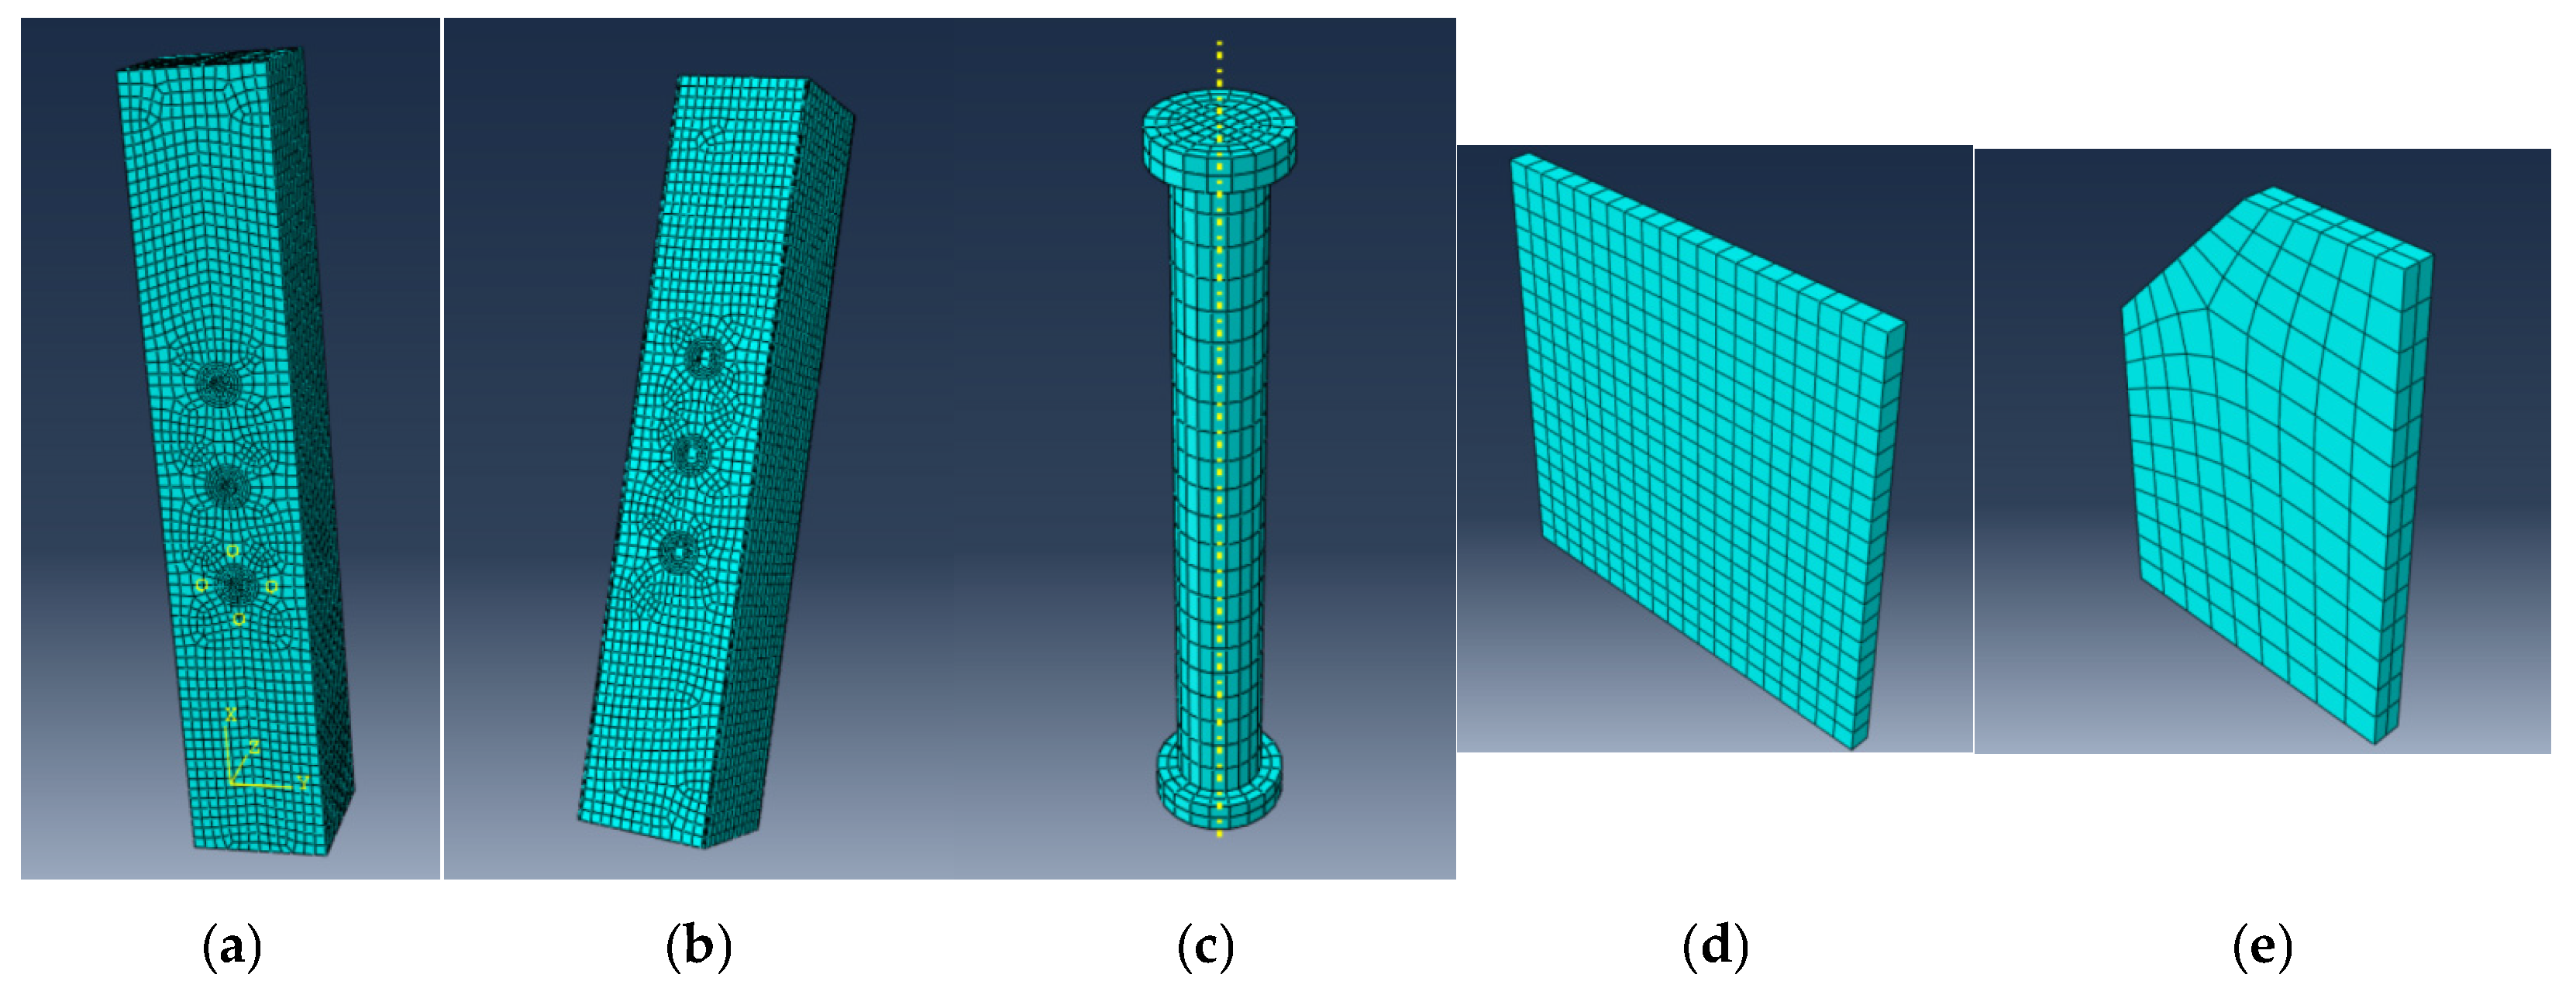
3.2.1. Component Meshing

The upper and lower fixed plates and stiffeners were meshed with C3D8R elements. Each element is an eight-node linear hexahedron, offering high displacement solution accuracy, low mesh distortion sensitivity, and resistance to shear locking under bending loads. For perforated wooden columns, holed thin-walled steel tubes, and bolts, swept meshing seeds were used, combined with local seeding near holes to generate high-quality meshes. Meshing results for each component are shown in Figure 17.

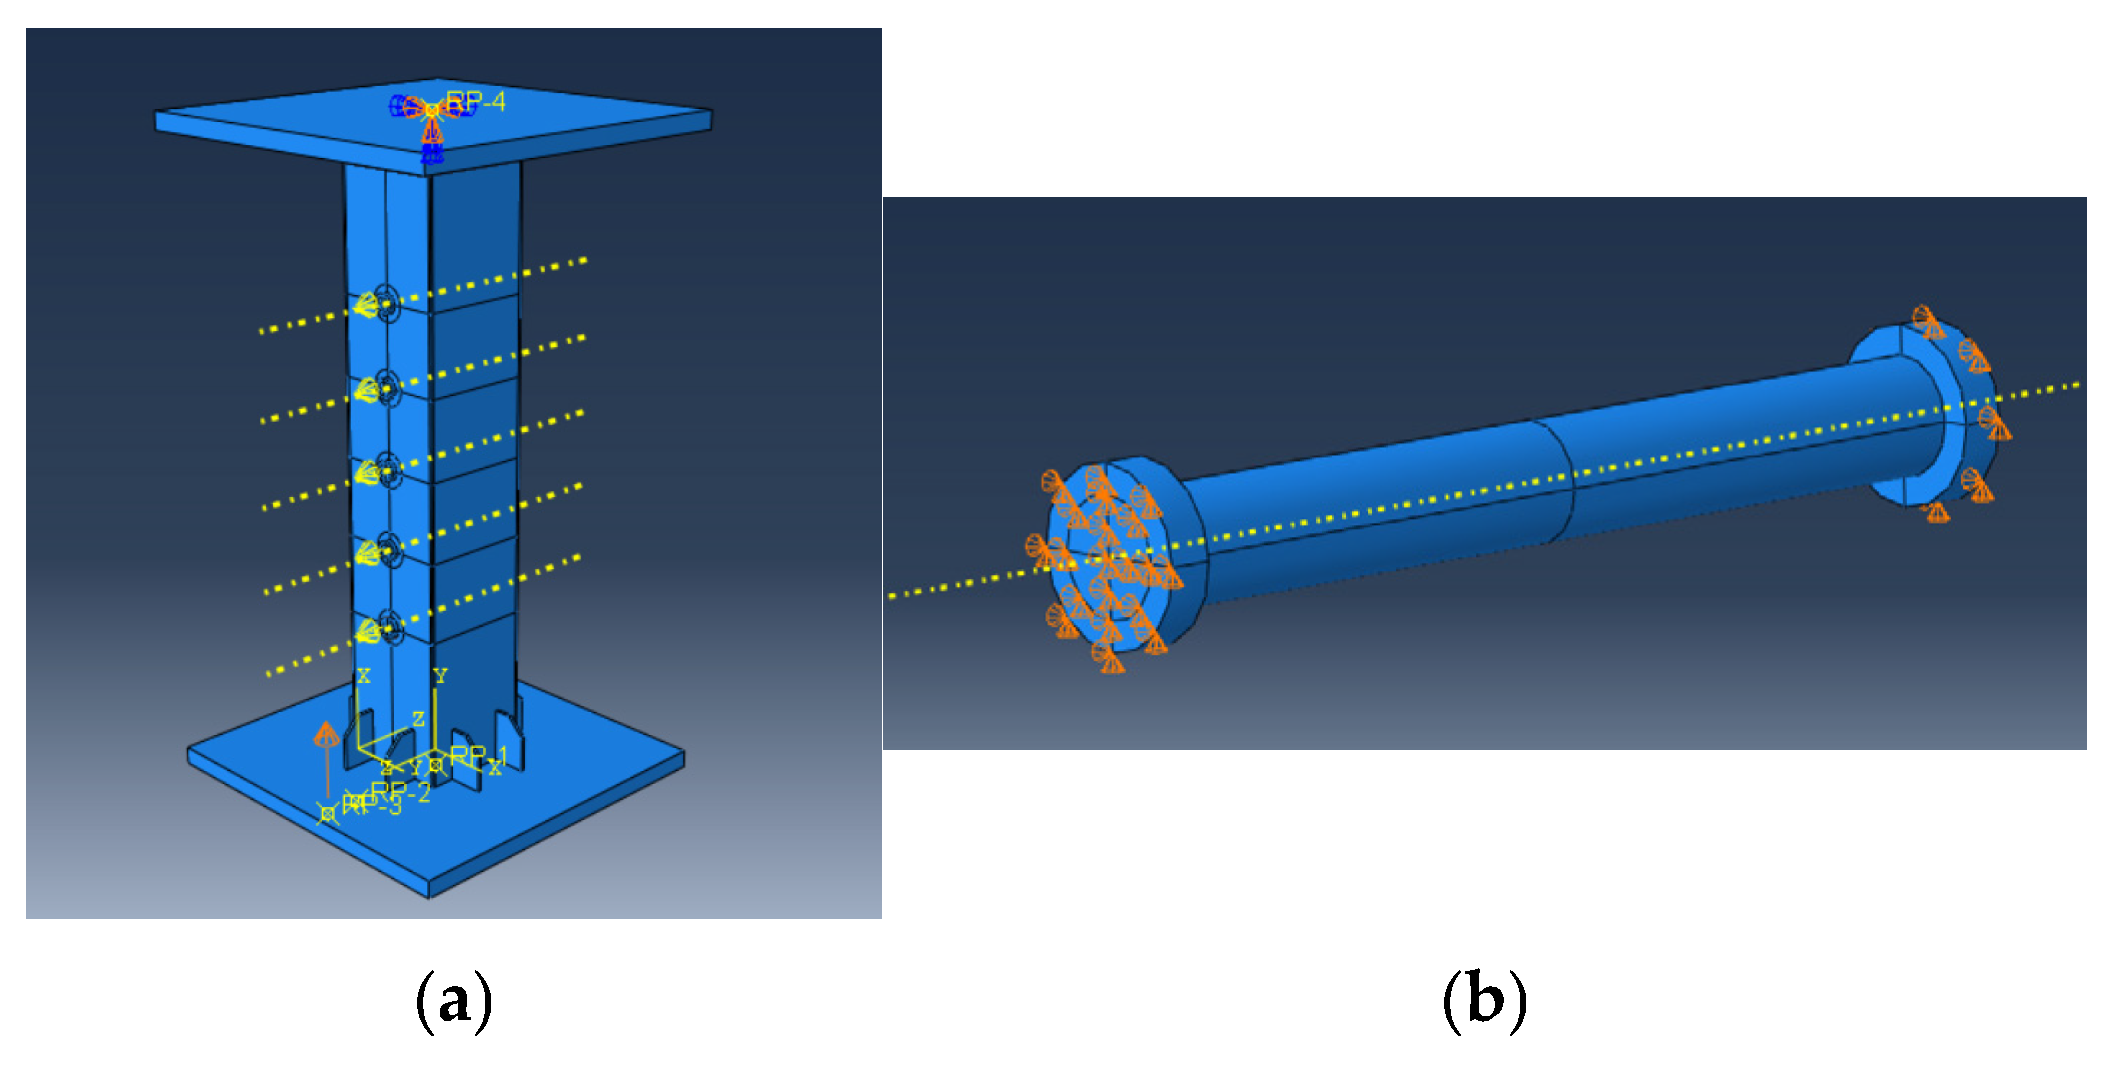
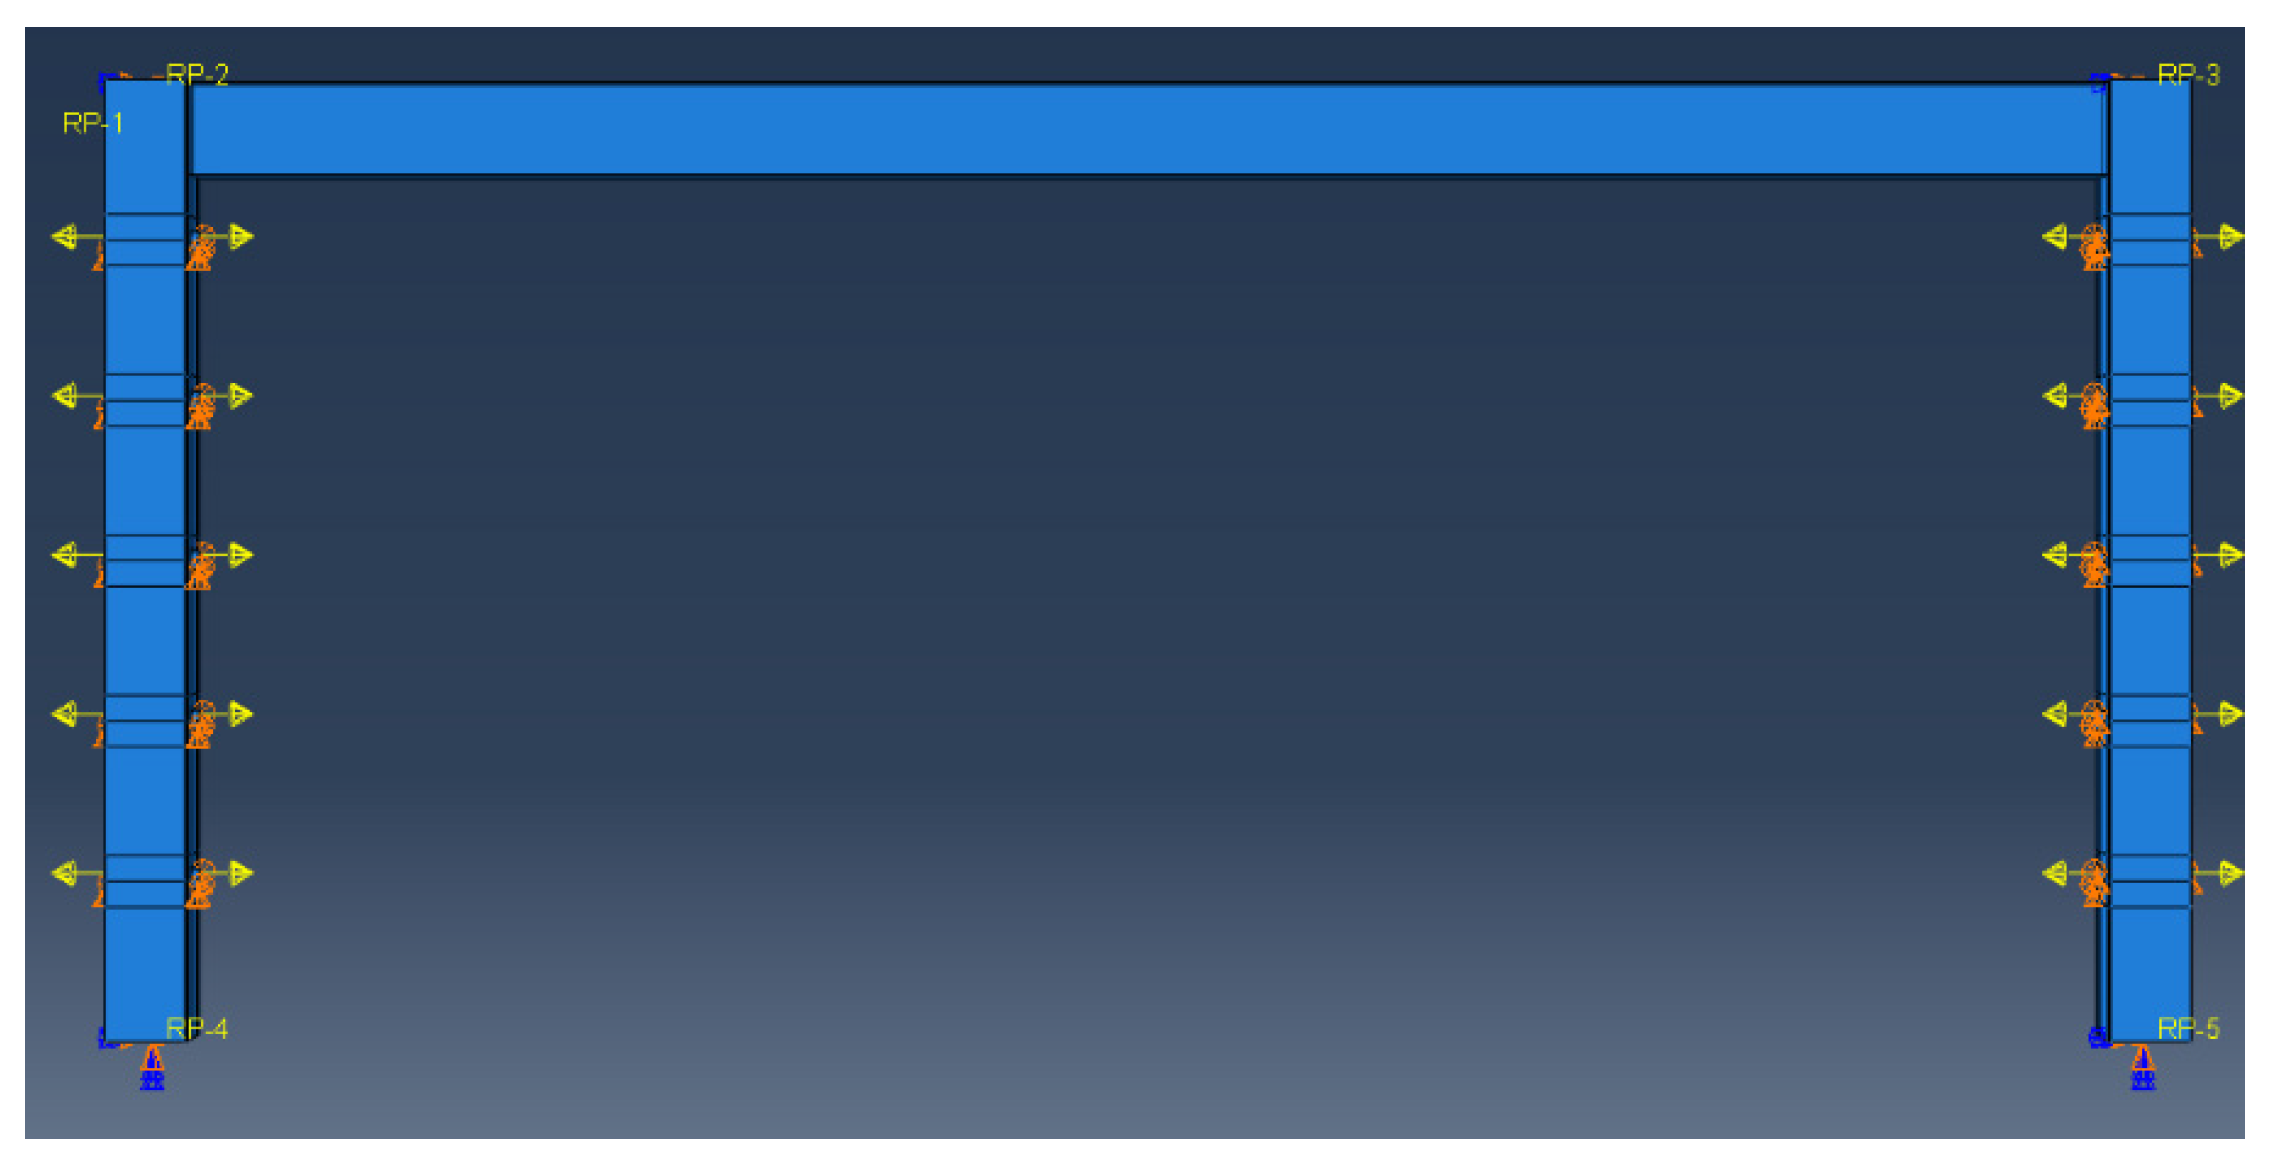
3.2.2. Contact Relationships and Boundary Conditions

In finite element models, contact relationships generally include tangential and normal behaviors. In the thin-walled steel-encased wooden composite column model, the upper/lower fixed plates and composite column ends, stiffeners and composite column sides, and stiffeners and fixed plates maintain fixed relative positions during loading. Therefore, tie constraints were used for these contact interfaces.
For the four contact situations of thin-walled steel pipes and square wooden columns, bolt rods and square wooden columns, bolt rods and thin-walled steel holes, and bolt caps and the side of thin-walled steel, the “face-to-face” contact method is adopted. The stiffer side was defined as the primary surface, and the less stiff side as the secondary surface. For tangential behaviors, the system’s universal Coulomb friction coefficient (penalty) was modeled at 0.3. Considering stress transmission and spacing, all contact surfaces used “hard” contact for normal behavior to prevent penetration during calculations.
In the boundary condition setup, the composite column used an upper-end-fixed, lower-end-loaded pattern to match simulated boundary conditions. To prevent local compression failure of the wooden column, the upper fixed plate was tied to the composite column’s upper end. Both fixed plates were defined as rigid bodies with reference points: the upper reference point was fixed, and the lower reference point had rotational displacement constrained. When applying pretension forces, rotational displacement constraints were applied to all bolt surfaces to prevent displacement between bolts and the composite column. Boundary conditions for components and bolts are shown in Figure 18.

3.3. Comparison of Simulation Results
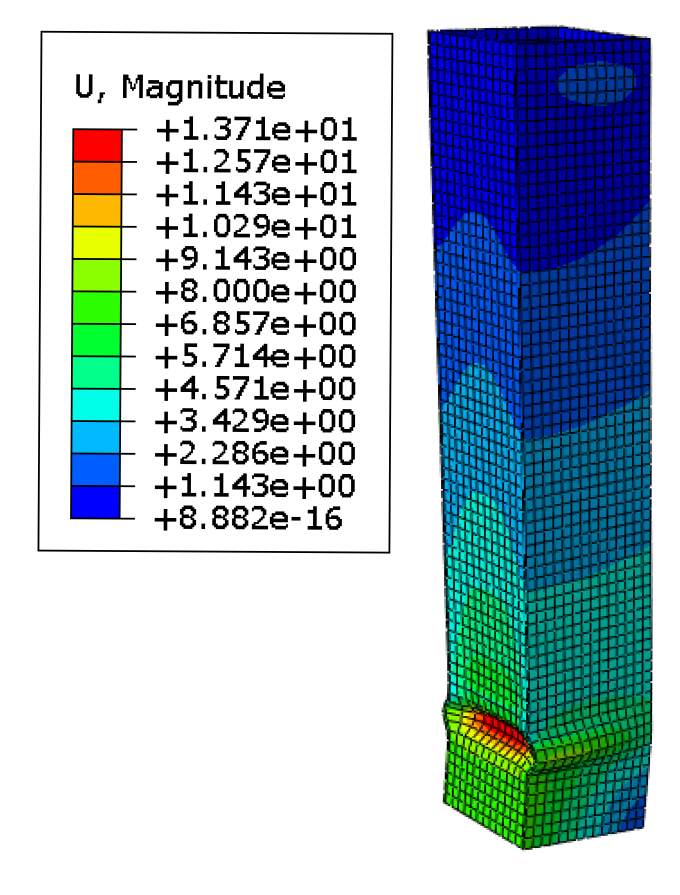
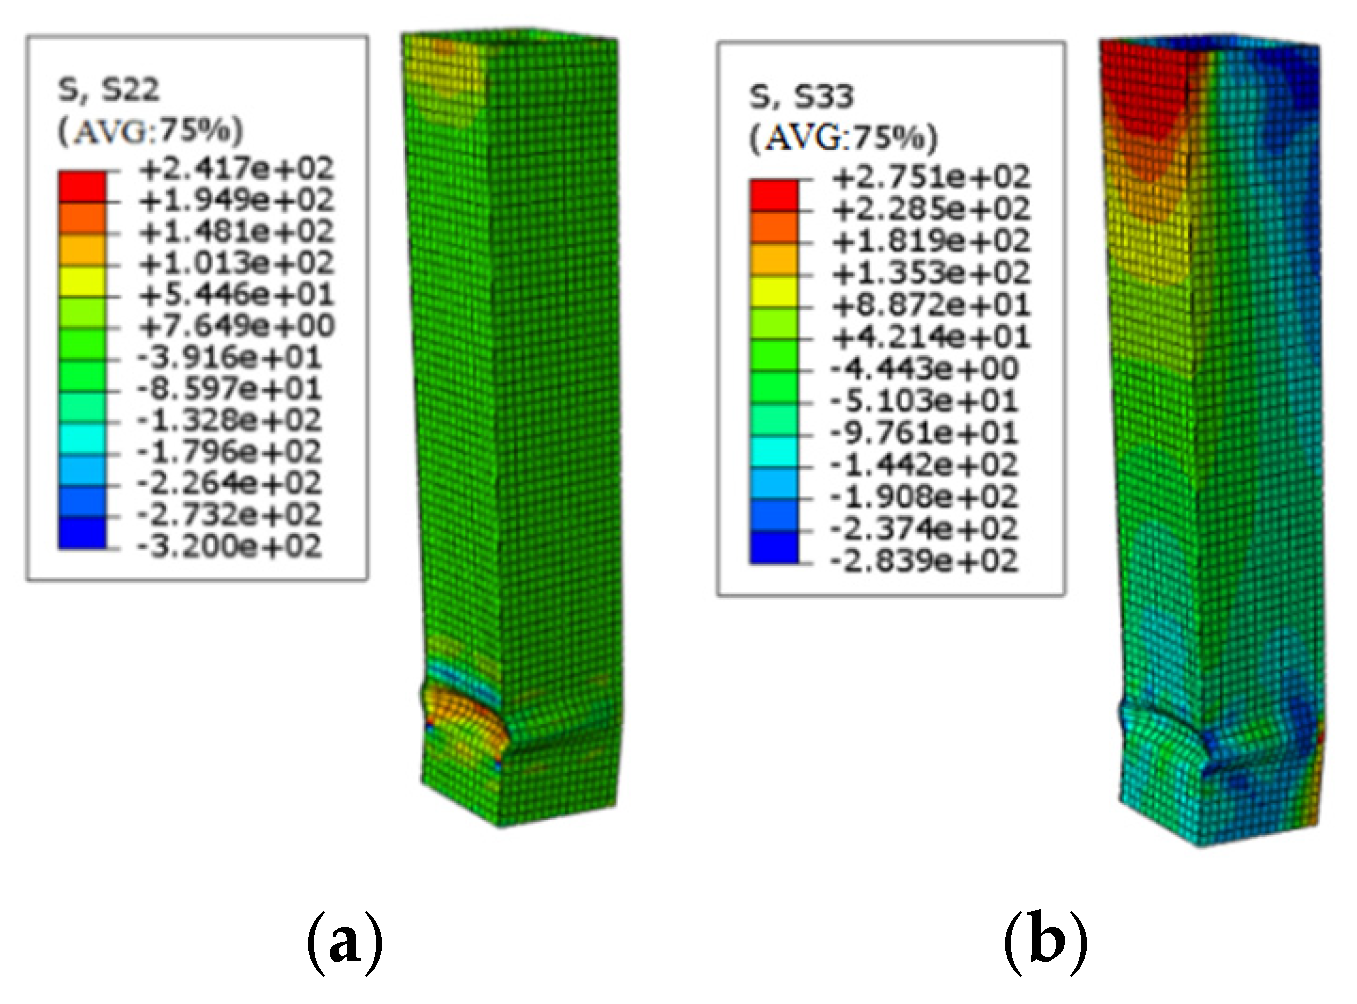
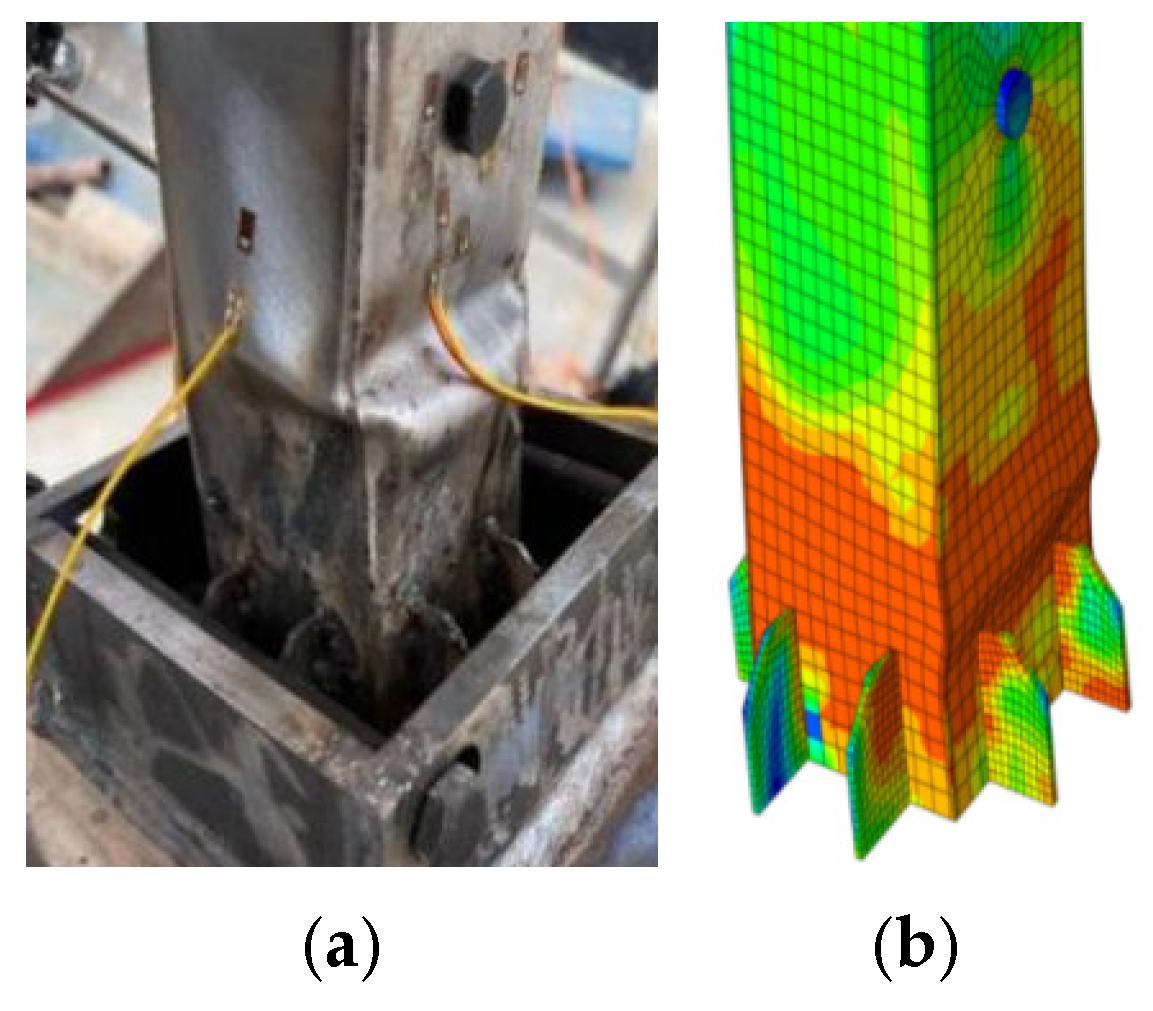
A finite element analysis model of the thin-walled steel–wood composite column under eccentric loading was carefully established based on basic mechanical relationships, boundary conditions, and complex component interactions. Through comprehensive analysis of simulation results, the stress and strain distributions in all directions of the composite column under eccentric compression can be accurately determined. Additionally, displacement variations and force states throughout the simulation process can be further explored. Taking specimens G2 and G3 (both steel–wood composite columns) as examples, the simulation results of specimen G2 are presented here.
(1)
Model analysis of specimen G1
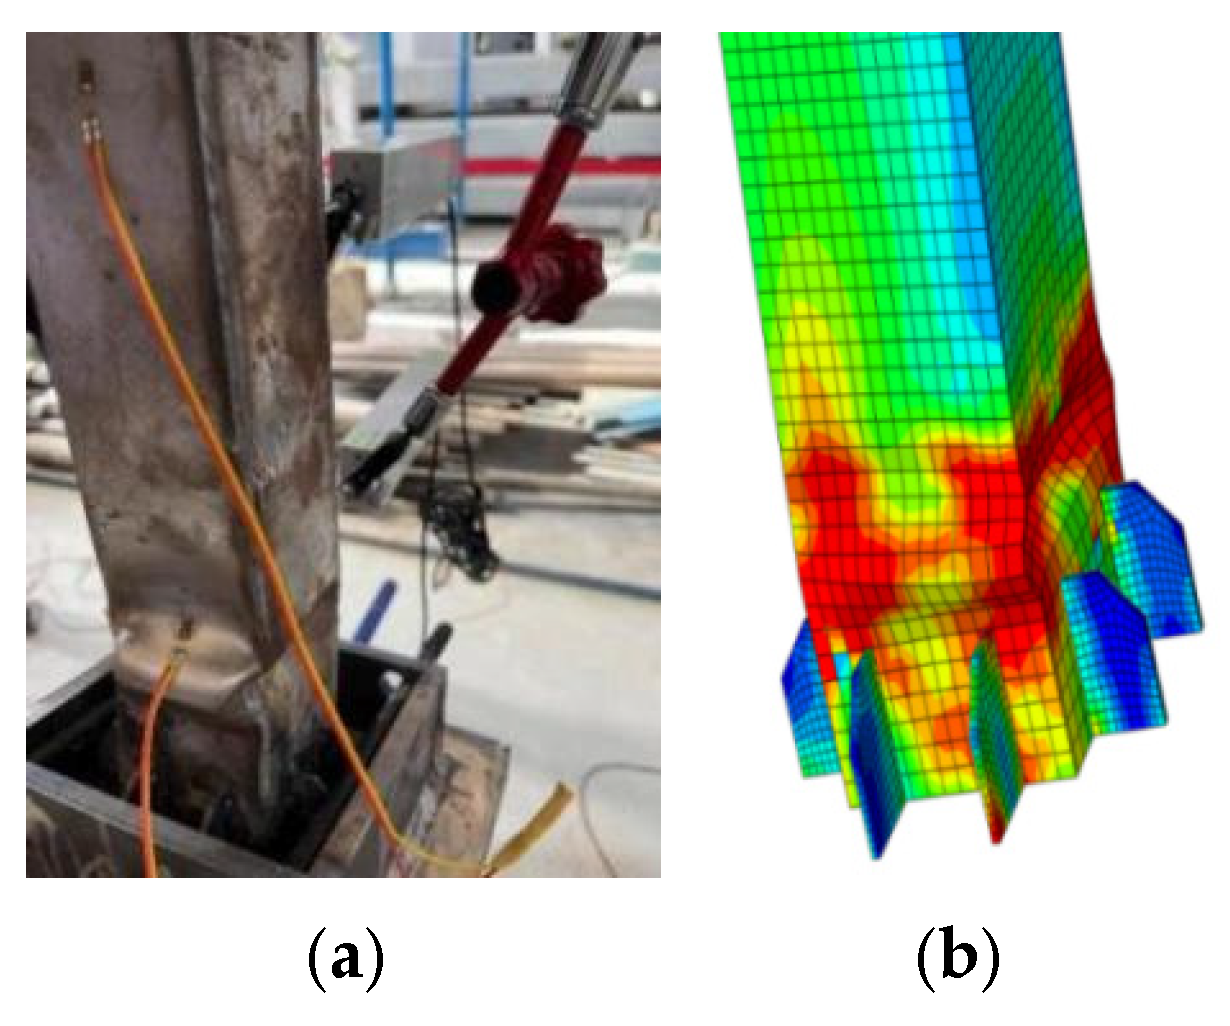
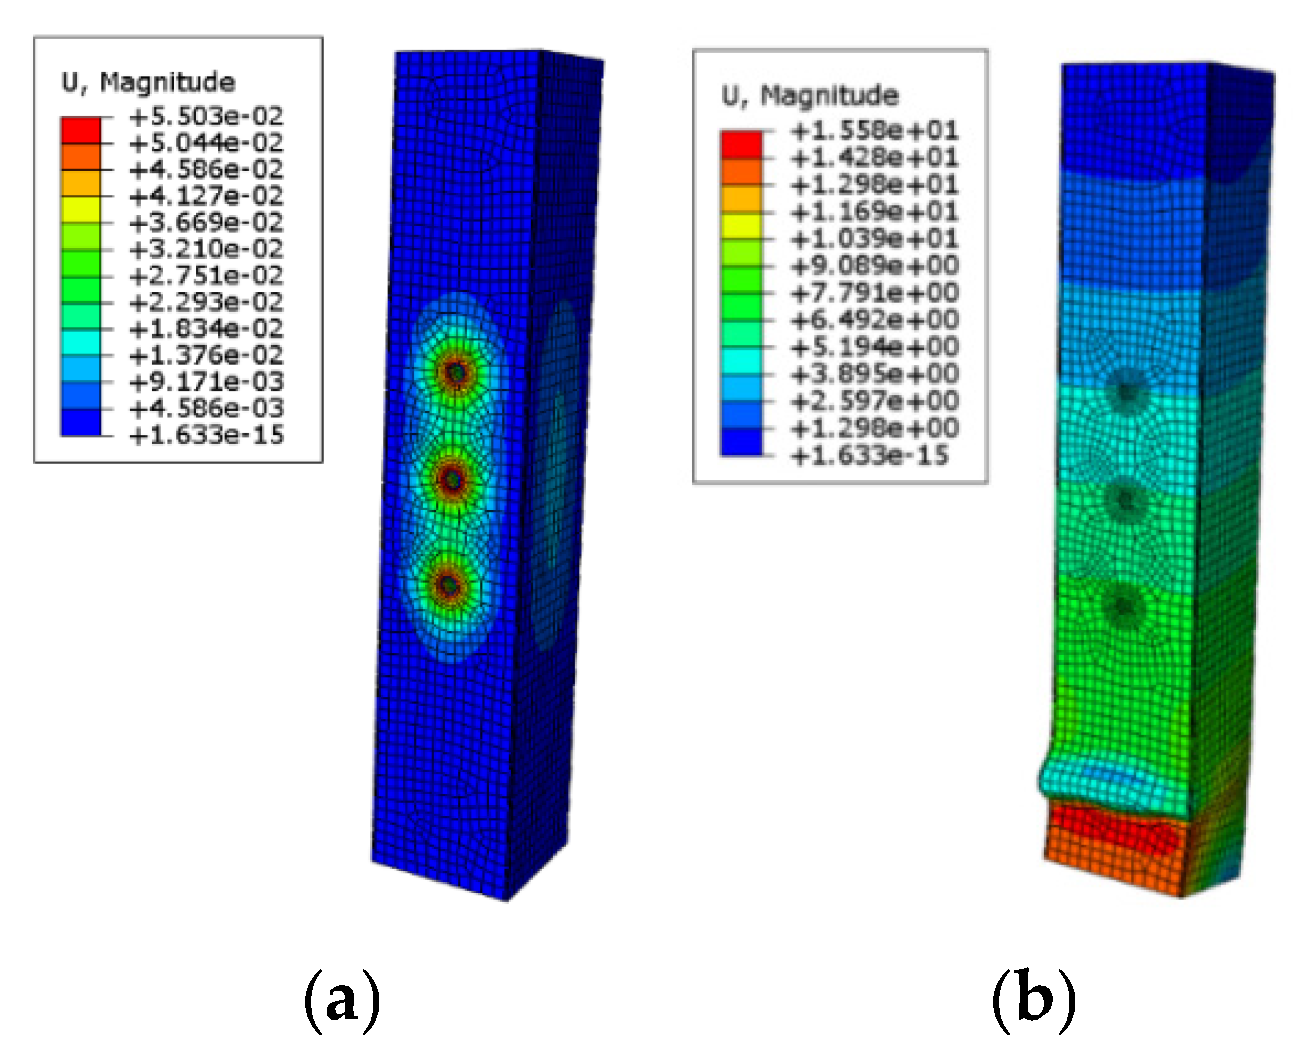
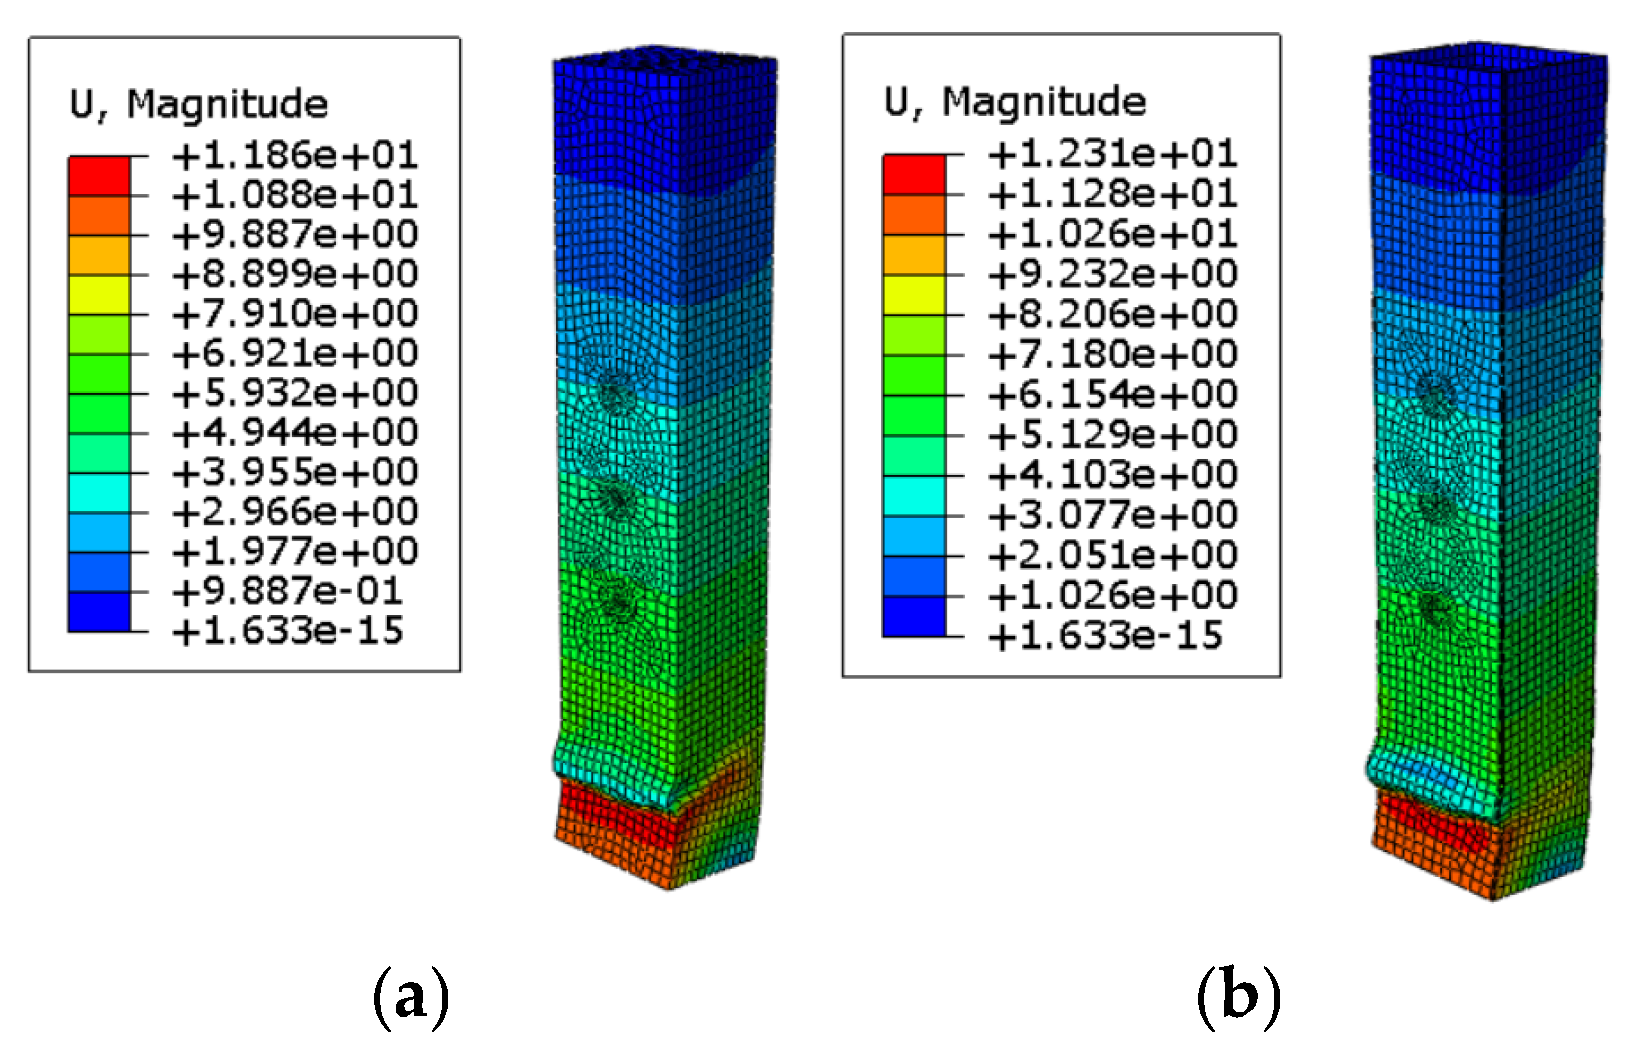
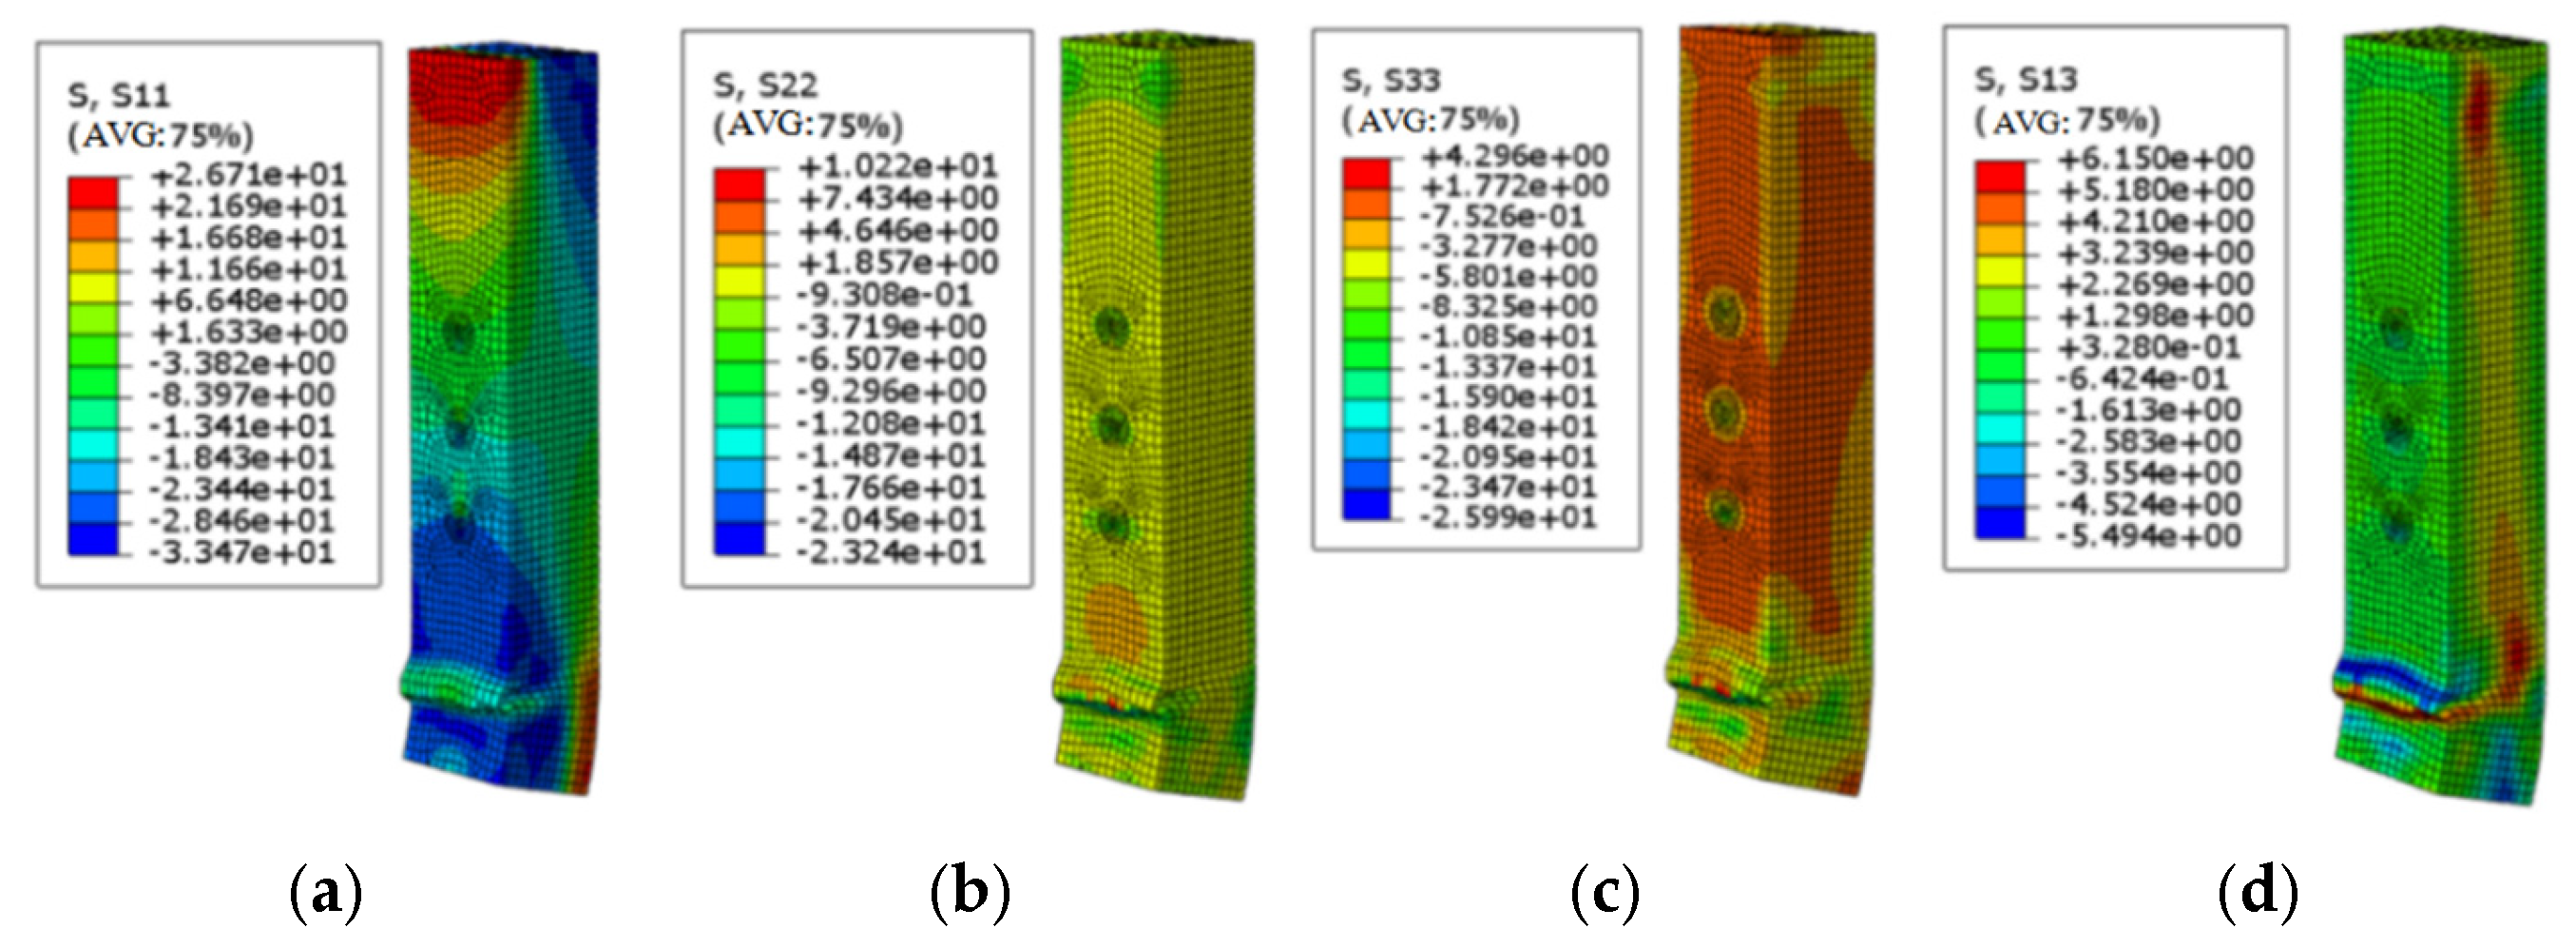
After completing the simulation calculations, the displacement nephogram of specimen G1 is shown in Figure 19. The maximum displacement occurred at the concave region of the steel pipe’s compressed end and the load application side of the loading-end fixed plate. Normal and shear stresses in all directions of the thin-walled steel pipe were comprehensively analyzed. Results showed that stress primarily concentrated in the S22 (Y-axis) and S33 (Z-axis) directions, as shown in Figure 20a,b. In contrast, stresses in other directions were negligible.
In the S22 direction, significant normal stress concentration was observed at the depression on the loading end’s compression side. Negative stress concentrations also occurred in the upper and lower regions of this depression. Conversely, stresses in other directions showed no significant variation. In the S33 direction, normal stress was primarily distributed on the fixed-end compression side and the loading-end tension side. Shear stress was distributed at the interface angles between the loading-end sides and the fixed-end tension side. Shear stress decreased with increasing distance from the fixed end along the mid-axis.
When G1’s load displacement reached 1.2 mm, the steel tube’s load-bearing capacity peaked at 34.3 kN. After displacement loading, a distinct depression formed on the steel pipe’s compression side. Meanwhile, significant buckling deformation occurred on steel pipe surfaces adjacent to the compression side. Deformation results of G1 from finite element simulation and tests are compared in Figure 21. As shown in Figure 21a,b, both numerical and experimental results showed obvious sagging deformation in the upper region of the loading-end stiffener of the thin-walled steel tube column. Moreover, simulation results matched well with experimental results.
(2)
Model analysis of specimen G2
The loading process of specimen G2 was divided into two stages: after bolt pretensioning and after external load application. Displacement variation diagrams for these two stages are shown in Figure 22. As displacement was applied, the specimen gradually failed, with the timber column and thin-walled steel tube displacement variations in agreement, as shown in Figure 23a,b. As shown in Figure 22a, bolts constrained the thin-walled steel plate, causing localized deformation near bolt holes. Figure 22b shows that under eccentric loading, the composite column’s fixed end had negligible displacement. At the loaded end, however, the compressed-side thin-walled steel bent due to the eccentric load, and the entire composite column at the loaded end bulged. Due to the internal timber core filling and stiffener restraint, the composite column did not exhibit the compressed-side loaded-end concave deformation typical of pure steel tubes.
After completing the model calculation, for the G2 specimen’s thin-walled steel, a prominent stress concentration appeared at the buckling region of the loading end’s compression side in the S11 direction, as shown in Figure 24a. In the S22 direction, distinct stress concentrations occurred at both the compression-side fixed end of the thin-walled steel pipe and the tension-side loading end, as illustrated in Figure 24b. In the S12 direction (YZ-plane shear force along the Y-axis), stress concentration was evident near the lowermost bolt, with positive and negative stresses symmetrically distributed about the vertical centerline of the bolt hole as the axis of symmetry, as shown in Figure 24c. No discernible stress concentrations were observed in other directions.
For the wooden column of the G2 specimen, in the S11 direction, the compression side of the fixed end and the tension side of the loading end were the regions where positive stress concentration occurred. Conversely, the compression side of the loading end and the tension side of the fixed end were the regions with negative stress concentration. Stresses in these four regions decreased as the distance from the column center increased, as shown in Figure 25a. In the S22 direction, stress distribution was relatively uniform, with no distinct variation regions, as shown in Figure 25b. In the S33 direction (Z-axis stress), stress concentrations were distributed above the buckling deformation zone at the composite column’s lower end (comprising the wooden column and rectangular steel tube), as shown in Figure 25c. In the S13 direction (in the YZ-axis plane, representing the direction of the shear force along the Z-axis), the shear force was concentrated at the buckling deformation of the wooden column. Additionally, there was also a concentration of shear force in the middle regions on both sides of the compression side, which was particularly pronounced at the upper and lower ends, as shown in Figure 25d. In other directions, no obvious stress concentration was observed.
Overall, the stress distributions of the square wooden column and rectangular steel tube were highly consistent, indicating that the two materials demonstrate excellent collaborative behavior after combination.
The comparison between the finite element simulation and test results of the G2 specimen is illustrated in Figure 26. Comparing Figure 26a,b shows good agreement between numerical and test results. When eccentric displacement was applied, the composite column’s fixed end showed negligible displacement, while the loading end and thin-walled steel’s compression side began to bend. The composite column’s loading end bent under eccentric displacement, but due to the internal wooden column infilling and bolt restraint, bending occurred primarily on the compression side. Unlike the compression-side loading end of a pure steel pipe, no pronounced depression deformation occurred.

3.4. Finite Element Result Analysis
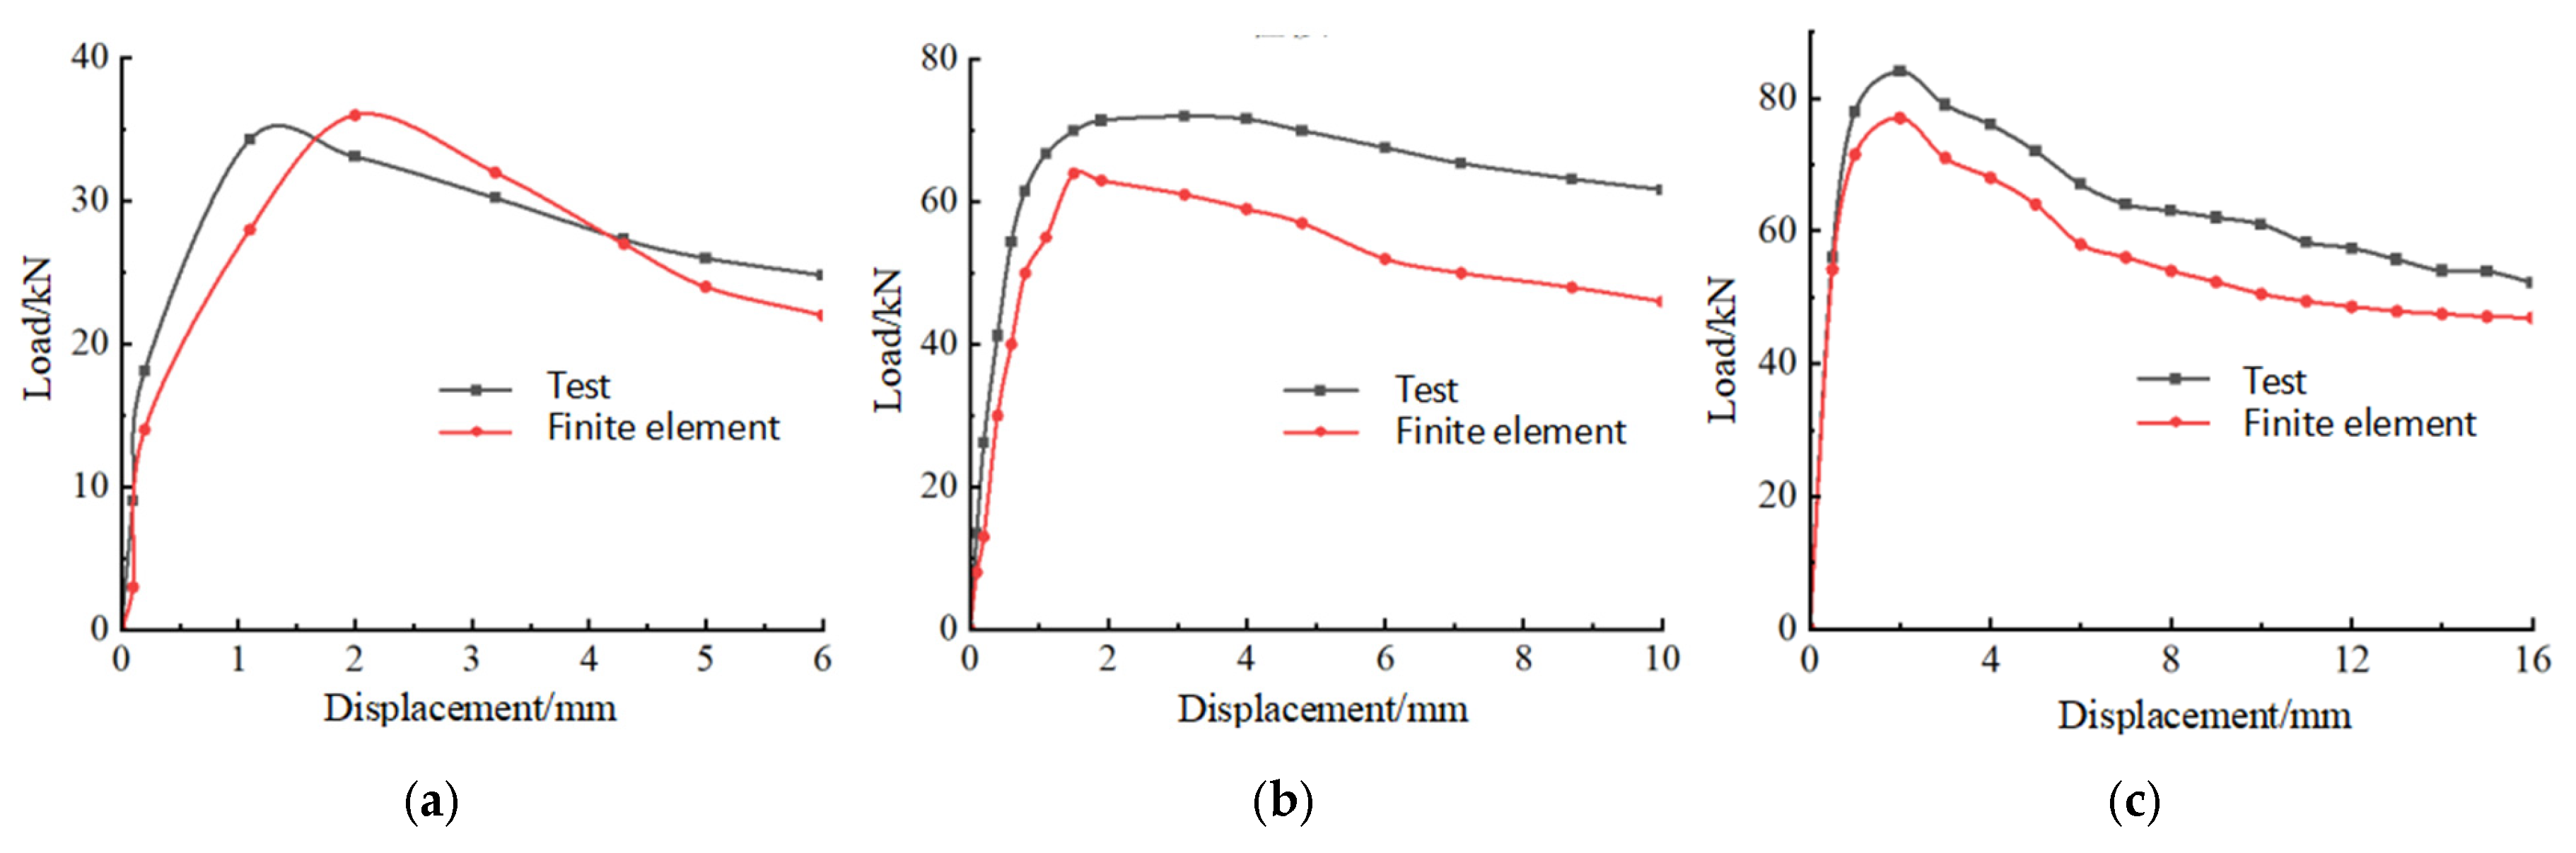
After completing the finite element model calculation, the load and displacement data were extracted and processed to generate load–displacement curves. The comparison results of specimens G1, G2, and G3 were presented in Figure 27a, Figure 27b and Figure 27c, respectively.
(1)
Comparative analysis of simulated and tested load–displacement curves
By comparing the test curve and the numerical simulation curve, the following observations could be made:
For specimen G1, during the elastic stage with small displacement, the two curves showed similar trends, and the finite element simulation curve had a slightly steeper slope. The pure steel tube specimens inherently contain unavoidable internal defects, which cause initial stiffness degradation. In contrast, the assumptions of the finite element model were rather idealized. As a result, significant load differences existed between the two when displacement ranged from 0.2 mm to 1.1 mm. Test results showed the load peaked at 2 mm displacement, while simulation results indicated a maximum at approximately 1 mm. In the late loading stage, as deformation increased and the specimen entered the plastic stage, the curves deviated, and the simulation curve declined linearly. When the specimen failed, the finite element simulation load value was slightly higher than the test result.
For specimen G2, the finite element simulation curve had a steeper slope than the test curve from the outset. The test load peaked at 1.5 mm displacement, while the simulation load reached a maximum at 1.9 mm. During displacement loading, relative slippage occurred at bolt nodes, interfaces between thin-walled steel tubes and square wooden columns, and junctions between wooden columns and steel tubes. This caused the load discrepancy between the two to increase gradually. When the specimen failed, the simulation and test results differed by 15 kN.
The finite element simulation curves of specimen G3 showed a significantly more consistent trend with experimental curves. Throughout the loading process, both curves reached their peak loads precisely when the displacement attained 2 mm. Nevertheless, the outcomes of the finite element simulation were consistently and marginally higher than the experimental results. The fundamental cause of this divergence lay in the prevalence of a large number of cracks and knots within the wooden columns. These inherent defects caused significant fluctuations in their mechanical properties. In contrast, within the finite element numerical simulation, the material properties were specified on the basis of the average values of the experimental data. This methodological approach inevitably led to a disparity between the simulated material properties and the actual properties of the wood.
(2)
Comparative Analysis of Finite Element Simulation and Test Ultimate Load
The test and simulation data of each specimen were extracted from the load–displacement curve comparison diagram of finite element and experimental results. Comparative results are tabulated in Table 5. Overall, the numerical simulation values were marginally higher than the experimental values. However, the discrepancies between them were insignificant. Specifically, the maximum ultimate bearing capacity error was 11.1%, and the minimum was 4.9%. The maximum elastic stiffness error was 5.0%, and the minimum was 2.6%. These results demonstrate that the finite element numerical simulation exhibited relatively high accuracy in predicting the behavior of thin-walled steel–wood composite columns under eccentric compression.

4. Parametric Analysis of Thin-Walled Steel–Wood Composite Columns

This chapter investigates the influence of wooden column slenderness ratio and bolt prestress magnitude on thin-walled steel–wood composite column frame structures. By simulating a single-story frame, varying wooden column cross-sections in the composite columns and bolt prestress magnitude, and keeping other component parameters unchanged, this study analyzes their effects on the structure.

4.1. Selection of Frame Parameters and Model Design

4.1.1. Selection of Frame Parameters

In the parametric analysis, the height of the composite column was fixed to better determine the slenderness ratio. The thin-walled steel–wood composite column length was 3000 mm. The cross-sectional dimensions of the wooden column varied from 200 mm to 300 mm, specifically 200 mm × 200 mm, 250 mm × 250 mm, and 300 mm × 300 mm. The bolt pretension forces changed from 2000 N to 6000 N, namely 2000 N, 4000 N, and 6000 N. A total of nine groups of thin-walled steel–wood composite column frame models were established. By varying the key parameters of wooden column cross-section and bolt pretension, the mechanical behavior of the composite columns was studied to derive optimal parameter recommendations. Specific analysis parameters are shown in Table 6.

4.1.2. Model Design

In this study, a single-story frame structure has a span of 6000 mm. The cross-sectional dimension of the beam is H300 × 250 × 8 × 10 mm. The column is composed of thin-walled rectangular steel tubes with a 4 mm wall thickness, infilled with a 250 mm × 250 mm wooden cross-section. Shell elements are used for the beam and thin-walled steel tubes, while solid elements are adopted for the wood and bolts. All steel materials are selected as Q325, and the wood is chosen as Chinese fir. A reference point is set on the left side of the beam–column intersection in the model, and the beam–column intersection is coupled. A cyclic reciprocating load is applied on this reference point as shown in Figure 28. The out-of-plane deformation of the frame beam and column is constrained, and the finite element analysis model of the structure is shown in Figure 29.

4.2. Structural Calculation Results

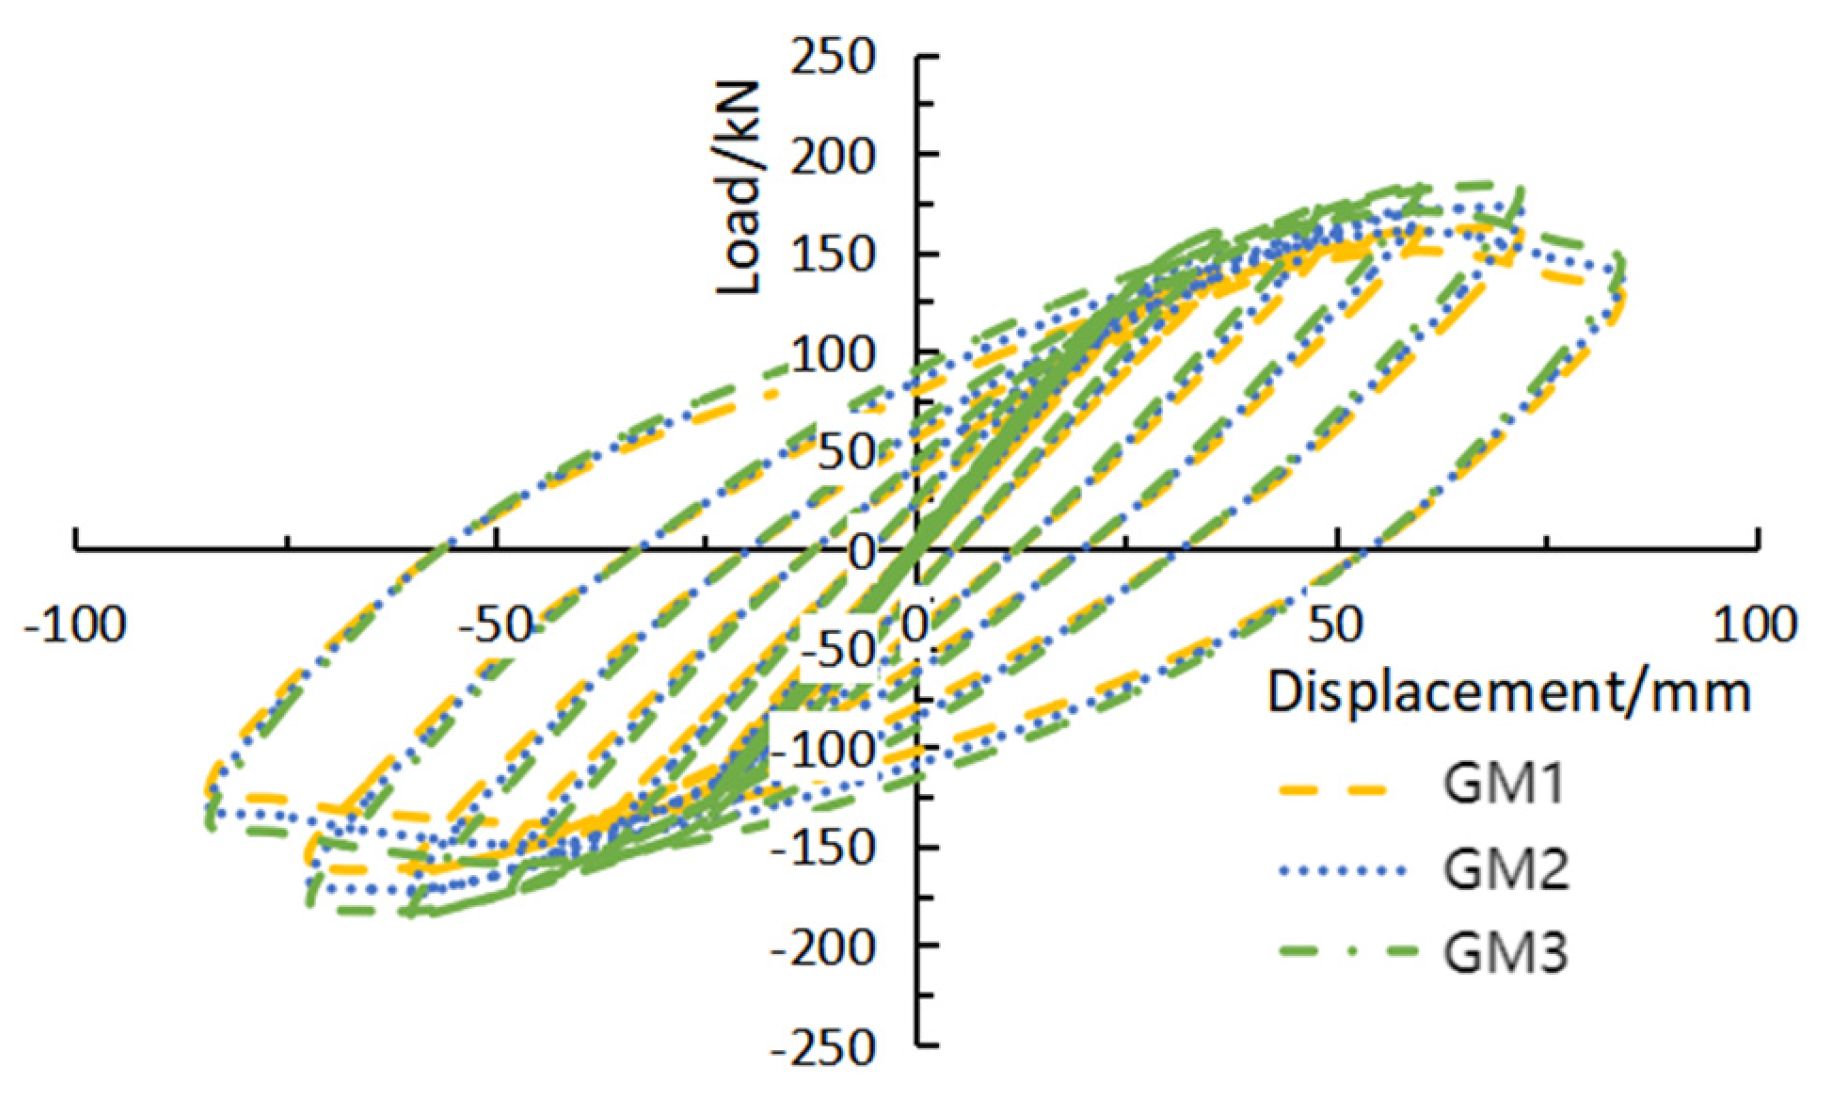
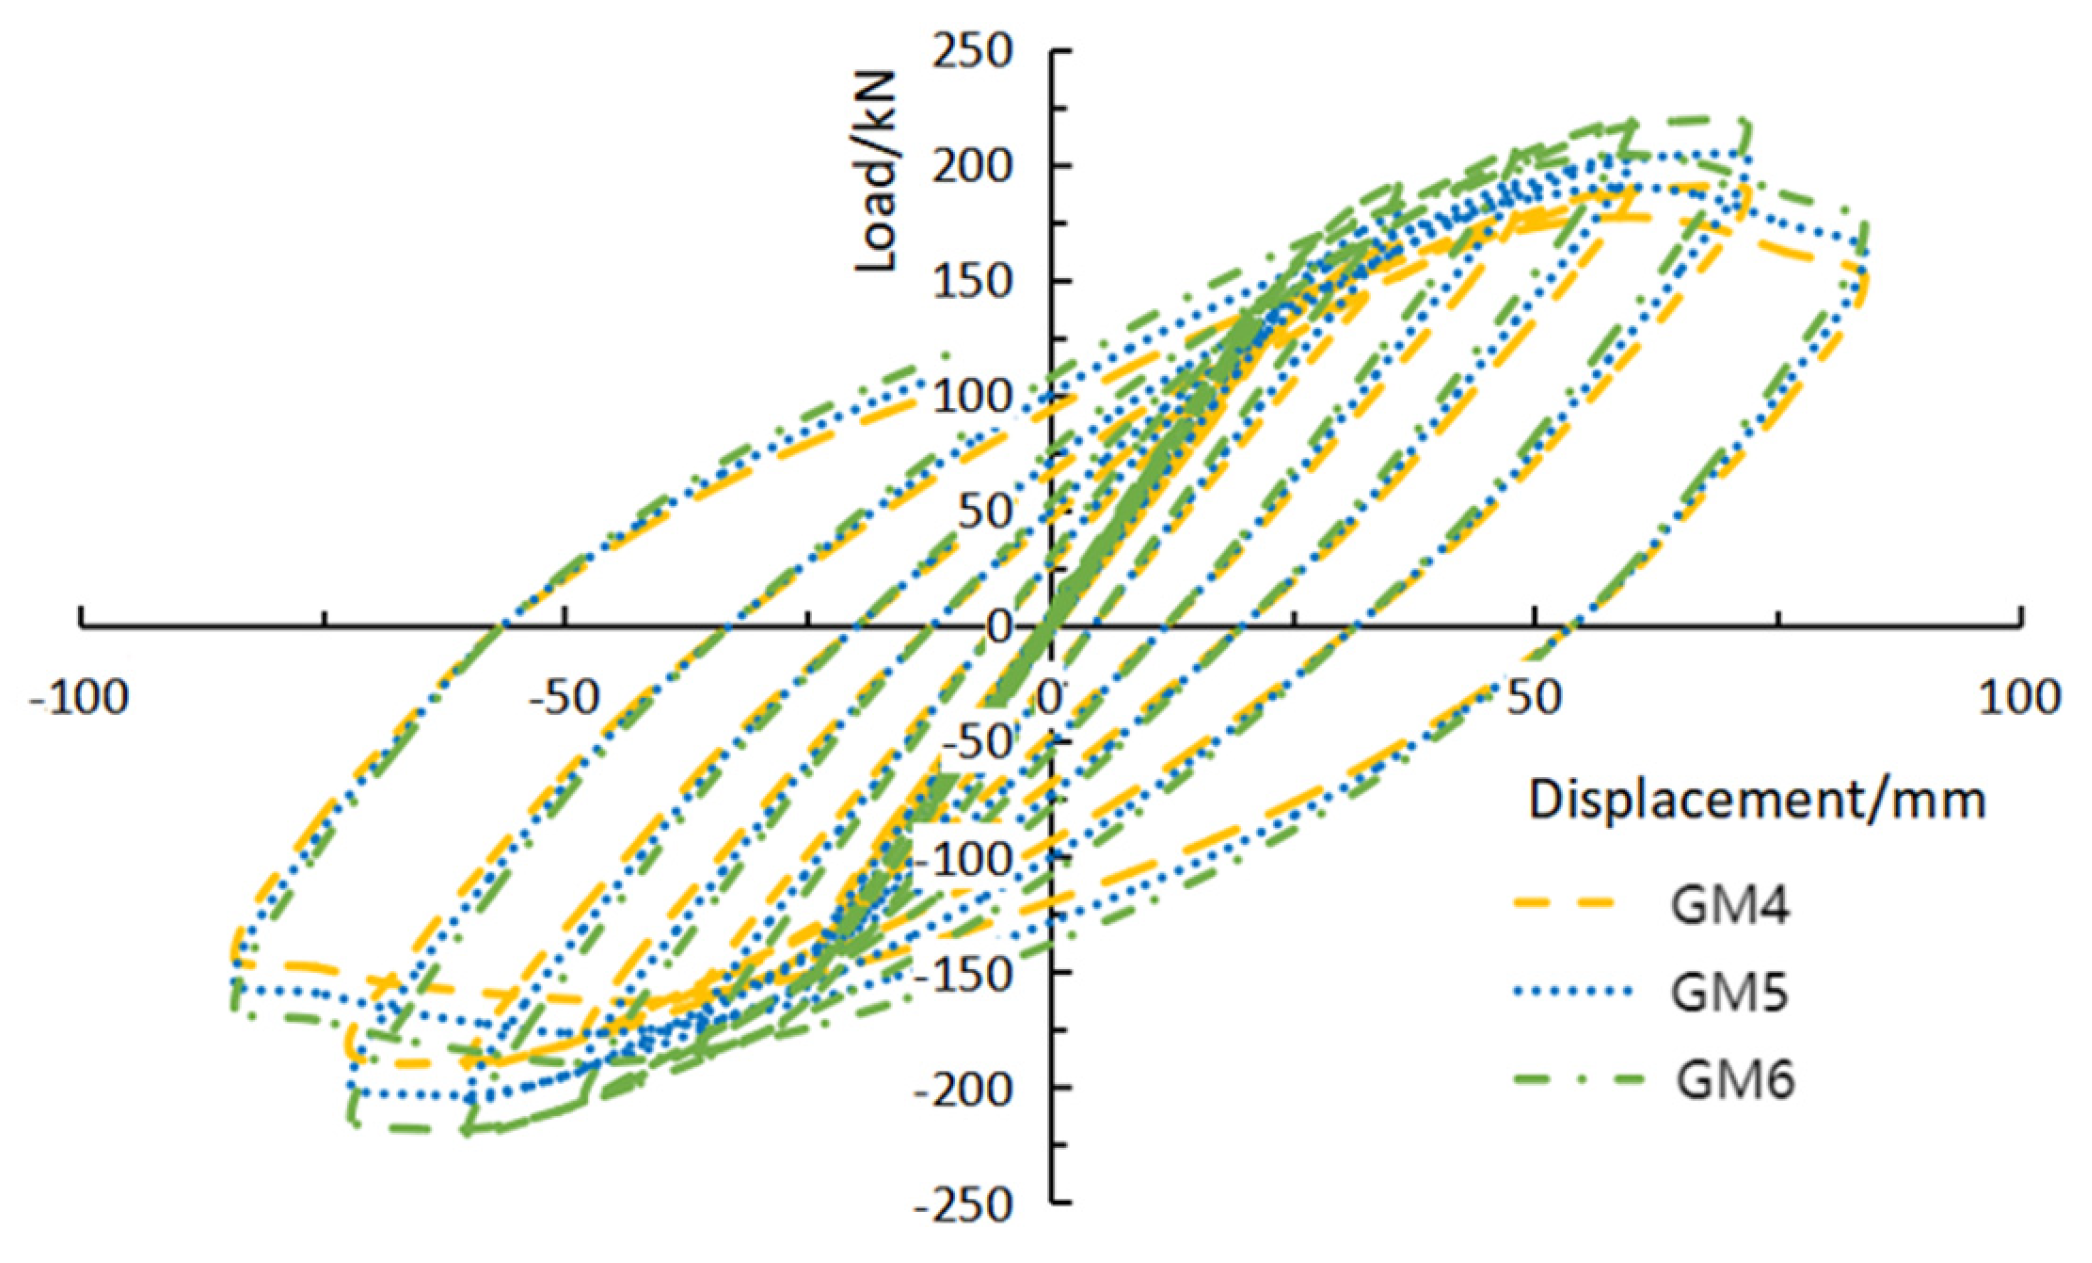
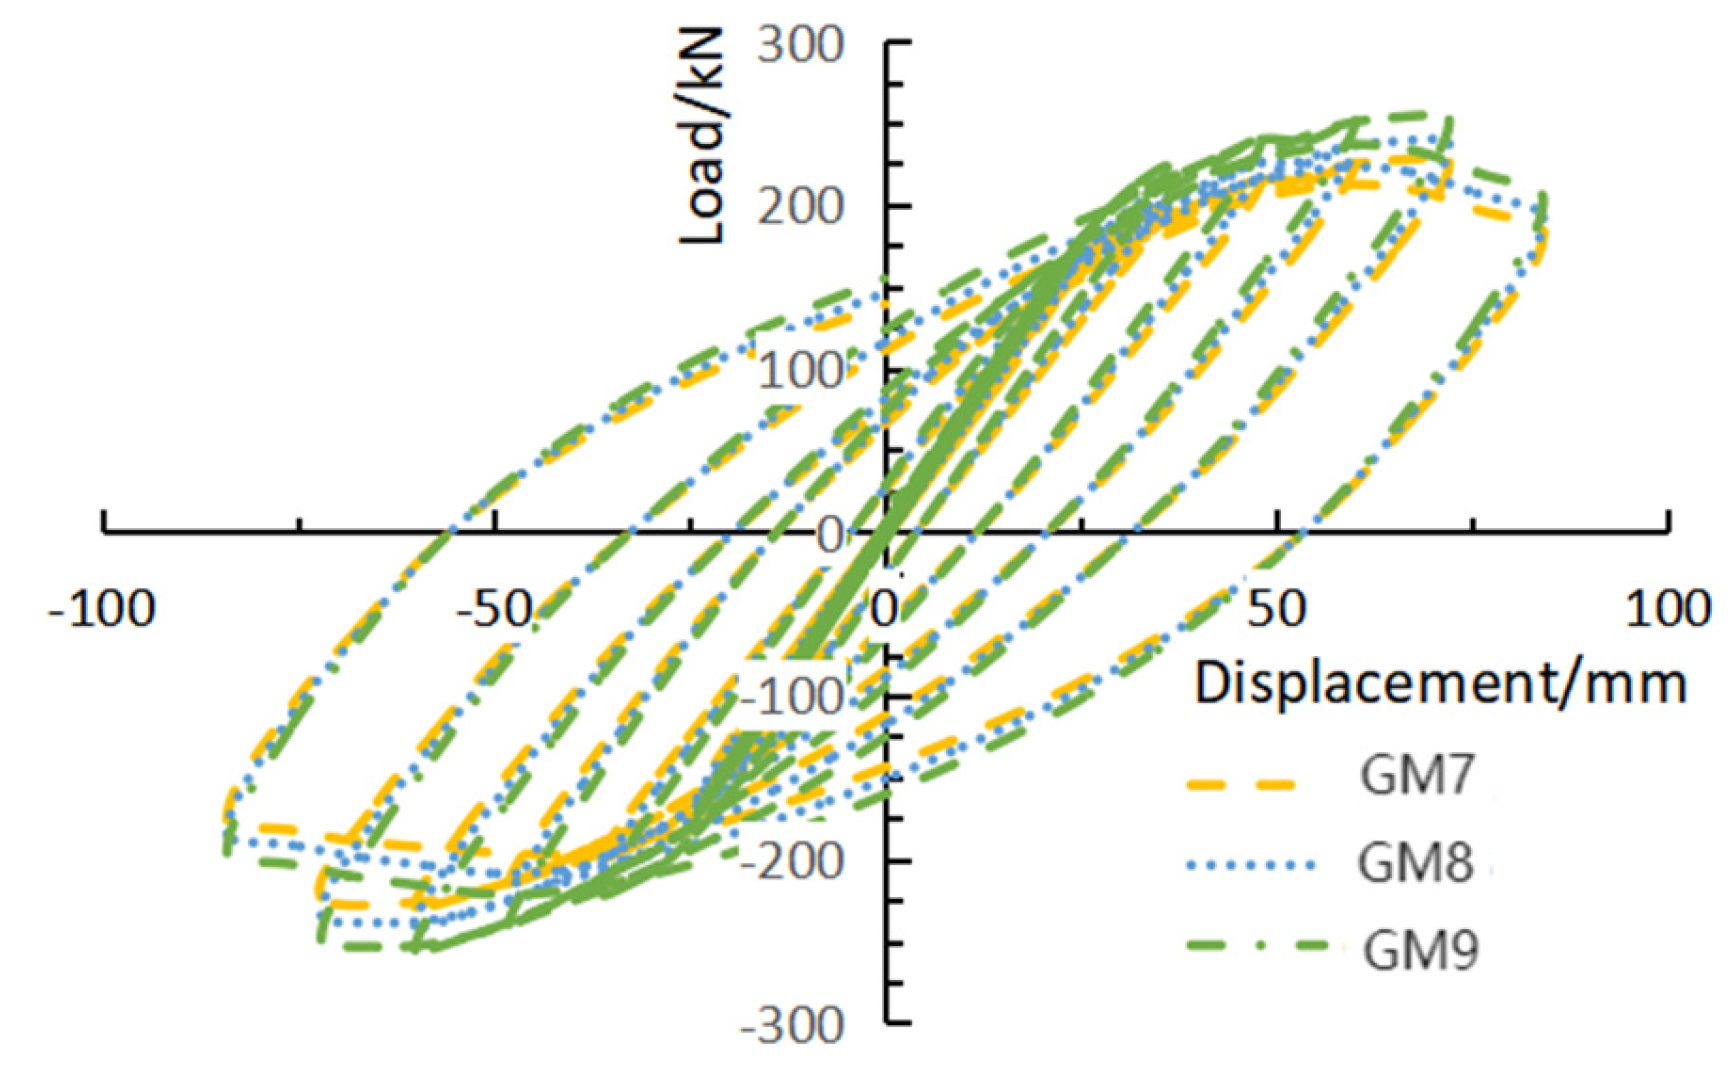
4.2.1. Comparison of Hysteresis Curves

Through numerical analysis of nine groups of thin-walled steel–wood composite column frame structures, hysteretic curves with different cross-sectional dimensions of wooden columns and different bolt pretension forces were obtained, as shown in Figure 30, Figure 31 and Figure 32.

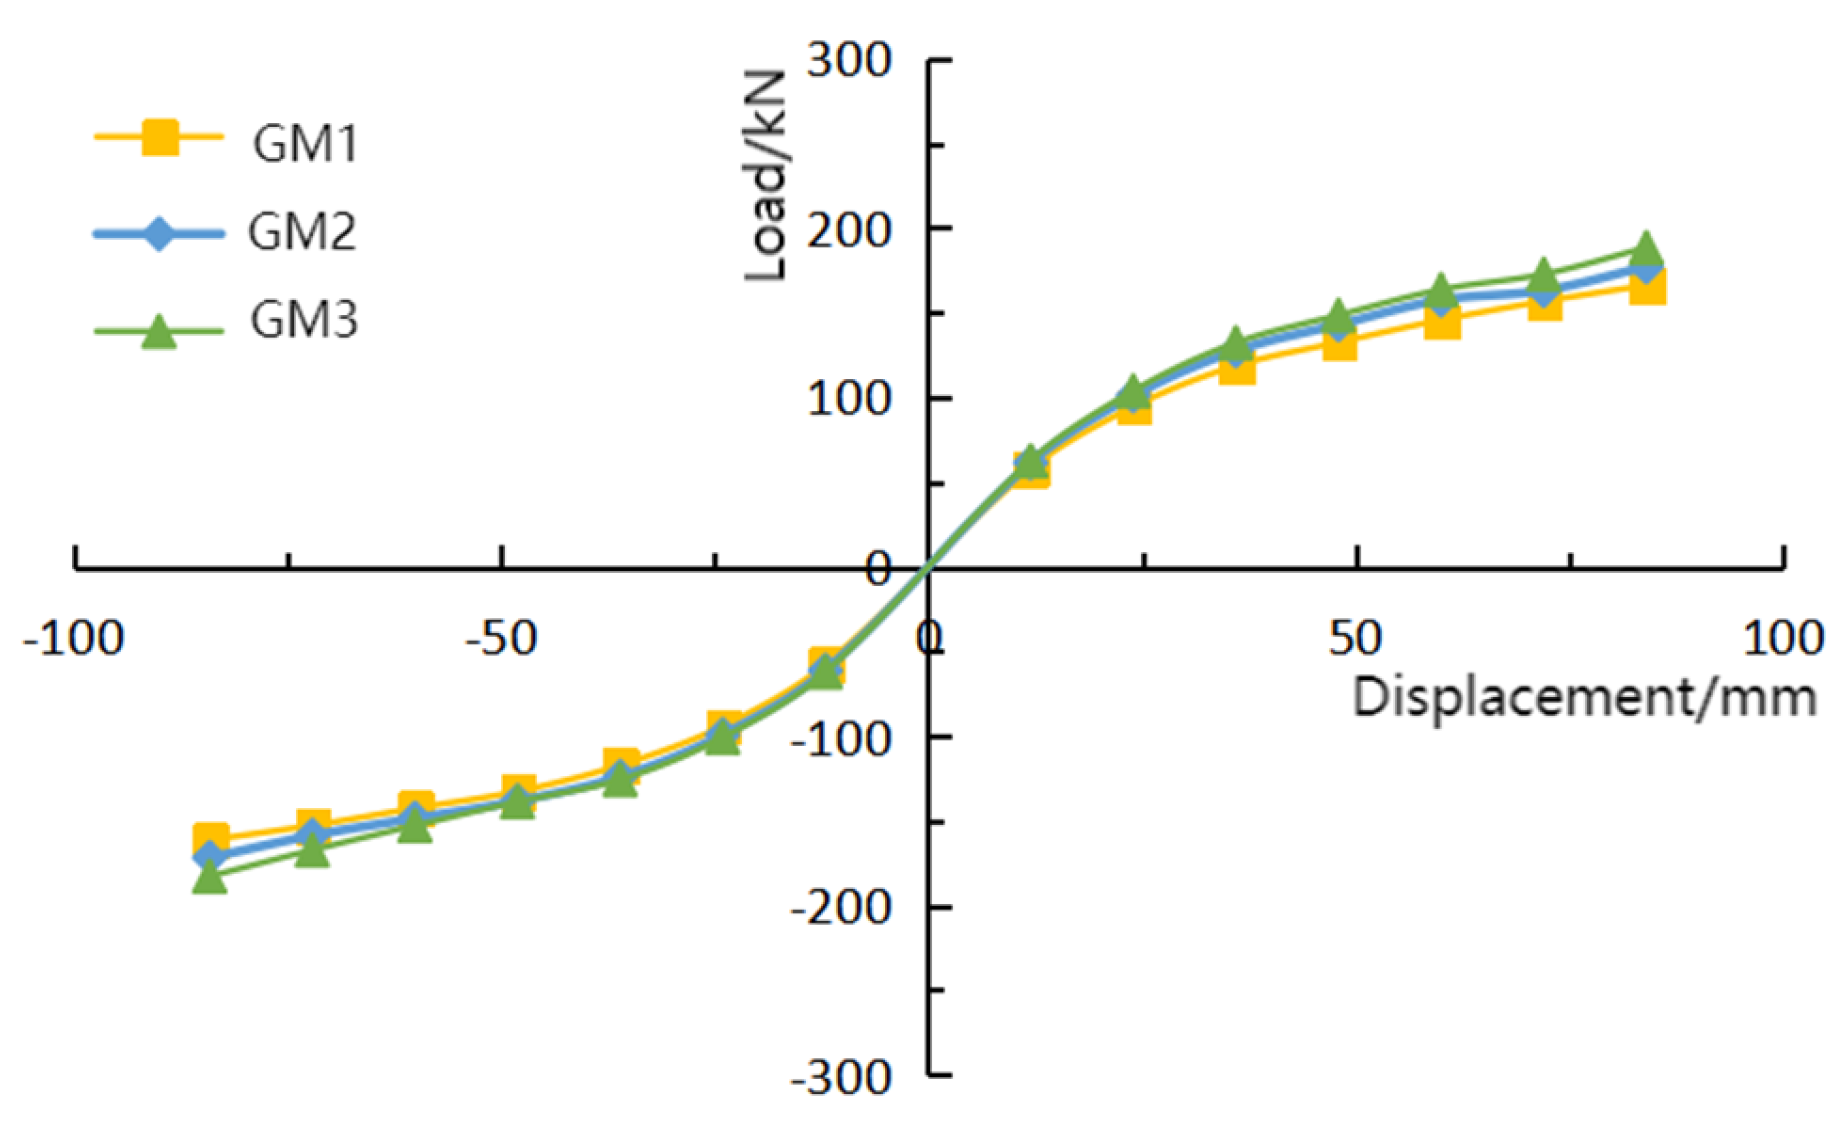
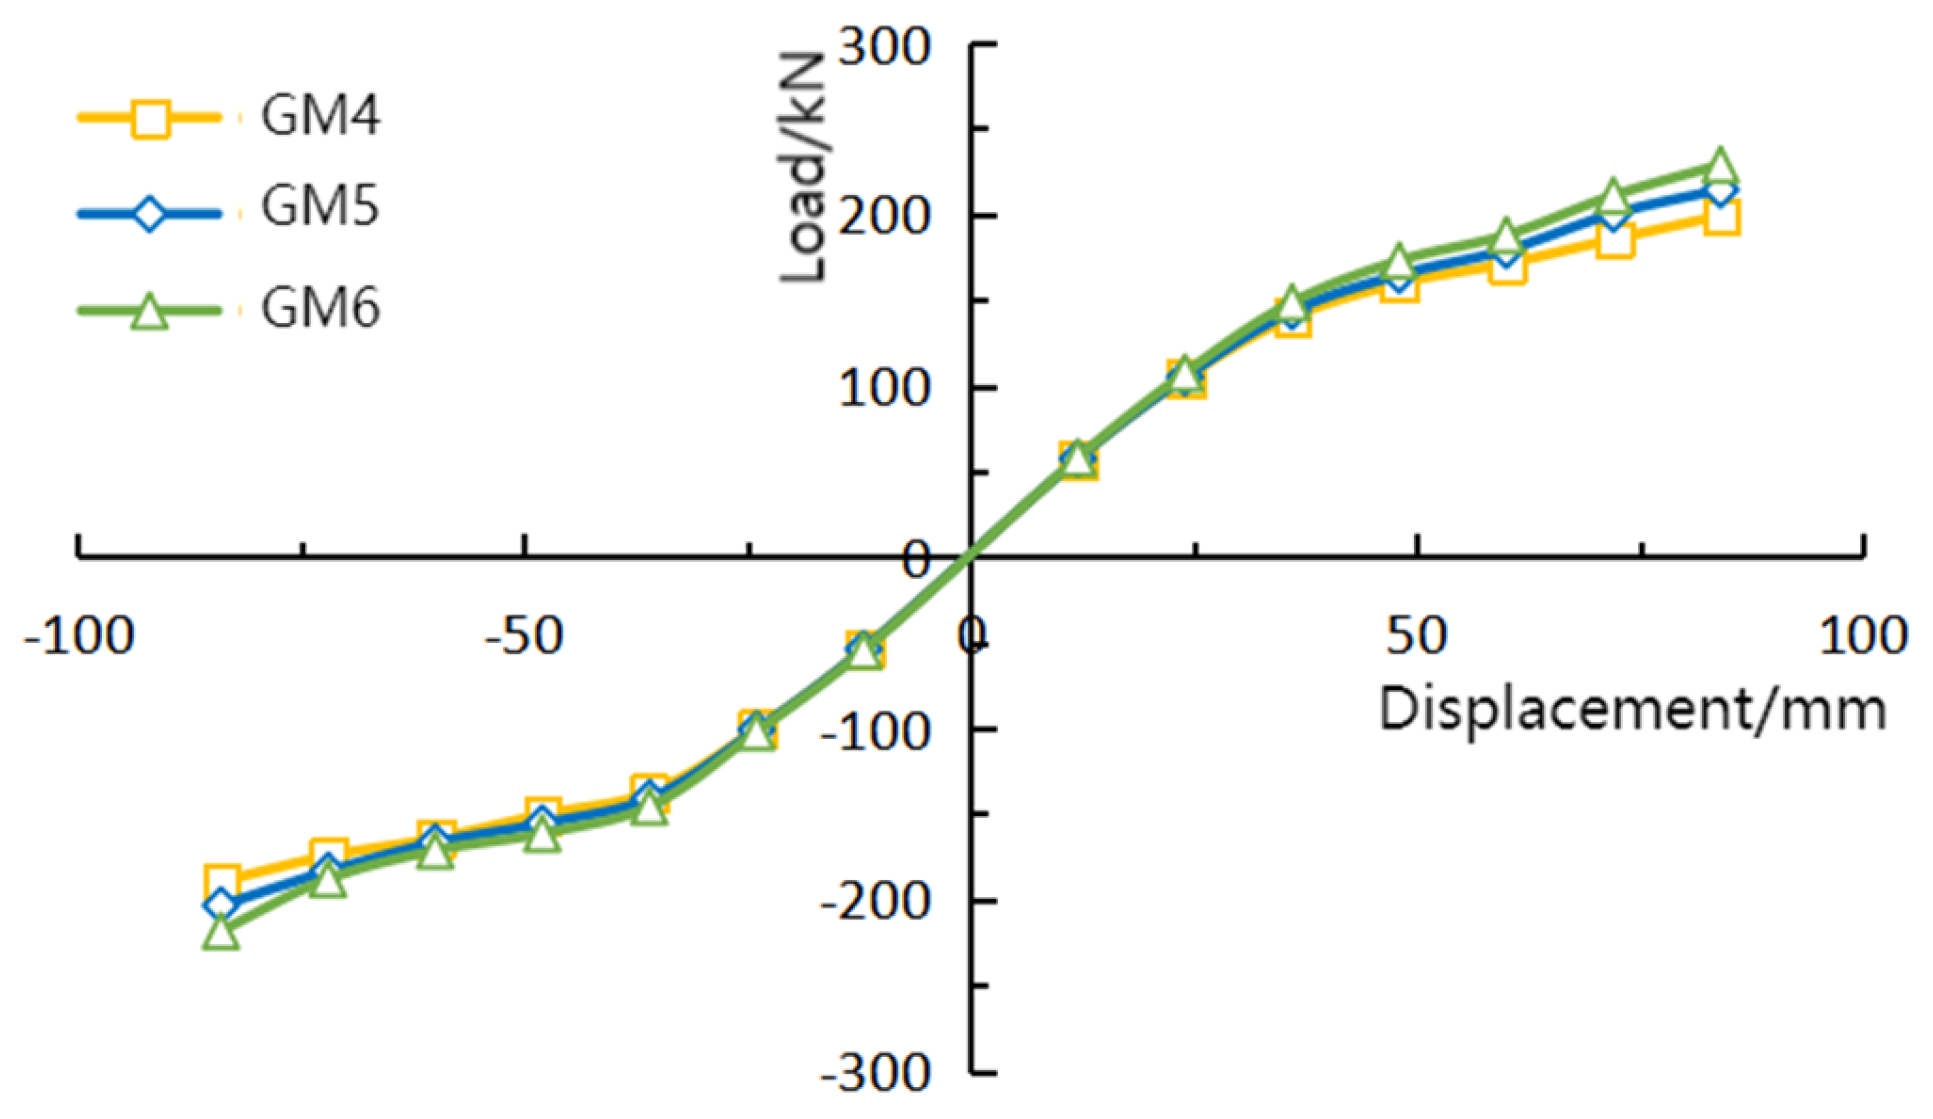
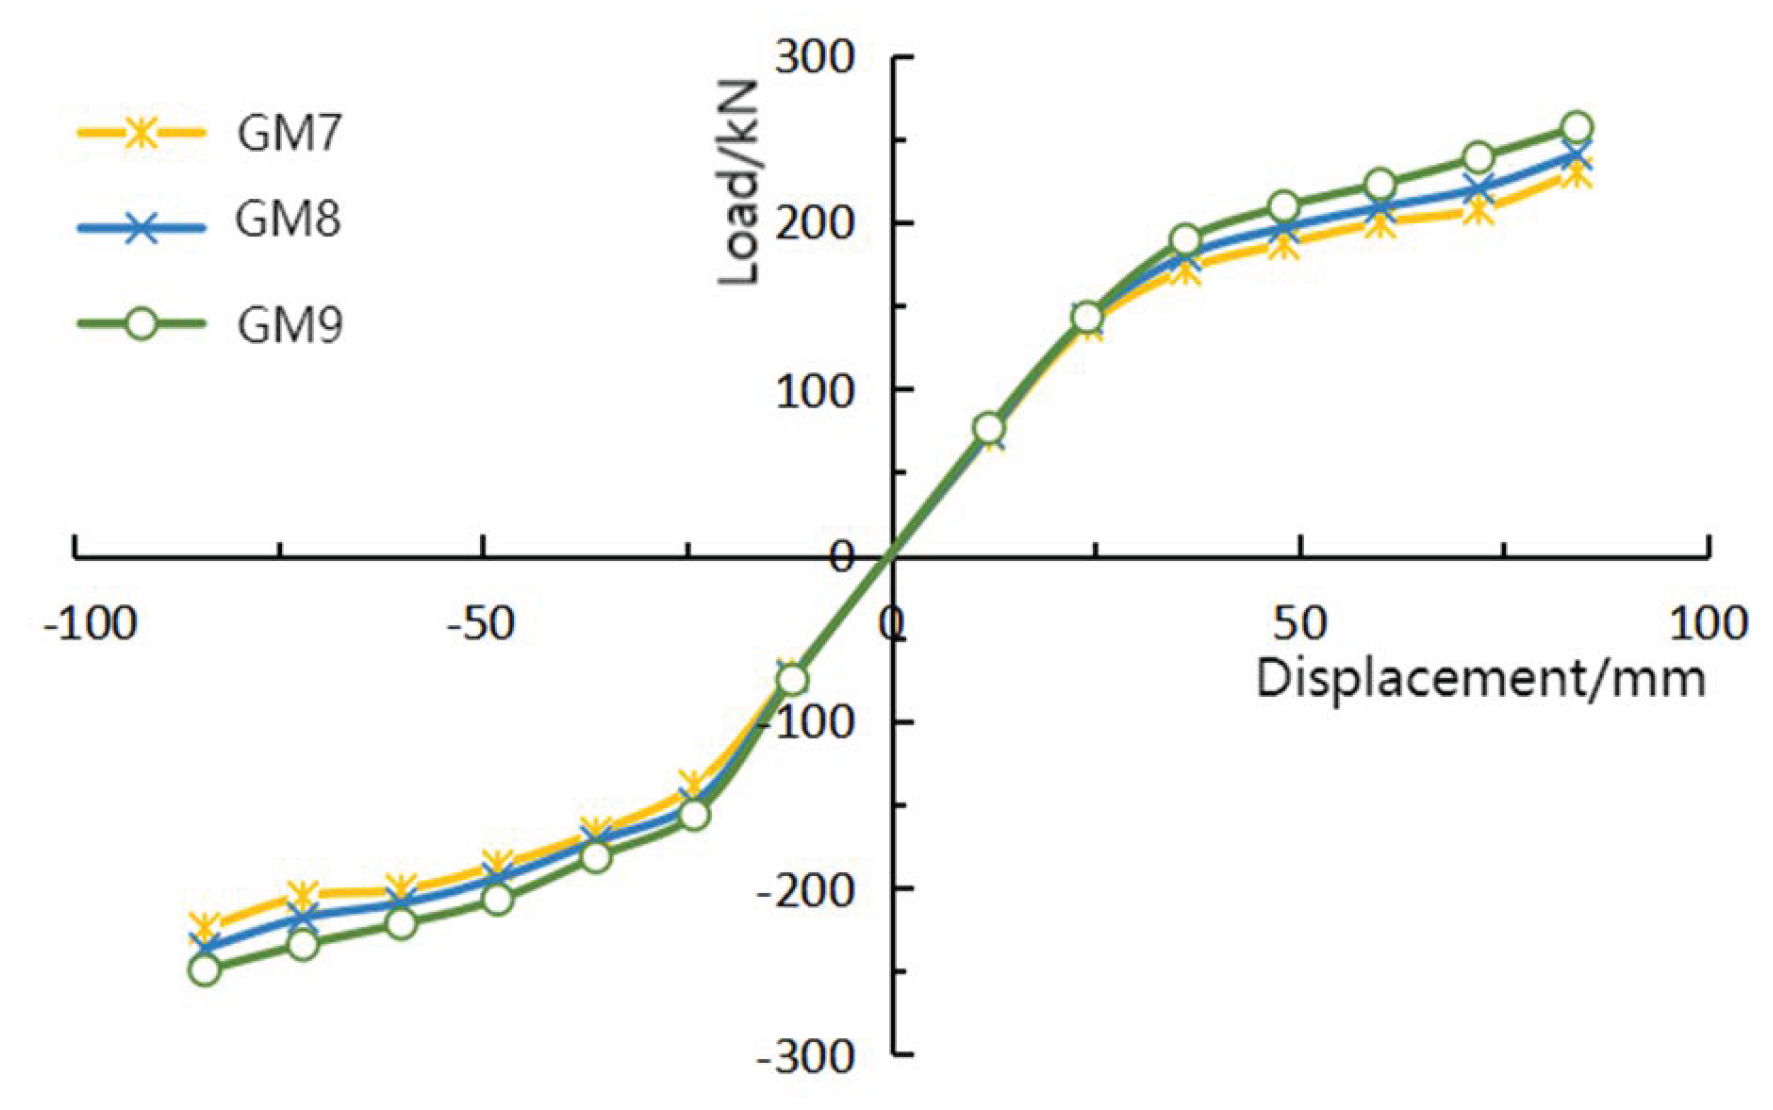
4.2.2. Comparison of Skeleton Curves

Through numerical analysis of nine groups of thin-walled steel–wood composite column frame structures, skeleton curves with different wooden column cross-sections, bolt strengths, and bolt pretension were obtained. To better study the mechanical properties of the thin-walled steel–wood composite column frame structure, the skeleton curves of the frame structures were compared by grouping them in the order of wooden column cross-sectional dimensions, bolt strengths, and bolt pretension forces, as shown in Figure 33, Figure 34 and Figure 35.
Skeleton curves show that at the first load level, the lateral resistance of each thin-walled steel–wood composite column exhibits a linear relationship with displacement, indicating that all components are in the elastic state at this stage. Under the same loading displacement, the structural bearing capacity increases with the increase in the cross-sectional dimensions of the wooden column in the composite column and the bolt pretension force. With the continuous application of low-cycle cyclic loads, the thin-walled steel–wood composite columns gradually enter the yield state. For the thin-walled steel–wood composite column frame structure, the skeleton curve grows gently after the thin-walled steel tube yields, but the overall trend is upward. Moreover, with the increase in the wooden column cross-sectional dimensions, bolt pretension force, and bolt strength, the slope of the skeleton curve becomes steeper after the buckling of the thin-walled steel tube. Taking the average of the two ultimate load values corresponding to the positive and negative loading ultimate displacements of the skeleton curve as the ultimate bearing capacity of the structure, the ultimate bearing capacities of the nine groups of thin-walled steel–wood composite column frame structures were calculated. Additionally, the bearing capacity improvement rates under the three groups of parameters were computed, with GM1 set as the control group. The ultimate bearing capacities and bearing capacity improvement rates of all structures are shown in Table 7 and Table 8.
Processing the nine groups of data revealed that increasing wooden column cross-sections raised the average ultimate bearing capacity by 27.7%, while increasing bolt pretension raised it by 23%. This indicates that wooden column cross-sections have a greater influence on composite column performance. For instance, at a bolt pretension of 2000 N, GM4 (200 mm × 200 mm wooden column) had an ultimate bearing capacity of 163.66 kN, whereas GM13 (250 mm × 250 mm wooden column) had 194.23 kN—GM13’s capacity was 18.68% higher than GM4’s. Compared to GM4, GM5 had a bolt pretension of 4000 N (other parameters unchanged), with an ultimate capacity of 174.38 kN—a 6.55% increase.

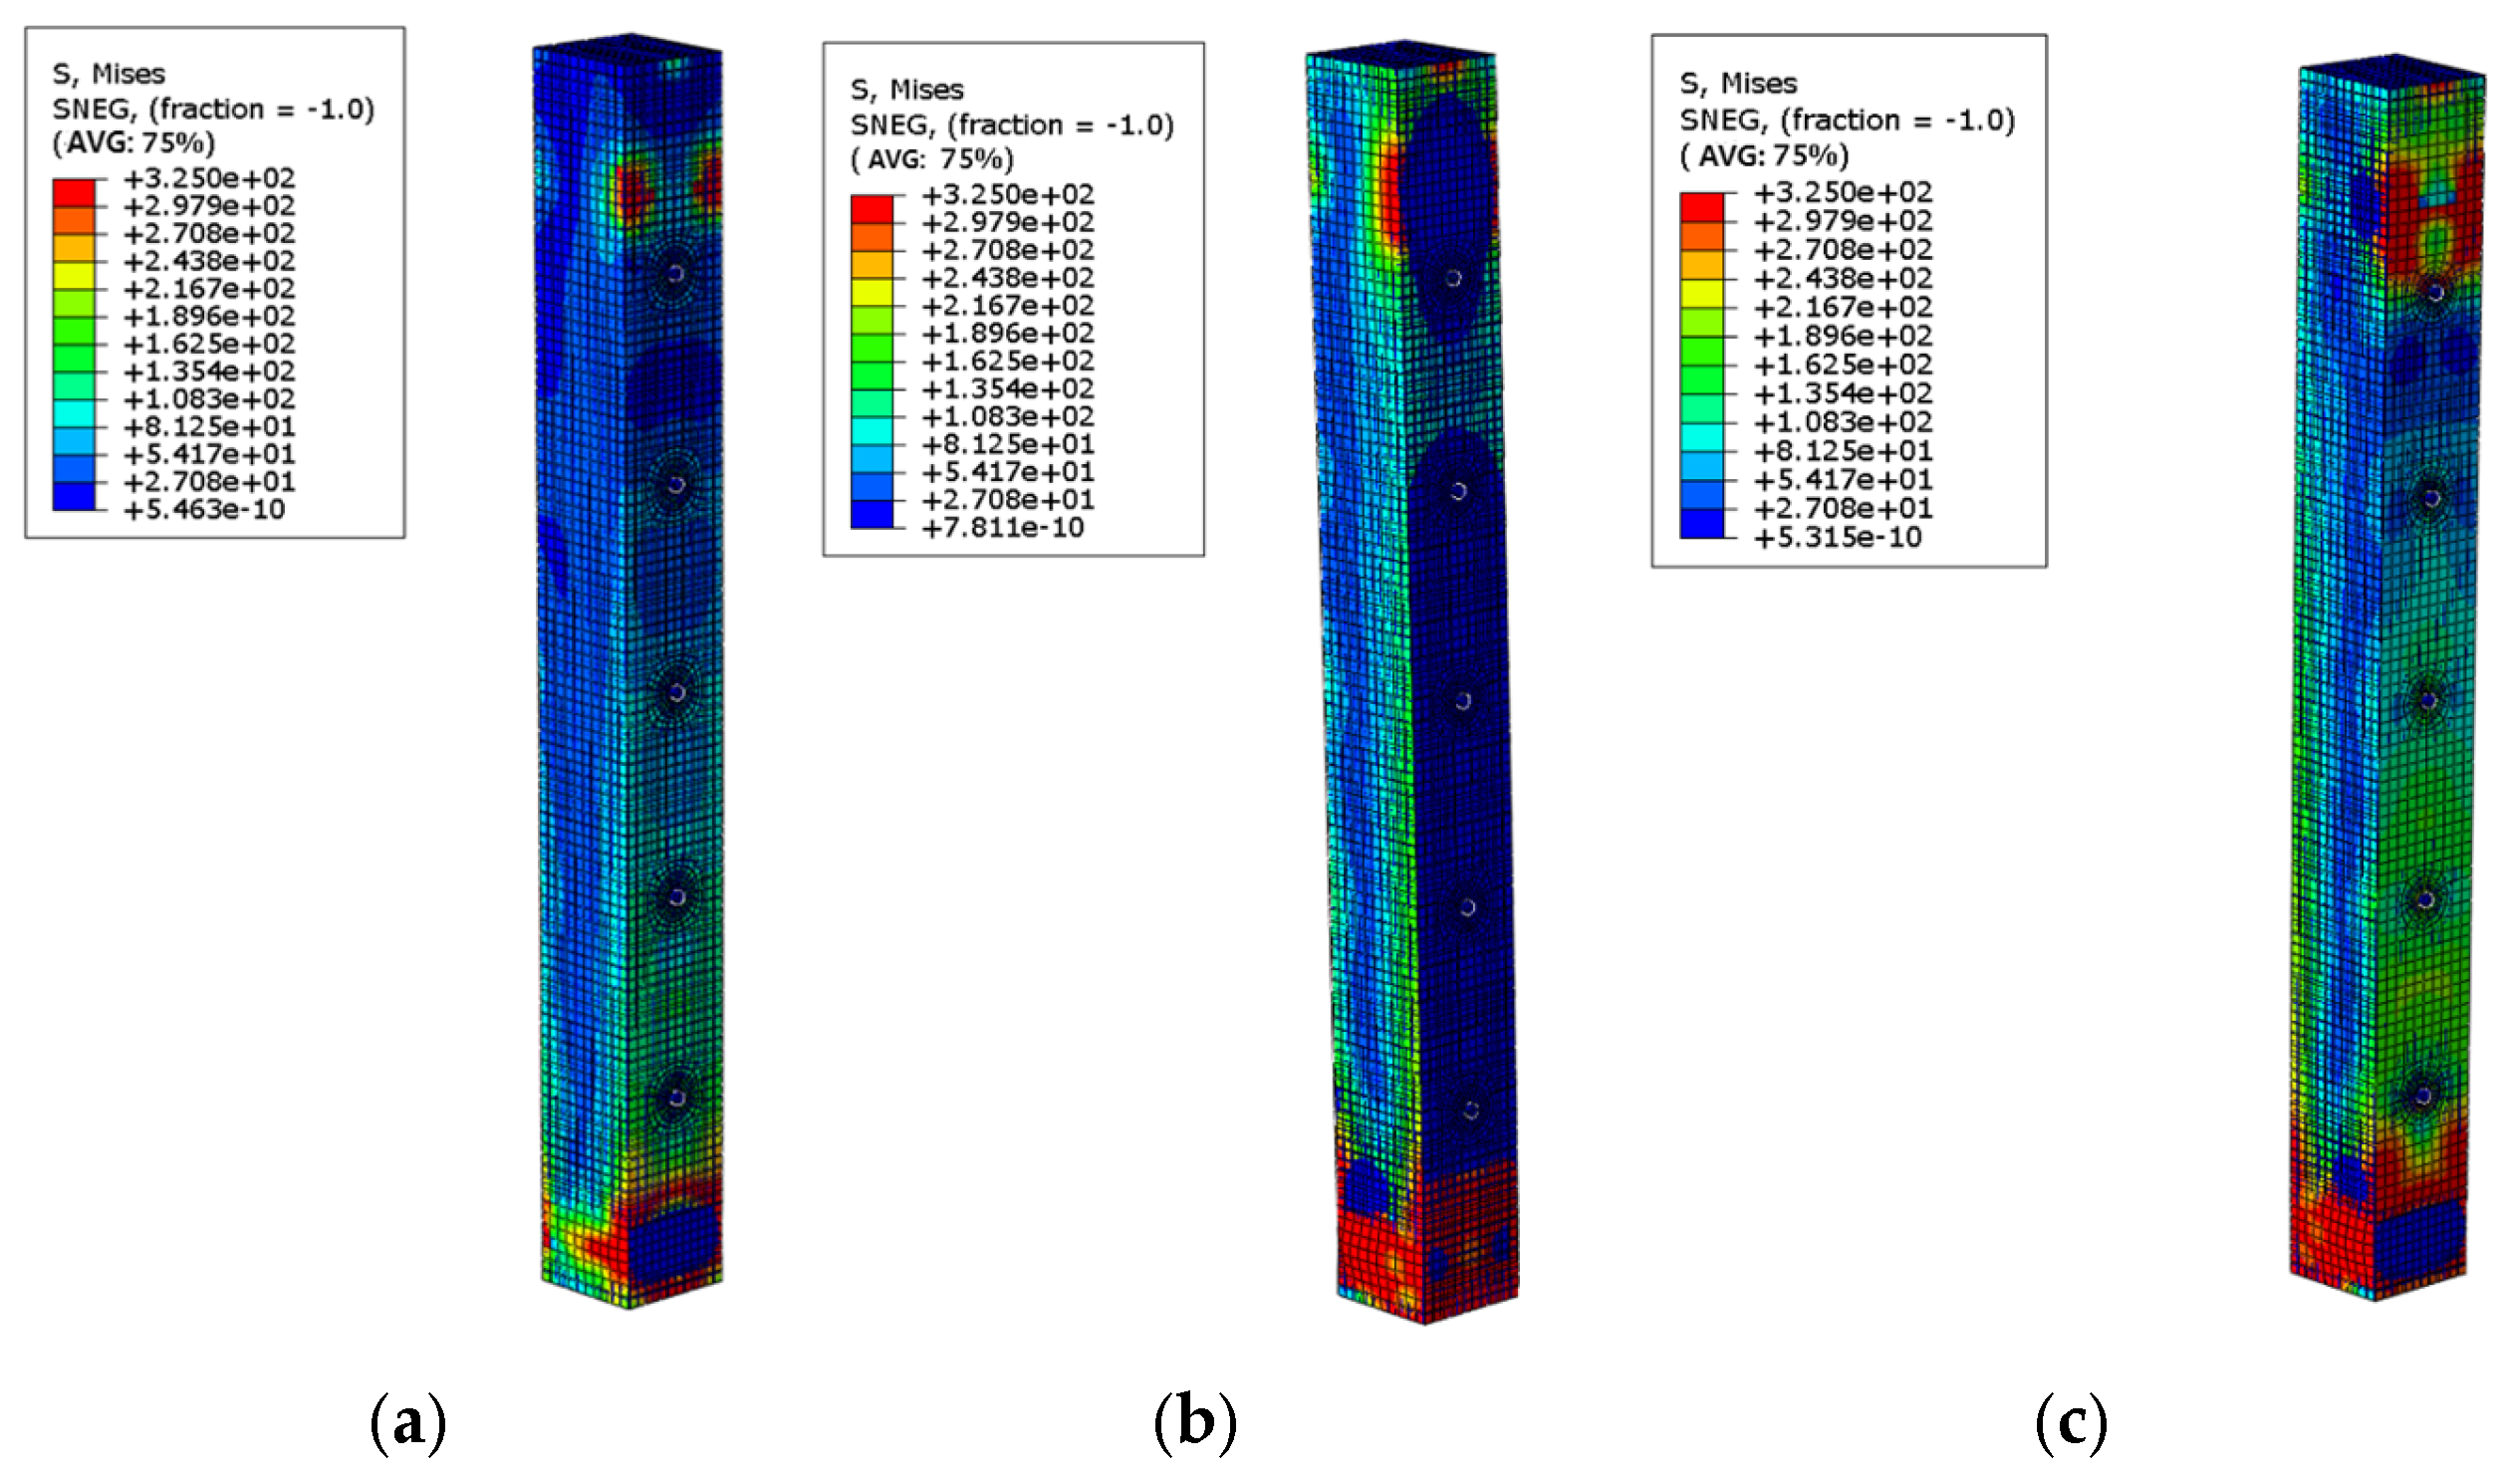
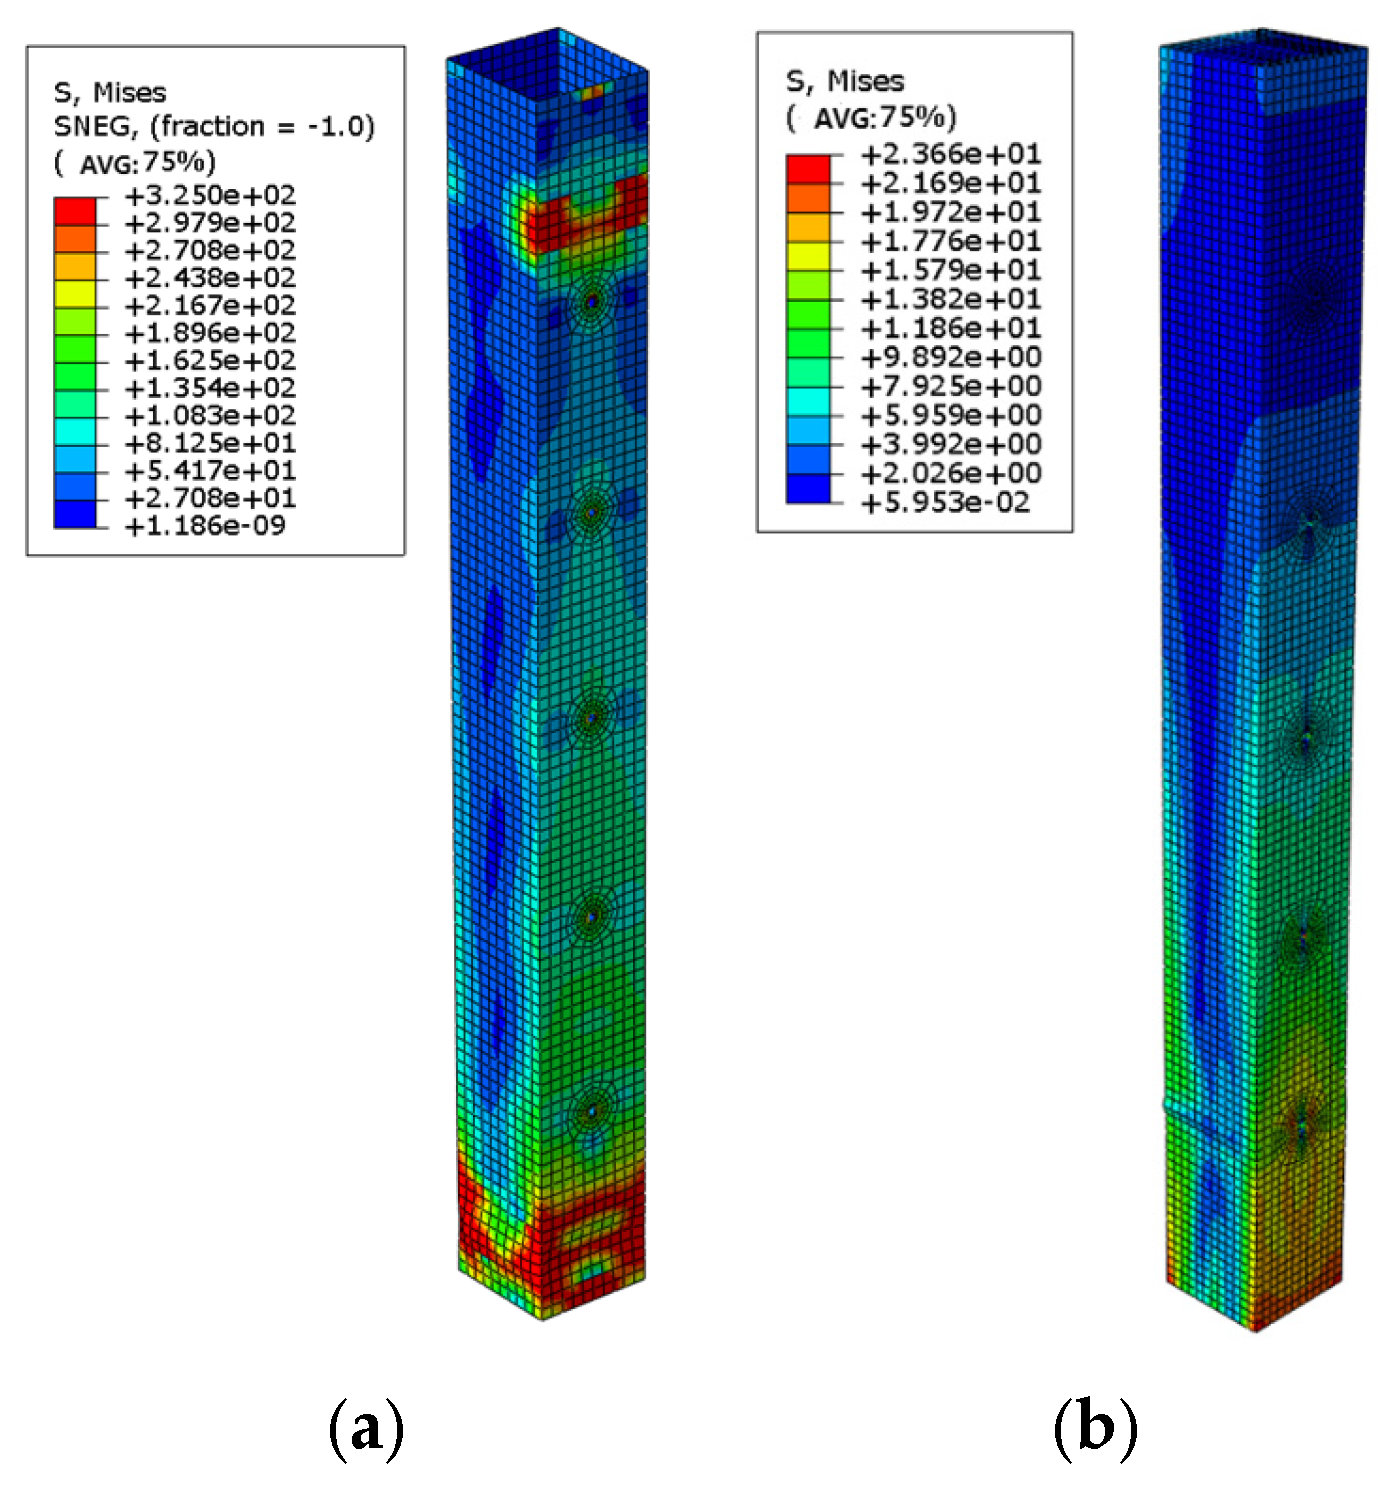
4.2.3. Comparison of Stress Nephograms

Nine sets of support stress nephograms of thin-walled steel–wood composite columns were selected for analysis to study the stress changes and deformation results of the composite column frame structure under different parameters. The specific stress nephograms of three groups of composite column frame structures (GM7-GM9) are shown in Figure 36.
The stress nephograms show that under low-cycle cyclic displacement loads, the structure fails when the thin-walled steel surface reaches its strength limit, mainly manifested as concave deformation on the loaded side of the lower end of the thin-walled steel tube and bulging deformation on both sides of the loaded area. The stress in the steel tube is mainly concentrated at the bulging deformation and around bolt holes, while the stress on the wooden column gradually increases from the column top to the column bottom, as shown in Figure 37.
When thin-walled steel–wood composite columns with different wooden column cross-sections are subjected to the same displacement load, the support stress of composite columns with smaller wooden column cross-sectional dimensions is lower than that of composite columns with larger wooden column cross-sectional dimensions. This indicates that increasing the cross-sectional dimensions of wooden columns effectively improves the seismic performance of composite columns. Meanwhile, the increase in bolt pretension force further enhances the mutual constraint of bolts on wooden columns and thin-walled steel tubes, increases the structural stiffness and lateral resistance, and makes the structure more stable under cyclic loads.

5. Conclusions

From the unidirectional eccentric loading test and finite element simulation of thin-walled steel–wood composite columns and thin-walled steel pipes, the following conclusions were drawn:
Firstly, under eccentric load, the pure thin-walled steel pipe column did not exhibit favorable deformation characteristics. The high strength and ductility of the steel were not fully exploited. In contrast, the thin-walled steel–wood composite column filled with wood had fully utilized the material strength by the end of the loading process, and its load-bearing capacity was significantly enhanced.
Secondly, under the same eccentricity condition, the load-bearing capacities of the G3, G2, and G1 specimens were 77 kN, 64 kN, and 36 kN, respectively. When contrasted with the pure steel tube column (G1), G2, and G3 showed increases of 77.78% and 113.89% in eccentric load-bearing capacity, and G3 was 20.31% higher than G2. Evidently, both wood infilling of thin-walled steel columns and bolt restraint significantly improved the eccentric load-bearing capacity of these columns.
Thirdly, specimens with more bolts showed smaller strains and a better strain development trend under the eccentric compression. Specifically, the maximum tensile and compressive strains at the top of the column of the G2 specimen were 80.06% and 133.74% higher than those of the G3 specimen, respectively. Before the eccentric load reached 40 kN, G3’s strain remained low, while G2 showed higher strain.
Fourth, in comparison with finite element analysis results, the damage morphology of the model closely resembled the damage morphology observed in the test. Although there was a certain discrepancy in the load–displacement curve, the error ratio was within the range of 4.9% to 11.1%.
Fifth, increasing the cross-sectional dimensions of wooden columns and enhancing the bolt pretension can both improve the ultimate bearing and seismic capacities of thin-walled steel–wood composite columns. Among them, increasing the cross-sectional dimensions of wooden columns has a more significant effect on improving the ultimate bearing capacity of composite columns, with an average increase of 27.7%, while increasing the bolt pretension force leads to an average increase of 23% in the ultimate bearing capacity of composite columns.
Lastly, this study focuses on the enhancement of mechanical properties of steel–wood composite columns compared with pure steel tubes under eccentric loading, so it provides limited reference for the reinforcement and renovation of wood structures. Future research could incorporate various energy-dissipating components to conduct experimental investigations on the seismic resilience of novel steel–wood composite structures, thereby contributing to the refinement and completion of the relevant theoretical framework.

Author Contributions

Conceptualization, Y.Z. and J.S.; methodology, Y.Z.; software, Y.Z. and J.S.; validation, Y.Z., J.S. and A.F.; formal analysis, Y.Z.; investigation, J.S.; resources, J.S. and Z.W.; data curation, A.F.; writing—original draft preparation, Y.Z. and J.S.; writing—review and editing, J.S. and A.F.; supervision, H.X.; project administration, J.G. and B.M.; funding acquisition, X.L. All authors have read and agreed to the published version of the manuscript.

Funding

Funding was provided by “National Natural Science Foundation of China (12462010), Qiandongnan Science and Technology Plan Project (Qiandongnan Science and Technology Cooperation Support (2024) No. 0019), Qiandongnan Science and Technology Plan Project (Qiandongnan Science and Technology Foundation (2023) No. 03), and the “14th Five-Year Plan” Discipline Professional Platform Team Integration Construction Project of Kaili College (YTH-PT202403)”. However, any opinions, findings, conclusions, and recommendations presented in this paper are those of the writers and do not necessarily reflect the views of the sponsors.

Data Availability Statement

The original contributions presented in this study are included in this article. Further inquiries can be directed to the corresponding author.

Conflicts of Interest

Authors Anxiang Feng and Hongxuan Xu were employed by Guizhou Zhongjian Weiye Construction (Group) Co., Ltd. The remaining authors declare that this research was conducted in the absence of any commercial or financial relationships that could be construed as potential conflicts of interest.

References

  1. Li, L.; Zhou, J. Study on the mechanical properties and application prospects of the traditional and modern connection of wood structure. IOP Conf. Ser. Earth Environ. Sci. 2021, 638, 012085. [Google Scholar] [CrossRef]
  2. Octavia, S.; Raubaba, H.S.; Simorangkir, Y.V. Wood and steel as a material alternative of concrete replacement in house structure in Merauke city. IOP Conf. Ser. Earth Environ. Sci. 2019, 343, 012231. [Google Scholar] [CrossRef]
  3. Wang, Q.; Wang, Z.; Feng, X.; Zhao, Y.; Li, Z. Mechanical properties and probabilistic models of wood and engineered wood products: A review of green construction materials. Case Stud. Constr. Mater. 2024, 21, 3796. [Google Scholar] [CrossRef]
  4. Song, X.B.; Zhang, Y.; Lu, Y.; Peng, Y.Q.; Zhou, H. Experimental study on fire resistance of traditional timber mortise-tenon joints with damages. Fire Saf. J. 2023, 138, 103780. [Google Scholar] [CrossRef]
  5. Abdelrahman, M.; Khaloian-Sarnaghi, A.; van de Kuilen, J.W. Fire performance of wood-steel hybrid elements: Finite element analysis and experimental validation. Wood Sci. Technol. 2025, 59, 23. [Google Scholar] [CrossRef]
  6. Liu, K.; Shao, J.; Tang, B.; Wu, Q.; Wang, Z. Seismic performance of low-yield-point steel plate shear walls under horizontal cyclic load. Iran. J. Sci. Technol. Trans. Civ. Eng. 2022, 46, 3739–3752. [Google Scholar] [CrossRef]
  7. Shao, J.; Wang, K.; Kaewunruen, S.; Cai, W.; Wang, Z. Experimental investigations into earthquake resistance of steel frame retrofitted by low-yield-point steel energy absorbers. Appl. Sci. 2019, 9, 3299. [Google Scholar] [CrossRef]
  8. Wang, T.; Shao, J.; Xu, T.; Wang, Z. Study on axial compression properties of aluminum foam-filled steel tube members after high temperature. Iran. J. Sci. Technol. Trans. Civ. Eng. 2022, 46, 883900. [Google Scholar] [CrossRef]
  9. Wang, Z.; Shao, J. Study on quasi-static axial compression performance and energy absorption of aluminum foam-filled steel tubes. Materials 2023, 16, 4485. [Google Scholar] [CrossRef]
  10. Wang, T.; Shao, J.; Zhao, C.; Liu, W.; Wang, Z. Shaking table test for evaluating the seismic performance of steel frame retrofitted by buckling-restrained braces. Shock Vib. 2021, 1–17. [Google Scholar] [CrossRef]
  11. Xu, T.; Shao, J.; Zhang, J.; Kaewunruen, S. Experimental performance evaluation of multi-storey steel plate shear walls designed by different methods. Int. J. Civ. Eng. 2019, 17, 1145–1154. [Google Scholar] [CrossRef]
  12. Yang, L.; Li, X.; Fang, H.; Liu, W.; Hong, J.; Hui, D.; Gaff, M. Compressive behaviour of wood-filled GFRP square columns with latticeweb reinforcements. Constr. Build. Mater. 2021, 310, 125129. [Google Scholar] [CrossRef]
  13. Navaratnam, S.; Thamboo, J.; Poologanathan, K.; Roy, K.; Gatheeshgar, P. Finite element modelling of timber infilled steel tubular shortcolumns under axial compression. Structures 2021, 30, 910–924. [Google Scholar] [CrossRef]
  14. Hu, Q.; Gao, Y.; Meng, X.; Diao, Y. Axial compression of steel-timber composite column consisting of H-shaped-steel and glulam. Eng. Struct. 2020, 216, 110561. [Google Scholar] [CrossRef]
  15. Yang, R.; Li, H.; Lorenzo, R.; Ashraf, M.; Sun, Y.; Yuan, Q. Mechanical behaviour of steel timber composite shear connections. Constr. Build. Mater. 2020, 258, 119605. [Google Scholar] [CrossRef]
  16. Qiao, Q.; Yang, Z.; Mou, B. Experimental study on axial compressive behavior of CFRP confined square timber filled steel tube stub columns. Structures 2020, 24, 823–834. [Google Scholar] [CrossRef]
  17. Ghazijahani, G.T.; Jiao, H.; Holloway, D. Timber filled CFRP jacketed circular steel tubes under axial compression. Constr. Build. Mater. 2015, 94, 791–799. [Google Scholar] [CrossRef]
  18. Heinisuo, M.; Mela, K.; Pajunen, S.; Malaska, M. New steel-timber composite beam, Nordic system. Ce/Papers 2019, 3, 193–202. [Google Scholar] [CrossRef]
  19. Wu, C.; Duan, J.; Yang, Z.; Zhao, Z.; Xu, Y. A Novel Rectangular Section Combined Beam of Welded Thin-Walled H-Shape Steel/Camphor Pine Wood: The Bending Performance Study. Sustainability 2023, 15, 7450. [Google Scholar] [CrossRef]
  20. Zhang, F.; Lu, Z.; Wang, D.; Fang, H. Mechanical properties of the composite sandwich structures with cold formed profiled steel plate and balsa wood core. Eng. Struct. 2024, 300, 117256. [Google Scholar] [CrossRef]
  21. Vogiatzis, T.; Efthymiou, E.; Tsalkatidis, T. Investigation of Wood-Steel Composite Shear Walls Behavioural Parameters. Ce/Papers 2023, 6, 243–247. [Google Scholar] [CrossRef]
  22. Sadat, S.I.; Ding, F.-X.; Lyu, F.; Wang, E.; Sun, H.; Akhunzada, K.; Lessani, N. Axial compression behavior and reliable design approach of rectangular dune sand concrete-filled steel tube stub columns. Dev. Built Environ. 2024, 18, 100437. [Google Scholar] [CrossRef]
  23. Sadat, S.I.; Ding, F.-X.; Wang, M.; Lyu, F.; Akhunzada, K.; Xu, H.; Hui, B. Behavior and Reliable Design Methods of Axial Compressed Dune Sand Concrete-Filled Circular Steel Tube Columns. Appl. Sci. 2024, 14, 6939. [Google Scholar] [CrossRef]
  24. Zhang, C.-C.; Ding, F.-X.; Sadat, S.I.; Lyu, F.; Huang, X.-Y.; Gao, R.; Yu, T.; Liu, Y.-L. Flexural Behavior of Desert Sand Concrete-Filled Steel Tube: Experimental Validation, FEM Analysis, and Design Formulas. Materials 2025, 18, 2371. [Google Scholar] [CrossRef]
  25. Wang, Y.; Gu, Y.; Liu, J. A domain-decomposition generalized finite difference method for stress analysis in three-dimensional composite materials. Appl. Math. Lett. 2020, 104, 106226. [Google Scholar] [CrossRef]
  26. Kabir, H.; Aghdam, M.M. A generalized 2D Bézier-based solution for stress analysis of notched epoxy resin plates reinforced with graphene nanoplatelets. Thin-Walled Struct. 2021, 169, 108484. [Google Scholar] [CrossRef]
  27. Kaushal, M.; Joshi, Y.M. Three-dimensional yielding in anisotropic materials: Validation of Hill’s criterion. Soft Matter 2019, 15, 4915–4920. [Google Scholar] [CrossRef]
Figure 1. Technology roadmap.
Buildings 15 02114 g001
Figure 2. Design drawing of composite member. (a) Cross-sectional view of composite member. (b) Elevation view of composite member.
Buildings 15 02114 g002
Figure 3. Dimensional three views of s of wood block for specimen G3 (unit: mm). (a) Top view. (b) Front view. (c) Left view. (d) Section 1-1 view.
Buildings 15 02114 g003
Figure 4. Dimensional three views of steel pipe for specimen G3 (unit: mm). (a) Top view. (b) Front view. (c) Left view.
Buildings 15 02114 g004
Figure 5. Three views, three-dimensional drawing of fixed groove (unit: mm). (a) Three-dimensional drawing. (b) Top view. (c) Front view. (d) Left view.
Buildings 15 02114 g005
Figure 6. Three-dimensional view of simulated setup and on-site test diagram. (a) Three-dimensional view of simulated setup. (b) On-site test diagram.
Buildings 15 02114 g006
Figure 7. Loading location and the direction of eccentric loading. (a) Loading location (top view). (b) Direction of eccentric loading (left view).
Buildings 15 02114 g007
Figure 8. Arrangement of strain gauge. (a) Schematic diagram of on-site test. (b) Detail drawing of specific location.
Buildings 15 02114 g008
Figure 9. Arrangement of displacement gauge. (a) Schematic diagram of on-site test. (b) Detail drawing of specific location.
Buildings 15 02114 g009
Figure 10. Damage phenomenon of specimen G1. (a) Slightly bulged lower end. (b) Significantly bulged lower end.
Buildings 15 02114 g010
Figure 11. Damage phenomenon of specimen G2. (a) Bulging at the lower end. (b) Significantly tilted lower end.
Buildings 15 02114 g011
Figure 12. Damage phenomenon of specimen G3. (a) Bulging and bending. (b) Obvious twisting deformation at the bolt.
Buildings 15 02114 g012
Figure 13. Load–vertical displacement curves of each specimen.
Buildings 15 02114 g013
Figure 14. Load–lateral deflection curve of each specimen.
Buildings 15 02114 g014
Figure 15. Load–strain curves of specimens G2 and G3.
Buildings 15 02114 g015
Figure 16. Simplified ontological relationship of wood. (a) Conformal ontological relationship of wood. (b) Transverse ontological relationship of wood.
Buildings 15 02114 g016
Figure 17. Meshing results for each component. (a) Three-hole wooden column. (b) Three-hole thin-walled steel tube. (c) Bolt. (d) Upper and lower fixing plates. (e) Stiffener.
Buildings 15 02114 g017
Figure 18. Boundary constraint condition of specimen and surface displacement constraints of nut. (a) Boundary constraint condition. (b) Surface displacement constraints of nut.
Buildings 15 02114 g018
Figure 19. Displacement nephogram of specimen G1 (unit: mm).
Buildings 15 02114 g019
Figure 20. Stress distribution of specimen G1 in S22 and S33 direction (unit: MPa). (a) S22 direction. (b) S33 direction.
Buildings 15 02114 g020
Figure 21. Comparison of deformation between finite element simulation and test for specimen G1. (a) Test. (b) Finite element simulation.
Buildings 15 02114 g021
Figure 22. Displacement variation diagram of G2 (unit: mm). (a) Displacement after preload of bolt. (b) Displacement after loading.
Buildings 15 02114 g022
Figure 23. Displacement nephogram of wood and thin-walled steel pipe for G2 (unit: mm). (a) Displacement nephogram of wood. (b) Displacement nephogram of thin-walled steel pipe.
Buildings 15 02114 g023
Figure 24. Stress diagram of thin-walled steel pipe in each direction for specimen G2 (unit: MPa). (a) S11 direction. (b) S22 direction. (c) S12 direction.
Buildings 15 02114 g024
Figure 25. Stress diagram of square wood column in each direction for specimen G2 (unit: MPa). (a) S11 direction. (b) S22 direction. (c) S33 direction. (d) S13 direction.
Buildings 15 02114 g025
Figure 26. Comparison of deformation between finite element simulation and test for specimen G2. (a) Test. (b) Finite element simulation.
Buildings 15 02114 g026
Figure 27. Comparison of load–displacement curves between finite element and experimental results for each specimen. (a) Comparison results of specimen G1. (b) Comparison results of specimen G2. (c) Comparison results of specimen G3.
Buildings 15 02114 g027
Figure 28. Cyclic load.
Buildings 15 02114 g028
Figure 29. Finite element model of structure.
Buildings 15 02114 g029
Figure 30. Comparison of hysteresis curves for specimens with 200 mm × 200 mm section.
Buildings 15 02114 g030
Figure 31. Comparison of hysteresis curves for specimens with 250 mm × 250 mm section.
Buildings 15 02114 g031
Figure 32. Comparison of hysteresis curves for specimens with 300 mm × 300 mm section.
Buildings 15 02114 g032
Figure 33. Comparison of skeleton curves for specimens with 200 mm × 200 mm section.
Buildings 15 02114 g033
Figure 34. Comparison of skeleton curves for specimens with 250 mm × 250 mm section.
Buildings 15 02114 g034
Figure 35. Comparison of skeleton curves for specimens with 300 mm × 300 mm section.
Buildings 15 02114 g035
Figure 36. Stress nephogram of composite column GM7-GM9 (unit: MPa). (a) GM7. (b) GM8. (c) GM9.
Buildings 15 02114 g036
Figure 37. Stress nephogram of thin-walled steel tube and wood column (unit: MPa). (a) Stress nephogram of thin-walled steel tube. (b) Stress nephogram of wood column.
Buildings 15 02114 g037
Table 1. Specimen design parameters.
Numbering of SpecimensLengths/mmSection Size/mmFilled Wood Number of BoltsDistance of Bolts/mm
G135065 × 65No0/
G235065 × 65Yes345
G335065 × 65Yes545
Table 2. Load–lateral deflection curve analysis.
Load/kNLateral Deflection of Specimen/mmReduction Rate of Lateral Deflection
G1G2G3G2 Than G1G3 Than G1G3 Than G2
361.50 0.730.6051.33%60.00%17.81%
64/1.491.25//16.11%
Table 3. Elastic parameters of wood.
E1/MPaE2/MPaE3/MPaμ1μ2μ3G12/MPaG23/MPaG13/MPa
11059242.7217.10.50.50.4829.4663.5199.1
Table 4. Parameters of wood plasticity.
σ11/MPaσ22/MPaσ33/MPaσ12/MPaσ13/MPaσ23/MPaR11R22R33R12R13R23
251.51.533310.060.060.120.120.12
Table 5. Comparison of test and finite element simulation results for ultimate load and stiffness.
Numbering of SpecimensG1G2G3
Tested values for ultimate loads/kN366477
Simulated values for extreme loads/kN34.37284
Ultimate bearing capacity error+4.9%−11.1%8.3%
Elastic stiffness of the test/(kN/mm)17.5460.95109.13
Elastic stiffness in finite element/(kN/mm)18.4158.06112.01
Elastic stiffness error−4.7%−5.0%2.6%
Table 6. Specimen parameter design.
Specimen NumberingThe Cross-Sectional Dimensions of Wooden Columns (mm)Bolt Pretension (N)
GM1200 × 2002000
GM2200 × 2004000
GM3200 × 2006000
GM4250 × 2502000
GM5250 × 2504000
GM6250 × 2506000
GM7300 × 3002000
GM8300 × 3004000
GM9300 × 3006000
Table 7. Ultimate bearing capacity of all composite columns (unit: kN).
Bolt Pretension (N)200040006000
Cross-Sectional
Dimensions of Wooden Columns (mm)
200 × 200163.66 174.38 185.54
250 × 250194.23 208.86 223.54
300 × 300226.85 238.28 252.96
Table 8. Improvement rate of ultimate bearing capacity for various composite columns.
Bolt Pretension (N)200040006000
Cross-Sectional
Dimensions of Wooden Columns (mm)
200 × 2000%6.55%13.37%
250 × 25018.68%27.62%36.59%
300 × 30038.61%45.59%54.56%
Disclaimer/Publisher’s Note: The statements, opinions and data contained in all publications are solely those of the individual author(s) and contributor(s) and not of MDPI and/or the editor(s). MDPI and/or the editor(s) disclaim responsibility for any injury to people or property resulting from any ideas, methods, instructions or products referred to in the content.

