1. Introduction
Bridges play a significant role in China’s transportation system. By the end of 2023, there were about 1,079,300 highway bridges in China, and more than 40% of these bridges have been in operation for more than 20 years [
1]. A large number of these are reinforced concrete structures, and reinforced concrete girders working with cracks will develop further cracks due to exposure to various environmental factors (e.g., seismic effects, high temperatures, and corrosion) and human factors (e.g., overloading of vehicles), which in turn will cause serious damage to the bridge structure [
2,
3]. Enhancing these bridges’ safety using economic and efficient reinforcement is therefore crucial [
4].
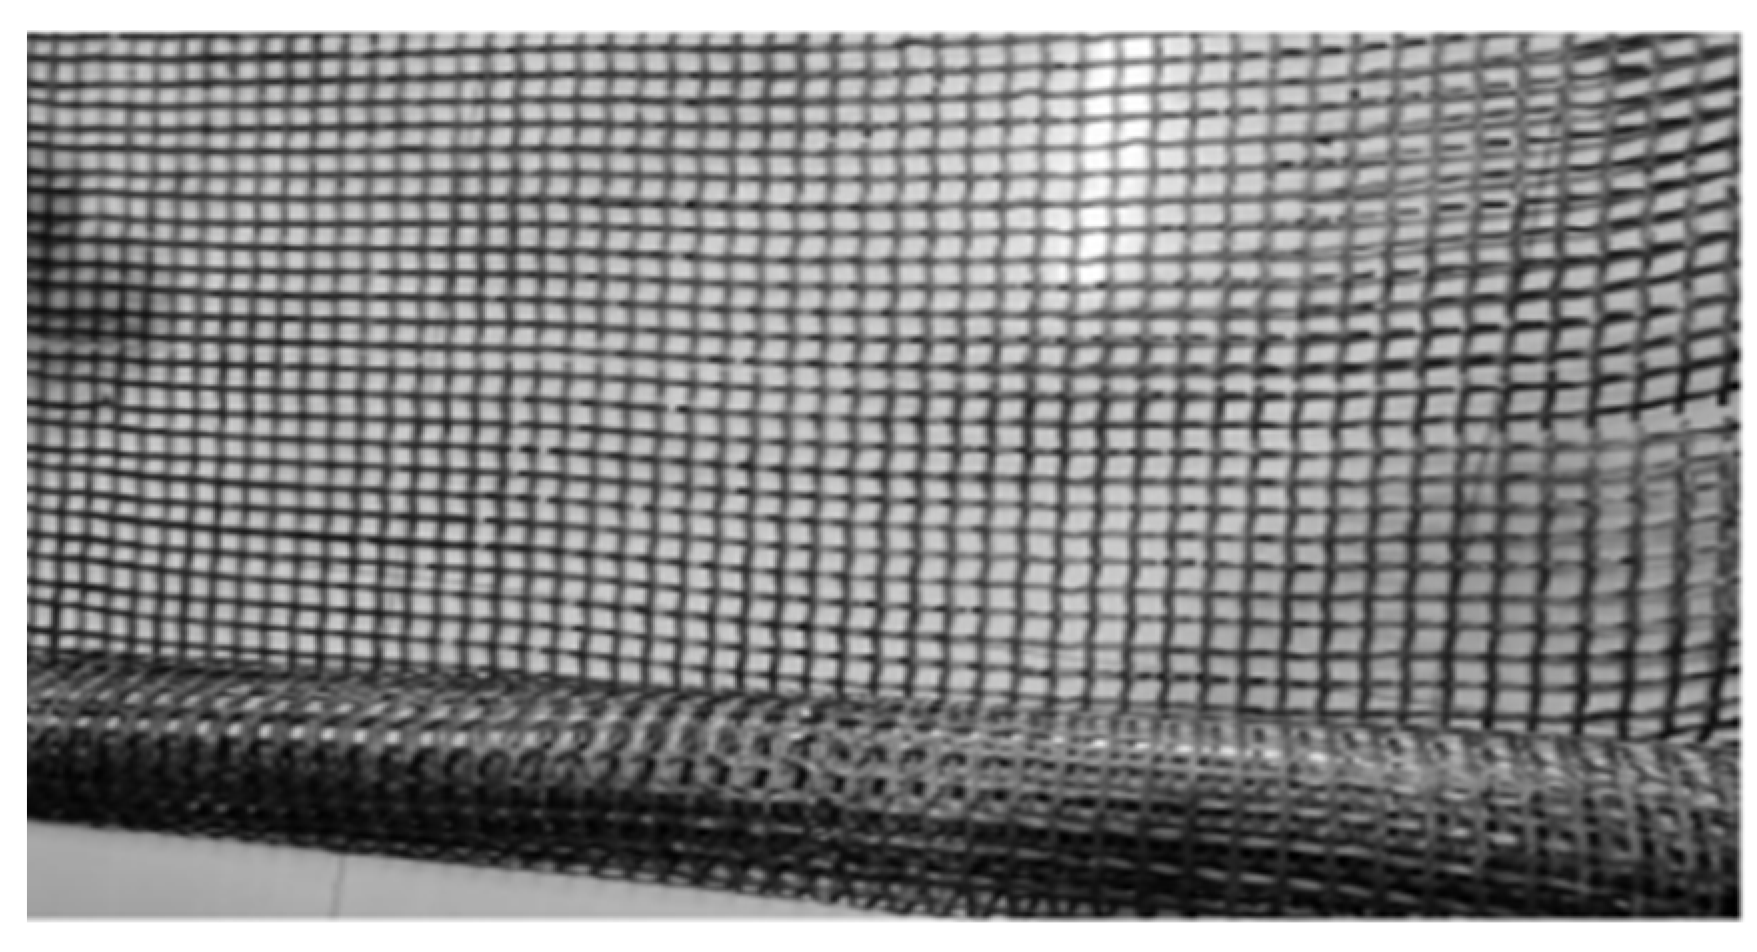
Carbon fiber nets are a special form of geometric construction in fiber-reinforced polymers. They are woven with high-strength carbon fiber raw filaments and have the advantage of being lightweight and strong as well as having good crack resistance, corrosion resistance, and durability. At the same time, their grid-like geometry means they can be successfully embedded with polymer mortar, which can be bidirectionally stressed and is easy to process [
5]. In addition, carbon fiber materials have disadvantages such as poor fire resistance, so in recent years carbon fiber and polymer mortar composite reinforced concrete structures have become a solution. Research undertaken on the effect of carbon fiber grid-reinforced cementitious composite reinforcement and repair under different working conditions is still in its infancy, so the promotion of carbon fiber grids in actual reinforcement projects remains at an early stage [
6,
7,
8,
9].
Xu Shilong et al. [
10] conducted an experimental study on fiber-woven mesh-reinforced concrete beams focusing on analyzing the effect of woven fiber material-reinforced concrete beams on flexural capacity, and the control parameters of carbon fiber mesh in the calculation of structural cracks were analyzed qualitatively. Apanicolaou et al. [
11] used carbon fiber mesh-reinforced mortar and FRP sheets for concrete reinforcement. The flexural performance of the beams was tested using carbon fiber mesh-reinforced mortar and FRP plates. The flexural test data results of carbon fiber-reinforced beams with different material forms were compared and analyzed. It was shown that the ultimate load capacity of carbon fiber mesh-reinforced beams was lower compared to FRP plate-reinforced beams, but showed better ductility properties. Ombres et al. [
12] conducted flexural tests on 12 carbon fiber mesh-reinforced cement mortar-reinforced concrete beams. The results showed that the carbon fiber mesh mating rate was positively proportional to the bond performance.
Deng Zongcai et al. [
13] conducted bending tests on CFNs-reinforced RC slabs, using the number of reinforcement layers and the reinforcement method as variables. The results showed that CFNs reinforcement significantly limits structural cracks and significantly improves structural toughness. Junwei Zhang and Junhao Huang [
14,
15] conducted flexural performance tests on CFRP fabric-reinforced beams with span–height ratio, pre-cracking load, number of CFRP fabric layers, and reinforcement rate as variable factors, respectively, and observed that the changes in the flexural performance of CFRP fabric-reinforced beams have some reference significance for CFNs-reinforced beam tests.
On the other hand, Wu Peng [
16] used finite element simulation to simulate and analyze CFRP sheet-reinforced beams to study the effects of different damage levels, slot edge distance, bond length, and concrete strength of RCs on the flexural capacity of reinforced beams.
In practice, researchers have found that damage to reinforced concrete beams strengthened with carbon fiber materials is often due to the peeling of the carbon fiber material base plate from the original concrete surface, which weakens the expensive carbon fiber material, meaning that as a technique it is underutilized and wasteful. Tang Xanting et al. [
17] therefore experimentally concluded that CFRP diagonal U-shaped hoops significantly inhibit the significant peeling damage to reinforced beams. Huang Lihua and Lin Xuanyu et al. [
18,
19] investigated the effect of fiber composites on the flexural performance of reinforced beams by using U-shaped anchorage. The results showed that U-shaped anchorage could effectively improve reinforced beams’ load capacity and stiffness.
In recent decades, scholars in China and abroad have conducted a series of studies on strengthening reinforced concrete members under secondary stresses [
20,
21]. Among them, Peng Hui and Zhang Tanxian et al. [
22,
23,
24] carried out flexural tests on reinforced concrete beams under secondary stresses with prestressed CFRP reinforcement, and the experimental results showed that the flexural stiffness of the beams could be significantly improved or even restored after the test beams were reinforced with prestressed CFRP after substantial overloads.
However, no research on the flexural performance of damaged reinforced concrete beams with carbon fiber mesh U-hoops has been carried out by domestic or international scholars. Therefore, this paper takes the secondary-stressed beams as the object of investigation and analyzes the reinforcement effect of the carbon fiber grid reinforcement system and its influence on the flexural performance of reinforced concrete beams under different preload amplitudes and different reinforcement methods to provide a reference for the application of fiber-reinforced composites in reinforced repair projects.
3. Test Results and Analysis
3.1. Major Damage Patterns
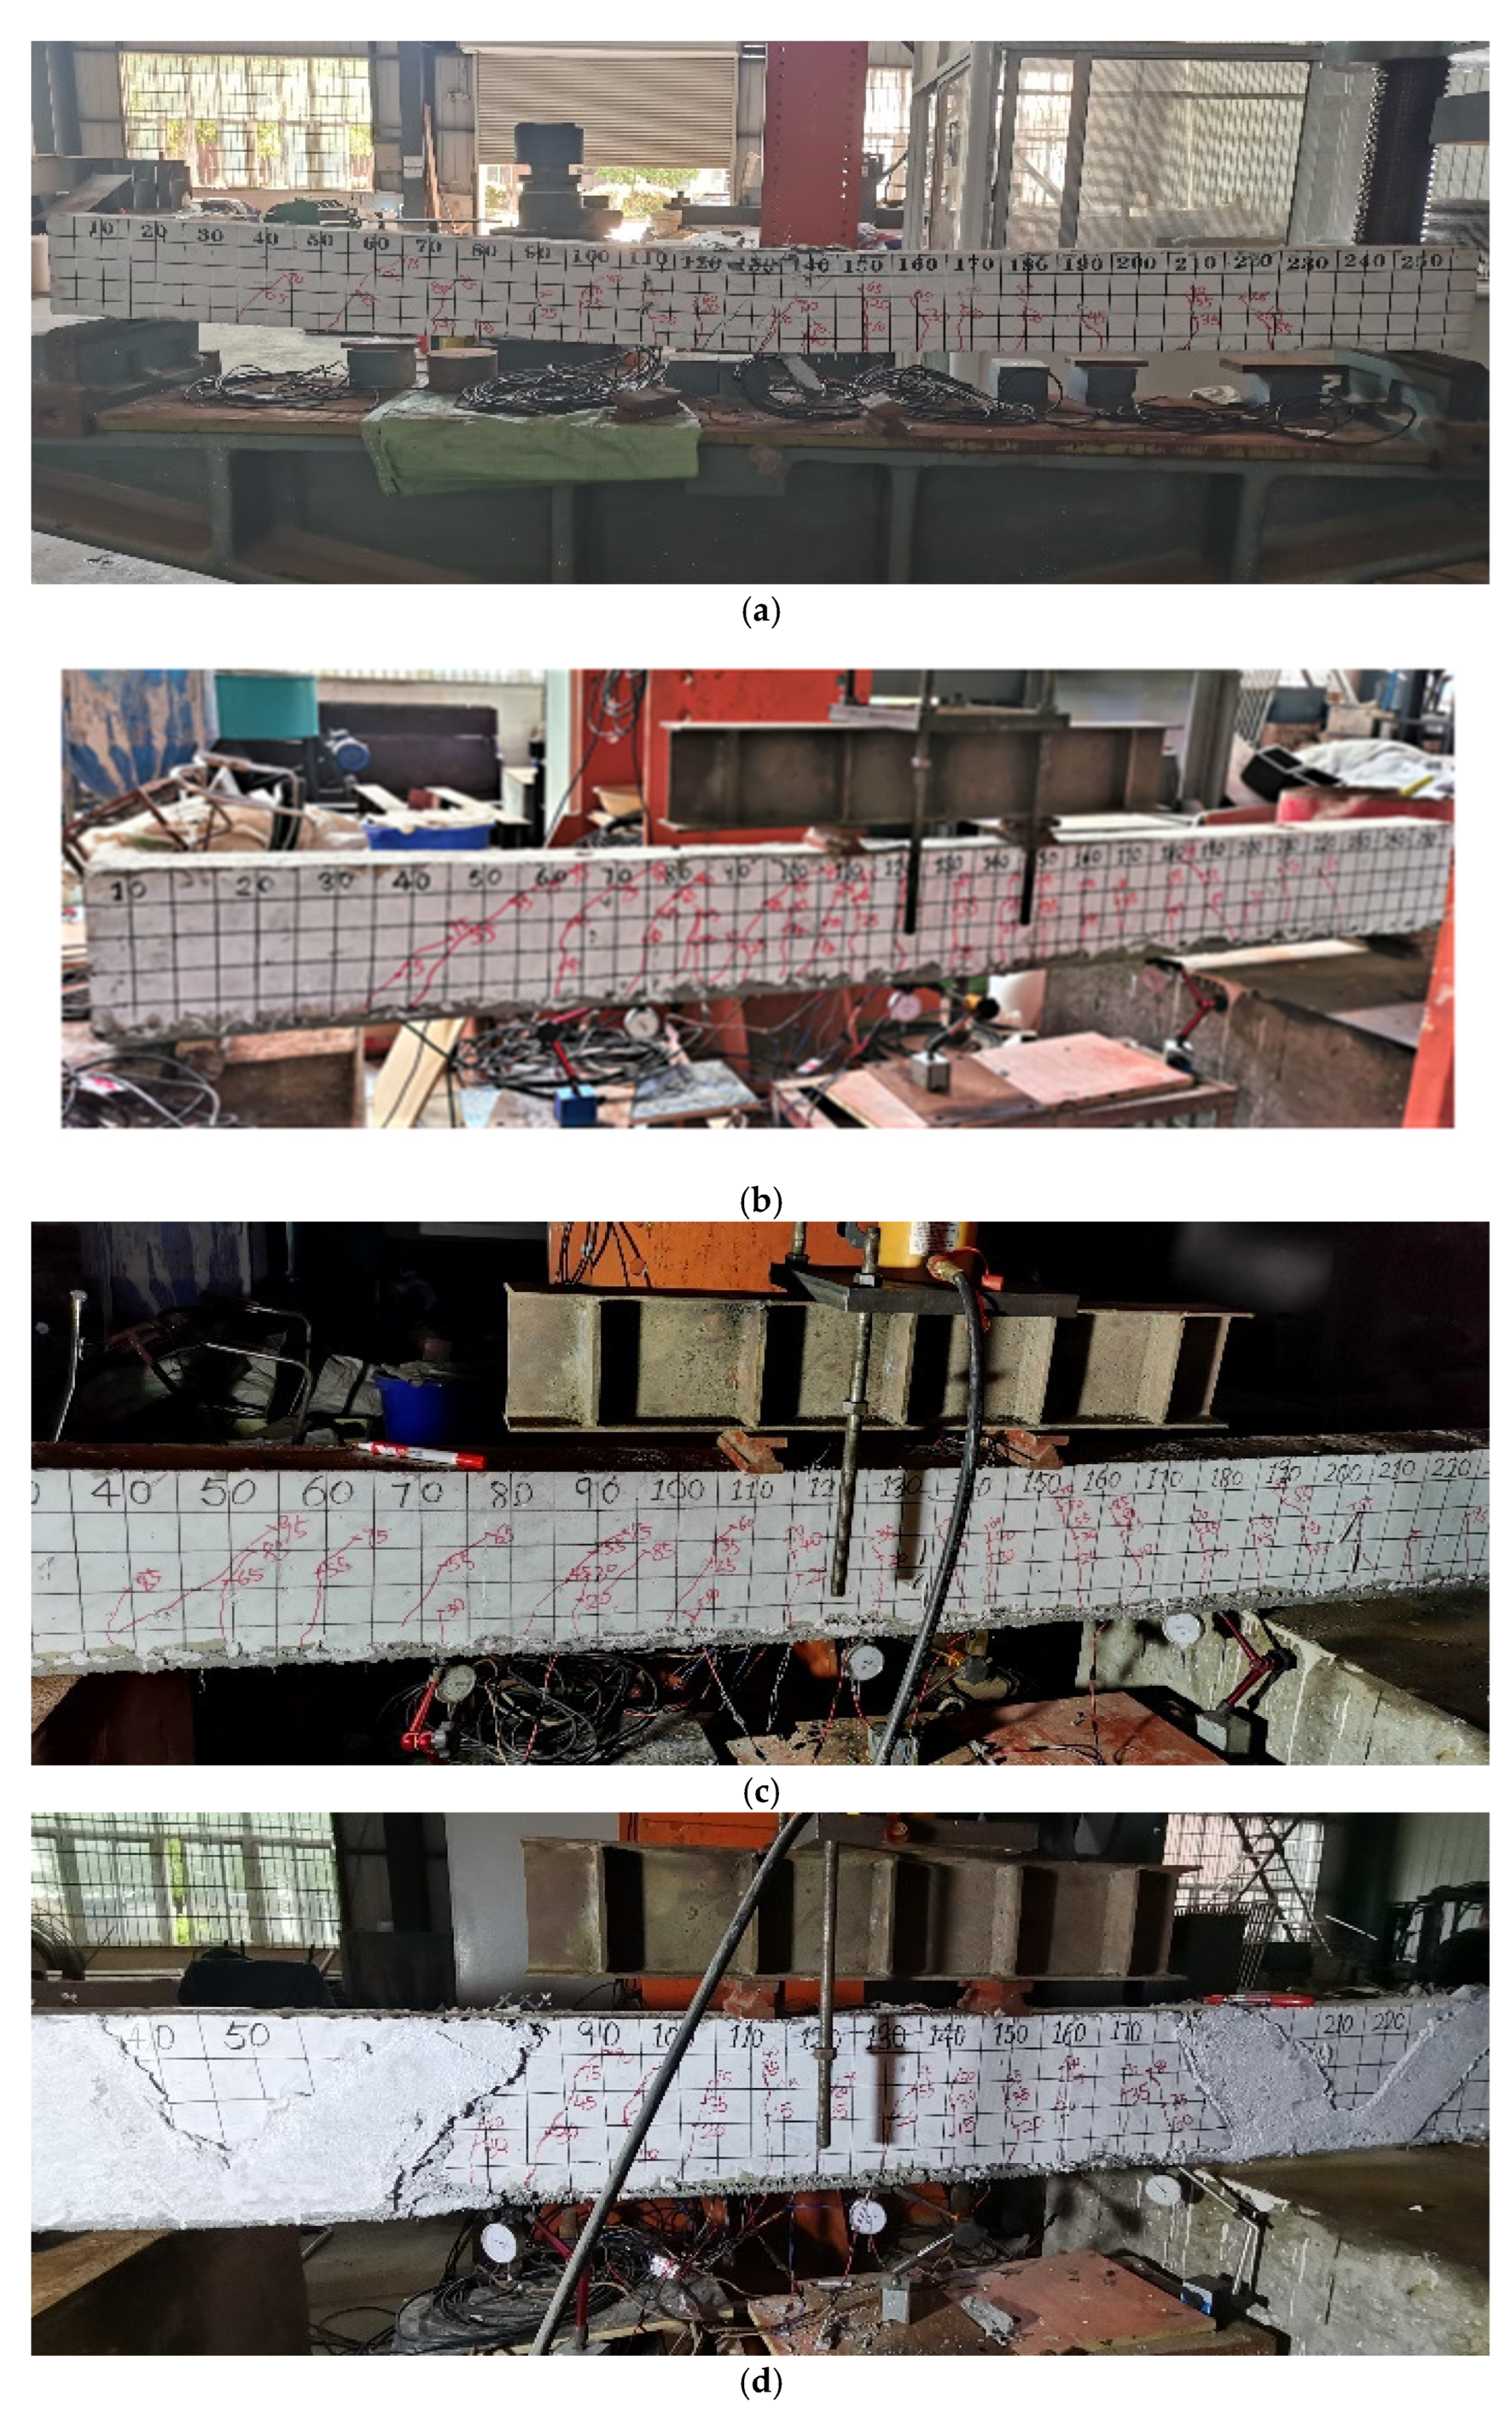
The damage pattern of each specimen is shown in
Figure 6. When the load of an RC specimen was increased to 10 kN, cracks started to appear on both sides of the span; when the load was increased to 40 kN, several prominent cracks developed from the bottom toward the top of the beam; and when the load was increased to 60 kN, the reinforcement entered the yielding stage, the deflection of the beam and the strain of the reinforcement increased significantly, and cracks also developed rapidly. When loaded to the ultimate load of 86.5 kN and kept in that state, the deflection deformation in the span increased continuously and the deflection reached 14.57 mm, the concrete in the compression zone was crushed, the load value gradually decreased to 75.2 kN, and the loading ended. The cracks that resulted when the RC specimen was damaged are shown in
Figure 6a.
Compared with the RC and CFNs specimens, the CFN-04 specimen showed oblique cracks in the pre-loading stage. Secondary loading was started after unloading the reinforcement. When the load was increased to 20 kN, the cracks started to expand. When the load was increased to 83 kN, the reinforcement started to yield, and the grid tightening started to work against the force. When the load continued to be increased to 98.75 kN, the deflection increase intensified and the load stopped rising; the test beam had reached the ultimate load-bearing state, and the deflection reached 16.345 mm at this time.
The test phenomena and causes of damage of the four reinforced beams, CFN-06, CFN-06X, CFN-06U, and CFN-08, were similar to those of the CFN-04 beam; only the characteristic load values were different. Since the carbon fiber mesh shared part of the tensile stress, the strengthened beams’ ultimate load capacity and mid-span displacement deformation capacity were improved, and the damage mode was converted from concrete crushing exhibited by the unreinforced beams to carbon fiber mesh pull-off. CFN-06X and CFN-06U specimens did not show apparent cracks at the U-hoop compared with CFN-06 members (
Figure 6c–e). In contrast, the number of bending cracks decreased and the crack spacing increased, indicating that the U-hoop improved the overall stiffness of the reinforced beam. The test damage characteristics cracking load Pcr, yield load Py, and ultimate load Pu for each specimen are shown in
Table 3.
As shown in
Table 4, in the load growth range of each reinforced beam compared with the unreinforced beam the average growth range of Pcr is the highest (88.50%), but the data is highly discrete (* SD = 37.60% *) and the confidence interval is the widest (95% CI [49.03%, 127.97%]), indicating low repeatability and reliability; The average increase in Py was 22.82% (* SD = 8.11% *, 95% CI [14.31%, 31.33%]), showing moderate stability. Although the average increase rate of Pu is the smallest (11.66%), the standard deviation is the lowest (* SD = 4.83% *) and the confidence interval is the narrowest (95% CI [6.60%, 16.73%]), indicating that the improvement effect has high repeatability and statistical reliability. Therefore, it is credible that the ultimate bearing capacity of reinforced concrete beams will increase by about 11.66% from the statistical analysis table.
By comparing the test results for the four working conditions of CFN, CFN-04, CFN-06, and CFN-08, the yield load value of each specimen was reduced from 85 kN to 72 kN, a decrease of 15.29%, and the ultimate load value was reduced from 102.01 kN to 90.01 kN, a decrease of 11.76%. This indicates an increase in the preloaded load, thus significantly reducing the yield load and ultimate load of CFNs-reinforced beams.
The ultimate loads of CFN-06X and CFN-06U are 98.34 kN and 96.40 kN, respectively, which are improved by 4.62% and 2.55% compared to the member CFN-06. This shows that the X-shaped oblique U-hoop arrangement improves the flexural load capacity of the beam under the exact value of the preloaded load.
3.2. Mid-Span Deflection
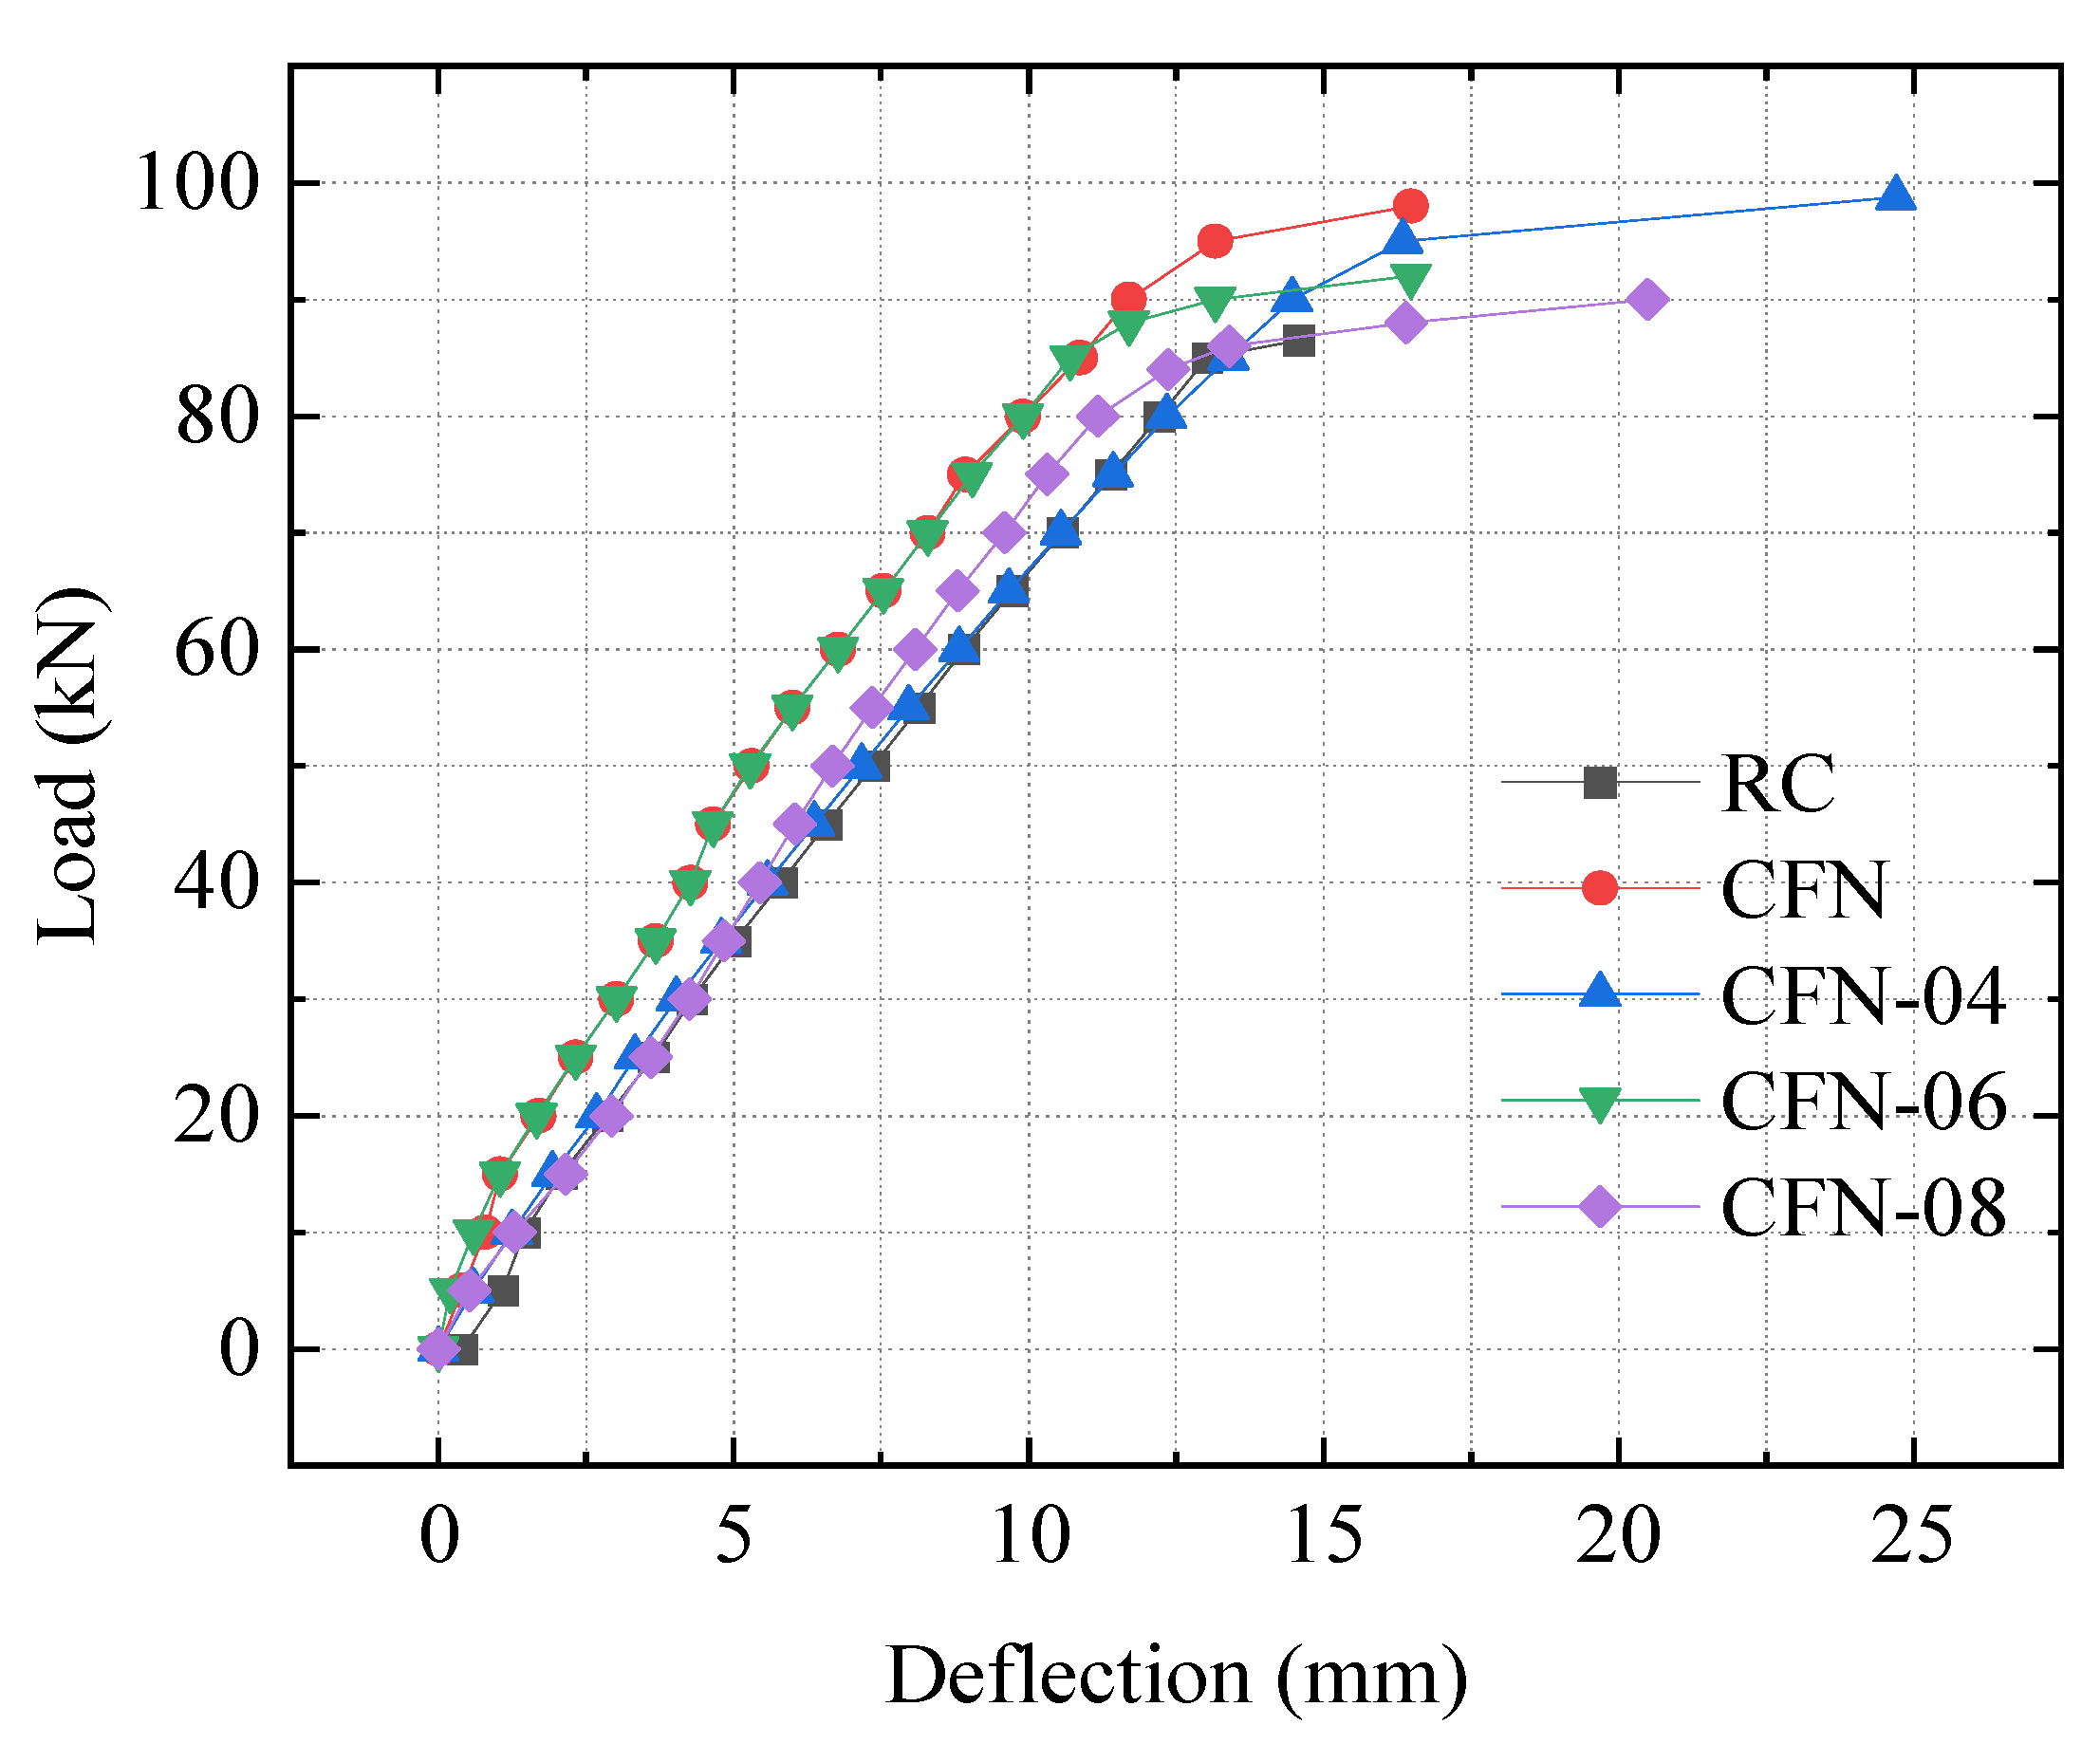
The load–span deflection curves of the secondary-stressed reinforced beams for each specimen are shown in
Figure 7. The slope of the load–span deflection curve under RC conditions is the most minor compared with other reinforced beams, and the corresponding span deflection under the ultimate load is also much smaller than that of the CFNs-reinforced beam at 24.7 mm. This indicates that the carbon fiber grid-reinforcement method enhances the stiffness of the beam. Before the reinforcement enters the yielding stage, the span deflection curves of CFN-04-, CFN-06-, and CFN-08-reinforced beams coincide with the unreinforced reference beams. After the reinforcement enters the yielding stage, the slope of the load–span deflection curves of CFN-04, CFN-06, and CFN-08 beams gradually changes from large to small. The span deflections of CFNs beams are always smaller than those of the secondary-stressed reinforced beams during the loading process. The deflection of the CFN-08 beam reached 26.1 mm when the ultimate load of each beam was applied. The final deflection value increased as the specimen’s preload value increased due to the excessive preload value and the most severe accumulated damage, resulting in reinforcement hardening, which also affected deflection. These three phenomena indicate that the carbon fiber grid-reinforcement system dramatically improves the beam stiffness and is more effective after the reinforcement enters the yielding stage, mainly because CFNs plays a significant load-bearing role after the reinforcement yields. The stiffness of the members with preload values is significantly lower than that of those without preload values, and the increase in stiffness decreases with an increase in preload values.
Figure 8 shows the load–span deflection curves of some specimens. Comparing the three reinforced beams in the figure, the slope of the specimen reinforced by the U-hoop is greater than that of the CFN-06 specimen before steel yielding, and the span deflection values of the CFN-06X and CFN-06U beams are significantly lower than that of the CFN-06 beam when the ultimate load is reached. This indicates that the stiffness of the specimens reinforced by the U-hoop is more significant under the same preload value, and the wrapping effect of the X-hoop is better than that of the vertical U-hoop.
3.3. Strain Analysis
3.3.1. Concrete Strain
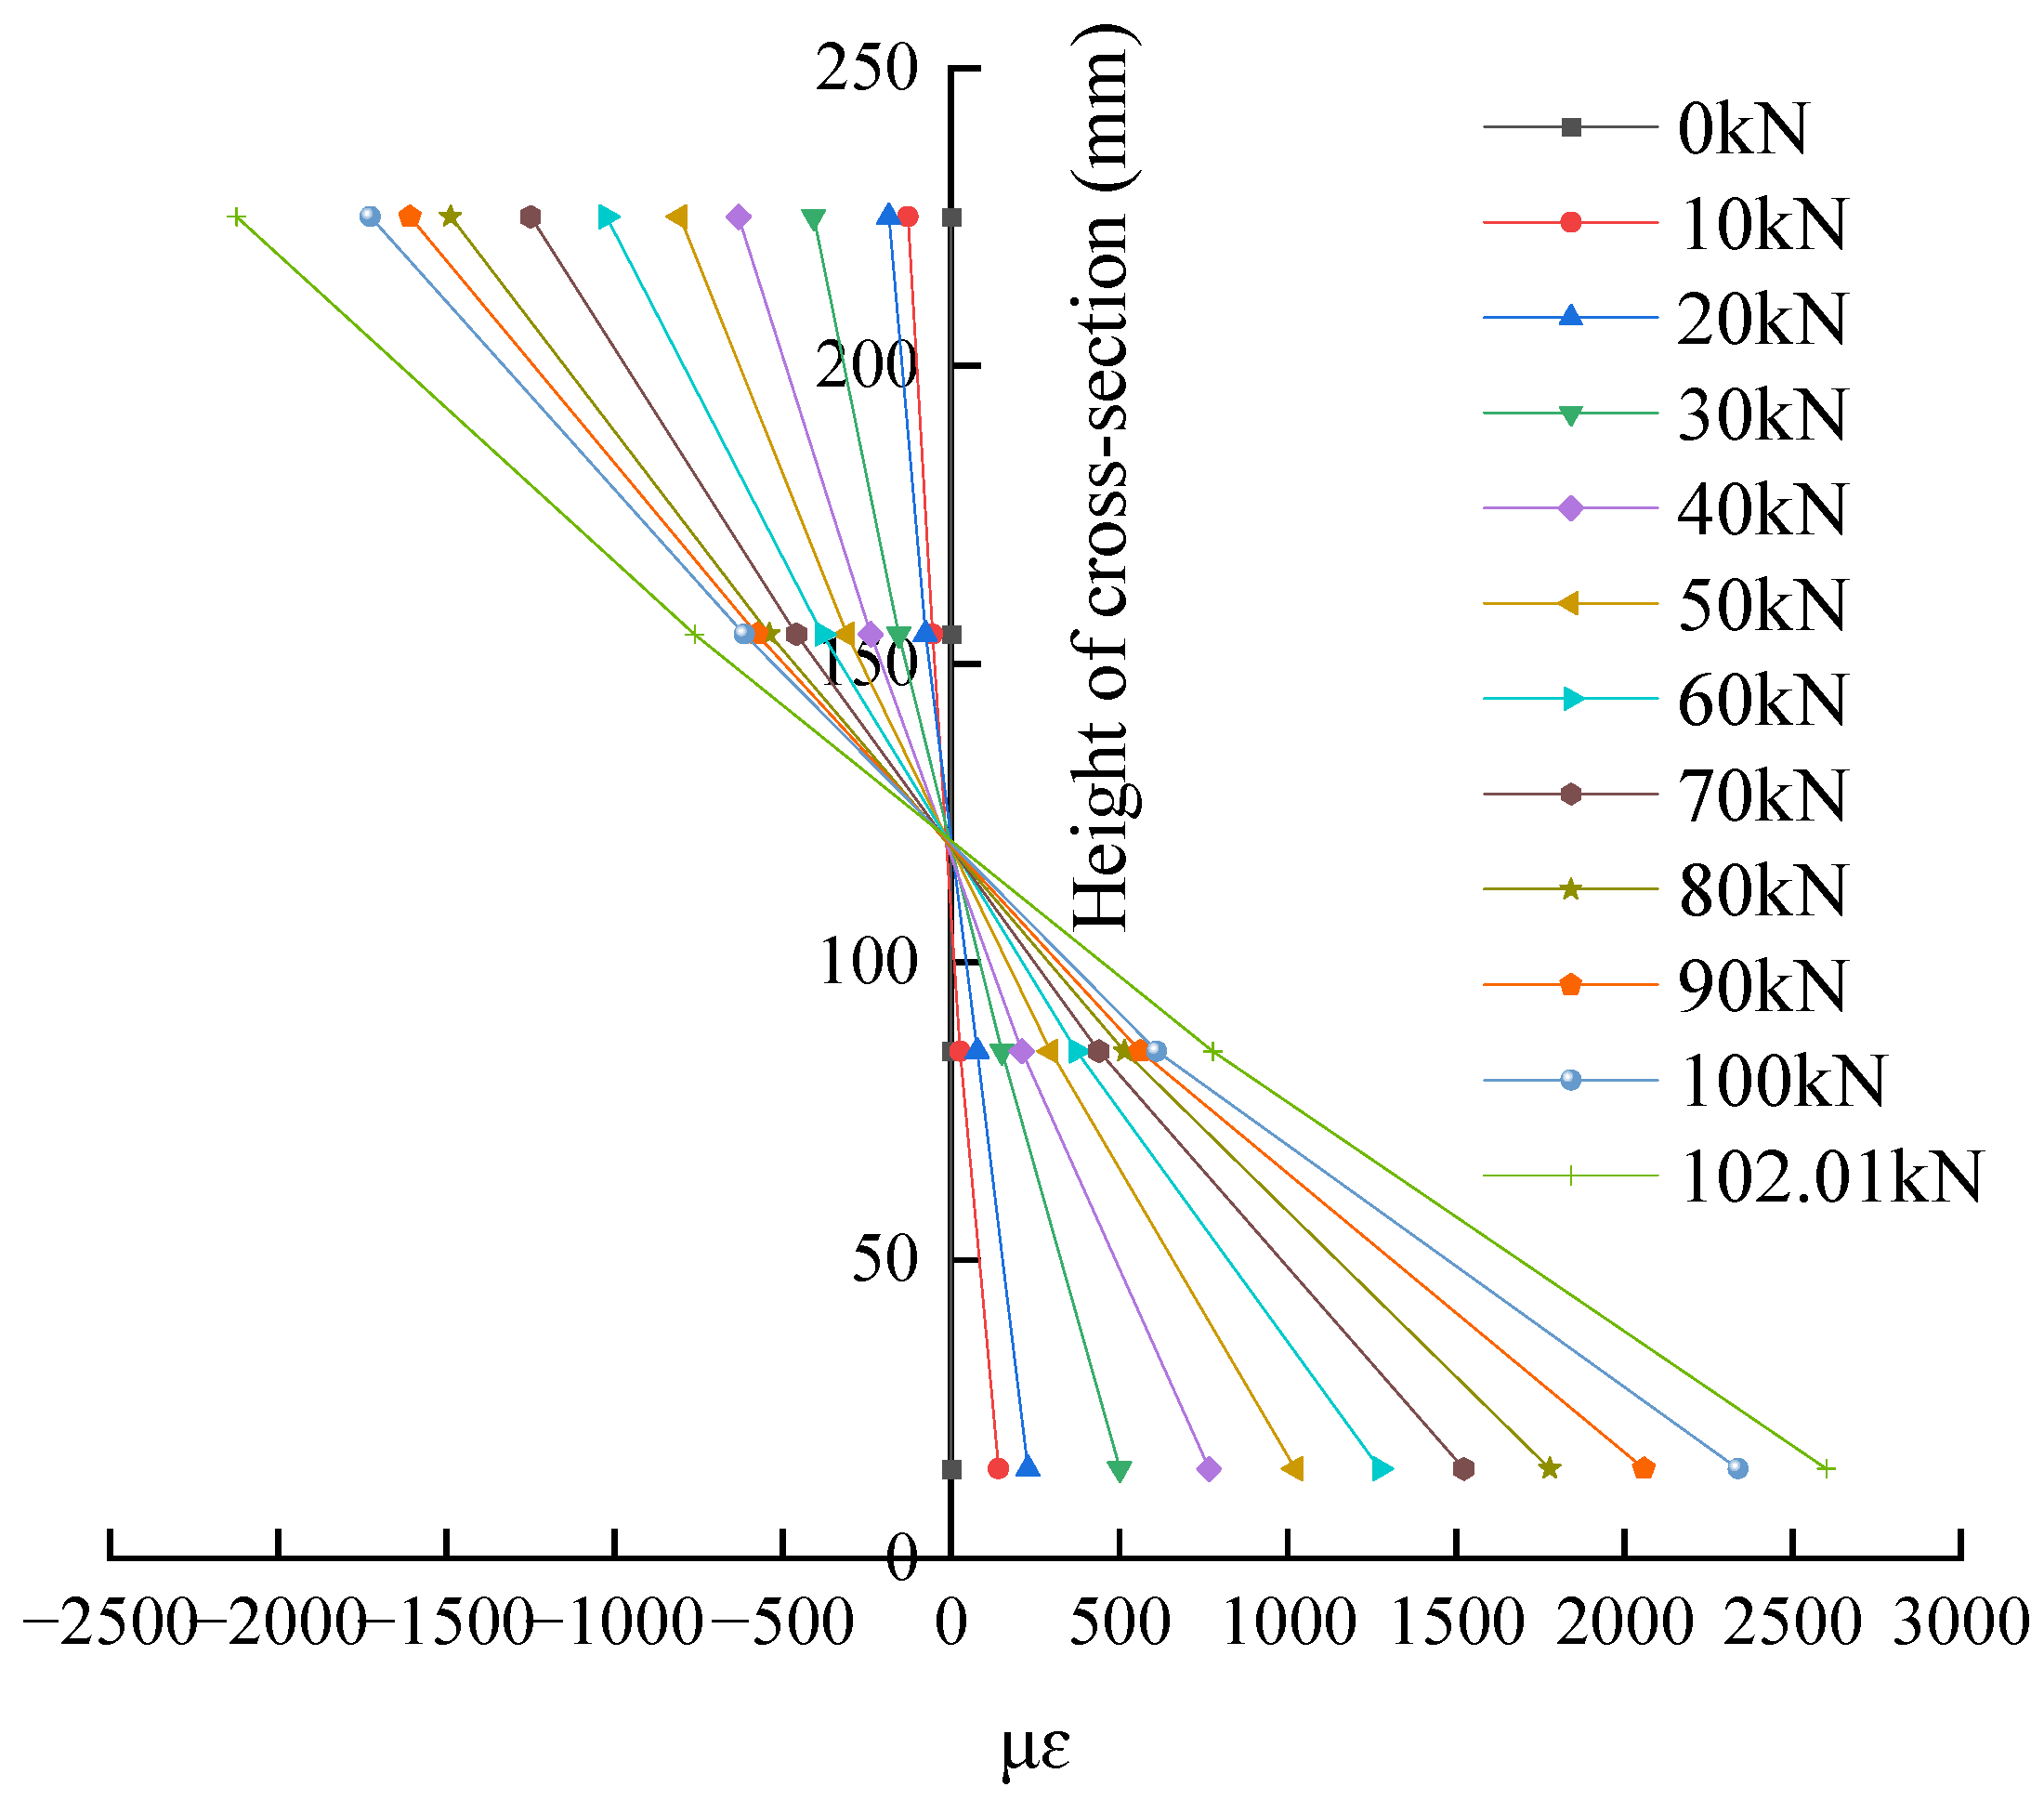
The concrete strain of RC and CFNs along the section height is shown in
Figure 9 and
Figure 10, which essentially reflects the evolution law of the redistribution of the section internal force and the coordinated stress of the material. The neutral wheelbase of the CFNs beam is only 115.61 mm away from the beam bottom, which is significantly higher than that of the RC (152.8 mm). The core mechanism is that the mortar reinforcement layer expands the “effective section” of the tensile zone at the beam bottom, and the carbon fiber mesh (CFN) bears the tensile stress through interface bonding, which inhibits the development of cracks, delays the withdrawal process of concrete in the tensile zone, increases the “virtual section stiffness” of the tensile zone, and forces the neutral axis to move up. This phenomenon verifies the “stiffness compensation effect” of the reinforcement layer on the tensile zone—the CFNs and mortar layer jointly construct a “composite tensile system”, which changes the section stress gradient.
It can be seen from
Table 5 that when the preload is lifted, the neutral axis position, the maximum tensile strain at the bottom of the beam, and the maximum compressive strain at the top of the beam increase synchronously, which is due to the initial damage accumulation caused by the preload. The preload makes the internal micro-cracks of the concrete develop, the stiffness of the tensile zone is then reduced, and the stress is transferred to the CFNs. However, the preloaded plastic deformation and micro-cracks could not be captured due to the back-sticking of the strain gauge, which led to the abnormal reduction in the compressive strain in the compression zone under CFN-08 working condition (the initial damage made the actual stress in the compression zone “overdrawn” in advance). When the preload exceeds 40% Pu, the neutral axis moves upward, indicating that the crack development has entered a nonlinear stage—the initial crack penetration causes a sudden change in the stiffness of the tensile zone, and the stress concentration forces the neutral axis to move upward rapidly, which is a critical signal of the degradation of the bearing capacity of the strengthened beam.
Compared with the neutral axis positions (154.76 mm, 143.37 mm, and 149.52 mm) of CFN-06, CFN-06x, and CFN-06u, the U-shaped hoop changed the section stress transfer path through the transverse constraint effect as the U-hoop formed a “hoop effect” on the concrete, limited the development of inclined cracks, enhanced the stiffness of the shear zone, and indirectly reduced the stress concentration in the tensile zone. The X-hoop inclined arrangement is more suitable for the main tensile stress trajectory, and has higher “blocking efficiency” for inclined cracks, making the neutral axis move up more significantly. This confirms the matching between the reinforcement structure and the structural stress mode—a reasonable hoop form can optimize the section stress distribution, delay the neutral axis move-up rate, and improve the overall stiffness.
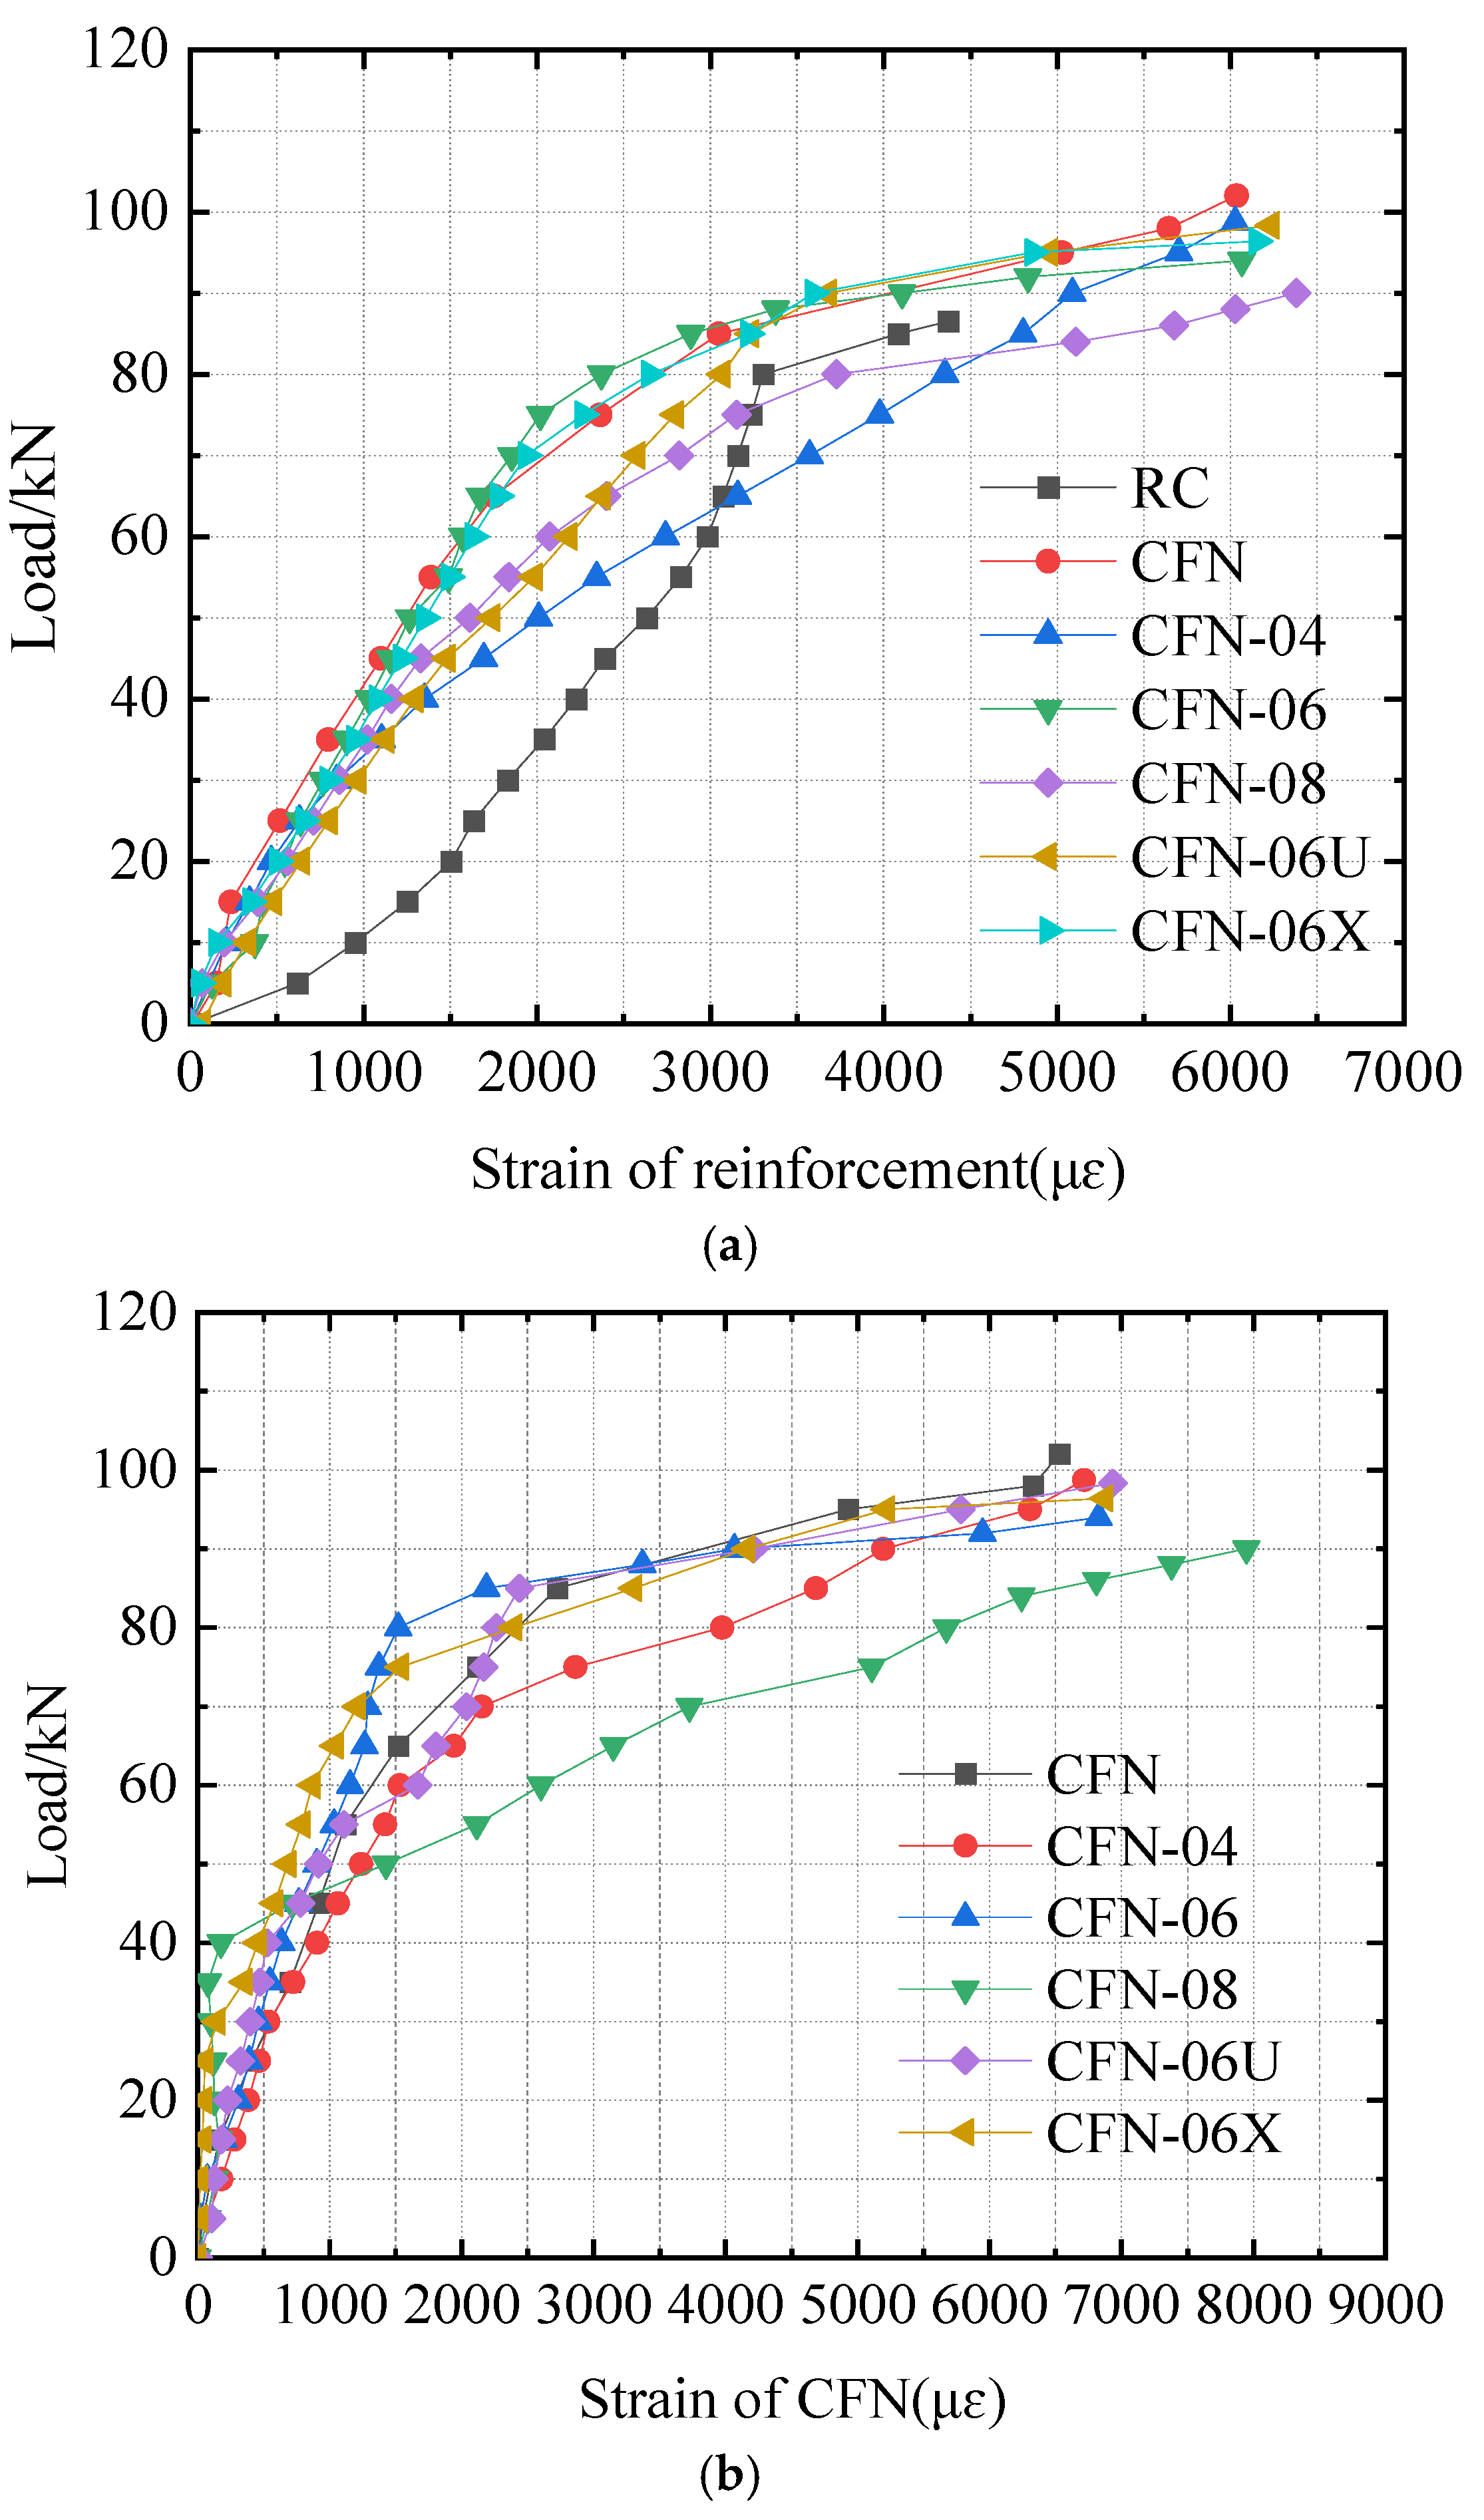
3.3.2. Strain on Reinforcement and CFNs
The mid-span load–strain curve (
Figure 11) reveals the “relay bearing” mechanism between the steel reinforcement and the CFNs. The yield load of the RC is 80 kN, while that of the CFN beam reaches 85 kN (an increase of 6.25%), with a maximum strain increase of 38.09%. This is attributed to the CFNs sharing tensile stress through interfacial bonding during the initial stage, thereby delaying the increase in steel reinforcement stress. After the steel reinforcement yields (marked by a sudden change in the curve slope), the steel enters the plastic stage, resulting in slower stress growth. Meanwhile, the CFNs, with their high elastic modulus (exhibiting linear stress–strain growth), experience strain surpassing that of the steel, achieving a force transfer between “elastic-plastic” materials. This process fundamentally represents a secondary adjustment of the cross-sectional stiffness as the development of steel plasticity reduces stiffness, while the CFN compensates by leveraging its high tensile stiffness, delaying overall stiffness degradation and enhancing ductility and load-carrying capacity.
The U-shaped stirrups have minimal impact on lagging strain but play a crucial role in strengthening interfacial bonding. After steel yielding, concentrated deformation occurs in the tension zone at the beam’s bottom. Without reliable anchoring, the CFNs may prematurely fail due to interfacial debonding (central debonding prevents full utilization of material strength). The U-shaped stirrups enhance CFNs–concrete bonding through “mechanical anchoring”, effectively transferring the CFNs tensile stress to the concrete, ensuring full utilization of its tensile strength (avoiding strength wastage). This illustrates the anchoring construct’s role in activating material efficiency; whilst U-shaped stirrups do not directly alter strain trends, they indirectly support increased flexural load-carrying capacity by ensuring proper CFNs performance, validating the reinforced design principle that “anchoring reliability determines material utilization”.
3.4. Ductility Analysis
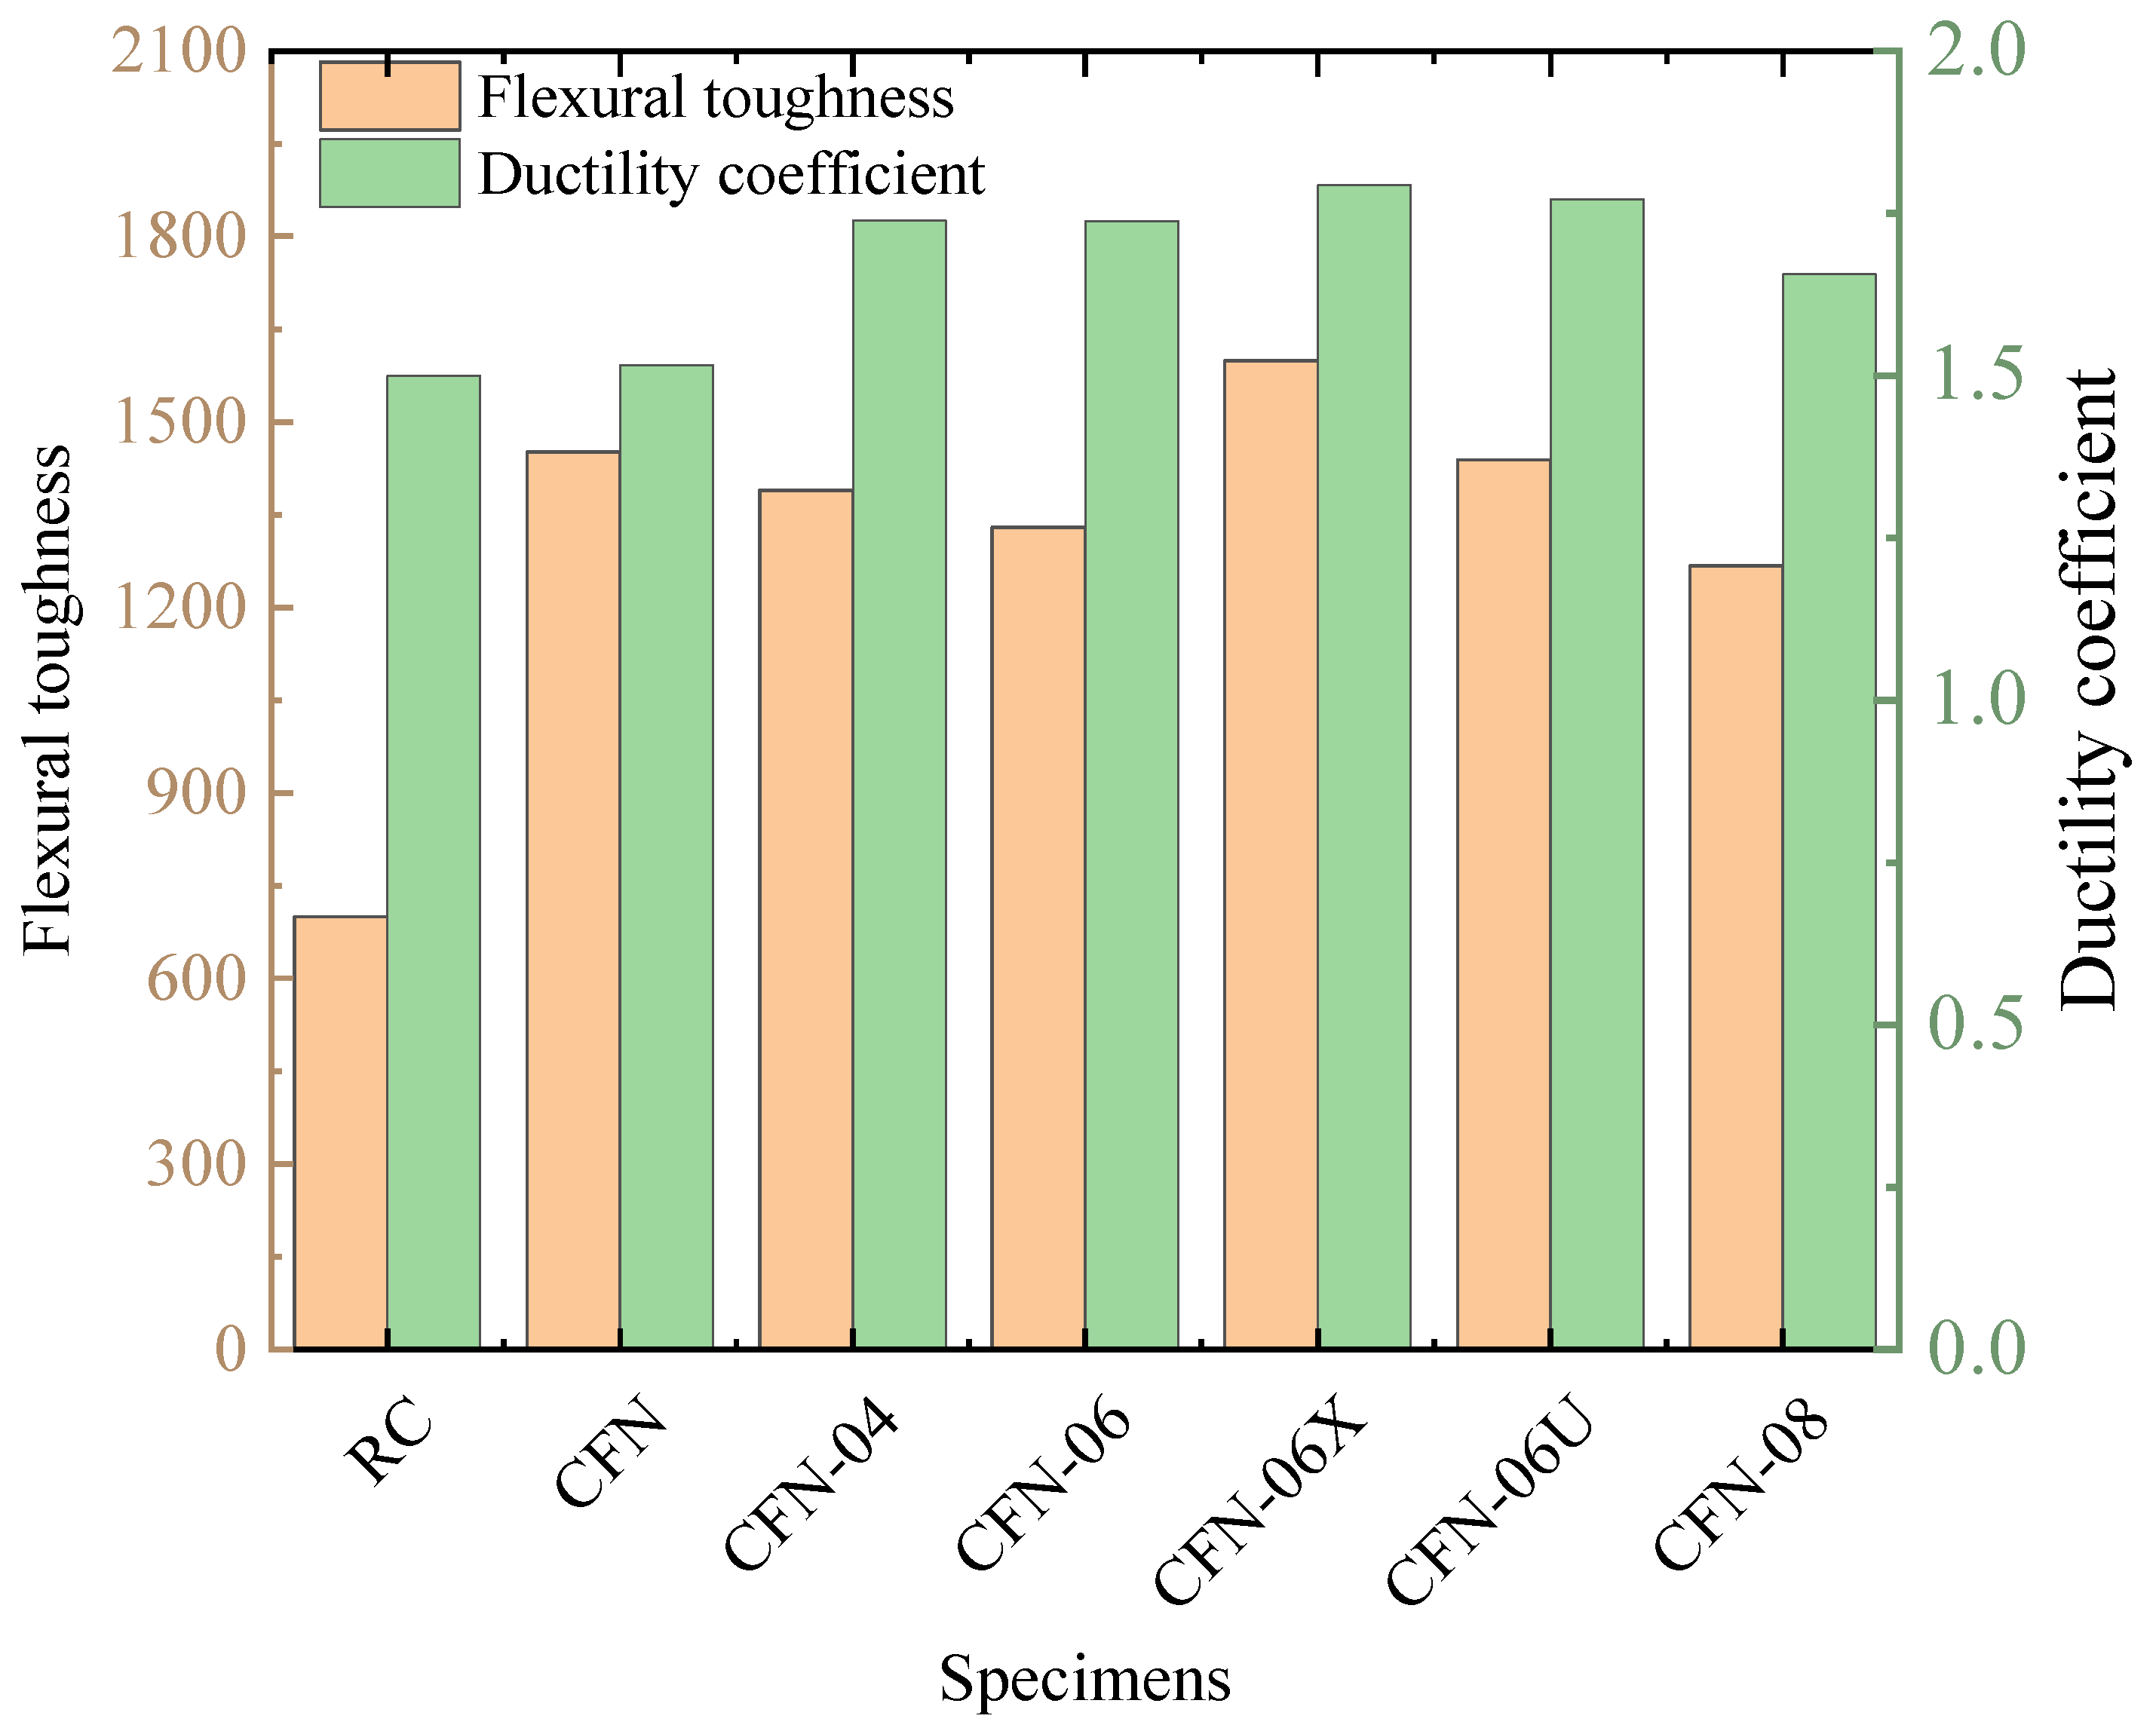
It can be seen from
Figure 12 that the ductility coefficient (the ductility coefficient is defined as the ratio of mid-span deflection corresponding to ultimate load to mid-span deflection corresponding to yield load) [
27] of the strengthened beam is higher than that of the contrast beam RC, and compared with the contrast beam RC the ductility coefficient increases by 5.15%, 16.00%, 15.97%, and 10.48% with the increase in the damage degree of the original beam. The main reason may be that the cracks of the original beams of CFN-04 and CFN-06 have been developed, but the overall bearing capacity has not been lost. Carbon fiber can not only effectively bear the tension but also have no stress concentration due to the excessive damage of the original beam. The tensile deformation of carbon fiber is complementary to the crushing deformation of concrete, and its ability to dissipate energy is the strongest. For CFN-08 the main reason for the decrease in the increased range of ductility coefficient (10.48%) should be that the effective compression zone of the beam section is reduced due to excessive damage and the concrete crushing is advanced, which partially offsets the reinforcement effect of carbon fiber. At the same time, serious damage may lead to the peeling of the reinforcement layer or the yielding of steel bars earlier, which makes the deformation of carbon fiber and the original beam incompatible so that the increased range of ductility is limited.
For CFN-06, CFN-06X, and CFN-06U with the same damage degree, the ductility coefficients of CFN-06x and CFN-06U were increased by 3.14% and 1.90%, respectively, compared with CFN-06, indicating that the anchoring effect of the X-hoop and U-hoop on the CFNs at the bottom is conducive to improving the ductility of the beam. In addition, because the bonding area of X-hoop is larger than that of U-hoop, the oblique stress dispersion is good and the anti-stripping ability is strong. Therefore, the ductility of the damaged beam is improved more significantly.
3.5. Flexural Toughness Analysis
Energy consumption is characterized by flexural toughness, and the flexural toughness coefficient is defined as the curve area of the load–deflection curve before the peak load [
33].
As shown in
Figure 12, compared with the RC, the flexural toughness coefficients of CFNs, CFN-04, CFN-06, and CFN-08 increase by 107.28%, 98.40%, and 89.88%, respectively, with the increase in the damage degree of the original beam, indicating that the reinforcement method adopted in this study can effectively improve the flexural energy dissipation capacity of concrete beams. In addition, the bending toughness coefficient shows a trend of decreasing with an increase in the damage degree. This is because the more serious the damage of the original beam, the smaller the effective compression area of concrete, the more dense the crack network, and the more the energy dissipation capacity of the matrix itself is significantly reduced, resulting in the weakening of the “incremental effect” of carbon fiber reinforcement. The low-damage beam after reinforcement mainly experiences flexural ductile failure (carbon fiber tensile fracture), while the high-damage beam may experience brittle failure, and the energy consumption mechanism changes from “plastic deformation energy consumption” to “brittle failure energy consumption”, which reduces the increase in toughness.
Compared with CFN-06, the flexural toughness coefficients of CFN-06, CFN-06X, CFN-06U, CFN-06X, and CFN-06U with the same damage degree increased by 20.31% and 8.24%, respectively. This is due to the fact that, when compared with the U-hoop, the oblique fiber of the X-hoop and the carbon fiber at the bottom of the beam form a spatial truss effect, which resists crack propagation through oblique tension and compression during bending deformation, making the energy dissipation more uniform. On the other hand, the oblique constraint has stronger adaptability to non-uniform damage cracks, which can avoid local stress concentration through deformation coordination and prolong the energy absorption stage in the loading process.
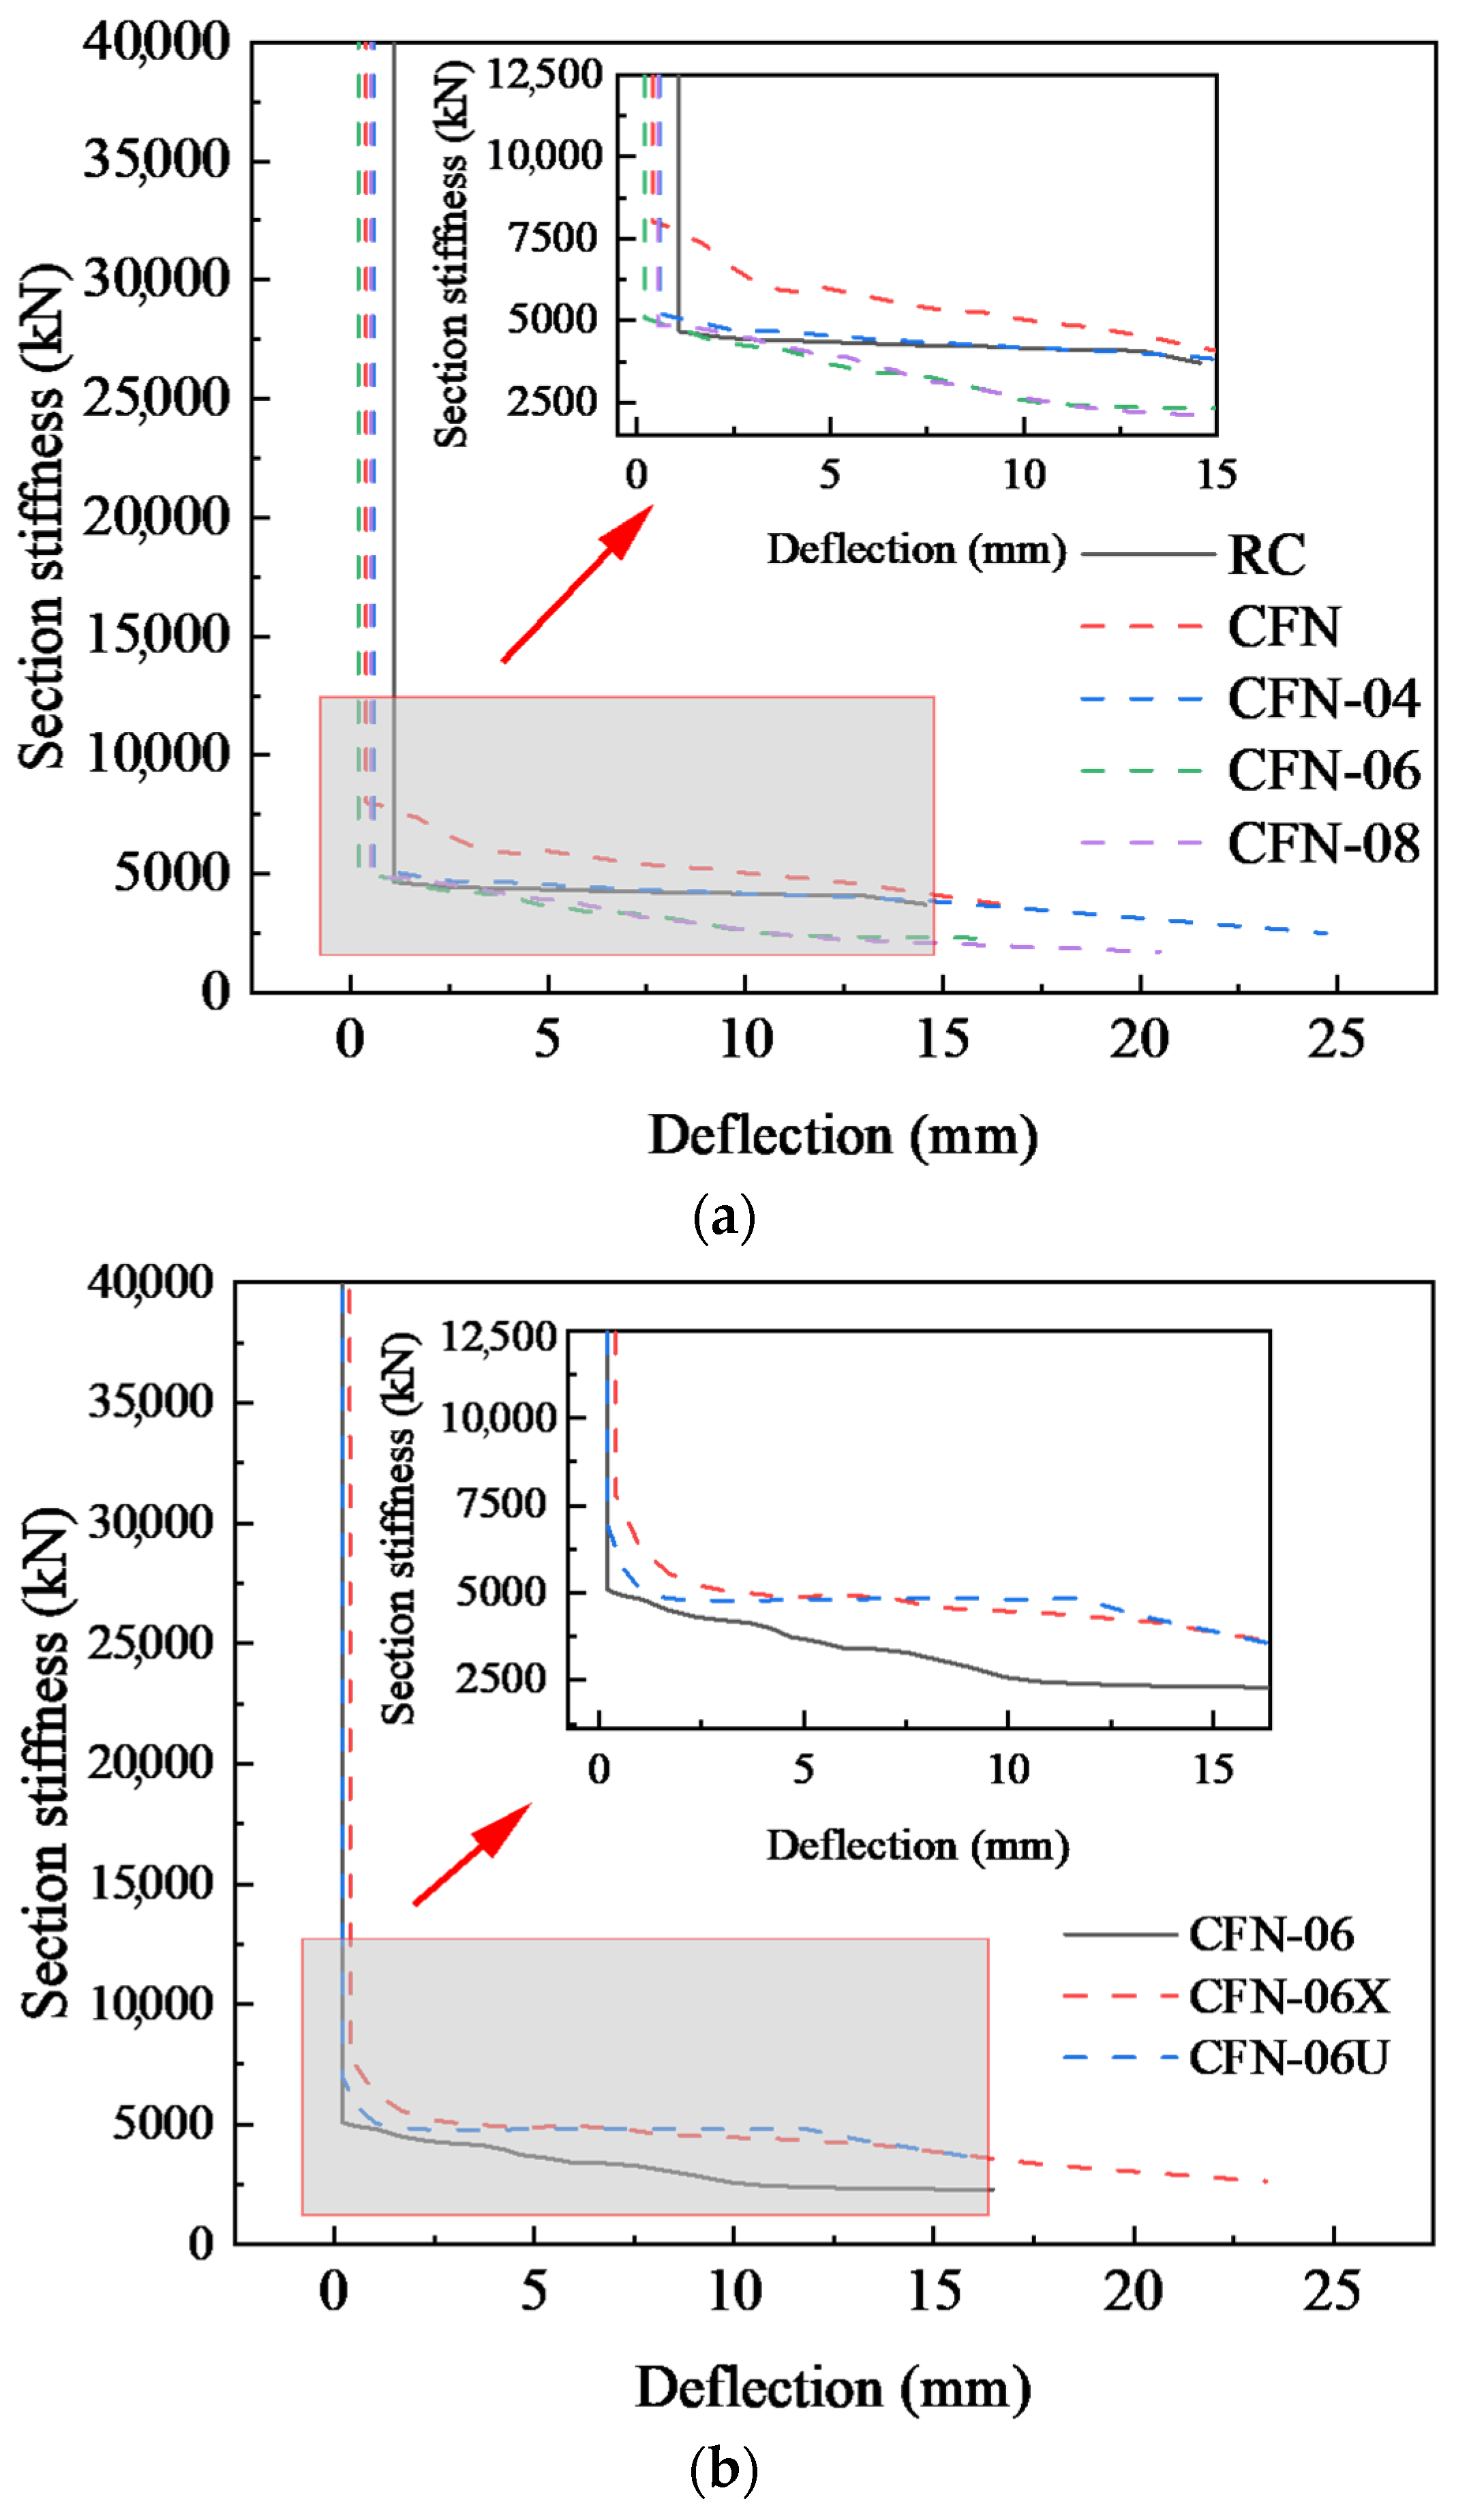
3.6. Section Stiffness Analysis
Figure 13 shows the section stiffness–deflection curve, where the section stiffness is defined as the ratio of the bending moment of the mid-span section to the corresponding deflection [
34]. It can be seen from
Figure 13 that the section stiffness of each strengthened beam is significantly higher than that of the unreinforced beam before reaching the ultimate load. This is because the existence of the reinforcement layer is equivalent to increasing the cross-sectional area and improving the cross-sectional stiffness of the beam. After the reinforcement layer breaks, the section stiffness of the specimen decreases to the stiffness close to the limit state of the contrast beam.
It can be seen from
Figure 13a that at the initial stage of loading the section stiffness of the non-destructive reinforced beam CFNs is significantly higher than that of the damaged reinforced beam, and the difference between the section stiffness of the two beams is gradually reduced when loading continues. The reason for this phenomenon should be that there are initial concrete cracks on the reinforced beams with different degrees of damage, which makes the early section stiffness relatively low. When the load is continued, concrete cracks appear in the undamaged reinforced beam and continue to extend, while the concrete cracks of the damaged reinforced beam extend very shortly after reinforcement, so the section stiffness of the two beams is becoming closer and closer. As the damage degree increases, the section stiffness of the strengthened beam decreases continuously because the greater the damage degree of the original beam, the more the stiffness decreases after unloading, and consequently, the lower the stiffness of the strengthened beam.
For the CFN-06, CFN-06X, and CFN-06U test beams with the same damage degree, as shown in
Figure 13b, the stiffness value of the mid-span section at the initial stage of the test is similar, but with the increase in load the mid-span deflection gradually increases. For CFN-06X with an X-ring and U-ring, respectively, the reduction in CFN-06U stiffness is significantly less than that of CFN-06. This is mainly because the X-hoops and U-hoops played an anchoring role for the CFNs at the bottom of the beam, making its material performance more fully displayed.
4. Finite Element Analysis
As we all know, numerical simulation can predict the behavior of complex systems, verify theoretical assumptions, or optimize engineering design under controlled conditions by constructing mathematical models and solving them with computers, providing low-cost and high-efficiency decision support for scientific research and engineering practice.
Nowadays, the commonly used numerical simulation methods include the finite element method, infinite element method, finite difference method, Bessel multistep method, etc. Among them, the finite element method will discretize the continuum as an element, and with the help of the variational principle or weighted residual method, discretize the differential equation into a system of algebraic equations to solve. Furthermore, it can flexibly cope with complex geometries and boundaries, and it is suitable for multi-physics fields [
35]. Conversely, the infinite element method combines the infinite discretization idea with finite elements, and it is used in infinite domains to avoid the boundary reflection error [
36]. In addition, the finite difference method discretizes space and time, approximates the derivative by the difference quotient, and transforms differential equations into algebraic equations, which is a simple algorithm suitable for PDEs in regular regions [
37]. Meanwhile, the Bessel multistep method (commonly known as the Adams multistep method) belongs to the linear multistep method, which solves the problem of the initial value of ordinary differential equations recursively through the history of the solution value and the derivative, is explicitly and implicitly differentiated, and is often used to solve the problem of the initial value of ordinary differential equations. Combining the prediction-correction mechanism for non-rigid ODEs can be seen in [
38,
39].
Given that the finite element method has a strong ability to deal with complex geometries, nonlinear material properties, and multi-physical field coupling problems, and can realize the advantages of high-precision modeling through flexible dissecting units and constructive shape functions, the finite element software ANSYS (v2023 R1) is used in this study to carry out numerical simulations.
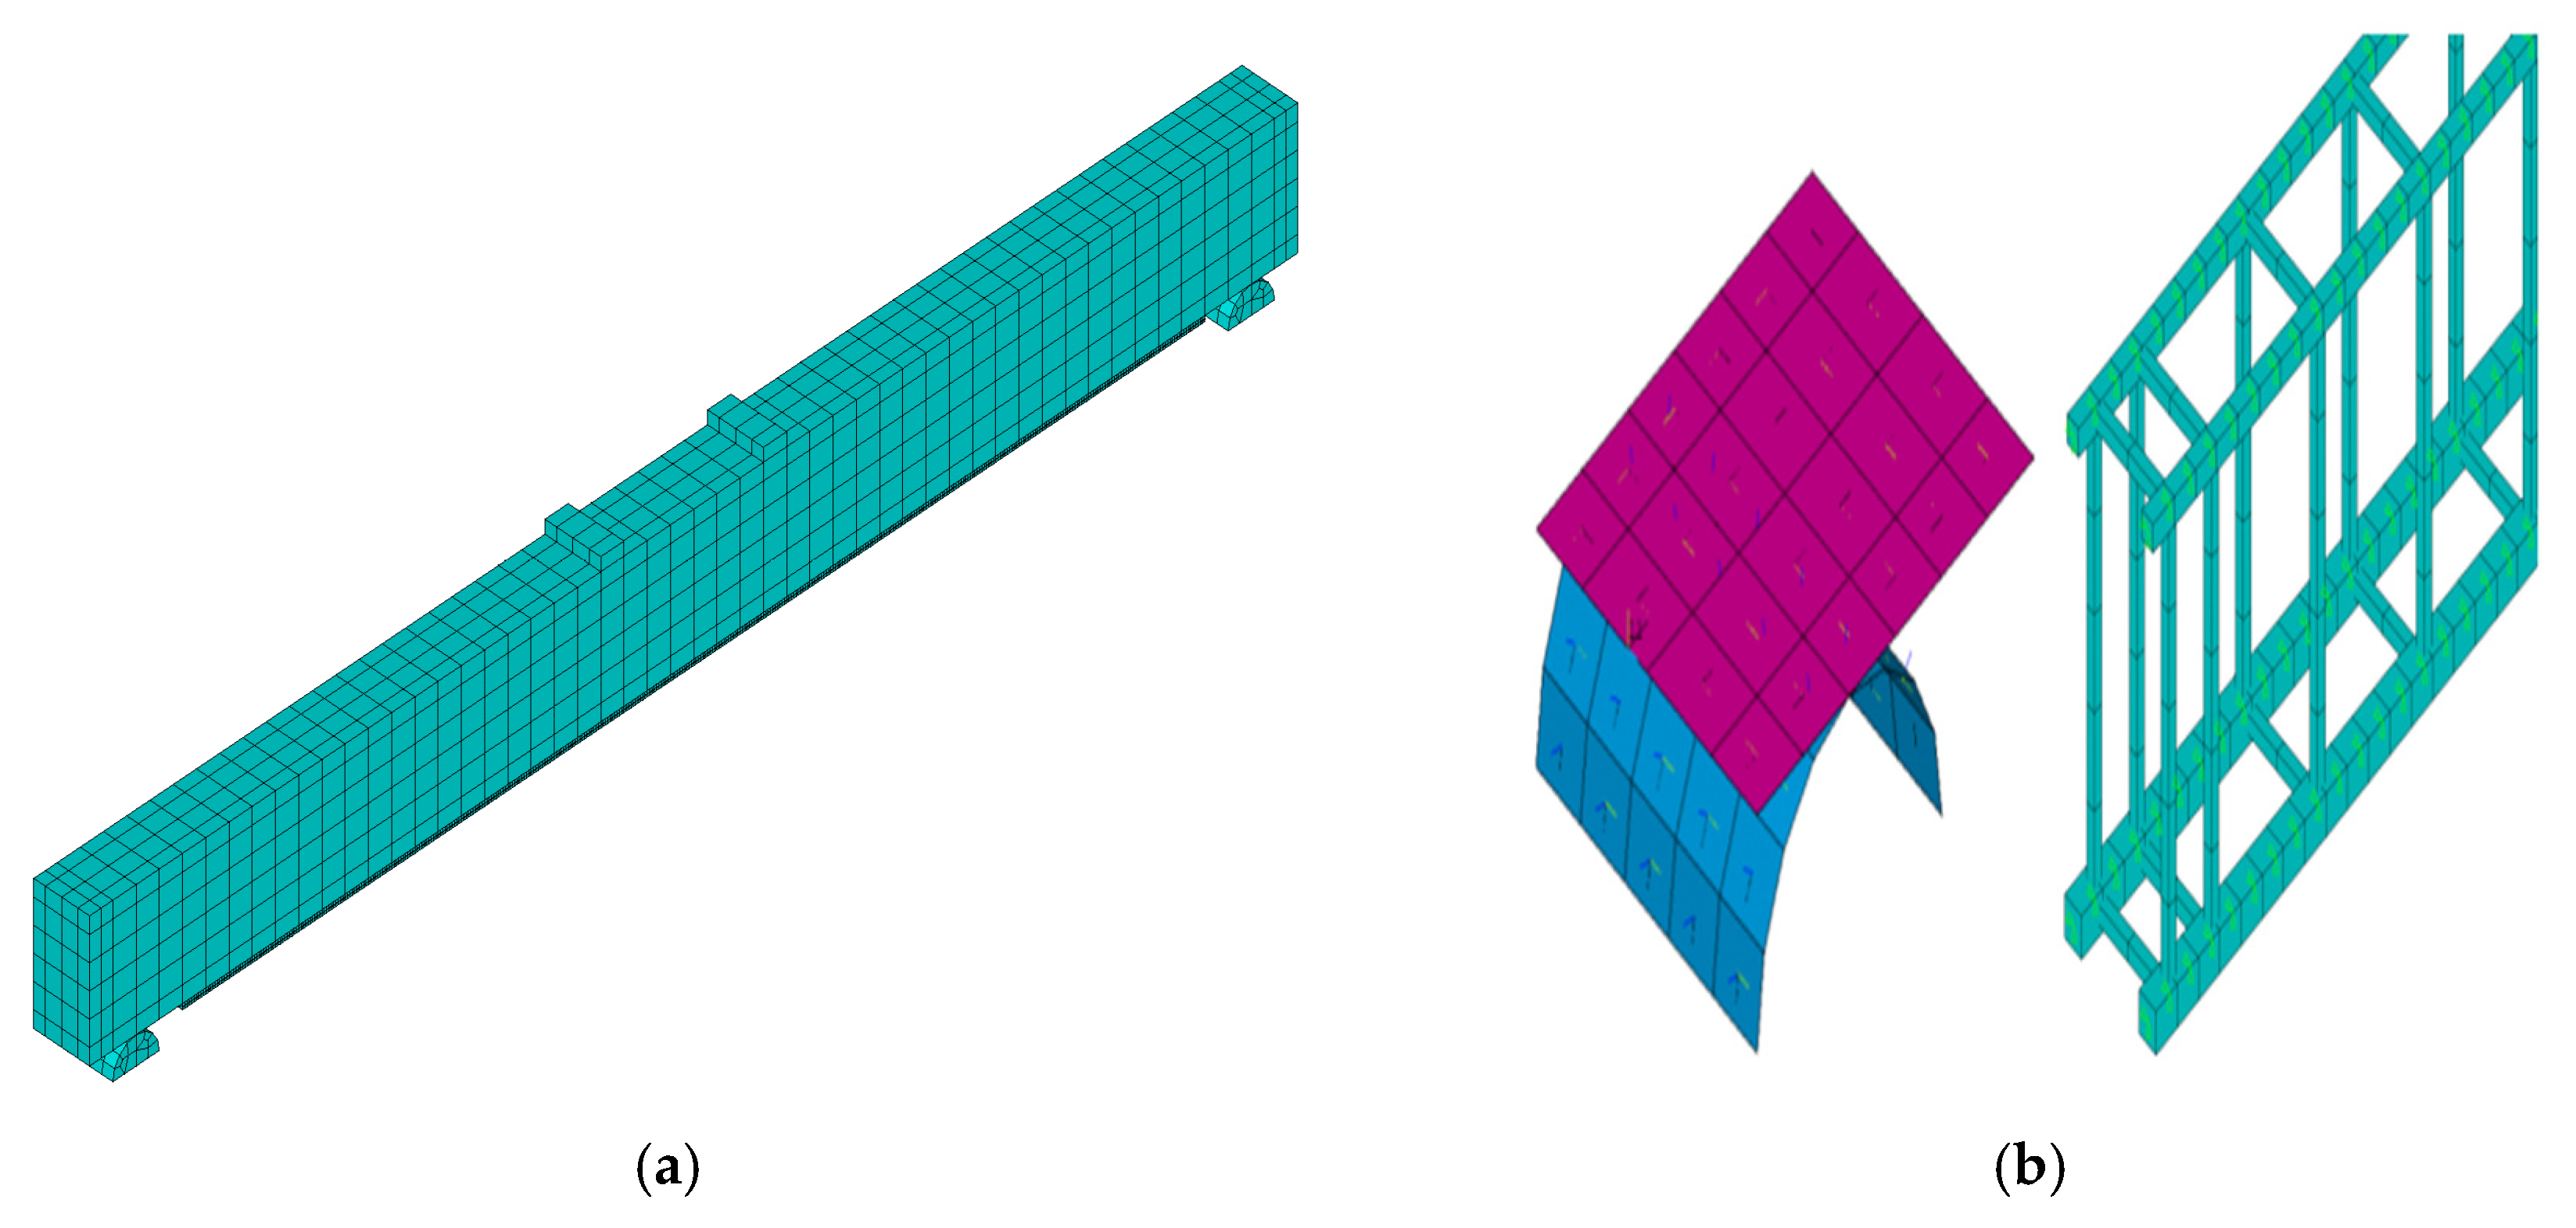
4.1. Model Building
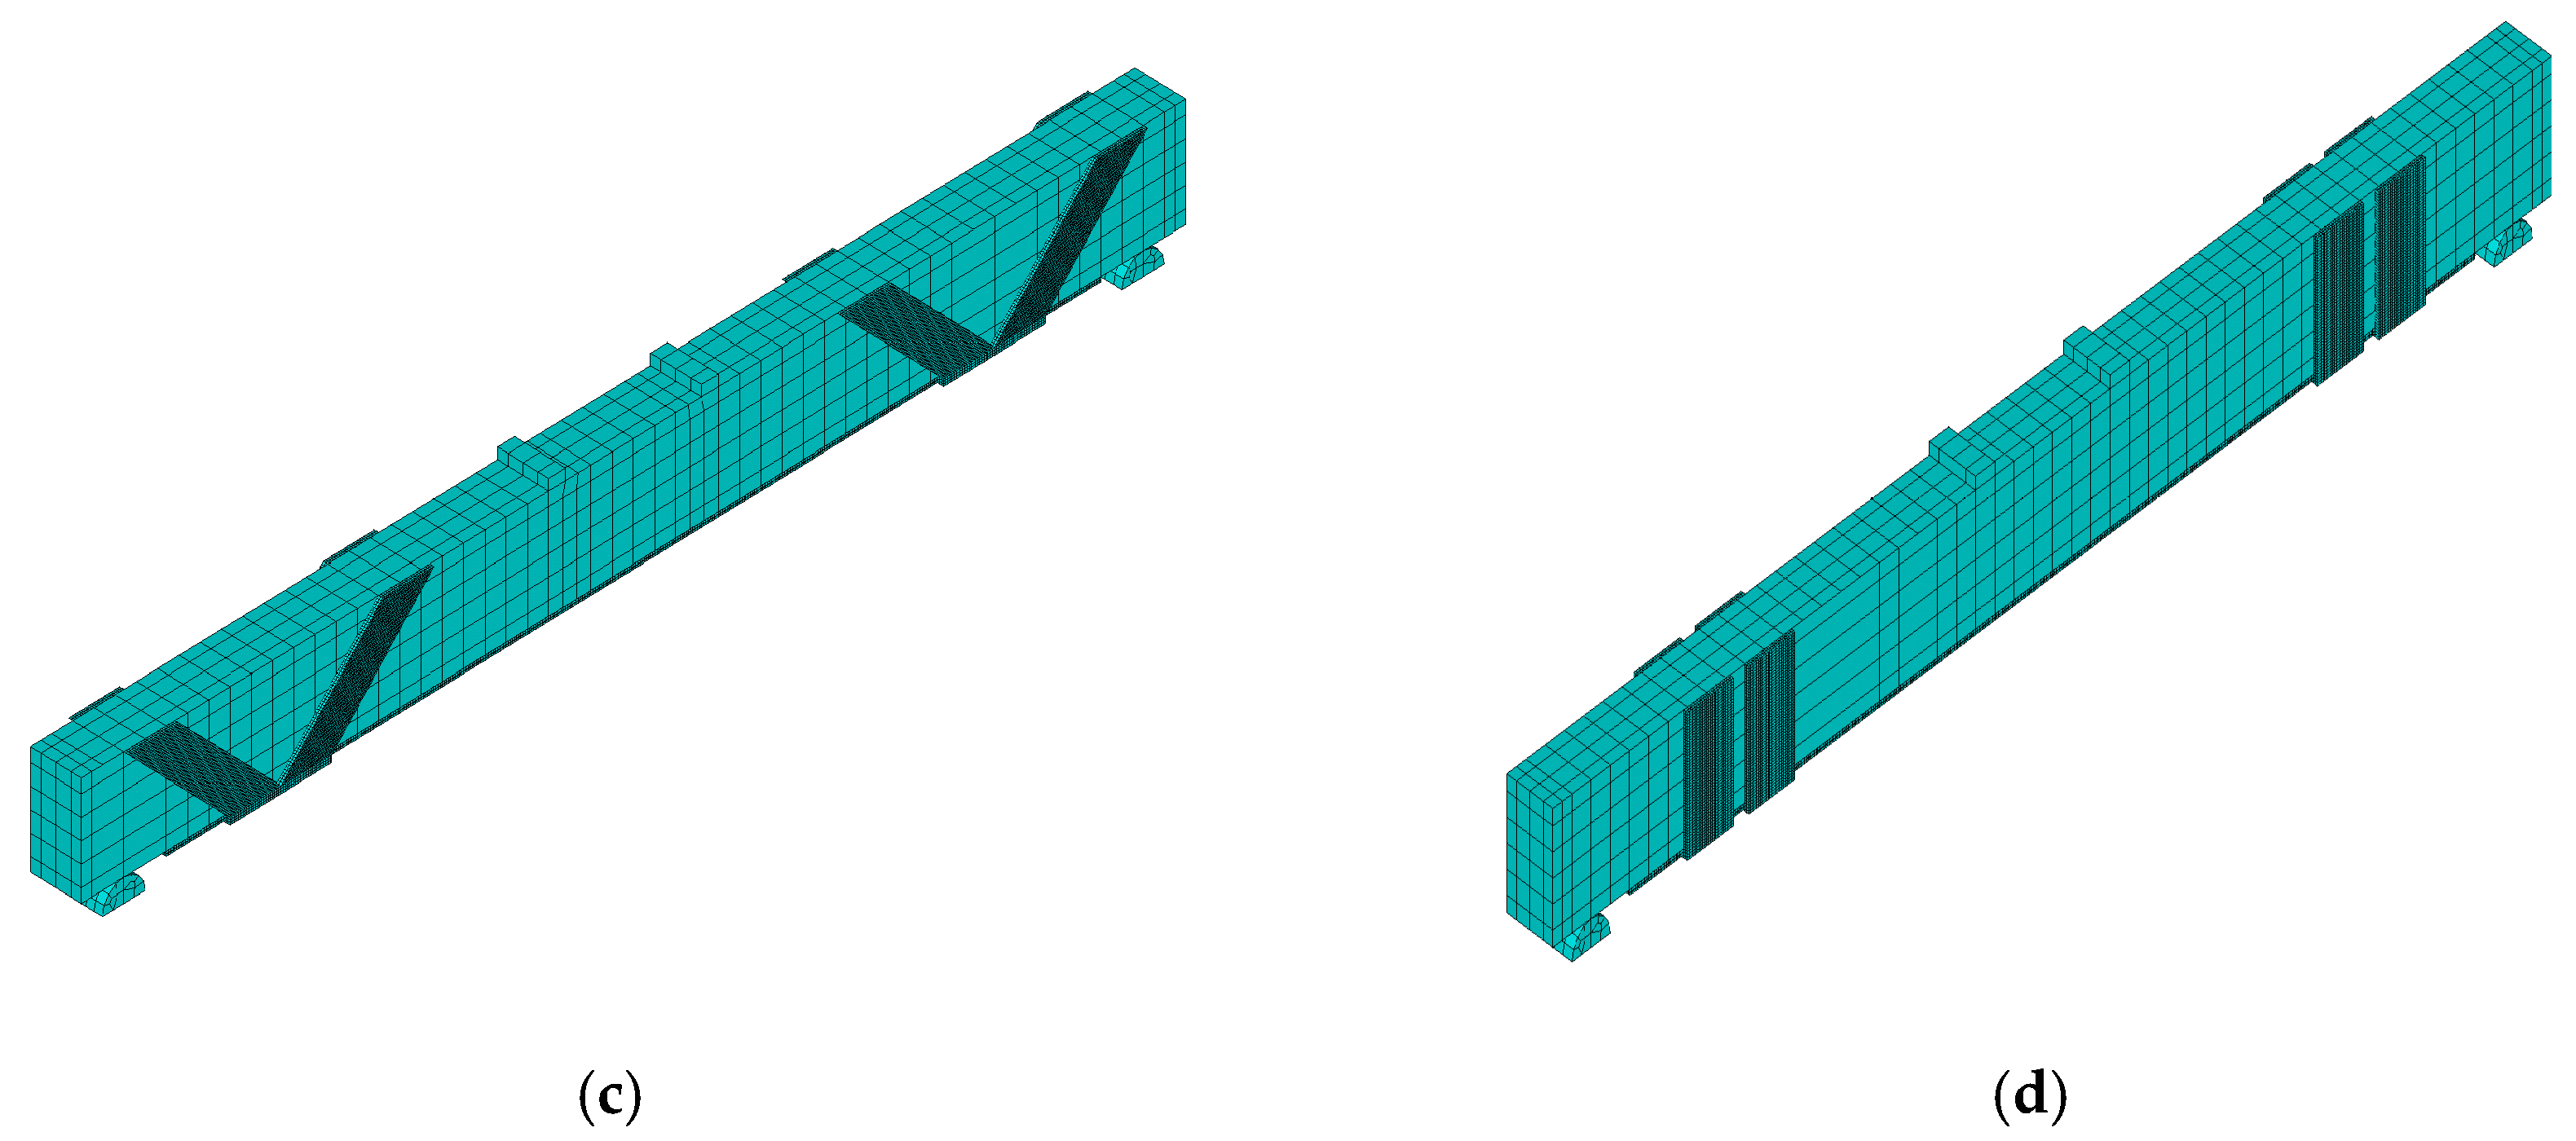
This study used ANSYS (v2023 R1) software to simulate the test results numerically. The finite element model of each specimen is shown in
Figure 14. In this paper, the finite element model of the reinforced beams is modeled in a combined manner, in which the concrete and reinforcement are modeled in a separated manner considering bond-slip and the mortar reinforcement layer is modeled in a monolithic manner. Solid65 solid unit is used to simulate the concrete; LINK180 rod unit is used to simulate the steel reinforcement; Solid65 reinforced concrete 3D solid unit is used to define the bidirectional reinforcement rate of the carbon fiber mesh by setting the real constants; and INTER205 unit is used to simulate the bond-slip between the CFNs and the mortar.
Contact surface and target surface consider the following selection principles: (1) the position connected to the rigid body is set as the target surface and the flexible body is set as the contact surface; (2) the convex surface is set as the contact surface, the concave surface is set as the target surface; (3) the larger size of the surface is set as the target surface, and the smaller size of the surface is set as the contact surface; and (4) the face of the mesh delineation of the finer surface is set as the target surface, and the face of the mesh delineation of the coarser surface is set as the contact surface.
The reinforced beam model adopted in this paper constrains the translational degrees of freedom of the bearing pads and sets contact pairs between the top surface of the bearing and the bottom surface of the reinforced concrete beam, which improves the accuracy and convergence of the calculation. The principal structure curves of the three materials are shown in
Figure 15.
4.2. Comparison of Results
4.2.1. Comparative Analysis of Ultimate Bearing Capacity
As can be seen from
Table 6, the relative error between the numerical calculation results of the reinforced beam bearing capacity and the experimental results is around 3.6%. The finite element calculated values are slightly higher than the tested values, which may be due to the fact that the intrinsic curves of the selected materials do not reflect the mechanical properties of the corresponding materials. Under secondary stress, the flexural ultimate bearing capacity values calculated by both the test and the finite element methods have the same influence distribution law; that is, the larger the preload amplitude, the weaker the enhancement effect of the carbon fiber mesh–polymer mortar composite reinforcement method on the concrete beam bearing capacity.
4.2.2. Deflection and Material Strain Results
The bending damage process of the seven test beams under secondary stress was simulated, and the convergence effect of each test beam was good.
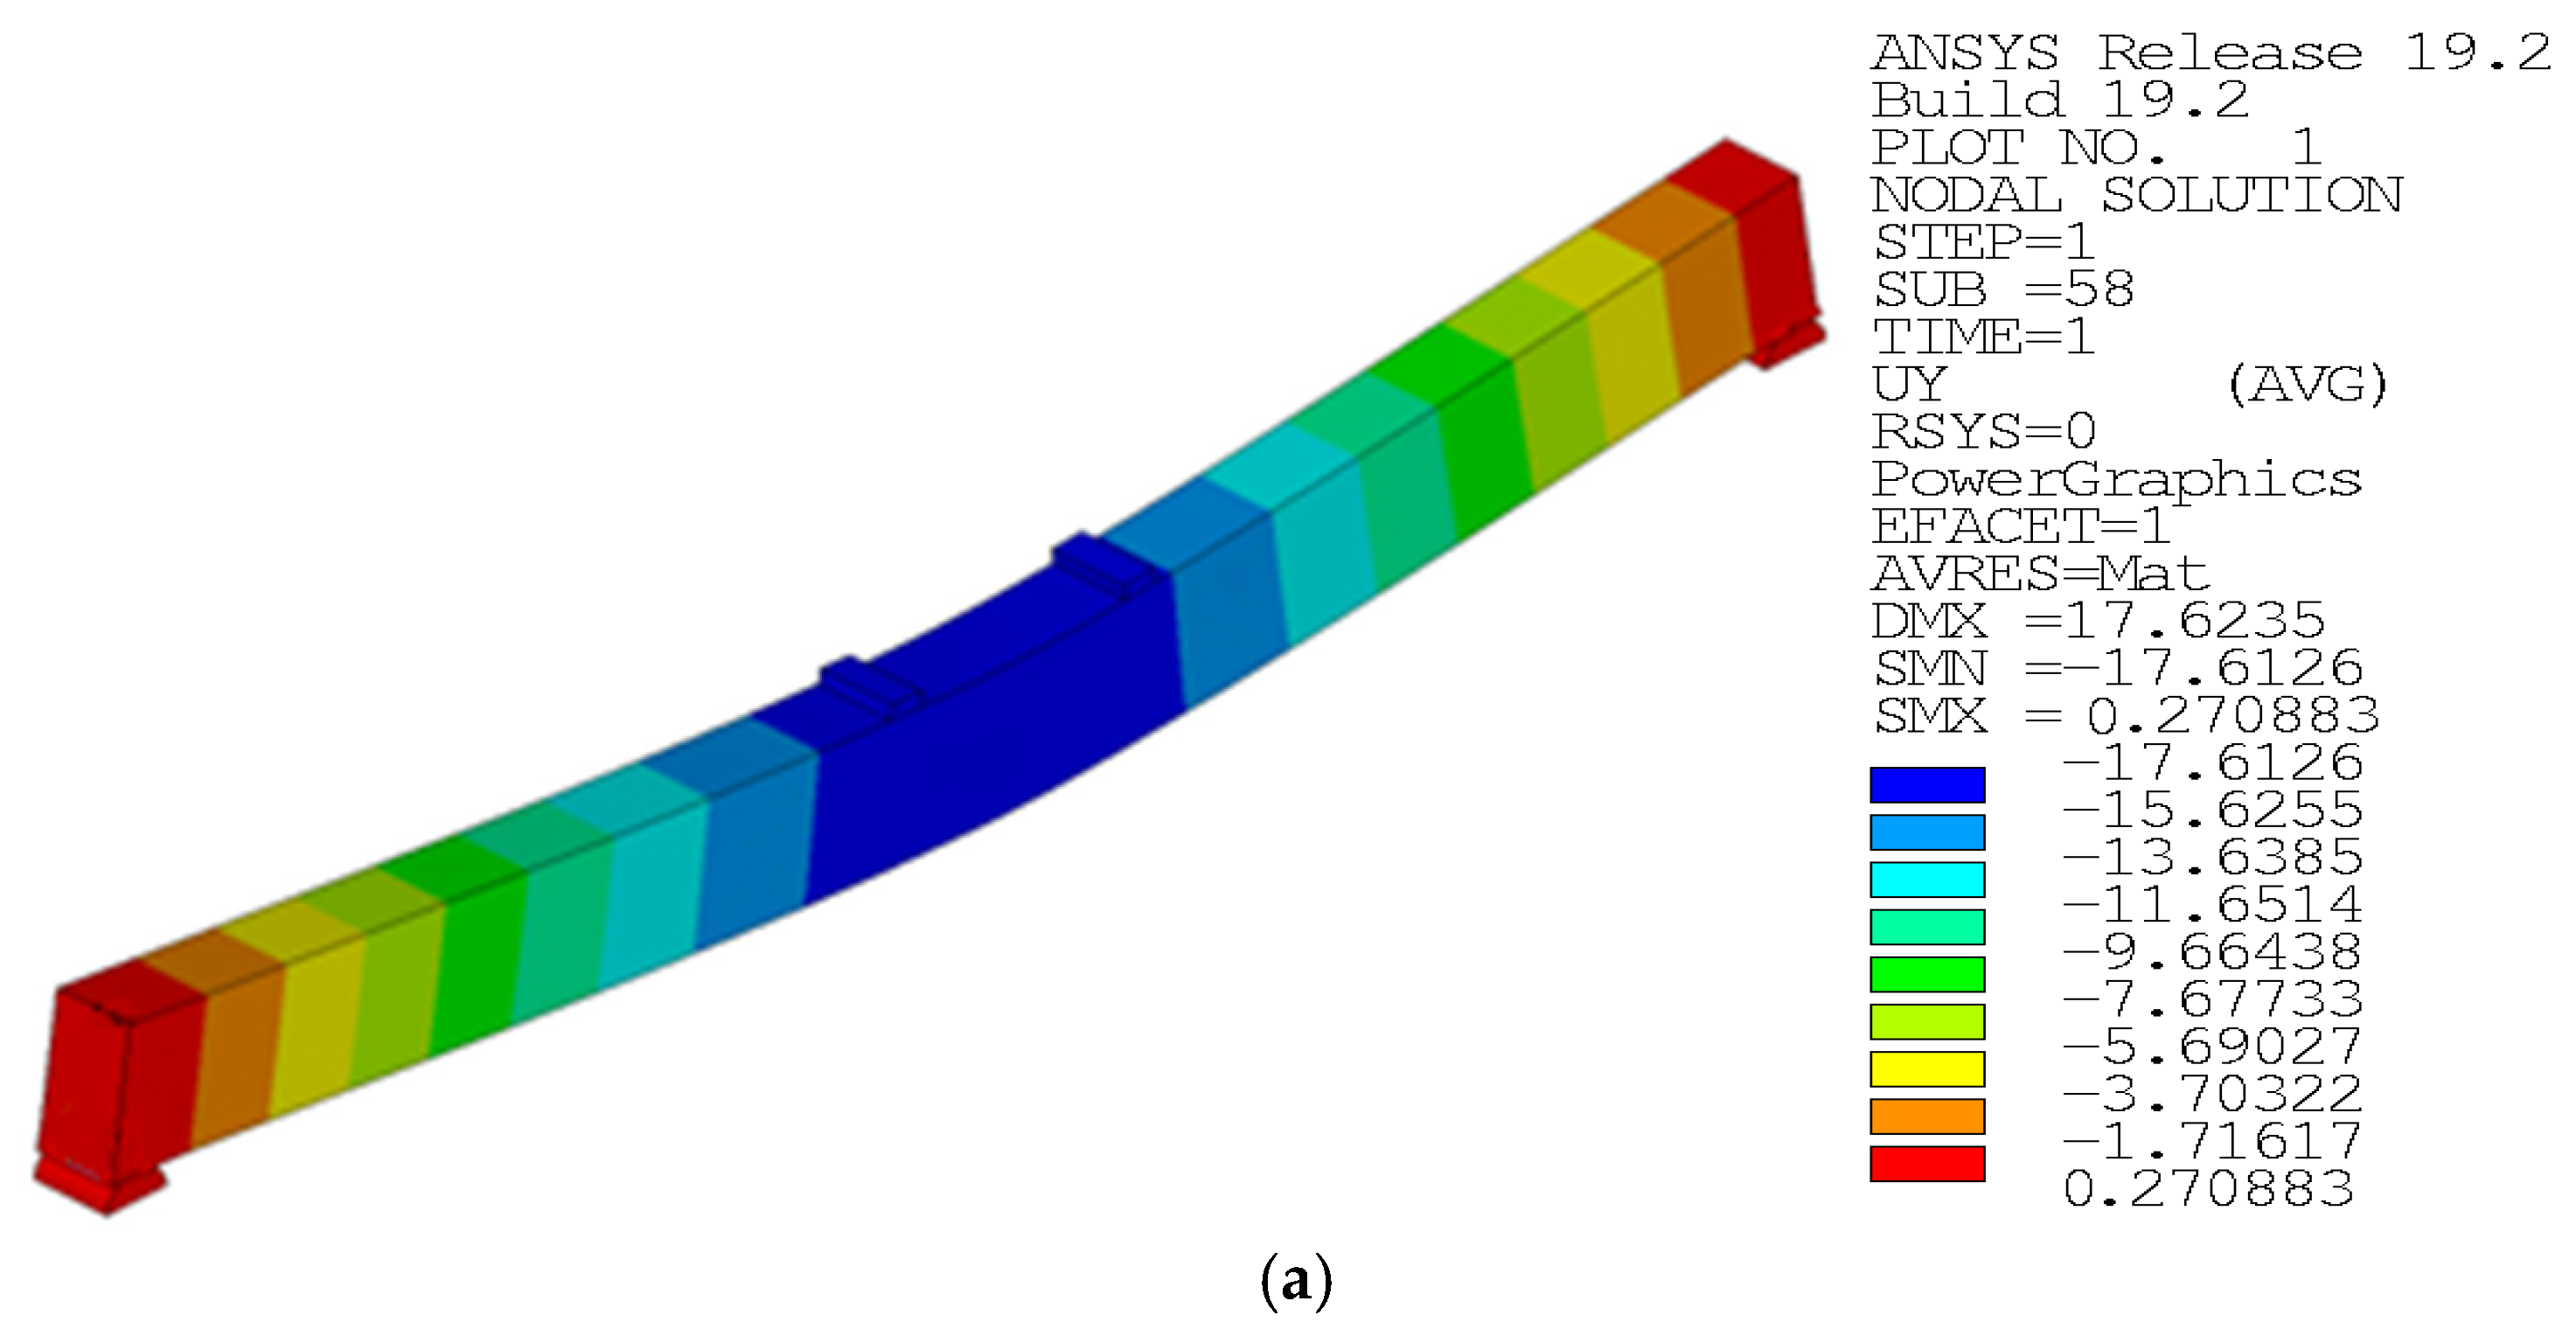
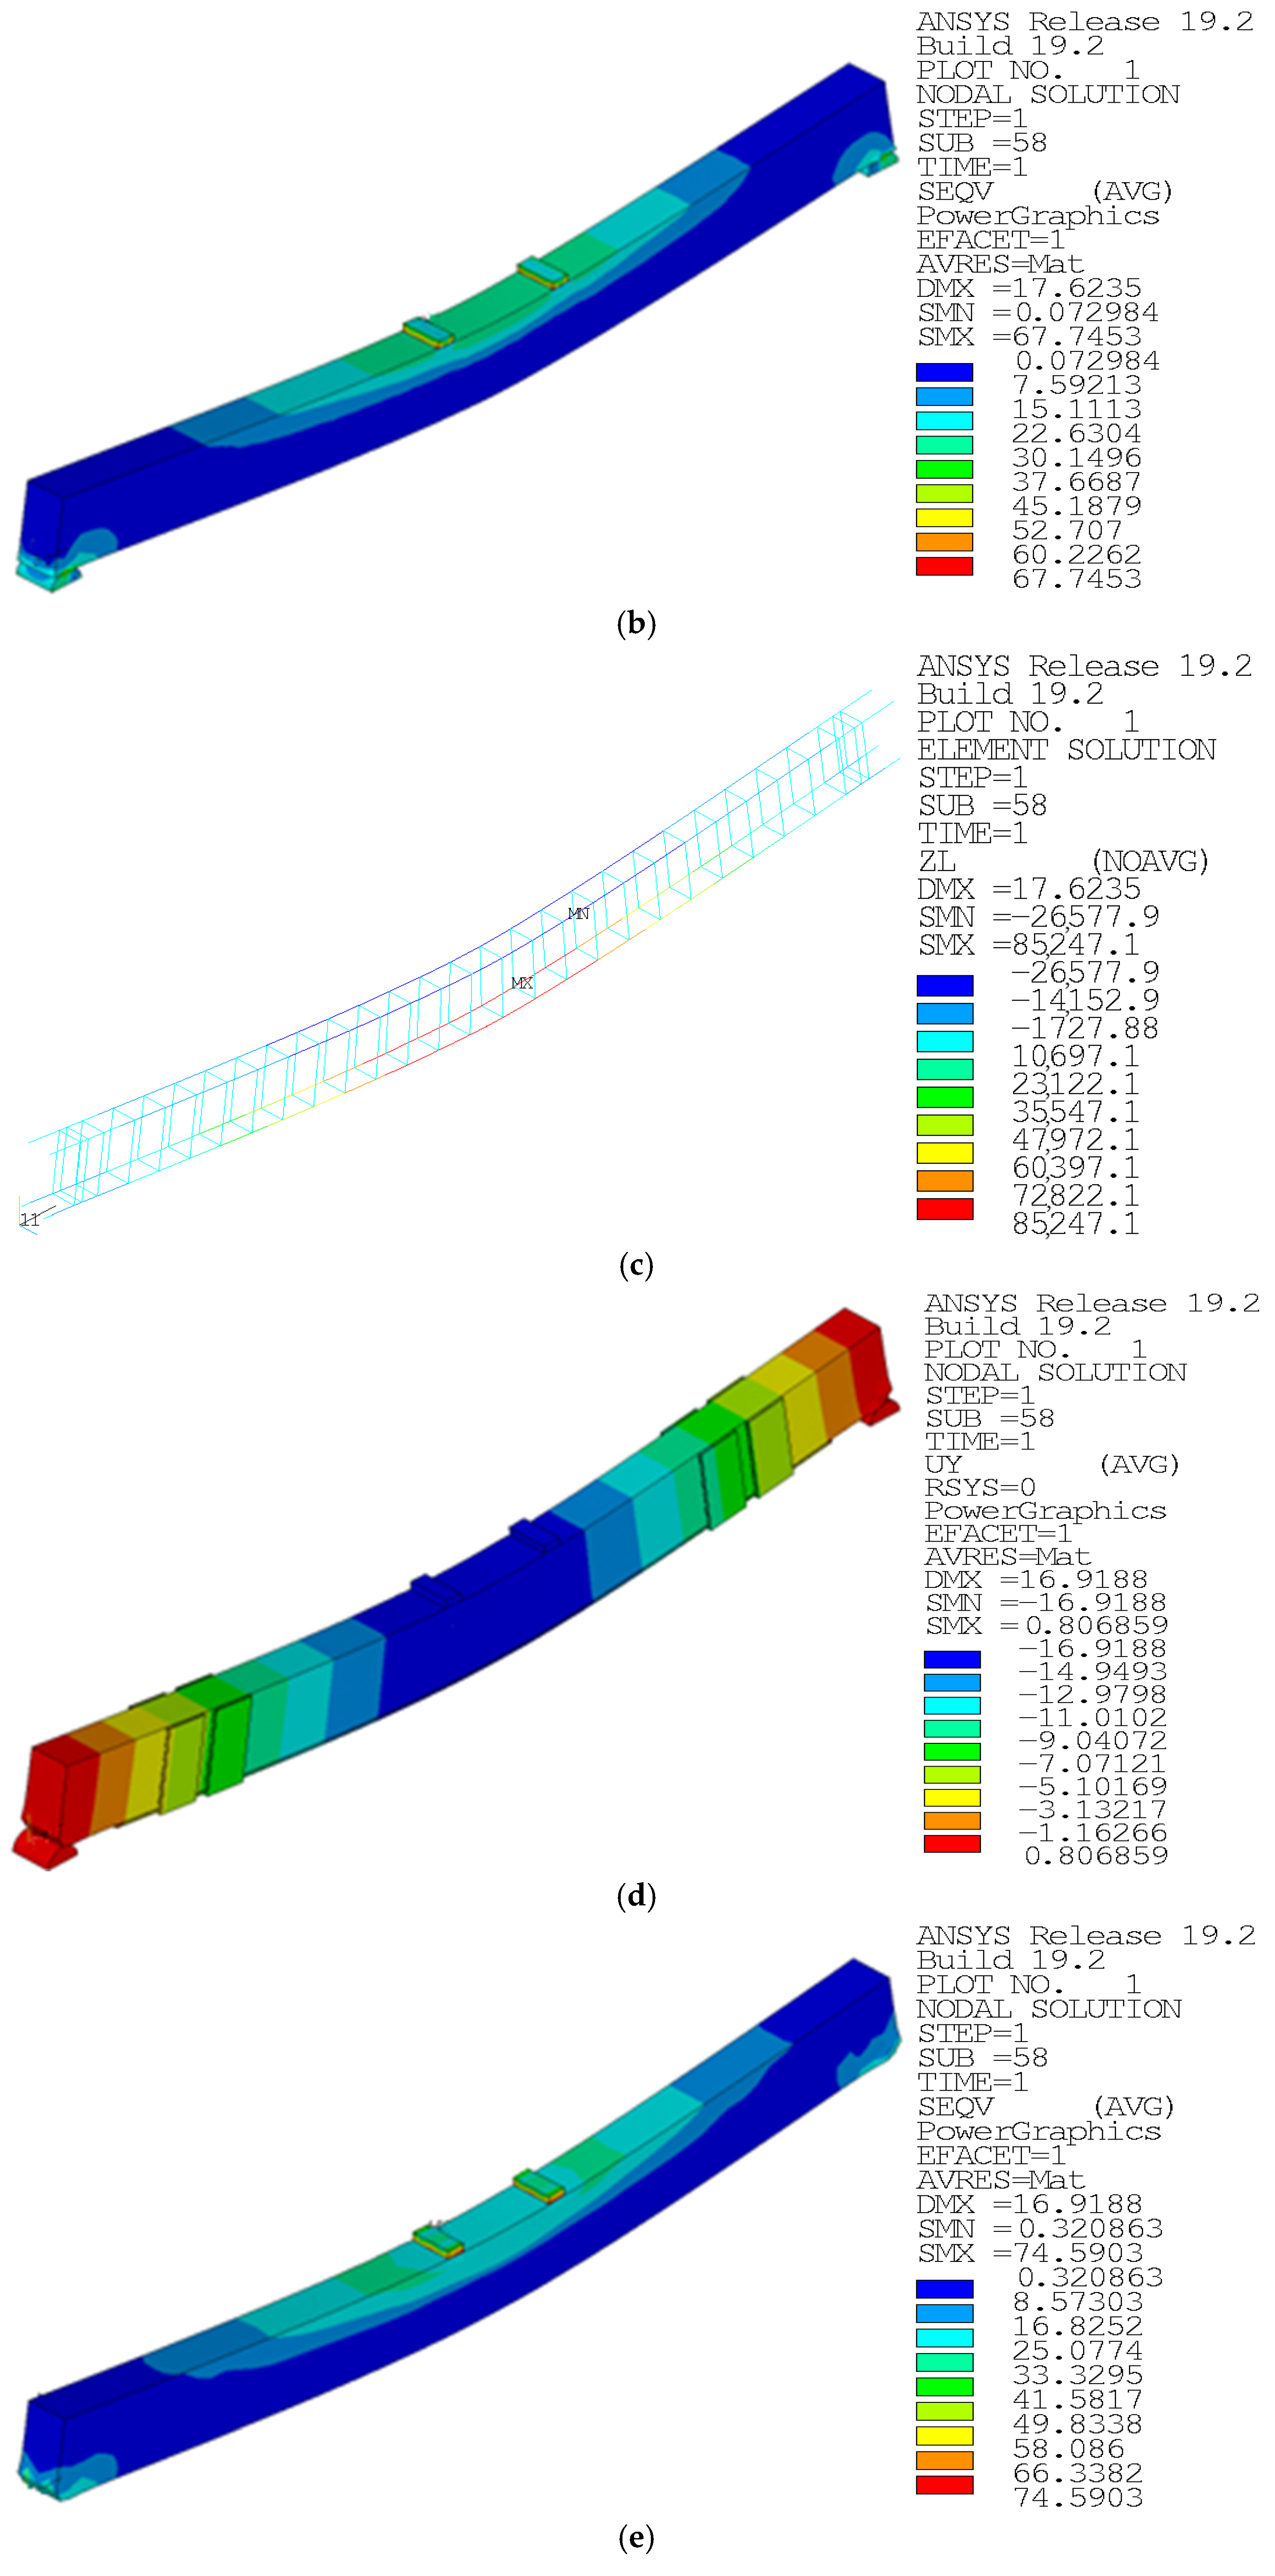
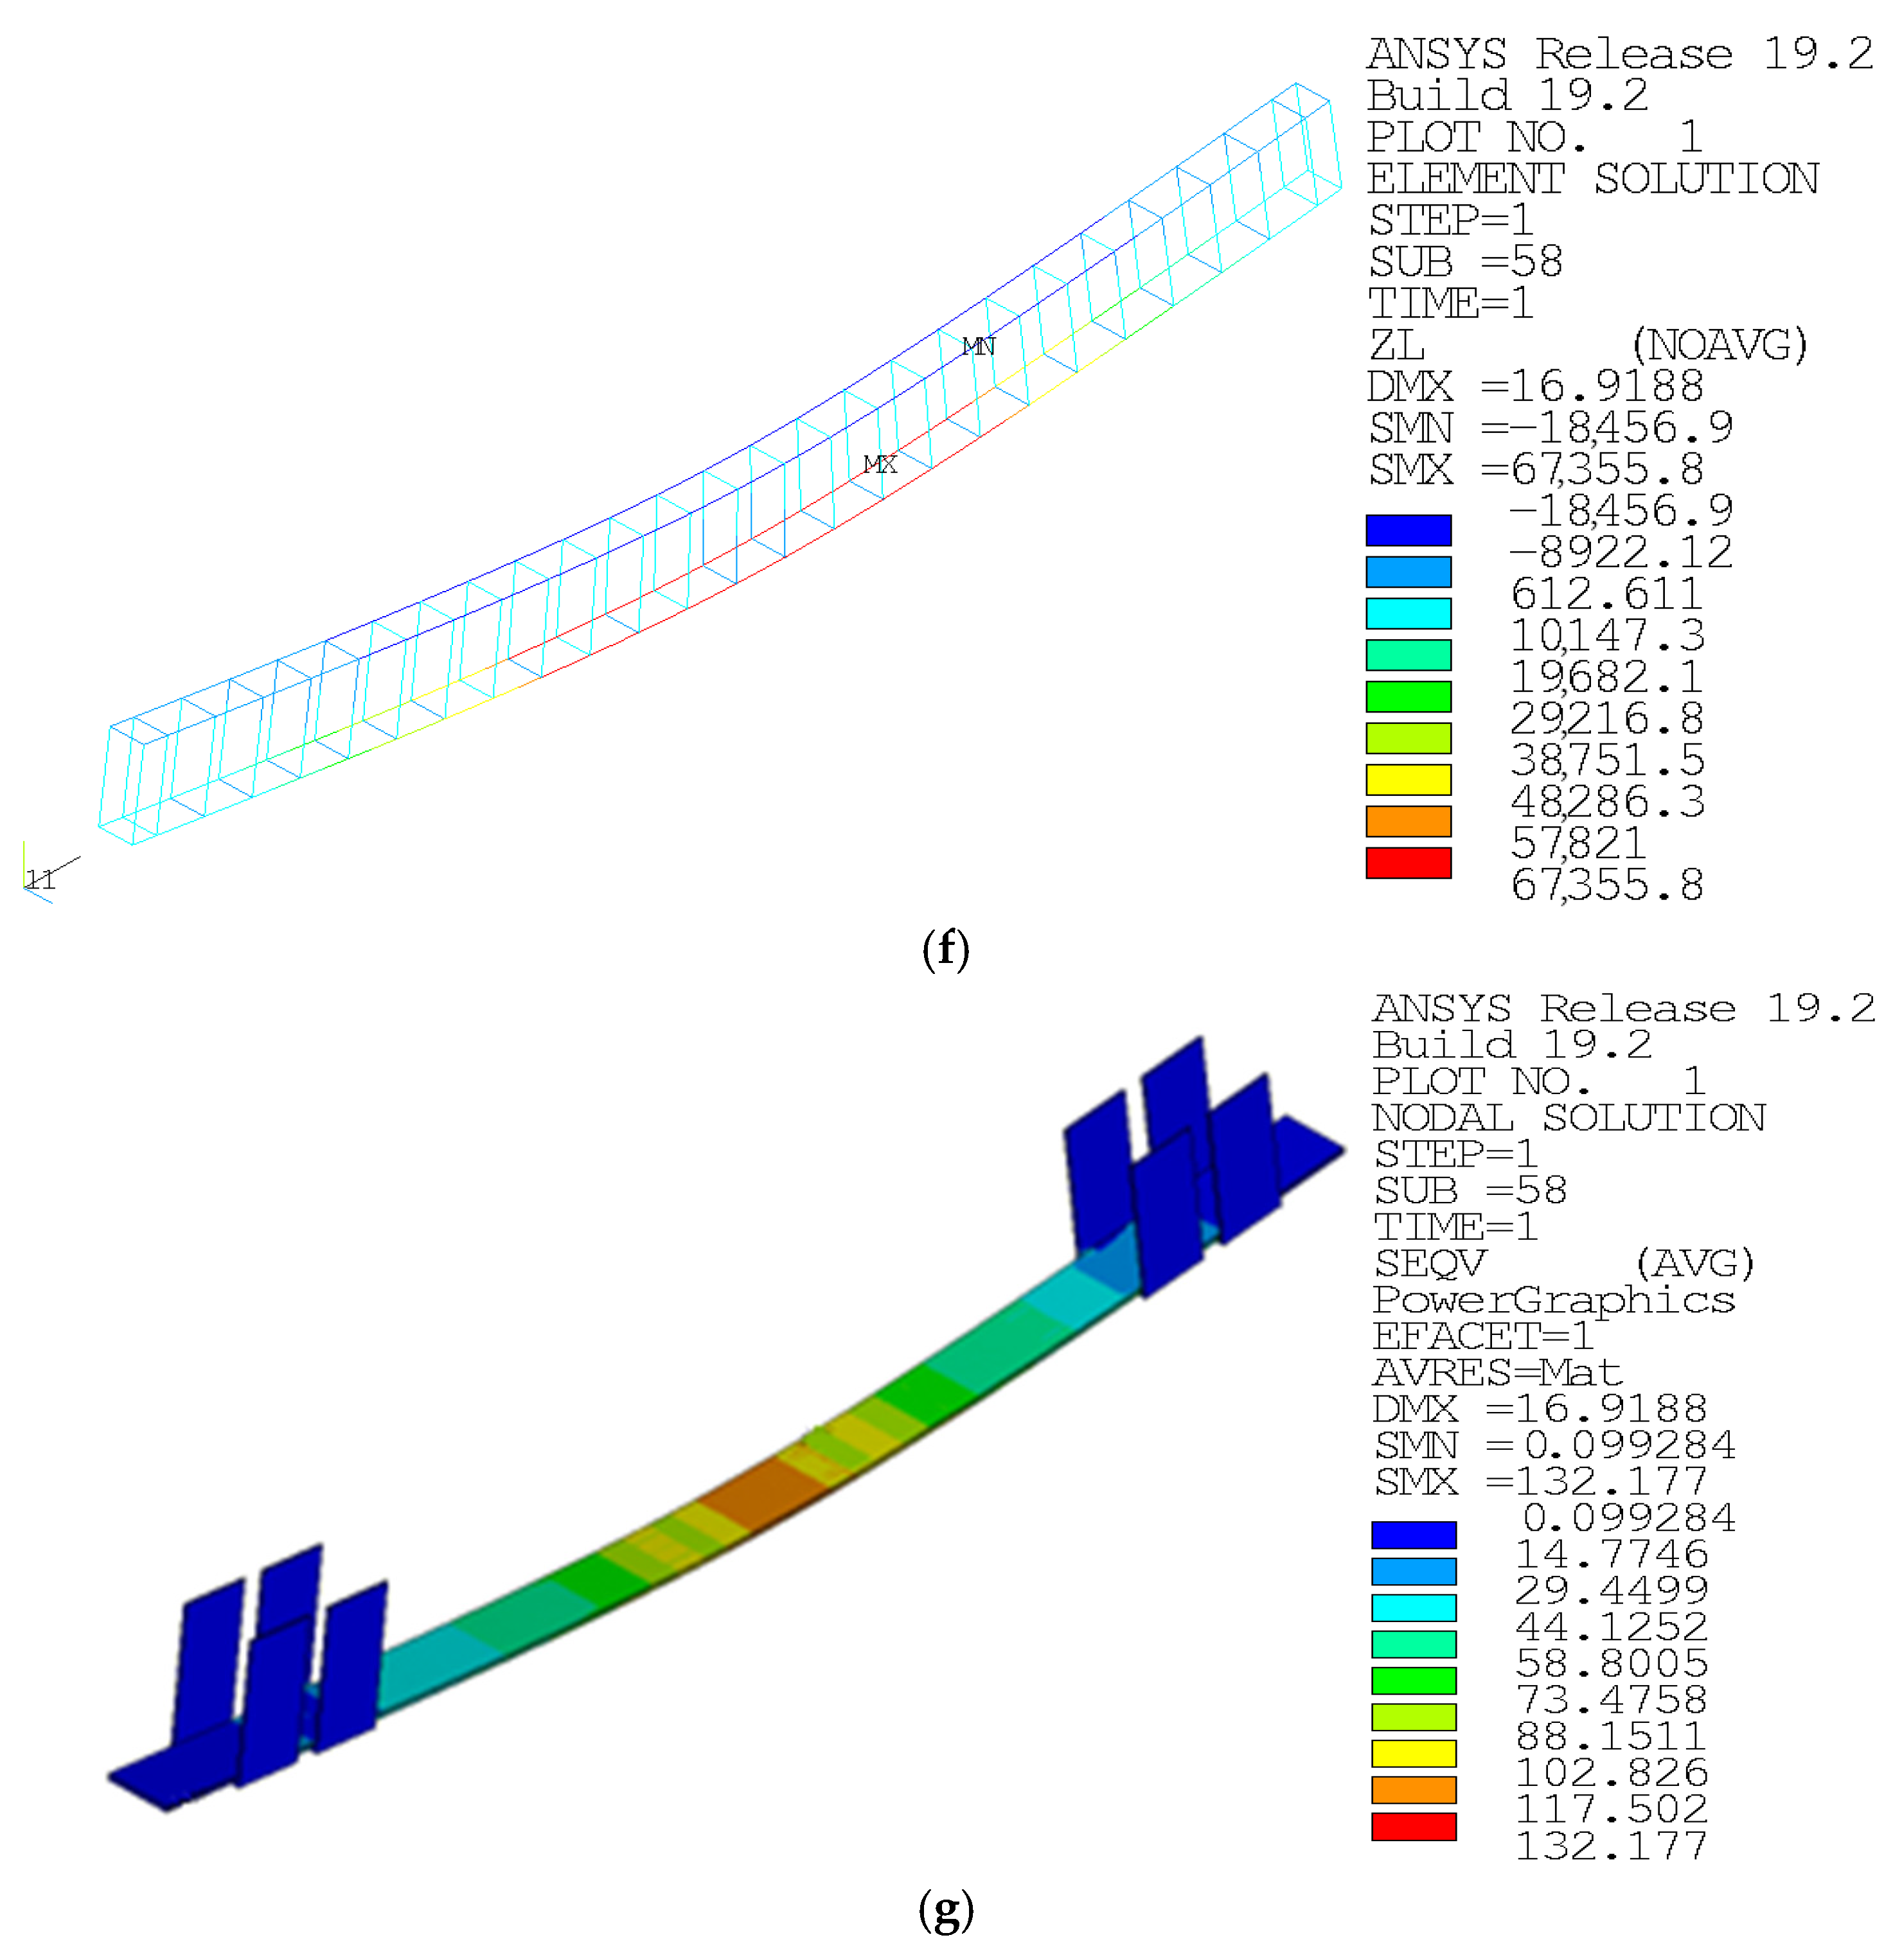
Figure 16 shows the finite element simulations of an unreinforced reference beam and a U-hoop reinforced beam. The figure shows that the maximum deformation values in the span of the unreinforced reference beam and U-hoop reinforced beam are 17.6126 mm and 16.9188 mm, respectively, which are different from the test-measured 14.57 mm and 17.089 mm. In addition, other working conditions have similar characteristics, which verifies the feasibility of using the finite element method to simulate the test beam.
4.3. U-Shaped Hoop Reinforcement Position Optimization
4.3.1. Optimization Algorithm Introduction
A multi-island genetic algorithm (MIGA) [
40] was used for the rational optimization of the U-hoop anchorage positions of CFRP grid-reinforced beams. This was an improvement on a parallel distributed genetic algorithm that can handle both discrete and continuous design variables and explore throughout the design space, with better overall computational power and optimization efficiency compared to traditional genetic algorithms. Isight was used to introduce penalty functions for different constraint variables to treat the sum of the objective function and the penalty function as a specific design point. If a constraint is violated, the penalty value becomes more significant and the objective value follows, and for feasible designs the penalty value is 0. Penalty values are as follows:
where
is the penalty function multiplier and
represents penalties for all restraint violations.
For multi-objective function problems, MIGA is used as an objective function within Isight by averaging its weights. The dimensionless objective function is as follows:
where
is the weighting factor and
is the scaling factor.
For feasible designs, when the MIGA converges or the set number of optimizations reaches a maximum, then the optimal solution of the objective function satisfying the constraints in the range of the variable space can be derived. The MIGA optimization number is calculated and empirically taken as follows:
where
is the number of optimization times;
is the number of design variables;
is the initial population size;
is the number of islands; and
is the evolutionary algebra.
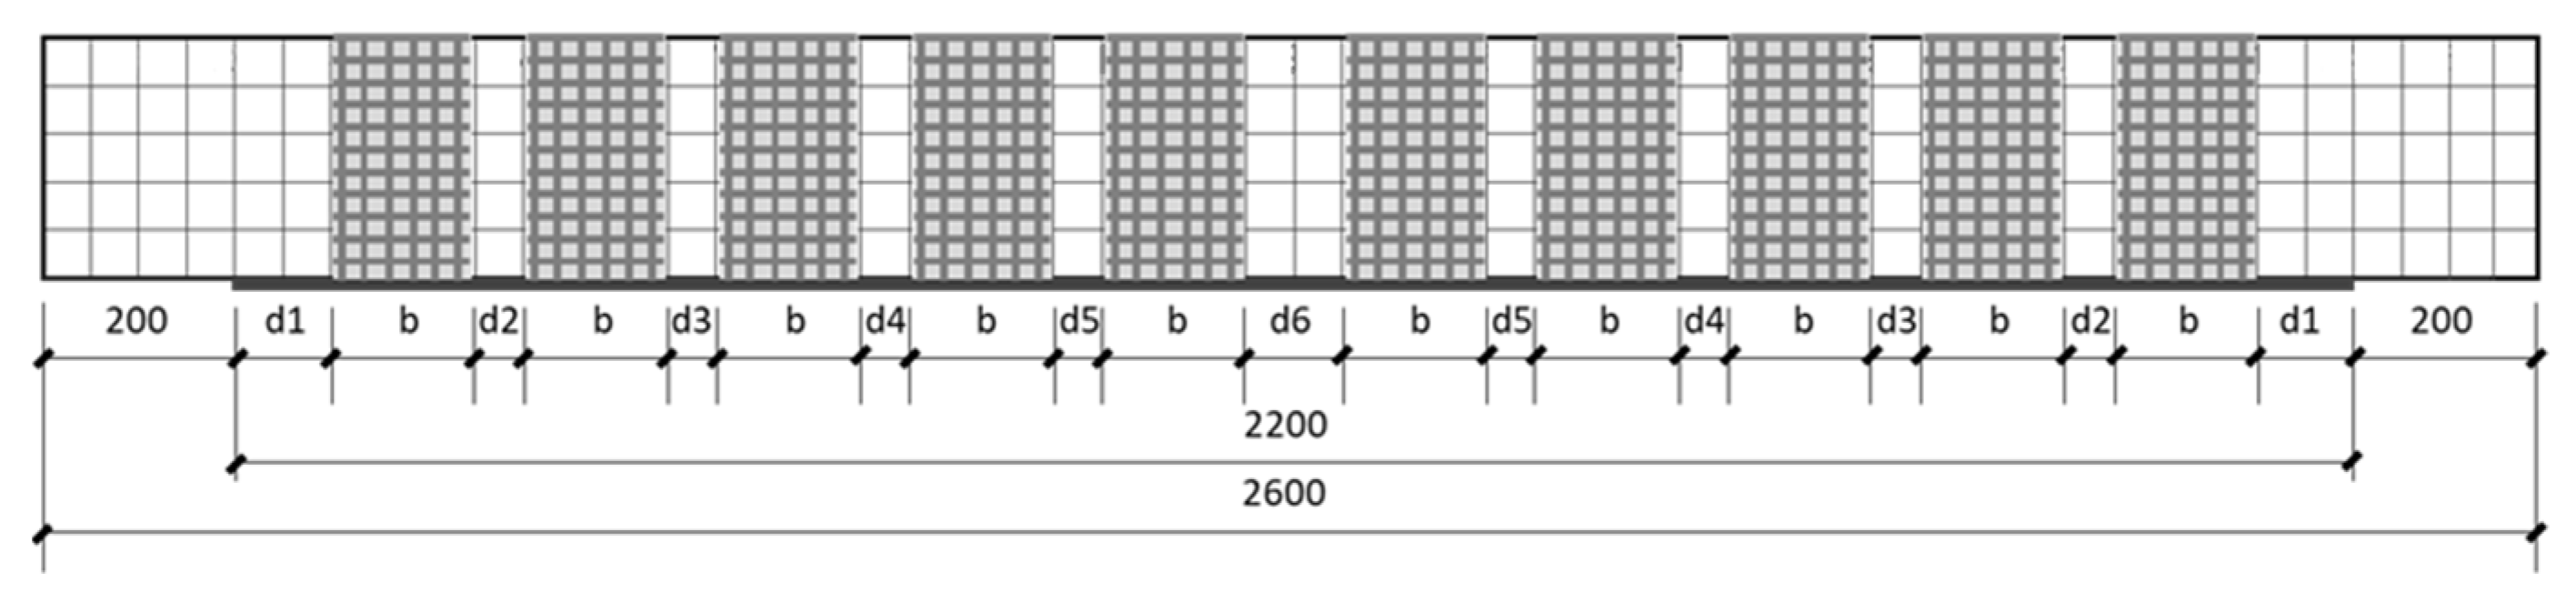
In this paper, we focused on optimizing the position of the symmetrically distributed U-hoop, so only the number of U-hoop groups, the distance d1 between the U-hoop and the end of the reinforcement layer at the bottom of the beam, and the distances d2, d3, d4, and d5 (
Figure 17) between adjacent U-hoops were selected as design variables. The span deflection and material use area of the reinforced beam were used as the objective functions to optimize the design, and by extracting the deflection and material area of the reinforced beam under the same load for weighted summation the optimal solution of the U-hoop reinforced beam position optimization problem could be calculated iteratively.
4.3.2. Optimization Process and Result Analysis
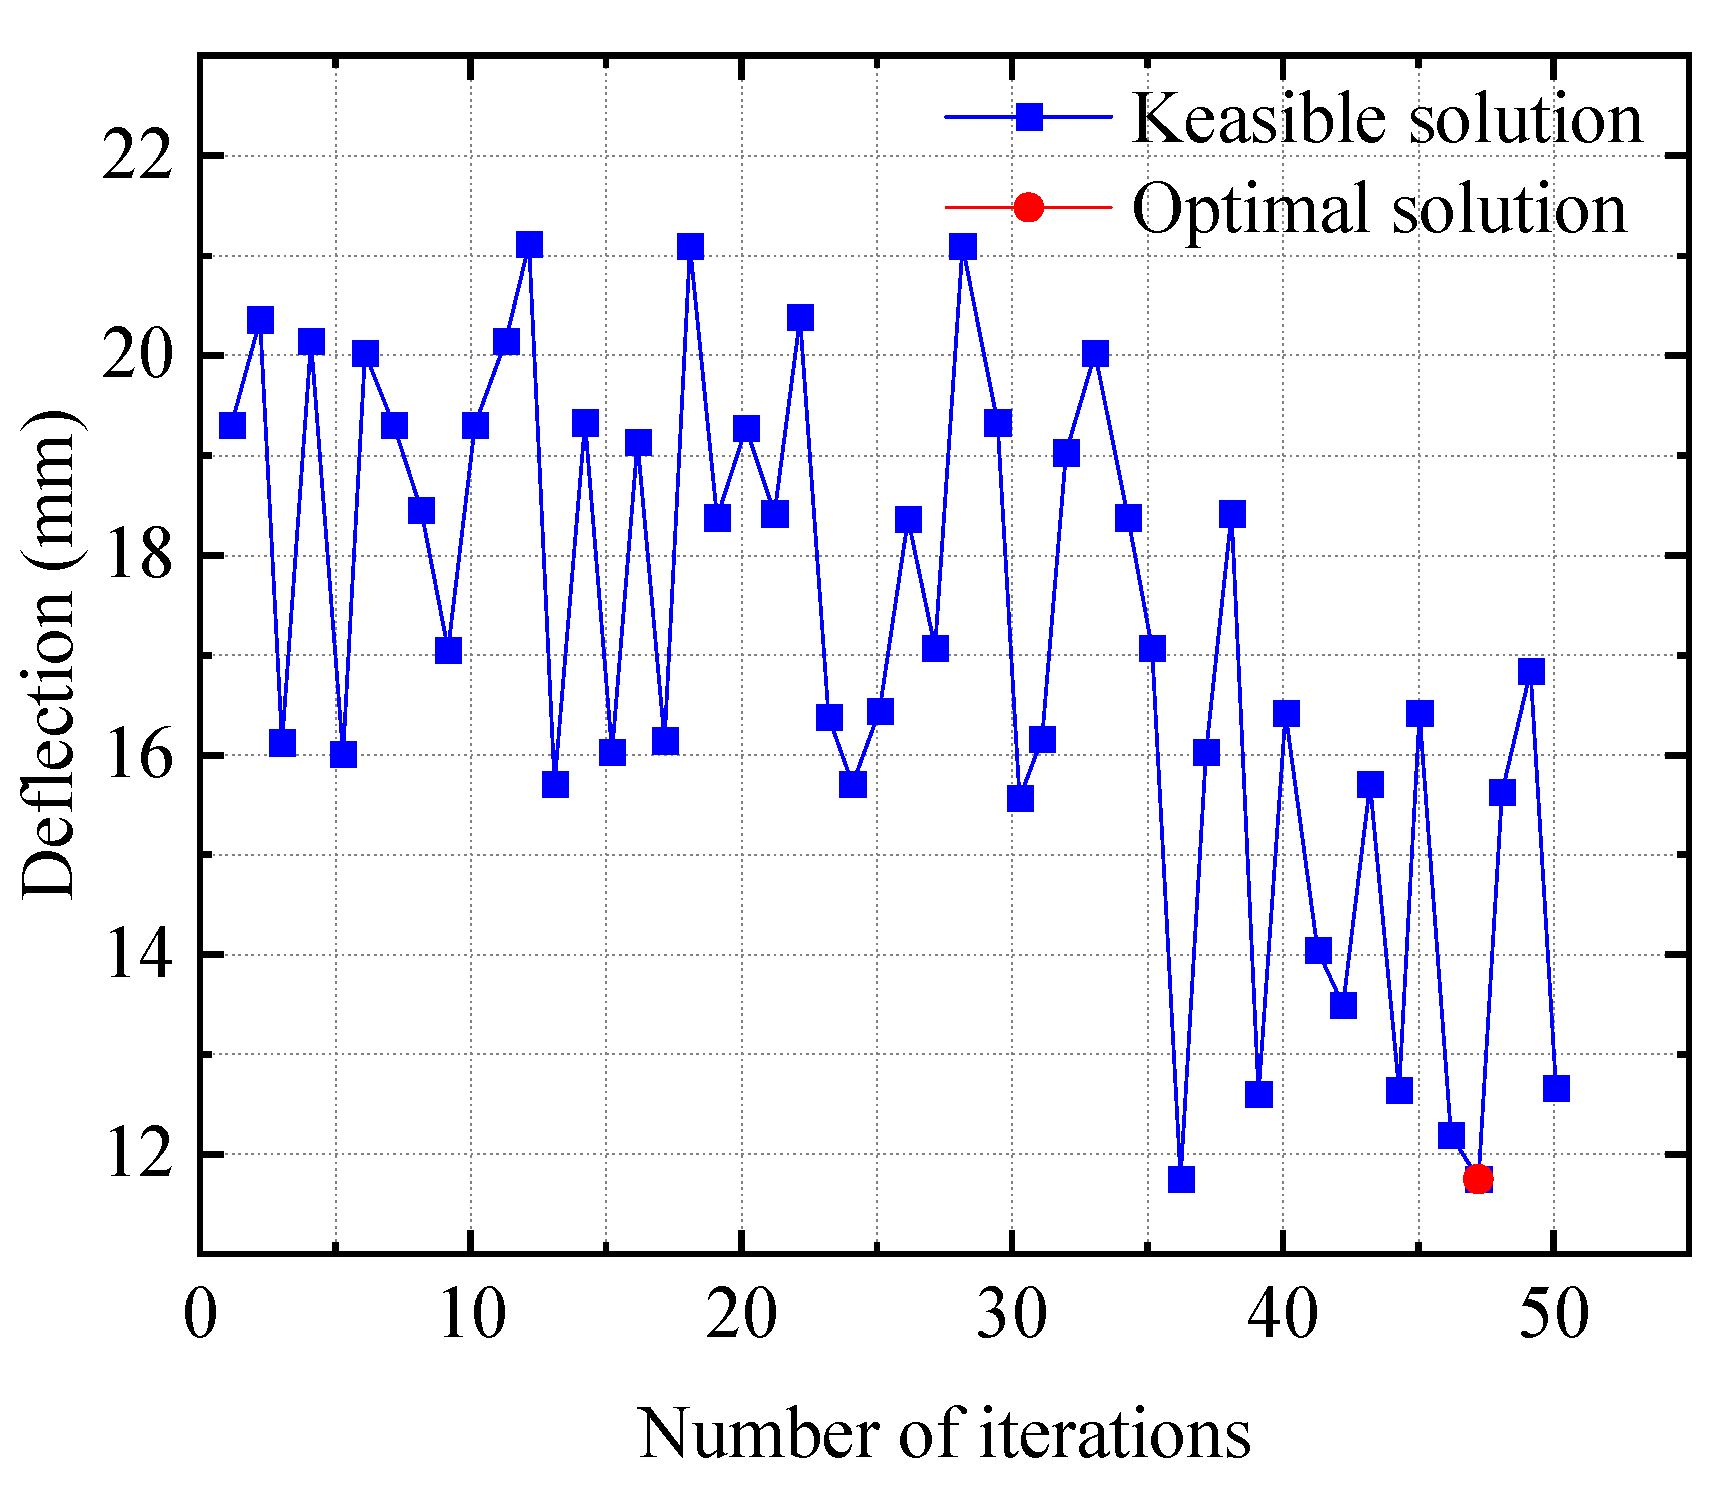
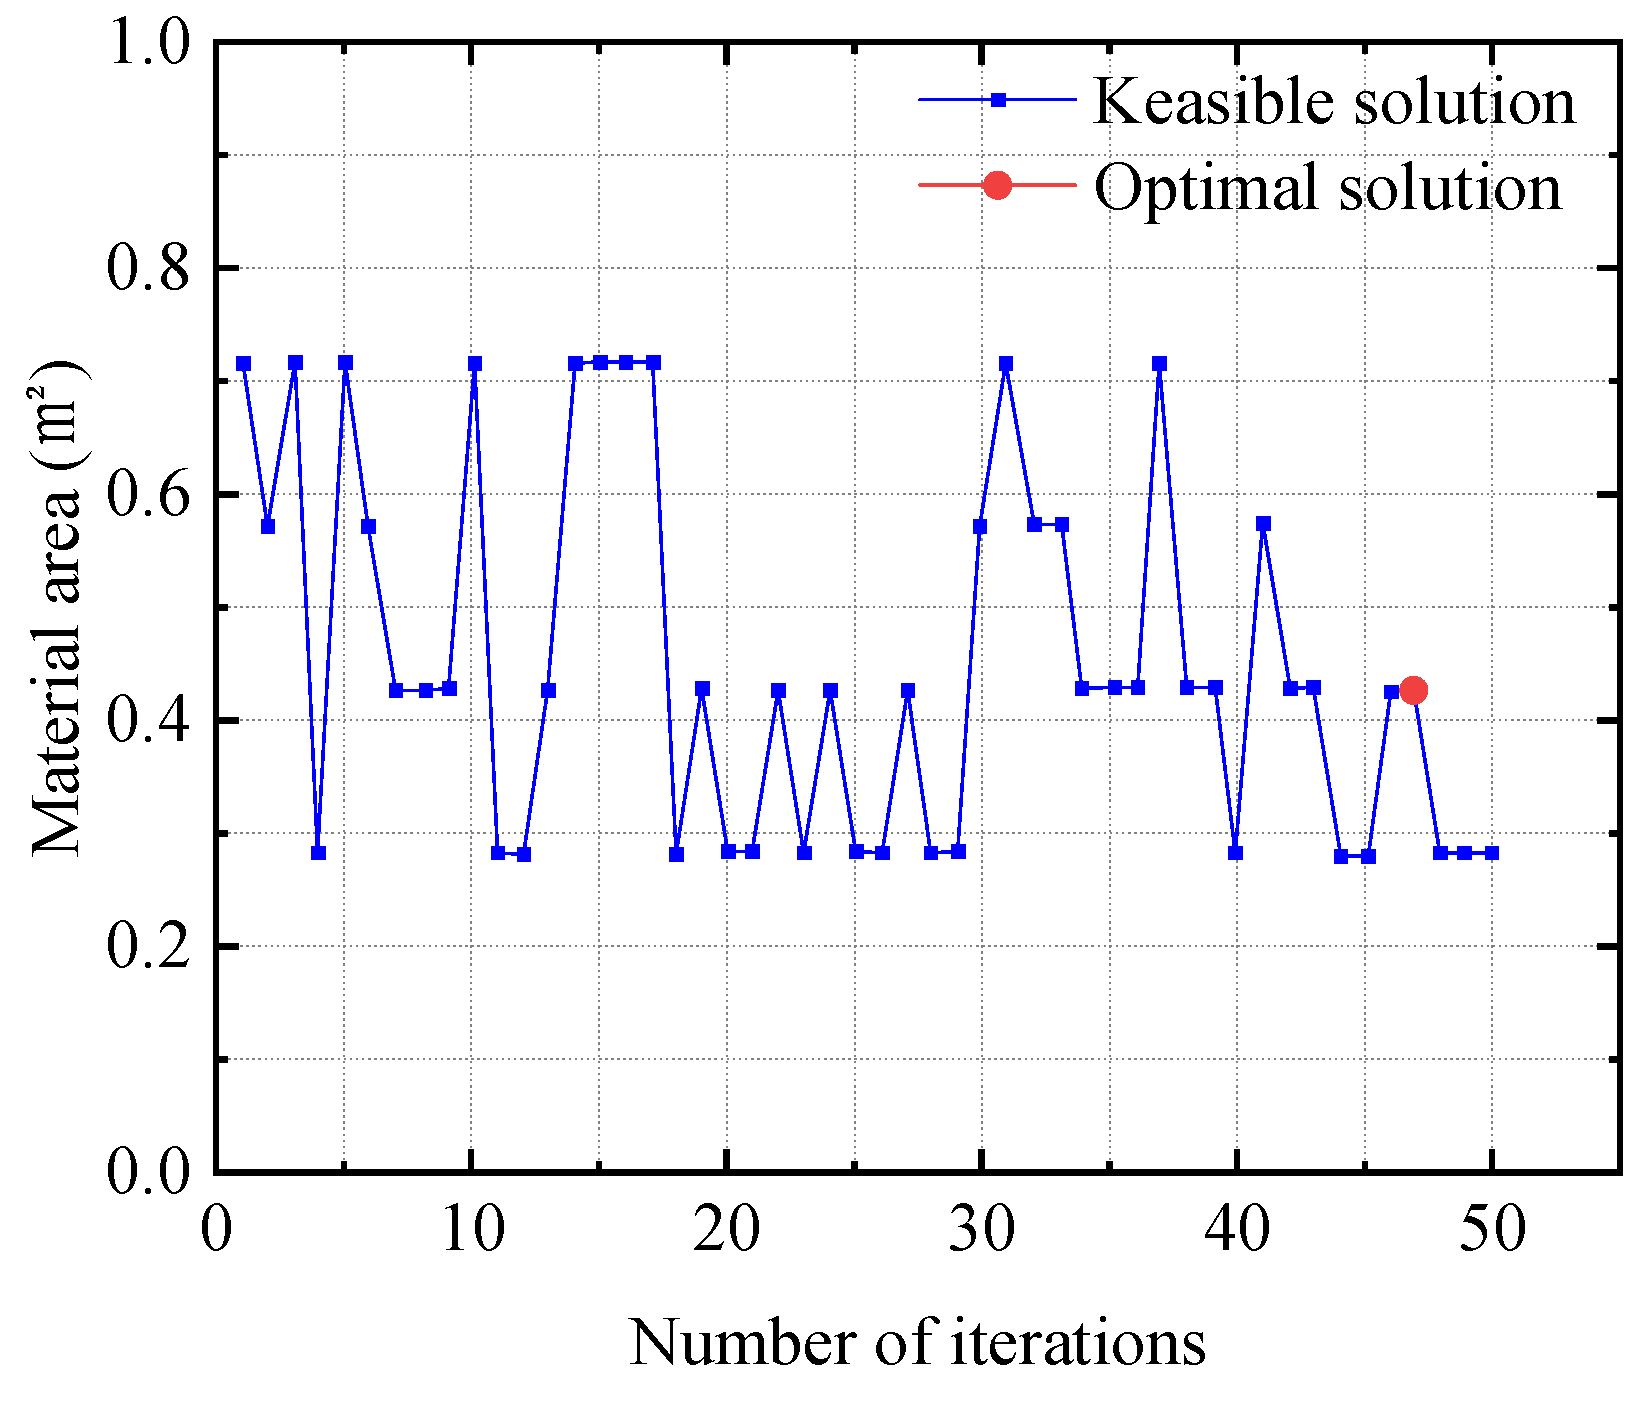
The multi-island genetic algorithm was optimized using an Isight (v2023) and ANASYS (v2023R1) joint simulation by running a Windows batch file to invoke the reinforced beam command stream directly. Initial population number P = 3, evolutionary generation T = 8, number of islands q = 2, crossover probability pc = 1, variation probability pm = 0.01, inter-island migration rate 0.5, and inter-island interval generation 5 were set. The variation in material quality and cost with the number of iterations during optimization is shown in
Figure 18 and
Figure 19.
From
Figure 18 and
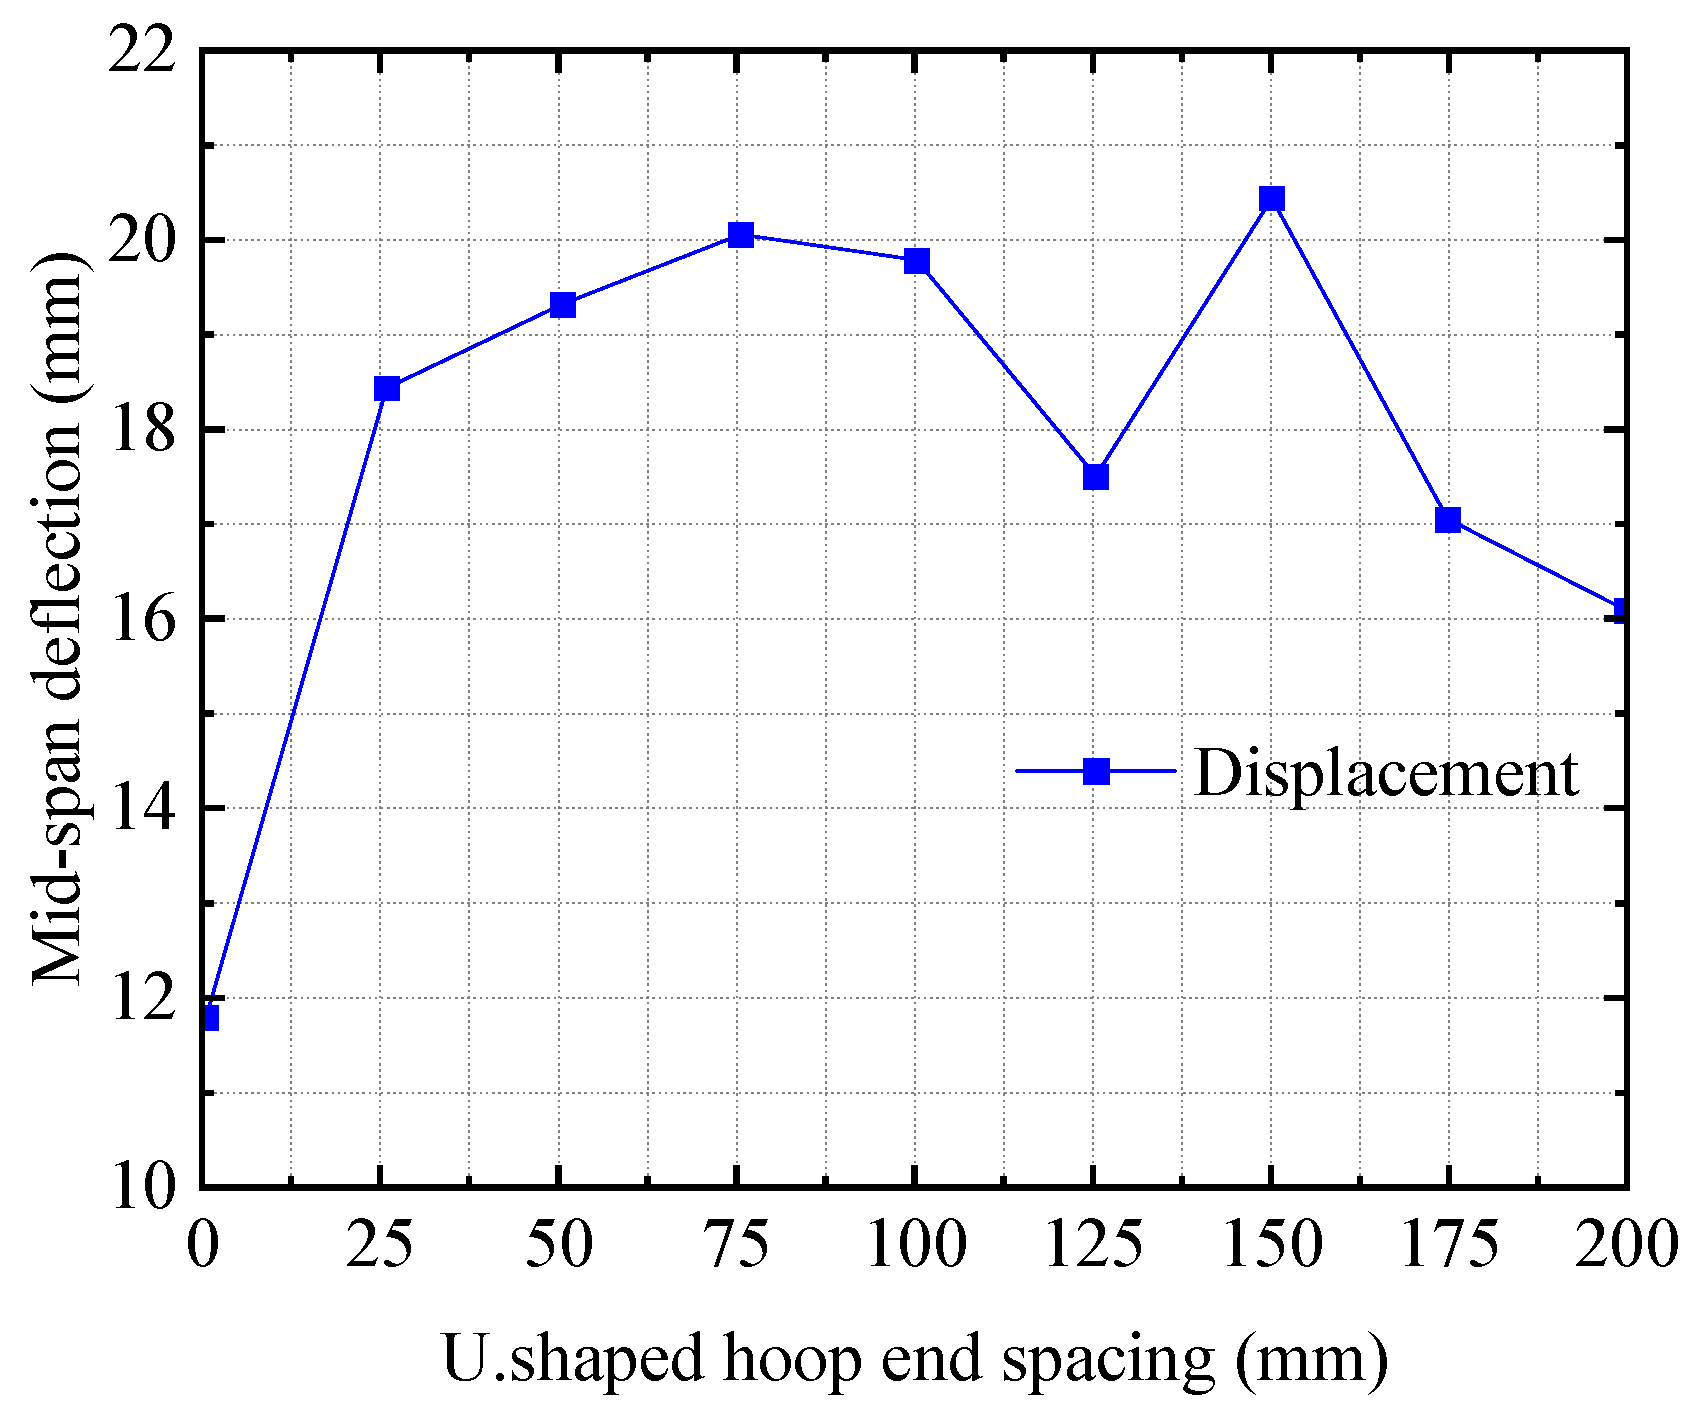
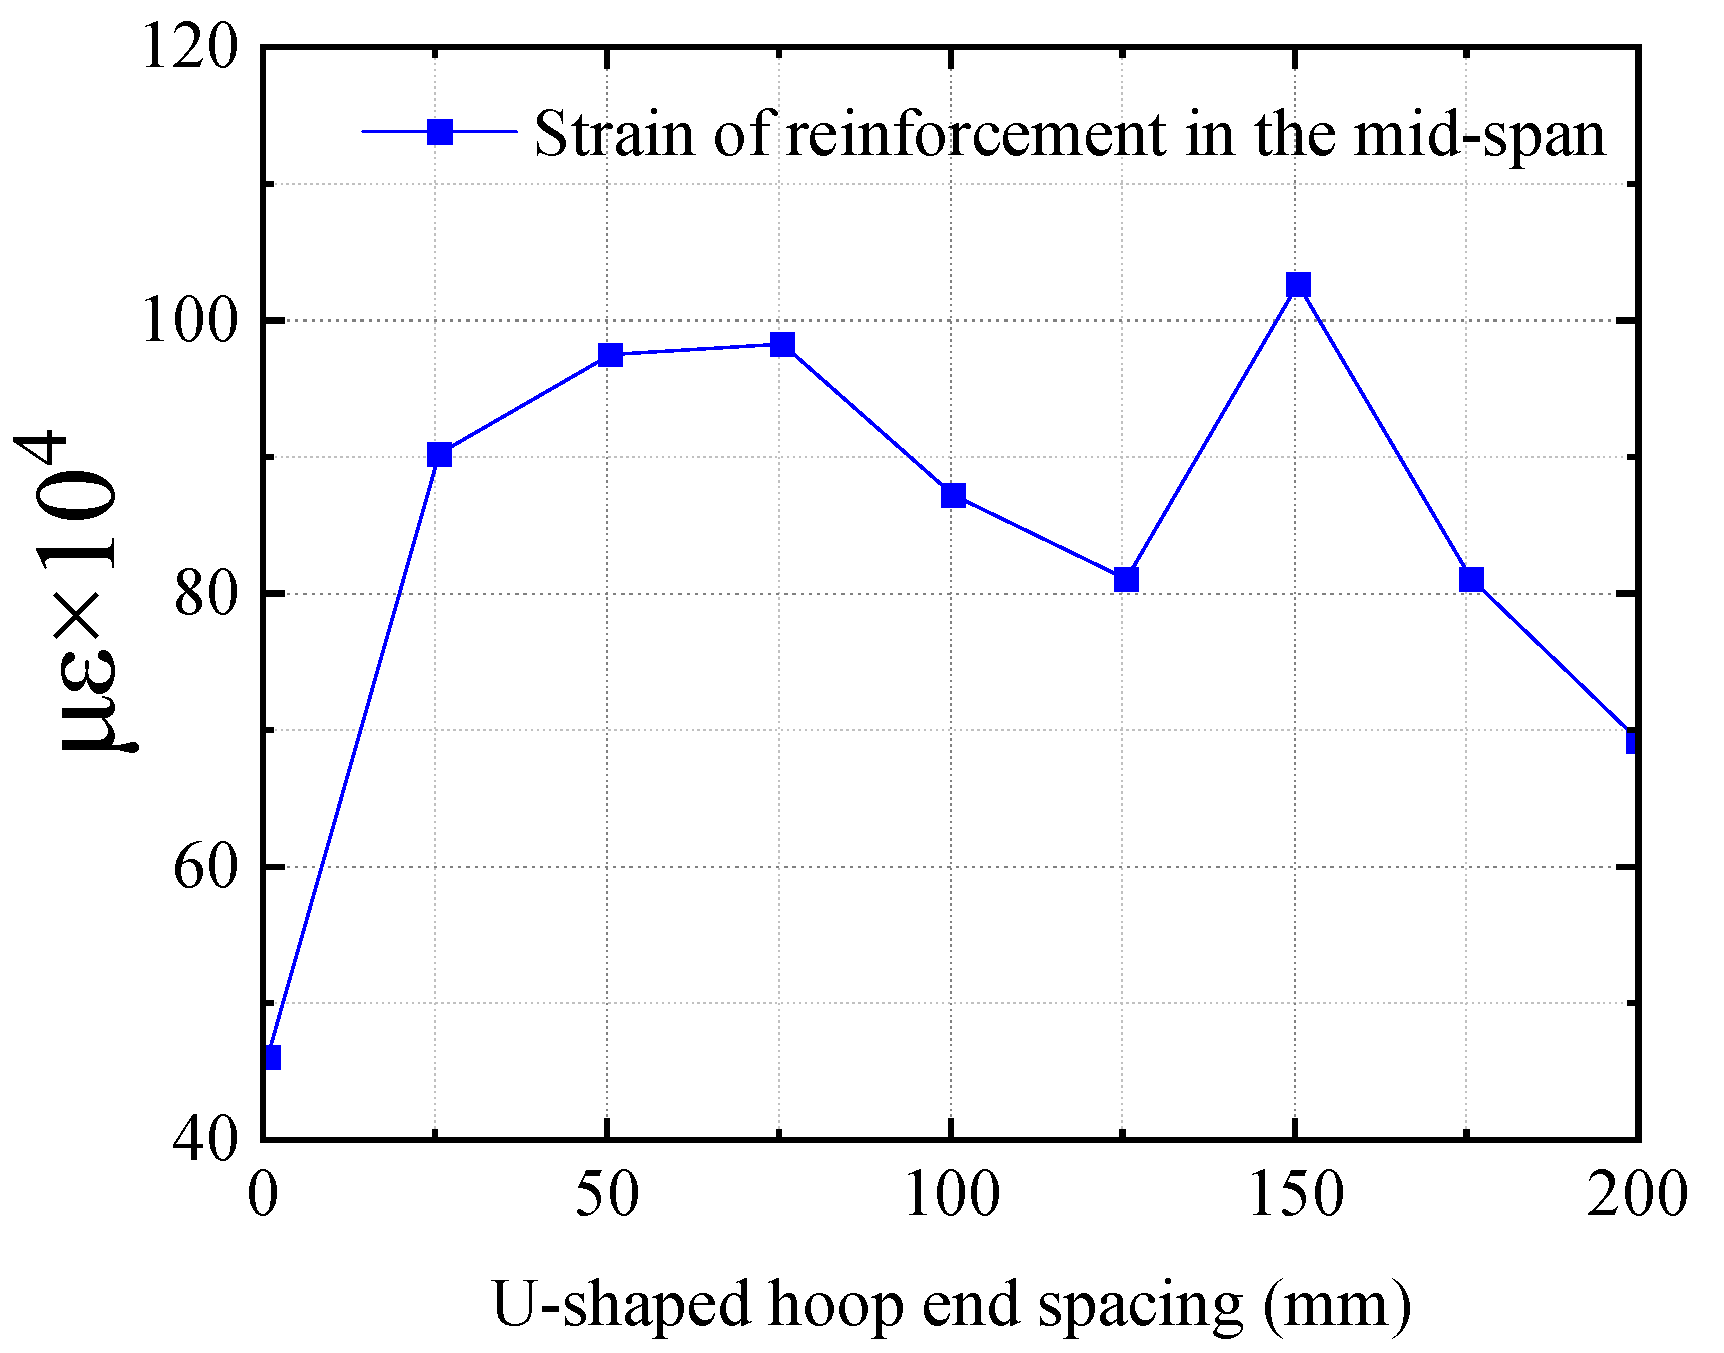
Figure 19, it can be seen that the inter-island migration effect of the multi-island genetic algorithm leads to significant local variations during the variable optimization process but does not affect the appearance of the optimal solution. When the end spacing d1 = 0, the number of U-hoop groups i = 3, the U-hoop spacing d2 = d3 = 50 mm, and d4 and d5 do not exist, the stress and deformation constraints are satisfied and the objective function value is relatively small, which is the optimal solution in the space range of the selected variables. The finite element models of the reinforced beam established with the selected set of design variables parameters and the maximum deflection and reinforcement strain in each reinforced beam span with the variation in U-hoop end spacing when only the end spacing d1 is changed are shown in
Figure 20 and
Figure 21.
As can be seen from the above
Figure 21, with an increase in U-hoop end spacing the span deflection and reinforcement strain of the reinforced beam increase significantly. The truncated end of the bottom reinforcement layer of the beam belongs to the local stress concentration area and is prone to end stripping damage. The anchoring of the U-hoop at the end of the bottom reinforcement layer effectively reduces the span deflection and reinforcement strain of the reinforced beam, which can better improve the structural stress and increase the bearing capacity. To sum up, for the arrangement of the U-hoop anchorage position of a two-way CFRP grid reinforced beam it is recommended to arrange three U-hoops continuously and symmetrically at both ends of the reinforced beam, and the U-hoops should be arranged at the end of the reinforcement layer at the bottom of the beam. The spacing between U-hoops should not be too large.


