
Understanding the Influence of Environmental Elements on Spatial Attractiveness in a Jiangnan Water Town Through Computer Vision Techniques


Abstract
1. Introduction
2. Literature Review
2.1. Research on Spatial Perception and Environmental Elements in Old Towns
2.2. Research on Environmental Elements Conducted Using Street-View Images
2.3. Research Gap
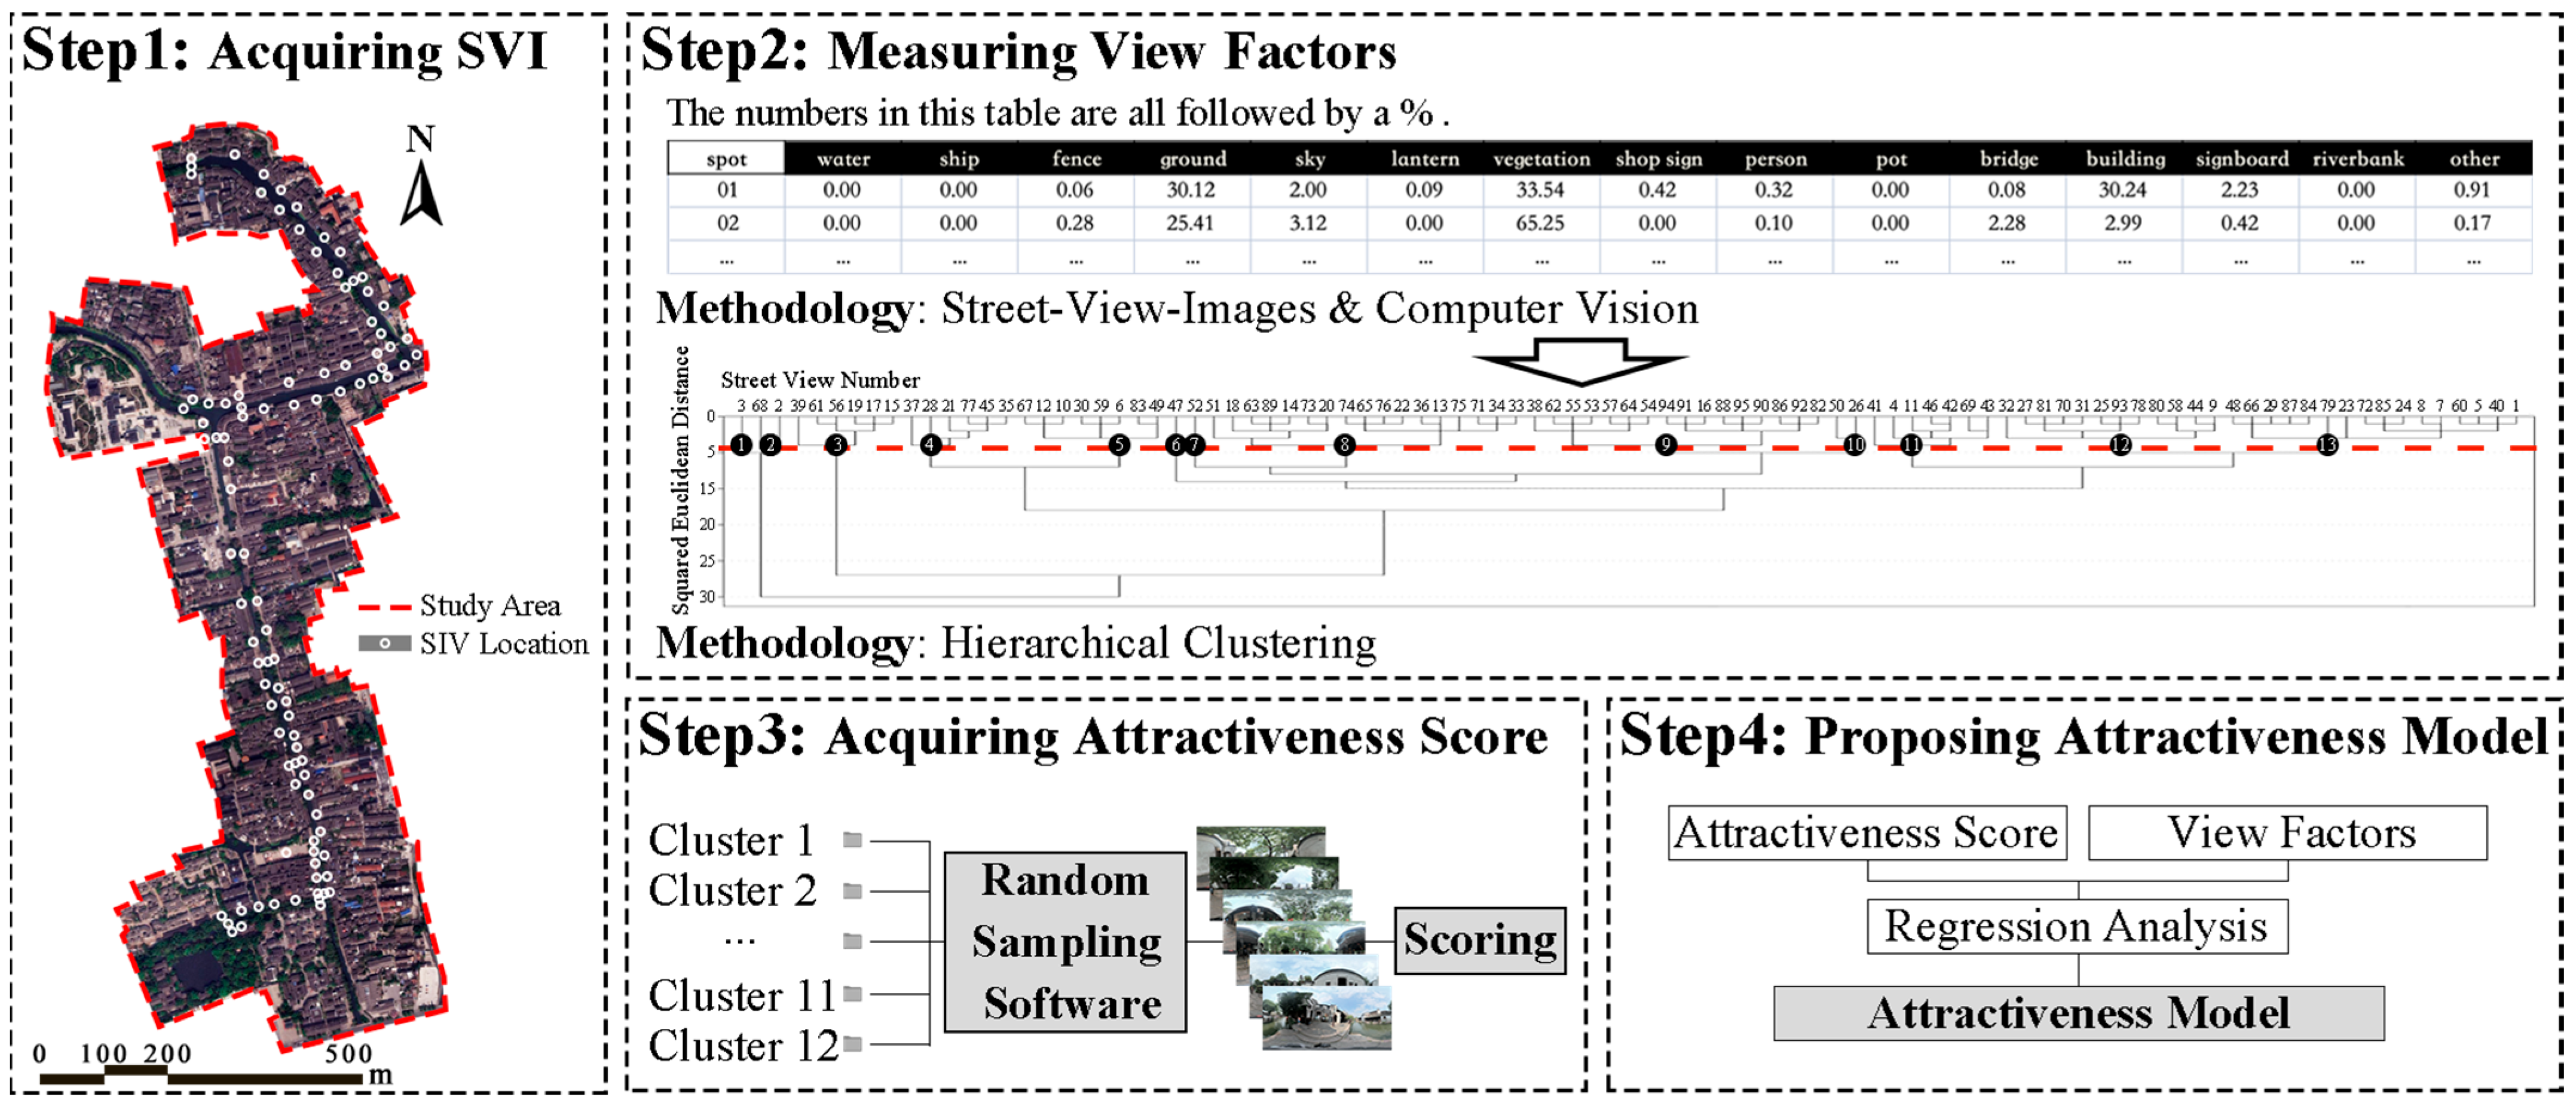
3. Methodology
3.1. Research Framework
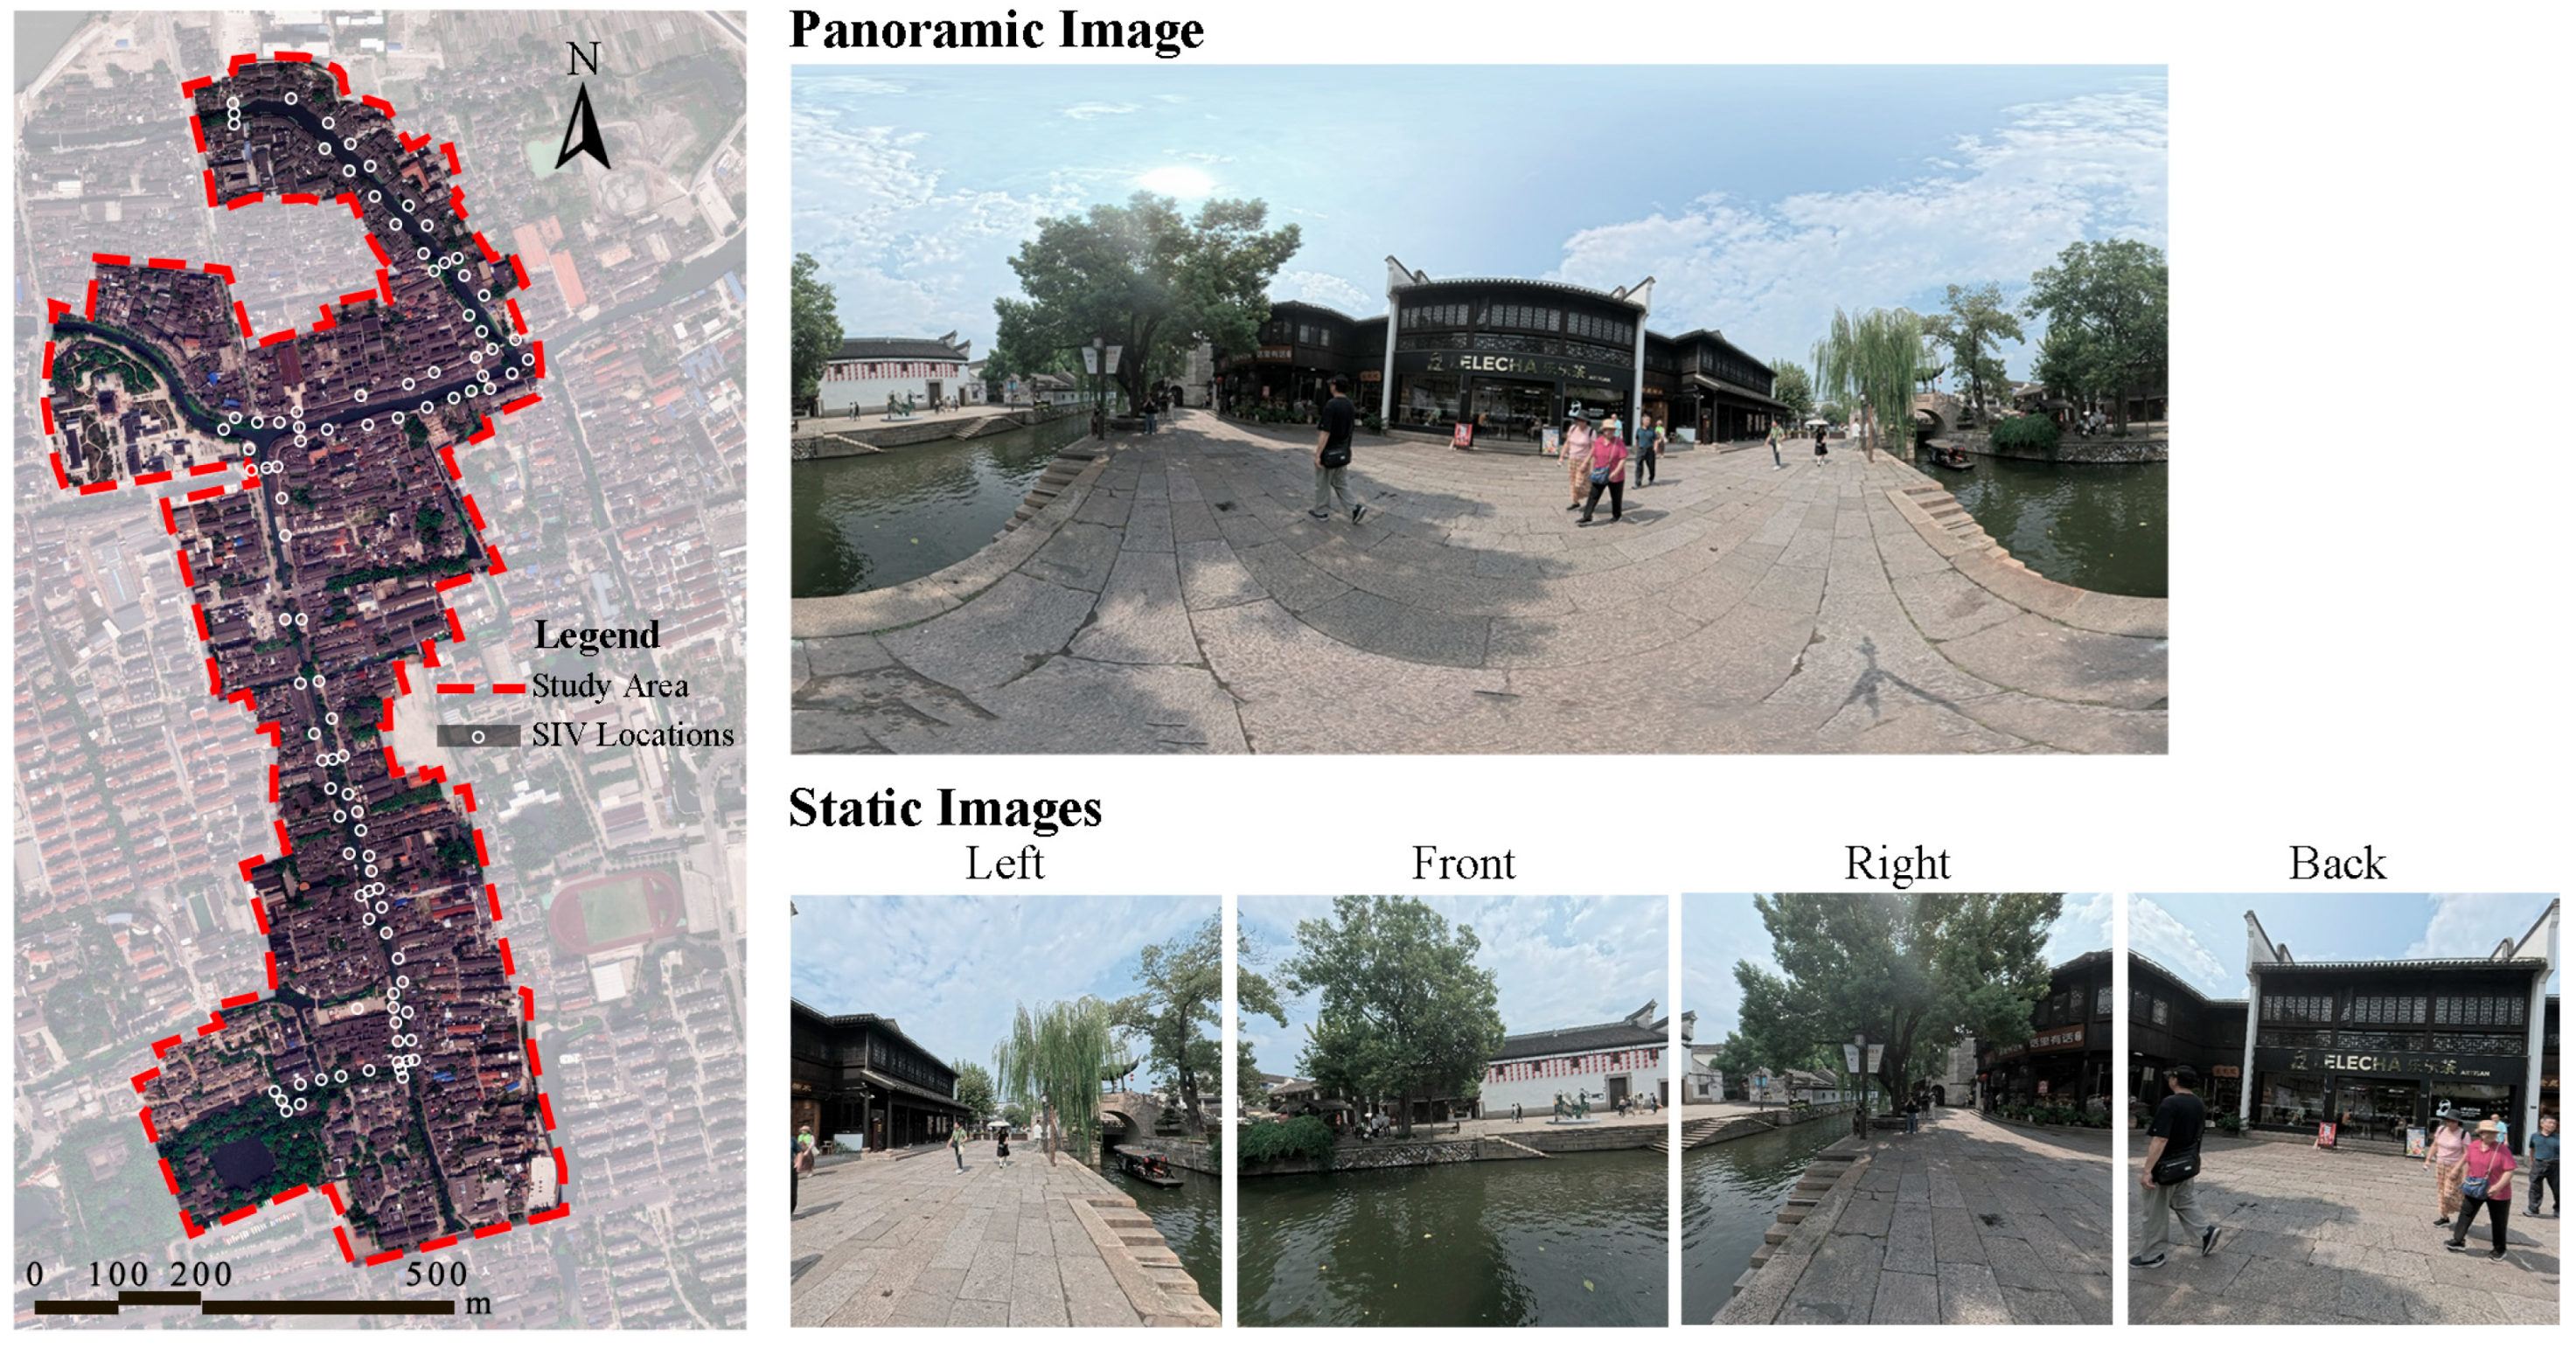
3.2. Study Area
3.3. Data Collection
3.3.1. Acquiring Street-View Images
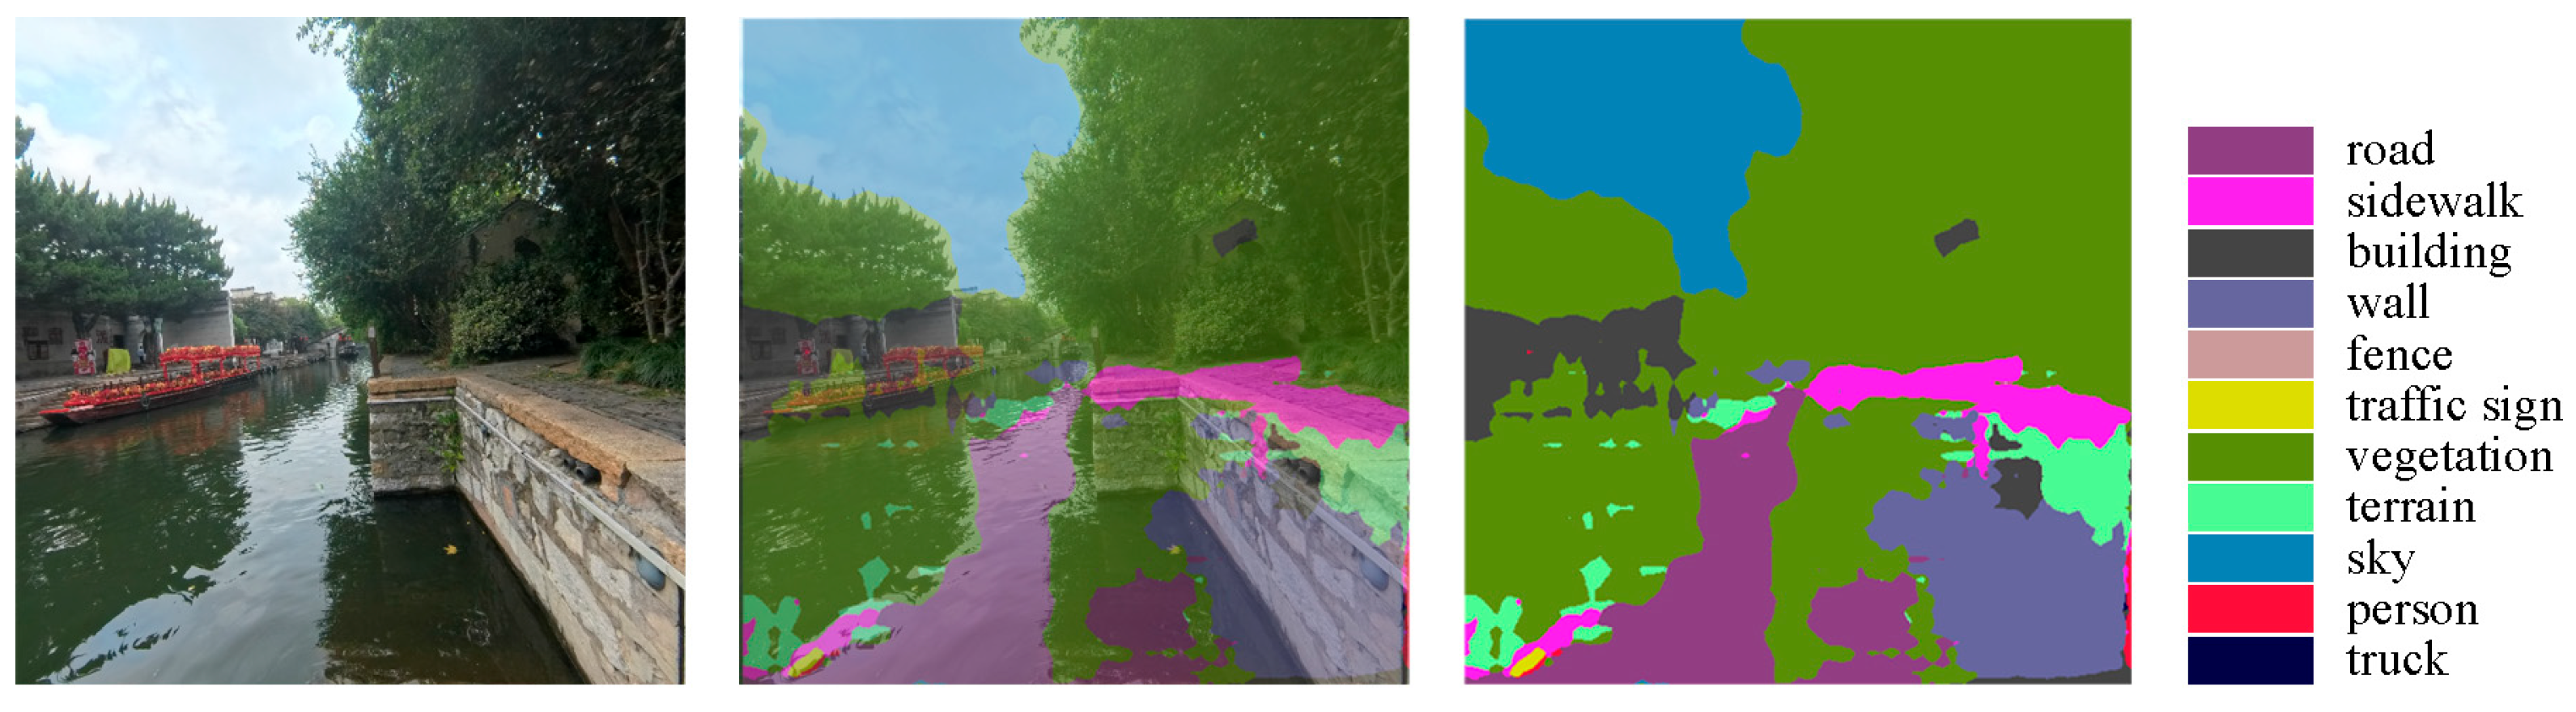
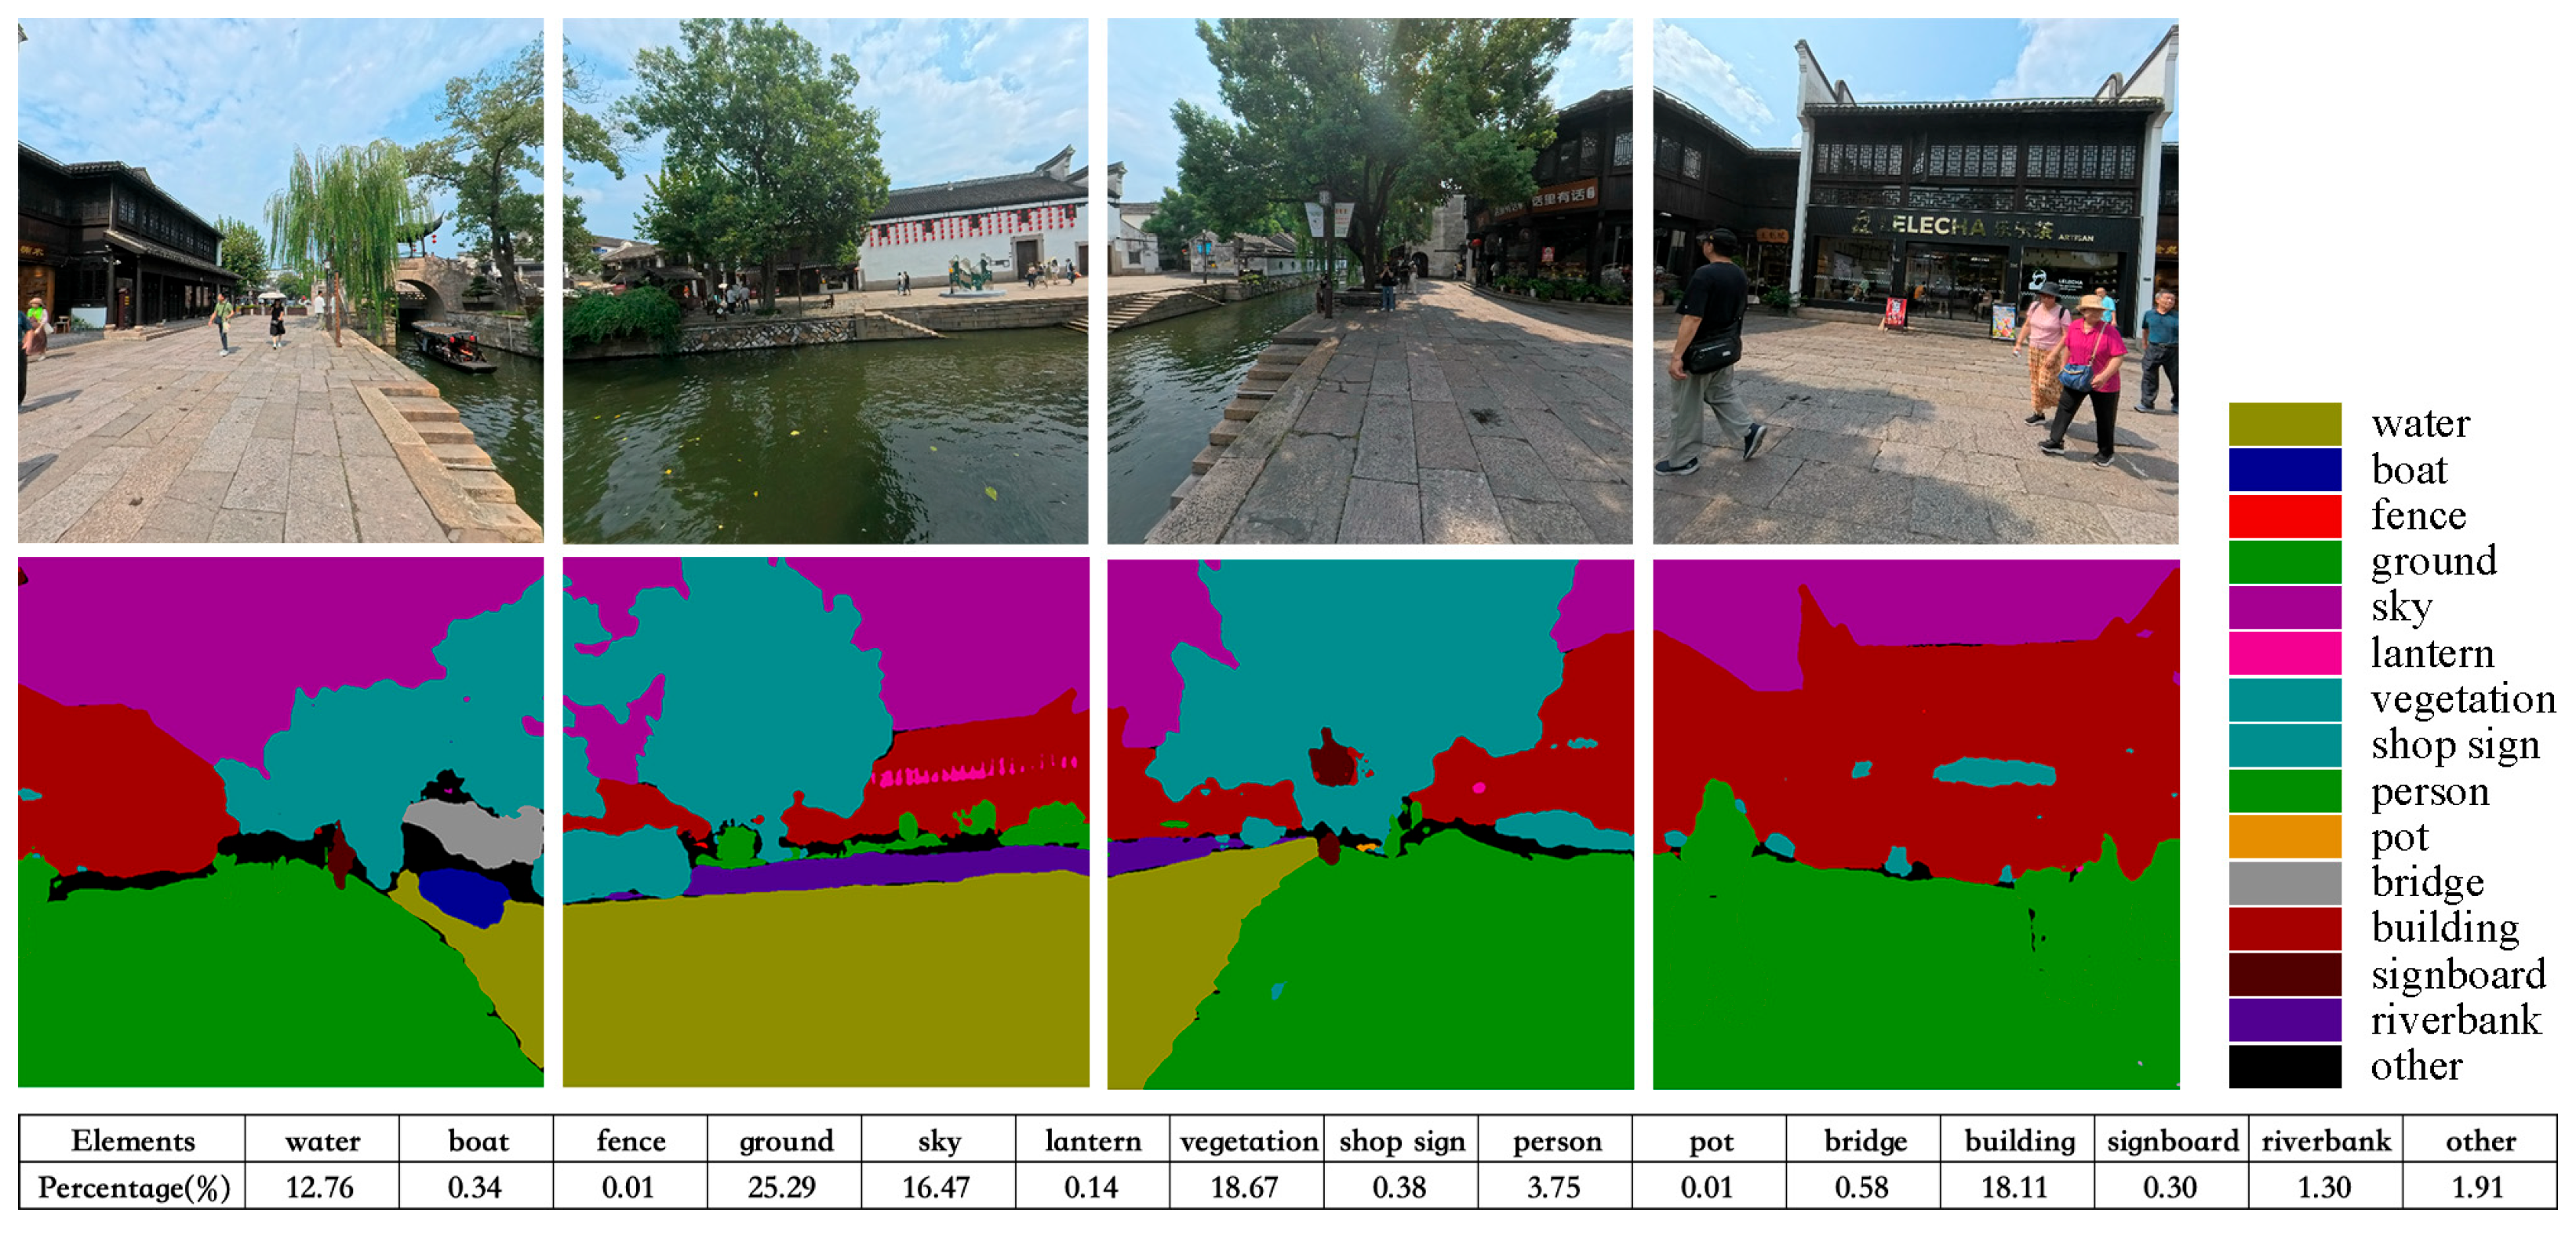
3.3.2. Semantic Segmentation
3.3.3. Acquiring Attractiveness Score
3.4. Establishing the Evaluation Model
4. Results
4.1. Validation of the Attractiveness Model
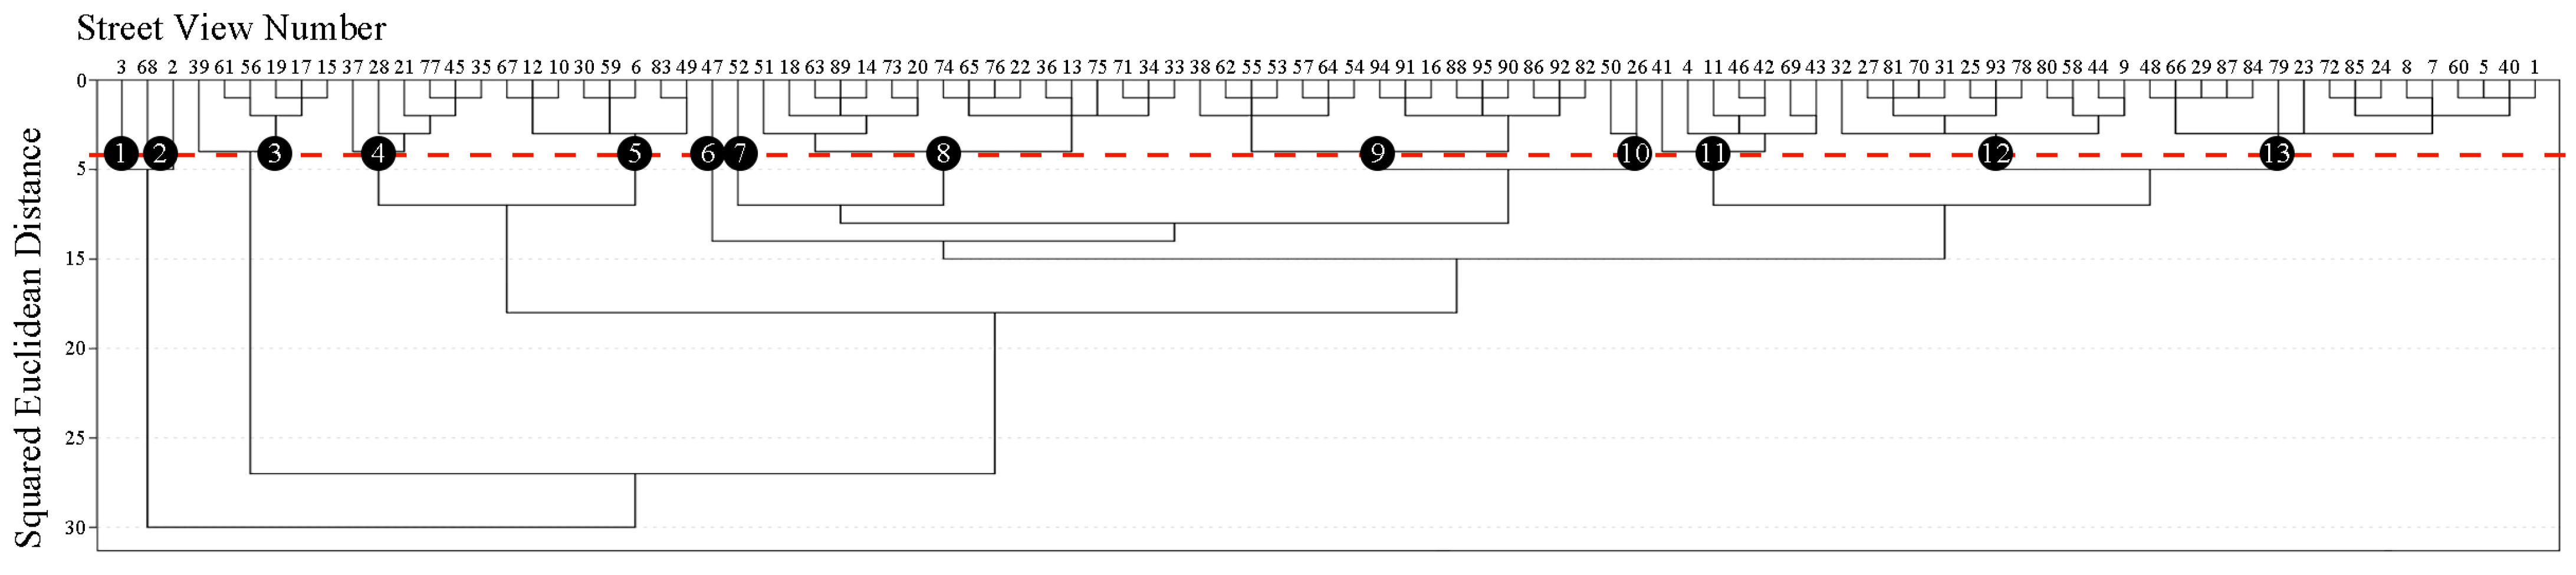
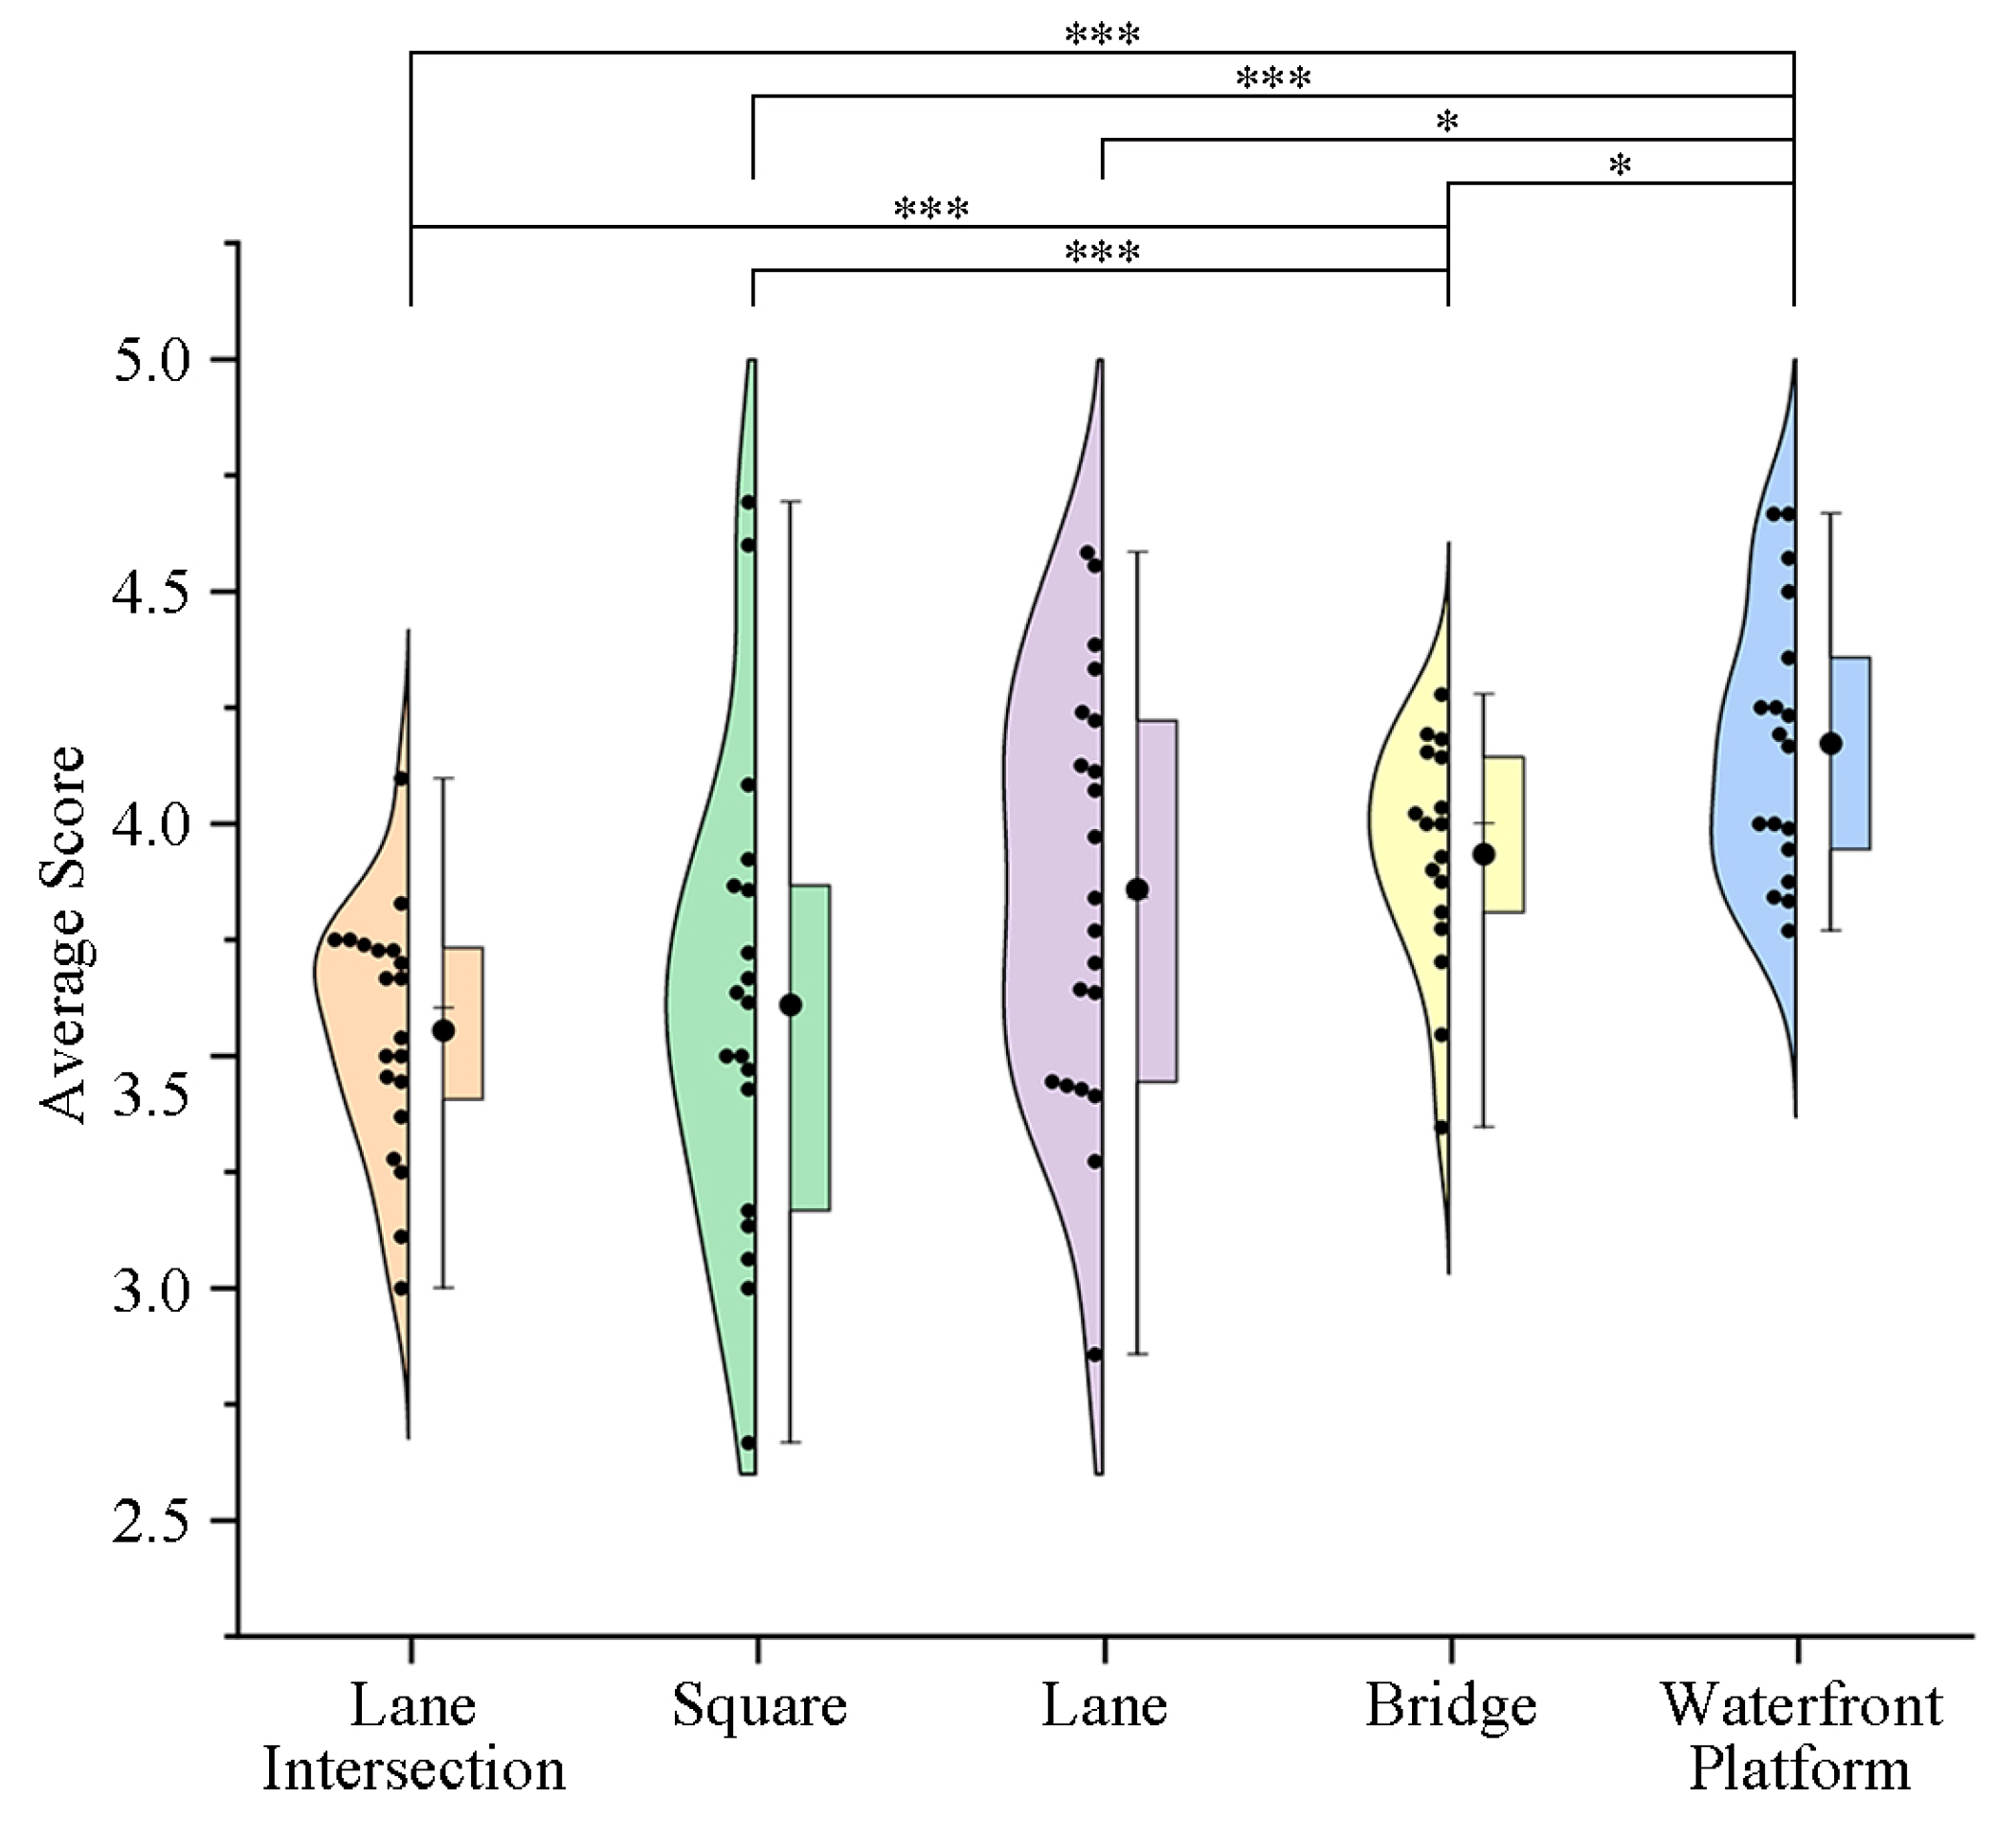
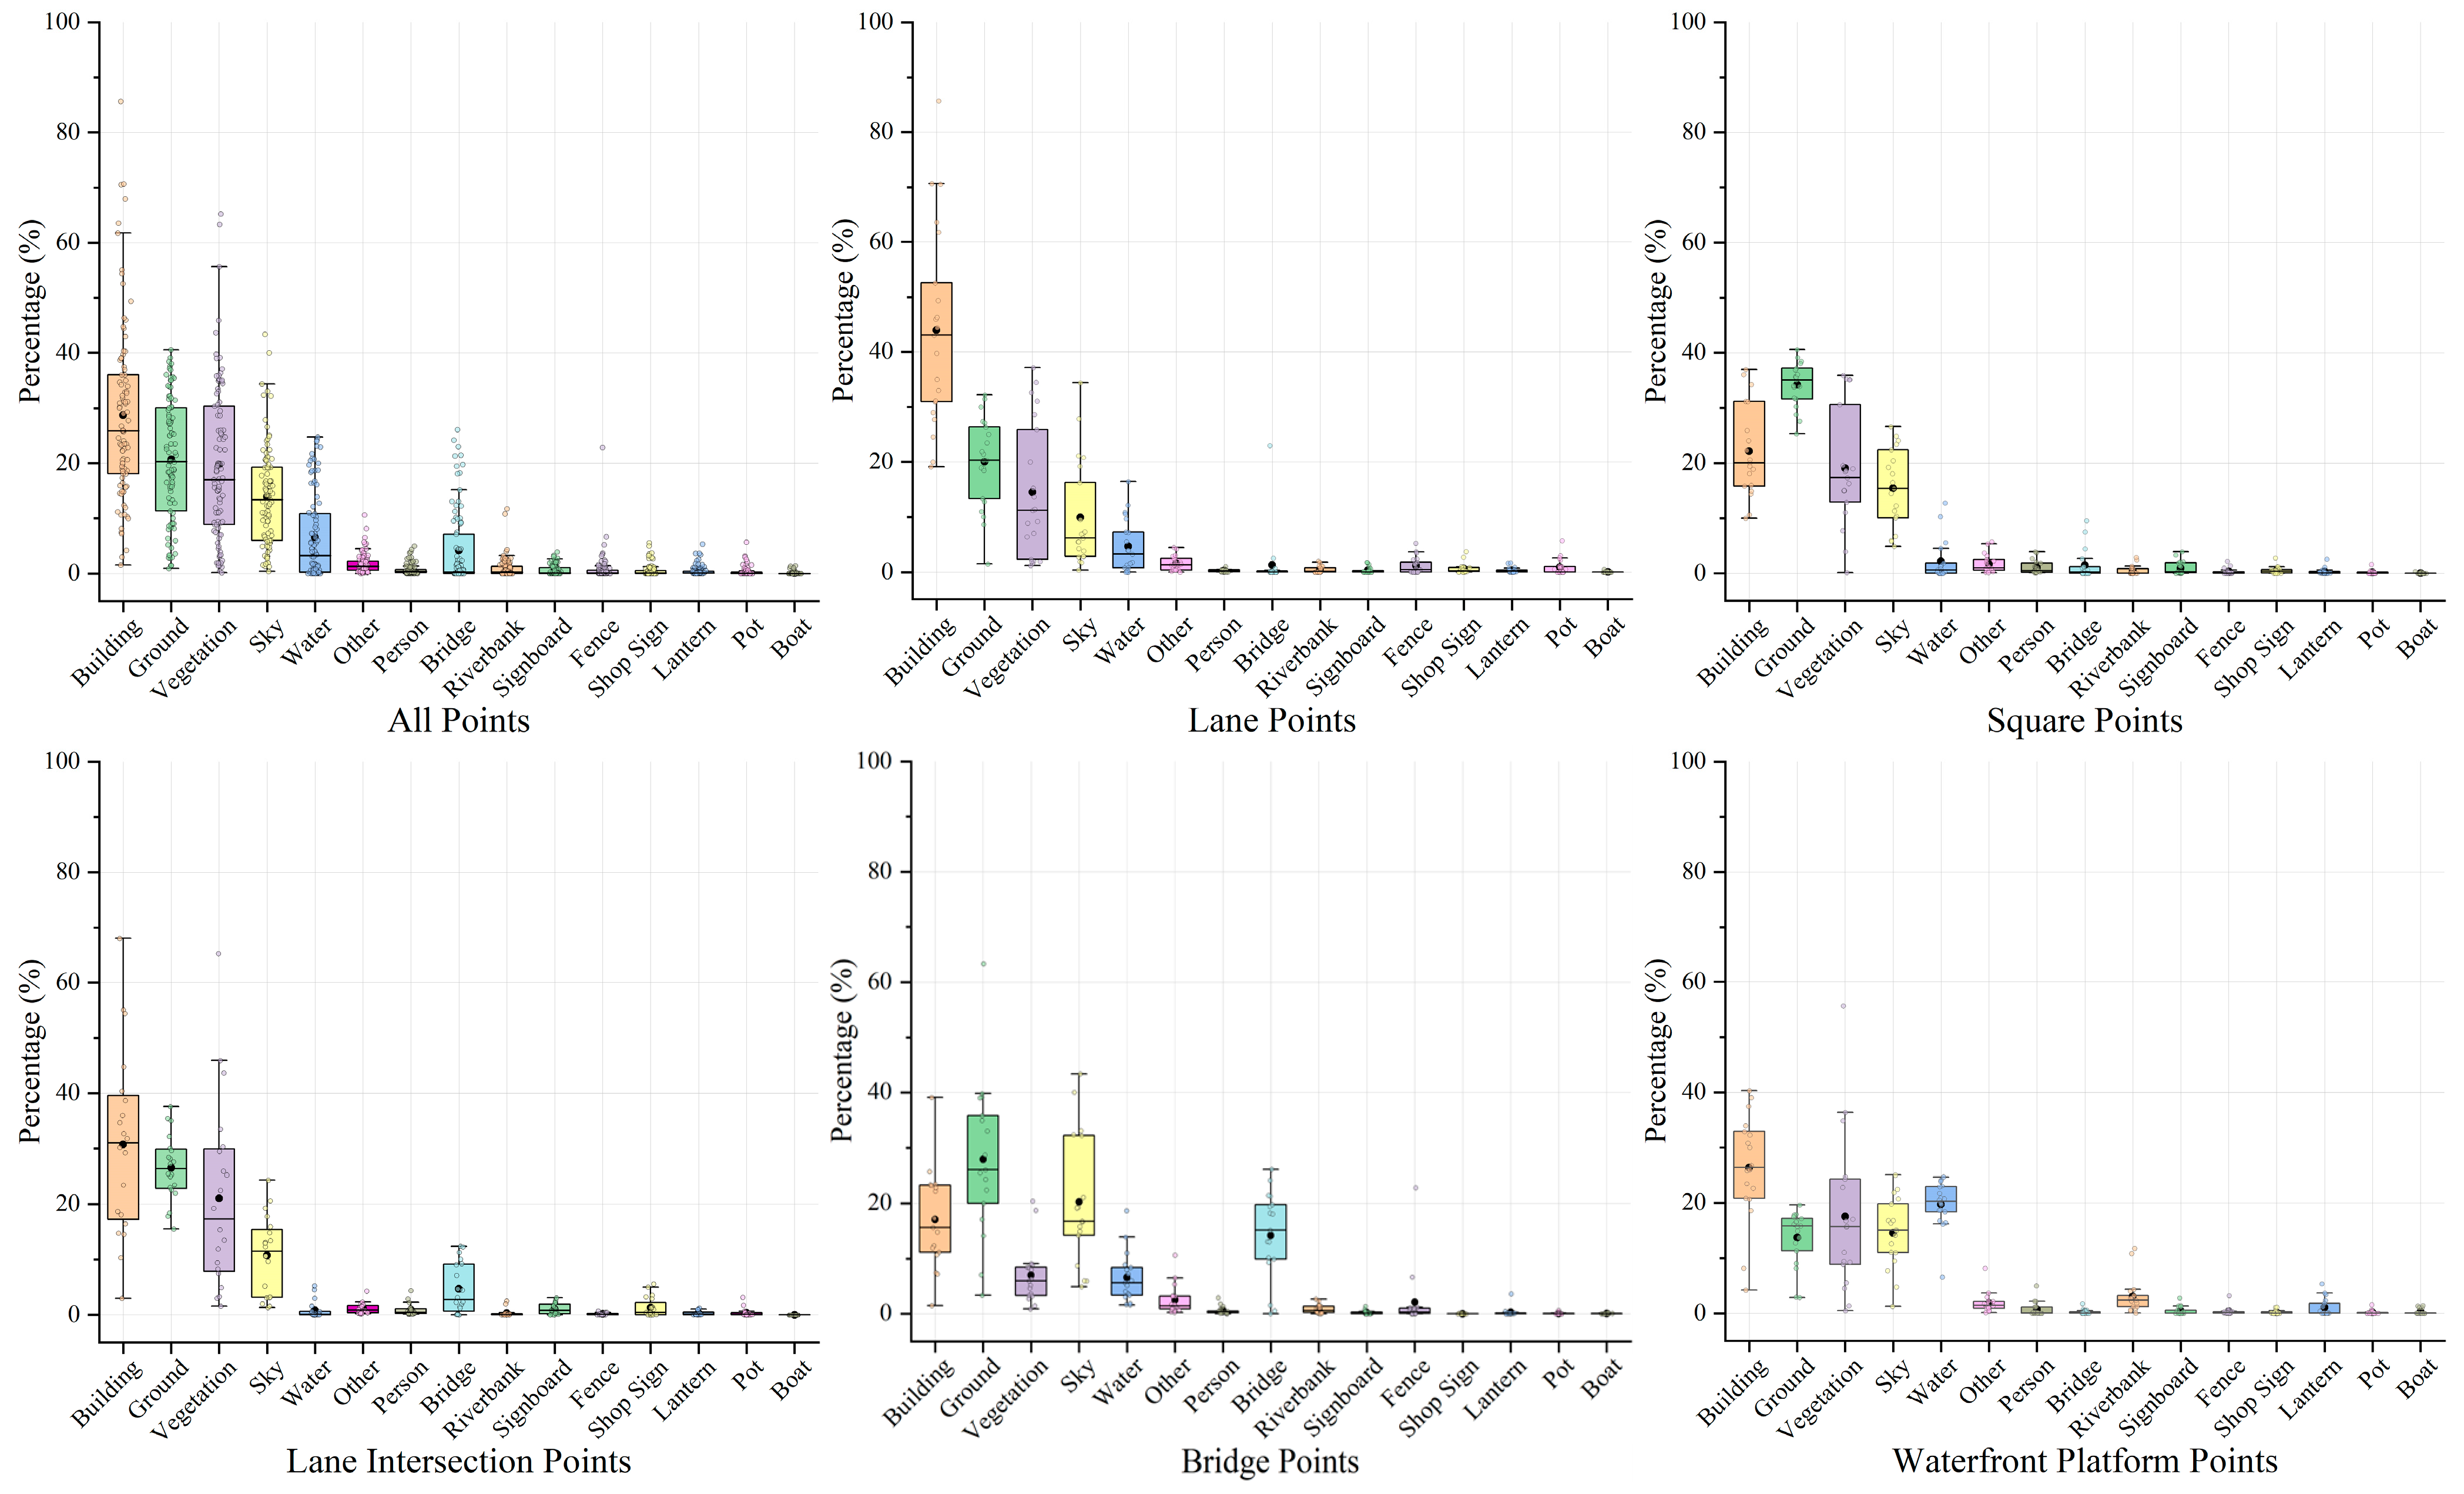
4.2. Spatial Distribution
4.3. Importance and Correlation Analysis
4.4. SHAP Values of Environmental Elements
5. Discussion
5.1. Variations in Space-Defining Element Proportions Leading to Different Spatial Imagery
5.2. Proper Organization of Foreground Elements to Enhance Water Town Atmosphere
5.3. Viewing Distance and Angle Influencing the Perceived Attractiveness of Environmental Elements
5.4. Policy Recommendations
5.5. Limitations
6. Conclusions
Author Contributions
Funding
Institutional Review Board Statement
Informed Consent Statement
Data Availability Statement
Conflicts of Interest
References
- Zhao, Y.; Zhang, J.; Lu, S.; Liu, Z. Further study on the evaluation index system for historic villages and townships taking the second group of Chinese historic townships (villages) as example. Archit. J. 2008, 55, 64–69. (In Chinese) [Google Scholar] [CrossRef]
- Zhang, L.; Yang, K.; Liu, B.; Liu, S. A study on the regional characteristics perception of ancient towns in the south of the Yangtze river based on different perspectives of tourists and residents: A case study of Tongli Ancient Town. Chin. Landsc. Archit. 2019, 35, 10–16. (In Chinese) [Google Scholar] [CrossRef]
- Kim, J.-H.; Ritchie, J.R.B. Cross-cultural validation of a memorable tourism experience scale (MTES). J. Travel Res. 2014, 53, 323–335. [Google Scholar] [CrossRef]
- Lew, A.A. A framework of tourist attraction research. Ann. Tour. Res. 1987, 14, 553–575. [Google Scholar] [CrossRef]
- Shi, Z.; Qi, W. Research on tourists’ real perception, satisfaction, and willingness to revisit in imitation ancient town tourist attraction. Tour. Res. 2024, 16, 45–55. (In Chinese) [Google Scholar] [CrossRef]
- Zhao, S.; Marzuki, A.; Rong, W.; Ran, X. An empirical application of the consumer-based authenticity model in heritage tourism of the George Town historic district, Penang, Malaysia. Heliyon 2024, 10, e38254. [Google Scholar] [CrossRef]
- Zhang, F.; Ye, T.; Liu, Q. Vitality construction of traditional waterfront blocks from the perspective of “space behavior”, taking the traditional waterfront blocks in the ancient city of Suzhou as an example. Chin. Anc. City 2020, 34, 45–51. (In Chinese) [Google Scholar] [CrossRef]
- Zhou, X.; Cui, L.; Chen, S.; Tan, Z. The experience evaluation of urban landscape of historical & cultural blocks based on eye-tracking: A case study of Yongqingfang, Guangzhou. Chin. Landsc. Archit. 2023, 39, 54–57. (In Chinese) [Google Scholar] [CrossRef]
- Song, Z.; Liu, J.; Ge, G. Evaluation of spatial visual attraction of Huayang Ancient Town landscape based on analytic hierarchy process. Urban. Archit. 2019, 16, 100–101, 113. (In Chinese) [Google Scholar] [CrossRef]
- Liu, L.; Sevtsuk, A. Clarity or confusion: A review of computer vision street attributes in urban studies and planning. Cities 2024, 150, 105022. [Google Scholar] [CrossRef]
- Lynch, K. The Image of the City; MIT Press: Cambridge, MA, USA, 1960. [Google Scholar]
- Rossi, A. L’architettura Della Città; II Saggiatore: Milan, Italy, 2018. (In Italian) [Google Scholar]
- Venturi, R.; Brown, D.S.; Izenour, S. Learning from Las Vegas: The Forgotten Symbolism of Architectural Form; MIT Press: Cambridge, MA, USA, 1977. [Google Scholar]
- Kaplan, S.; Kaplan, R. Cognition and Environment: Functioning in an Uncertain World; Praeger: New York, NY, USA, 1982. [Google Scholar]
- Hildebrand, G. Origins of Architectural Pleasure; University of California Press: Berkeley, CA, USA, 1999. [Google Scholar]
- Relph, E. Place and Placelessness; Pion: London, UK, 1976. [Google Scholar]
- Rapoport, A. The Meaning of the Built Environment: A Nonverbal Communication Approach, 2nd ed.; University of Arizona Press: Tucson, AZ, USA, 1990. [Google Scholar]
- Proshansky, H.M.; Fabian, A.K.; Kaminoff, R. Place-identity: Physical world socialization of the self. J. Environ. Psychol. 1983, 3, 57–83. [Google Scholar] [CrossRef]
- Davidson, J.; Milligan, C. Embodying emotion, sensing space: Introducing emotional geographies. Soc. Cult. Geogr. 2004, 5, 523–532. [Google Scholar] [CrossRef]
- Ma, T.; Li, X.; Xie, Y. Old wine in new bottle? The myth of tourist satisfaction measurement. Tour. Trib. 2017, 32, 53–63. (In Chinese) [Google Scholar] [CrossRef]
- Hyunju, J.; Harumi, I.; Yoshifumi, M. Physiological and psychological benefits of viewing an autumn foliage mountain landscape image among young women. Forests 2022, 13, 1492. [Google Scholar] [CrossRef]
- Sun, D. (Ed.) A Study on the Landscape Imagery of Linpan Settlements in Western Sichuan; Sichuan University Press: Chengdu, China, 2019; p. 1. (In Chinese) [Google Scholar]
- Wang, K.; Meng, C.Y.; Lin, Q. Landscape image perception of ancient towns along the Grand Canal: Analysis based on network text data. Archit. Creat. 2024, 36, 184–191. (In Chinese) [Google Scholar]
- Li, Y.; Chen, X.; Liu, P.; Huang, G. Research on image perception of heritage tourist destinations from the three-dimensional perspective of “cognition-emotion-integrity”: Taking Xiangjiang Ancient Town group as an example. Hum. Geogr. 2021, 36, 167–176. (In Chinese) [Google Scholar] [CrossRef]
- Wu, C.; Shao, X. Analysis of tourism image perception of ancient villages based on UGC and questionnaire data—A case of Qikou Ancient Town. J. Arid Land Resour. Environ. 2020, 34, 195–200. (In Chinese) [Google Scholar] [CrossRef]
- Wu, L.; Huang, Z.; Tan, Z.; Hou, B.; Chen, X. Tourism impact perception of residents in jiangnan ancient town and its formation mechanism: A case study of Tongli. Hum. Geogr. 2015, 30, 143–148. (In Chinese) [Google Scholar] [CrossRef]
- Huang, H.; Zhang, W.; Zhao, M.; Zou, Y.; Zhang, Q. Exploration of image cognitive differentiation and social association in semi-urbanization areas: A case study based on the ancient town of Shawan in Guangzhou. South Archit. 2023, 43, 24–34. (In Chinese) [Google Scholar] [CrossRef]
- Chen, Q.; Han, G. Typical tourism image elements of Sanhe Ancient Town analyzed from the tourist gaze perspective: Based on the zaltman metaphor elicitation technique. J. Southwest Jiaotong Univ. (Soc. Sci.) 2023, 24, 89–103. (In Chinese) [Google Scholar] [CrossRef]
- Xu, X.; Xu, C.; Gao, J. Using VEP method to understand tourists’ perception on ancient water towns in Southern Yangtze River: A case study of Shanghai Fengjing Ancient Town. Areal Res. Dev. 2017, 36, 121–126. (In Chinese) [Google Scholar] [CrossRef]
- Dong, X.; Sun, H.; Liang, J. The Non-Visual perceptions: Foundation and reconstruction of the genius loci—A case of Yunshuiyao Old Town in Fujian. Hum. Geogr. 2022, 19, 32–35. (In Chinese) [Google Scholar] [CrossRef]
- Shen, H.; Aziz, N.F.; Lv, X. Using 360-degree panoramic technology to explore the mechanisms underlying the influence of landscape features on visual landscape quality in traditional villages. Ecol. Inform. 2025, 86, 103036. [Google Scholar] [CrossRef]
- Shen, H.; Aziz, N.F.; Huang, M.; Yu, L.; Liu, Z. Tourist perceptions of landscape in Chinese traditional villages: Analysis based on online data. J. Tour. Cult. 2024, 22, 232–251. [Google Scholar] [CrossRef]
- Shen, H.; Aziz, N.F.; Omar, S.I.; Huang, M.; Zhang, X.; Yu, L. Tourism’s impact on visual landscape: Residents’ perceptions from a traditional Chinese village. Pol. J. Environ. Stud. 2024, 33, 4707–4719. [Google Scholar] [CrossRef]
- Xiao, J.; Zhang, R.; Liu, S.; Liu, S.; Jia, K. The landscape perception study and flowing scenes setting of historic towns based on the ‘Bag of Photographic Words’ Model: A case study of Qingyan Historic Town. Dev. Small Cities 2023, 41, 22–32, 40. (In Chinese) [Google Scholar] [CrossRef]
- Zhao, Y.; Lin, J.; Liu, Y. Research on visual evaluation of tourism scenery based on eye movement experiment: A case of Tangjia Ancient Town in Zhuhai. Hum. Geogr. 2020, 35, 130–140. (In Chinese) [Google Scholar] [CrossRef]
- Li, M.; Yan, Y.; Ying, Z.; Zhou, L. Measuring villagers’ perceptions of changes in the landscape values of traditional villages. ISPRS Int. J. Geo-Inf. 2024, 13, 60. [Google Scholar] [CrossRef]
- Bi, F.; Liu, J.; Lin, B. Research on the construction strategy of cultural tourism space based on landscape visual attraction—A case study of Guanzhong historical and cultural Block. Chin. Landsc. Archit. 2023, 39, 84–89. (In Chinese) [Google Scholar] [CrossRef]
- Wang, X.; Jia, D. The analysis of contemporary on constructing strategy in traditional settlements and architectural space: The thought of water system of landscape and architecture space changes in Huizhou Hongcun. Huazhong Archit. 2011, 29, 83–85. (In Chinese) [Google Scholar] [CrossRef]
- Zhang, L.; Zhang, B.; Kou, H. Tourist perception of ancient town landscape in the area south of Yangtze River based on NLP of online comments Data. Chin. Urban For. 2022, 20, 125–132. (In Chinese) [Google Scholar] [CrossRef]
- Tang, S.; Zhou, S. Roles of text in placeness construction: Analysis on core literature of cultural geography in recent years. Sci. Geogr. Sin. 2011, 31, 1159–1165. (In Chinese) [Google Scholar] [CrossRef]
- Yu, G.; Chen, T.; Huang, L.; Xiao, J. The landscape characteristics and renovation strategies of historical neighborhoods in the ancient City of Shaoxing: A case of the typical historical neighborhoods. Urban. Archit. 2024, 21, 26–29. (In Chinese) [Google Scholar] [CrossRef]
- Han, F.; Ma, Y.; Huang, S.; Wang, S. The double construction of human settlements and regional culture: A review of domestic waterfront spaces research from the perspective of historical inheritance. Trop. Geogr. 2023, 43, 2369–2380. (In Chinese) [Google Scholar] [CrossRef]
- Zhao, H.; Sun, Y. Landscape and its topological regeneration of Nancheng Historical Blocks in Wuchang from the perspective of the “Embankment-Street” evolution. South Archit. 2024, 44, 69–77. (In Chinese) [Google Scholar] [CrossRef]
- Zhu, F.; Teng, Y. Research on Place-Making Approaches in Urban Waterfront Historical Districts: A Case Study of Qiaoxi, Dadou Road, and Xiaohezhi Street in Hangzhou. New Arts 2020, 41, 93–98. (In Chinese) [Google Scholar]
- Yang, C.; Zhou, Y.; Lu, D. Evaluation of the street space atmosphere of historic towns by semantic differential method: The case of Luocheng. New Archit. 2018, 36, 102–107. (In Chinese) [Google Scholar] [CrossRef]
- Zhou, J.; Hua, C.; Xia, X.; Wu, S. Perception of traditional settlement culture space based on network text content analysis: A case of Qiantong Traditional Town, Zhejing. Huazhong Archit. 2022, 40, 108–112. (In Chinese) [Google Scholar] [CrossRef]
- Meng, S.; Liu, C.; Zeng, Y.; Xu, R.; Zhang, C.; Chen, Y.; Wang, K.; Zhang, Y. Quality evaluation of public spaces in traditional villages: A study using deep learning and panoramic images. Land 2024, 13, 1584. [Google Scholar] [CrossRef]
- Ren, Y.; Leng, H.; Wang, Y.; Chen, C.; Zhou, J. Research on the reconstruction design of historical town’s street elevation with the unified synchronicity and diachronicity: Taking Sanjiang Avenue, Sanjiang Town, Nanchang County as an example. Decoration 2022, 65, 142–144. (In Chinese) [Google Scholar] [CrossRef]
- Jiang, X.; Zhang, X.; Qian, X.; Lin, Q.; Wang, X. Research on “authenticity” perceptual evaluation and renewal strategy of canal historical and cultural blocks (towns) based on multi-source data. Mod. Urban Res. 2021, 20–27, 37. (In Chinese) [Google Scholar] [CrossRef]
- Wang, Z.; Zeng, Z.; Yang, J.; Lin, R.; Xie, Y.; Li, X. Research on the perception of homesickness in ancient town landscape based on analysis of online texts and the IPA Model. J. Southwest Univ. (Nat. Sci. Ed.) 2023, 45, 210–218. (In Chinese) [Google Scholar] [CrossRef]
- Xu, M.; Lan, J. The study on influence factors of visitors dynamic in tourism town based on Geo-Detector Model: A case study in Wuzhen Xizha. Mod. Urban Res. 2023, 62–66, 73. (In Chinese) [Google Scholar] [CrossRef]
- Gao, W.; Jia, M.; Zhao, M.; Gao, Y.; Meng, H. Review of progress and quantitative measurement methods of research on street space. City Plan. Rev. 2022, 46, 106–114. (In Chinese) [Google Scholar]
- Ma, Z. Deep exploration of street view features for identifying urban vitality: A case study of Qingdao city. Int. J. Appl. Earth Obs. Geoinf. 2023, 123, 103476. [Google Scholar] [CrossRef]
- Jiang, Y.; Han, Y.; Liu, M.; Ye, Y. Street vitality and built environment features: A data-informed approach from fourteen Chinese cities. Sustain. Cities Soc. 2022, 79, 103724. [Google Scholar] [CrossRef]
- Alvarez Leon, L.; Quinn, S. The value of crowdsourced street-level imagery: Examining the shifting property regimes of OpenStreetCam and Mapillary. GeoJournal 2019, 84, 395–414. [Google Scholar] [CrossRef]
- Dai, M.; Ward, W.; Meyers, G.; Densley Tingley, D.; Mayfield, M. Residential building facade segmentation in the urban environment. Build. Environ. 2021, 199, 107921. [Google Scholar] [CrossRef]
- Ki, D.; Chen, Z.; Lee, S.; Lieu, S. A novel walkability index using Google Street View and deep learning. Sustain. Cities Soc. 2023, 99, 104896. [Google Scholar] [CrossRef]
- Wang, M.; Vermeulen, F. Life between buildings from a street view image: What do big data analytics reveal about neighbourhood organisational vitality? Urban Stud. 2021, 58, 3118–3139. [Google Scholar] [CrossRef]
- Gao, F.; Li, S.; Tan, Z.; Zhang, X.; Lai, Z.; Tan, Z. How is urban greenness spatially associated with dockless bike sharing usage on weekdays, weekends, and holidays? ISPRS Int. J. Geo-Inf. 2021, 10, 238. [Google Scholar] [CrossRef]
- Chen, C.; Li, H.; Luo, W.; Xie, J.; Yao, J.; Wu, L.; Xia, Y. Predicting the effect of street environment on residents’ mood states in large urban areas using machine learning and street view images. Sci. Total Environ. 2022, 816, 151605. [Google Scholar] [CrossRef]
- Yoo, E.-H.; Roberts, J.E.; Eum, Y.; Li, X.; Konty, K. Exposure to urban green space may both promote and harm mental health in socially vulnerable neighborhoods: A neighborhood-scale analysis in New York City. Environ. Res. 2022, 204, 112292. [Google Scholar] [CrossRef] [PubMed]
- Ito, K.; Biljecki, F. Assessing bikeability with street view imagery and computer vision. Transp. Res. Part C Emerg. Technol. 2021, 132, 103371. [Google Scholar] [CrossRef]
- Hoffmann, E.J.; Wang, Y.; Werner, M.; Kang, J.; Zhu, X.X. Model fusion for building type classification from aerial and street view images. Remote Sens. 2019, 11, 1259. [Google Scholar] [CrossRef]
- Schinasi, L.H.; Kanungo, C.; Christman, Z.; Barber, S.; Tabb, L.; Headen, I. Associations between historical redlining and present-day heat vulnerability, housing, and land cover characteristics in Philadelphia, PA. J. Urban Health 2022, 99, 134–145. [Google Scholar] [CrossRef]
- Huang, Z.; Qi, H.; Kang, C.; Su, Y.; Liu, Y. An ensemble learning approach for urban land use mapping based on remote sensing imagery and social sensing data. Remote Sens. 2020, 12, 3254. [Google Scholar] [CrossRef]
- Lu, Y. Using Google Street View to investigate the association between street greenery and physical activity. Landsc. Urban Plan. 2019, 191, 103435. [Google Scholar] [CrossRef]
- Sun, Q.; Macleod, T.; Both, A.; Hurley, J.; Butt, A.; Amati, M. A human-centred assessment framework to prioritise heat mitigation efforts for active travel at city scale. Sci. Total Environ. 2021, 763, 143033. [Google Scholar] [CrossRef]
- Wu, W.; Ma, Z.; Guo, J.; Niu, X.; Zhao, K. Evaluating the effects of built environment on street vitality at the city level: An empirical research based on spatial panel Durbin model. Res. Public. Health 2022, 19, 1664. [Google Scholar] [CrossRef]
- Li, D.; Deal, B.; Zhou, X.; Slavenas, M.; Sullivan, W.C. Moving beyond the neighborhood: Daily exposure to nature and adolescents’ mood. Landsc. Urban Plan. 2018, 173, 33–43. [Google Scholar] [CrossRef]
- Koo, B.; Guhathakurta, S.; Botchwey, N. How are neighborhood and street-level walkability factors associated with walking behaviors? A big data approach using street view images. Environ. Behav. 2022, 54, 211–241. [Google Scholar] [CrossRef]
- Gong, F.-Y.; Zeng, Z.-C.; Zhang, F.; Li, X.; Ng, E.; Norford, L.K. Mapping sky, tree, and building view factors of street canyons in a high-density urban environment. Build. Environ. 2018, 134, 155–167. [Google Scholar] [CrossRef]
- Nagata, S.; Nakaya, T.; Hanibuchi, T.; Amagasa, S.; Kikuchi, H.; Inoue, S. Objective scoring of streetscape walkability related to leisure walking: Statistical modeling approach with semantic segmentation of Google Street View images. Health Place 2020, 66, 102428. [Google Scholar] [CrossRef] [PubMed]
- Lu, Y.; Chen, H.-M. Using Google Street View to reveal environmental justice: Assessing public perceived walkability in macroscale city. Landsc. Urban Plan. 2024, 244, 104995. [Google Scholar] [CrossRef]
- Ito, K.; Bansal, P.; Biljecki, F. Examining the causal impacts of the built environment on cycling activities using time-series street view imagery. Res. Part Policy Pract. 2024, 190, 104286. [Google Scholar] [CrossRef]
- Kruse, J.; Kang, Y.; Liu, Y.-N.; Zhang, F.; Gao, S. Places for play: Understanding human perception of playability in cities using street view images and deep learning. Comput. Environ. Urban Syst. 2021, 90, 101693. [Google Scholar] [CrossRef]
- Treisman, A.; Gelade, G. A feature-integration theory of attention. Cogn. Psychol. 1980, 12, 97–136. [Google Scholar] [CrossRef]
- Fechner, G. Elemente der Psychophysik; Breitkopf & Härtel: Leipzig, Germany, 1860. [Google Scholar] [CrossRef]
- Zhao, Y.; Zhang, B.; Li, J. A study on the water environment spatial paradigm of Zhangqiu Ancient Town based on ecological resilience. J. West. Hum. Settl. 2024, 39, 163–170. (In Chinese) [Google Scholar] [CrossRef]
- Ge, D.; Xu, W.; Gao, N. Research on regeneration strategies and mechanisms of ancient towns based on the authenticity of subject and object: A case study of Qianyuan Ancient Town, Zhejiang. J. Zhejiang Univ. (Sci. Ed.) 2018, 45, 251–260. (In Chinese) [Google Scholar] [CrossRef]
- Guo, W.; Huang, Z. A field theory to the production of multi-dimensional space of cultural heritage tourism destination—A case study of Zhouzhuang Ancient Town. Hum. Geogr. 2013, 28, 117–124. (In Chinese) [Google Scholar] [CrossRef]
- Wang, Y. Tourism development models comparative study and sustainable development countermeasures of ancient towns in South China. J. Cent. China Norm. Univ. (Nat. Sci.) 2006, 52, 104–109. (In Chinese) [Google Scholar] [CrossRef]
- Mao, Q. Construction of water town residential culture system from the perspective of urbanization development: A case study of Nanxun Town, Huzhou. People’s Trib. 2015, 24, 96–97. (In Chinese) [Google Scholar] [CrossRef]
- Ruan, Y.; Shao, Y.; Lin, L. The characteristics, values and the preservation planning of the towns in Jiangnan water region. Urban Plann. Forum 2002, 1, 79–84. (In Chinese) [Google Scholar] [CrossRef]
- China News Zhejiang. Zhejiang Nanxun Ancient Town Welcomes Its 10 Millionth Visitor Three Months Ahead of Schedule. Available online: https://www.zj.chinanews.com.cn/jzkzj/2024-07-01/detail-ihecwwfa4571526.shtml (accessed on 29 November 2024).
- Vanore, M.; Triches, M. (Eds.) #CURACITTÀ VENEZIA: Vs Marghera e la città-paesaggio; Quodlibet: Macerata, Italy, 2021. [Google Scholar]
- Liu, Y. China National Nutrition and Chronic Disease Status Report (2020). Acta Nutr. Sin. 2020, 42, 521. (In Chinese) [Google Scholar] [CrossRef]
- Tsai, V.J.D.; Chang, C.T. Three-dimensional positioning from Google street view panoramas. IET Image Process. 2013, 7, 229–239. [Google Scholar] [CrossRef]
- Ogawa, Y.; Oki, T.; Zhao, C.; Sekimoto, Y.; Shimizu, C. Evaluating the subjective perceptions of streetscapes using street-view images. Landsc. Urban Plan. 2024, 247, 105073. [Google Scholar] [CrossRef]
- Chen, L.; Lu, Y.; Ye, Y.; Xiao, Y.; Yang, L. Examining the association between the built environment and pedestrian volume using street view images. Cities 2022, 127, 103734. [Google Scholar] [CrossRef]
- Yao, Y.; Liang, Z.; Yuan, Z.; Liu, P.; Bie, Y.; Zhang, J.; Wang, R.; Wang, J.; Guan, Q. A human-machine adversarial scoring framework for urban perception assessment using street-view images. Int. J. Geogr. Inf. Sci. 2019, 33, 2363–2384. [Google Scholar] [CrossRef]
- Long, J.; Shelhamer, E.; Darrell, T. Fully Convolutional Networks for Semantic Segmentation. In Proceedings of the IEEE Conference on Computer Vision and Pattern Recognition, Boston, MA, USA, 7–12 June 2015; IEEE: New York, NY, USA, 2015; pp. 3431–3440. [Google Scholar] [CrossRef]
- Ewing, R.; Handy, S. Measuring the unmeasurable: Urban design qualities related to walkability. J. Urban Des. 2009, 14, 65–84. [Google Scholar] [CrossRef]
- Tao, Y.; Wang, Y.; Wang, X.; Tian, G.; Zhang, S. Measuring the correlation between human activity density and streetscape perceptions: An analysis based on Baidu street view images in Zhengzhou, China. Land 2022, 11, 400. [Google Scholar] [CrossRef]
- Yang, Y.; Wang, Q.; Wu, D.; Hang, T.; Ding, H.; Wu, Y.; Liu, Q. Constructing child-friendly cities: Comprehensive evaluation of street-level child-friendliness using the method of empathy-based stories, street view images, and deep learning. Cities 2024, 154, 105385. [Google Scholar] [CrossRef]
- Ashihara, Y. The Aesthetic Townscape; MIT Press: Cambridge, MA, USA, 1983; pp. 73–81. [Google Scholar] [CrossRef]
- Liu, Y.; Xiao, T.; Liu, Y.; Yao, Y.; Wang, R. Natural outdoor environments and subjective well-being in Guangzhou, China: Comparing different measures of access. Urban For. Urban Green. 2021, 59, 127027. [Google Scholar] [CrossRef]
- Yang, L. A Study on the emotional expression of lighting culture in Jiangnan water towns. Mod. Decorat. (Theory) 2015, 31, 185. (In Chinese) [Google Scholar]
- Liu, W.; Hu, X.; Song, Z.; Yuan, X. Identifying the integrated visual characteristics of greenway landscape: A focus on human perception. Sustain. Cities Soc. 2023, 99, 104937. [Google Scholar] [CrossRef]
- Mittal, H.; Pandey, A.C.; Saraswat, M.; Kumar, S.; Pal, R.; Modwel, G. A comprehensive survey of image segmentation: Clustering methods, performance parameters, and benchmark datasets. Multimed. Tools Appl. 2022, 81, 35001–35026. [Google Scholar] [CrossRef]
- Shao, Y.; Yin, Y.; Xue, Z. Evaluation and comparison of streetscape comfort in Beijing and Shanghai based on a big data approach with street images. Landsc. Archit. 2021, 28, 53–59. (In Chinese) [Google Scholar] [CrossRef]
- Nasar, J.L. Visual Preferences in Urban Street Scenes: A Cross-Cultural Comparison between Japan and the United States. In Environmental Aesthetics; Nasar, J.L., Ed.; Cambridge University Press: Cambridge, UK, 1988; pp. 260–274. ISBN 978-0-521-34124-0. [Google Scholar] [CrossRef]
- Liaw, A.; Wiener, M. Classification and regression by random forest. R News 2002, 2, 18–22. [Google Scholar] [CrossRef]
- Lundberg, S.M.; Lee, S.-I. A Unified Approach to Interpreting Model Predictions. In Advances in Neural Information Processing Systems; Curran Associates, Inc.: Red Hook, NY, USA, 2017; Volume 30. [Google Scholar]
- Li, Y.; Song, X.; Sun, L.; Zhuang, C.C.; Liu, J.; Yang, M. Exploring urbanization strategies by dissecting aggregate crowd behaviors: A case study in China. Systems 2024, 12, 459. [Google Scholar] [CrossRef]
- Xu, Y.; Lu, L. Probing the long-term evolution of traditional village tourism destinations from a glocalisation perspective: A case study of Wuzhen in Zhejiang province, China. Habitat Int. 2024, 148, 103073. [Google Scholar] [CrossRef]
- Wu, Y.; Yan, C.; Li, F.; Hong, Q.; Liu, J. Effects of waterfront spatial visual elements on the perception of waterscape attraction. South Hortic. 2022, 33, 60–65. (In Chinese) [Google Scholar] [CrossRef]
- Kaplan, R.; Kaplan, S. The Experience of Nature: A Psychological Perspective; Cambridge University Press: New York, NY, USA, 1989. [Google Scholar]
- Nasar, J.L. Urban design aesthetics: The evaluative qualities of building exteriors. Environ. Behav. 1994, 26, 377–401. [Google Scholar] [CrossRef]
- Wang, R.; Niu, Q.; Gao, H.; Huang, S.; Xu, Z. Quantitative research and evaluation on street interface of historic district—A case of Sanhe Ancient Town in Hefei. Urban. Archit. 2020, 17, 15–19,56. (In Chinese) [Google Scholar] [CrossRef]
- Zuo, H.; Li, Z.; Yu, X.; Wang, D.; Cui, W. A visual quantitative study on “second contour” of the historic blocks: Taking the Tunxi Ancient Street, Anhui for example. Mod. Urban Res. 2019, 1, 88–93. (In Chinese) [Google Scholar] [CrossRef]
- Shen, H.; Aziz, N.F.; Liu, J.; Huang, M.; Yu, L.; Yang, R. From text to insights: Leveraging NLP to assess how landscape features shape tourist perceptions and emotions toward traditional villages. Environ. Res. Commun. 2024, 6, 115006. [Google Scholar] [CrossRef]
- Ye, Y.; Zhong, C.; Suel, E. Unpacking the perceived cycling safety of road environment using street view imagery and cycle accident data. Accid. Anal. Prev. 2024, 205, 107677. [Google Scholar] [CrossRef] [PubMed]
- Ren, L.; Wang, Y. A study on placeness evaluation of the Suzhou Pingjiang Historical and Cultural Block: From the perspective of tourist perceptions. South Archit. 2024, 44, 20–31. (In Chinese) [Google Scholar] [CrossRef]
- Wei, K. The node of ancient towns: A reflection of the gathering of folk cultural context—A perspective on the architectural style of Huanglongxi Ancient Town. J. Southwest Univ. Natl. (Humanit. Soc. Sci.) 2008, 30, 208–211. (In Chinese) [Google Scholar]
- Hsieh, C.-M. A multiscale walkability assessment approach creating walkable streets: A case study of high-density city, Macau. Res. Transp. Bus. Manag. 2024, 57, 101217. [Google Scholar] [CrossRef]
- Li, Z.; Ma, Y.; Weng, S. The post-modern authentic tourist experience and its generation mechanism in thematic historic town: A case study of Wuzhen west scenic zone. Tour. Trib. 2023, 38, 42–52. (In Chinese) [Google Scholar] [CrossRef]
- Chen, Z.; Zhu, Z.; Chen, Y.; Xu, Y.; Lan, Y.; Fu, W.; Ding, G.; Dong, J. Quantitative analysis on the impact of the street greening on landscapes in ancient towns—Taking Dayan Ancient Town and Shuhe Ancient Town in Lijiang as cases. J. Shandong Agric. Univ. (Nat. Sci. Ed.) 2016, 47, 911–916. (In Chinese) [Google Scholar] [CrossRef]
- Dong, W.; Dai, D.; Shen, P.; Zhang, R.; Liu, M. How Public Urban Space Enhance Restoration Benefits through Combined Multisensory Effects: A Systematic Review. Land 2024, 13, 2018. [Google Scholar] [CrossRef]
- Chen, Z.M.; Huang, R.; Huang, Y.; Chen, Z.; Ye, Y. The measurements of fine-scale street walkability and precise design control: An evidence-based approach based on virtual reality and wearable bio-sensors. Chin. Landsc. Archit. 2022, 38, 70–75. (In Chinese) [Google Scholar] [CrossRef]


| Author | Research Content | Related Environmental Elements |
|---|---|---|
| Shen, Aziz, Lv, 2025 [31] | Panoramic technology was used to identify the key landscape features affecting traditional village esthetics and propose sustainable development strategies. | Water |
| Vegetation | ||
| Ground | ||
| Building | ||
| Shen, Aziz, Omar et al., 2024 [32] | The authors investigated tourism’s impact on residents’ visual landscape perceptions in Huangdu Dong Village via online data. | Water |
| Building | ||
| Person | ||
| Meng, Liu, Zeng et al., 2024 [47] | Panoramic images and deep learning were used to quantify certain indicators of public space quality in villages in Beijing’s Fangshan District. | Vegetation |
| Building | ||
| Sky | ||
| Xu, Lan, 2023 [51] | The authors analyzed environmental influences (spatial layout, visual perception, etc.) on tourist activity in Wuzhen Xizha using spatial models and Baidu data. | Shop sign |
| Ren, Leng, 2022 [48] | Diachronic and synchronic approaches were integrated to renovate the historic streetscape of Sanjiang Avenue in Nanchang. | Building |
| Lantern | ||
| Shop sign | ||
| Jiang, Zhang et al., 2021 [49] | The authors evaluated authenticity in Grand Canal cultural blocks with respect to four aspects by using multi-source data across different renewal modes. | Water |
| Building | ||
| Lantern | ||
| Boat | ||
| Vegetation | ||
| Zhang, Yang, 2019 [2] | The authors examined tourist and resident perceptions of Tongli Old Town’s landscape through surveys, photo analysis, field interviews, and tour route tracking. | Bridge |
| Water | ||
| Boat |
| Model | FCN | PSPNET | Newly Trained Deeplabv3+ (Ours) |
|---|---|---|---|
| Overall Accuracy (%) | 86.00 | 86.60 | 88.00 |
| Label Classification | Label |
|---|---|
| Space-defining elements | Sky |
| Water | |
| Building | |
| Riverbank | |
| Ground | |
| Foreground and space-defining elements | Bridge |
| Foreground elements | Vegetation |
| Fence | |
| Pot | |
| Lantern | |
| Boat | |
| Shop sign | |
| Signboard | |
| Person | |
| Other |
| Type | ICC | p-Value |
|---|---|---|
| ICC(1,k) | 0.740 | 0.022 ** |
| ICC(2,k) | 0.754 | 0.007 *** |
| ICC(3,k) | 0.799 | 0.007 *** |
| Variable | Importance | Weight (Rescaled) |
|---|---|---|
| water | 20.5028 | 1.0000 |
| boat | 2.8582 | 0.1394 |
| fence | 4.4219 | 0.2157 |
| ground | 10.8069 | 0.5271 |
| sky | 4.7482 | 0.2316 |
| lantern | 5.5967 | 0.2730 |
| vegetation | 4.6768 | 0.2280 |
| shop sign | 5.7841 | 0.2821 |
| person | 7.7541 | 0.3782 |
| pot | 2.4232 | 0.1182 |
| bridge | 3.9639 | 0.1777 |
| building | 4.0574 | 0.1934 |
| signboard | 3.8896 | 0.1979 |
| riverbank | 12.2144 | 0.5957 |
| other | 6.5483 | 0.3193 |
| MSE (Train) | RMSE (Train) | MAE (Train) | MAPE (Train) | MSE (Test) | RMSE (Test) | MAE (Test) | MAPE (Test) | Training R2 | Testing R2 |
|---|---|---|---|---|---|---|---|---|---|
| 0.0303 | 0.1740 | 0.1370 | 3.6978 | 0.0423 | 0.2056 | 0.1745 | 4.6245 | 0.8358 | 0.7487 |
Disclaimer/Publisher’s Note: The statements, opinions and data contained in all publications are solely those of the individual author(s) and contributor(s) and not of MDPI and/or the editor(s). MDPI and/or the editor(s) disclaim responsibility for any injury to people or property resulting from any ideas, methods, instructions or products referred to in the content. |
© 2025 by the authors. Licensee MDPI, Basel, Switzerland. This article is an open access article distributed under the terms and conditions of the Creative Commons Attribution (CC BY) license (https://creativecommons.org/licenses/by/4.0/).
Share and Cite
Xu, C.; Cao, H.; Xia, Z.; You, X.; Wang, Z. Understanding the Influence of Environmental Elements on Spatial Attractiveness in a Jiangnan Water Town Through Computer Vision Techniques. Buildings 2025, 15, 2091. https://doi.org/10.3390/buildings15122091
Xu C, Cao H, Xia Z, You X, Wang Z. Understanding the Influence of Environmental Elements on Spatial Attractiveness in a Jiangnan Water Town Through Computer Vision Techniques. Buildings. 2025; 15(12):2091. https://doi.org/10.3390/buildings15122091
Chicago/Turabian StyleXu, Chenpeng, Hongshi Cao, Zhengwei Xia, Xinjie You, and Zixuan Wang. 2025. "Understanding the Influence of Environmental Elements on Spatial Attractiveness in a Jiangnan Water Town Through Computer Vision Techniques" Buildings 15, no. 12: 2091. https://doi.org/10.3390/buildings15122091
APA StyleXu, C., Cao, H., Xia, Z., You, X., & Wang, Z. (2025). Understanding the Influence of Environmental Elements on Spatial Attractiveness in a Jiangnan Water Town Through Computer Vision Techniques. Buildings, 15(12), 2091. https://doi.org/10.3390/buildings15122091