
AI-Driven Optimization of Fly Ash-Based Geopolymer Concrete for Sustainable High Strength and CO2 Reduction: An Application of Hybrid Taguchi–Grey–ANN Approach
 , , ,
, , ,
Abstract
1. Introduction
2. Development of Reference Datasets
3. Life Cycle Assessment and CO2 Calculations
4. Research Methodology
4.1. Taguchi–Grey Rational Analysis (GRA) Calculation Model
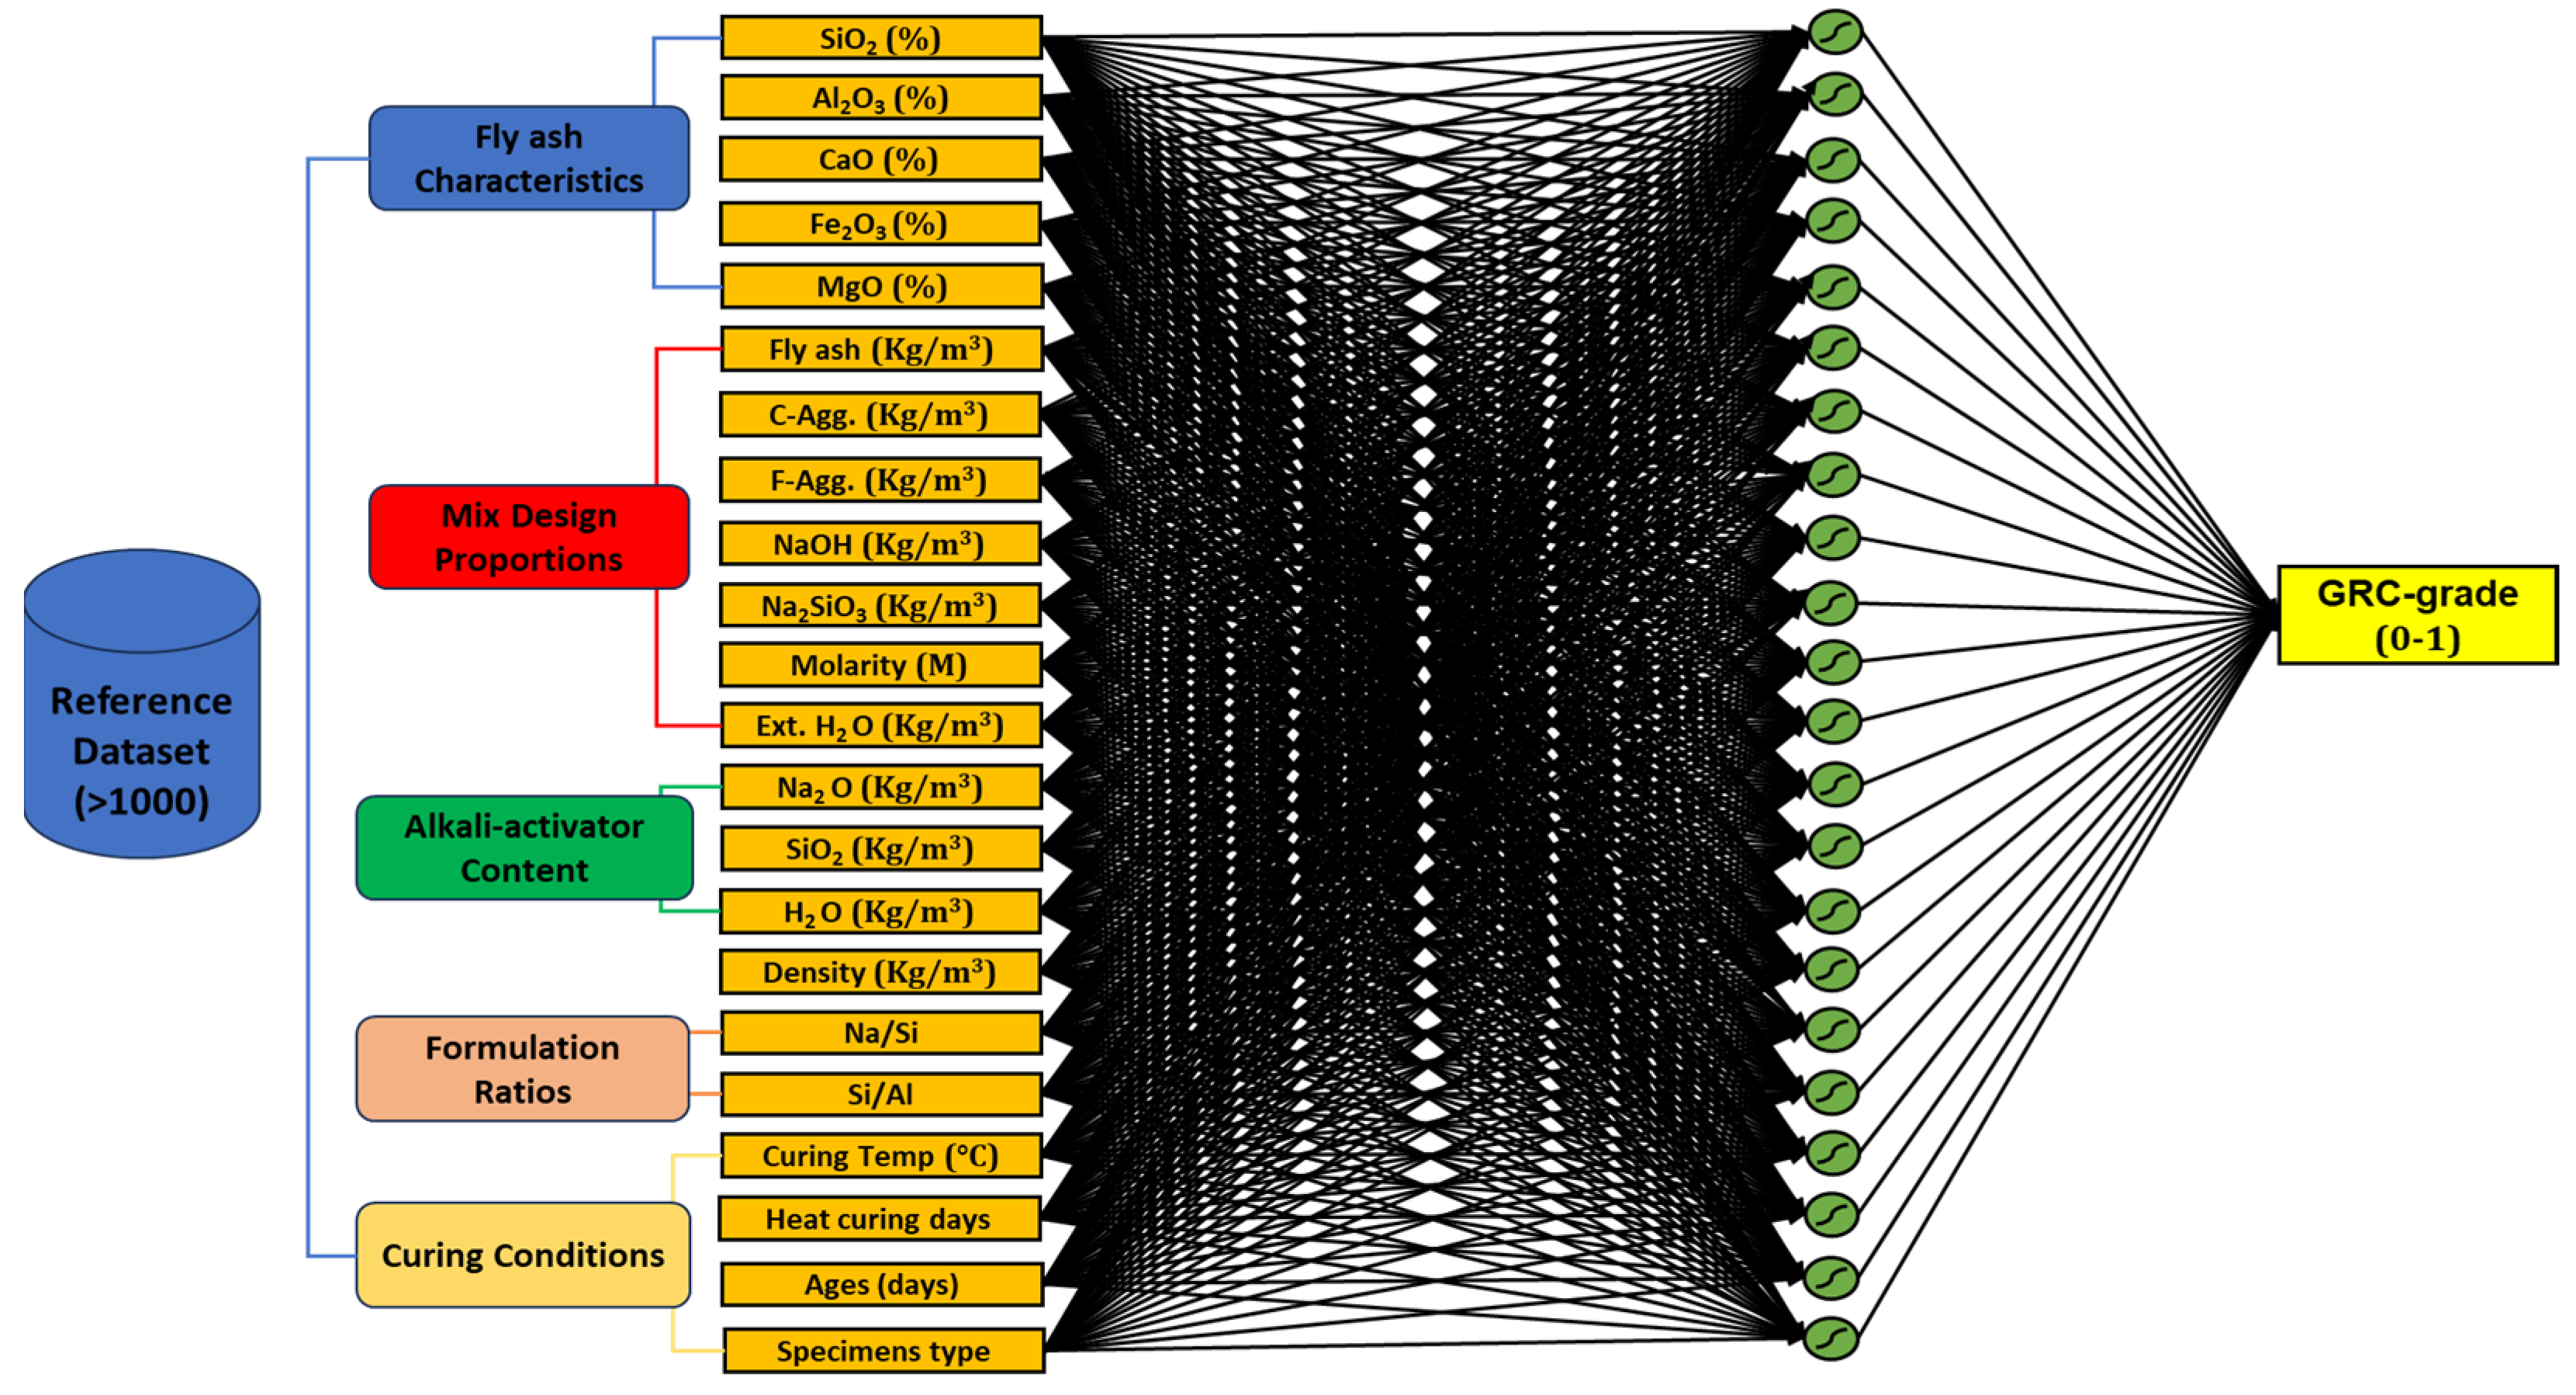
4.2. Artificial Neural Network (ANN) Model
5. Results and Discussions
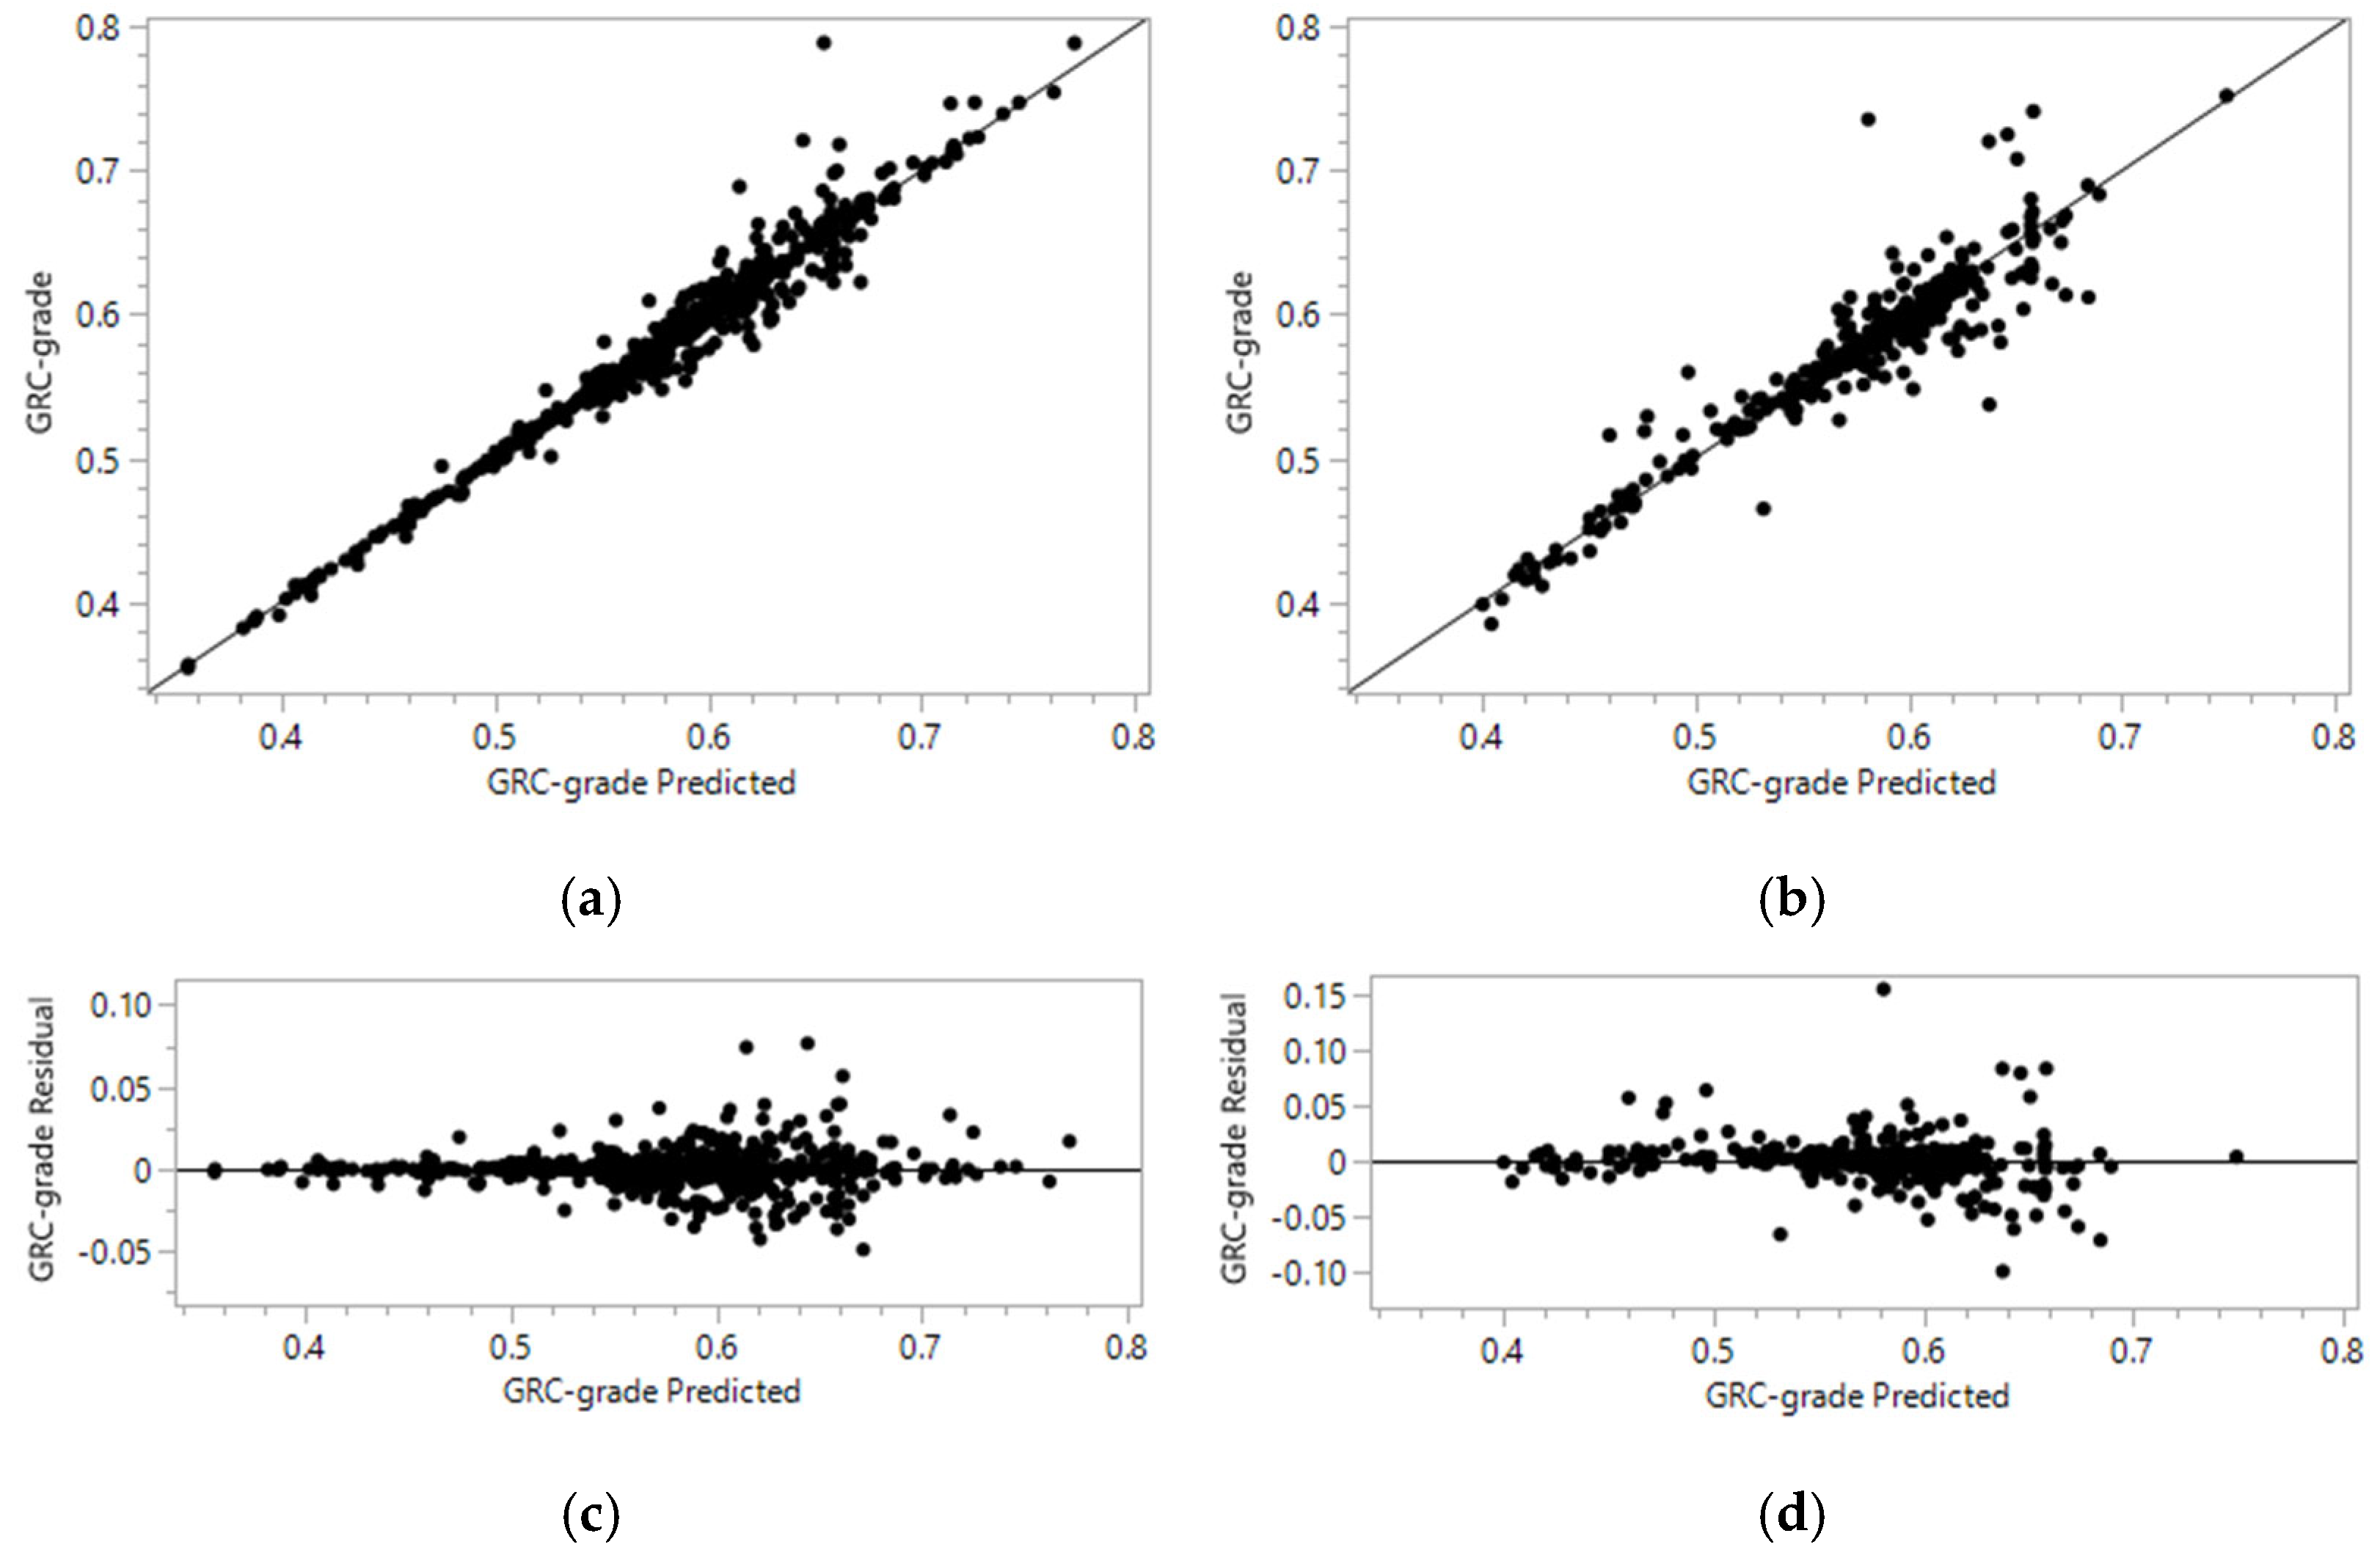
5.1. Results of Artificial Neural Networks
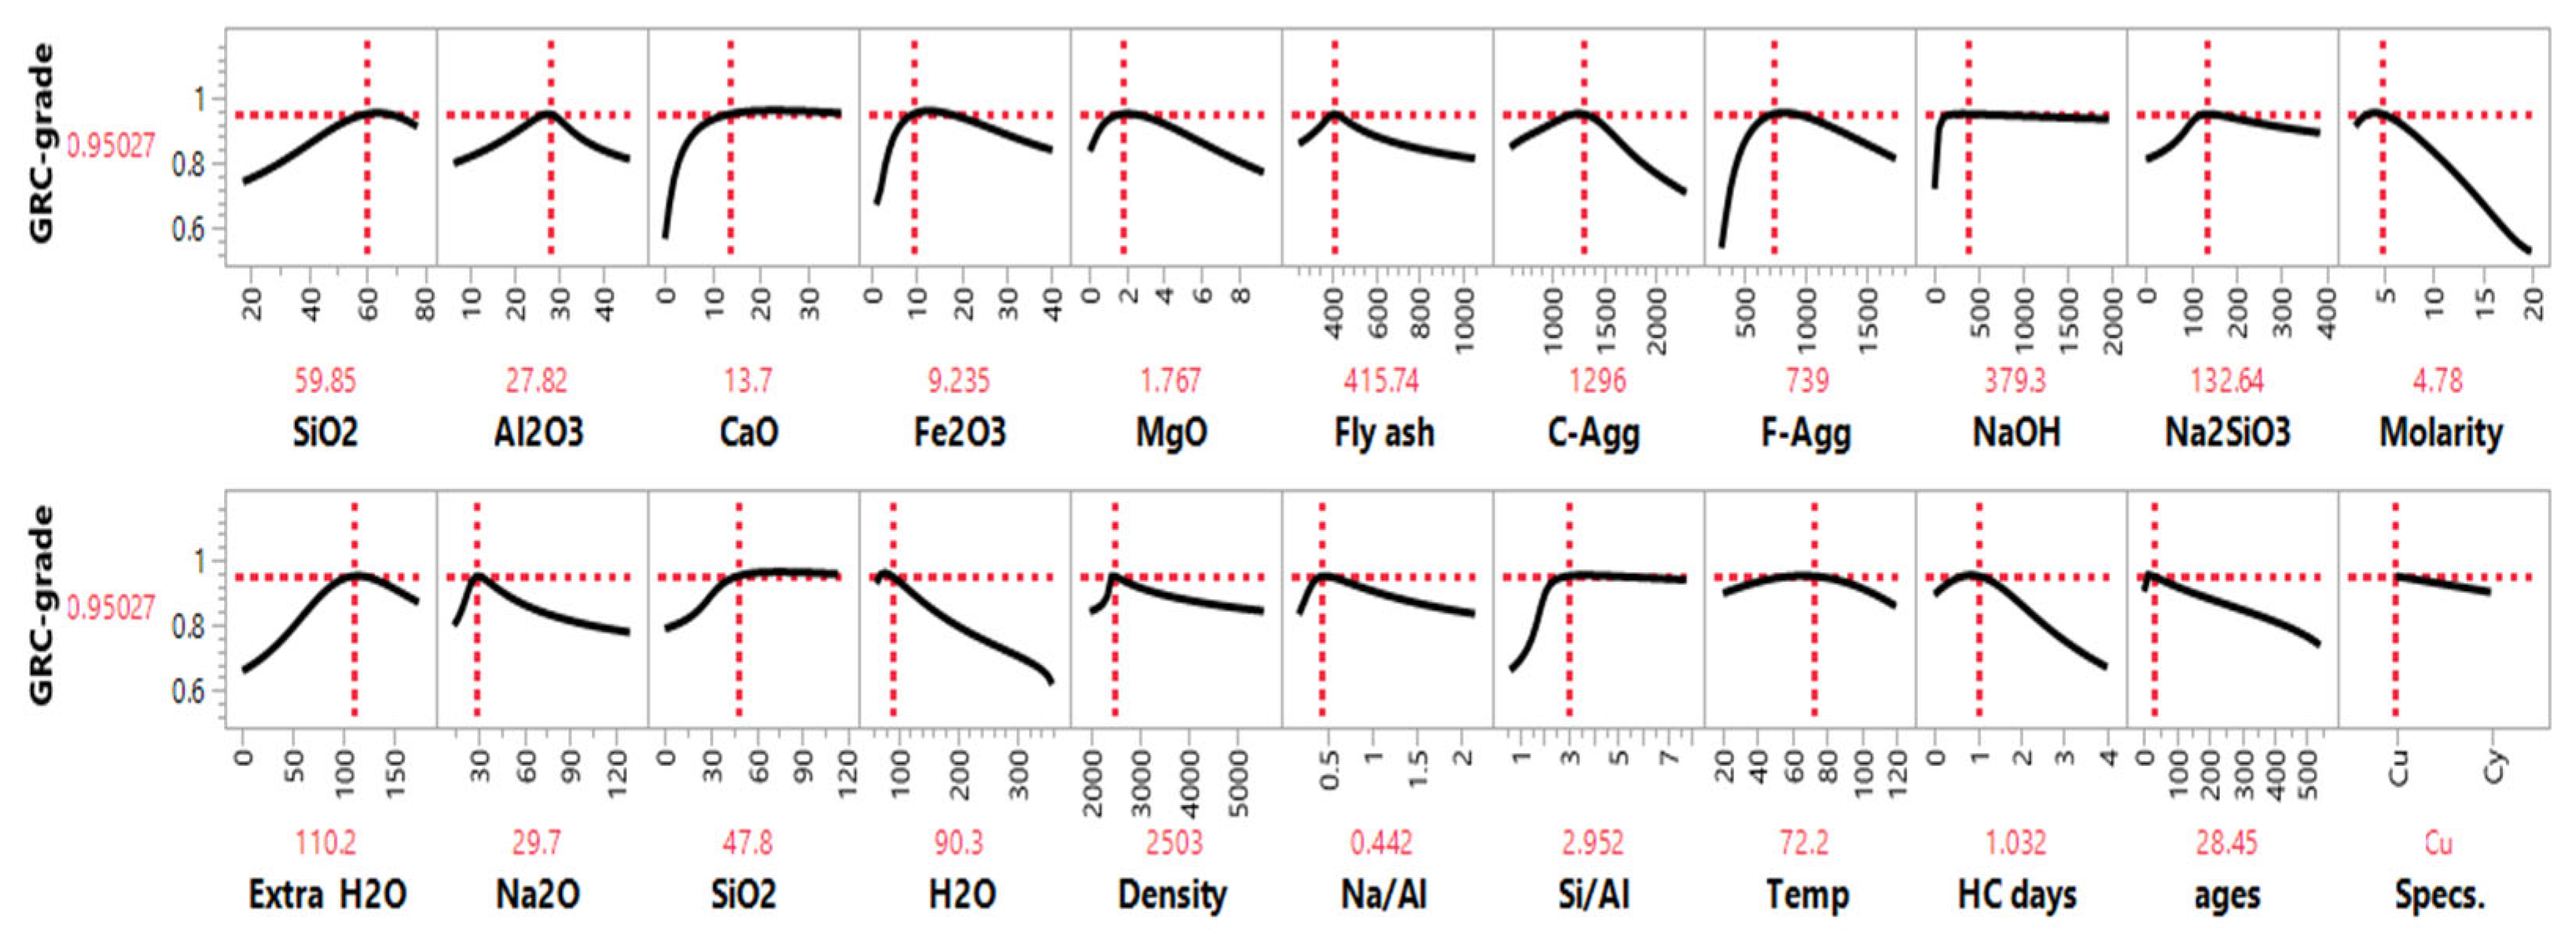
5.2. Prediction Profiler Using ANNs
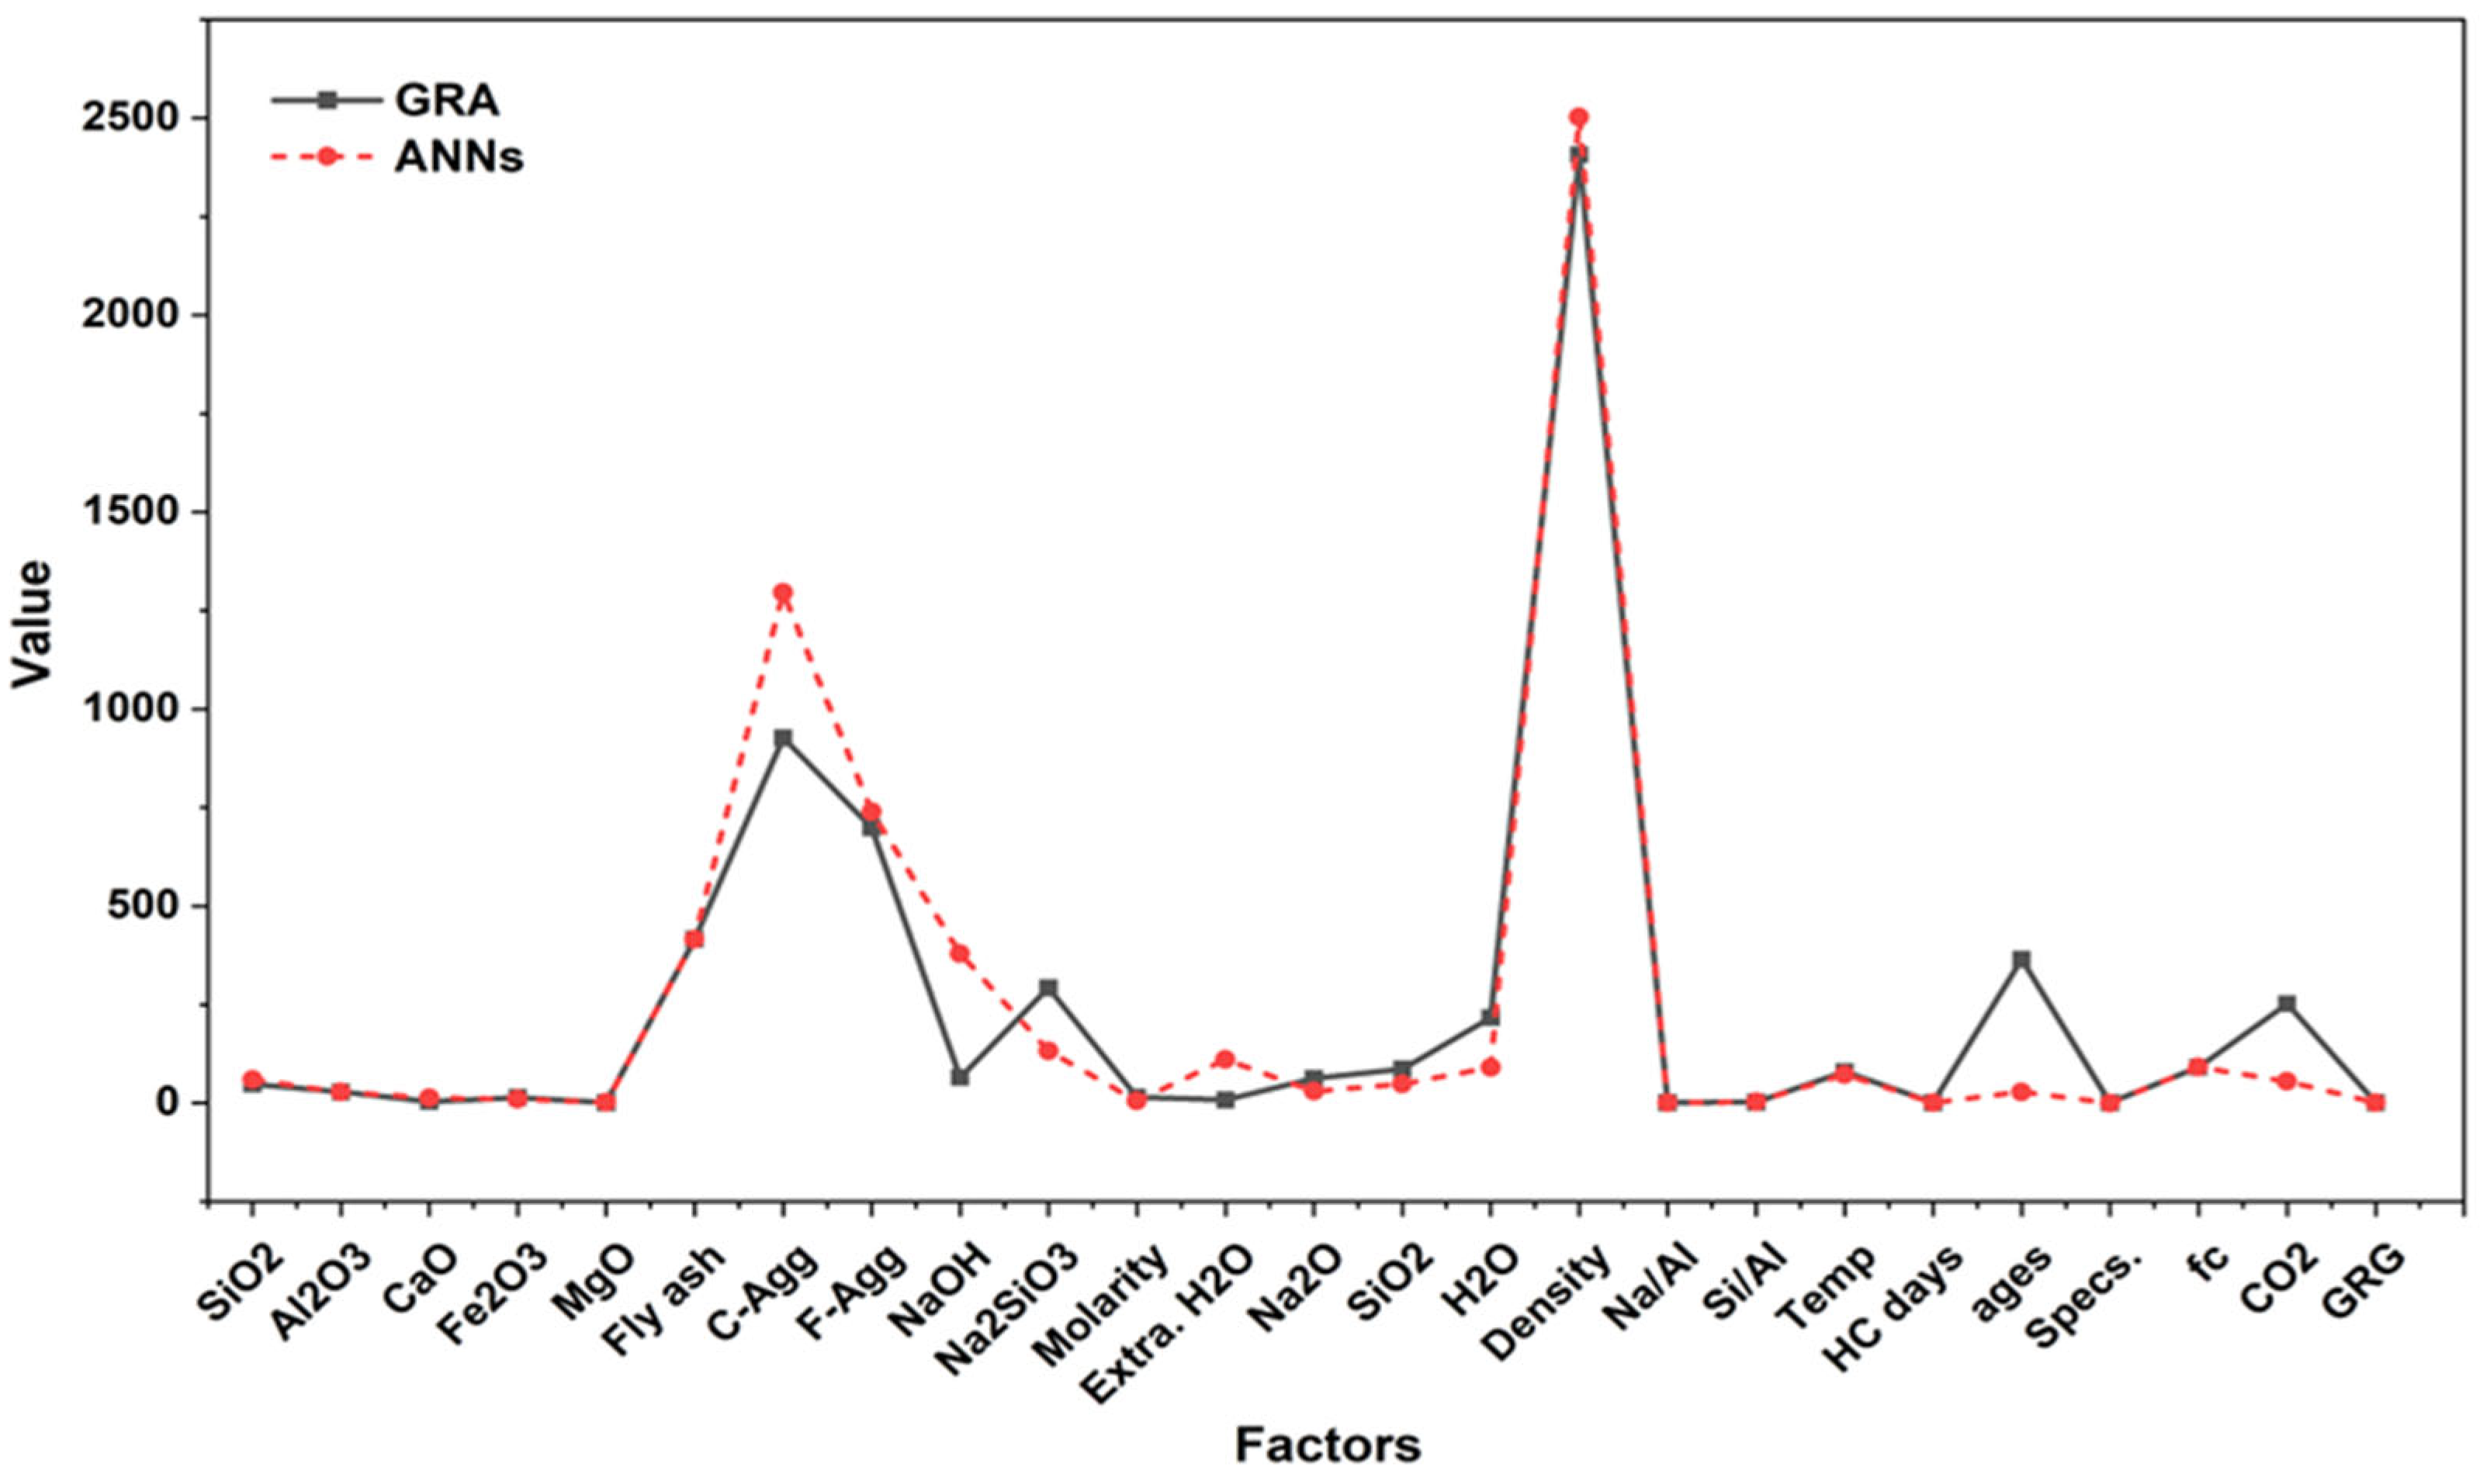
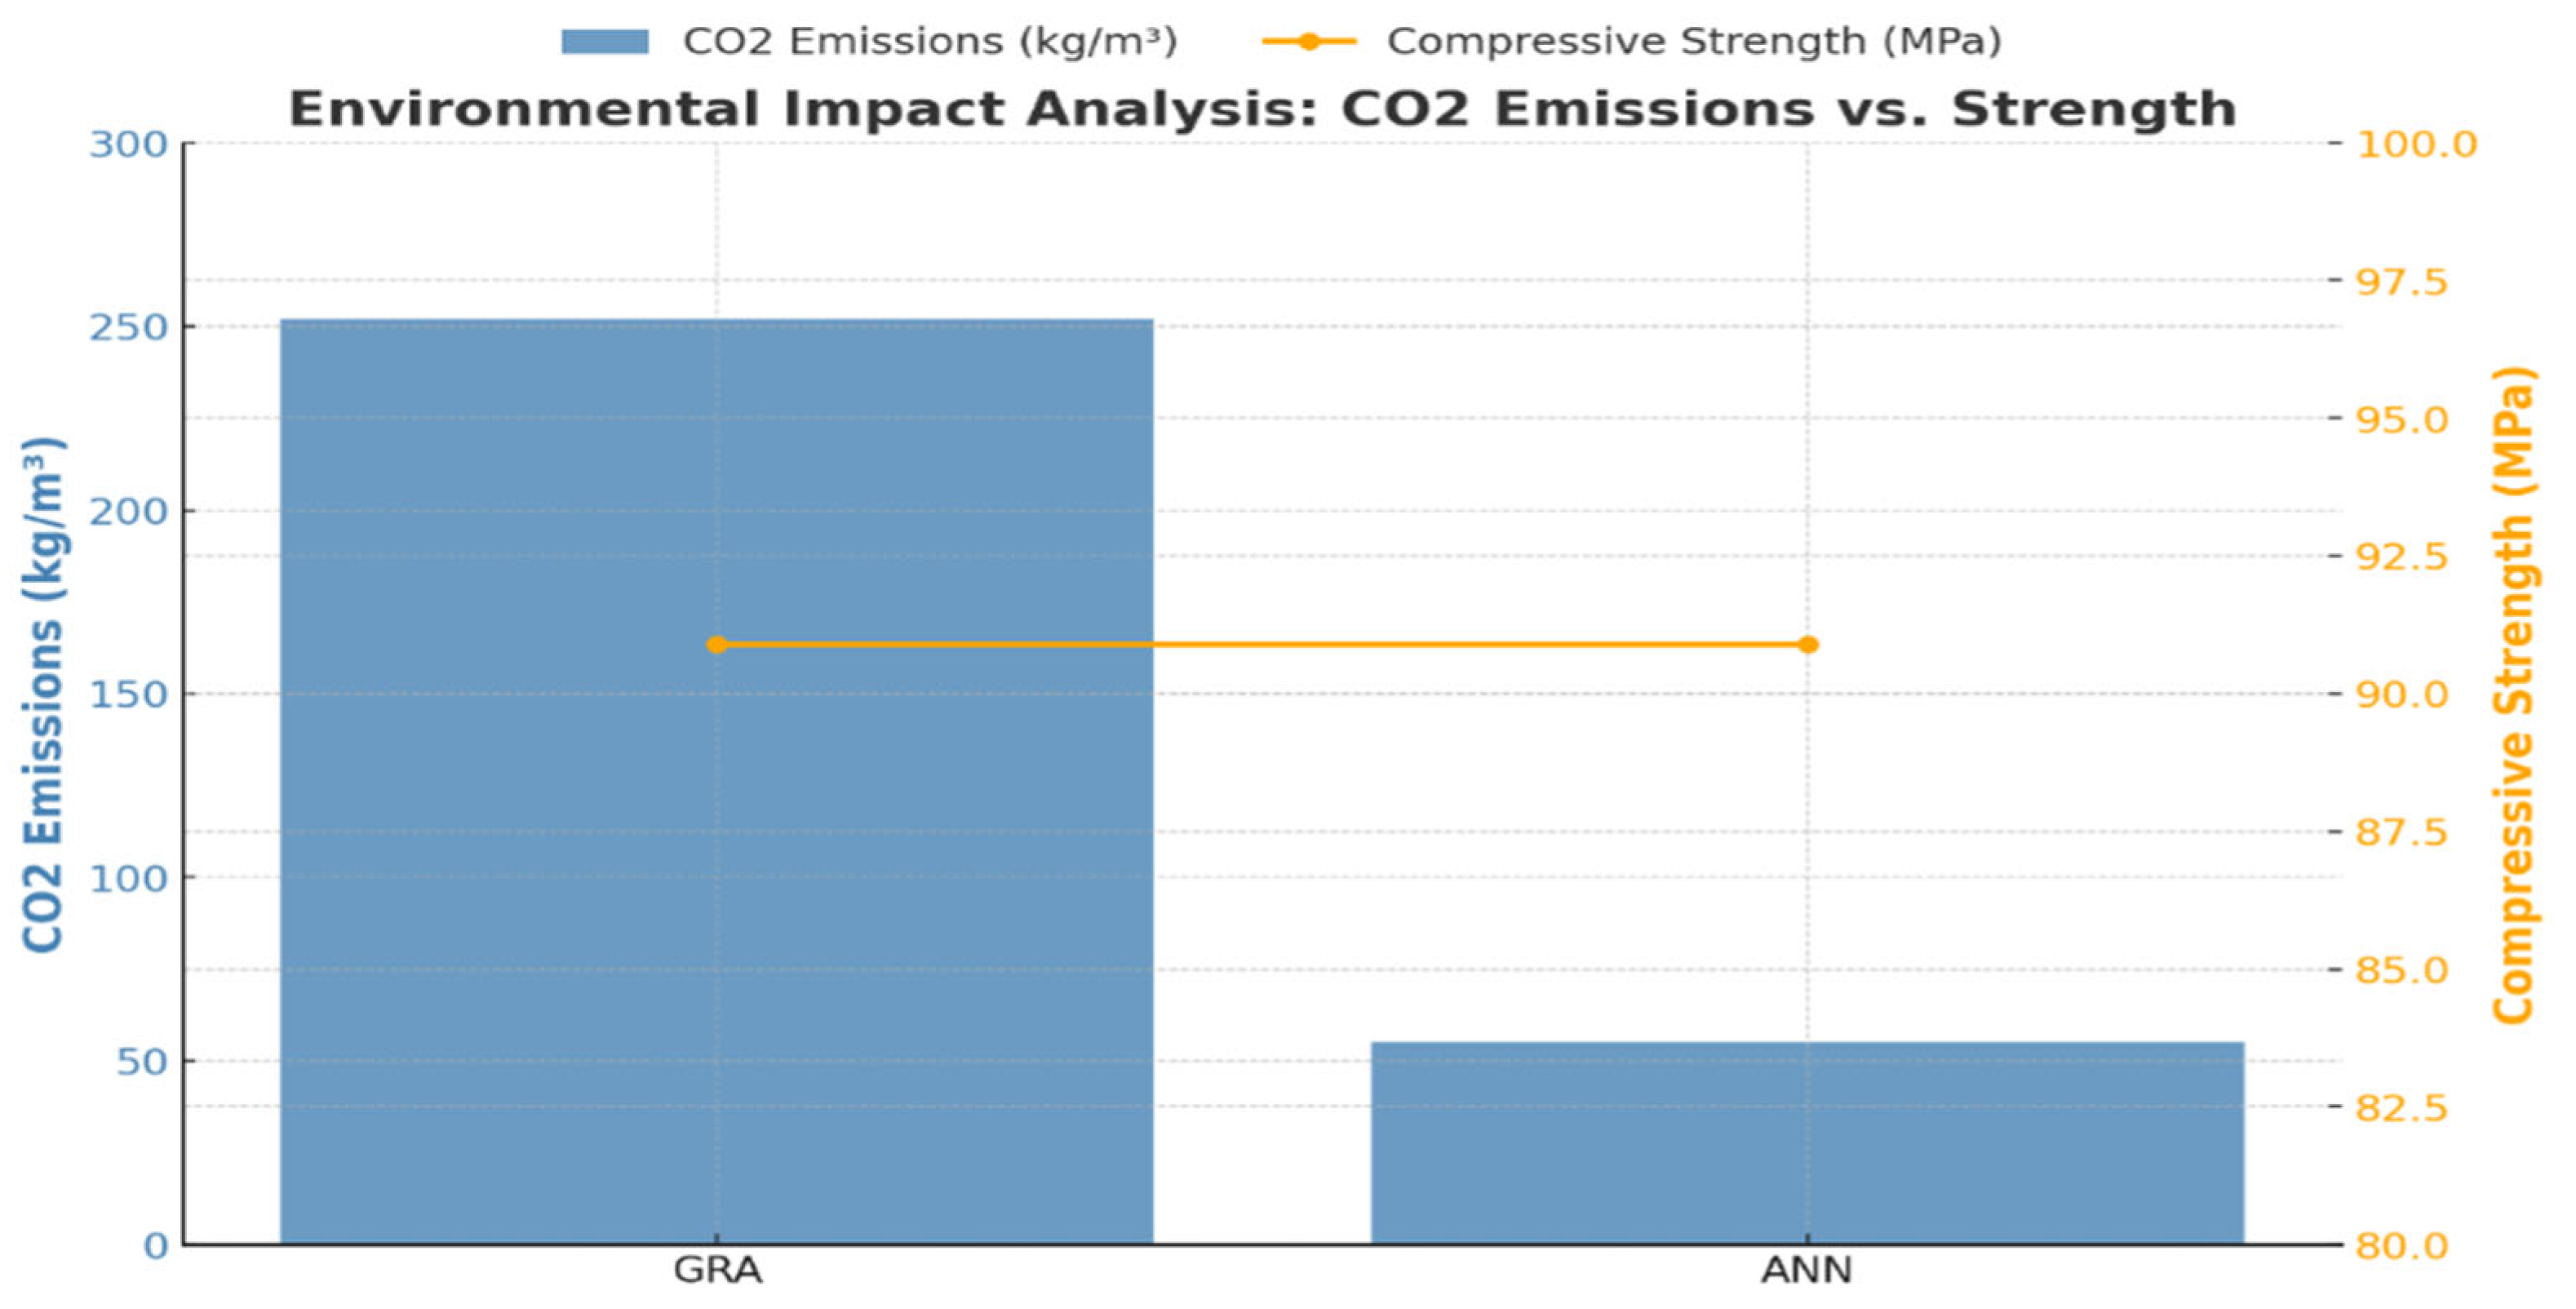
5.3. Comparison Results of GRA vs. ANNs with Optimal Parameters
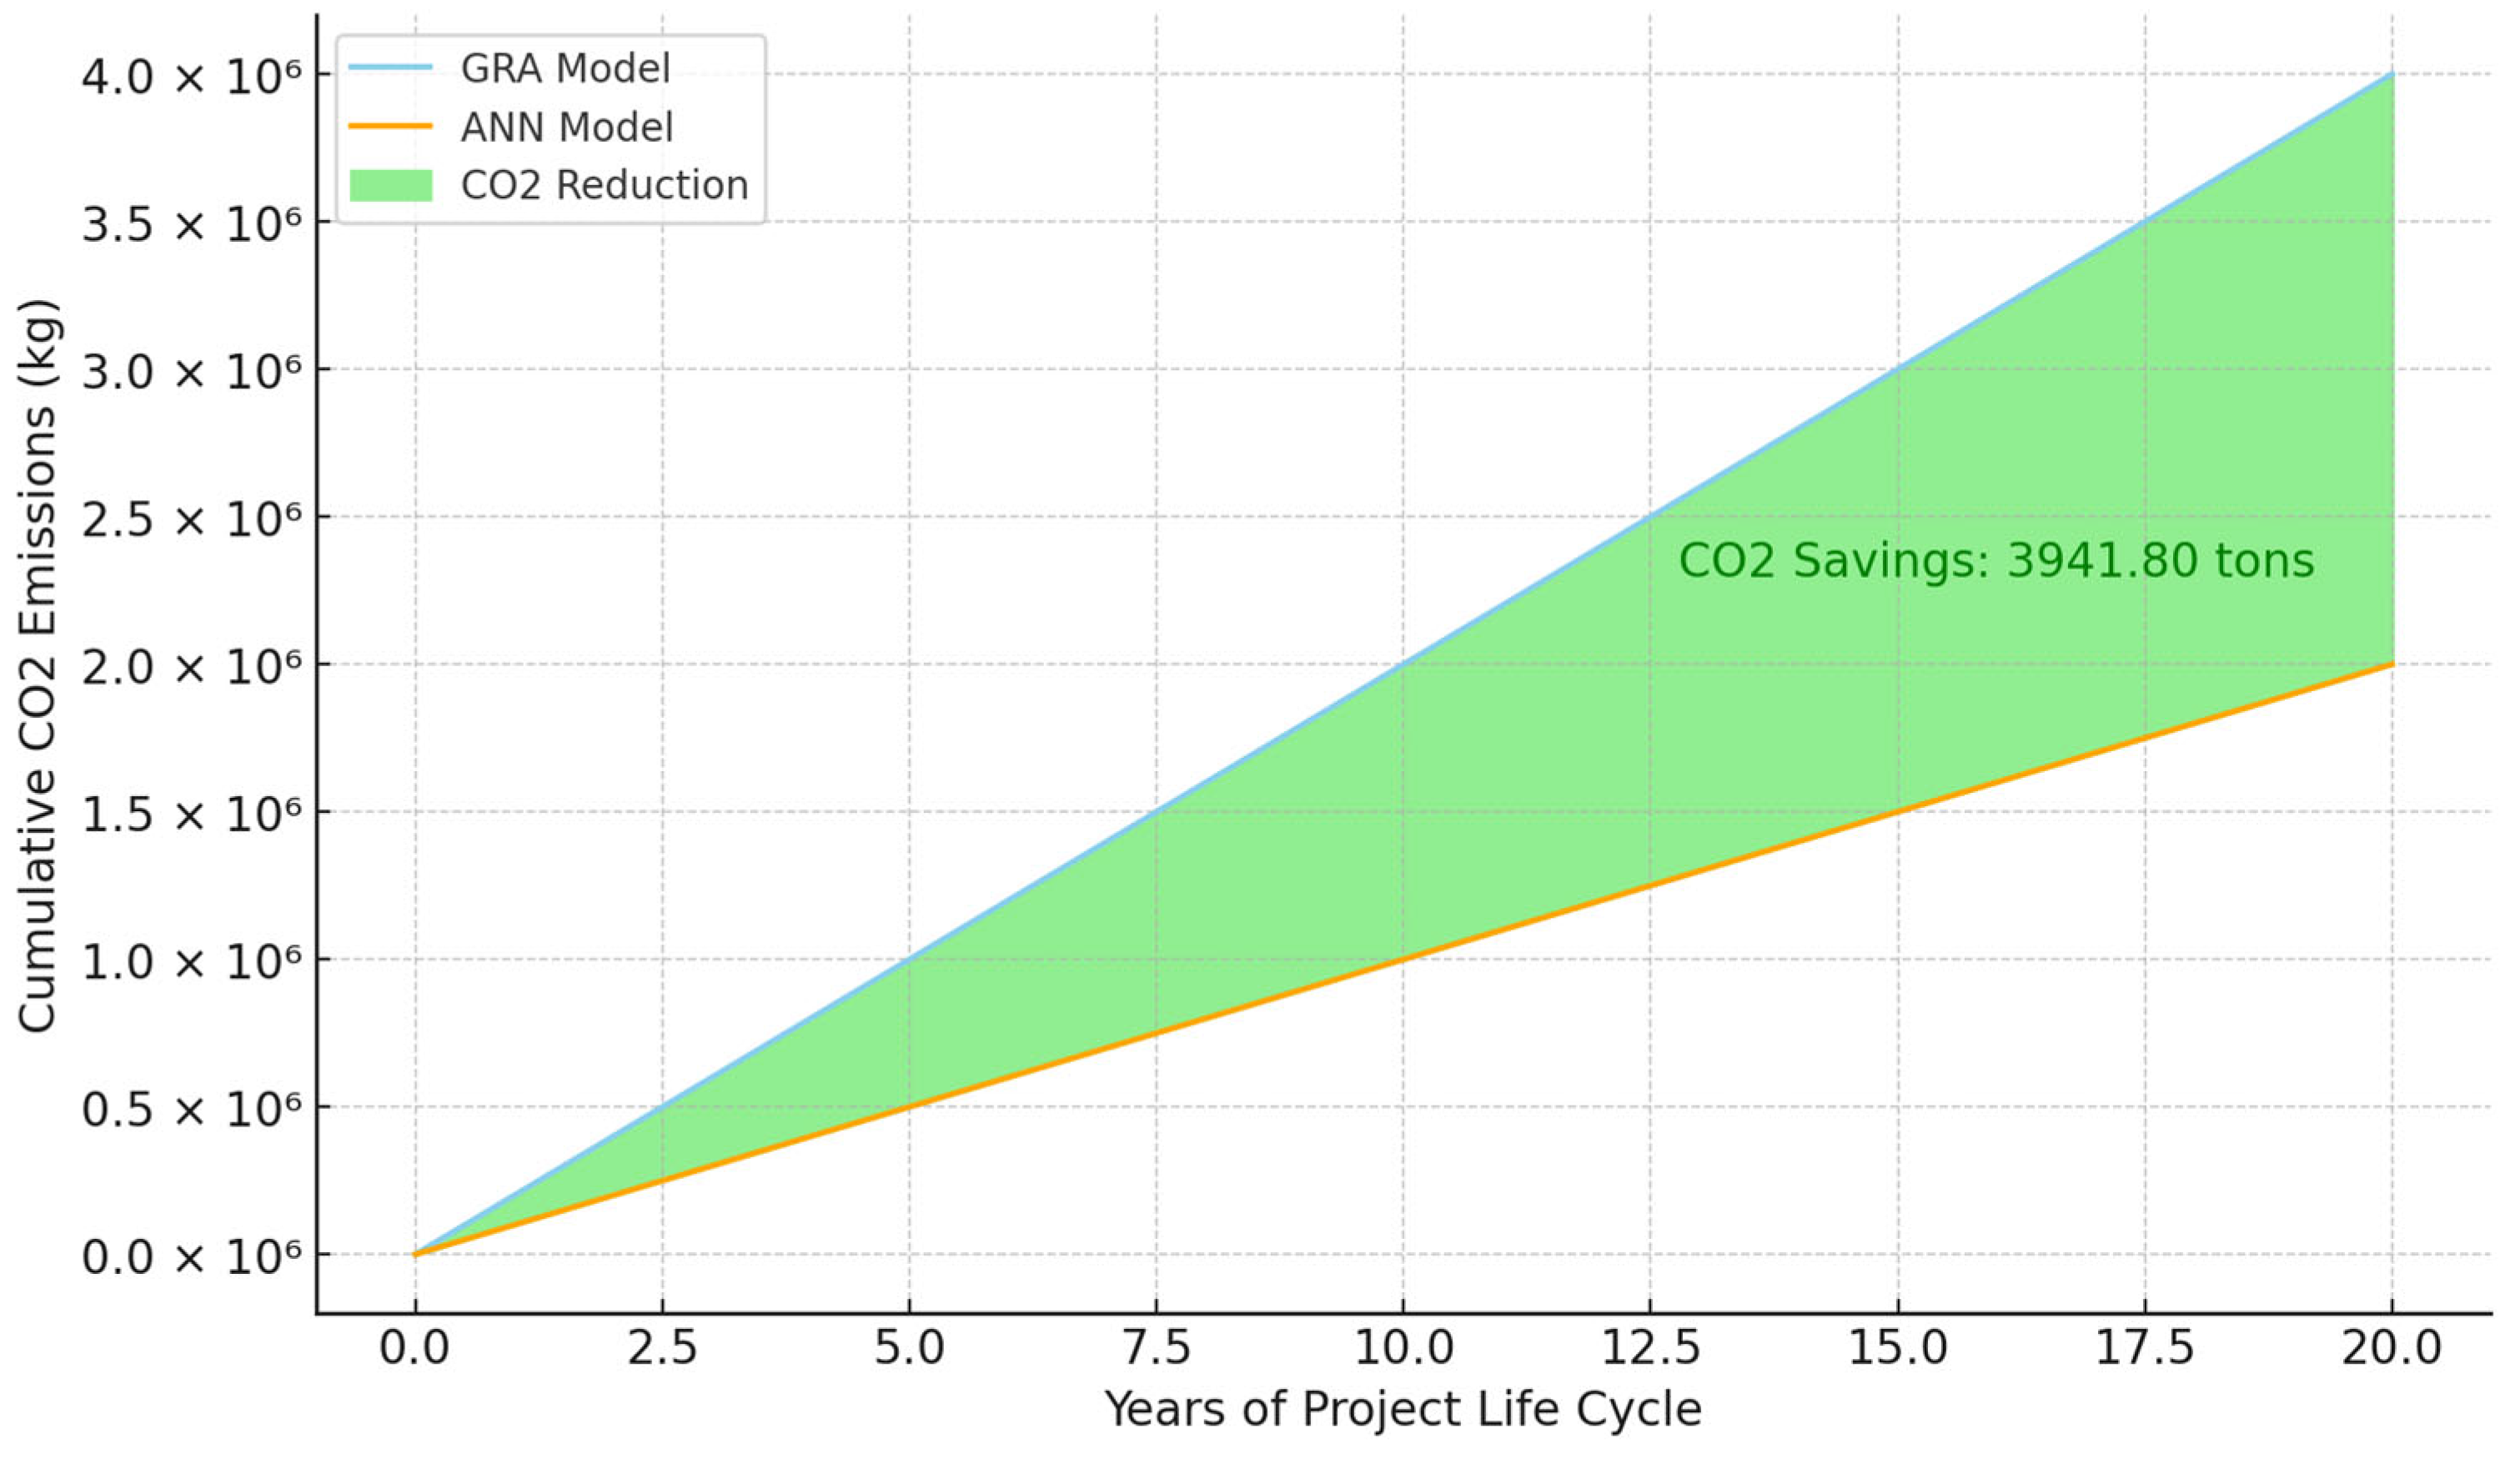
5.4. Life-Cycle Assessment (LCA) Comparison of GRA vs. ANNs
6. Limitations and Future Research Directions
7. Conclusions
Author Contributions
Funding
Data Availability Statement
Conflicts of Interest
References
- Monteiro, P.J.; Miller, S.A.; Horvath, A. Towards sustainable concrete. Nat. Mater. 2017, 16, 698–699. [Google Scholar] [CrossRef]
- Miller, S.A.; Moore, F.C. Climate and health damages from global concrete production. Nat. Clim. Change 2020, 10, 439–443. [Google Scholar] [CrossRef]
- Habert, G.; Miller, S.A.; John, V.M.; Provis, J.L.; Favier, A.; Horvath, A.; Scrivener, K.L. Environmental impacts and decarbonization strategies in the cement and concrete industries. Nat. Rev. Earth Environ. 2020, 1, 559–573. [Google Scholar] [CrossRef]
- Gholampour, A.; Ozbakkaloglu, T. Performance of sustainable concretes containing very high volume Class-F fly ash and ground granulated blast furnace slag. J. Clean. Prod. 2017, 162, 1407–1417. [Google Scholar] [CrossRef]
- Li, Q.; Zhang, L.; Gao, X.; Zhang, J. Effect of pulverized fuel ash, ground granulated blast-furnace slag and CO2 curing on performance of magnesium oxysulfate cement. Constr. Build. Mater. 2020, 230, 116990. [Google Scholar] [CrossRef]
- Kina, C.; Tanyildizi, H.; Turk, K. Forecasting the compressive strength of GGBFS-based geopolymer concrete via ensemble predictive models. Constr. Build. Mater. 2023, 405, 133299. [Google Scholar] [CrossRef]
- Shah, S.A.R.; Azab, M.; Seif ElDin, H.M.; Barakat, O.; Anwar, M.K.; Bashir, Y. Predicting compressive strength of blast furnace slag and fly ash based sustainable concrete using machine learning techniques: An application of advanced decision-making approaches. Buildings 2022, 12, 914. [Google Scholar] [CrossRef]
- Alhazmi, H.; Shah, S.A.R.; Anwar, M.K.; Raza, A.; Ullah, M.K.; Iqbal, F. Utilization of polymer concrete composites for a circular economy: A comparative review for assessment of recycling and waste utilization. Polymers 2021, 13, 2135. [Google Scholar] [CrossRef]
- Dong, W.; Huang, Y.; Cui, A.; Ma, G. Mix design optimization for fly ash-based geopolymer with mechanical, environmental, and economic objectives using soft computing technology. J. Build. Eng. 2023, 72, 106577. [Google Scholar] [CrossRef]
- Billong, N.; Oti, J.; Kinuthia, J. Using silica fume based activator in sustainable geopolymer binder for building application. Constr. Build. Mater. 2021, 275, 122177. [Google Scholar] [CrossRef]
- Venkatesan, G.; Alengaram, U.J.; Ibrahim, S.; Ibrahim, M.S.I. Effect of Fly Ash characteristics, sodium-based alkaline activators, and process variables on the compressive strength of siliceous Fly Ash geopolymers with microstructural properties: A comprehensive review. Constr. Build. Mater. 2024, 437, 136808. [Google Scholar] [CrossRef]
- Gunasekara, C.; Law, D.W.; Setunge, S.; Burgar, I.; Brkljaca, R. Effect of element distribution on strength in fly ash geopolymers. ACI Mater. J. 2017, 114, 795. [Google Scholar] [CrossRef]
- Robayo-Salazar, R.; Mejía-Arcila, J.; de Gutiérrez, R.M.; Martínez, E. Life cycle assessment (LCA) of an alkali-activated binary concrete based on natural volcanic pozzolan: A comparative analysis to OPC concrete. Constr. Build. Mater. 2018, 176, 103–111. [Google Scholar] [CrossRef]
- Terán-Cuadrado, G.; Tahir, F.; Nurdiawati, A.; Almarshoud, M.A.; Al-Ghamdi, S.G. Current and potential materials for the low-carbon cement production: Life cycle assessment perspective. J. Build. Eng. 2024, 96, 110528. [Google Scholar] [CrossRef]
- Yang, K.-H.; Song, J.-K.; Song, K.-I. Assessment of CO2 reduction of alkali-activated concrete. J. Clean. Prod. 2013, 39, 265–272. [Google Scholar] [CrossRef]
- Malkawi, A.B.; Nuruddin, M.F.; Fauzi, A.; Almattarneh, H.; Mohammed, B.S. Effects of alkaline solution on properties of the HCFA geopolymer mortars. Procedia Eng. 2016, 148, 710–717. [Google Scholar] [CrossRef]
- Rajabipour, F.; Sharbaf, M. Predicting the Alkali Contribution of SCMs to Concrete Pore Solution. In Interdisciplinary Symposium on Smart & Sustainable Infrastructures; Springer: Cham, Switzerland, 2023; pp. 152–158. [Google Scholar]
- De Weerdt, K.; Lothenbach, B.; Krüger, M.E.; Ranger, M.; Leemann, A. Impact of SCMs on alkali concentration in pore solution. In Proceedings of the International Conference on Alkali-Aggregate Reaction in Concrete; Springer: Cham, Switzerland, 2024; pp. 3–10. [Google Scholar]
- Benli, A.; Karataş, M.; Bakir, Y. An experimental study of different curing regimes on the mechanical properties and sorptivity of self-compacting mortars with fly ash and silica fume. Constr. Build. Mater. 2017, 144, 552–562. [Google Scholar] [CrossRef]
- Wang, Y.; Xiao, R.; Lu, H.; Hu, W.; Jiang, X.; Huang, B. Effect of curing conditions on the strength and durability of air entrained concrete with and without fly ash. Clean. Mater. 2023, 7, 100170. [Google Scholar] [CrossRef]
- Van Deventer, J.S.; Provis, J.L.; Duxson, P.; Brice, D.G. Chemical research and climate change as drivers in the commercial adoption of alkali activated materials. Waste Biomass Valorization 2010, 1, 145–155. [Google Scholar] [CrossRef]
- Miller, S.A.; Horvath, A.; Monteiro, P.J. Readily implementable techniques can cut annual CO2 emissions from the production of concrete by over 20%. Environ. Res. Lett. 2016, 11, 074029. [Google Scholar] [CrossRef]
- McLellan, B.C.; Williams, R.P.; Lay, J.; Van Riessen, A.; Corder, G.D. Costs and carbon emissions for geopolymer pastes in comparison to ordinary portland cement. J. Clean. Prod. 2011, 19, 1080–1090. [Google Scholar] [CrossRef]
- Turner, L.K.; Collins, F.G. Carbon dioxide equivalent (CO2-e) emissions: A comparison between geopolymer and OPC cement concrete. Constr. Build. Mater. 2013, 43, 125–130. [Google Scholar] [CrossRef]
- Payá, J.; Agrela, F.; Rosales, J.; Morales, M.M.; Borrachero, M.V. Application of alkali-activated industrial waste. In New Trends in Eco-Efficient and Recycled Concrete; Elsevier: Amsterdam, The Netherlands, 2019; pp. 357–424. [Google Scholar]
- He, M.; Yang, Z.; Li, N.; Zhu, X.; Fu, B.; Ou, Z. Strength, microstructure, CO2 emission and economic analyses of low concentration phosphoric acid-activated fly ash geopolymer. Constr. Build. Mater. 2023, 374, 130920. [Google Scholar] [CrossRef]
- Dash, P.K.; Parhi, S.K.; Patro, S.K.; Panigrahi, R. Influence of chemical constituents of binder and activator in predicting compressive strength of fly ash-based geopolymer concrete using firefly-optimized hybrid ensemble machine learning model. Mater. Today Commun. 2023, 37, 107485. [Google Scholar] [CrossRef]
- Kumar, A.; Arora, H.C.; Kapoor, N.R.; Kumar, K. Prognosis of compressive strength of fly-ash-based geopolymer-modified sustainable concrete with ML algorithms. Struct. Concr. 2023, 24, 3990–4014. [Google Scholar] [CrossRef]
- Kumar, S.; Kumar, D.R.; Wipulanusat, W.; Keawsawasvong, S. Development of ANN-Based Metaheuristic Models for the Study of the Durability Characteristics of High-Volume Fly Ash Self-Compacting Concrete with Silica Fume. J. Build. Eng. 2024, 94, 109844. [Google Scholar] [CrossRef]
- Harith, I.K.; Abbas, Z.H.; Hamzah, M.K.; Hussien, M.L. Comparison of artificial neural network and hierarchical regression in prediction compressive strength of self-compacting concrete with fly ash. Innov. Infrastruct. Solut. 2024, 9, 62. [Google Scholar] [CrossRef]
- Song, H.; Ahmad, A.; Farooq, F.; Ostrowski, K.A.; Maślak, M.; Czarnecki, S.; Aslam, F. Predicting the compressive strength of concrete with fly ash admixture using machine learning algorithms. Constr. Build. Mater. 2021, 308, 125021. [Google Scholar] [CrossRef]
- Rao, J.V.; Kumar, K.H.; Satish, N. Compressive Strength Prediction of Fly Ash Geopolymer Concrete Using Support Vector and Random Forest Regression. J. Phys. Conf. Ser. 2024, 2779, 012048. [Google Scholar]
- Li, Y.; Shen, J.; Lin, H.; Li, Y. Optimization design for alkali-activated slag-fly ash geopolymer concrete based on artificial intelligence considering compressive strength, cost, and carbon emission. J. Build. Eng. 2023, 75, 106929. [Google Scholar] [CrossRef]
- Arifeen, S.U.; Amin, M.N.; Ahmad, W.; Althoey, F.; Ali, M.; Alotaibi, B.S.; Abuhussain, M.A. A comparative study of prediction models for alkali-activated materials to promote quick and economical adaptability in the building sector. Constr. Build. Mater. 2023, 407, 133485. [Google Scholar] [CrossRef]
- Peng, Y.; Unluer, C. Analyzing the mechanical performance of fly ash-based geopolymer concrete with different machine learning techniques. Constr. Build. Mater. 2022, 316, 125785. [Google Scholar] [CrossRef]
- Khursheed, S.; Jagan, J.; Samui, P.; Kumar, S. Compressive strength prediction of fly ash concrete by using machine learning techniques. Innov. Infrastruct. Solut. 2021, 6, 149. [Google Scholar] [CrossRef]
- Ferdous, W.; Manalo, A.; Aravinthan, T. Bond behaviour of composite sandwich panel and epoxy polymer matrix: Taguchi design of experiments and theoretical predictions. Constr. Build. Mater. 2017, 145, 76–87. [Google Scholar] [CrossRef]
- Hadi, M.N.; Farhan, N.A.; Sheikh, M.N. Design of geopolymer concrete with GGBFS at ambient curing condition using Taguchi method. Constr. Build. Mater. 2017, 140, 424–431. [Google Scholar] [CrossRef]
- Prusty, J.K.; Pradhan, B. Multi-response optimization using Taguchi-Grey relational analysis for composition of fly ash-ground granulated blast furnace slag based geopolymer concrete. Constr. Build. Mater. 2020, 241, 118049. [Google Scholar] [CrossRef]
- Anwar, M.K.; Qurashi, M.A.; Zhu, X.; Shah, S.A.R.; Siddiq, M.U. A Comparative Performance Analysis of Machine Learning Models for Compressive Strength Prediction in Fly Ash-Based Geopolymers Concrete Using Reference Data. Case Stud. Constr. Mater. 2025, 22, e04207. [Google Scholar] [CrossRef]
- Ahmad, A.; Ahmad, W.; Aslam, F.; Joyklad, P. Compressive strength prediction of fly ash-based geopolymer concrete via advanced machine learning techniques. Case Stud. Constr. Mater. 2022, 16, e00840. [Google Scholar] [CrossRef]
- Rathnayaka, M.; Karunasinghe, D.; Gunasekara, C.; Wijesundara, K.; Lokuge, W.; Law, D.W. Machine learning approaches to predict compressive strength of fly ash-based geopolymer concrete: A comprehensive review. Constr. Build. Mater. 2024, 419, 135519. [Google Scholar] [CrossRef]
- Yi, S.-T.; Yang, E.-I.; Choi, J.-C. Effect of specimen sizes, specimen shapes, and placement directions on compressive strength of concrete. Nucl. Eng. Des. 2006, 236, 115–127. [Google Scholar] [CrossRef]
- Torres, B.M.; Völker, C.; Firdous, R. Concreting a sustainable future: A dataset of alkali-activated concrete and its properties. Data Brief 2023, 50, 109525. [Google Scholar] [CrossRef]
- Xie, T.; Visintin, P.; Zhao, X.; Gravina, R. Mix design and mechanical properties of geopolymer and alkali activated concrete: Review of the state-of-the-art and the development of a new unified approach. Constr. Build. Mater. 2020, 256, 119380. [Google Scholar] [CrossRef]
- Luan, C.; Zhou, A.; Li, Y.; Zou, D.; Gao, P.; Liu, T. CO2 avoidance cost of fly ash geopolymer concrete. Constr. Build. Mater. 2024, 416, 135193. [Google Scholar] [CrossRef]
- Shobeiri, V.; Bennett, B.; Xie, T.; Visintin, P. A comprehensive assessment of the global warming potential of geopolymer concrete. J. Clean. Prod. 2021, 297, 126669. [Google Scholar] [CrossRef]
- Habert, G.; Ouellet-Plamondon, C. Recent update on the environmental impact of geopolymers. RILEM Tech. Lett. 2016, 1, 17–23. [Google Scholar] [CrossRef]
- Salas, D.A.; Ramirez, A.D.; Ulloa, N.; Baykara, H.; Boero, A.J. Life cycle assessment of geopolymer concrete. Constr. Build. Mater. 2018, 190, 170–177. [Google Scholar] [CrossRef]
- Al-Fakih, A.; Al-wajih, E.; Saleh, R.A.; Muhit, I.B. Ensemble machine learning models for predicting the CO2 footprint of GGBFS-based geopolymer concrete. J. Clean. Prod. 2024, 472, 143463. [Google Scholar] [CrossRef]
- T/CBMF 27–2018; Methods and Requirements of Low-Carbon Products Evaluation for Ready-Mixed Concrete. China Building Materials Federation (CBMF): Beijing, China, 2018.
- Zhang, Z.; Zhu, Y.; Yang, T.; Li, L.; Zhu, H.; Wang, H. Conversion of local industrial wastes into greener cement through geopolymer technology: A case study of high-magnesium nickel slag. J. Clean. Prod. 2017, 141, 463–471. [Google Scholar] [CrossRef]
- Hong, J.; Chen, W.; Wang, Y.; Xu, C.; Xu, X. Life cycle assessment of caustic soda production: A case study in China. J. Clean. Prod. 2014, 66, 113–120. [Google Scholar] [CrossRef]
- Research Institute of Highway Ministry of Transport. Analysis Report on the Operation of China’s Road Transportation Industry Based on Big Data; Research Institute of Highway Ministry of Transport: Beijing, China, 2021. [Google Scholar]
- Zhou, W.; Jiang, D.; Chen, D.; Griffy-Brown, C.; Jin, Y.; Zhu, B. Capturing CO2 from cement plants: A priority for reducing CO2 emissions in China. Energy 2016, 106, 464–474. [Google Scholar] [CrossRef]
- Arpitha, B.; Parthasarathy, P. Enhanced approach for geopolymer mix-design and performance evaluation: Integrating hybrid Taguchi-GRA-PCA for improved properties and behavioral insights. Constr. Build. Mater. 2024, 433, 136701. [Google Scholar]
- Mahendra, K.; Narasimhan, M.C.; Prakash, G.B.; Das, A.K. Multi-objective optimization of one-part alkali-activated mortar mixes using Taguchi-Grey relational analysis. Constr. Build. Mater. 2024, 412, 134761. [Google Scholar] [CrossRef]
- Lokuge, W.; Wilson, A.; Gunasekara, C.; Law, D.W.; Setunge, S. Design of fly ash geopolymer concrete mix proportions using Multivariate Adaptive Regression Spline model. Constr. Build. Mater. 2018, 166, 472–481. [Google Scholar] [CrossRef]
- Assi, L.N.; Deaver, E.E.; ElBatanouny, M.K.; Ziehl, P. Investigation of early compressive strength of fly ash-based geopolymer concrete. Constr. Build. Mater. 2016, 112, 807–815. [Google Scholar] [CrossRef]
- Shaikh, F.; Vimonsatit, V. Compressive strength of fly-ash-based geopolymer concrete at elevated temperatures. Fire Mater. 2015, 39, 174–188. [Google Scholar] [CrossRef]
- Muthadhi, A.; Suganya, B. Effect of activator on strength and microstructure of alkali activated concrete with class C fly ash. Iran. J. Sci. Technol. Trans. Civ. Eng. 2021, 46, 261–269. [Google Scholar] [CrossRef]
- Mehta, A.; Siddique, R.; Ozbakkaloglu, T.; Shaikh, F.U.A.; Belarbi, R. Fly ash and ground granulated blast furnace slag-based alkali-activated concrete: Mechanical, transport and microstructural properties. Constr. Build. Mater. 2020, 257, 119548. [Google Scholar] [CrossRef]
- Mehta, A.; Siddique, R. Sulfuric acid resistance of fly ash based geopolymer concrete. Constr. Build. Mater. 2017, 146, 136–143. [Google Scholar] [CrossRef]
- Rai, B.; Roy, L.; Rajjak, M. A statistical investigation of different parameters influencing compressive strength of fly ash induced geopolymer concrete. Struct. Concr. 2018, 19, 1268–1279. [Google Scholar] [CrossRef]
- Zhang, H.; Li, L.; Sarker, P.K.; Long, T.; Shi, X.; Wang, Q.; Cai, G. Investigating various factors affecting the long-term compressive strength of heat-cured fly ash geopolymer concrete and the use of orthogonal experimental design method. Int. J. Concr. Struct. Mater. 2019, 13, 63. [Google Scholar] [CrossRef]
- Abdulrahman, H.; Muhamad, R.; Visintin, P.; Shukri, A.A. Mechanical properties and bond stress-slip behaviour of fly ash geopolymer concrete. Constr. Build. Mater. 2022, 327, 126909. [Google Scholar] [CrossRef]
- Nguyen, T.T.; Goodier, C.I.; Austin, S.A. Factors affecting the slump and strength development of geopolymer concrete. Constr. Build. Mater. 2020, 261, 119945. [Google Scholar] [CrossRef]
- Ruengsillapanun, K.; Udtaranakron, T.; Pulngern, T.; Tangchirapat, W.; Jaturapitakkul, C. Mechanical properties, shrinkage, and heat evolution of alkali activated fly ash concrete. Constr. Build. Mater. 2021, 299, 123954. [Google Scholar] [CrossRef]
- Law, D.W.; Adam, A.A.; Molyneaux, T.K.; Patnaikuni, I.; Wardhono, A. Long term durability properties of class F fly ash geopolymer concrete. Mater. Struct. 2015, 48, 721–731. [Google Scholar] [CrossRef]
- Adam, A. Strength and Durability Properties of Alkali Activated Slag and Fly Ash-Based Geopolymer Concrete. Ph.D. Thesis, RMIT University, Melbourne, Australia, 2009. [Google Scholar]
- Gunasekera, C.; Setunge, S.; Law, D.W. Correlations between mechanical properties of low-calcium fly ash geopolymer concretes. J. Mater. Civ. Eng. 2017, 29, 04017111. [Google Scholar] [CrossRef]
- Gunasekara, C.; Law, D.W.; Setunge, S. Long term permeation properties of different fly ash geopolymer concretes. Constr. Build. Mater. 2016, 124, 352–362. [Google Scholar] [CrossRef]
- Topark-Ngarm, P.; Chindaprasirt, P.; Sata, V. Setting time, strength, and bond of high-calcium fly ash geopolymer concrete. J. Mater. Civ. Eng. 2015, 27, 04014198. [Google Scholar] [CrossRef]
- Thomas, R.J.; Peethamparan, S. Alkali-activated concrete: Engineering properties and stress–strain behavior. Constr. Build. Mater. 2015, 93, 49–56. [Google Scholar] [CrossRef]
- Nuaklong, P.; Sata, V.; Chindaprasirt, P. Influence of recycled aggregate on fly ash geopolymer concrete properties. J. Clean. Prod. 2016, 112, 2300–2307. [Google Scholar] [CrossRef]
- Farhan, N.A.; Sheikh, M.N.; Hadi, M.N. Investigation of engineering properties of normal and high strength fly ash based geopolymer and alkali-activated slag concrete compared to ordinary Portland cement concrete. Constr. Build. Mater. 2019, 196, 26–42. [Google Scholar] [CrossRef]
- Le, T.A.; Le, S.H.; Nguyen, T.N.; Nguyen, K.T. Assessment of the rheological and mechanical properties of geopolymer concrete comprising fly ash and fluid catalytic cracking residue as aluminosilicate precursor. Appl. Sci. 2021, 11, 3032. [Google Scholar] [CrossRef]
- Sarker, P.K. Bond strength of reinforcing steel embedded in fly ash-based geopolymer concrete. Mater. Struct. 2011, 44, 1021–1030. [Google Scholar] [CrossRef]
- Deb, P.S.; Nath, P.; Sarker, P.K. The effects of ground granulated blast-furnace slag blending with fly ash and activator content on the workability and strength properties of geopolymer concrete cured at ambient temperature. Mater. Des. 2014, 62, 32–39. [Google Scholar] [CrossRef]
- Yang, W.; Zhu, P.; Liu, H.; Wang, X.; Ge, W.; Hua, M. Resistance to sulfuric acid corrosion of geopolymer concrete based on different binding materials and alkali concentrations. Materials 2021, 14, 7109. [Google Scholar] [CrossRef] [PubMed]
- Ali, I.M.; Naje, A.S.; Al-Zubaidi, H.; Al-Kateeb, R. Performance evaluation of fly ash-based geopolymer concrete incorporating nano slag. Glob. Nest J. 2019, 21, 70–75. [Google Scholar]
- Okoye, F.; Durgaprasad, J.; Singh, N. Effect of silica fume on the mechanical properties of fly ash based-geopolymer concrete. Ceram. Int. 2016, 42, 3000–3006. [Google Scholar] [CrossRef]
- Nath, P.; Sarker, P.K. Use of OPC to improve setting and early strength properties of low calcium fly ash geopolymer concrete cured at room temperature. Cem. Concr. Compos. 2015, 55, 205–214. [Google Scholar] [CrossRef]
- Nagajothi, S.; Elavenil, S. Effect of GGBS addition on reactivity and microstructure properties of ambient cured fly ash based geopolymer concrete. Silicon 2021, 13, 507–516. [Google Scholar] [CrossRef]
- Mehta, A.; Siddique, R. Strength, permeability and micro-structural characteristics of low-calcium fly ash based geopolymers. Constr. Build. Mater. 2017, 141, 325–334. [Google Scholar] [CrossRef]
- Mehta, A.; Siddique, R. Properties of low-calcium fly ash based geopolymer concrete incorporating OPC as partial replacement of fly ash. Constr. Build. Mater. 2017, 150, 792–807. [Google Scholar] [CrossRef]
- Chindaprasirt, P.; Chalee, W. Effect of sodium hydroxide concentration on chloride penetration and steel corrosion of fly ash-based geopolymer concrete under marine site. Constr. Build. Mater. 2014, 63, 303–310. [Google Scholar] [CrossRef]
- Gunasekara, C.; Dirgantara, R.; Law, D.W.; Setunge, S. Effect of curing conditions on microstructure and pore-structure of brown coal fly ash geopolymers. Appl. Sci. 2019, 9, 3138. [Google Scholar] [CrossRef]
- Memon, F.A.; Nuruddin, M.F.; Shafiq, N. Effect of silica fume on the fresh and hardened properties of fly ash-based self-compacting geopolymer concrete. Int. J. Miner. Metall. Mater. 2013, 20, 205–213. [Google Scholar] [CrossRef]
- Gomaa, E.; Sargon, S.; Kashosi, C.; Gheni, A.; ElGawady, M.A. Mechanical properties of high early strength class C fly ash-based alkali activated concrete. Transp. Res. Rec. 2020, 2674, 430–443. [Google Scholar] [CrossRef]
- Nuruddin, M.F.; Demie, S.; Shafiq, N. Effect of mix composition on workability and compressive strength of self-compacting geopolymer concrete. Can. J. Civ. Eng. 2011, 38, 1196–1203. [Google Scholar] [CrossRef]
- Cui, Y.; Gao, K.; Zhang, P. Experimental and statistical study on mechanical characteristics of geopolymer concrete. Materials 2020, 13, 1651. [Google Scholar] [CrossRef]
- Olivia, M.; Nikraz, H. Properties of fly ash geopolymer concrete designed by Taguchi method. Mater. Des. 2012, 36, 191–198. [Google Scholar] [CrossRef]
- Verma, M.; Dev, N. Effect of ground granulated blast furnace slag and fly ash ratio and the curing conditions on the mechanical properties of geopolymer concrete. Struct. Concr. 2022, 23, 2015–2029. [Google Scholar] [CrossRef]
- Zhang, H.; Li, L.; Long, T.; Sarker, P.K.; Shi, X.; Cai, G.; Wang, Q. The effect of ordinary portland cement substitution on the thermal stability of geopolymer concrete. Materials 2019, 12, 2501. [Google Scholar] [CrossRef]
- Long, T.; Wang, Q.; Guan, Z.; Chen, Y.; Shi, X. Deterioration and microstructural evolution of the fly ash geopolymer concrete against MgSO4 solution. Adv. Mater. Sci. Eng. 2017, 2017, 4247217. [Google Scholar] [CrossRef]
- Negahban, E.; Bagheri, A.; Sanjayan, J. Pore gradation effect on Portland cement and geopolymer concretes. Cem. Concr. Compos. 2021, 122, 104141. [Google Scholar] [CrossRef]
- Diaz-Loya, E.I.; Allouche, E.N.; Vaidya, S. Mechanical properties of fly-ash-based geopolymer concrete. ACI Mater. J. 2011, 108, 300. [Google Scholar]
- Cornelis, R.; Priyosulityo, H.; Satyarno, I.; Rustendi, I. Effect of the mortar volume ratio on the mechanical behavior of class CI fly ash-based geopolymer concrete. Civ. Eng. J. 2022, 8, 1920–1935. [Google Scholar] [CrossRef]
- Wardhono, A.; Law, D.; Molyneaux, T. The mechanical properties of fly ash geopolymer in long term performance. In Proceedings of the the CIC2014 “Concrete Innovation Conference”, Oslo, Norway, 1–13 June 2014. [Google Scholar]
- Shehab, H.K.; Eisa, A.S.; Wahba, A.M. Mechanical properties of fly ash based geopolymer concrete with full and partial cement replacement. Constr. Build. Mater. 2016, 126, 560–565. [Google Scholar] [CrossRef]
- Hongen, Z.; Feng, J.; Qingyuan, W.; Ling, T.; Xiaoshuang, S. Influence of Cement on Properties of Fly-Ash-Based Concrete. ACI Mater. J. 2017, 114, 745. [Google Scholar] [CrossRef]
- Pachamuthu, S.; Thangaraju, P. Utjecaj pepela iz papirnog mulja na geopolimerni beton s letećim pepelom. J. Gradev. 2017, 69, 851–859. [Google Scholar]
- Vora, P.R.; Dave, U.V. Parametric studies on compressive strength of geopolymer concrete. Procedia Eng. 2013, 51, 210–219. [Google Scholar] [CrossRef]
- Zhang, H.; Li, L.; Yuan, C.; Wang, Q.; Sarker, P.K.; Shi, X. Deterioration of ambient-cured and heat-cured fly ash geopolymer concrete by high temperature exposure and prediction of its residual compressive strength. Constr. Build. Mater. 2020, 262, 120924. [Google Scholar] [CrossRef]
- Ahmed, M.F.; Nuruddin, M.F.; Shafiq, N. Compressive strength and workability characteristics of low-calcium fly ash-based self-compacting geopolymer concrete. Int. J. Civ. Environ. Eng. 2011, 5, 64–70. [Google Scholar]
- Hassan, A.; Arif, M.; Shariq, M. Effect of curing condition on the mechanical properties of fly ash-based geopolymer concrete. SN Appl. Sci. 2019, 1, 1694. [Google Scholar] [CrossRef]
- Memon, F.A.; Nuruddin, F.; Demie, S.; Shafiq, N. Effect of curing conditions on strength of fly ash-based self-compacting geopolymer concrete. Int. J. Civ. Environ. Eng. 2011, 3, 3–29. [Google Scholar]
- Wallah, S. Creep behaviour of fly ash-based geopolymer concrete. Civ. Eng. Dimens. 2010, 12, 73–78. [Google Scholar]
- Sarker, P.K.; Haque, R.; Ramgolam, K.V. Fracture behaviour of heat cured fly ash based geopolymer concrete. Mater. Des. 2013, 44, 580–586. [Google Scholar] [CrossRef]
- Shaikh, F.U.A. Mechanical and durability properties of fly ash geopolymer concrete containing recycled coarse aggregates. Int. J. Sustain. Built Environ. 2016, 5, 277–287. [Google Scholar] [CrossRef]
- Patankar, S.V.; Jamkar, S.S.; Ghugal, Y.M. Effect of water-to-geopolymer binder ratio on the production of fly ash based geopolymer concrete. Int. J. Adv. Technol. Civ. Eng 2013, 2, 79–83. [Google Scholar] [CrossRef]
- Olivia, M.; Nikraz, H. Strength and water penetrability of fly ash geopolymer conrete. J. Eng. Appl. Sci. 2011, 6, 70–78. [Google Scholar]
- Olivia, M.; Nikraz, H. Water penetrability of low calcium fly ash geopolymer concrete. Proc. Iccbt2008-A 2008, 46, 517–530. [Google Scholar]
- Gunasekara, C.; Atzarakis, P.; Lokuge, W.; Law, D.W.; Setunge, S. Novel analytical method for mix design and performance prediction of high calcium fly ash geopolymer concrete. Polymers 2021, 13, 900. [Google Scholar] [CrossRef]
- Demie, S.; Nuruddin, M.F.; Shafiq, N. Effects of micro-structure characteristics of interfacial transition zone on the compressive strength of self-compacting geopolymer concrete. Constr. Build. Mater. 2013, 41, 91–98. [Google Scholar] [CrossRef]
- Çevik, A.; Alzeebaree, R.; Humur, G.; Niş, A.; Gülşan, M.E. Effect of nano-silica on the chemical durability and mechanical performance of fly ash based geopolymer concrete. Ceram. Int. 2018, 44, 12253–12264. [Google Scholar] [CrossRef]
- Okoye, F.; Durgaprasad, J.; Singh, N. Mechanical properties of alkali activated flyash/Kaolin based geopolymer concrete. Constr. Build. Mater. 2015, 98, 685–691. [Google Scholar] [CrossRef]
- Jena, S.; Panigrahi, R.; Sahu, P. Mechanical and durability properties of fly ash geopolymer concrete with silica fume. J. Inst. Eng. (India) Ser. A 2019, 100, 697–705. [Google Scholar] [CrossRef]
- Wang, Y.; Hu, S.; He, Z. Mechanical and fracture properties of fly ash geopolymer concrete addictive with calcium aluminate cement. Materials 2019, 12, 2982. [Google Scholar] [CrossRef] [PubMed]
- Bellum, R.R.; Venkatesh, C.; Madduru, S.R.C. Influence of red mud on performance enhancement of fly ash-based geopolymer concrete. Innov. Infrastruct. Solut. 2021, 6, 215. [Google Scholar] [CrossRef]
- Embong, R.; Kusbiantoro, A.; Shafiq, N.; Nuruddin, M.F. Strength and microstructural properties of fly ash based geopolymer concrete containing high-calcium and water-absorptive aggregate. J. Clean. Prod. 2016, 112, 816–822. [Google Scholar] [CrossRef]
- Pan, Z.; Sanjayan, J.G.; Rangan, B.V. Fracture properties of geopolymer paste and concrete. Mag. Concr. Res. 2011, 63, 763–771. [Google Scholar] [CrossRef]
- Kusbiantoro, A.; Nuruddin, M.F.; Shafiq, N.; Qazi, S.A. The effect of microwave incinerated rice husk ash on the compressive and bond strength of fly ash based geopolymer concrete. Constr. Build. Mater. 2012, 36, 695–703. [Google Scholar] [CrossRef]
- Joseph, B.; Mathew, G. Influence of aggregate content on the behavior of fly ash based geopolymer concrete. Sci. Iran. 2012, 19, 1188–1194. [Google Scholar] [CrossRef]
- Vikas, G.; Rao, T.G. Setting time, workability and strength properties of alkali activated fly ash and slag based geopolymer concrete activated with high silica modulus water glass. Iran. J. Sci. Technol. Trans. Civ. Eng. 2021, 45, 1483–1492. [Google Scholar] [CrossRef]
- Haruna, S.; Mohammed, B.S.; Wahab, M.; Liew, M. Effect of paste aggregate ratio and curing methods on the performance of one-part alkali-activated concrete. Constr. Build. Mater. 2020, 261, 120024. [Google Scholar] [CrossRef]
- Kar, A.; Ray, I.; Unnikrishnan, A.; Halabe, U.B. Prediction models for compressive strength of concrete with Alkali-activated binders. Comput. Concr. 2016, 17, 523–539. [Google Scholar] [CrossRef]
- Aleem, M.A.; Arumairaj, P. Optimum mix for the geopolymer concrete. Indian J. Sci. Technol. 2012, 5, 2299–2301. [Google Scholar] [CrossRef]
- Wardhono, A.; Gunasekara, C.; Law, D.W.; Setunge, S. Comparison of long term performance between alkali activated slag and fly ash geopolymer concretes. Constr. Build. Mater. 2017, 143, 272–279. [Google Scholar] [CrossRef]
- Luan, C.; Shi, X.; Zhang, K.; Utashev, N.; Yang, F.; Dai, J.; Wang, Q. A mix design method of fly ash geopolymer concrete based on factors analysis. Constr. Build. Mater. 2021, 272, 121612. [Google Scholar] [CrossRef]
- Shekhovtsova, J.; Kovtun, M.; Kearsley, E.P. Evaluation of short-and long-term properties of heat-cured alkali-activated fly ash concrete. Mag. Concr. Res. 2015, 67, 897–905. [Google Scholar] [CrossRef]
- Mortar, N.A.M.; Kamarudin, H.; Rafiza, R.; Meor, T.; Rosnita, M. Compressive strength of fly ash geopolymer concrete by varying sodium hydroxide molarity and aggregate to binder ratio. IOP Conf. Ser.: Mater. Sci. Eng. 2020, 864, 012037. [Google Scholar] [CrossRef]
- Xie, T.; Ozbakkaloglu, T. Behavior of low-calcium fly and bottom ash-based geopolymer concrete cured at ambient temperature. Ceram. Int. 2015, 41, 5945–5958. [Google Scholar] [CrossRef]
- Bocullo, V.; Vaičiukynienė, D.; Gečys, R.; Daukšys, M. Effect of ordinary portland cement and water glass on the properties of alkali activated fly ash concrete. Minerals 2019, 10, 40. [Google Scholar] [CrossRef]
- Chithambaram, S.J.; Kumar, S.; Prasad, M.M.; Adak, D. Effect of parameters on the compressive strength of fly ash based geopolymer concrete. Struct. Concr. 2018, 19, 1202–1209. [Google Scholar] [CrossRef]
- Al-Azzawi, M.; Yu, T.; Hadi, M.N. Factors affecting the bond strength between the fly ash-based geopolymer concrete and steel reinforcement. Structures 2018, 14, 262–272. [Google Scholar] [CrossRef]
- Hardjito, D.; Rangan, B.V. Development and Properties of Low-Calcium Fly Ash-Based Geopolymer Concrete; Curtin University of Technology: Perth, Australia, 2005. [Google Scholar]
- Dai, J.; Shi, X.; Wang, Q.; Zhang, H.; Luan, C.; Zhang, K.; Yang, F. The influence of multiple factors on the compressive strength of recycled composite admixture-based geopolymer concrete. Mater. Rep. 2021, 35, 9077–9082. [Google Scholar]
- Nazar, S.; Yang, J.; Amin, M.N.; Khan, K.; Ashraf, M.; Aslam, F.; Javed, M.F.; Eldin, S.M. Machine learning interpretable-prediction models to evaluate the slump and strength of fly ash-based geopolymer. J. Mater. Res. Technol. 2023, 24, 100–124. [Google Scholar] [CrossRef]
- Ahmed, H.U.; Mohammed, A.S.; Faraj, R.H.; Abdalla, A.A.; Qaidi, S.M.; Sor, N.H.; Mohammed, A.A. Innovative modeling techniques including MEP, ANN and FQ to forecast the compressive strength of geopolymer concrete modified with nanoparticles. Neural Comput. Appl. 2023, 35, 12453–12479. [Google Scholar] [CrossRef]
- Van Deventer, J.; Provis, J. Alkali-Activated Materials: State-of-the-Art Report, RILEM TC 224-AAM; Springer: Dordrecht, The Netherlands, 2014. [Google Scholar]
- Davidovits, J. Geopolymer Chemistry and Applications; Geopolymer Institute: Saint-Quentin, France, 2008. [Google Scholar]
- Rangan, B. Engineering properties of geopolymer concrete. In Geopolymers; Elsevier: Amsterdam, The Netherlands, 2009; pp. 211–226. [Google Scholar]
- Nath, P.; Sarker, P.K. Flexural strength and elastic modulus of ambient-cured blended low-calcium fly ash geopolymer concrete. Constr. Build. Mater. 2017, 130, 22–31. [Google Scholar] [CrossRef]
- Liu, M.; Dai, W.; Jin, W.; Li, M.; Yang, X.; Han, Y.; Huang, M. Mix proportion design and carbon emission assessment of high strength geopolymer concrete based on ternary solid waste. Sci. Rep. 2024, 14, 24989. [Google Scholar] [CrossRef]
- Ansari, M.A.; Shariq, M.; Mahdi, F. Multioptimization of FA-Based Geopolymer Concrete Mixes: A Synergistic Approach Using Gray Relational Analysis and Principal Component Analysis. J. Struct. Des. Constr. Pract. 2025, 30, 04024101. [Google Scholar] [CrossRef]
- Jiang, P.; Zhao, D.; Jin, C.; Ye, S.; Luan, C.; Tufail, R.F. Compressive strength prediction and low-carbon optimization of fly ash geopolymer concrete based on big data and ensemble learning. PLoS ONE 2024, 19, e0310422. [Google Scholar] [CrossRef]
- Habert, G.; De Lacaillerie, J.D.E.; Roussel, N. An environmental evaluation of geopolymer based concrete production: Reviewing current research trends. J. Clean. Prod. 2011, 19, 1229–1238. [Google Scholar] [CrossRef]
- Allam, Z.; Cheshmehzangi, A. Sustainable Futures and Green New Deals; Springer: Cham, Switzerland, 2024. [Google Scholar]


| No. | Influential Factors | Unit | Mean | Std. | Min. | Q1 | Q2 | Q3 | Max. | |
|---|---|---|---|---|---|---|---|---|---|---|
| X1 | SiO2 | Chemical composition | % | 51.4 | 11.1 | 17.6 | 45.2 | 51.3 | 59.7 | 77.2 |
| X2 | Al2O3 | % | 24.9 | 5.9 | 6.4 | 21.4 | 26.5 | 28.4 | 45.9 | |
| X3 | CaO | % | 6.84 | 7.66 | 0.00 | 2.10 | 3.42 | 10.7 | 37 | |
| X4 | Fe2O3 | % | 9.24 | 6.45 | 0.90 | 4.57 | 7.12 | 13.2 | 40.5 | |
| X5 | MgO | % | 1.77 | 1.51 | 0 | 0.77 | 1.26 | 2.20 | 9.39 | |
| X6 | Fly ash | Mix proportions | kg/m3 | 415.7 | 94.3 | 254.5 | 388 | 408 | 450 | 1050 |
| X7 | C-Agg | kg/m3 | 1167.5 | 174.2 | 594.3 | 1080 | 1201 | 1276.8 | 2291 | |
| X8 | F-Agg | kg/m3 | 635 | 134 | 318 | 548 | 630 | 663 | 1728 | |
| X9 | NaOH | kg/m3 | 379 | 667.5 | 0 | 44.9 | 58.4 | 108 | 1967 | |
| X10 | Na2SiO3 | kg/m3 | 133 | 55.1 | 0 | 103 | 121.7 | 143 | 386 | |
| X11 | Molarity | kg/m3 | 11.7 | 3.1 | 2 | 10 | 12 | 14 | 20 | |
| X12 | Extra. H2O | kg/m3 | 15.1 | 26.6 | 0 | 0 | 0 | 20.70 | 175 | |
| X13 | Na2O | Alkaline activator factors | kg/m3 | 35.1 | 13.1 | 14.7 | 27.2 | 31.8 | 37.9 | 128.6 |
| X14 | SiO2 | kg/m3 | 40.5 | 15.8 | 0 | 30.3 | 38.4 | 44.9 | 113.5 | |
| X15 | H2O | kg/m3 | 137.5 | 50.9 | 63.8 | 100 | 123.0 | 167.8 | 358.9 | |
| X16 | Density | - | kg/m3 | 2431 | 298 | 1991 | 2371 | 2400 | 2442 | 5564 |
| X17 | Na/Al | Formulation ratios | - | 0.61 | 0.28 | 0.18 | 0.42 | 0.54 | 0.68 | 2.16 |
| X18 | Si/Al | - | 2.25 | 0.89 | 0.62 | 1.84 | 2.03 | 2.46 | 7.76 | |
| X19 | Temp | Curing conditions | °C | 62.8 | 24.8 | 20 | 60 | 60 | 80 | 120 |
| X20 | HC days | days | 0.89 | 0.68 | 0 | 1 | 1 | 1 | 4 | |
| X21 | ages | days | 28.5 | 67.4 | 1 | 7 | 7 | 28 | 540 | |
| X22 | Specs. | - | - | 0.39 | 0.49 | 0 | 0 | 0 | 1 | 1 |
| Y1 | fc | Output responses | MPa | 38.50 | 15.02 | 1.10 | 28.61 | 39.52 | 48.38 | 90.90 |
| Y2 | CO2 | kg/m3 | 186.80 | 61.50 | 55.01 | 151.11 | 172.60 | 194.70 | 594.33 | |
| Y3 | GRG | 0–1 | 0.58 | 0.06 | 0.35 | 0.55 | 0.59 | 0.61 | 0.79 | |
| Parameters | Range/Average | Transport Distances (Km) | References |
|---|---|---|---|
| Emission factors (kgCO2/kg) | |||
| Portland cement | 0.73 | 50–300 = 75 | [51,52] |
| Fly ash | Varies with price | 50–300 = 75 | [52] |
| Aggregates (fine and coarse) | 0.0039 | 50 | [51,52] |
| NaOH pellets | 1.04–1.59 = 1.32 | 50–300 = 75 | [52,53] |
| Na2SiO3 solution | 0.376 | 50–300 = 75 | [48,52] |
| H2O | 0.00015 | 0 | [51] |
| Admixture (superplasticizer) | 0.72 | 50–300 = 75 | [51,52] |
| Transportation details | |||
| Mode of transport | By road | / | / |
| Unit price (USD/ton. km) | 0.069 | / | [54] |
| Emission factors (kgCO2/kg⋅ km) | 0.000137 | / | [51] |
| Curing details | |||
| Energy source | Electricity | / | |
| Unit price (USD/kWh) | 0.0809 | / | [55] |
| Emission factors (kgCO2/kWh) | 0.55 | / | [55] |
| Sources | Inputs Variables | Output Parameters | Grey Rational Analysis (GRA) | |||||||||||||||||||||||
|---|---|---|---|---|---|---|---|---|---|---|---|---|---|---|---|---|---|---|---|---|---|---|---|---|---|---|
| Chemical Composition of Fly Ash | Mixture Proportion | Alkaline Activator | Formulation Ratios | Curing Conditions | ||||||||||||||||||||||
| No. | Ref. | SiO2 | Al2O3 | CaO | Fe2O3 | FA | CAgg | FAgg | NaOH | Na2SiO3 | M | Ex.H2O | Na2O | SiO2 | H2O | ρ | Na/Al | Si/Al | CTem | Cper | Ages | Spec. | fc | CO2 | Grade | Rank |
| Unit | % | % | % | % | Kg/m3 | Kg/m3 | Kg/m3 | Kg/m3 | Kg/m3 | / | Kg/m3 | Kg/m3 | Kg/m3 | Kg/m3 | Kg/m3 | / | / | C | Days | Days | MPa | Kg/m3 | 0–1 | - | ||
| 1 | [58] | 47.9 | 28.0 | 3.8 | 14.1 | 410 | 1155 | 587 | 41 | 164 | 10 | 2.6 | 33.7 | 48.2 | 125.7 | 2359 | 0.48 | 1.81 | 80 | 1 | 28 | Cu | 55.5 | 169.90 | 0.63 | 162 |
| 2 | [59] | 50.2 | 26.4 | 4.3 | 10.0 | 408 | 1110 | 739 | 41 | 103 | 14 | 0 | 27.6 | 30.3 | 86.1 | 2401 | 0.42 | 1.86 | 75 | 2 | 7 | Cy | 63.1 | 154.72 | 0.67 | 50 |
| 3 | [60] | 51.5 | 23.6 | 1.7 | 15.3 | 408 | 1168 | 660 | 41 | 103 | 16 | 0 | 29.0 | 30.3 | 84.7 | 2380 | 0.50 | 2.12 | 60 | 1 | 28 | Cy | 74.9 | 141.28 | 0.75 | 5 |
| 4 | [61] | 32.6 | 31.2 | 17.1 | 8.5 | 300 | 1372 | 696 | 43 | 107 | 14 | 0 | 28.8 | 31.5 | 89.7 | 2518 | 0.51 | 1.17 | 20 | 0 | 28 | Cu | 17.1 | 129.83 | 0.58 | 614 |
| 5 | [62] | 53.6 | 28.5 | 4.2 | 8.7 | 350 | 1282 | 690 | 45 | 113 | 15 | 0 | 32.7 | 39.1 | 85.7 | 2479 | 0.54 | 1.93 | 70 | 1 | 3 | Cu | 46.8 | 154.37 | 0.62 | 232 |
| 6 | [63] | 37.6 | 14.8 | 19.6 | 18.6 | 310 | 1204 | 649 | 49 | 122 | 10 | 0 | 31.2 | 42.4 | 97.4 | 2334 | 1.12 | 2.95 | 80 | 1 | 365 | Cu | 47.3 | 162.11 | 0.61 | 284 |
| 7 | [64] | 42.0 | 33.6 | 12.7 | 4.0 | 427 | 1277 | 547 | 31 | 76 | 14 | 0 | 20.5 | 22.4 | 63.8 | 2358 | 0.24 | 1.20 | 80 | 1 | 28 | Cu | 42.4 | 122.15 | 0.64 | 130 |
| 8 | [65] | 50.8 | 27.3 | 5.4 | 4.6 | 460 | 1201 | 539 | 49 | 151 | 14 | 0 | 28.2 | 41.8 | 130.0 | 2400 | 0.37 | 1.86 | 80 | 1 | 480 | Cu | 80.7 | 176.65 | 0.75 | 4 |
| 9 | 50.8 | 27.3 | 5.4 | 4.6 | 460 | 1174 | 527 | 80 | 160 | 14 | 0 | 38.4 | 44.1 | 156.7 | 2400 | 0.50 | 1.88 | 80 | 1 | 480 | Cu | 84.5 | 220.88 | 0.75 | 6 | |
| 10 | 50.8 | 27.3 | 5.4 | 4.6 | 460 | 1186 | 533 | 74 | 147 | 12 | 0 | 32.9 | 40.7 | 147.2 | 2400 | 0.43 | 1.85 | 80 | 1 | 480 | Cu | 83.3 | 207.99 | 0.75 | 7 | |
| 11 | [66] | 32.3 | 16.4 | 19.1 | 19.0 | 475 | 1060 | 707 | 64 | 96 | 14 | 74 | 28.4 | 27.6 | 177.9 | 2476 | 0.60 | 1.98 | 27 | 0 | 180 | Cu | 42.0 | 156.99 | 0.60 | 362 |
| 12 | [67] | 54.1 | 26.7 | 3.4 | 6.5 | 425 | 1201 | 647 | 36 | 91 | 12 | 42.3 | 22.6 | 25.5 | 121.7 | 2442 | 0.33 | 1.92 | 75 | 1 | 28 | Cu | 49.1 | 137.02 | 0.64 | 127 |
| 13 | [68] | 27.9 | 14.4 | 27.9 | 15.6 | 400 | 970 | 795 | 187 | 93 | 2 | 0 | 25.9 | 31.8 | 222.3 | 2445 | 0.74 | 2.12 | 27.5 | 0 | 90 | Cy | 32.5 | 318.49 | 0.47 | 1060 |
| 14 | [69] | 49.5 | 29.6 | 3.5 | 10.7 | 1050 | 2291 | 1728 | 209 | 198 | 10 | 88 | 77.9 | 58.2 | 358.9 | 5564 | 0.41 | 1.58 | 80 | 1 | 7 | Cy | 46.1 | 451.01 | 0.45 | 1085 |
| 15 | [70] | 49.5 | 29.6 | 3.5 | 10.7 | 1016 | 2291 | 1728 | 123 | 324 | 10 | 79 | 76.3 | 95.3 | 354.4 | 5561 | 0.42 | 1.69 | 80 | 1 | 90 | Cy | 59.6 | 385.24 | 0.52 | 991 |
| 16 | [71] | 49.4 | 31.3 | 4.8 | 4.5 | 416 | 927 | 699 | 65 | 292 | 15 | 8 | 62.4 | 85.8 | 216.8 | 2407 | 0.79 | 1.90 | 80 | 1 | 28 | Cy | 43.5 | 252.09 | 0.53 | 958 |
| 17 | [72] | 47.9 | 28.0 | 3.8 | 14.1 | 416 | 927 | 699 | 65 | 292 | 15 | 8 | 62.4 | 85.8 | 216.8 | 2407 | 0.88 | 2.08 | 80 | 1 | 365 | Cy | 90.9 | 252.09 | 0.79 | 1 |
| 18 | [73] | 45.2 | 20.0 | 15.5 | 13.2 | 414 | 1091 | 588 | 69 | 138 | 20 | 0 | 49.1 | 45.4 | 112.6 | 2300 | 0.98 | 2.39 | 23 | 0 | 28 | Cy | 55.1 | 176.77 | 0.62 | 193 |
| 19 | [74] | 37.7 | 20.0 | 23.4 | 5.6 | 570 | 780 | 658 | N/A | 228 | N/A | 0 | 28.5 | 42.8 | 156.8 | 2236 | 0.41 | 1.92 | 50 | 2 | 28 | Cy | 56.3 | 136.22 | 0.67 | 67 |
| 20 | [75] | 35.9 | 15.1 | 17.2 | 17.3 | 450 | 1150 | 500 | 108 | 162 | 12 | 0 | 49.4 | 48.9 | 171.7 | 2370 | 1.20 | 2.63 | 60 | 2 | 7 | Cy | 48.9 | 258.85 | 0.54 | 918 |
| 21 | [76] | 62.2 | 27.5 | 2.3 | 3.9 | 480 | 1140 | 625 | 56 | 112 | 14 | 35 | 33.5 | 32.9 | 136.5 | 2448 | 0.42 | 2.13 | 80 | 1 | 28 | Cy | 67.9 | 171.43 | 0.68 | 44 |
| 22 | [77] | 51.7 | 31.9 | 1.2 | 3.5 | 500 | 950 | 760 | 100 | 100 | 10 | 0 | 31.7 | 27.6 | 140.7 | 2410 | 0.33 | 1.52 | 60 | 0.167 | 7 | Cy | 30.7 | 216.18 | 0.53 | 971 |
| 23 | [78] | 48.0 | 29.0 | 1.8 | 12.7 | 408 | 1202 | 647 | 41 | 103 | 14 | 15 | 27.6 | 30.3 | 101.1 | 2416 | 0.38 | 1.62 | 60 | 1 | 28 | Cy | 46.6 | 141.51 | 0.63 | 161 |
| 24 | [79] | 53.7 | 27.2 | 1.9 | 11.2 | 400 | 1222 | 658 | 40 | 100 | 14 | 0 | 23.7 | 30.0 | 86.3 | 2420 | 0.36 | 1.91 | 20 | 0 | 180 | Cy | 41.3 | 123.77 | 0.64 | 143 |
| 25 | [80] | 50.0 | 28.3 | 1.8 | 13.5 | 400 | 1209 | 651 | 46 | 114 | 14 | 0 | 27.0 | 35.1 | 97.9 | 2420 | 0.39 | 1.77 | 21.5 | 0 | 56 | Cy | 33.0 | 137.29 | 0.60 | 368 |
| 26 | [81] | 49.6 | 45.9 | 0.0 | 4.5 | 400 | 1100 | 720 | N/A | 160 | 10 | 40 | 58.8 | 52.0 | 249.2 | 2580 | 0.53 | 1.16 | 23 | 0 | 28 | Cu | 12.0 | 308.55 | 0.44 | 1094 |
| 27 | [82] | 50.7 | 28.8 | 2.4 | 8.8 | 400 | 1293 | 554 | 45 | 113 | 14 | 0 | 28.8 | 30.1 | 99.1 | 2405 | 0.41 | 1.72 | 100 | 3 | 28 | Cu | 45.0 | 188.24 | 0.58 | 600 |
| 28 | [83] | 53.7 | 27.2 | 1.9 | 11.2 | 400 | 1209 | 651 | 46 | 114 | 14 | 0 | 27.0 | 34.4 | 98.6 | 2420 | 0.41 | 1.95 | 21.5 | 0 | 90 | Cy | 38.4 | 137.29 | 0.61 | 266 |
| 29 | [84] | 63.3 | 26.8 | 2.5 | 5.6 | 380 | 1189 | 660 | 49 | 122 | 8 | 0 | 27.5 | 35.9 | 107.6 | 2400 | 0.44 | 2.31 | 25 | 0 | 28 | Cu | 30.0 | 144.87 | 0.59 | 546 |
| 30 | [85] | 37.6 | 14.8 | 19.6 | 18.6 | 310 | 1204 | 649 | 57 | 114 | 10 | 0 | 31.8 | 39.6 | 99.7 | 2334 | 1.14 | 2.89 | 80 | 1 | 90 | Cu | 45.5 | 169.76 | 0.60 | 390 |
| 31 | [86] | 53.0 | 27.9 | 4.2 | 8.7 | 310 | 1204 | 649 | 57 | 114 | 10 | 0 | 31.8 | 39.6 | 99.7 | 2334 | 0.60 | 2.00 | 80 | 1 | 365 | Cu | 47.5 | 169.76 | 0.60 | 330 |
| 32 | [87] | 32.1 | 19.9 | 18.8 | 16.9 | 390 | 1092 | 585 | 67 | 167 | 16 | 0 | 37.7 | 50.1 | 146.2 | 2301 | 0.80 | 1.92 | 30.5 | 0 | 28 | Cy | 38.0 | 186.91 | 0.57 | 750 |
| 33 | [88] | 47.5 | 17.3 | 2.3 | 6.0 | 279 | 956 | 721 | 21 | 363 | 15 | 0 | 60.1 | 106.7 | 217.2 | 2340 | 2.05 | 4.22 | 120 | 1 | 7 | Cu | 30.9 | 223.48 | 0.52 | 983 |
| 34 | [89] | 51.3 | 30.1 | 8.7 | 4.6 | 400 | 950 | 850 | 57 | 143 | 10 | 48 | 33.7 | 42.1 | 172.2 | 2448 | 0.46 | 1.75 | 70 | 2 | 28 | Cu | 51.4 | 188.65 | 0.60 | 378 |
| 35 | [90] | 43.9 | 20.1 | 21.2 | 5.0 | 450 | 972 | 810 | 68 | 68 | 10 | 78.3 | 25.7 | 19.8 | 167.8 | 2445 | 0.47 | 2.04 | 70 | 1 | 28 | Cy | 48.4 | 167.27 | 0.61 | 296 |
| 36 | [91] | 51.2 | 24.0 | 5.6 | 6.6 | 400 | 950 | 850 | 57 | 143 | 12 | 40 | 36.5 | 42.5 | 161.0 | 2440 | 0.62 | 2.19 | 70 | 1 | 28 | Cu | 53.0 | 182.17 | 0.61 | 290 |
| 37 | [92] | 58.5 | 21.0 | 3.8 | 8.3 | 420 | 1090 | 630 | 60 | 150 | 12 | 31 | 38.2 | 44.1 | 158.7 | 2381 | 0.71 | 2.79 | 80 | 1 | 7 | Cy | 54.5 | 189.80 | 0.61 | 298 |
| 38 | [93] | 50.5 | 26.6 | 2.1 | 13.8 | 499 | 1168 | 584 | 43 | 107 | 14 | 18.8 | 28.7 | 31.4 | 108.1 | 2419 | 0.36 | 1.82 | 75 | 1 | 91 | Cy | 65.8 | 152.75 | 0.69 | 33 |
| 39 | [94] | 45.8 | 21.4 | 13.7 | 12.6 | 405 | 1269 | 683 | 81 | 81 | 13 | 81 | 31.4 | 21.9 | 189.7 | 2600 | 0.60 | 2.03 | 80 | 1 | 56 | Cu | 29.0 | 192.45 | 0.54 | 928 |
| 40 | [95] | 49.1 | 26.4 | 5.2 | 4.6 | 459 | 1172 | 539 | 57 | 143 | 10 | 0 | 35.3 | 55.0 | 109.7 | 2370 | 0.48 | 1.97 | 20 | 0 | 90 | Cu | 50.5 | 163.67 | 0.62 | 218 |
| 41 | [96] | 74.2 | 9.4 | 5.5 | 4.2 | 437 | 1318 | 647 | 62 | 156 | 10 | 0 | 28.2 | 43.1 | 146.6 | 2620 | 1.13 | 7.57 | 80 | 1 | 28 | Cu | 32.0 | 198.00 | 0.54 | 917 |
| 42 | [97] | 56.7 | 24.9 | 5.2 | 6.9 | 400 | 1200 | 600 | 60 | 120 | 8 | 0 | 29.3 | 35.3 | 115.4 | 2380 | 0.48 | 2.24 | 23 | 0 | 28 | Cy | 15.9 | 158.45 | 0.55 | 890 |
| 43 | [98] | 48.7 | 16.6 | 18.7 | 6.9 | 494 | 858 | 691 | 99 | 99 | 14 | 0 | 44.9 | 29.6 | 123.0 | 2241 | 0.90 | 2.80 | 60 | 3 | 4 | Cy | 83.6 | 226.46 | 0.74 | 10 |
| 44 | [99] | 37.3 | 6.4 | 10.7 | 40.5 | 513 | 1477 | 409 | 60 | 120 | 10 | 0 | 23.4 | 23.8 | 132.5 | 2579 | 1.18 | 5.60 | 24 | 0 | 56 | Cy | 55.8 | 162.60 | 0.64 | 134 |
| 45 | [100] | 70.3 | 23.1 | 0.2 | 1.4 | 467 | 1039 | 784 | 147 | 234 | 10 | 10 | 68.7 | 68.8 | 253.5 | 2681 | 1.05 | 3.13 | 80 | 1 | 360 | Cy | 38.9 | 342.27 | 0.47 | 1054 |
| 46 | [101] | 57.9 | 31.1 | 1.3 | 5.1 | 300 | 1131 | 754 | 39 | 96 | 10 | 68.81 | 24.7 | 33.4 | 145.7 | 2388 | 0.44 | 1.89 | 100 | 1 | 28 | Cu | 26.9 | 149.03 | 0.58 | 649 |
| 47 | [102] | 74.2 | 9.4 | 5.5 | 4.2 | 459 | 1172 | 539 | 57 | 143 | 10 | 0 | 35.3 | 55.0 | 109.7 | 2370 | 1.34 | 7.76 | 20 | 0 | 56 | Cu | 17.0 | 163.67 | 0.55 | 906 |
| 48 | [103] | 54.0 | 34.7 | 2.0 | 5.3 | 426 | 1213 | 643 | 55 | 137 | 12 | 0 | 26.4 | 38.3 | 126.9 | 2472 | 0.29 | 1.54 | 60 | 1 | 28 | Cu | 53.0 | 173.98 | 0.62 | 228 |
| 49 | [104] | 57.3 | 27.1 | 0.0 | 8.1 | 428 | 1170 | 630 | 57 | 114 | 14 | 43 | 36.6 | 39.9 | 137.5 | 2442 | 0.52 | 2.09 | 90 | 1 | 1 | Cu | 49.0 | 176.50 | 0.60 | 350 |
| 50 | [105] | 65.3 | 14.5 | 5.6 | 6.3 | 460 | 1201 | 539 | 50 | 150 | 14 | 0 | 28.5 | 41.5 | 130.1 | 2400 | 0.70 | 4.36 | 80 | 1 | 28 | Cu | 72.8 | 177.74 | 0.70 | 27 |
| 51 | [106] | 51.2 | 24.0 | 5.6 | 6.6 | 400 | 950 | 850 | 57 | 143 | 12 | 40 | 35.8 | 42.1 | 162.1 | 2440 | 0.61 | 2.19 | 70 | 1 | 2 | Cu | 53.5 | 182.17 | 0.61 | 278 |
| 52 | [107] | 51.9 | 9.2 | 2.3 | 34.0 | 410 | 1044 | 531 | 67 | 117 | 10 | 79.2 | 33.7 | 38.6 | 191.5 | 2249 | 1.48 | 5.69 | 20 | 0 | 180 | Cu | 29.0 | 164.00 | 0.57 | 745 |
| 53 | [108] | 51.3 | 30.1 | 8.7 | 4.6 | 400 | 950 | 850 | 57 | 143 | 12 | 48 | 35.8 | 42.1 | 170.1 | 2448 | 0.49 | 1.75 | 70 | 2 | 30 | Cu | 53.8 | 188.65 | 0.61 | 308 |
| 54 | [109] | 47.8 | 24.4 | 2.4 | 17.4 | 408 | 1294 | 554 | 41 | 103 | 8 | 0 | 23.1 | 30.3 | 90.6 | 2400 | 0.38 | 1.92 | 60 | 1 | 7 | Cy | 69.7 | 141.49 | 0.72 | 16 |
| 55 | [110] | 50.5 | 26.6 | 2.1 | 13.8 | 408 | 1201 | 647 | 68 | 103 | 14 | 0 | 30.1 | 29.8 | 111.1 | 2427 | 0.46 | 1.85 | 60 | 1 | 28 | Cy | 56.6 | 177.65 | 0.63 | 177 |
| 56 | [111] | 51.1 | 25.6 | 4.3 | 12.5 | 408 | 1233 | 554 | 47 | 118 | 8 | 0 | 26.5 | 34.7 | 103.8 | 2360 | 0.42 | 1.98 | 60 | 1 | 7 | Cy | 48.5 | 154.86 | 0.62 | 199 |
| 57 | [112] | 77.1 | 17.7 | 0.6 | 1.2 | 334 | 1329 | 633 | 58 | 58 | 13 | 41.23 | 26.4 | 20.1 | 111.7 | 2454 | 0.73 | 3.99 | 90 | 0.33 | 7 | Cu | 61.3 | 151.05 | 0.67 | 60 |
| 58 | [113] | 50.5 | 26.6 | 2.1 | 13.8 | 408 | 1201 | 647 | 41 | 103 | 14 | 16.5 | 27.6 | 30.3 | 102.6 | 2417 | 0.42 | 1.85 | 60 | 1 | 28 | Cy | 70.1 | 141.50 | 0.72 | 15 |
| 59 | [114] | 50.3 | 26.3 | 2.3 | 13.6 | 408 | 1201 | 647 | 41 | 103 | 14 | 16.5 | 27.6 | 30.3 | 102.6 | 2417 | 0.42 | 1.87 | 60 | 1 | 28 | Cy | 70.2 | 141.50 | 0.72 | 14 |
| 60 | [115] | 38.7 | 20.8 | 26.6 | 5.3 | 460 | 976 | 496 | 77 | 153 | 10 | 75.5 | 40.4 | 45.1 | 220.0 | 2237 | 0.70 | 1.98 | 60 | 1 | 28 | Cy | 39.1 | 206.78 | 0.55 | 868 |
| 61 | [116] | 51.3 | 30.1 | 8.7 | 4.6 | 400 | 950 | 850 | 57 | 143 | 12 | 48 | 36.5 | 42.5 | 169.0 | 2448 | 0.50 | 1.75 | 70 | 2 | 28 | Cu | 44.7 | 188.65 | 0.58 | 612 |
| 62 | [117] | 59.2 | 24.4 | 2.2 | 7.1 | 500 | 1150 | 575 | 64 | 161 | 14 | 0 | 43.2 | 47.2 | 134.5 | 2450 | 0.58 | 2.39 | 70 | 2 | 28 | Cu | 51.6 | 207.47 | 0.59 | 555 |
| 63 | [118] | 50.7 | 28.8 | 2.4 | 8.8 | 388 | 1293 | 554 | 45 | 113 | 14 | 0 | 28.8 | 30.1 | 99.1 | 2393 | 0.42 | 1.73 | 100 | 3 | 28 | Cu | 37.0 | 187.90 | 0.56 | 785 |
| 64 | [119] | 53.4 | 21.6 | 3.3 | 6.9 | 410 | 1100 | 590 | N/A | 161 | N/A | 0 | 40.9 | 47.4 | 137.2 | 2326 | 0.76 | 2.56 | 70 | 1 | 28 | Cu | 38.0 | 198.41 | 0.56 | 843 |
| 65 | [120] | 49.4 | 32.1 | 4.8 | 5.2 | 564 | 733 | 599 | 1332 | 125 | N/A | 0 | 44.6 | 32.2 | 224.6 | 2197 | 0.41 | 1.46 | 75 | 0.67 | 28 | Cu | 33.5 | 334.49 | 0.46 | 1071 |
| 66 | [121] | 58.2 | 25.1 | 2.9 | 4.6 | 338 | 1013 | 506 | 39 | 96 | 8 | 0 | 14.7 | 26.6 | 93.7 | 1991 | 0.29 | 2.24 | 20 | 0 | 28 | Cu | 27.8 | 114.77 | 0.62 | 233 |
| 67 | [122] | 17.6 | 36.4 | 10.6 | 12.4 | 350 | 1250 | 650 | 41 | 103 | 10 | 0 | 24.7 | 30.6 | 88.6 | 2394 | 0.32 | 0.62 | 20 | 0 | 28 | Cu | 19.0 | 125.13 | 0.59 | 521 |
| 68 | [123] | 48.3 | 30.5 | 2.8 | 12.1 | 381 | 1294 | 554 | 49 | 140 | 8 | 0 | 30.1 | 41.2 | 117.7 | 2418 | 0.43 | 1.65 | 60 | 3 | 28 | Cy | 75.0 | 176.31 | 0.71 | 19 |
| 69 | [124] | 51.7 | 29.1 | 8.8 | 4.8 | 350 | 1200 | 645 | 41 | 103 | 10 | 35 | 24.7 | 30.6 | 123.6 | 2374 | 0.40 | 1.77 | 65 | 1 | 28 | Cy | 58.9 | 141.85 | 0.67 | 61 |
| 70 | [125] | 59.7 | 28.4 | 2.1 | 4.6 | 314 | 1204 | 648 | 49 | 123 | 10 | 0 | 31.6 | 42.7 | 98.4 | 2339 | 0.58 | 2.20 | 100 | 1 | 7 | Cu | 60.0 | 174.29 | 0.64 | 124 |
| 71 | [126] | 60.1 | 26.5 | 4.0 | 4.2 | 500 | 935 | 765 | N/A | 300 | N/A | 0 | 29.8 | 86.9 | 183.3 | 2500 | 0.37 | 2.48 | 27 | 0 | 28 | Cu | 16.2 | 152.75 | 0.55 | 849 |
| 72 | [127] | 37.3 | 14.9 | 17.9 | 16.5 | 528 | 1155 | 495 | N/A | 72 | N/A | 150 | 36.7 | 33.1 | 152.2 | 2400 | 0.77 | 2.49 | 23 | 0 | 90 | Cu | 60.8 | 60.91 | 0.79 | 2 |
| 73 | 37.3 | 14.9 | 17.9 | 16.5 | 616 | 1068 | 458 | 0 | 84 | N/A | 175 | 42.8 | 38.6 | 177.5 | 2400 | 0.77 | 2.49 | 23 | 0 | 90 | Cu | 54.3 | 66.82 | 0.75 | 3 | |
| 74 | 37.3 | 14.9 | 17.9 | 16.5 | 528 | 1155 | 495 | 0 | 72 | N/A | 150 | 36.7 | 33.1 | 152.2 | 2400 | 0.77 | 2.49 | 23 | 0 | 28 | Cu | 46.1 | 60.91 | 0.74 | 9 | |
| 75 | [128] | 49.3 | 22.7 | 3.1 | 16.0 | 400 | 1209 | 651 | 11 | 129 | N/A | 0 | 27.2 | 38.1 | 74.7 | 2400 | 0.49 | 2.20 | 60 | 1 | 90 | Cy | 61.9 | 111.21 | 0.72 | 17 |
| 76 | [129] | 46.2 | 26.4 | 0.7 | 3.2 | 408 | 1346 | 612 | 41 | 103 | N/A | 0 | 24.2 | 30.3 | 89.5 | 2510 | 0.37 | 1.72 | 60 | 1 | 28 | Cu | 52.4 | 142.69 | 0.65 | 115 |
| 77 | [130] | 70.3 | 23.1 | 0.2 | 1.4 | 409 | 909 | 686 | 1595 | 204 | N/A | 10 | 68.0 | 60.0 | 215.1 | 2347 | 1.18 | 3.13 | 80 | 1 | 540 | Cy | 39.2 | 302.09 | 0.49 | 1036 |
| 78 | [131] | 62.8 | 16.7 | 6.4 | 7.4 | 500 | 1185 | 532 | 1718 | 122 | N/A | 0 | 28.8 | 33.6 | 120.1 | 2400 | 0.57 | 3.54 | 80 | 1 | 28 | Cu | 79.8 | 181.80 | 0.74 | 8 |
| 79 | [132] | 55.8 | 30.3 | 4.1 | 3.9 | 500 | 1113 | 603 | 1716 | N/A | N/A | 0 | 45.0 | 0.0 | 163.1 | 2424 | 0.49 | 1.57 | 60 | 1 | 182 | Cu | 59.8 | 325.10 | 0.55 | 907 |
| 80 | [133] | 39.6 | 17.5 | 16.6 | 18.1 | 560 | 936 | 624 | 1560 | 200 | N/A | 0 | 40.1 | 57.4 | 182.5 | 2400 | 0.67 | 2.42 | 20 | 0 | 28 | Cu | 71.9 | 218.29 | 0.66 | 75 |
| 81 | [134] | 49.0 | 31.0 | 5.0 | 3.0 | 475 | 1253 | 539 | 1792 | 78 | N/A | 0 | 16.1 | 22.5 | 80.4 | 2386 | 0.18 | 1.47 | 25 | 0 | 28 | Cy | 35.9 | 119.07 | 0.63 | 169 |
| 82 | [135] | 49.5 | 27.5 | 3.7 | 7.4 | 719 | 729 | 583 | 1312 | N/A | N/A | 0 | 128.7 | 0.0 | 275.4 | 2435 | 1.07 | 1.53 | 60 | 2 | 14 | Cu | 17.5 | 594.33 | 0.36 | 1135 |
| 83 | [136] | 65.6 | 26.5 | 0.3 | 5.5 | 298 | 1377 | 590 | 1967 | 96 | N/A | 0 | 25.6 | 33.7 | 74.8 | 2399 | 0.53 | 2.46 | 60 | 1 | 28 | Cu | 32.4 | 132.89 | 0.61 | 329 |
| 84 | [137] | 43.4 | 26.2 | 5.4 | 17.4 | 300 | 1321 | 622 | 60 | 90 | 12 | 11 | 29.4 | 26.5 | 105.1 | 2404 | 0.62 | 1.69 | 70 | 1 | 7 | Cy | 53.1 | 163.76 | 0.63 | 175 |
| 85 | [138] | 47.8 | 24.4 | 2.4 | 17.4 | 408 | 1201 | 647 | 41 | 103 | 8 | 0 | 23.1 | 30.3 | 90.6 | 2400 | 0.38 | 1.92 | 90 | 1 | 90 | Cy | 70.7 | 150.63 | 0.71 | 18 |
| 86 | [139] | 66.8 | 15.5 | 5.0 | 6.8 | 460 | 1200 | 540 | 1740 | 133 | N/A | 0 | 24.3 | 36.9 | 138.9 | 2400 | 0.56 | 4.11 | 80 | 1 | 3 | Cu | 37.7 | 193.47 | 0.56 | 819 |
| 87 | [139] | 66.8 | 15.5 | 5.0 | 6.8 | 460 | 1200 | 540 | 1740 | 133 | N/A | 0 | 28.5 | 36.9 | 134.7 | 2400 | 0.66 | 4.11 | 80 | 1 | 28 | Cu | 50.6 | 193.47 | 0.59 | 453 |
| Statistical Measures | Training | Validation |
|---|---|---|
| R-square | 0.984 | 0.918 |
| Root absolute square error (RASE) | 0.011 | 0.021 |
| Mean absolute deviation | 0.005 | 0.012 |
| −Log likelihood | −2790.66 | −930.14 |
| Sum of squared error | 0.100 | 0.1526 |
| Sum frequency | 788 | 338 |
Disclaimer/Publisher’s Note: The statements, opinions and data contained in all publications are solely those of the individual author(s) and contributor(s) and not of MDPI and/or the editor(s). MDPI and/or the editor(s) disclaim responsibility for any injury to people or property resulting from any ideas, methods, instructions or products referred to in the content. |
© 2025 by the authors. Licensee MDPI, Basel, Switzerland. This article is an open access article distributed under the terms and conditions of the Creative Commons Attribution (CC BY) license (https://creativecommons.org/licenses/by/4.0/).
Share and Cite
Siddiq, M.U.; Anwar, M.K.; Almansour, F.H.; Qurashi, M.A.; Adeel, M. AI-Driven Optimization of Fly Ash-Based Geopolymer Concrete for Sustainable High Strength and CO2 Reduction: An Application of Hybrid Taguchi–Grey–ANN Approach. Buildings 2025, 15, 2081. https://doi.org/10.3390/buildings15122081
Siddiq MU, Anwar MK, Almansour FH, Qurashi MA, Adeel M. AI-Driven Optimization of Fly Ash-Based Geopolymer Concrete for Sustainable High Strength and CO2 Reduction: An Application of Hybrid Taguchi–Grey–ANN Approach. Buildings. 2025; 15(12):2081. https://doi.org/10.3390/buildings15122081
Chicago/Turabian StyleSiddiq, Muhammad Usman, Muhammad Kashif Anwar, Faris H. Almansour, Muhammad Ahmed Qurashi, and Muhammad Adeel. 2025. "AI-Driven Optimization of Fly Ash-Based Geopolymer Concrete for Sustainable High Strength and CO2 Reduction: An Application of Hybrid Taguchi–Grey–ANN Approach" Buildings 15, no. 12: 2081. https://doi.org/10.3390/buildings15122081
APA StyleSiddiq, M. U., Anwar, M. K., Almansour, F. H., Qurashi, M. A., & Adeel, M. (2025). AI-Driven Optimization of Fly Ash-Based Geopolymer Concrete for Sustainable High Strength and CO2 Reduction: An Application of Hybrid Taguchi–Grey–ANN Approach. Buildings, 15(12), 2081. https://doi.org/10.3390/buildings15122081