Article

Performance Evaluation and Simulation Optimization of Outdoor Environmental Space in Communities Based on Subjective Comfort: A Case Study of Minhe Community in Qian’an City

1
Department of Urban and Rural Planning, School of Architecture and Urban Planning, Beijing University of Civil Engineering and Architecture, Beijing 100044, China
2
Heibei Institute of Architectural Design & Research Co., Ltd., Shijiazhuang 050021, China
3
Guangzhou Institute of Geography, Guangdong Academy of Sciences, Guangzhou 510070, China
4
Department of Architecture, School of Architecture and Urban Planning, Shandong Jianzhu University, Jinan 250101, China
*
Author to whom correspondence should be addressed.
Buildings 2025, 15(12), 2078; https://doi.org/10.3390/buildings15122078
Submission received: 28 April 2025 / Revised: 8 June 2025 / Accepted: 12 June 2025 / Published: 17 June 2025

Abstract

:
With the continual expansion of global urbanization and population growth, urban energy demands have intensified, and anthropogenic activities have precipitated profound shifts in the global climate. These climatic changes directly alter urban environmental conditions, which in turn exert indirect effects on human physiological function. Consequently, the comfort of outdoor community environments has emerged as a critical metric for assessing the quality of human habitation. Although existing studies have focused on improving singular environmental factors—such as wind or thermal comfort—they often lack an integrated, multi-factor coupling mechanism, and adaptive strategy systems tailored to hot-summer, cold-winter regions remain underdeveloped. This study examines the Minhe Community in Qian’an City to develop a performance evaluation framework for outdoor spaces grounded in subjective comfort and to close the loop from theoretical formulation to empirical validation via an interdisciplinary approach. We first synthesized 25 environmental factors across eight categories—including wind, thermal, and lighting parameters—and applied the Analytic Hierarchy Process (AHP) to establish factor weights, thereby constructing a comprehensive model that encompasses both physiological and psychological requirements. Field surveys, meteorological data collection, and ENVI-met (V5.1.1) microclimate simulations revealed pronounced issues in the community’s wind distribution, thermal comfort, and acoustic environment. In response, we proposed adaptive interventions—such as stratified vegetation design and permeable pavement installations—and validated their efficacy through further simulation. Post-optimization, the community’s overall comfort score increased from 4.64 to 5.62, corresponding to an efficiency improvement of 21.3%. The innovative contributions of this research are threefold: (1) transcending the limitations of single-factor analyses by establishing a multi-dimensional, coupled evaluation framework; (2) integrating AHP with ENVI-met simulation to realize a fully quantified “evaluation–simulation–optimization” workflow; and (3) proposing adaptive strategies with broad applicability for the retrofit of communities in hot-summer, cold-winter climates, thereby offering a practical technical pathway for urban microclimate enhancement.

1. Introduction

The iterative development of the four industrial revolutions has ushered humanity into a new era. One of the most notable characteristics of mental and physical labor is the separation of cities and the countryside [1]. The rise of large and mega-cities has provided residents with a wide array of goods and services. However, this promising development masks a disregard for the carrying capacity of natural resources and environmental limits, leading to the rapid depletion of resources and severe environmental degradation. These issues directly impact our daily lives, including access to clean air, water resources, and habitable land [2]. Communities are a key indicator of societal development, closely linked to every individual and family. The healthy development of communities is essential for improving residents’ quality of life and well-being [3,4]. Currently, more than 100 countries and regions have developed community planning initiatives to address various community-related issues. Notable conferences, such as the 1976 United Nations Conference on Human Settlements, the 1986 International Conference on the Human Environment, and the 18th International Union of Architects Congress in 1993, have focused on “achieving sustainable community development”. These events emphasized the importance of improving community environments, highlighting global concern for sustainable development, and setting the direction for community growth in the 21st century. China is currently undergoing an ecological transformation in its urban areas, with urban residents placing increasing importance on the built environment within their communities. A well-maintained community environment can enhance both the physical and mental well-being of residents and fulfill their social interaction needs. Improving the state of outdoor community environments, promoting residents’ health, and creating more comfortable and convenient living spaces have thus become essential priorities [5,6,7].
Community outdoor spaces encompass all areas beyond enclosed indoor environments, including outdoor environments such as parks, gardens, plazas, walkways, streets, and bike paths. These open spaces aim to provide places for leisure, recreation, interaction, and activities, fostering social connections among community members [8]. As fundamental units of cities, communities play a crucial role in mitigating urban environmental issues and regulating microclimates within neighborhoods. Addressing the health problems arising from the development of outdoor environments in communities has become a focal point in the global built environment research field [9].
“Comfort” refers to the quantitative expression of a state of comfort. It is a multifaceted concept, encompassing both physiological and psychological aspects. According to Wikipedia, comfort denotes a state of physical or mental ease, characterized by the absence of discomfort or pain. If an experience brings psychological satisfaction, revisiting it often elicits similar feelings of comfort, such as participating in enjoyable activities or spending time in pleasing natural spaces [10]. In the context of spatial performance evaluation, users’ physiological and psychological experiences are essential indicators of spatial quality. Introducing the concept of comfort into the performance evaluation of outdoor community spaces is crucial for exploring effective methods to improve these environments. This research carries significant theoretical and practical value [11].
Research on spatial performance based on comfort is becoming increasingly diverse and interdisciplinary, with a growing range of topics [12,13,14,15]. Scholars select evaluation models tailored to the specific characteristics of their research subjects and environments. At the urban level, studies primarily focus on the configuration of green infrastructure, mitigation of the urban heat island effect, and climate regulation, applying interdisciplinary methods to enhance urban comfort and ecological sustainability. For example, Takebayashi (2022) analyzed how sea breezes affect indoor cooling loads and the risk of heat stress in coastal cities like Tokyo, Osaka, and Nagoya [16]. The study considered factors such as temperature, wind speed, thermal environment index, and wet bulb temperature Similarly, Wang et al. (2015) assessed the comfort level of the tourism environment at West Lake in Hangzhou using five indicators: temperature, humidity, carbon dioxide, carbon monoxide, and noise [17]. At the neighborhood and community levels, research on spatial comfort primarily investigates the relationship between microclimate and spatial environment, with a growing focus on optimizing microclimate conditions to improve urban residents’ comfort and quality of life [18,19,20,21,22]. For instance, Al-Atrash and Al-Ayyoub (2023) analyzed outdoor thermal comfort in urban blocks in Jabal Al Natheef, focusing on factors such as thermal adaptability, solar radiation, and green infrastructure [23]. Peng and Elwan (2014) used the C3UND method to simulate the design of New Cairo neighborhoods and employed ENVI-met and Ecotect software to predict environmental changes both outdoors and within buildings [24]. Similarly, Lai et al. (2023) evaluated outdoor thermal and acoustic comfort in a planned commercial district in Singapore, considering the effects of air temperature, wind speed, solar radiation, and noise propagation [25].
Drawing on comfort theory, established comfort evaluation models, and documented approaches for improving community outdoor environments, existing research exhibits two primary limitations. First, most studies focus on the enhancement of individual environmental factors—such as wind, thermal, or lighting conditions—while overlooking the coupling effects among multiple dimensions; as a result, they fail to capture the complex interactions that characterize real-world community environments. Second, there is a paucity of research combining simulation-based improvement with ecological function enhancement: Few studies employ integrated modeling tools to compare baseline and optimized scenarios and thus lack rigorous validation of the proposed interventions’ effectiveness. To address these gaps, the present study aims to improve outdoor environmental comfort and optimize spatial layouts within urban communities by establishing an explicit linkage among the community context, resident comfort, and outdoor space performance. Methodologically, we introduce an innovative closed-loop “evaluation–simulation–optimization” framework that integrates the Analytic Hierarchy Process (AHP) with Delphi expert consultation and incorporates microclimate and solar analysis tools (ENVI-met V5.1.1 and SketchUp 2020) alongside structured surveys of resident comfort. This multi-dimensional coupling approach enables both quantitative assessment and iterative refinement of intervention strategies. Based on this framework, we propose targeted optimization measures designed to enhance outdoor comfort in hot-summer, cold-winter regions, thereby overcoming the limitations of prior single-factor studies and delivering a comprehensive model for community microclimate and spatial improvement.

2. Materials and Methods
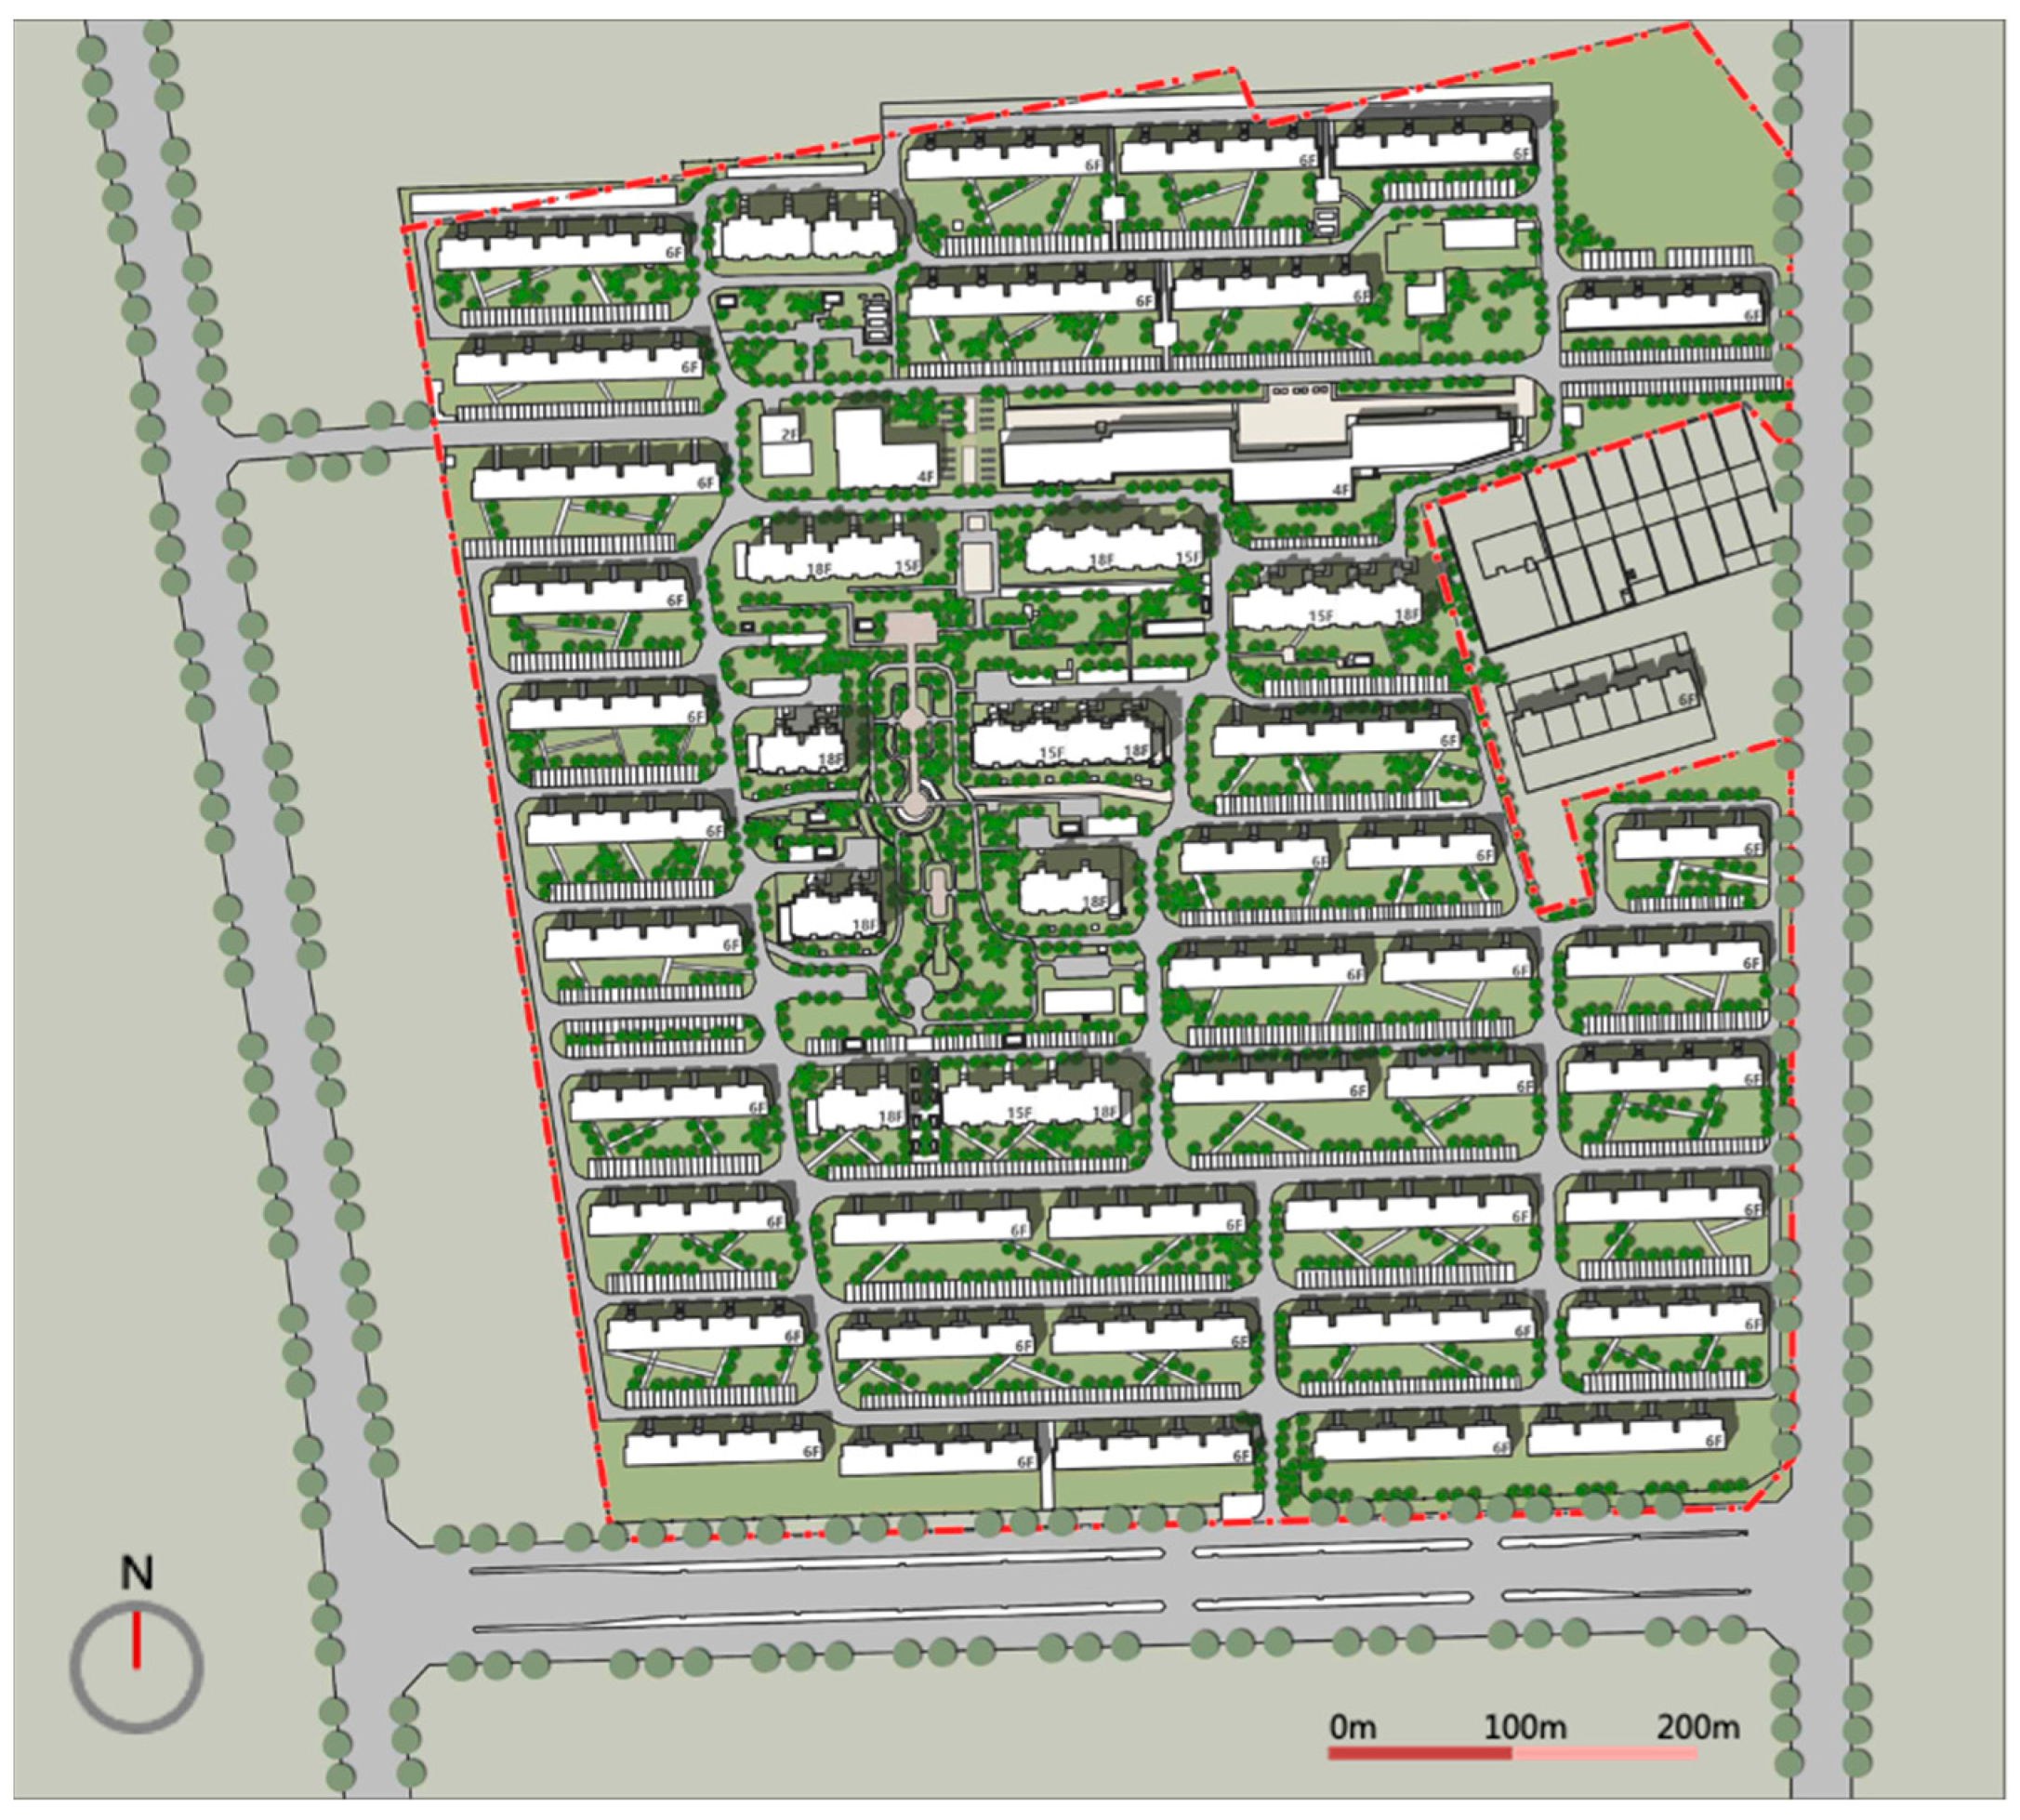
2.1. Research Area

Minhe Community is located in Qian’an City, Hebei Province, China, bordered by Qi’an Street to the south and connected to Qianlei Road to the west (Figure 1). The planned land area covers 26.5 hectares, with 167,000 square meters dedicated to commercial space. The floor area ratio (FAR) is 1.44, and the community consists of a total of 98 residential buildings. The green space ratio is 26.5%, serving a population of approximately 6500 residents. The land use layout of Minhe Community is well-structured, adjacent to waterfront green spaces and riverbanks. Primarily a residential area, the community also includes facilities such as kindergartens, nursing homes, and management services, making it a typical urban mixed-use community. Located in Hebei Province, the community lies within a region characterized by hot summers and cold winters. From both a geographical and climatic perspective, the Minhe Community offers a representative case with broad applicability for research on community outdoor space performance and comfort.

2.2. Data Sources

In March 2023 and March 2024, the author conducted multiple site visits to the Minhe Community in Qian’an City for field research and questionnaire distribution. During the field research, a weather station was installed at the central square of the community to collect data on wind, temperature, and humidity. In addition, drones were deployed to gather multispectral plant data, orthophotos, and oblique photography images, while also collecting and organizing landscape elements of the community. Questionnaires were distributed to residents to capture their subjective experiences of the environment. The combination of subjective and objective data collection methods provided a comprehensive dataset, laying a solid foundation for the development of the performance evaluation system for outdoor community spaces based on subjective comfort, as well as for subsequent spatial improvement strategies.

2.3. Research Methods

2.3.1. Multidimensional Theoretical Analysis

First, the study employed the software Citespace 6.2.R4 to analyze existing research on community outdoor environments, identifying key indicators related to outdoor environmental comfort and summarizing the research trends in outdoor environmental studies and human comfort. Second, through inductive analysis, the study identified the most critical and targeted indicators that reflect outdoor comfort in the community, focusing on addressing the primary issues facing the community’s outdoor environment (Table 1). Building on literature reviews and field research, the author consulted with experts and scholars in relevant fields to refine the indicator framework and specific factors for improving outdoor comfort. This process facilitated the establishment of an objective and actionable indicator system, ensuring that the strategies for enhancing community outdoor comfort are practical and effective [26,27].

2.3.2. Comprehensive Evaluation Method Combining Analytic Hierarchy Process (AHP) and Delphi Method

The Analytic Hierarchy Process (AHP) is a quantitative analysis method used for multi-objective decision-making. The core idea of AHP is to decompose a complex decision problem into several hierarchical levels, including the goal level, criterion level, and alternative level. A judgment matrix is then constructed, and the eigenvalue method is used to determine the weights of each factor (Figure 2). By conducting pairwise comparisons of factors at each level, their relative importance is established. Finally, the weights across different levels are integrated to conduct a comprehensive evaluation and produce the final decision result [28].
Using YAAHP 12.0.6766 software, the evaluation content is exported, and the judgment matrix is generated (Equation (1)). To gain deeper insights into the relative importance of the elements within each level, industry experts were invited to participate in a questionnaire survey. Experts performed pairwise comparisons of the content at the goal, criterion, and indicator levels, ranking the importance of each element based on the comparison results. The AHP method employs a scoring scale where, for example, a score of 9/1 indicates absolute importance, and a score of 7/1 signifies very high importance, and so on. After the experts complete their scoring, the results are compiled and entered into the system. Consistency checks (Equations (2) and (3)) are introduced to ensure the accuracy of the results. The CI (Consistency Index) of the matrix is calculated by Formula (2), where max is the maximum eigenvalue of the matrix and n is the number of factors involved in the comparison. Then the CR (Consistency Ratio) of the matrix is calculated by Formula (3), where RI is the Random Consistency Index. The smaller the consistency of the CR value, the better the consistency of the representative matrix. It is generally believed that when CR ≤ 0.1, the consistency of the matrix is acceptable. In this study, after the consistency of the matrix is tested and the matrix value is adjusted repeatedly, finally, the CR value is 0.006, which is far less than 0.1, indicating that the matrix has good consistency.
A = a 11 a 12 a 1 n a 21 a 22 a 2 n a n 1 a n 2 a n n
C I = λ m a x n n 1
C R = C I / R I
Finally, a weighted comprehensive analysis is conducted for all evaluation factors to obtain the performance evaluation score of outdoor environmental spaces based on subjective comfort (Equation (4)). In this equation, Sij represents the overall score, Si denotes the score of the community for an individual evaluation factor, Wi is the weight assigned to each factor, and n is the number of factors included in the comparison.
S i j = i = 1 n S i × W i

2.3.3. Software Simulation Method

This study employs software-based simulation methods to conduct quantitative analysis of complex outdoor environmental parameters—such as temperature, humidity, and wind speed—within community spaces. An experimental model was established using ENVI-met to simulate the microclimatic conditions of the study site. The ENVI-met workflow proceeded as follows: (1) definition of research requirements and importation of site, building, and vegetation data into the software to represent the community’s physical layout; (2) configuration of simulation parameters, including atmospheric conditions, surface properties, and vegetation characteristics; (3) execution of the simulation to generate microclimate outputs, followed by validation and analysis of results to characterize wind, thermal, and humidity conditions; and (4) iterative optimization and design adjustments informed by the simulation outcomes, aimed at improving outdoor comfort and verifying the feasibility of proposed strategies. Specific input parameters for this study included the site location (Qian’an City, China; 118° E, 39° N; UTC + 8; elevation 42 m), with initial air temperature and relative humidity at 1.5 m height drawn from field measurements. Building parameters were set in accordance with the “Energy-Saving Design Standards for Residential Buildings in Hot-Summer, Cold-Winter Regions”, while all other parameters remained at their default values. Simulations were run at six critical time points—08:00, 10:00, 12:00, 14:00, 16:00, and 18:00—starting at 08:00 and exporting data every two hours. The exported datasets comprised wind speed, air temperature, and relative humidity for each of these time steps.
In addition to microclimate modeling, the study assessed other environmental dimensions through a combination of rapid analysis and field survey techniques. Solar shading and daylighting performance were evaluated using the SketchUp “Sunpath” module. Green space comfort was gauged through photographic vegetation identification and in situ observation. Pedestrian flow patterns were analyzed with Depthmap by calculating global and local integration values; isovist maps were color-coded to indicate areas of high to low pedestrian congregation. Water- and noise-environment metrics, as well as the adequacy of service facilities, were assessed via field survey protocols enhanced by unmanned aerial vehicle (UAV) orthophotos and oblique photogrammetry. This integrated approach facilitated efficient spatial data collection and provided a multi-faceted understanding of outdoor environmental comfort within the community.

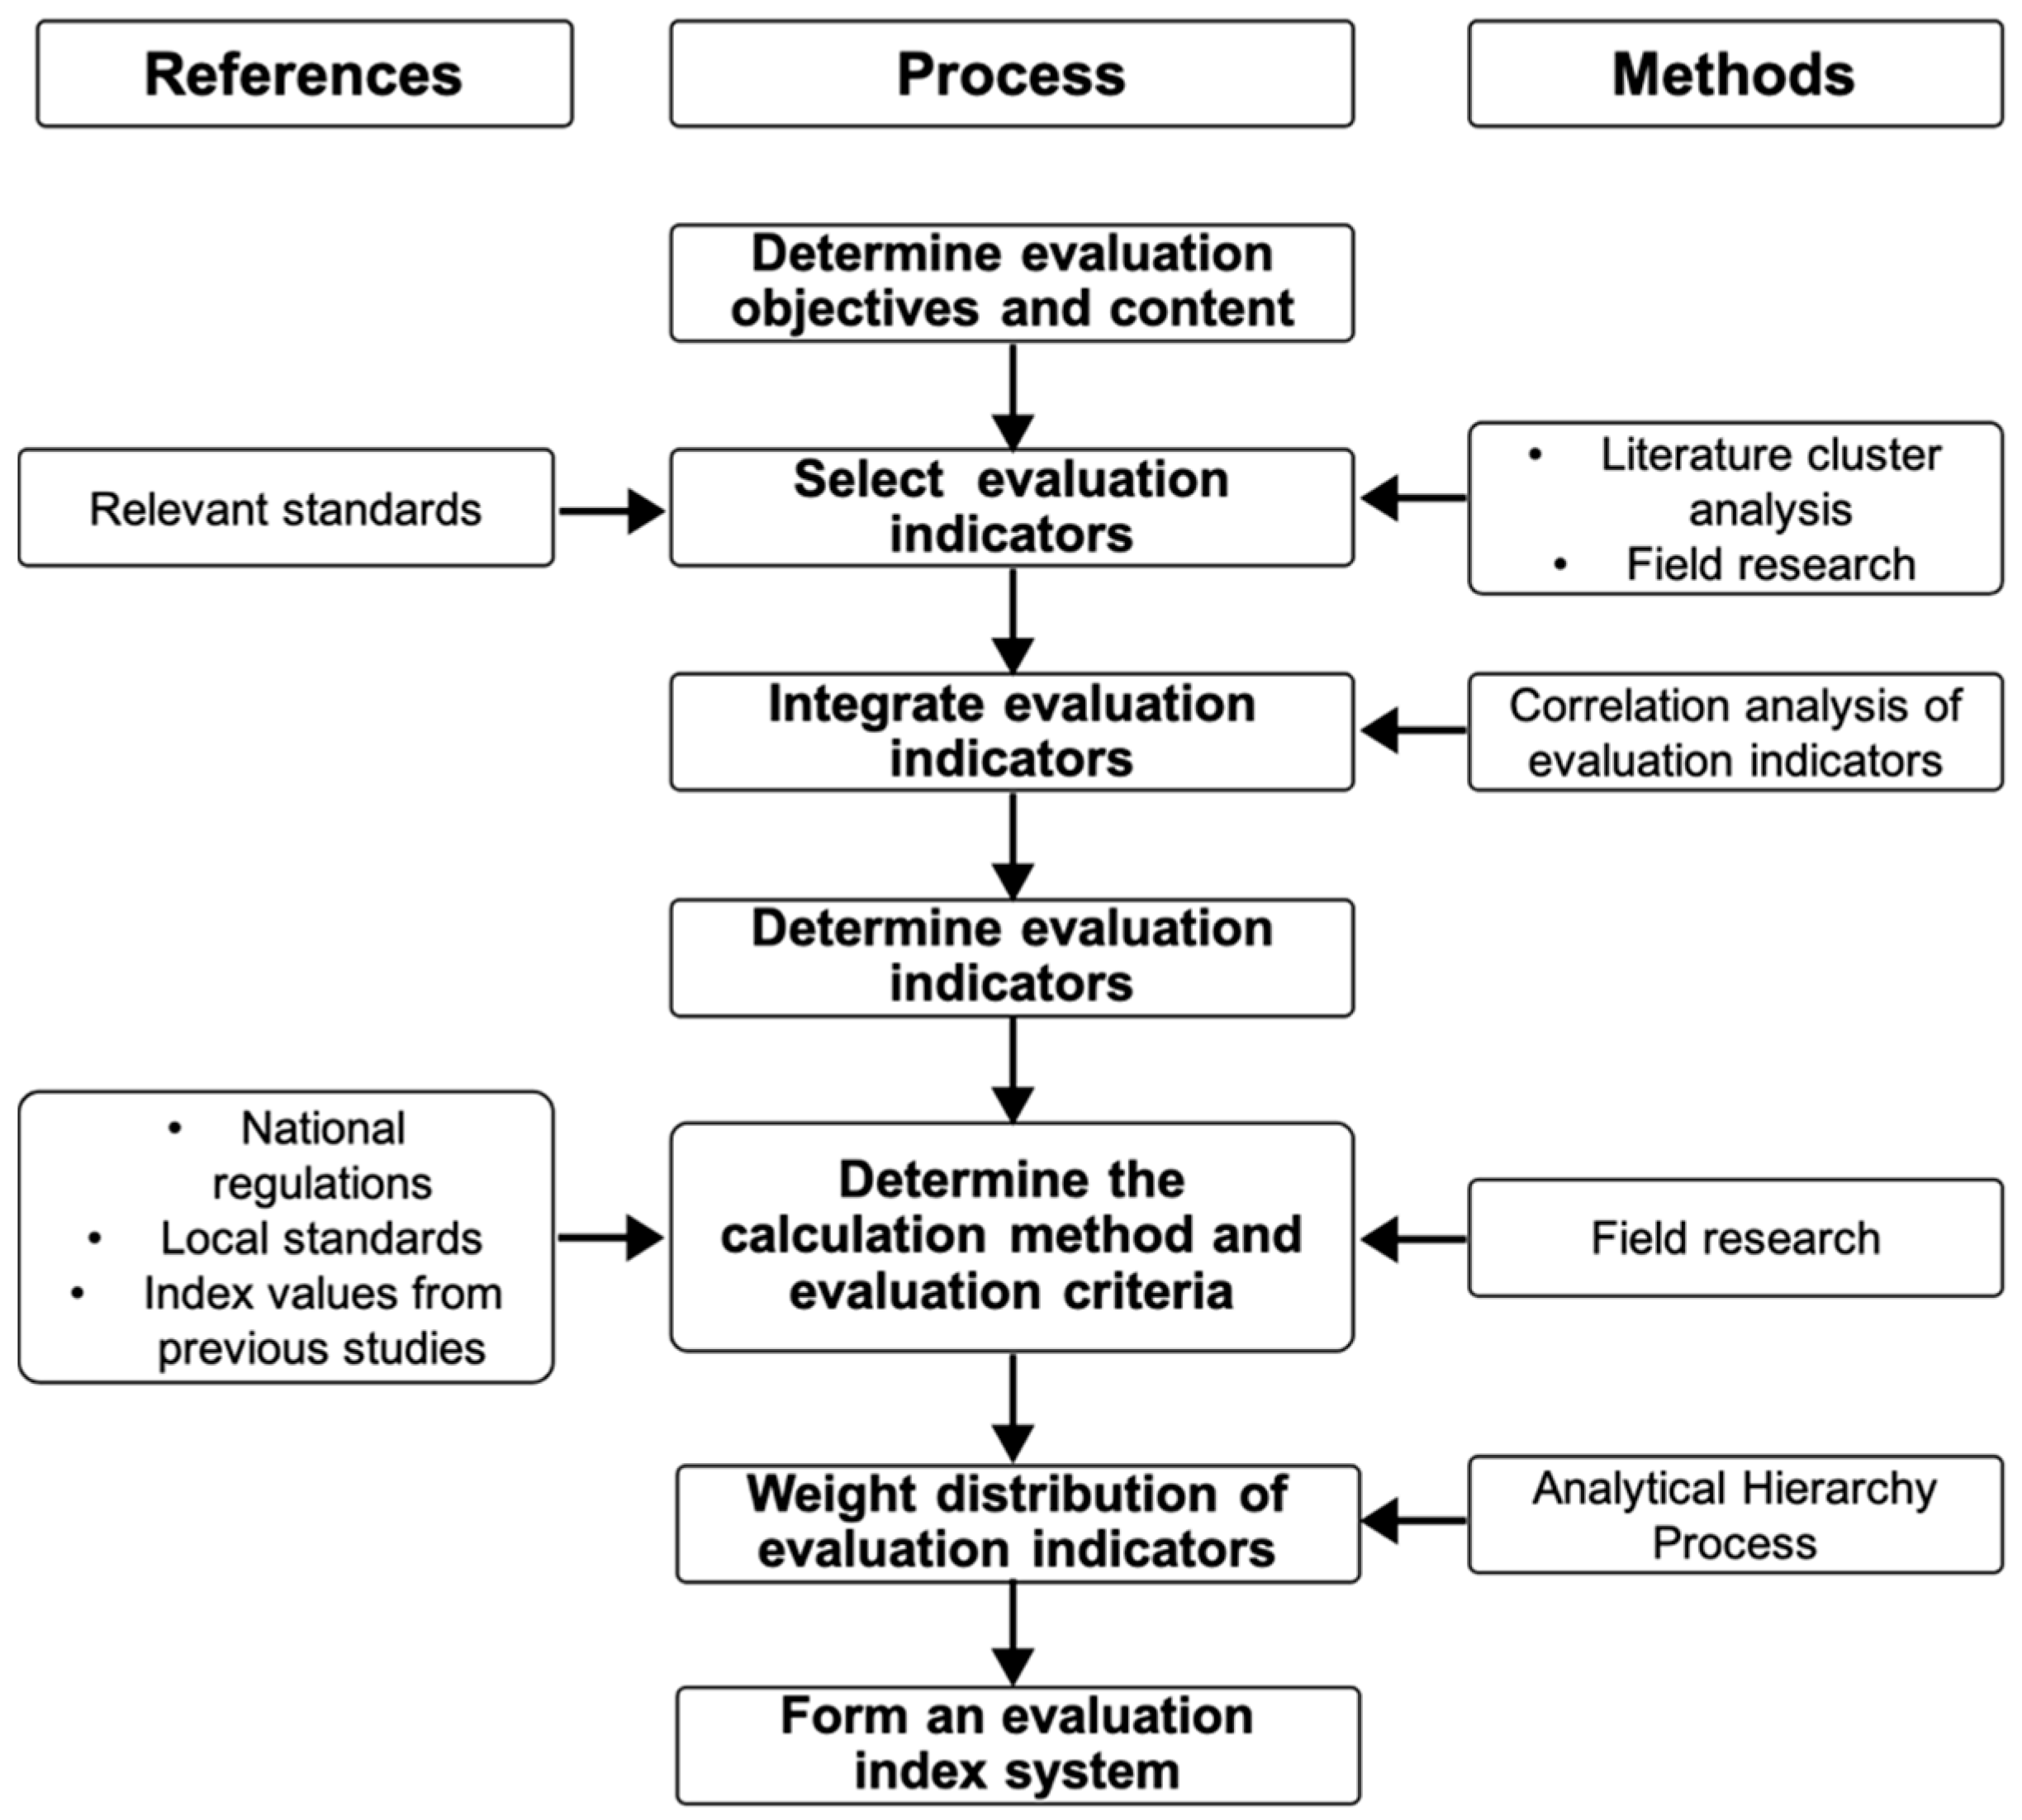
3. Evaluation System Construction

3.1. Principles of Construction

3.1.1. Principle of Comprehensiveness

The selection of indicators for the performance evaluation system of outdoor community spaces based on subjective comfort should reflect the conditions and characteristics of the outdoor environment from multiple perspectives. Therefore, when building the evaluation system, it is essential to choose indicators that are closely related to the outdoor community environment. Only by doing so can the evaluation and simulation effectively address the specific status of the community environment.

3.1.2. Principle of Scientific Validity

The principle of scientific validity requires ensuring that the selected indicators do not overlap. It is also important to consider the influence of multiple factors in the outdoor community environment, such as climate conditions, landscape features, greening levels, and noise levels. Each indicator should capture distinct aspects to enhance the evaluation’s objectivity.

3.1.3. Principle of Operability

The operability principle emphasizes that evaluation indicators should be easy to calculate and collect. The number of indicators should be appropriate to minimize unnecessary workload. Additionally, the absence of critical factors could lead to inaccurate assessments, so it is crucial to select quantifiable and practical indicators to facilitate effective simulation and calculation.

3.1.4. Principle of Simplicity

Given the complexity of most indicator systems, efforts should be made to ensure that the quantification of indicators is concise and straightforward. This will enhance the clarity and comprehensibility of the system, facilitating more efficient evaluation and analysis.

3.1.5. Principle of Universality

The goal of the performance evaluation system for outdoor community environments is to improve the quality of outdoor spaces within communities. The selected comfort indicators should also be applicable to other communities, ensuring that the evaluation system serves as a reference framework for broader environmental improvement initiatives. By adhering to the principle of universality, the system can offer insights and practical recommendations that apply to similar communities.

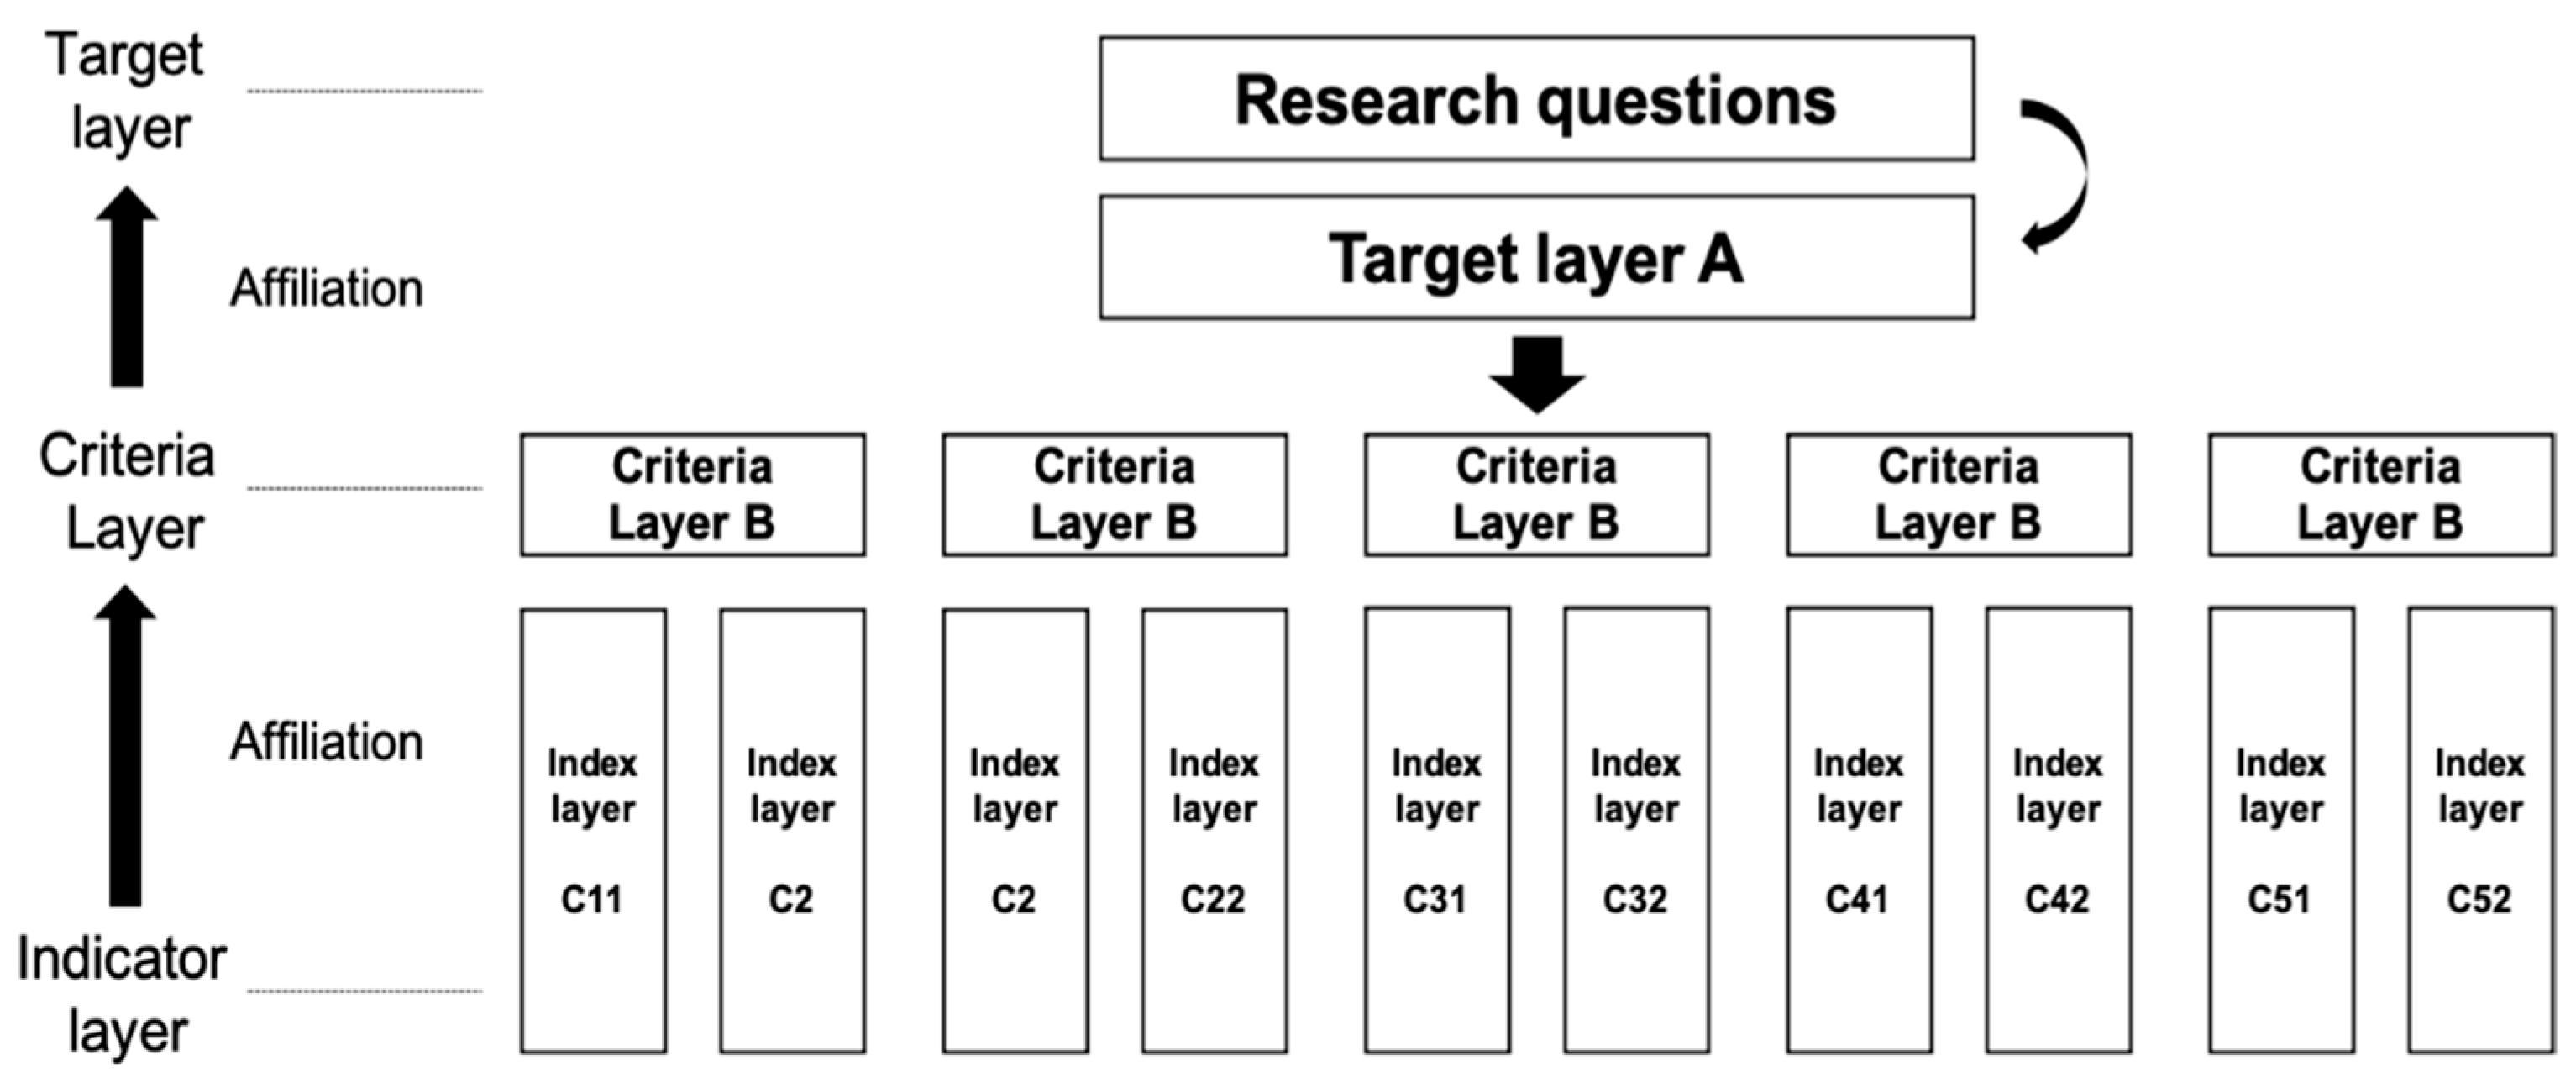
3.2. Construction of the Indicator System

The evaluation system reflects the overall quality of the outdoor environment in community spaces, both during the design phase of community development and throughout the usage phase. A comprehensive range of factors must be considered, including climatic elements (such as wind, light, and heat) as well as materials and psychological aspects. Improving the outdoor environment of communities requires ongoing efforts, and the operation and maintenance of these environments is a long-term process [29]. Therefore, the establishment of the performance evaluation system for community outdoor spaces based on subjective comfort must incorporate adaptability and scalability to meet the evolving needs of urban and community development, as well as to promote healthy living for residents. With this in mind, the study aims to enhance the comfort of outdoor community spaces by aligning with key domestic and international standards and guidelines related to outdoor environments. The overall goal is further divided into eight criterion levels: Wind Comfort, Thermal Comfort, Light Comfort, Greening Comfort, Cleanliness Comfort, Water Comfort, Sound Comfort, and Service Facility Comfort. Each criterion level is further decomposed into 26 operational indicators, ensuring the system is both comprehensive and practical. This hierarchical structure establishes a robust performance evaluation framework for assessing and improving the comfort of outdoor spaces based on subjective comfort (Figure 3 and Table 2).
In order to ensure the scientificity and convenience of statistics, the weight assignment process is carried out in the YAAHP software. According to the above performance evaluation system for assessing and improving the comfort of outdoor spaces based on subjective comfort, the hierarchical structure is constructed in the software, and the questionnaires are exported and distributed. A total of 25 scholars in related fields were consulted by experts in this research, and 22 valid questionnaires were obtained. Finally, the questionnaire results are imported into the YAAHP software, and the specific weights of each index are obtained by judging the matrix solution weights, the relative weights of each layer, and the matrix consistency detection.

3.3. Evaluation Criteria

The classification of the performance levels for community outdoor environmental spaces requires establishing appropriate evaluation benchmarks. These benchmarks are essential for defining comfort levels. On the one hand, existing domestic and international standards, local regulations, and industry norms are referenced to determine the thresholds and levels for various environmental factors, such as wind speed, wind pressure, and sunlight exposure. On the other hand, relevant mathematical models, combined with baseline data and field measurements, are used to align collected data with these standards or reference literature. This process helps establish threshold values and evaluation criteria for individual indicators. For example, shading performance in lighting assessments can be measured by setting up fixed miniature weather stations in the community, which continuously collect data on wind direction, humidity, temperature, and other relevant factors. By aggregating the above information, a comprehensive evaluation standard is developed to classify the performance of outdoor environmental spaces based on subjective comfort. The final evaluation standard table (Table 3) categorizes the community outdoor space performance into various levels according to comfort criteria.

4. Results

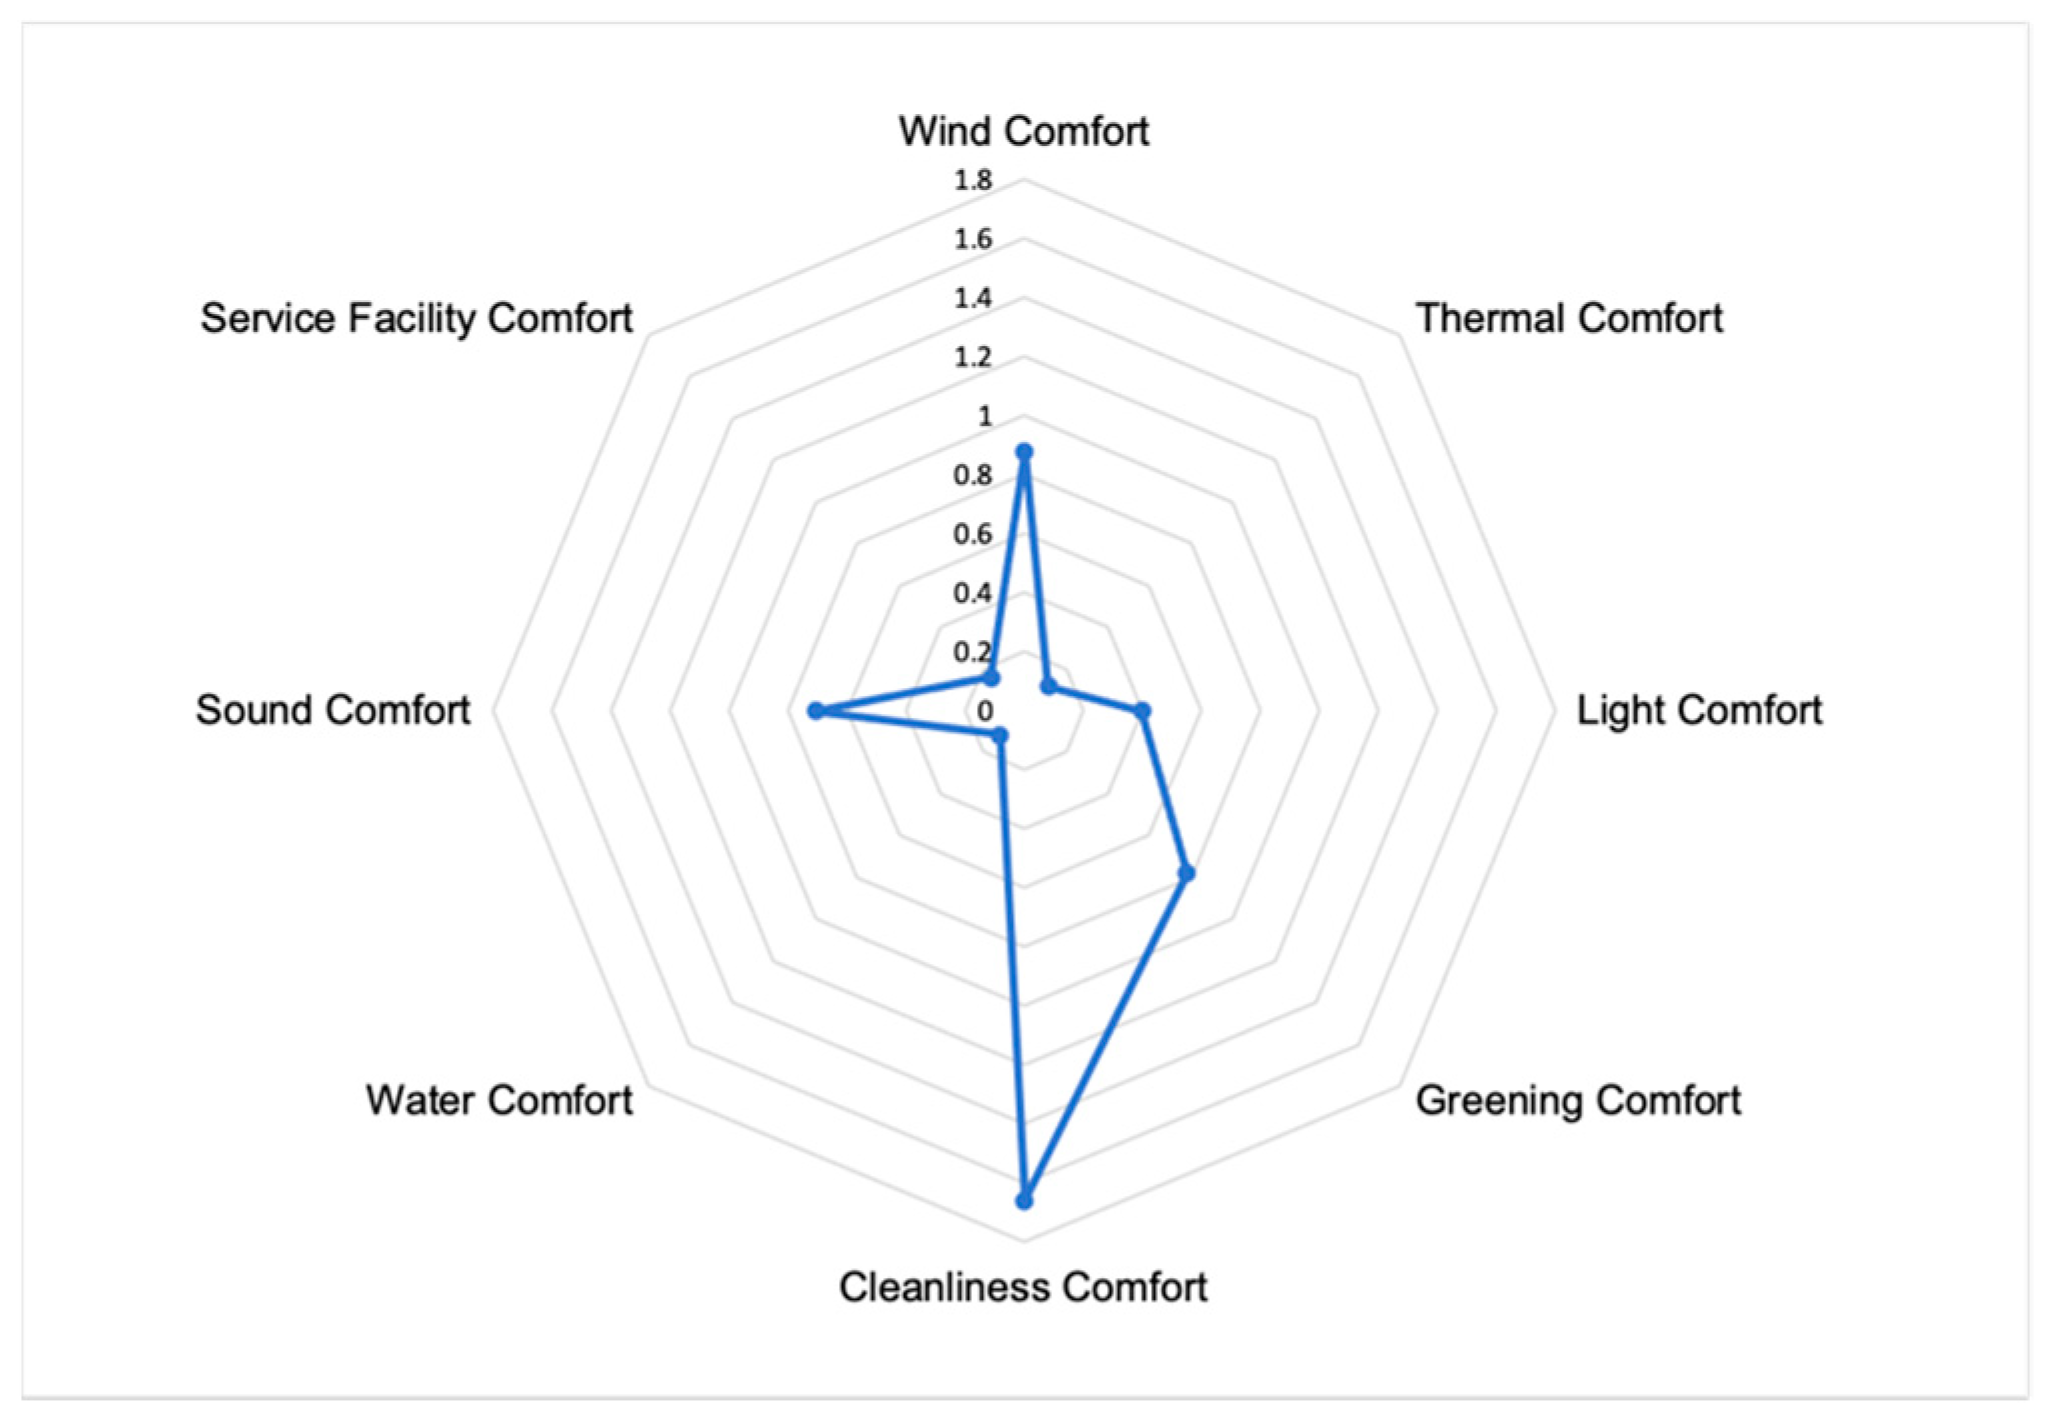
4.1. Comprehensive Evaluation Results

Using the established evaluation system, the Minhe Community in Qian’an City was selected as a case study for assessing outdoor environmental comfort. The evaluation was conducted using a combination of qualitative and quantitative methods: ENVI-met microclimate software simulated the wind, temperature, and humidity conditions. The SketchUp Solar Analysis tool was used to analyze sunlight exposure and shading performance. DepthmapX-0.7.0 software evaluated pedestrian density to assess spatial cleanliness. Aerial photography with drones provided orthophoto and oblique imagery to complement on-site assessments. Field research and questionnaires were used to collect data directly from the site and residents. The final evaluation score for the community’s outdoor environmental comfort was 4.643, indicating that the overall comfort level is slightly below average (Table 4).
Based on the performance evaluation results of the outdoor environmental space in Minhe Community, it was found that the community performs relatively well in terms of cleanliness and comfort, wind environment comfort, thermal environment comfort, and green space comfort. In contrast, it exhibits relatively weaker performance in the areas of service facility comfort, thermal environment comfort, and water environment comfort (Figure 4).
As shown in Figure 5, we ranked the weighted scores of all evaluation indicators to identify the most critical factors within each of the eight criterion categories. The key indicators requiring the most attention include wind speed, outdoor shading, nighttime lighting, environmental sanitation, pollutant collection, green stormwater infrastructure, noise levels, and intelligent operation. Furthermore, by analyzing the coupling diagram of expert scores and benchmark scores, we identified additional indicators outside of the eight main categories that received high expert evaluations but exhibited low benchmark scores. These included natural soundscapes, garden vegetation, and elderly care services—each of which was determined to warrant targeted improvement.
By integrating both sets of indicators—the most critical ones within each criterion layer and the expert-identified low-performing items—we ultimately selected 11 key indicators for focused analysis and optimization.

4.2. Specialized Evaluation Results

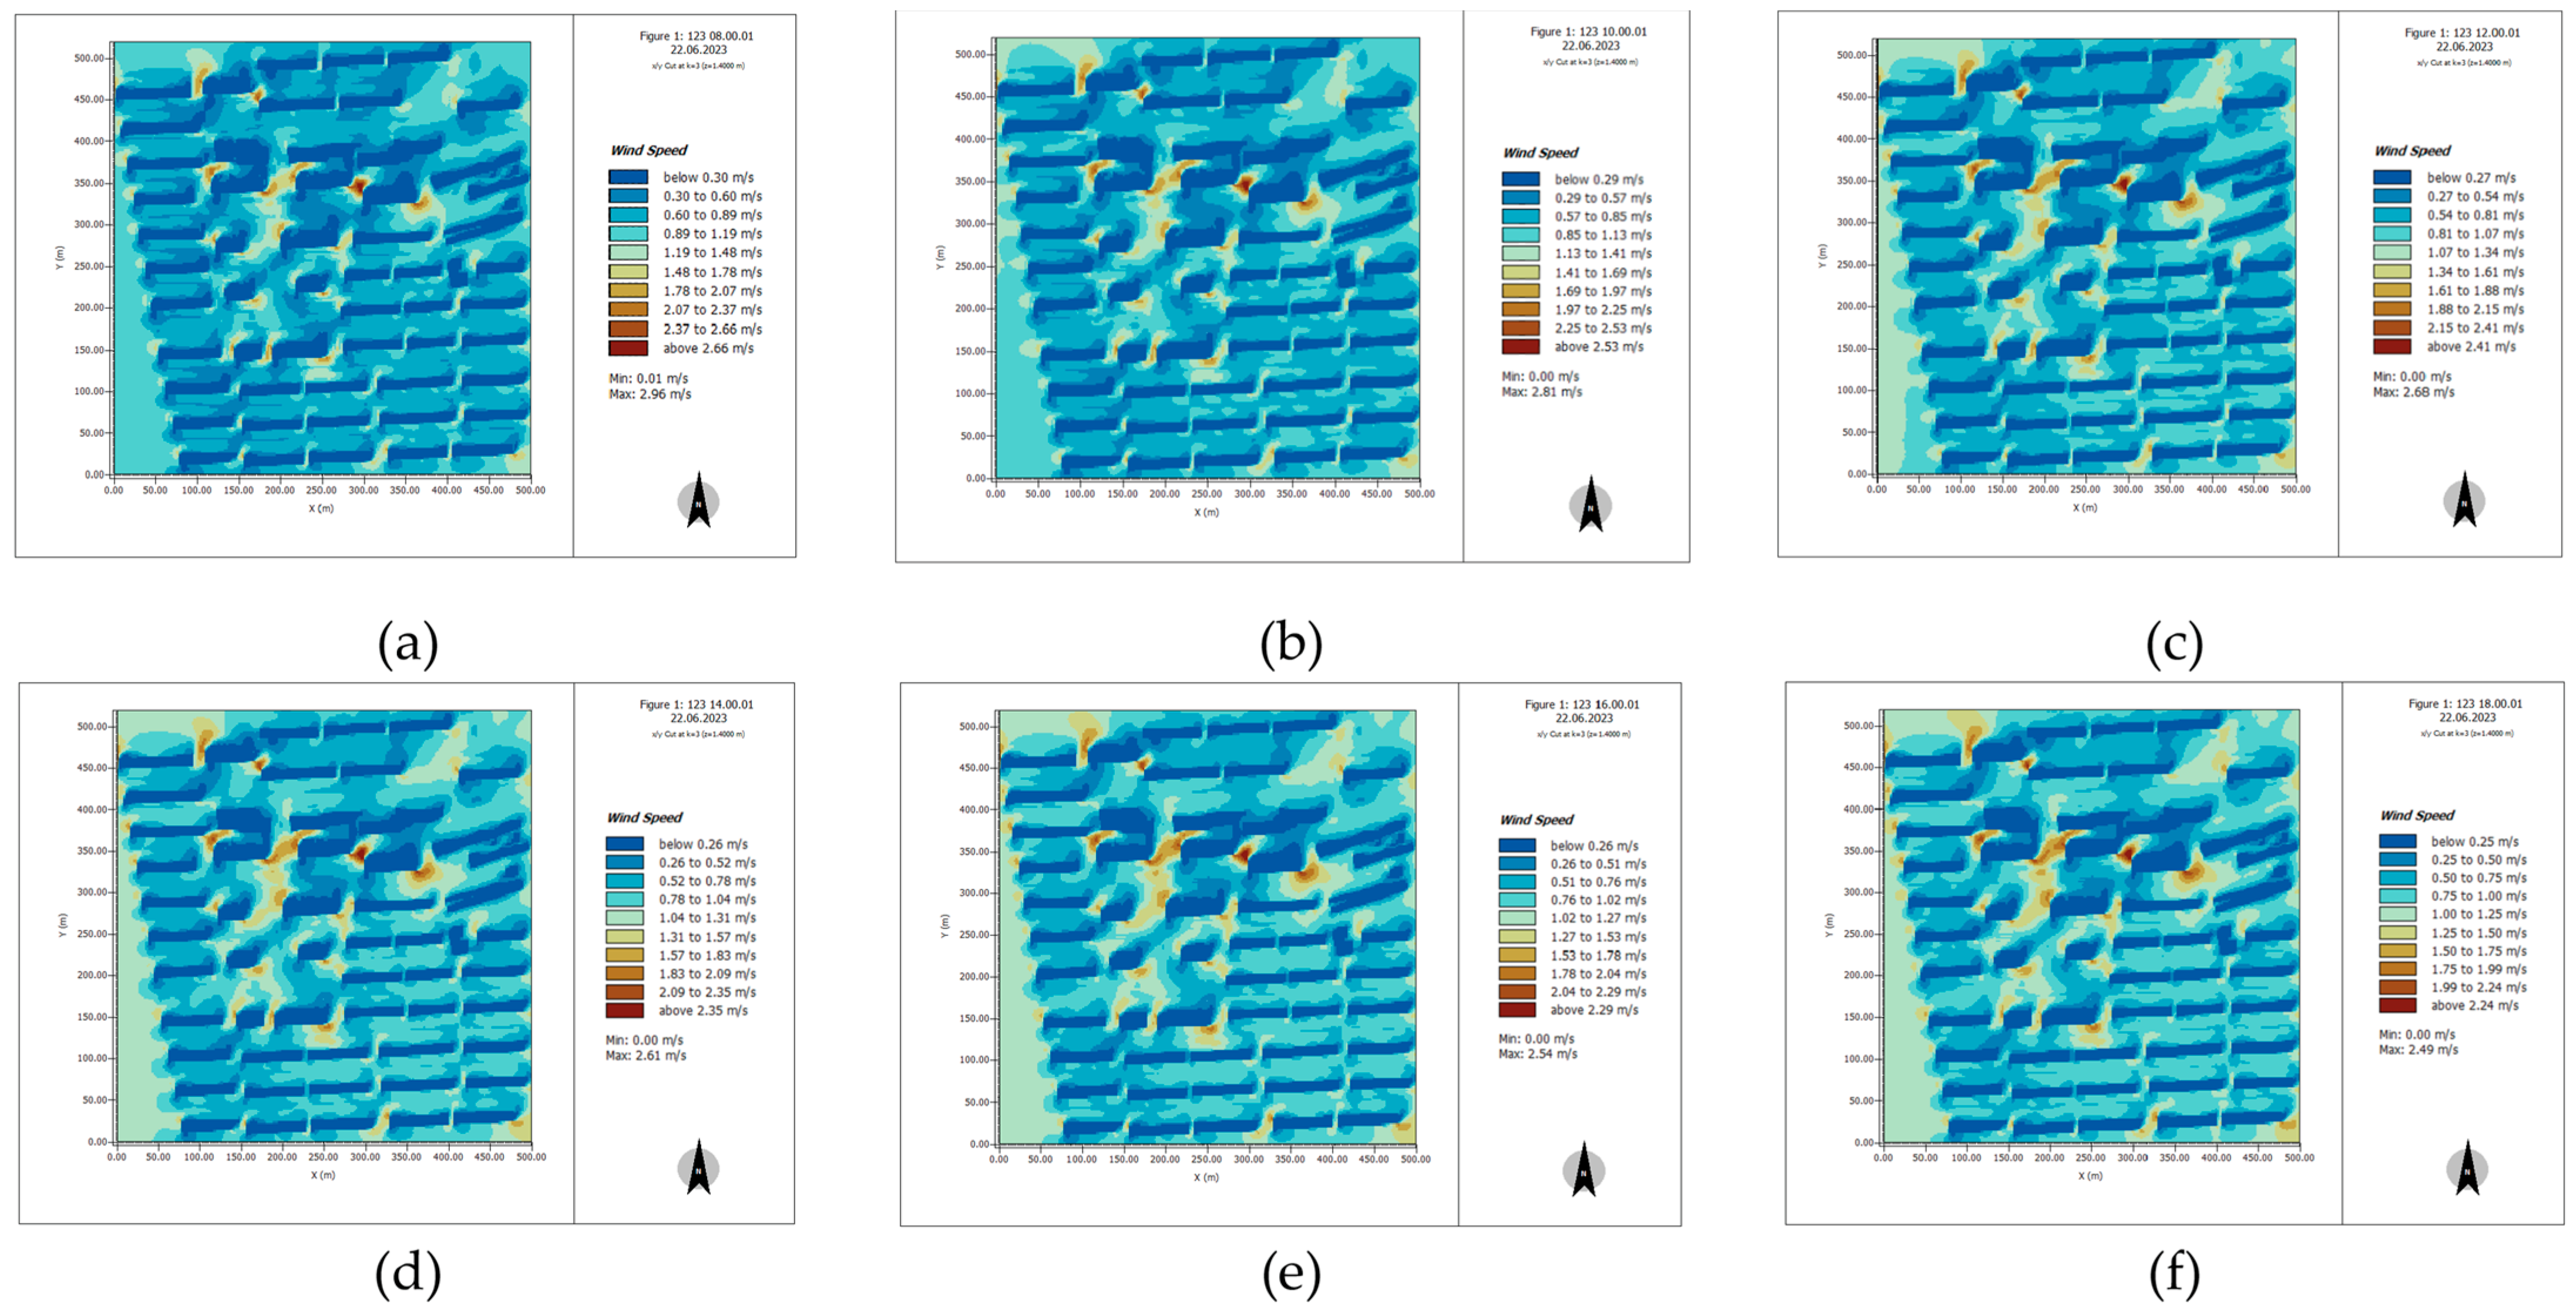
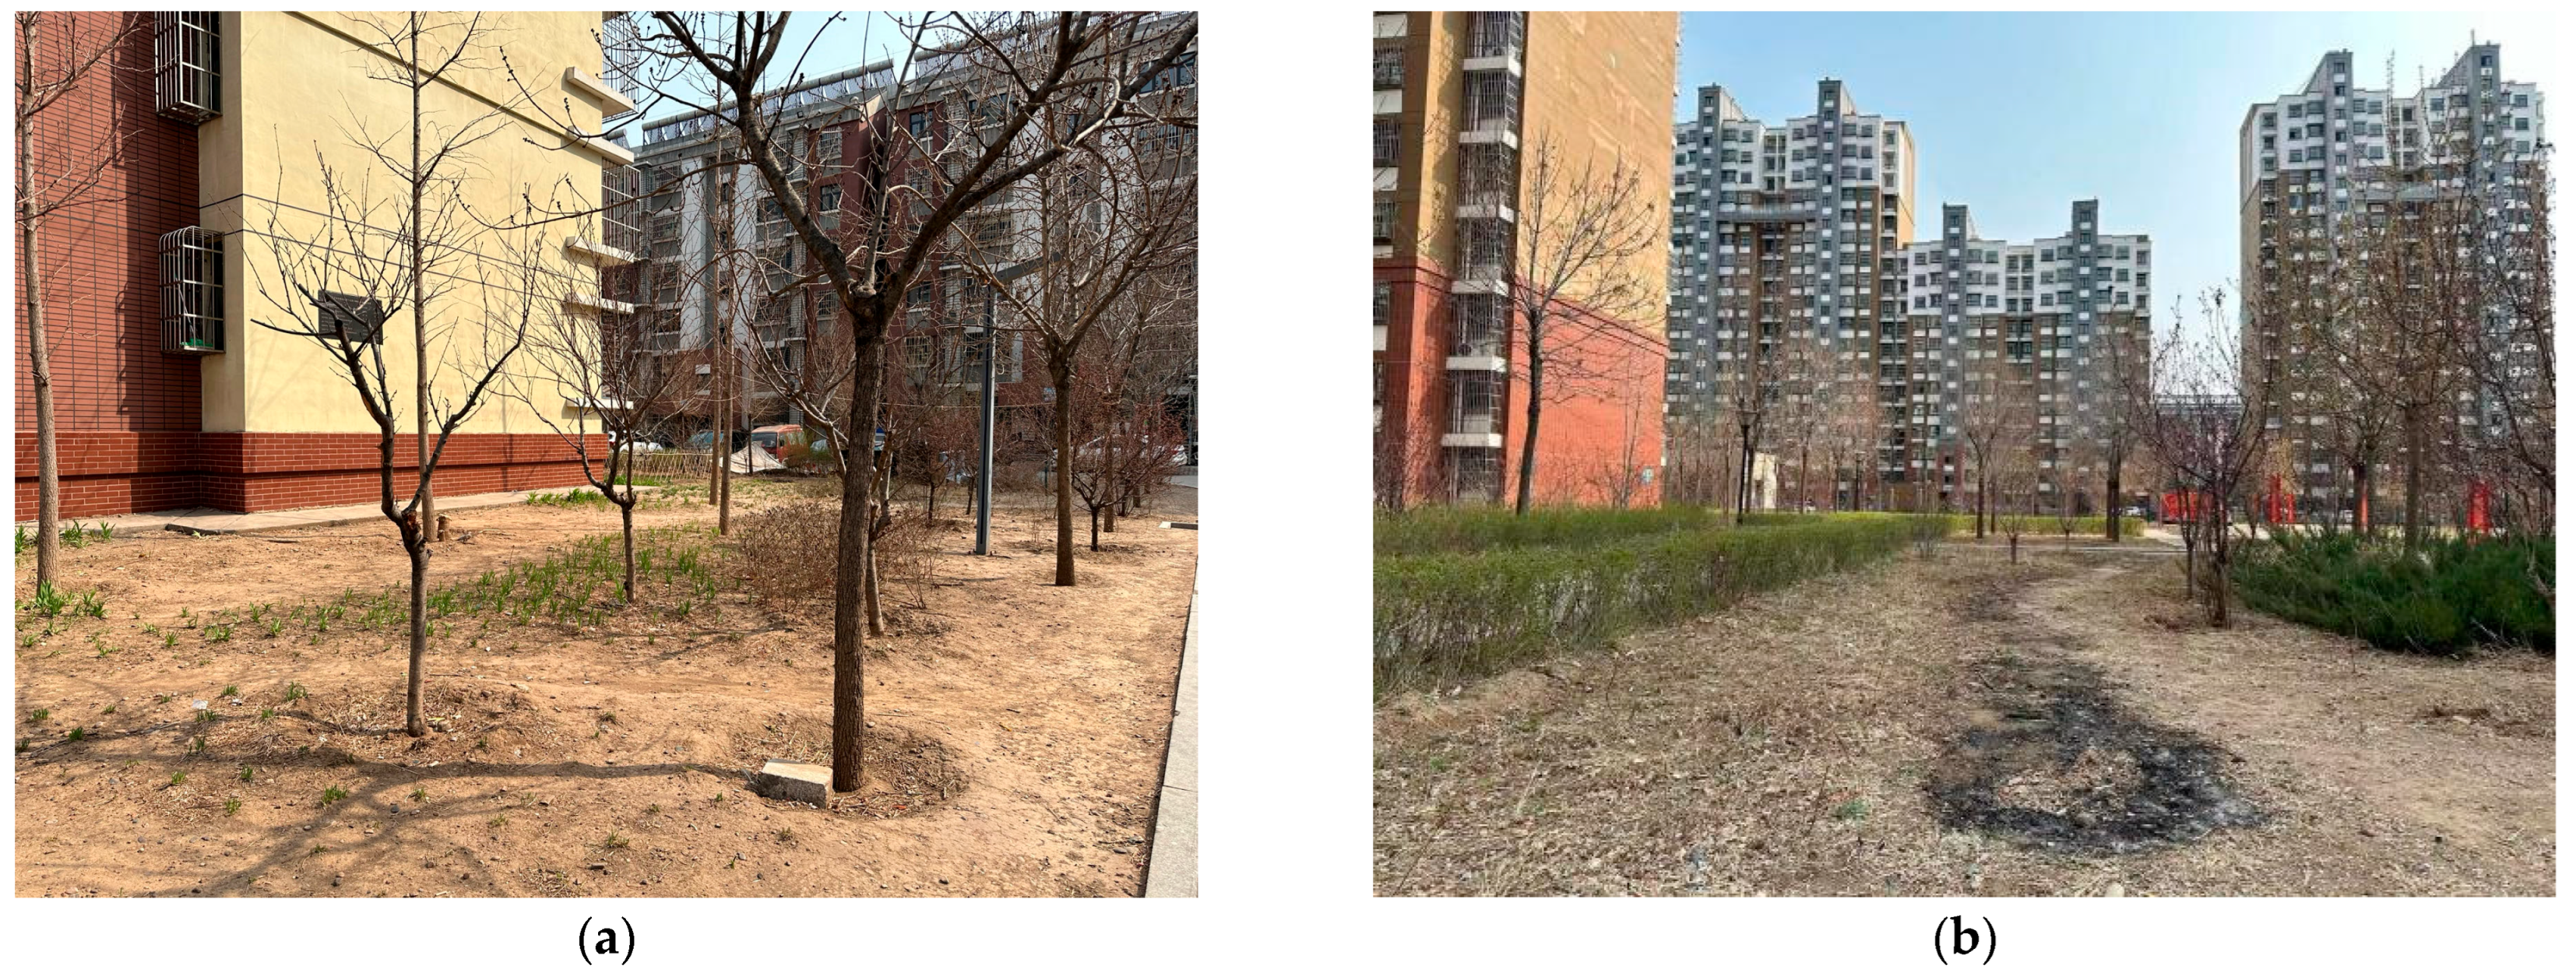
4.2.1. Uneven Wind Speed and Lack of Vegetation Coverage

Through questionnaires and field research, combined with evaluation results, it was found that 40% of residents reported feeling hot during summer within the community. The analysis reveals that the high degree of enclosure within the site leads to low-speed vortex areas, hindering air circulation. Additionally, the northwest side of the community is particularly enclosed, creating low-speed vortices, highlighting the urgent need to improve ventilation efficiency. Measurements conducted using fixed weather stations indicated significant variations in wind speed at different locations within the community. In wind-sheltered areas behind buildings, wind speeds are reduced due to structural obstructions, while the “slit effect” between buildings accelerates wind, creating a “draft corridor” effect. This suggests that the layout of high-rise buildings influences the wind environment, and adjusting the spatial arrangement of community buildings will be a key strategy to improve the wind environment. According to the local wind rose diagram, the prevailing wind direction is from northeast to southwest, aligning with the orientation of community roads. This parallel alignment accelerates wind speeds within the community, negatively impacting residents’ comfort. Additionally, the row-based layout of buildings results in significant wind speed differences, causing an unstable and uneven wind environment (Figure 6).

4.2.2. Low Outdoor Shading Rate and Heat-Absorbing Paving

The green space area, green space ratio, plant species, and green structure in the community significantly impact the thermal environment. A comparison with relevant standards shows that the community’s greening level is relatively low, meaning that trees and vegetation fail to provide sufficient shade and cooling. The low green space ratio further contributes to increased temperatures within the community (Figure 7). The high building density in the community reflects both a low open space ratio and high structural concentration, leading to heat accumulation and reduced heat dissipation. This high density limits ventilation and increases the overall temperature of the outdoor environment. The community’s extensive use of concrete paving for outdoor surfaces exacerbates the heat problem by absorbing solar radiation and increasing surface evaporation rates, further contributing to higher temperatures. Additionally, public activities in the community are primarily sports-oriented, making it difficult for residents to enjoy outdoor activities comfortably in such thermal conditions. This results in poor outdoor experiences and reduces residents’ satisfaction with the environment during warmer periods.

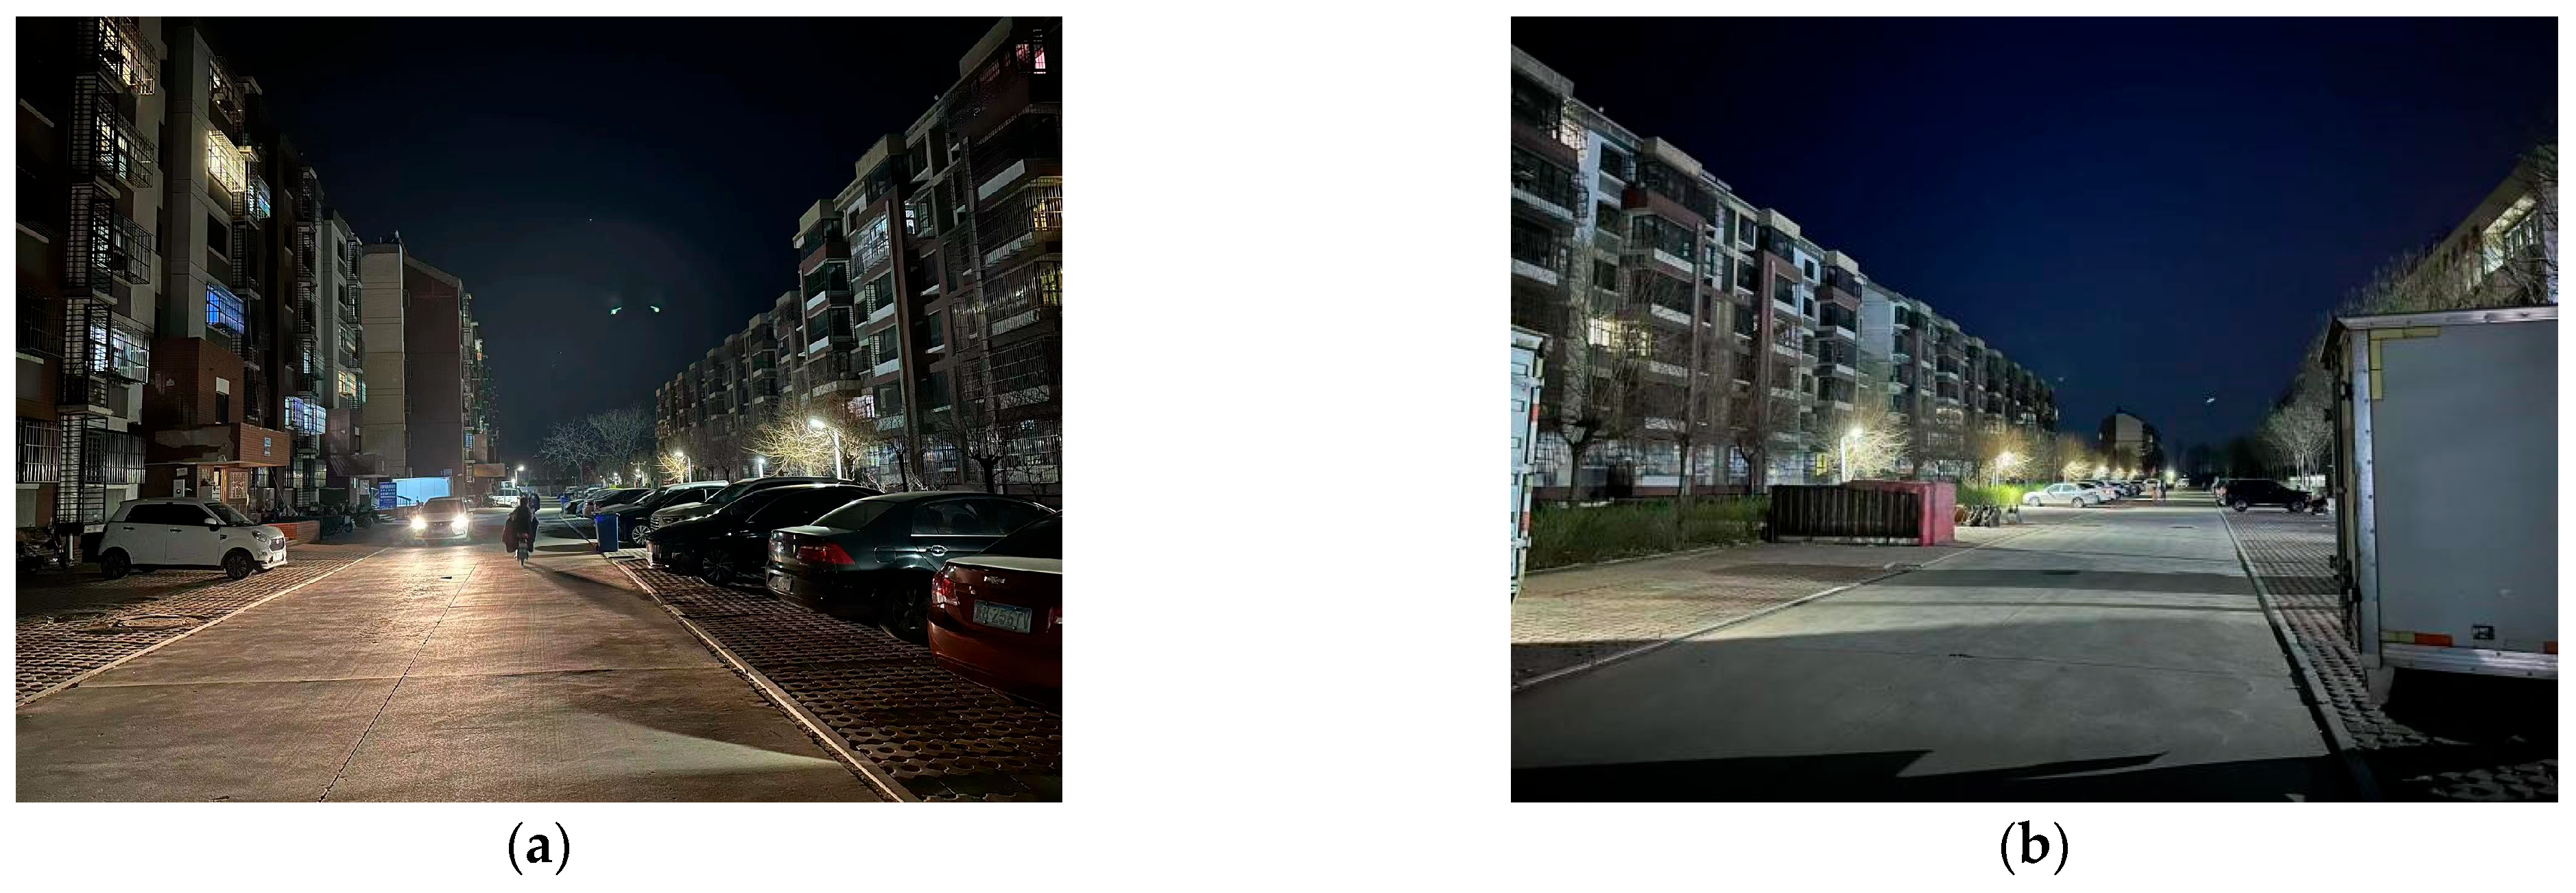
4.2.3. Uneven Night Lighting and Low Light Utilization

Based on the results of questionnaires and field research, the community exhibits issues of uneven night lighting and low light utilization (Figure 8). At the edges of the community, the absence of lighting facilities increases safety risks and the potential for accidents. Insufficient lighting in these areas also affects residents’ daily activities and quality of life, weakening community cohesion and contributing to strained neighborly relations. Public activity areas within the community suffer from excessive lighting intensity, leading to light pollution. This negatively affects residents’ sleep, causing increased tension, anxiety, and depression, ultimately reducing the overall quality of life. To address these issues, it is essential to enhance the design and distribution of night lighting facilities throughout the community. Optimizing lighting infrastructure will improve residents’ safety, foster better community interactions, and enhance overall living comfort.

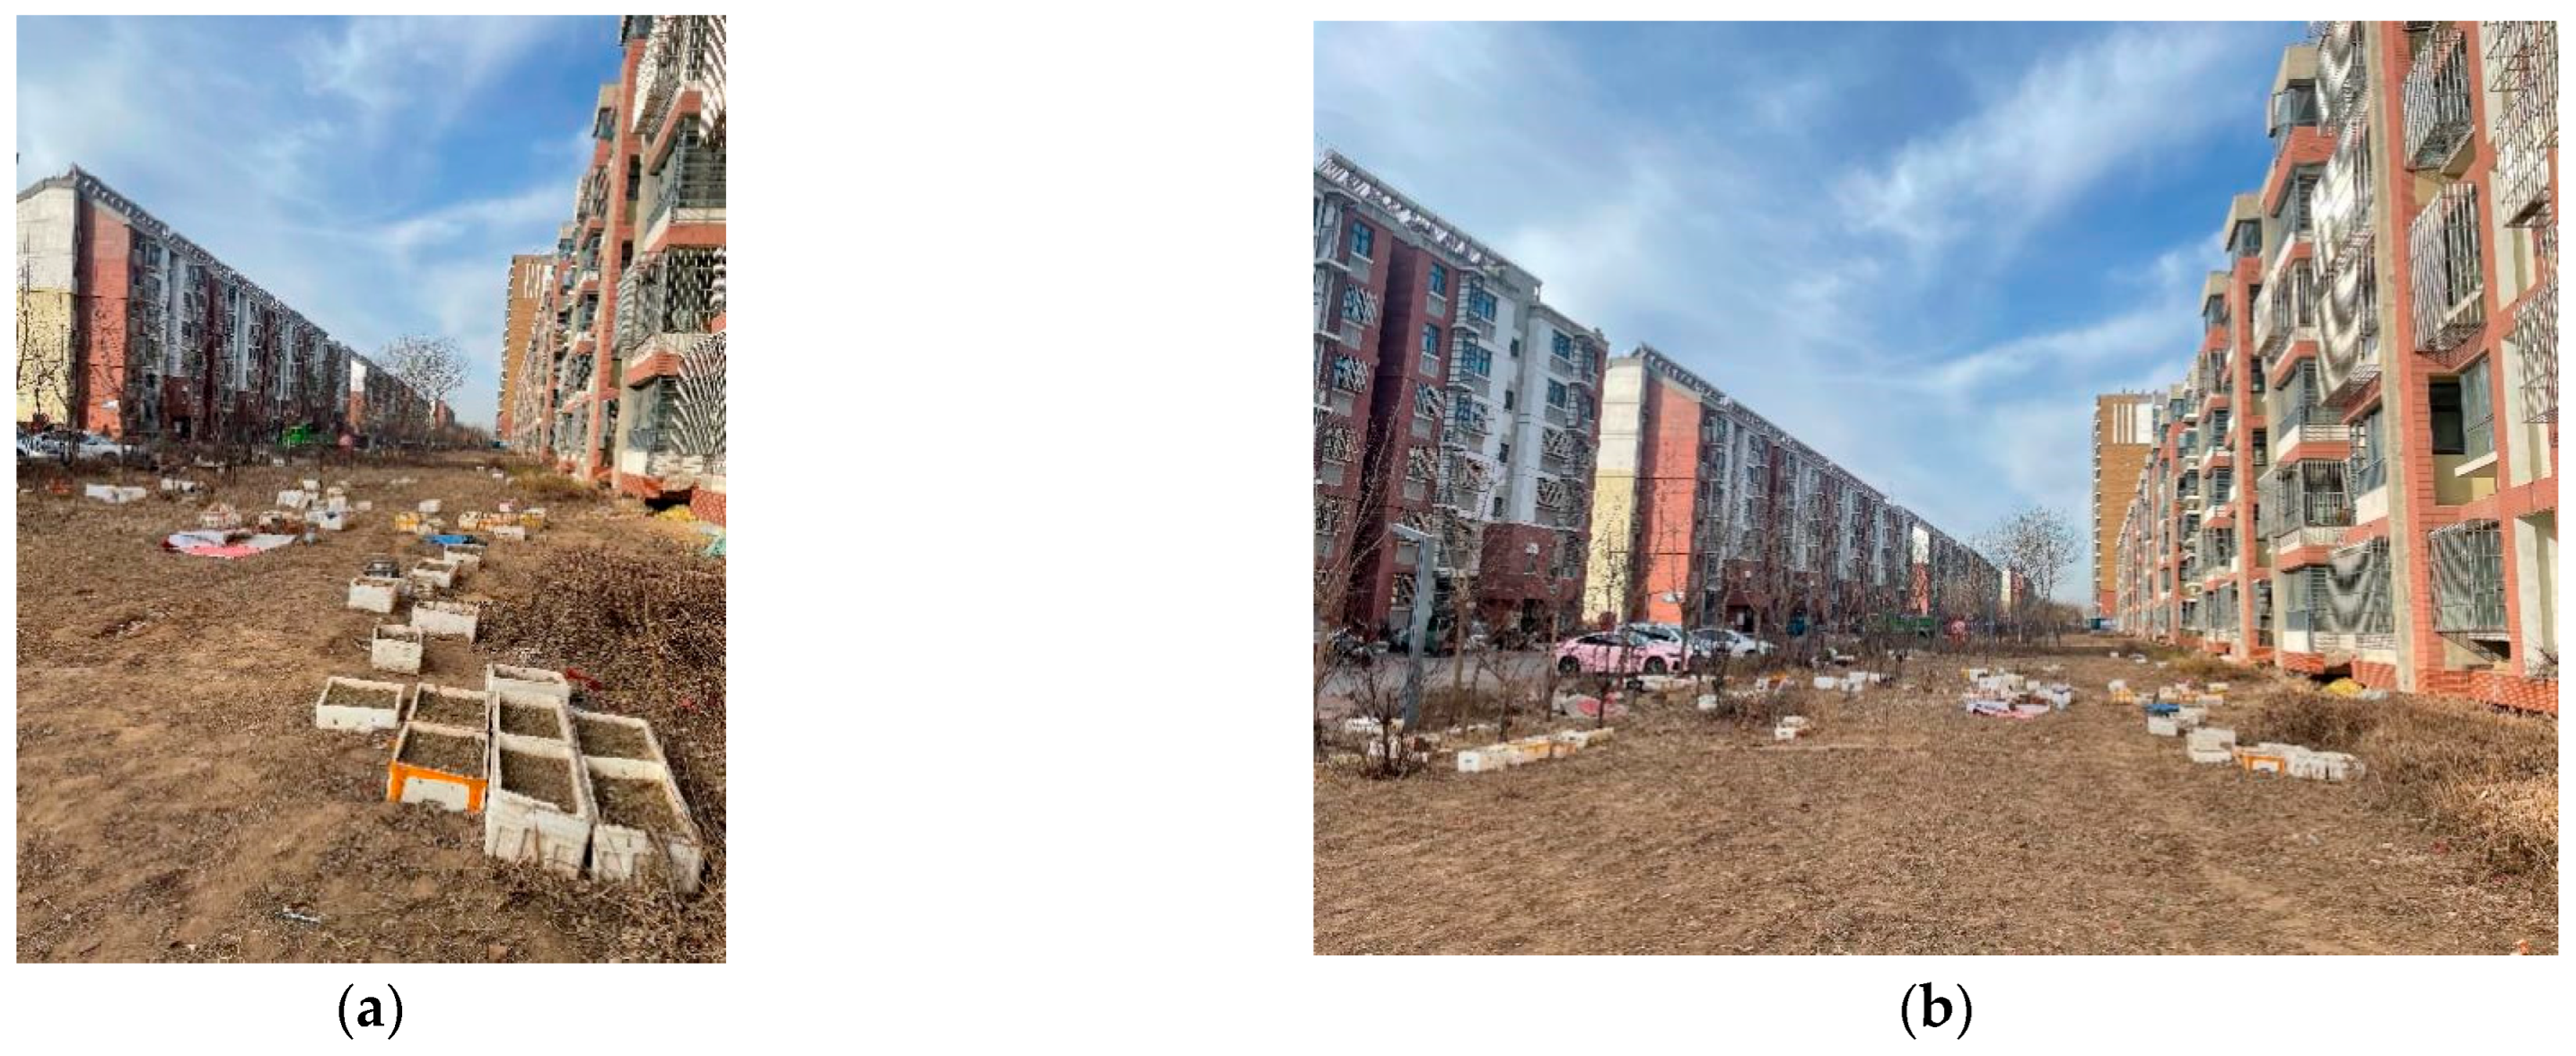
4.2.4. Poor Sanitation Conditions and Limited Waste Collection Methods

Based on field research and evaluation results, the community faces significant environmental pollution issues. Garbage accumulation in public areas deteriorates the overall hygiene, and wind disperses waste, spreading litter throughout the community. The community also lacks a waste classification system (Figure 9). Waste collection is limited and inefficient, with no effective mechanisms to sort recyclable waste, food waste, and other types of garbage. This results in both environmental pollution and resource wastage. These hygiene issues pose health risks to residents, increasing the likelihood of respiratory diseases. Furthermore, poor sanitation negatively affects residents’ mental well-being, leading to mood deterioration and increased negative emotions. In the long term, these issues contribute to disruptions in community order and environmental instability, undermining efforts to maintain a sustainable and harmonious environment.

4.2.5. Weak Green Infrastructure and Fragmented Landscape Layers

The community faces significant issues related to insufficient green infrastructure and fragmented landscape design (Figure 10). Essential green infrastructure, such as grass swales, sunken green spaces, rooftop greenery, and rainwater harvesting facilities, is either lacking or poorly developed. These elements are crucial for improving the ecological environment and enhancing urban water resource management efficiency. Lack of green infrastructure (e.g., grass swales and sunken green spaces) hinders the effective collection and utilization of rainwater, increasing urban drainage pressure and contributing to water wastage. The landscape within the community is divided by roads, with poor design and limited interaction with residents, reducing opportunities for people to benefit from nature and diminishing the aesthetic appeal and livability of the community. The planting scheme is monotonous, with low vegetation density, which weakens the greening effect and reduces ecological functionality. The lack of diversity and layered vegetation further limits the ability to improve the quality of the ecological environment.

4.2.6. High Noise Levels and Lack of Natural Sounds

According to field surveys and evaluation results, the community experiences excessive traffic noise. The areas around entrances, exits, and road intersections have high traffic volumes, with vehicle horns and engine noise being the primary noise sources. Additionally, public activities such as square dancing contribute to noise pollution within the community. The low green space ratio and lack of diverse vegetation result in fewer natural sounds, such as bird calls and cicada chirps, which are important for promoting psychological well-being and enhancing comfort. The absence of these natural elements negatively impacts residents’ mental health and sense of relaxation.

4.2.7. Poor Service Facilities and Low Level of Digitalization

Based on on-site discussions and community evaluation results, the community faces service operation issues including information opacity, inadequate healthcare and elderly care services, and resource shortages. Lack of transparency: Service-related information is not updated in a timely manner, and residents are unaware of the community comfort index and available services, reducing their engagement. Healthcare services: The community lacks medical stations, forcing residents to seek healthcare services in the city center or nearby neighborhoods. Elderly care services: There are no dedicated activities or policies to support elderly care, negatively affecting the comfort and well-being of older residents.

5. Discussion

5.1. Optimization Strategies

Based on the specialized evaluation results, the following optimization strategies are proposed:

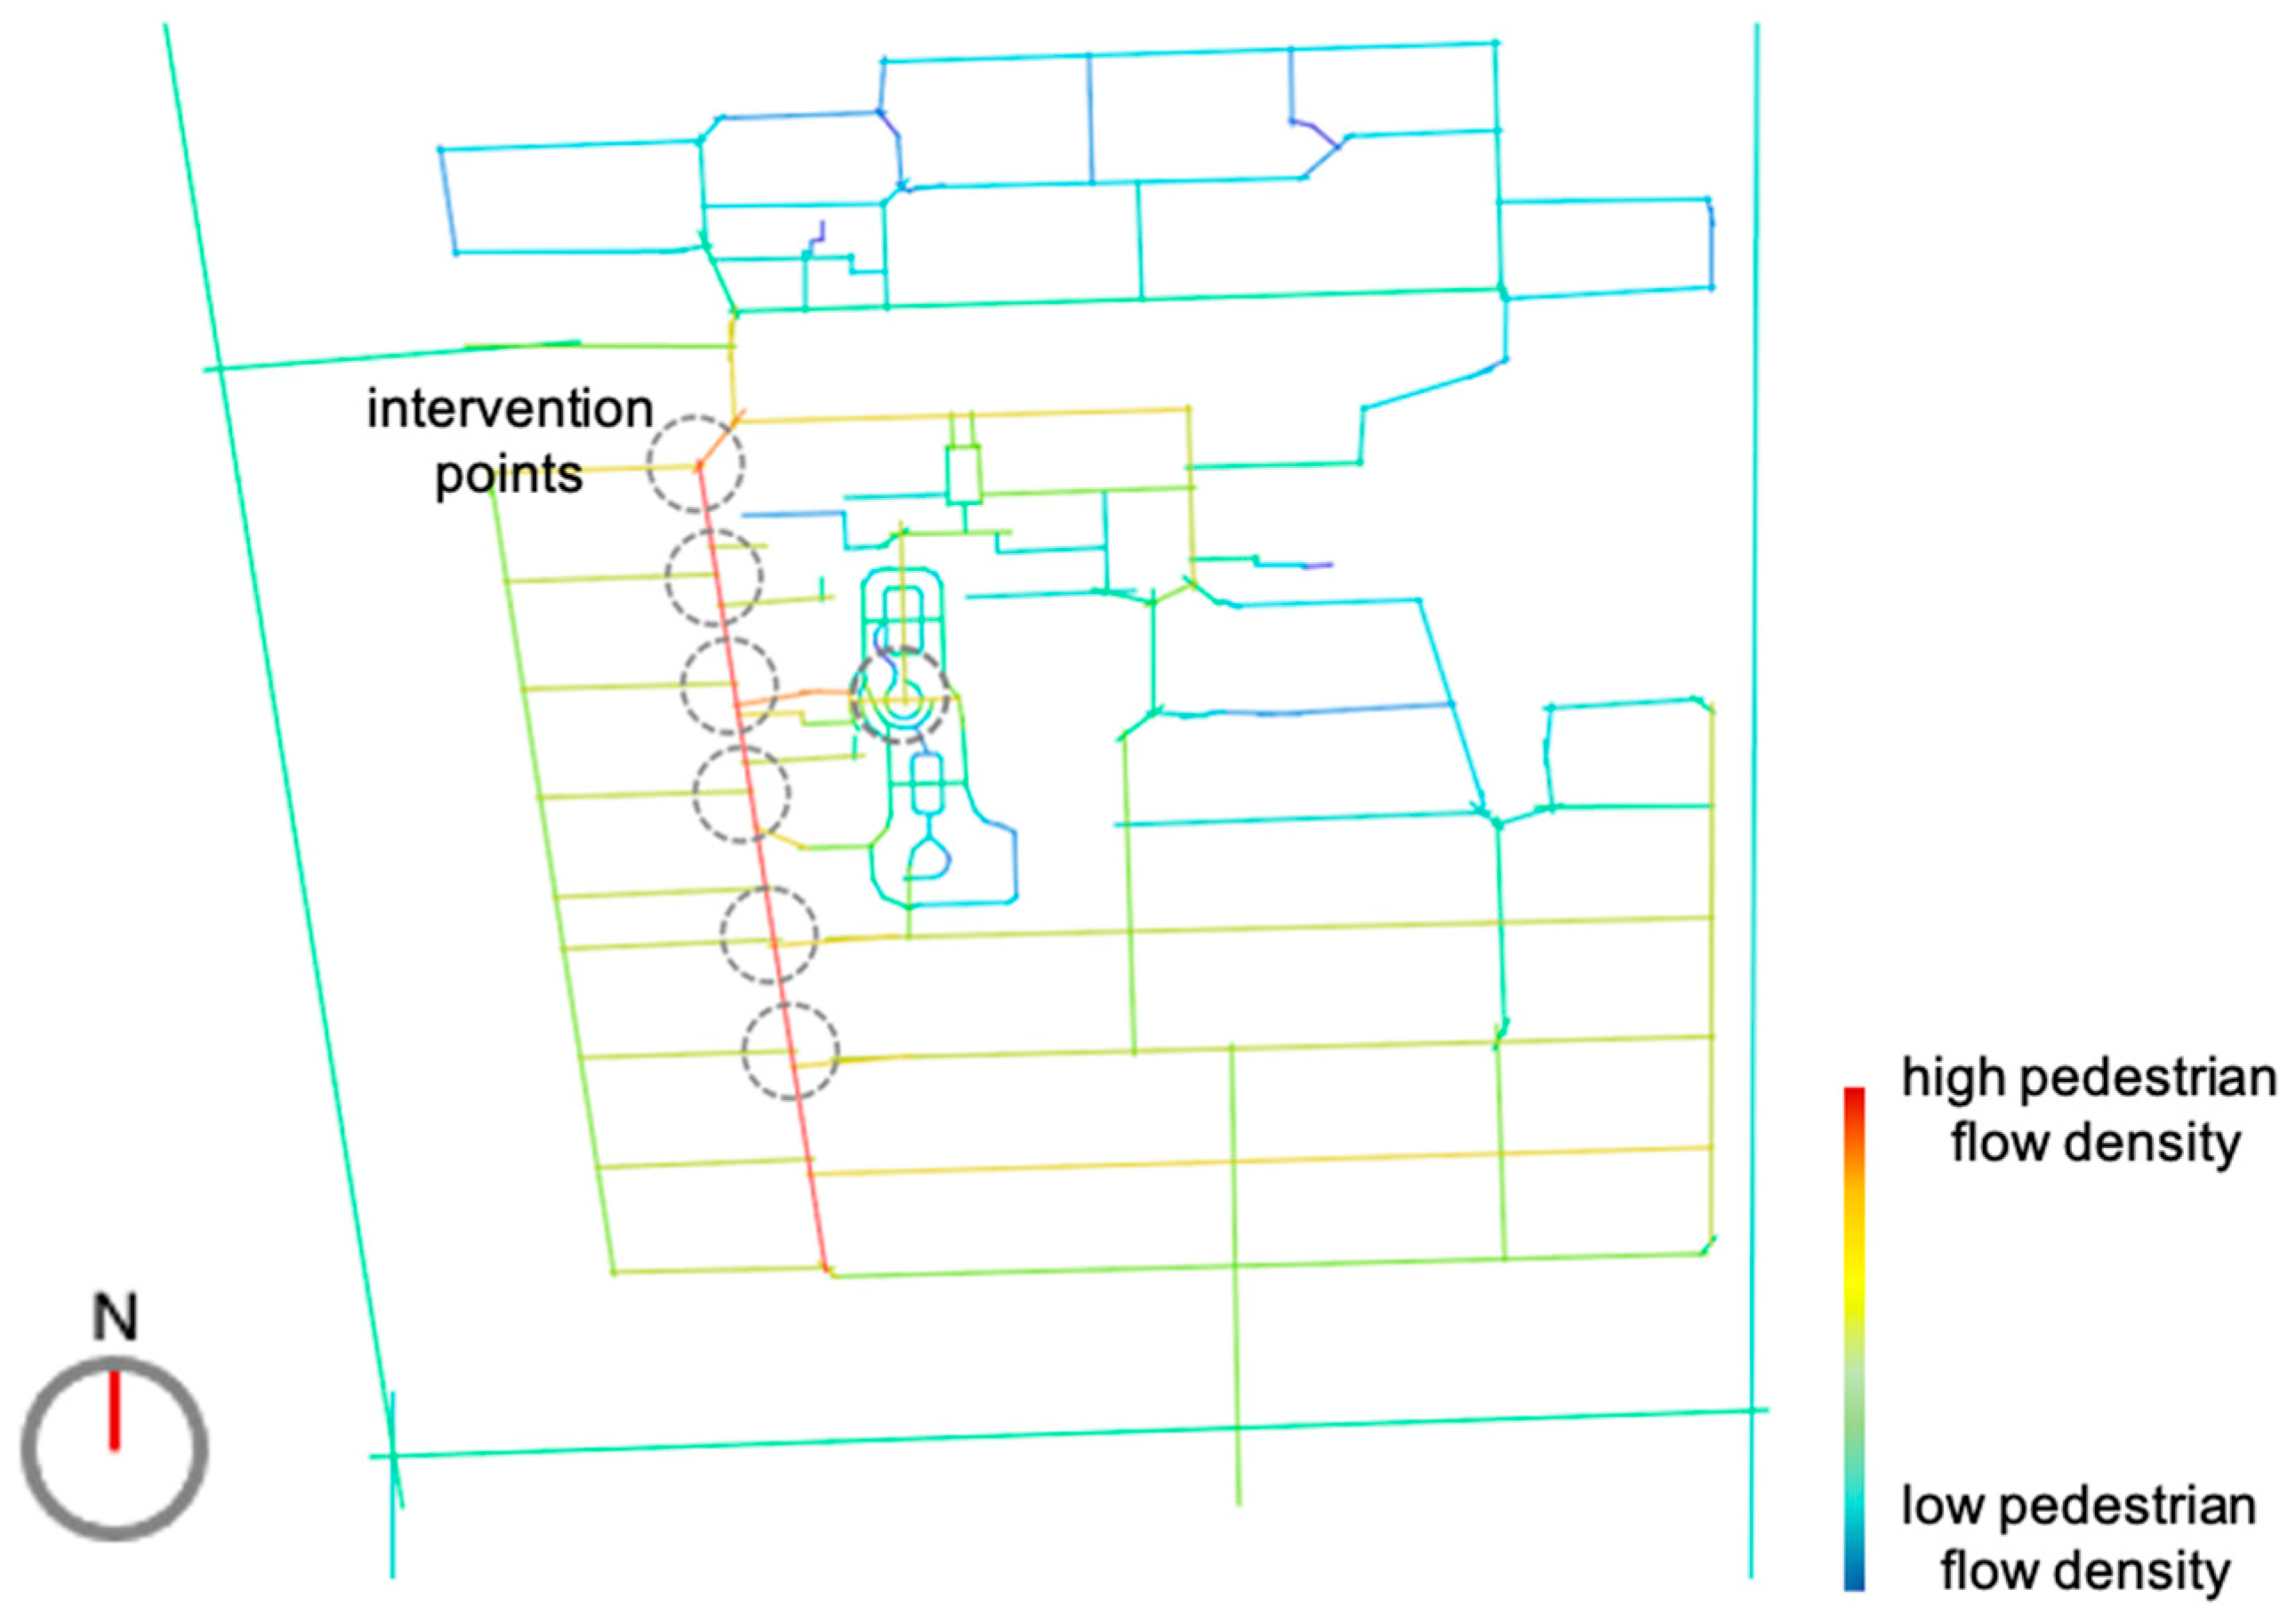
5.1.1. Wind Environment Optimization

In areas where spatial optimization is challenging, tall trees and small trees can be strategically planted to create layered vegetation configurations. This helps redirect strong winds and mitigate wind fields around buildings. Since trees are more effective than shrubs at reducing wind speeds, tall trees can be placed on windward sides, especially at the corners of high-rise buildings.
Shrubs can be planted under tall trees on windward sides to block airflow near the ground, channeling it through gaps, thus minimizing the wind’s impact. In areas with high wind speeds, sharp angles in architectural layouts should be avoided, and flexible corner designs should be used wherever possible to reduce wind effects [39,40].

5.1.2. Environmental Improvements

To enhance comfort, outdoor seating areas and lounges can be added, creating semi-open spaces that offer shelter from wind and sun. In areas requiring shade, shade trees or umbrellas should be installed to provide comfortable resting spaces for residents.
Rather than using large lawns, small areas with trees and other vegetation should be arranged. Tree canopies can absorb solar radiation, improving thermal comfort during summer [41,42].
Green infrastructure development should be prioritized by planning and constructing grass swales, sunken green spaces, rooftop greenery, vertical gardens, and rainwater harvesting facilities. These features will promote water recycling and improve the microclimate within the community [43,44,45].

5.1.3. Sound and Light Environment Optimization

A scientific assessment of the lighting environment should be conducted to adjust lighting intensity and eliminate unnecessary lighting. Energy-saving solutions should also be promoted.
Sound barriers or green belts can be installed at community entrances and road intersections to reduce noise pollution. Road modifications, such as speed bumps and shock absorbers, should be implemented on busy streets to minimize noise from traffic.
Acoustic optimization should be applied to public activity spaces by using sound-absorbing materials, which will reduce noise disturbances from activities and improve residents’ experience [46,47].

5.1.4. Smart Management

A community service information platform should be developed using UE4 technology to enhance the digital infrastructure. This platform can provide timely updates on community activities, services, projects, and relevant policies, improving residents’ access to information and engagement with services.
These strategies are designed to address specific challenges in the community and enhance overall environmental comfort, fostering a more livable, sustainable, and harmonious community.

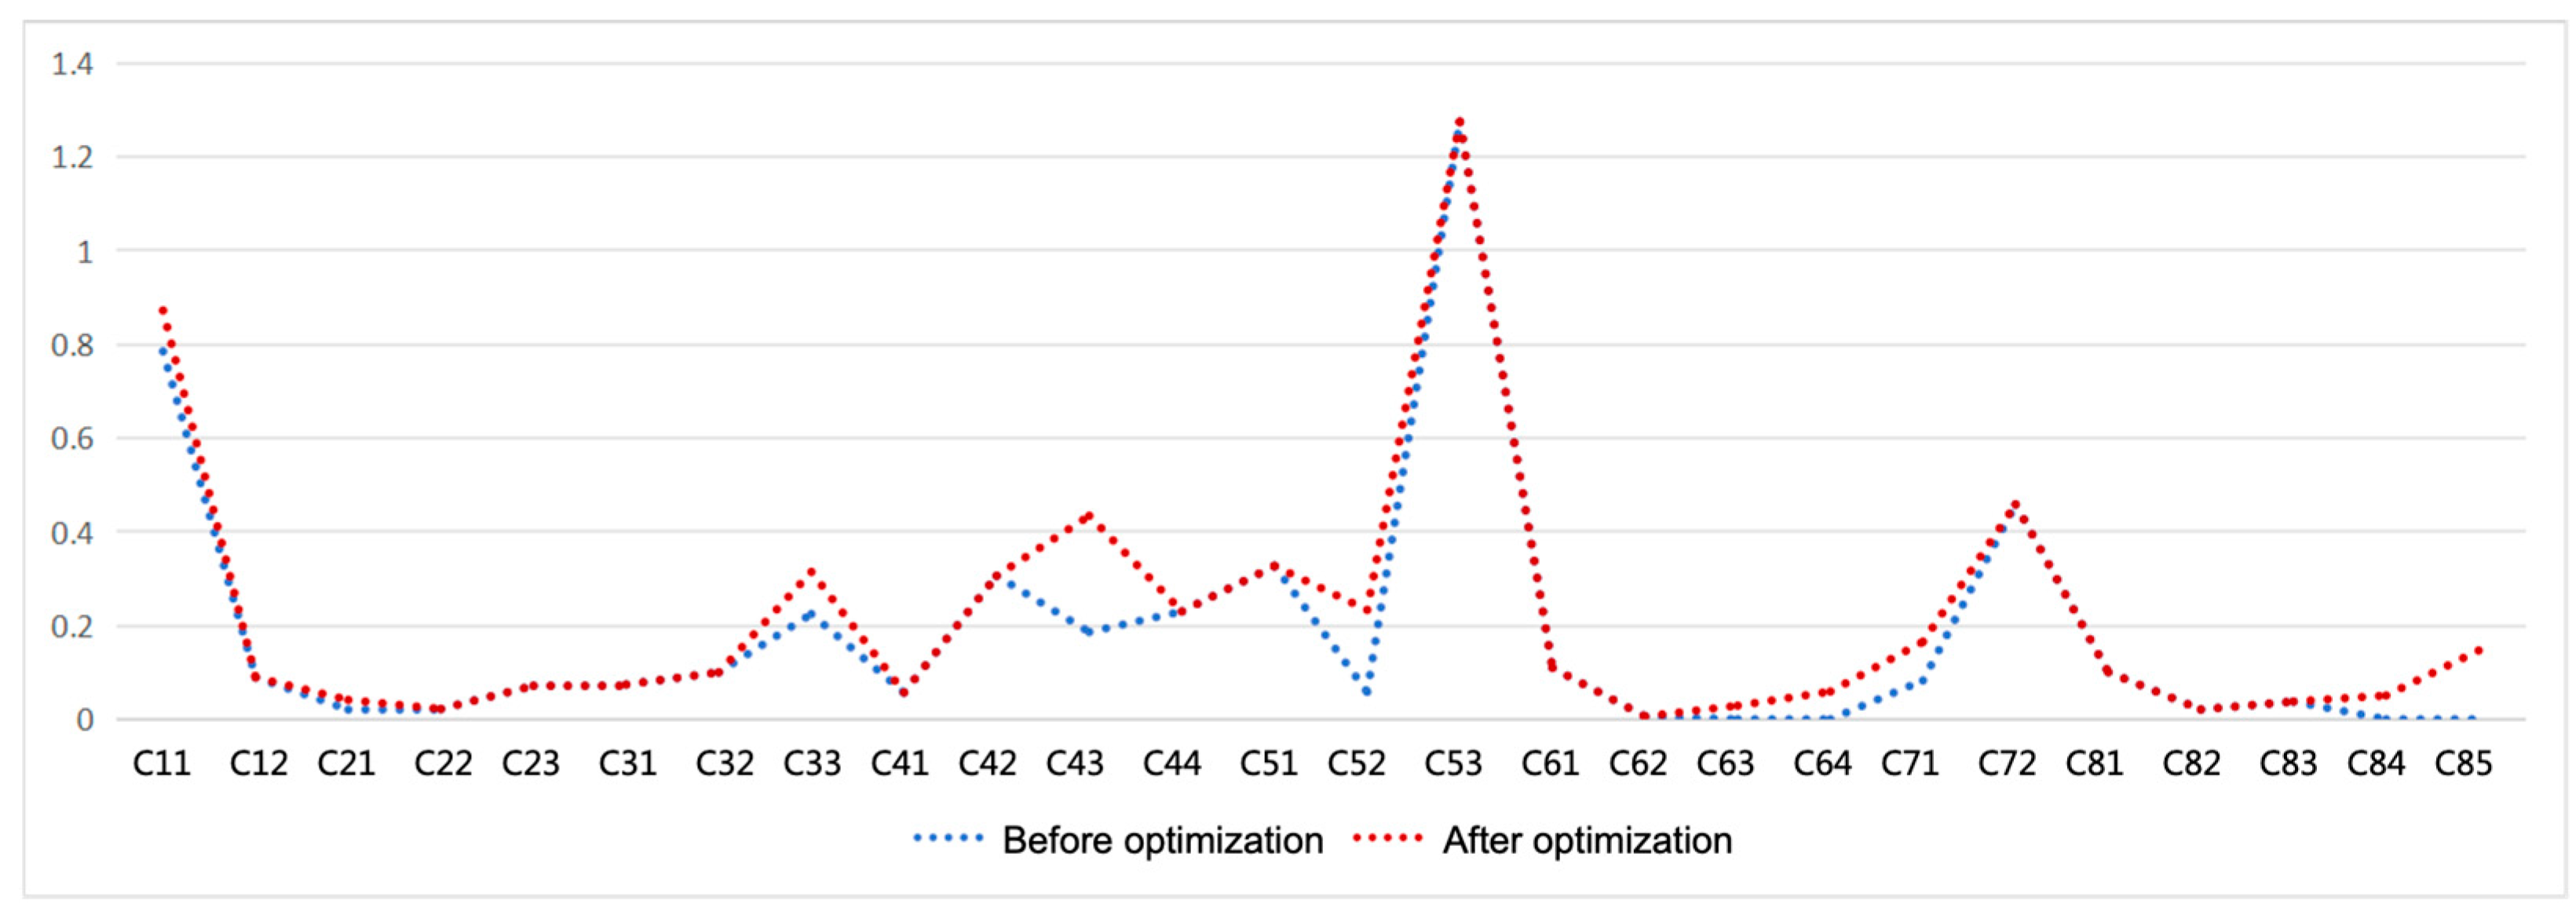
5.2. Simulation Verification

In this study, the core area for modeling covers approximately 25,000 m2 and is shaped like a rectangle. To increase the model’s accuracy and align it with real-world conditions, the model’s range was expanded to 250 × 260 m2 with a resolution of 4 m. Aerial images captured by drones were imported into the model as a reference to map buildings, surfaces, vegetation, and other elements. The ENVI-met software was used for the simulation, with a focus on four types of vertical grid resolutions and a maximum building height of 54 m. To ensure accurate results, the upper boundary height of the model was set to more than twice the height of the tallest building. Microclimate data were collected at a height of 1.5 m, and seven nested grids were configured for the simulation. For surface types, the model alternates soil and asphalt in a checkerboard pattern to reflect real-world conditions. Input parameters such as geographic data, meteorological information, and soil conditions were adjusted based on the actual geographic and climatic conditions of Qian’an City [20,21,22,48].
The improvement strategies were modeled and validated by using ENVI-met, Depthmap, SketchUp, and UE4 software. Simulations were conducted based on the specific locations for improvement within the community. Specifically, Depthmap was employed to analyze both the global and local integration values within the community, where warmer (red) colors indicated higher pedestrian flow density and cooler (blue) colors represented lower densities. Based on this spatial analysis, intervention points were strategically selected in red-colored, high-traffic segments to optimize microclimatic conditions and improve the overall utilization efficiency of outdoor spaces (Figure 11).
Key optimization measures included expanding core landscape areas within the community; conducting micro-renovations of specific spaces; and creating a more cohesive landscape system to enhance the environment in terms of wind, heat, light, sound, cleanliness, greening, and service facilities.
By comparing the simulation results before and after the improvements, the analysis showed that the post-optimization outdoor environmental comfort score was 5.62 points, reflecting an overall improvement of 21.3%. This outcome confirms the feasibility and effectiveness of the proposed strategies (Figure 12).

5.3. Applicability Analysis

The community outdoor environmental performance evaluation system and optimization strategies developed in this study—centered on subjective comfort—demonstrate notable generalizability and practical relevance. From a methodological perspective, the integrated evaluation framework, which combines the Analytic Hierarchy Process (AHP) with the Delphi method, allows for flexible adjustment of indicator weights and evaluation benchmarks in accordance with the specific environmental characteristics and resident needs of different regions. This decision-making logic is applicable to communities across a variety of climatic zones. For instance, in hot-summer and cold-winter regions such as Qian’an—the location of the case study—greater emphasis can be placed on thermal and wind environment indicators, whereas in hot and humid areas, ventilation and shading factors may be prioritized. The evaluation system incorporates eight major categories comprising 26 indicators (wind speed, green space ratio, and noise levels), which collectively capture the essential elements of the community’s outdoor environment. Benchmark values for these indicators are drawn from authoritative standards, including the Green Building Evaluation Standard and the Urban Residential District Planning and Design Standard, ensuring both the universality and normative legitimacy of the framework. In addition, the study employs internationally recognized simulation tools such as ENVI-met for microclimate modeling and SketchUp for solar exposure analysis. These tools can be locally adapted to reflect the specific architectural layouts and vegetation configurations of different communities, thereby enhancing the contextual relevance and accuracy of the simulation results.
In terms of practical value, Minhe Community, as a representative urban mixed-use residential area, faces common environmental challenges such as uneven wind distribution, insufficient thermal comfort, and limited vertical greening—issues that are widely present in similar communities across China. The optimization strategies proposed in this study, including layered vegetation to regulate wind flow, the use of shading devices and permeable pavement to improve thermal comfort, and the application of smart lighting and sound barriers to enhance the acoustic and lighting environments, are designed to be adaptable based on variations in community scale, construction era, and environmental constraints. For example, older communities may prioritize greening enhancements and lighting upgrades, while newly built communities could incorporate green stormwater infrastructure and sound environmental assessments during the planning phase. Moreover, the “evaluation–simulation–optimization” technical pathway established in this study provides a replicable implementation model for communities lacking professional technical support. Local administrative bodies can adopt this framework to rapidly identify environmental shortcomings and formulate scientifically grounded renovation strategies, thereby promoting the overall enhancement of outdoor environmental quality at the regional level.

5.4. Shortcomings

Due to the constraints of research methodology and data acquisition approaches, this study still faces certain limitations in evaluating and optimizing community outdoor environments based on subjective comfort.
On the one hand, the adaptability of the evaluation system to local contexts remains insufficient. Although the study establishes an evaluation framework comprising eight categories of indicators, the weighting of these indicators does not fully account for the climatic characteristics of Qian’an, a region experiencing hot summers and cold winters. For example, in winter, the dominant wind direction in Qian’an is from the northeast, and community building layouts have a pronounced impact on the local wind environment. However, the current weight assigned to the “wind pressure” indicator is only 0.0223, which may not accurately reflect its actual influence on residents’ comfort in this specific climatic setting. On the other hand, the evaluation framework lacks consideration for the dynamic nature of residents’ needs. While the study adopts “subjective comfort” as a central theme, it does not thoroughly investigate seasonal variations in behavioral patterns and psychological demands among residents. For instance, in the Minhe Community, elderly residents demonstrate a higher demand for sunlight exposure during winter, yet the weight assigned to “sunlight duration” in the light environment assessment is only 0.0185—only marginally lower than that for summer shading (0.0238)—failing to capture the seasonal shift in priorities. Furthermore, noise generated by collective activities such as square dancing becomes more prominent in summer, but the acoustic environment evaluation does not incorporate a dynamic analysis of the temporal and spatial distribution of such activities.
To address these limitations, future research can advance in two key directions. First, a regionally adaptive and dynamically adjustable evaluation model should be developed. This can be achieved by selecting three to five communities of different construction periods within Qian’an and conducting microclimatic monitoring over a 12-month period, with a focus on collecting localized data such as winter northeast wind speeds and the frequency of extreme summer heat events. A geographically weighted regression (GWR) model can then be introduced to adjust indicator weights seasonally, resulting in a dynamic and context-sensitive evaluation framework. Second, a long-term optimization path that integrates ecological and social needs should be explored. By employing social behavior research methods—such as Depthmap analysis to identify hotspots for square dancing—composite facilities combining sound barriers with vertical greening can be strategically implemented in noise-sensitive areas. Real-time noise monitoring can then be used to assess the long-term impacts of these interventions on residents’ activity patterns and psychological comfort.

6. Conclusions

This study addresses the enhancement of outdoor environmental comfort in urban communities situated within hot-summer, cold-winter climates, using the Minhe Community in Qian’an City as an empirical case. We developed a comprehensive research framework comprising four sequential phases—conceptual development, performance evaluation, simulation-based optimization, and practical validation—grounded in the dual imperatives of global urbanization and climate change. To overcome the limitations of prior single-factor approaches and the absence of adaptive strategies for such climates, we integrated 26 environmental variables across eight categories (including wind, thermal, and lighting parameters) and applied the Analytic Hierarchy Process (AHP) alongside Delphi expert consultation to derive indicator weights. This yielded a holistic evaluation model that captures both physiological and psychological dimensions of comfort.
Using ENVI-met microclimate modeling, SketchUp solar exposure analysis, and on-site surveys, we identified key deficiencies in Minhe Community: uneven wind distribution, insufficient thermal comfort, excessive noise levels, and a lack of green infrastructure. In response, we proposed and implemented targeted interventions, such as stratified vegetation layouts to regulate wind flow, permeable pavements and tree shade to mitigate heat stress, optimized nocturnal lighting systems, improved waste sorting facilities, a green stormwater infrastructure network, and an intelligent service platform. Post-intervention simulations demonstrated that the community’s overall comfort score rose from 4.64 to 5.62, representing a 21.3% improvement and empirically confirming the feasibility of our strategies.
The study’s contributions are threefold. First, it transcends the narrow focus on individual environmental factors by establishing a multi-dimensional, coupled evaluation framework for community outdoor spaces. Second, it innovatively merges AHP with ENVI-met simulation to form a fully quantifiable “evaluate–simulate–optimize” workflow, providing a rigorous methodological paradigm for environmental performance enhancement. Third, the proposed interventions—ranging from vegetation optimization to permeable paving—offer broadly applicable design guidelines for retrofitting communities in hot-summer, cold-winter regions, thus delivering a practical technical roadmap.
We also acknowledge certain limitations in the current evaluation system, notably its regional sensitivity and the dynamic nature of resident needs. For example, indicator weights did not fully account for Qian’an’s prevailing winter northeasterly winds, and seasonal variations in resident behavior patterns were not exhaustively analyzed. Looking ahead, future research should develop regionally adaptive, dynamic evaluation models that integrate ecological monitoring with social behavior analysis to explore enduring optimization mechanisms. On the implementation front, we advocate for embedding the evaluation indicators within local government community health assessment schemes, establishing dedicated technical support platforms, leveraging pilot projects and fiscal incentives to catalyze community upgrades, and formulating pertinent local standards or guidelines. Such measures will facilitate the sustainable application and large-scale dissemination of the framework, ultimately advancing a comprehensive transformation of community outdoor environments—one that equally addresses ecological functions and residents’ psychological well-being.

Author Contributions

Conceptualization, Y.R., Z.X. and J.S.; methodology, Z.X. and J.S.; software, Z.X. and H.L.; validation, B.Y., J.L. and S.G.; formal analysis, Z.X.; investigation, Z.X. and J.S.; resources, H.L.; data curation, B.Y. and J.L.; writing—original draft preparation, Z.X. and J.S.; writing—review and editing, J.L. and S.G.; visualization, Y.R., Z.X. and J.S.; supervision, H.L.; project administration, Y.R.; funding acquisition, Y.R. and J.S. All authors have read and agreed to the published version of the manuscript.

Funding

This research was funded by the Research Project of Humanities and Social Sciences of the Ministry of Education of China (Grant number: 24YJAZH115), National Key Research and Development Program of China (Grant number: 2023YFC3804803), GuangDong Basic and Applied Basic Research Foundation (Grant number: 2020A1515110768), and Doctoral Research Ability Enhancement Project in Beijing University of Civil Engineering and Architecture (Grant number: DG2024001).

Data Availability Statement

The data presented in this study are available upon request from the corresponding author due to safety regulatory requirements imposed by the relevant authorities.

Acknowledgments

We are very grateful to the comments provided by the three anonymous reviewers, as well as the Assistant Editor.

Conflicts of Interest

Author Zhuofan Xu is employed by the Heibei Institute of Architectural Design & Research Co., Ltd. The remaining authors declare that the research was conducted in the absence of any commercial or financial relationships that could be construed as a potential conflict of interest.

References

  1. Marx, K.H.; Engels, F. Die Deutsche Ideologie; People’s Publishing House: Beijing, China, 1960. [Google Scholar]
  2. Gu, T.; Li, D.; Zhu, S.; Wang, Y. Does sponge-style old community renewal lead to a satisfying life for residents? An investigation in Zhenjiang, China. Habitat Int. 2019, 90, 102004. [Google Scholar] [CrossRef]
  3. Peiffer-Smadja, O.; Torre, A. Retail decentralization and land use regulation policies in suburban and rural communities: The case of the Île-de-France region. Habitat Int. 2018, 72, 27–38. [Google Scholar] [CrossRef]
  4. Zhou, D.; Feng, D.; Feng, Z.; Liu, Y.; Xiao, S.L.; He, R.Z. Research progress of living environment comfort. Environ. Ecol. 2023, 8, 65–74+94. [Google Scholar]
  5. Mohammadzadeh, N.; Karimi, A.; Brown, R.D. The influence of outdoor thermal comfort on acoustic comfort of urban parks based on plant communities. Build. Environ. 2023, 228, 109884. [Google Scholar] [CrossRef]
  6. Cureau, R.J.; Pigliautile, I.; Pisello, A.L. A new wearable system for sensing outdoor environmental conditions for monitoring hyper-microclimate. Sensors 2022, 22, 502. [Google Scholar] [CrossRef] [PubMed]
  7. Liu, Y.X.; Feng, L.; Tian, H.; Yang, S.Q. Analysis of the spatial and temporal distribution characteristics of climate comfort in China. J. Geo-Inf. Sci. 2020, 22, 2338–2347. [Google Scholar]
  8. Tsai, K.T.; Lin, Y.H. Identification of urban park activity intensity at different thermal environments and visible sky by using sound levels. Int. J. Biometeorol. 2018, 62, 1987–1994. [Google Scholar] [CrossRef]
  9. Yan, C.Q.; Ma, Q.; Wang, M.H. Review of research in urban communities—Empirical research based on WHO recommended guidelines. Archit. J. 2023, 1, 6–13. [Google Scholar]
  10. Miller, D. The Comfort of Things; Polity: London, UK, 2008. [Google Scholar]
  11. Hu, X.; Li, B.F.; Chen, H. Review and evaluation framework of outdoor thermal comfort study. Build. Sci. 2020, 36, 53–61. [Google Scholar]
  12. Rocha, C.A.; Sousa, F.W.; Zanella, M.E.; Oliveira, A.G.; Nascimento, R.F.; Souza, O.V.; Cavalcante, R.M. Environmental quality assessment in areas used for physical activity and recreation in a city affected by intense urban expansion (Fortaleza-CE, Brazil): Implications for public health policy. Expo. Health 2017, 9, 169–182. [Google Scholar] [CrossRef]
  13. Sen, J.; Nag, P.K. Human susceptibility to outdoor hot environment. Sci. Total Environ. 2019, 649, 866–875. [Google Scholar] [CrossRef] [PubMed]
  14. Edwards, M.; Johns, D.G.; Leterme, S.C.; Svendsen, E.; Richardson, A.J. Regional climate change and harmful algal blooms in the northeast Atlantic. Limnol. Oceanogr. 2006, 51, 820–829. [Google Scholar] [CrossRef]
  15. Cao, Y.; Sun, Y.L.; Wu, M.X. Building Science. Acta Ecol. Sin. 2019, 39, 7567–7582. [Google Scholar]
  16. Takebayashi, H. Effects of air temperature, humidity, and wind velocity distribution on indoor cooling load and outdoor human thermal environment at urban scale. Energy Build. 2022, 257, 111792. [Google Scholar] [CrossRef]
  17. Wang, G.X.; Qian, L.; Chen, T.; Yang, X.N.; Xu, Z.X.; Zhu, W.P. Take the West Lake in Hangzhou as an example. Acta Ecol. Sin. 2015, 35, 2206–2216. [Google Scholar]
  18. Luo, Y.L.; Lv, S.; Yin, J.; Jia, Z.W.; Xu, W.G. Improvement method of outdoor microenvironment comfort based on responsive variable space. Archit. J. 2024, 2, 22–28. [Google Scholar]
  19. Zhang, Y.Y.; Xu, J.J. Simulation Study on Outdoor Thermal Environment and Comfort in Urban Residential Area. Energy Conserv. 2019, 38, 40–43. [Google Scholar]
  20. Zhang, Z.C.; Yang, D.; Lin, X.; Jia, Y.P. Simulation and evaluation of outdoor wind environment in a residential area in Qingdao city. City House 2021, 28, 89–92. [Google Scholar]
  21. Jiang, C.H.; Jia, F.Y.; Tang, W.; Wang, C.; Wang, X.Z. Simulation analysis of outdoor wind environment in a residential community in Guilin. Energy Conserv. 2020, 39, 30–33. [Google Scholar]
  22. Lan, H.F.; Cheng, B. Numerical simulation analysis of outdoor thermal environment improvement strategy of urban high-density communities in Mianyang. Green Build. 2020, 12, 48–51+54. [Google Scholar]
  23. Al-Atrash, F.Z.; Al-Ayyoub, A. Evaluating urban outdoor thermal comfort in Jabal Al Natheef Amman. Sustainability 2023, 15, 4092. [Google Scholar] [CrossRef]
  24. Peng, C.; Elwan, A. An outdoor-indoor coupled simulation framework for Climate Change–conscious Urban Neighborhood Design. Simulation 2014, 90, 874–891. [Google Scholar] [CrossRef]
  25. Lai, P.Y.; Koh, W.S.; Gopalan, H.; Liu, H.; Leong, D.; Tan, J. Outdoor environmental comfort evaluation for retail planning in a tropical business district using Integrated Environmental Modeller. PLoS ONE 2023, 18, e0282106. [Google Scholar] [CrossRef] [PubMed]
  26. Guo, L.L.; Tang, X.M. Research on walking comfort of community roads under the background of urban double repair—Take Caoyang New Village in Shanghai as an example. Chin. Landsc. Archit. 2020, 36, 70–75. [Google Scholar]
  27. Xue, S.H.; Ma, Y.; Wang, H. Analysis of multi-way regulation of outdoor comfort in cold areas—Take Zhengzhou as an example. J. Nanjing For. Univ. (Nat. Sci. Ed.) 2022, 46, 210–218. [Google Scholar]
  28. Yan, Y.C.; Yue, S.P.; Liu, X.H.; Wang, D.; Chen, H. Research progress in climate comfort evaluation at home and abroad. Adv. Earth Sci. 2013, 28, 1119–1125. [Google Scholar]
  29. Olgyay, V. Design with climate: Bioclimatic approach to architectural regionalism. J. Archit. Educ. 2015, 18, 157–166. [Google Scholar]
  30. GB/T50378-2019; Assessment Standard for Green Building. China Building Industry Press: Beijing, China, 2019.
  31. Gagge, A.P.; Fobelets, A.; Berglund, L.A. Standard predictive index of human response to the thermal environment. ASHRAE Transactions. 1986, 2, 709–731. [Google Scholar]
  32. GB/T 27963—2011; Climatic Suitability Evaluating on Human Settlement. Standards Press of China: Beijing, China, 2011.
  33. GB50180-2018; Urban Residential District Design Standard. China Building Industry Press: Beijing, China, 2018.
  34. GB/T 43992-2024; Specification for Construction Service Quality Evaluation of Urban Luminous Environment. Standards Press of China: Beijing, China, 2024.
  35. Housing Industrialization Promotion Center of the Ministry of Construction. Guidelines for Environmental Landscape Design in Residential Areas; China Building Industry Press: Beijing, China, 2009. [Google Scholar]
  36. HJ633—2012; Technical Regulation on Ambient Air Quality Index (on Trial). China Environmental Science Press: Beijing, China, 2012.
  37. GB3838-2002; Environmental Quality Standards for Surface Water. China Environmental Science Press: Beijing, China, 2002.
  38. GB3096-2008; Environmental Quality Standards for Noise. China Environmental Science Press: Beijing, China, 2008.
  39. Zhu, Y.M.; Tan, Y.; Ma, Z.L.; Liu, J. Establishment of the thermal comfort model of the outdoor environment. Build. Sci. 2007, 6, 1–3. [Google Scholar]
  40. Liao, Z.Q.; Xun, R.H.; Pei, X.Z.; Liu, G.B. Building Science. Low Temp. Archit. Technol. 2013, 7, 40–42. [Google Scholar]
  41. Gao, Y.F.; Yu, J.N.; Liu, L.; Chen, G.; Lin, G.G.; Chen, S.Q. Study on winter heat and comfort of campus public space in hot and humid areas. J. Guangdong Univ. Technol. 2021, 1, 39–45. [Google Scholar]
  42. Shi, Y.; Ren, C.; Wu, E.R. Improvement strategy of urban design based on outdoor wind environment and thermal comfort—Take Xidan Commercial Street in Beijing as an example. Urban Plan. Forum 2012, 5, 92–98. [Google Scholar]
  43. Du, T. Research on Environmental Comfort Measure and Environmental Protection Countermeasures in Beijing. Master’s Thesis, Beijing Forestry University, Beijing, China, 2006. [Google Scholar]
  44. Zhang, K.L.; Wu, T. Take the environmental transformation of Haikou Binhai New Village as an example. Archit. Cult. 2015, 7, 122–124. [Google Scholar]
  45. Xing, Y.M. Research on Outdoor Thermal Environment Evaluation and Reconstruction Strategy of Old Communities in Mild Areas. Master’s Thesis, Guizhou University, Guizhou, China, 2023. [Google Scholar]
  46. Lu, M.J. Discussion on the outdoor sound environment in the high-end residential community. Henan Build. Mater. 2008, 1, 22–23. [Google Scholar]
  47. Hu, X.Q.; Zhang, L.; Li, S.; Zhang, F.F. The fuzzy comprehensive evaluation method for the comfort level of residential light environment. J. Chongqing Univ. Technol. (Nat. Sci.) 2023, 27, 103–107. [Google Scholar]
  48. Sun, B.D.; Zahng, L.; Xun, A.; Pei, Y.; Ren, P.P.; Liu, S.Z. Comfort analysis of NADPI mathematical model for outdoor wind-heat environment. J. Yantai Univ. (Nat. Sci. Eng. Ed.) 2023, 36, 222–230. [Google Scholar]
Figure 1. Map of Minhe Community.
Buildings 15 02078 g001
Figure 2. AHP hierarchical analysis system hierarchy diagram.
Buildings 15 02078 g002
Figure 3. Evaluation index system construction flow chart.
Buildings 15 02078 g003
Figure 4. Scores for each criterion in the community evaluation layer.
Buildings 15 02078 g004
Figure 5. Coupling between expert scores and benchmark scores.
Buildings 15 02078 g005
Figure 6. Wind speed simulation at different times. (a) A visualization of Wind speed simulation at 08:00 a.m. (b) A visualization of Wind speed simulation at 10:00 a.m. (c) A visualization of Wind speed simulation at 12:00 p.m. (d) A visualization of Wind speed simulation at 14:00 p.m. (e) A visualization of Wind speed simulation at 16:00 p.m. (f) A visualization of Wind speed simulation at 18:00 p.m.
Buildings 15 02078 g006
Figure 7. Community garden plants. (a) Plants within the community. (b) Green spaces within the community.
Buildings 15 02078 g007
Figure 8. Community lighting at night. (a) Night lighting for community lanes. (b) Night Lighting for community ring road.
Buildings 15 02078 g008
Figure 9. Community sanitation. (a) Sanitation status of community public spaces. (b) Sanitation status of green space in front of community buildings.
Buildings 15 02078 g009
Figure 10. Community manholes. (a) Damaged manhole covers in community sidewalks. (b) Damaged manhole covers in the community roadways.
Buildings 15 02078 g010
Figure 11. Selection of improvement points for community outdoor space based on spatial syntax.
Buildings 15 02078 g011
Figure 12. Comparison between community evaluation indicators before and after optimization.
Buildings 15 02078 g012
Table 1. Summary table of evaluation indicators.
CategorySubcategorySpecific TypeFactors and Correlation Ranking
Community Outdoor Environmental ComfortEnvironmental IndicatorsWind ComfortWind Speed, Wind Pressure, Wind Direction
Thermal ComfortOutdoor Shading, Temperature, Humidity, Solar Radiation, Surface Temperature, Solar Energy
Light ComfortNatural Day-Night Lighting, UV Intensity, Hours of Sunshine, Light, Daylight Design, Quality of Electric Lighting, Dark Sky, and Light Pollution
Greening ComfortVegetation Coverage, Green Space Ratio, Landscape Plants, Trees, Public Green Space Facilities, Canopy Coverage, Negative Oxygen Ion Concentration, Plant Communities
Cleanliness ComfortAir Quality, Air Cleanliness, CO2, CO, Air Monitoring Facilities, Sky Impact Factor, Sky View Factor
Food Accessibility, Nutrition Education, Dining Areas
Environmental Hygiene, Pollution Cleanup, Waste Collection, Odor Control
Bacteria, Fine Particles
Water ComfortWater Quality, Drainage Facilities, Water Features, Green Stormwater Infrastructure, Drinking Water Facilities
Sound ComfortNoise Levels, Natural Sounds, Wall Sound Insulation, Audio Equipment, Sound Pressure
Material IndicatorsMaterial ComfortMaterial Types, VOC Limits, Use of Green and Non-toxic Materials
Mental Health IndicatorsPsychological ComfortMental Health Services, Education, Connection with Nature
Infrastructure IndicatorsPublic Service ComfortRoad Facility Maintenance Frequency, Recreation Square Area, Healthcare Services, Elderly Care Services, Sports Facilities, Physical Activity Opportunities, Activity Spaces, Self-monitoring, Smart Operations
Table 2. Performance evaluation system for outdoor environmental space in communities based on subjective comfort.
Overall GoalCriterion LevelIndicator LevelFactor DescriptionWeight
Improvement of Outdoor Environmental Comfort (A)Wind Comfort (B1)Wind Speed (C11)Indicates the speed of air movement within the community.0.0872
Wind Pressure (C12)Refers to the pressure exerted by wind within the community area.0.0223
Thermal Comfort (B2)Temperature (C21)Represents the thermal sensation of the community’s temperature.0.0103
Humidity (C22)Reflects the residents’ perceived comfort based on humidity levels.0.0110
Outdoor Shading (C23)Indicates shading facilities in public and activity spaces within the community.0.0238
Light Comfort (B3)Hours of Sunshine (C31)Refers to the cumulative sunlight hours on the winter solstice or coldest day.0.0185
UV Intensity (C32)Represents the intensity of solar radiation.0.0200
Night Lighting (C33)Reflects the quality of lighting conditions provided at night within the community.0.0449
Greening Comfort (B4)Green Space Ratio (C41)The proportion of the vertical projection area of green plants to the total land area.0.0190
Public Green Space (C42)Open green spaces accessible to residents.0.0510
Garden Plants (C43)Various plants used for landscaping and beautification within the community.0.0620
Negative Oxygen Ion Concentration (C44)The concentration of negative oxygen ions per unit volume of air.0.0460
Cleanliness Comfort (B5)Air Quality (C51)Concentration levels of pollutants and harmful substances in the air.0.0467
Environmental Hygiene (C52)Overall cleanliness of the environment.0.0583
Pollutant Collection (C53)Radius of garbage bins within the community.0.1416
Water Comfort (B6)Water Quality (C61)The quality and characteristics of water bodies within the community.0.0137
Drainage Facilities (C62)Infrastructure for rainwater, wastewater, and sewage management.0.0060
Landscape Water Bodies (C63)Water bodies designed for the beautification of the community.0.0145
Green Stormwater Infrastructure (C64)Proportion of green infrastructure for stormwater control within green spaces.0.0197
Sound Comfort (B7)Noise Levels (C71)Existing noise levels within the community (measured in dB).0.0413
Natural Sounds (C72)Sounds from nature, such as birdsong, rustling leaves, and flowing water.0.1146
Service Facility Comfort (B8)Road Maintenance Frequency (C81)Frequency of road maintenance and repairs within the community.0.0201
Recreation Square Area (C82)Public spaces for leisure, entertainment, and relaxation.0.0208
Healthcare Services (C83)Medical and health promotion services available within the community.0.0126
Elderly Care Services (C84)Activities and institutions providing care for the elderly within the community.0.0253
Smart Operations (C85)Intelligent management of infrastructure, services, and resources using advanced IT and IoT.0.0489
Table 3. Performance evaluation grade standard for the community outdoor environment based on subject comfort.
Evaluation LevelI (Excellent)II (Good)III (Average)IV (Below Average)V (Poor)Reference Standard
Evaluation Index{8,10}{6,8}{4,6}{2,4}{0,2}
Wind Speed<2 m/s<5 m/s<8 m/s<11 m/s>15 m/sGB/T 50378-2019 “Assessment Standard for Green Building” [30]
Wind PressureNo vortices, calmNo vortices, slight breezeSmall vortices, slight breezeMany vortices, fast windMany vortices, high wind speedGB/T 50378-2019 “Assessment Standard for Green Building” [30]
Temperature±24 °C20–24 °C, 24–28 °C16–20 °C, 28–32 °C10–16 °C, 32–35 °C<10 °C, >35 °CGagge’s Effective Temperature Standard [31]
Humidity<24%<20%<17%<14%<14%, >27.5%GB/T 27963-2011 “Climatic suitability evaluating on human settlement” [32]
Shading>35%30–35%25–30%20–25%<20%GB/T 50378-2019 “Assessment Standard for Green Building” [30]
Sunlight Hours>3 h2.5–3 h2–2.5 h1.5–2 h<1.5 hGB50180-2018 “Urban Residential District Design Standard” [33]
UV Index<22–44–66–9>10GB/T 27963-2011 “Climatic suitability evaluating on human settlement” [32]
Night Lighting7–88–99–1010–11>11GB/T 43992-2024 “Specification for construction service quality evaluation of urban luminous environment” [34]
Green Space Ratio>35%30–35%28–30%25–28%<25%GB50180-2018 “Urban Residential District Design Standard” [33]
Public Green Space>500 m2480–500 m2450–480 m2400–450 m2<400 m2Guidelines for Environmental Landscape Design in Residential Areas [35]
Garden Plant Layers5 layers4 layers3 layers2 layers1 layerGuidelines for Environmental Landscape Design in Residential Areas [35]
Negative Oxygen Ion Concentration≥1200 ions/cm31000–1200 ions/cm3500–1000 ions/cm3≥500 ions/cm3≤500 ions/cm3GB/T 27963-2011 “Climatic suitability evaluating on human settlement” [32]
Air Quality Index (AQI)0–5051–100101–150151–200>200HJ633—2012 “Technical Regulation on Ambient Air Quality Index (on trial)” [36]
Litter (pieces/1000 m2)≤44–66–88–10≥10Subjective Evaluation
Garbage Bin Radius50 m50–60 m60–70 m70–80 m≥80 mSubjective Evaluation
Water Quality CategoryI–IIIIIIVVBelow VGB3838-2002 “Environmental quality standards for surface water” [37]
Drainage Network Density1.77 km/km21.21–1.77 km/km20.869–1.21 km/km20.332–0.869 km/km2≤0.332 km/km2GB/T 27963-2011 “Climatic suitability evaluating on human settlement” [32]
Landscape Water Bodies6 types5 types4 types3 types≤2 typesGuidelines for Environmental Landscape Design in Residential Areas [35]
Green Stormwater Infrastructure≥50%40–50%30–40%20–30%≤10%GB/T 50378-2019 “Assessment Standard for Green Building” [30]
Noise Levels (dB)≤6060–6565–7070–75≥75GB 3096-2008 “Environmental quality standards for noise” [38]
Natural SoundsWater, vendors’ callsWind, rustling leavesLaughter, conversationVendors’ callsTraffic, construction soundsSubjective Evaluation
Road Maintenance FrequencyDailyWeeklyMonthlyQuarterlyAnnuallySubjective Evaluation
Recreation Square Area800 m2750 m2700 m2600 m2500 m2Subjective Evaluation
Healthcare Services5 levels4 levels3 levels2 levels≤1 levelGB50180-2018 “Urban Residential District Design Standard” [33]
Elderly Care Center Area750 m2650–750 m2550–650 m2450–550 m2≤350 m2GB50180-2018 “Urban Residential District Design Standard” [33]
Smart Operations>4 systems3–4 systems2–3 systems1–2 systems<1 systemGB/T 50378-2019 “Assessment Standard for Green Building” [30]
Table 4. Performance evaluation results for the outdoor environment in Minhe Community.
Goal
Level A
Criterion Level BCriterion WeightWeighted ScoreIndicator LevelExpert Weighted ScoreBaseline ScoreWeighted Score
A: Outdoor Environmental Comfort ImprovementB1: Wind Comfort0.10950.874C11: Wind Speed0.087290.7848
C12: Wind Pressure0.022340.0892
B2: Thermal Comfort0.04510.114C21: Temperature0.010320.0206
C22: Humidity0.011020.022
C23: Outdoor Shading0.023830.0714
B3: Light Comfort0.08340.3985C31: Hours of Sunshine0.018520.074
C32: UV Intensity0.020070.1
C33: Night Lighting0.044950.2245
B4: Greening Comfort0.17800.779C41: Green Space Ratio0.019030.057
C42: Public Green Space0.051060.306
C43: Garden Plants0.062030.186
C44: Negative Oxygen Ion Concentration0.046050.23
B5: Cleanliness Comfort0.24661.659C51: Air Quality0.046770.3269
C52: Environmental Hygiene0.058310.0583
C53: Pollutant Collection0.141691.2744
B6: Water Comfort0.05390.1156C61: Water Quality0.013780.1096
C62: Drainage Facilities0.006010.006
C63: Landscape Water Bodies0.014500
C64: Green Stormwater Infrastructure0.019700
B7: Sound Comfort0.15600.7062C71: Noise Levels0.041320.0826
C72: Natural Sounds0.114640.4584
B8: Service Facility Comfort0.12760.1591C81: Road Maintenance Frequency0.020150.1005
C82: Recreation Square Area0.020810.0208
C83: Healthcare Services0.012630.0378
C84: Elderly Care Services0.025300
C85: Smart Operations0.048900
Disclaimer/Publisher’s Note: The statements, opinions and data contained in all publications are solely those of the individual author(s) and contributor(s) and not of MDPI and/or the editor(s). MDPI and/or the editor(s) disclaim responsibility for any injury to people or property resulting from any ideas, methods, instructions or products referred to in the content.

