Article

Study on Vertical Propagation of Power Parameters in RC Frame Under Internal Explosion

1
Institute of Systems of Engineering, China Academy of Engineering Physics, Mianyang 621900, China
2
China Norinco Group Testing and Research Institute, Xi’an 710089, China
3
School of Marxism, Tianshui Normal University, Tianshui 741001, China
*
Author to whom correspondence should be addressed.
Buildings 2025, 15(12), 2080; https://doi.org/10.3390/buildings15122080
Submission received: 14 May 2025 / Revised: 8 June 2025 / Accepted: 10 June 2025 / Published: 17 June 2025

Abstract

:
The roof slab, as a critical component for partitioning the vertical space within RC frame structures, can effectively mitigate the propagation of shock waves and reduce damage levels in adjacent rooms. This study employed finite element (FE) modeling to investigate the vertical propagation of blast waves and roof ejection velocity in RC frames. The model’s reliability was verified by reconstructing internal explosion tests on RC frames and close-in explosion tests on masonry walls. On this basis, two typical single-room RC frame structures that are vertically adjacent were designed, and numerical simulations of the internal explosion were conducted under four explosive equivalents and four venting coefficients. The propagation of shock waves, load characteristics in the vertically adjacent room, and the dynamic response of roof slabs were examined. The results show that shock waves propagated to the vertically adjacent room decreased by approximately two orders of magnitude for peak overpressure and one order of magnitude for impulse due to the obstruction of shock waves by roof slabs, respectively, compared to the source explosion room. For larger venting coefficients, abundant energy was released through the venting openings, making it difficult to form a quasi-static pressure with a long duration inside the source explosion room. In addition to the shock wave, the explosive ejection of roof slabs in the explosion source room will further exacerbate the damage to the vertically adjacent room. Peak overpressure and impulse propagated to the vertically adjacent room were reduced significantly by the increase in the venting coefficient, resulting in an attenuation of structural damage. Finally, empirical models incorporating the venting coefficient were established to characterize the attenuation coefficients of power parameters, demonstrating the predictive capability for peak overpressure, impulse, and roof ejection velocity in both the explosion source room and the vertically adjacent room.

1. Introduction

Reinforced concrete (RC) framework structures are widely used due to their high load-bearing capacity, good seismic performance, convenient construction, and cost-effectiveness [1,2]. They have become the main carriers for fixed-point defense, command and communication centers, and a large number of political and economic activities. However, the frequent occurrence of terrorist attacks and public safety incidents, compounded by increasingly complex international situations, has rendered RC frame structures progressively critical as both protective assets and potential targets [3,4,5]. For instance, in 2023, Russian forces employed hypersonic missiles to strike a Ukrainian command center, causing extensive damage to the building [5]. Therefore, a thorough investigation of damage on RC frame structures subjected to a large equivalent explosion can optimize pre-engagement weapon deployment and enable rapid post-blast damage assessment. Also, the findings can guide protective design for critical infrastructure.
Under internal explosion, the attenuation of blast load propagated to adjacent rooms is significant due to the reduction in explosion shock waves by infill walls and roof slabs, as well as the energy dissipation from the damage to structural components. The attenuation magnitude is dependent on both structural and explosive parameters [6,7]. It is evident that the propagation of shock waves in RC frame structures is extremely complex. In recent years, numerous scholars have conducted abundant research on the load characteristics of internal explosions in RC-box structures [8,9,10], while relatively few studies have focused on the load characteristics in adjacent rooms. Santos et al. [11] conducted a series of internal explosion tests on full-scale RC structures and found that the damage to the adjacent room was significantly lower than that of the explosion source room due to the attenuation of blast loads by infill walls. Liu et al. [12] performed internal explosion tests on a two-span full-scale RC frame structure under two explosion equivalents and found that the overpressure of shock waves propagated to the adjacent room was greatly attenuated, with an increased duration. Guo et al. [13] carried out internal explosion tests on a 1/3 scale RC structure with openings, analyzing the cumulative damage of the shear wall under blast loads, but did not further investigate the damage to adjacent rooms. Li et al. [14] experimentally studied the failure modes of multi-box structures under internal explosion, revealing a “cross-shaped” damage distribution. Hu, Khan, and Cai [15,16,17] investigated the attenuation effects of different building materials on shock waves, providing a theoretical basis for the design of blast-resistant structures. Kong, Chen, and Eslami [18,19,20] conducted experimental studies on internal explosions in confined spaces with water mist, demonstrating that water mist can significantly reduce shock wave load. Similarly, Rose, Michaloudis, and Hájek [21,22,23] examined the blast-resistant performance of various walls, finding that such walls can effectively mitigate damage to protective structures.
As a critical vertical space partition in RC frame structures, the roof slab has a large load-bearing area but relatively weak blast resistance, making it susceptible to damage under internal explosion. This damage may cause secondary injuries to occupants and equipment, while further expanding the destruction range [24,25,26]. Therefore, besides shock wave load, the power parameters propagated to vertically adjacent rooms should account for the impact damage caused by the ejection of roof slabs from the explosion source room. Under large-scale internal explosions, RC frame structures are prone to damage that may destroy sensors, complicating the velocity measurements of roof slabs [27]. As a result, researchers have primarily focused on the dynamic behavior of roof slabs under small-scale internal explosions. Kim et al. [28] analyzed damage to a typical RC apartment under internal explosions (2 kg and 3 kg TNT), demonstrating that FE models incorporating post-detonation combustion could accurately predict the dynamic behavior of roof slabs. Lopez et al. [29] performed explosion tests and simulations on a two-span full-scale RC frame structure using two TNT equivalents. At 20 kg TNT, the floor slab failed in punching shear, while the adjacent slab sustained only minor damage. Park et al. [30] carried out internal explosion tests on two deeply buried RC-box structures, showing that larger venting areas and high-strength concrete could effectively reduce the damage to roof slabs under equivalent TNT. GAO et al. [31] performed internal explosion tests on a three-story RC frame structure with varying TNT equivalents and detonation positions, investigating its dynamic response, failure modes, and progressive collapse mechanisms.
However, their analysis did not focus on the dynamic behavior of roof slabs. Yang, Zhou, and Zhao [32,33,34] employed machine learning to predict the dynamic response of RC slabs under blast loading. The results demonstrated that the machine learning-based prediction approach can accurately forecast the maximum displacement and failure modes of RC slabs. Sagaseta, Gao, and Yao [35,36,37] conducted a series of field blast tests on RC slabs, revealing that under far-range explosions, the slabs exhibited flexural failure, whereas under close-range explosions, they were more prone to punching shear failure. Lukić, Maazoun, and Liao [38,39,40] proposed applying protective coatings on RC slab surfaces to enhance blast resistance. Their findings indicated that fiberglass and polyurea coatings significantly improved the blast resistance of RC slabs.
Additionally, studies have examined how the venting area affects internal explosion loads [41,42,43]. Results indicate that the attenuation of quasi-static pressure is strongly influenced by the venting area. A smaller venting area leads to slower pressure decay and more severe structural damage. Weibull [44] studied the influence of vent shapes on quasi-static pressure in confined spaces, concluding that it depends solely on the ratio of charge mass (M) to the container volume (V). When the venting coefficient S/V2/3 ≤ 0.0125, the attenuation of overpressure becomes negligible. Li et al. [45] investigated the effect of venting coefficients on the dynamic behavior of RC-box structures, finding that increasing the venting coefficient from 0.457 to 1.220 reduced the maximum displacement at the wall center by over 50%. Park et al. [30] simulated internal explosions in RC structures by LS-DYNA under three venting conditions (fully enclosed, partially enclosed, and fully ventilated). Results showed the smallest displacement occurred under fully ventilated conditions, which is only about 1% of that in the fully enclosed case. Tascon, Qing, and Song [46,47,48] conducted experimental studies on internal explosions under different venting coefficients. The results indicated that while the venting coefficient had minimal influence on the first peak overpressure, it effectively eliminated subsequent peak overpressures. Chen et al. [49] investigated the effect of vent opening geometry on internal blast loading, demonstrating that under identical venting coefficients, the shape of vent openings has a negligible influence on the blast loads.
Generally, the existing studies still have the following main limitations: (i) the propagation of shock waves and the load characteristics between vertically adjacent rooms under internal explosion, especially the attenuation of shock waves by the roof slabs, require further investigation; (ii) besides the shock wave load propagated to vertically adjacent rooms, the explosive ejection of roof slabs from the source room further expand the destruction range, but research in this area remains limited; (iii) under large-scale internal explosions, the influence of venting coefficient on the power parameters in the explosion source room and vertically adjacent room remains qualitative and lacks quantitative characterization.
To address the above limitations, refined numerical studies on the internal explosion loads and dynamic behaviors of RC frame buildings were conducted. First, the reliability of the adopted FE modeling approach was validated through comparison with existing test data from internal explosions on RC structures and close-in explosions on masonry walls, including material models and parameters, modeling techniques, and fluid–structure interaction algorithms. Subsequently, numerical simulations of internal explosions were conducted for two vertically adjacent single-room RC frames, considering four TNT equivalents and four venting coefficients. The propagation of shock waves and load characteristics in the vertically adjacent room is comparatively analyzed under varying venting coefficients, as well as the failure models and dynamic response of the roof slab. Finally, empirical models incorporating the venting coefficient were established to calculate the attenuation coefficients of power parameters (i.e., overpressure, impulse, and roof ejection velocity), enabling rapid assessment of vertical damage in RC frames under internal explosions.

2. FE Modeling Approach

This section conducts numerical analysis of the internal explosion tests on partially enclosed RC structures and the close-in explosion tests on masonry walls [28,50]. The reliability of the FE modeling approach is verified by comparing the simulated and experimental results.

2.1. Internal Explosion Tests on Partially Enclosed RC Structures

(a)
test description and FE model
As shown in Figure 1, Kim et al. [28] conducted internal explosion tests on a scaled RC structure with an internal space dimension of 2000 mm × 2000 mm × 2000 mm. The thickness of the walls and slabs is 160 mm, and the dimensions of the door and window openings are 600 mm × 1500 mm and 600 mm × 500 mm, respectively. Each component is reinforced with two-way double layers of Φ14@150 rebars, and the concrete grade is C30. 2 kg and 3 kg of spherical TNT were selected as the explosives for the experiments, and the explosive was placed in the center of the room. Figure 1b shows the locations of reflected pressure sensors and displacement sensors. Among them, P1 and DP1 were located at the roof slab center, with P2 at the wall corner and DP2 at the wall center.
The FE models of the test are shown in Figure 1b,c. To improve computational efficiency, the application of the blast load was achieved through the 2D-3D MAPPING method in conjunction with the Arbitrary Lagrangian-Eulerian (ALE) algorithm. Specifically, the calculation of the 2D FE model is terminated before the shock waves arrive at the structure’s internal surface, with a MAPPING file output containing displacement, velocity, and pressure at that instant. This file serves as the initial condition for the 3D FE model calculation. The concrete is modeled with Lagrange elements, the rebar is modeled with Beam elements, and the air and explosives are modeled with Arbitrary Lagrangian-Eulerian (ALE) elements. The mesh sizes for air and explosives are determined based on the equivalent explosive mesh density, as shown in Table 1 [45]. In the 3D FE model, for fluid–structure coupling, the air mesh size must match the mesh size of the RC structure. The explosive is filled with the keyword *INITIAL_VOLUME_FRACTION_GEOMETRY, while fluid-solid coupling between the explosive and RC structure is achieved via the keyword *CONSTRAINED_LAGRANGE_IN_SOLID. A non-reflecting boundary is applied to the air domain via the keyword *BOUNDARY_NON_REFLECTING. Note that the 2D-3D MAPPING method ensures adequate explosive mesh density for small TNT equivalents. For large TNT equivalents, the 3D FE model can meet the equivalent explosive mesh density, thus making the 2D-3D MAPPING method unnecessary.
(b)
material model and parameters
The concrete is simulated by the K&C (*MAT_CONCRETE_DAMAGE_REL3) material model. This model accounts for both damage and strain rate effects, enabling accurate prediction of the dynamic response of concrete under high-strain-rate and large-deformation conditions. Concrete strength under different stress states is characterized as follows:
Δ σ f = ζ Δ σ m + 1 ζ Δ σ y ,   λ λ m
Δ σ f = ζ Δ σ m + 1 ζ Δ σ r ,   λ λ m
where Δ σ f is an effective stress deviator under different stress states; Δ σ m , Δ σ y , and Δ σ r are initial yield strength, ultimate strength, and residual strength; λ is a damage variable; λ m is the damage threshold; ζ is a function of λ .
*MAT_PLASTIC_KINMATIC and CS (Cowper–Symonds) are used to describe the material model and strain rate effect of the rebar, respectively. The constitutive equation and corresponding dynamic amplification coefficient are as follows:
σ y = σ 0 + E p ε eff , p
σ dy = 1 + ε ˙ / C 1 / P
where σ y and σ dy are static and dynamic yield strength, respectively; σ 0 is the initial yield strength; E p is the plastic hardening modulus; ε eff , p is effective plastic strain; ε ˙ is the strain rate of reinforcement; C and P are strain rate parameters.
The propagation of blast waves and their interaction with structures are realized via ALE algorithms coupled with FSI (Fluid–Structure Interaction) methods. The detonation process of TNT explosives and the compression behavior of detonation products are described by the keyword *MAT_HIGH_ENERGY_BURN material model and the *EOS_JWL equation of state, expressed as:
P e = A [ 1 ω R 1 V e ] e R 1 V e + B [ 1 ω R 2 V e ] e R 2 V e + ω E V e
where A, B, R1, R2, and ω are the material parameters determined by experiments; E is the initial unit volume energy; Ve is the relative volume.
Air is regarded as a non-viscous ideal gas with the *MAT_NULL material model, and the equation of state is described by the keyword *EOS_LINEAR_POLYNOMIAL.
P e = A [ 1 ω R 1 V e ] e R 1 V e + B [ 1 ω R 2 V e ] e R 2 V e + ω E V e
where C0C6 are parameters of the polynomial state equation; E0 is the initial volume energy; μ = 1/(Va − 1); Va is the relative volume. Table 2 shows the model parameters.
(c)
result comparison
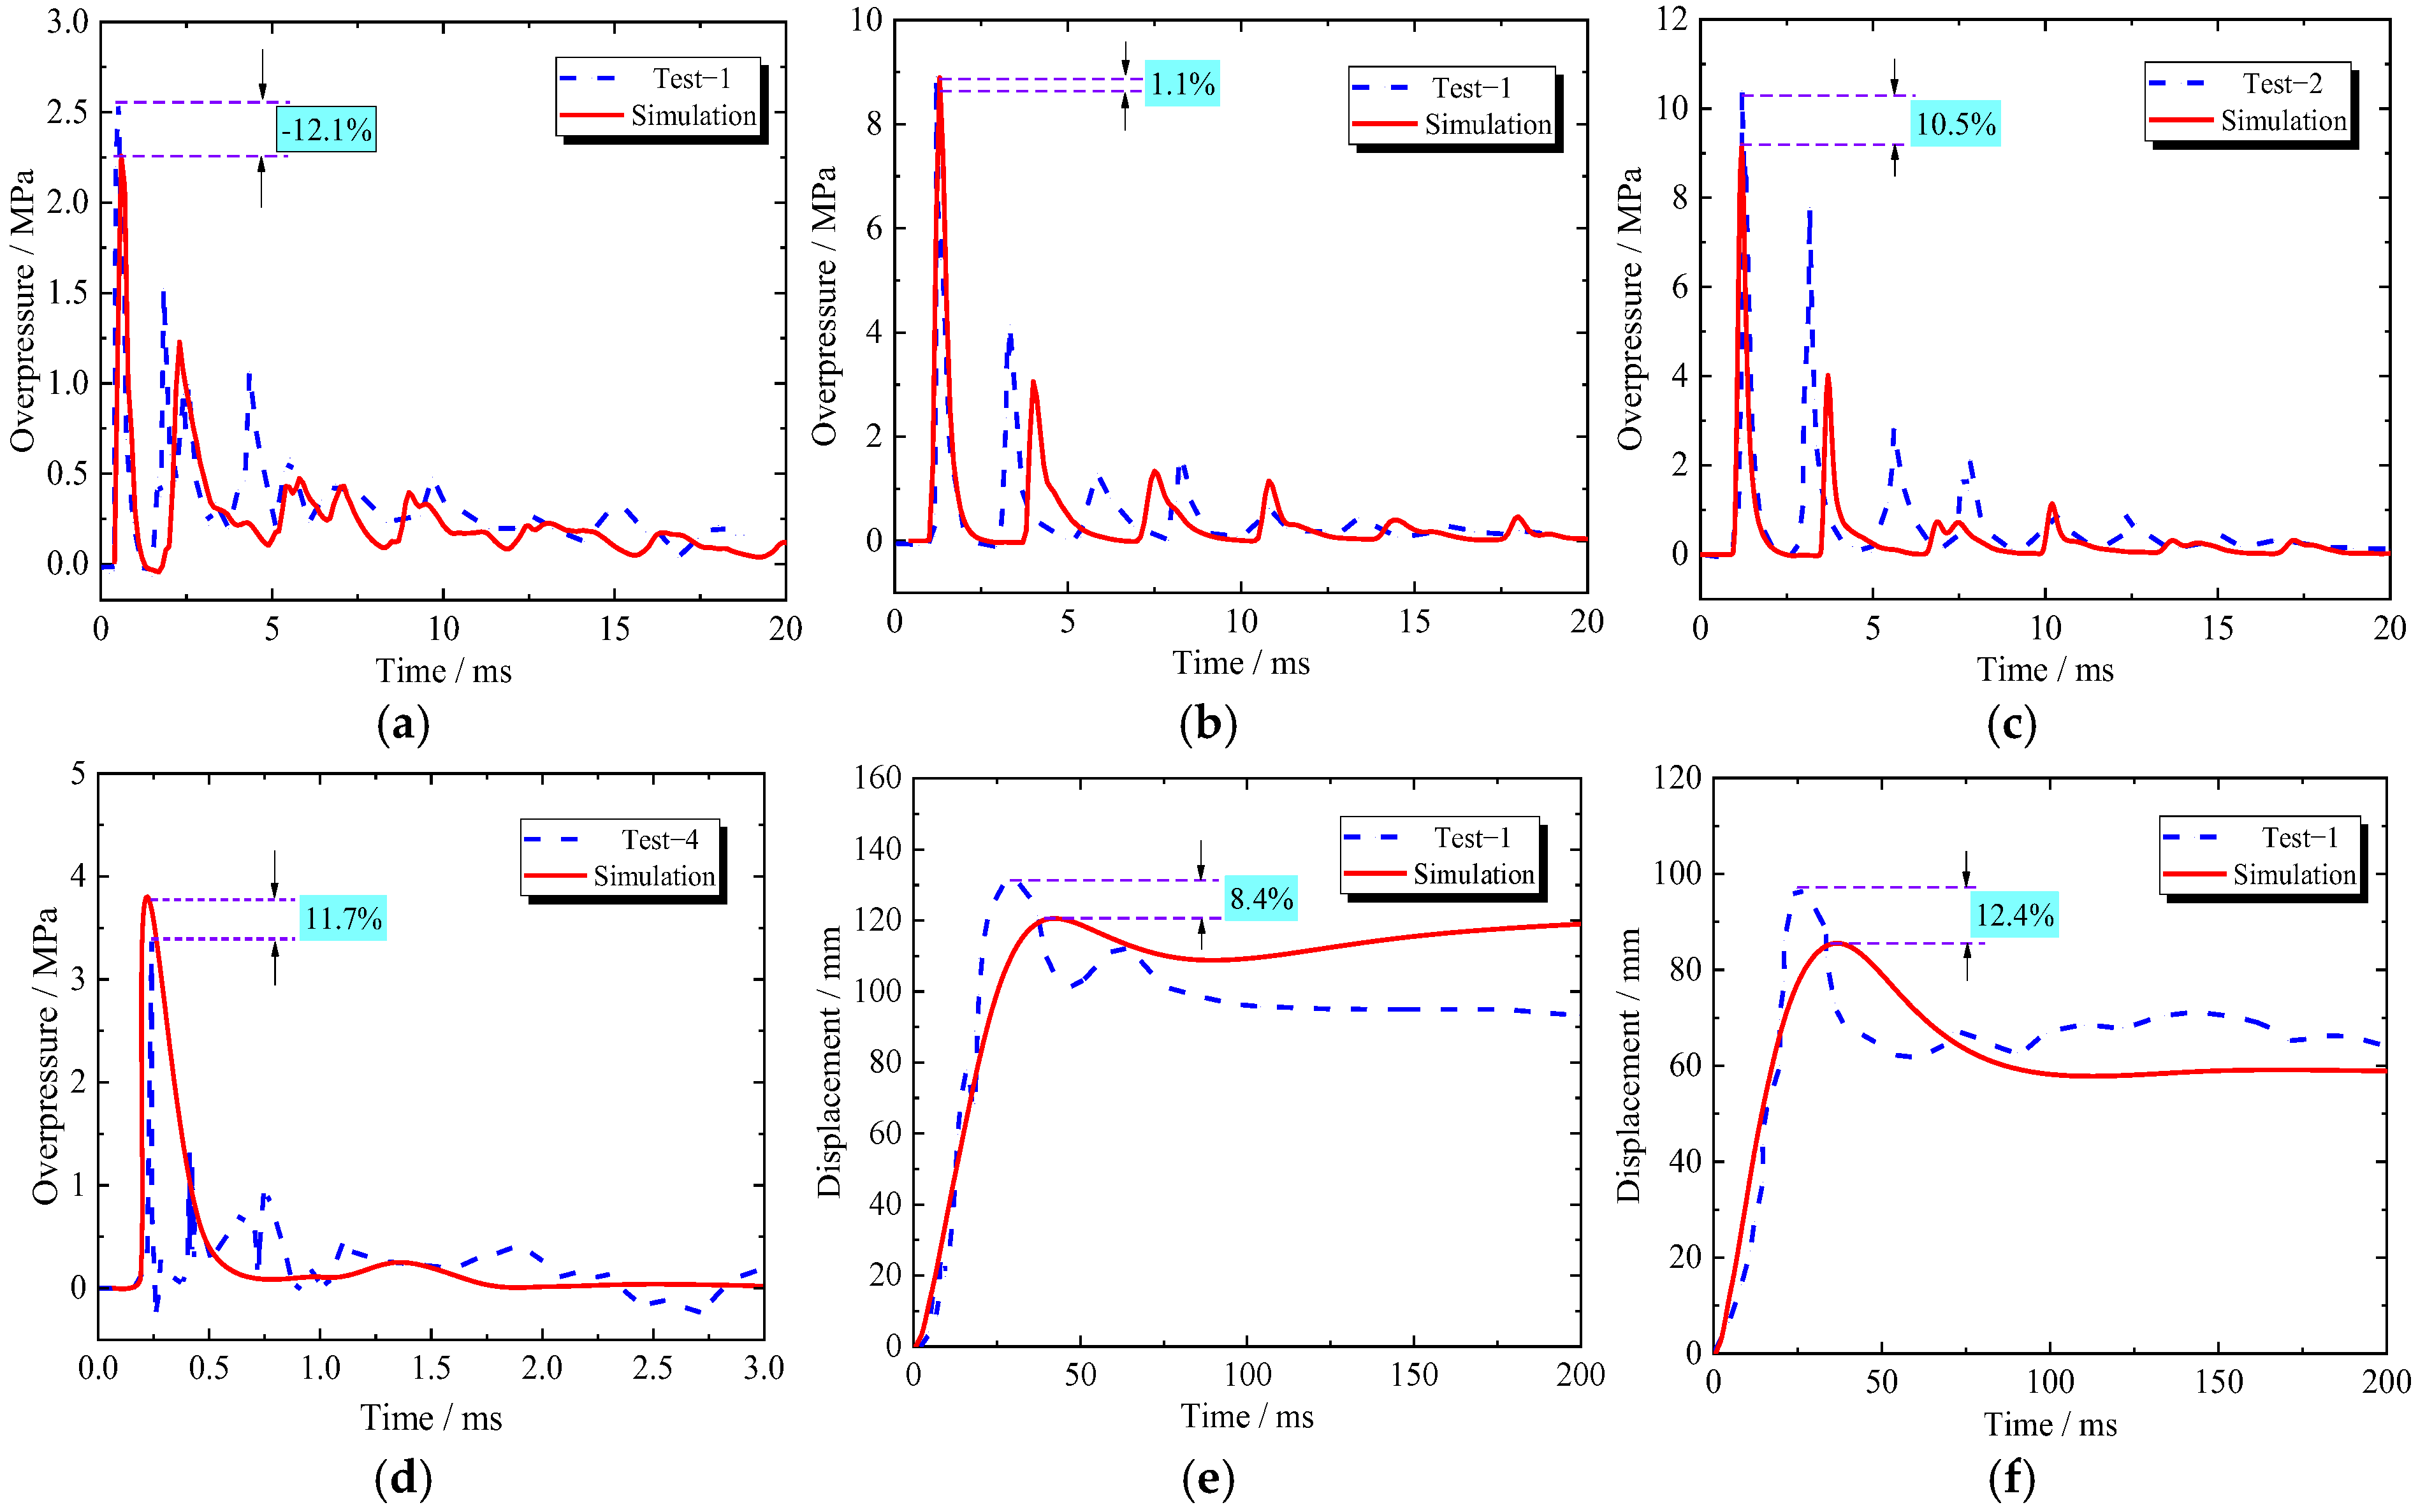
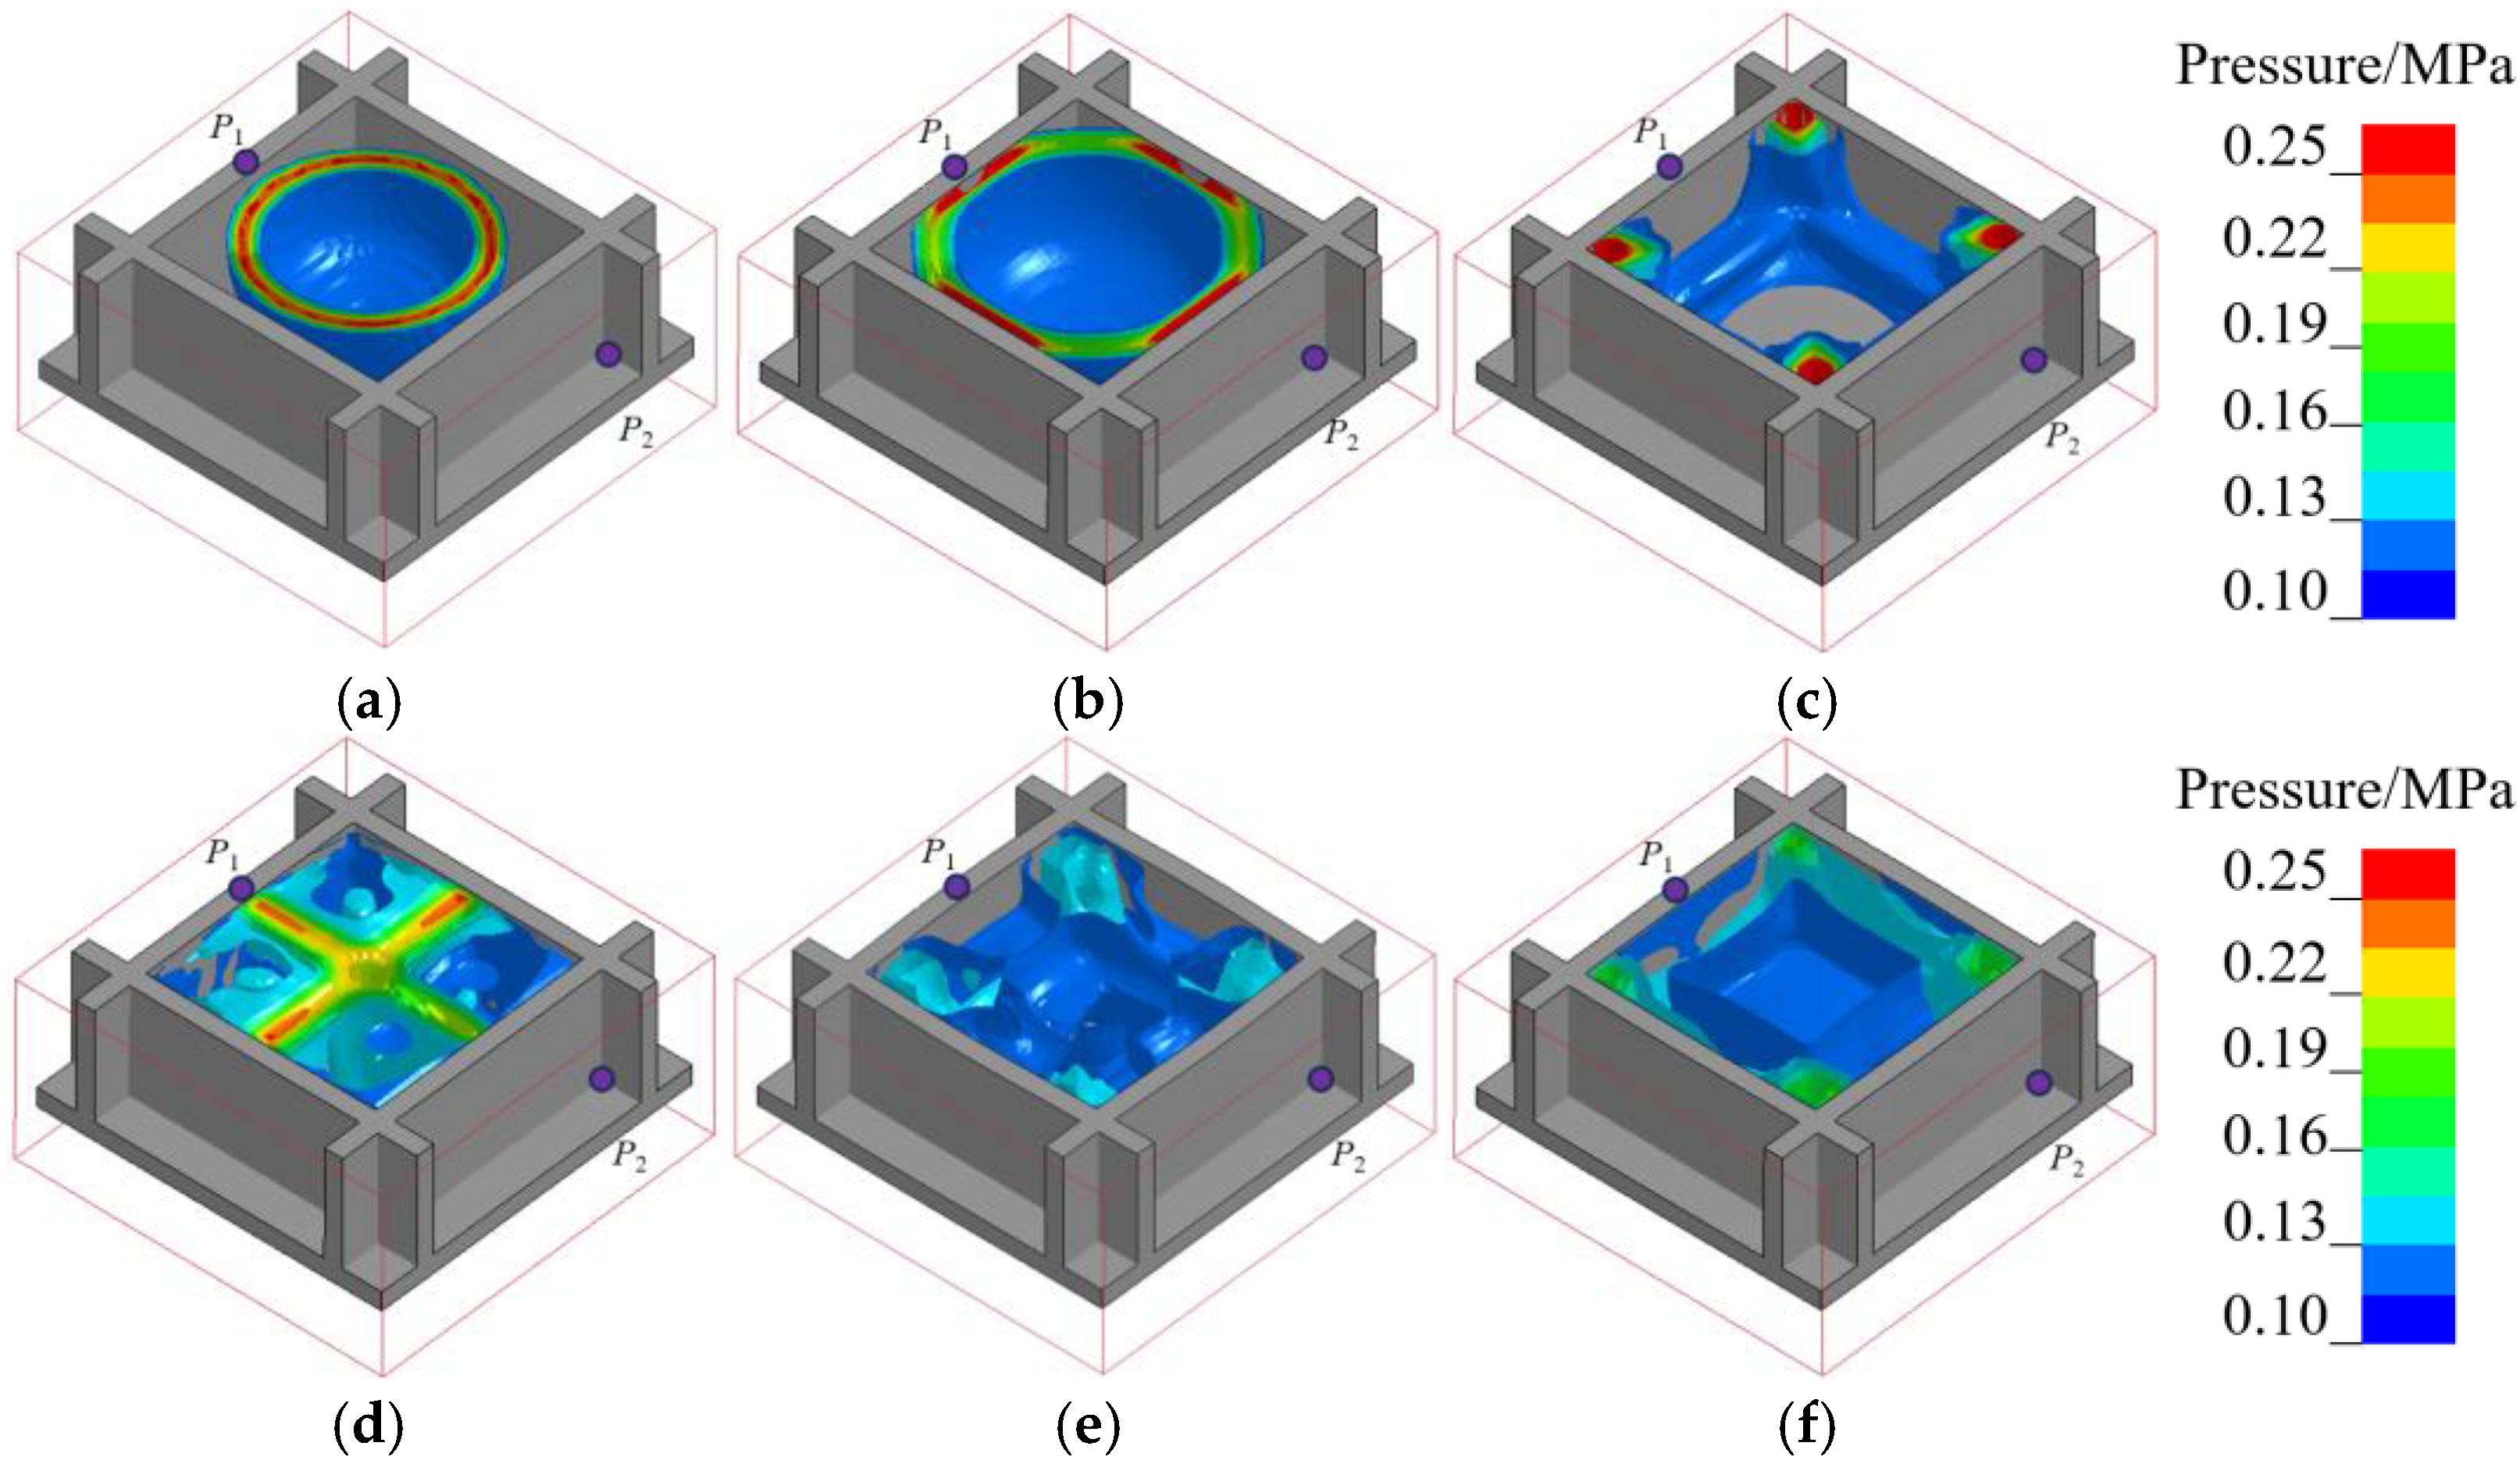
Figure 2 compares overpressure-time histories at different measurement points for both TNT equivalents. The results demonstrate that the internal explosion load exhibits distinct multi-peak characteristics, with the simulated overpressure-time histories showing good agreement with the experimental curves in terms of both trend and magnitude. The relative errors in peak overpressure are within 15%. Furthermore, the propagation of shock waves was analyzed by the measurement points P1 and P2 in Test-1. Figure 3 shows the dynamic pressure distribution inside the RC structure. At T = 0.6 ms, the shock wave arrived at the center of the inner wall, causing the overpressure-time history curve at P1 to reach its first peak; At T = 1.2 ms, the pressure at the corner of the inner wall rose sharply due to the reflection and superposition of shock waves, and the overpressure-time history curve at P2 reaches its first peak; At T = 2 ms, the reflected waves converged at the center of the RC room and then continue to reflect towards the surrounding walls, causing the overpressure-time history curve at P1 to reach its second peak. At T = 4 ms, the reflected shock waves propagated toward the corner of the inner wall, and P2 reached its second peak.
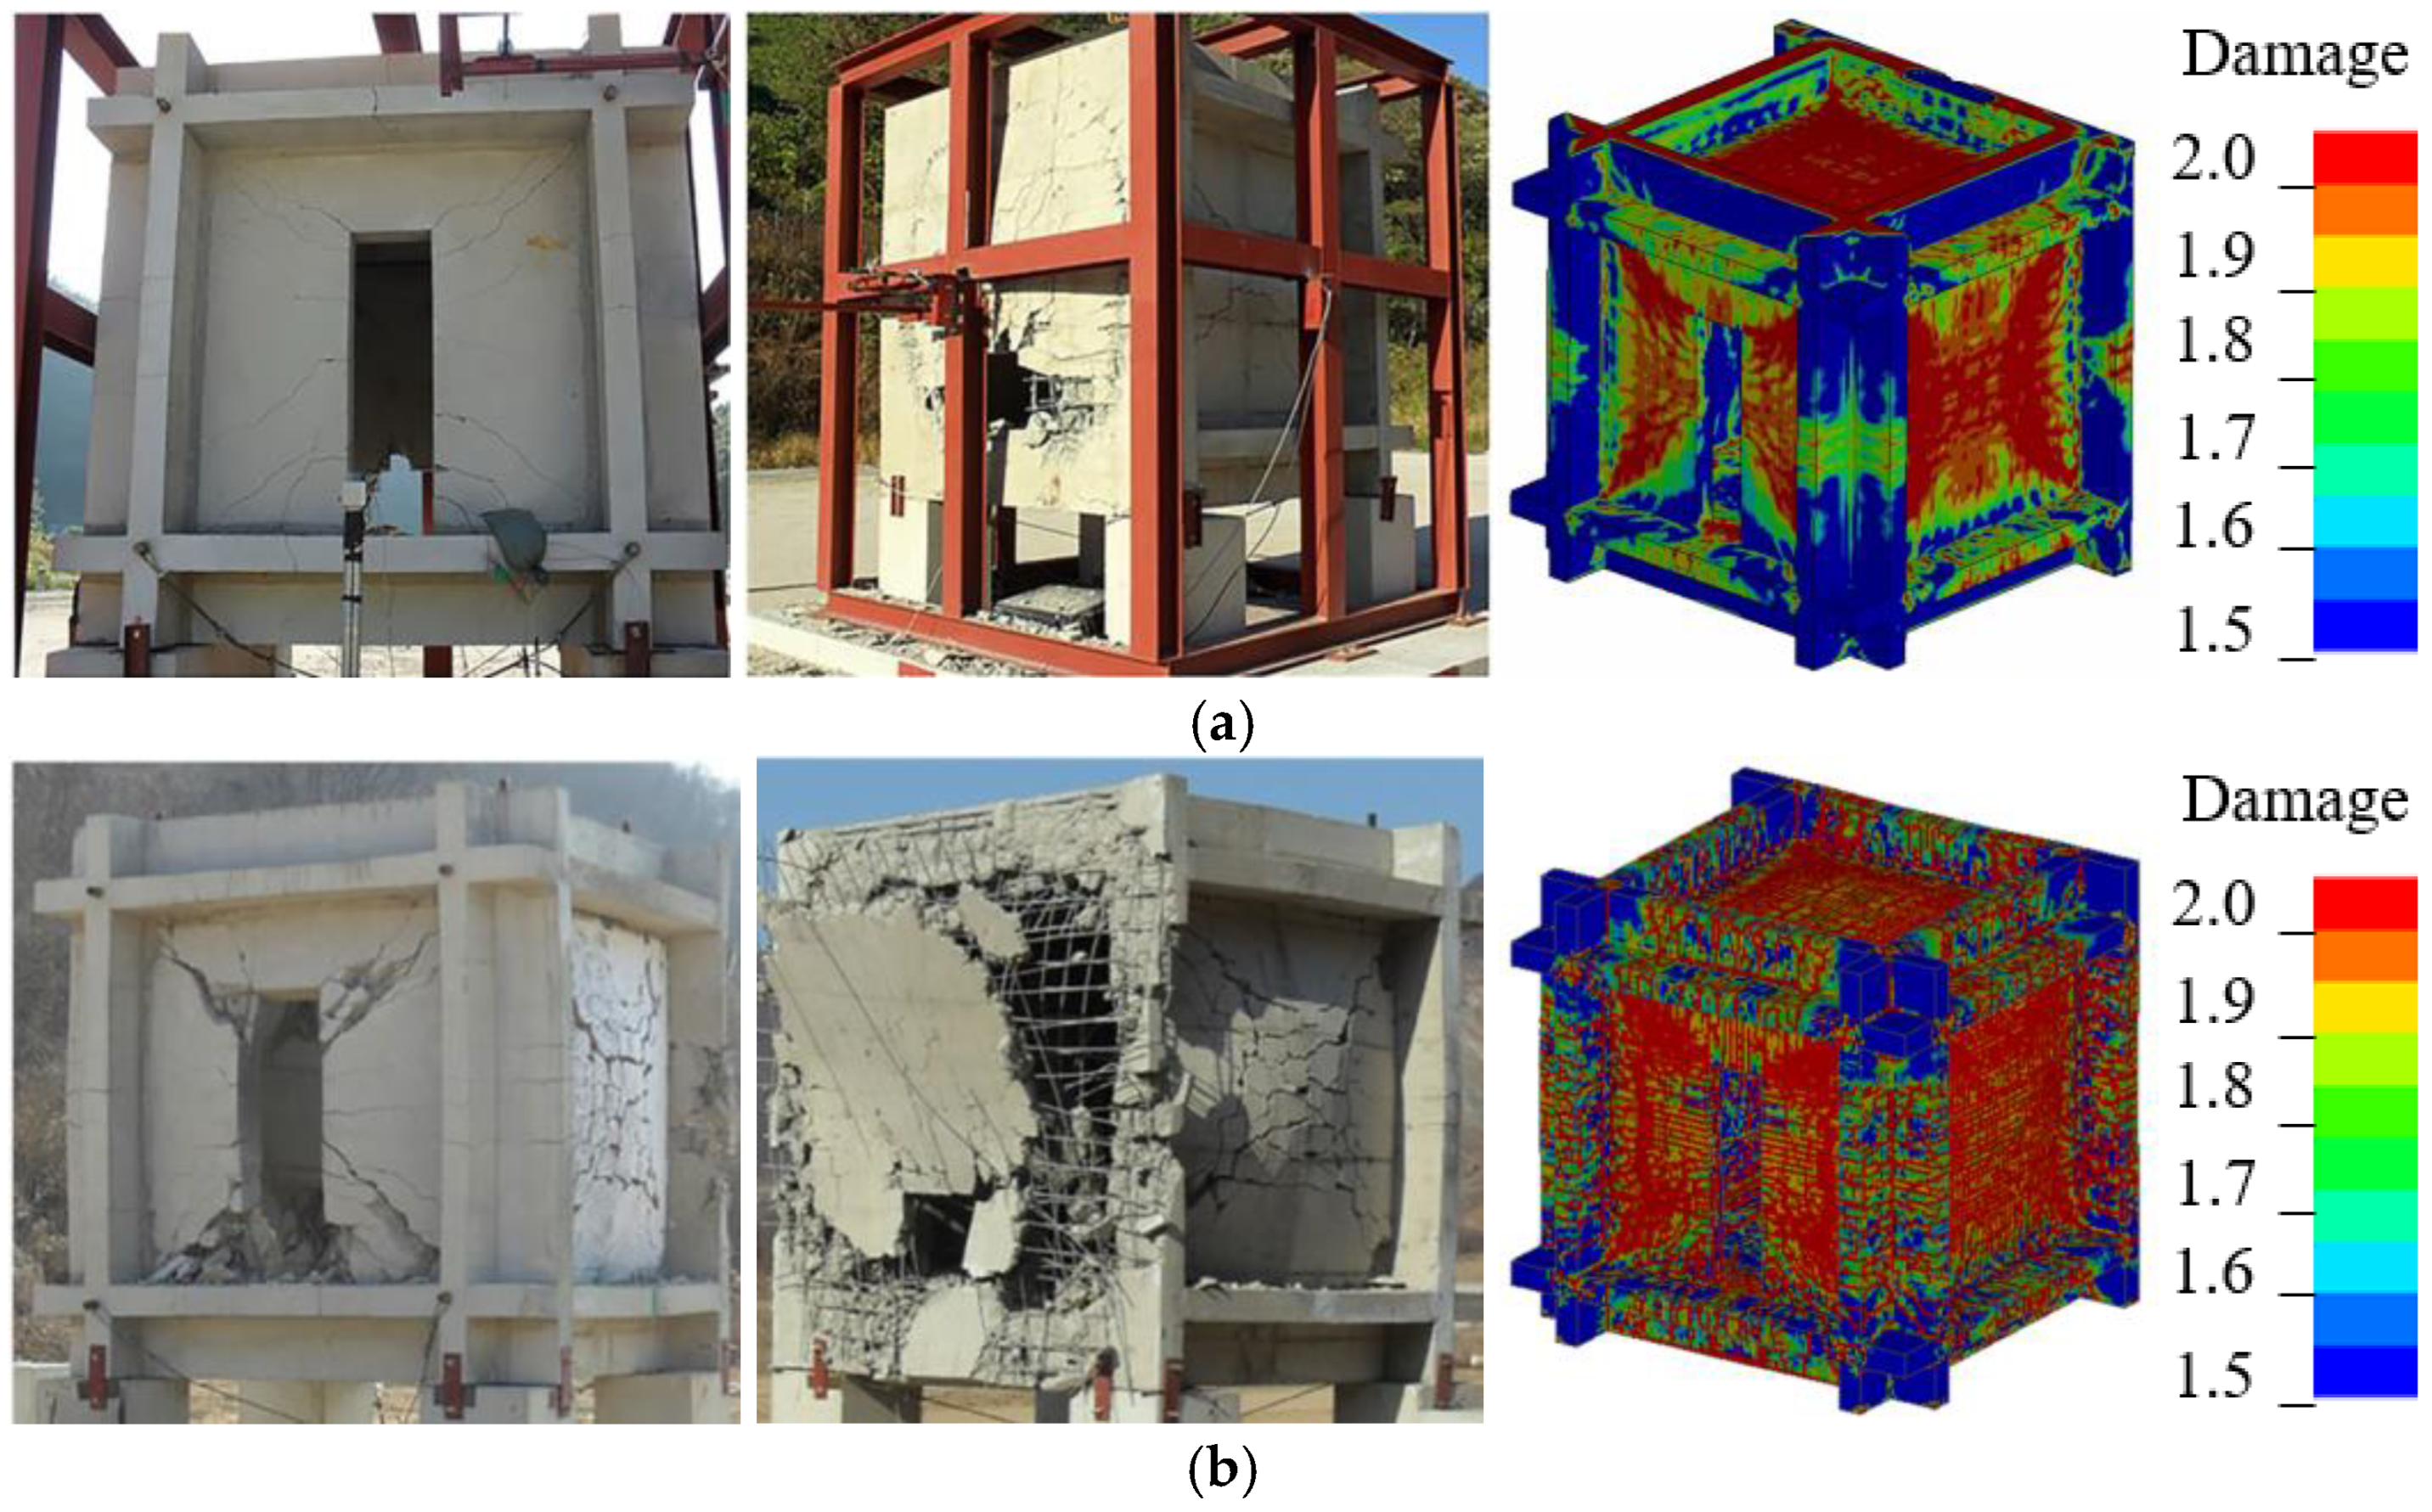
Figure 2 compares the simulated and experimental displacement-time histories for the center of the roof slab and outer wall in Test-1. The numerical results show good agreement with the experimental curves at both measurement points, with the error of maximum displacement less than 15%. Figure 4 compares the damage to the roof slab and side walls, showing good consistency between simulated and experimental results in both failure mode and damage level. In Test-2, the experimental damage to the RC structure is slightly greater than the simulated result. The primary reason is that the RC structure sustained initial damage before Test-2, which originated from Test-1.

2.2. Close-In Explosions on Masonry Walls

(a)
test introduction and modeling approach
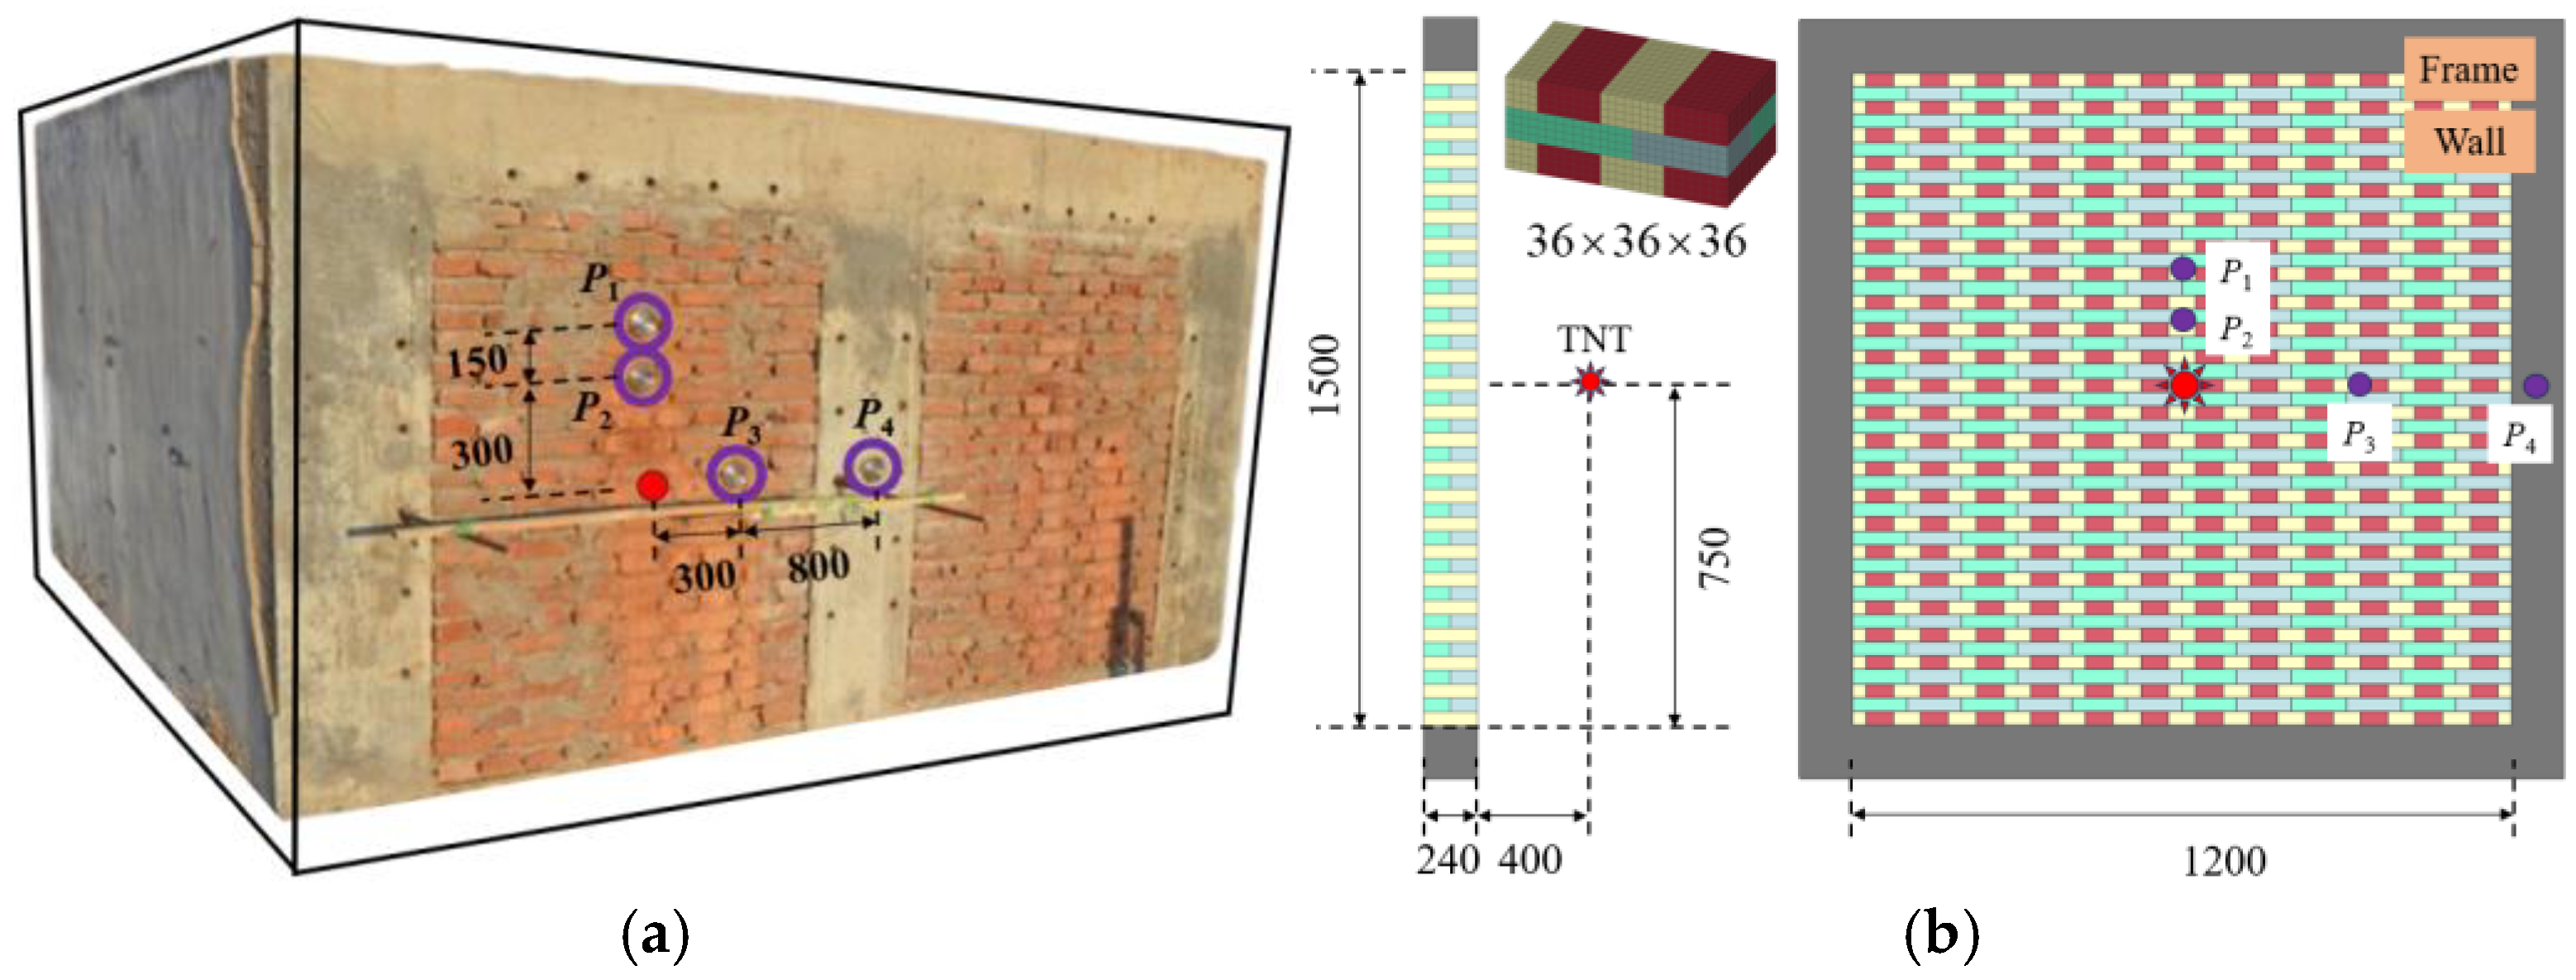
Shi et al. [31] carried out close-in explosion tests on masonry walls built with ordinary bricks (compressive strength: 15 MPa) and cement mortar (compressive strength: 5 MPa). The walls measured 240 mm in thickness, 1200 mm in length, and 1500 mm in height. TNT charges of 1 kg and 6 kg were detonated at a standoff distance of 400 mm from the wall surface. Four reflected overpressure sensors were installed on the surface of the masonry wall and RC frame, as shown in Figure 5. However, due to the severe damage to the wall, sensors P1-P3 were damaged during the test, yielding no valid data. Only sensor P4 recorded a complete overpressure-time history curve.
(b)
material model and parameters
The FE modeling approach is the same as in Section 2.1. Air mesh sizes under different explosive equivalents are determined according to the principle of equivalent explosive mesh density, as shown in Table 1. A simplified microscopic method is used in the modeling of masonry walls [53]. The mortar thickness is incorporated into the brick units, while the bricks and their adjacent mortar joints are integrated as expanded brick units. The cohesive contact between expanded brick units is employed to characterize the bonding effect of mortar, enabling the simulation of brick-mortar interaction and increased computational efficiency.
The expanded brick units are simulated by the *RHT (Riedel–Hiermaier–Thoma) model, which accounts for material failure, damage, hardening, and strain rate effects, making it suitable for capturing the dynamic behavior of masonry walls under high pressure and high strain rates [53]. As shown in Figure 6, this model incorporates three strength surfaces, namely the elastic yield surface, the maximum failure surface, and the residual strength surface, which describe the initial yield strength σ E , the failure strength σ F , and the residual strength σ R of expanded brick units, respectively. Additionally, the P-α equation of state defines the compaction curve for porous brittle materials, effectively describing the volumetric deformation of bricks under hydrostatic pressure. The compressive strength and shear modulus of the expanded brick units are determined through Equations (7) and (8).
f = 3.45 × 10 4 G e + 0 . 58 f e 6.01 × 10 8 G e 2 6.08 × 10 3 f e 2 + 3.46 × 10 5 G e f e
E = 4.1 × 10 2 f 2 + 1.5 G e 36.1 f 2 2 8.6 × 10 5 G e 2 + 5.6 × 10 2 G e f 2
where f and e are the uniaxial compressive strength and elastic modulus of the brick, respectively. fe and Ge are the compressive strength and shear modulus of the expanded brick unit, respectively. f2 is the compressive strength of mortar.
The bond-slip behavior between expanded brick units is simulated by the cohesive contact model. This model employs a linear elastic “traction-separation” for load transfer, with the interfacial bond behavior divided into linear hardening and linear softening stages. Three failure modes are defined: normal tensile (Mode I), tangential shear (Mode II), and mixed-mode (Mode M), where the normal and tangential bond strengths are denoted as T and S, respectively. Under mixed-mode conditions, the relative displacement of the contact interface is defined as:
δ m = δ I 2 + δ II 2
where δI and δII are relative displacements of the contact interface in normal and tangential directions; damage initiation in the cohesive contact occurs when the mixed-mode displacement δm reaches the critical displacement δ0 corresponding to peak interface strength, while complete bond failure is triggered when δm exceeds the ultimate displacement δF. The expressions for δ0 and δF are given as follows:
δ 0 = δ I 0 δ II 0 1 + β 2 δ II 2 2 + β δ I 2 2
δ F = 2 1 + β 2 δ 0 K N + β 2 K S G I + G II G I β 2 K S K N + β 2 K S λ
where δ I 0 and δ II 0 are relative displacement corresponding to the normal and tangential strength; β is a mixing coefficient; KN and KS are normal and tangential stiffness; GI and GII are tensile and shear fracture energies of normal and tangential contact interfaces; λ is the mixed exponent; Table 2 shows the model parameters.
(c)
results comparison
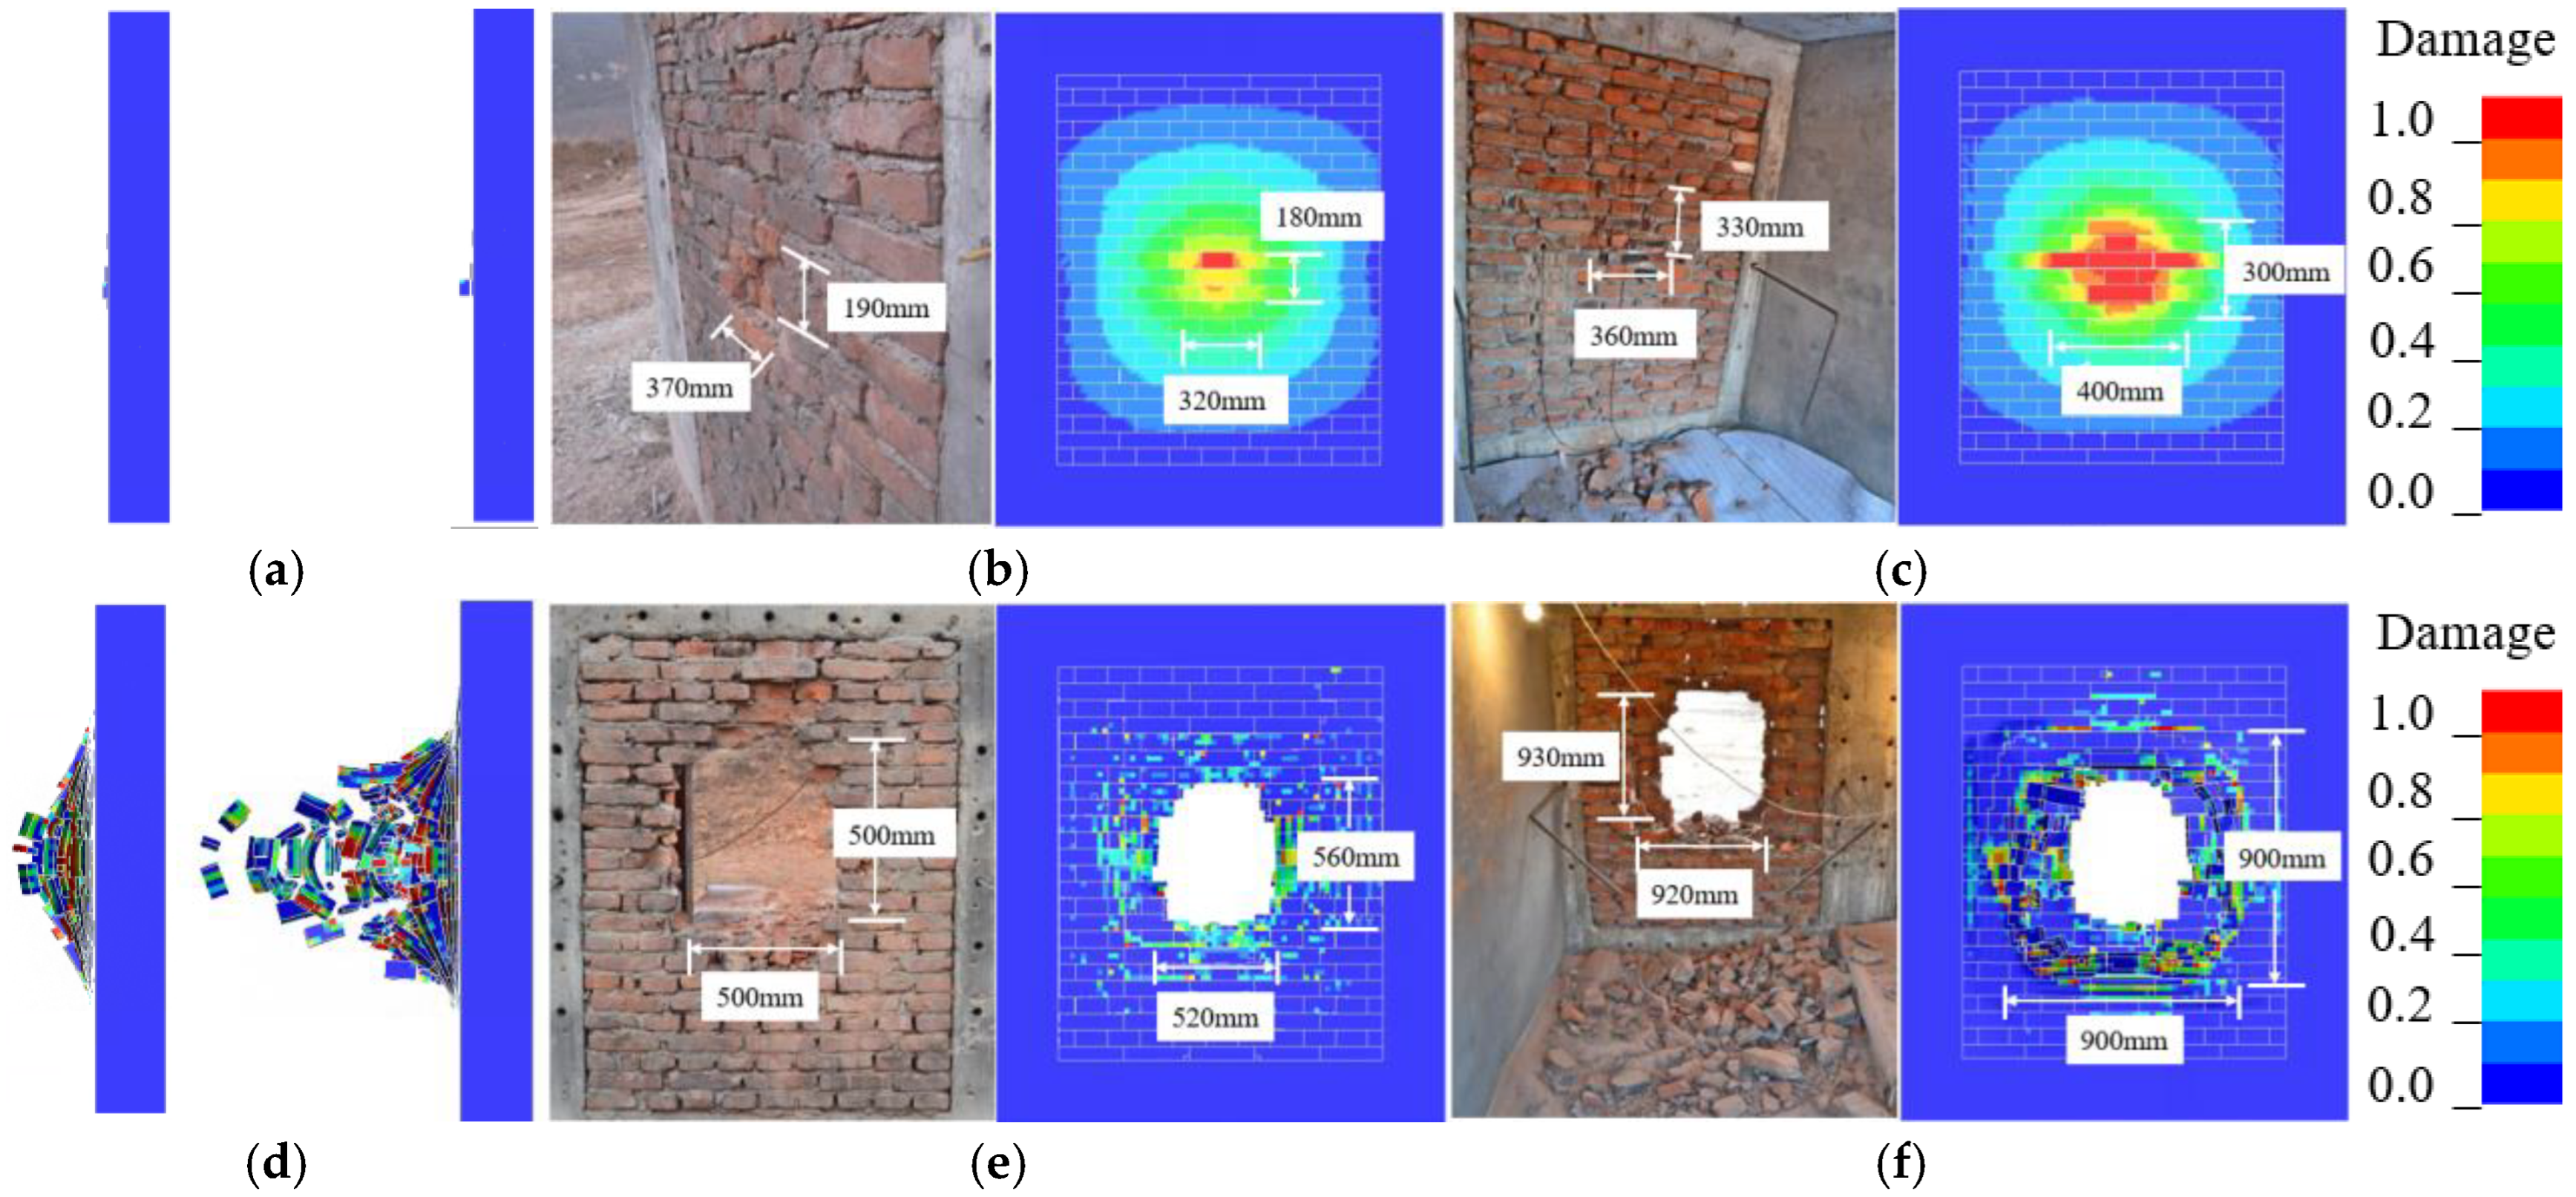
Figure 2d compares the simulated and experimental overpressure-time history curves at measurement point P4. The simulated results show good agreement with the test data in the overall trend, with a relative error of less than 10%. Figure 7 further compares the failure modes of masonry walls under two TNT equivalents, with results listed in Table 3. The failure mode predicted by simulation is consistent with the test results, and the errors of damaged areas are less than 20%.
This section verifies the reliability of the FE modeling approach by comparing overpressure-time history curves, shock wave propagation, and structural damage for both internal explosion tests on RC structures and close-in explosion tests on masonry walls. The validation includes material models and parameters, determination methodology of mesh size, MAPPING method, and fluid–structure interaction algorithms. Therefore, the FE modeling approach can accurately predict the internal explosion load and dynamic behavior of RC structures, making it suitable for damage assessment in prototype structures.

3. Prototypical RC Frame Structure

Based on the GB 50010-2010 Code for Design of Concrete Structures [54] and GB 50011-2010 Code for Seismic Design of Buildings [55], the prototypical RC frame structures were constructed, as shown in Figure 8. The infill wall was constructed with ordinary clay brick, with dimensions of 240 mm × 120 mm × 50 mm and a compressive strength of 10 MPa. The FE model consists of two vertically adjacent rooms, each with dimensions of 5000 mm × 5000 mm × 3000 mm. The slab thickness is 150 mm, and the concrete grade is C40. Figure 8e–h show the dimensions and reinforcements of each component. For the RC columns, the reinforcement consists of 12Φ25 (12 steel bars and a diameter of 25 mm) longitudinal bars and Φ8@100 stirrups (a diameter of 10 mm with a spacing of 100 mm). For the RC beams, the reinforcement consists of 6Φ22 (6 steel bars and a diameter of 22 mm) longitudinal bars and Φ8@100 stirrups (a diameter of 10 mm with a spacing of 100 mm). For the RC slab, the reinforcement consists of double-layer longitudinal reinforcement with Φ10@150 (a diameter of 10 mm with a spacing of 150 mm). In addition, the longitudinal rebars and stirrups are HRB400 and HPB300, and the thickness of the concrete cover for structural members is 25 mm. TNT explosive is detonated at the center.
Four FE models were established to analyze the influence of the venting coefficient on power parameters (i.e., peak overpressure, impulse, and roof ejection velocity) propagated to vertically adjacent rooms, as shown in Figure 8a–d. Four TNT equivalents (20, 100, 300, 500 kg) were selected to cover the majority of engineering scenarios. After the calculation, due to the relatively large TNT equivalent studied in this paper, both the mesh sizes of RC structures and air are determined to be 36 mm × 36 mm × 36 mm. The venting coefficient is defined as a dimensionless parameter of the venting area to the container volume, as given in Equation (12). Table 4 lists the 16 simulation scenarios.
η = S V 2 / 3
where η is the venting coefficient; V is the container volume; S is the venting area.

4. Results Analysis

4.1. Blast Wave Propagation

Figure 9 shows the dynamic pressure distributions inside the RC frame structures under scenario 2 and scenario 14. At T = 2 ms, the TNT explosive detonated in Room 1, generating blast waves that propagated outward. At T = 4 ms, the shock waves penetrated the roof slab and propagated into Room 2. In scenario 14, due to the lack of infill walls to reflect the shock wave, substantial blast energy was leaked out, resulting in a lower pressure in Room 1 compared to scenario 2. At T = 8 ms, due to the reflection of shock waves by the roof slab and infill walls, the pressure in Room 2 gradually increases to form quasi-static pressure (scenario 2). However, in scenario 14, the pressure in Room 2 gradually dissipated, approaching atmospheric pressure. At T = 16 ms, scenario 2 exhibited stabilized quasi-static pressures in both rooms, while scenario 14 showed complete pressure dissipation with no further damage to the RC frame structure. At T = 32 ms, the destruction of the side walls in Room 1 caused shock wave leakage, reducing internal pressure to atmospheric levels, while Room 2 maintained quasi-static pressure (scenario 2). In contrast, scenario 14 showed complete shock wave dissipation in both rooms. The above analysis demonstrates the critical role of the venting coefficient in shock wave propagation. For small coefficients, the side walls can reflect the blast wave, forming sustained quasi-static pressures that amplify the structural damage. For large coefficients, substantial blast energy venting prevents prolonged quasi-static pressure formation and significantly reduces the structural damage level.

4.2. Load Characteristics in Adjacent Rooms

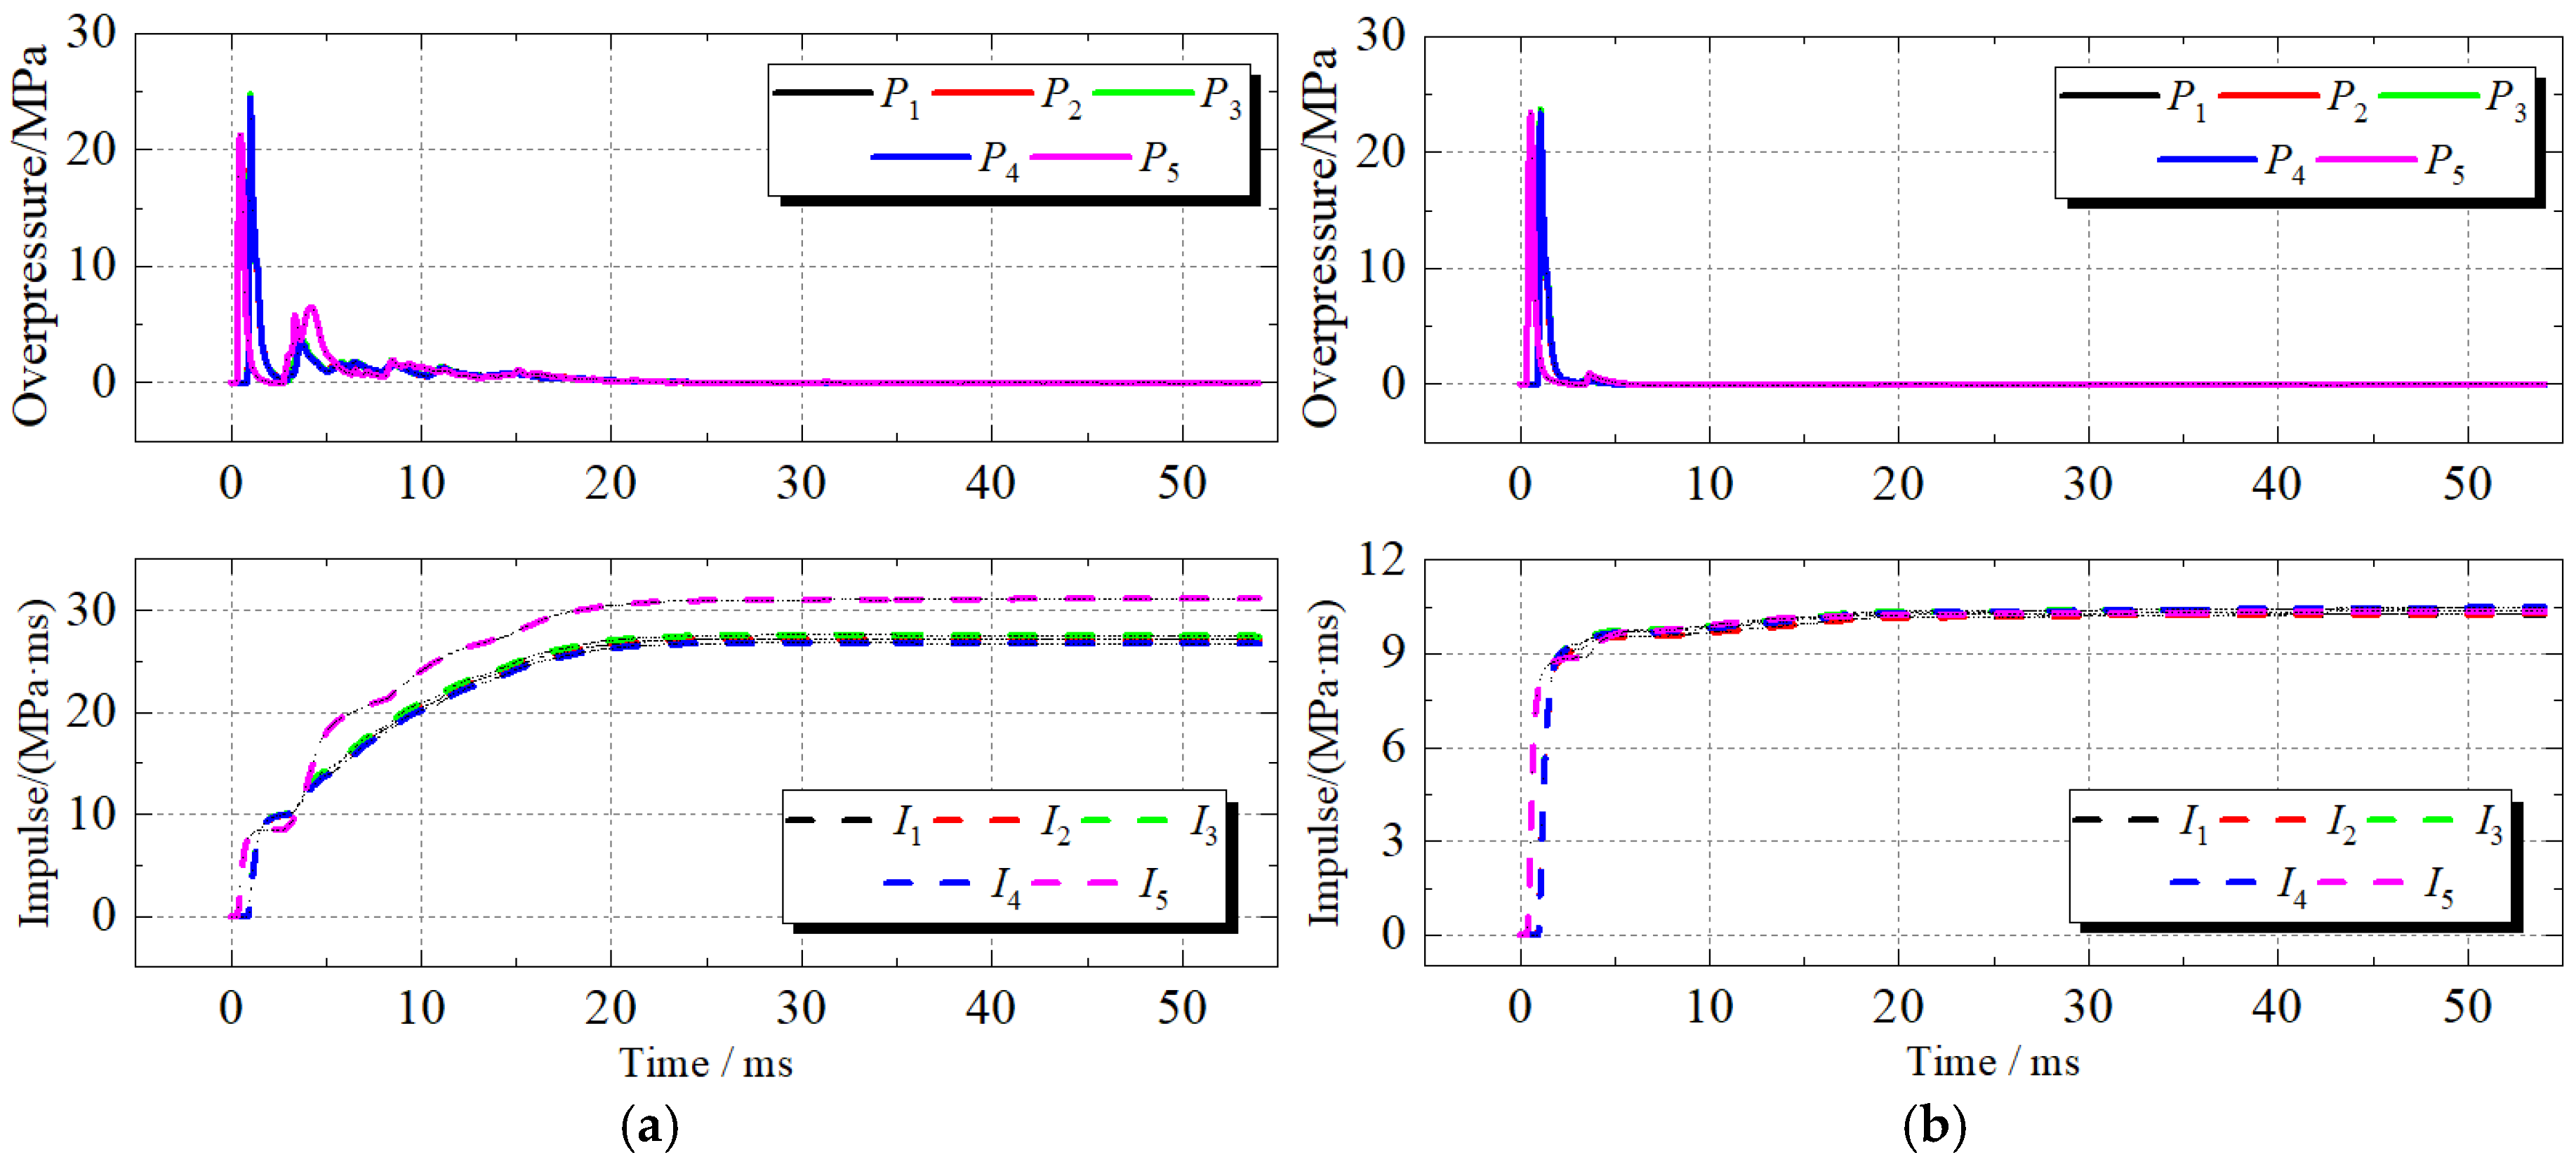
Figure 10 compares overpressure-time and impulse-time histories between scenarios 2 and 14, revealing the complex multi-peak characteristics of internal explosion load. Within 5 ms, the release of blast energy generated a shock wave with fast-rising pressure, exerting high-frequency dynamic pressure on the structure. With the attenuation of the shock wave pressure, the high-temperature and high-pressure detonation products expanded outward. Confined by the enclosed space, the RC room formed a quasi-static pressure characterized by low pressure and long duration, namely the quasi-static pressure phase. During the shock wave phase, peak overpressures are nearly identical for both venting coefficients under a certain TNT equivalent. In the quasi-static phase, however, the second peak pressure on the center of the roof slab is 0.5 MPa (scenario 14), an 87.5% reduction from 4 MPa (scenario 2). Consequently, the maximum impulse drops from 26.8 MPa·ms (scenario 2) to 10.29 MPa·ms (scenario 14), a 61.6% decrease. Thus, the venting coefficient primarily influences the quasi-static pressure phase of the internal explosion load, with negligible effects on the shock wave phase. For large-scale internal explosions, the rapid failure of the roof slab and side walls diminishes the load convergence effect at the structural corners. The overpressure-time histories at different points on the roof slab surface are similar, and the impulse-time histories also have similar shapes. The maximum deviations of the peak overpressures and impulses are below 10%. Subsequently, the peak overpressure and impulse at the center of the roof slab can be used to characterize the load characteristics in the explosion source room.
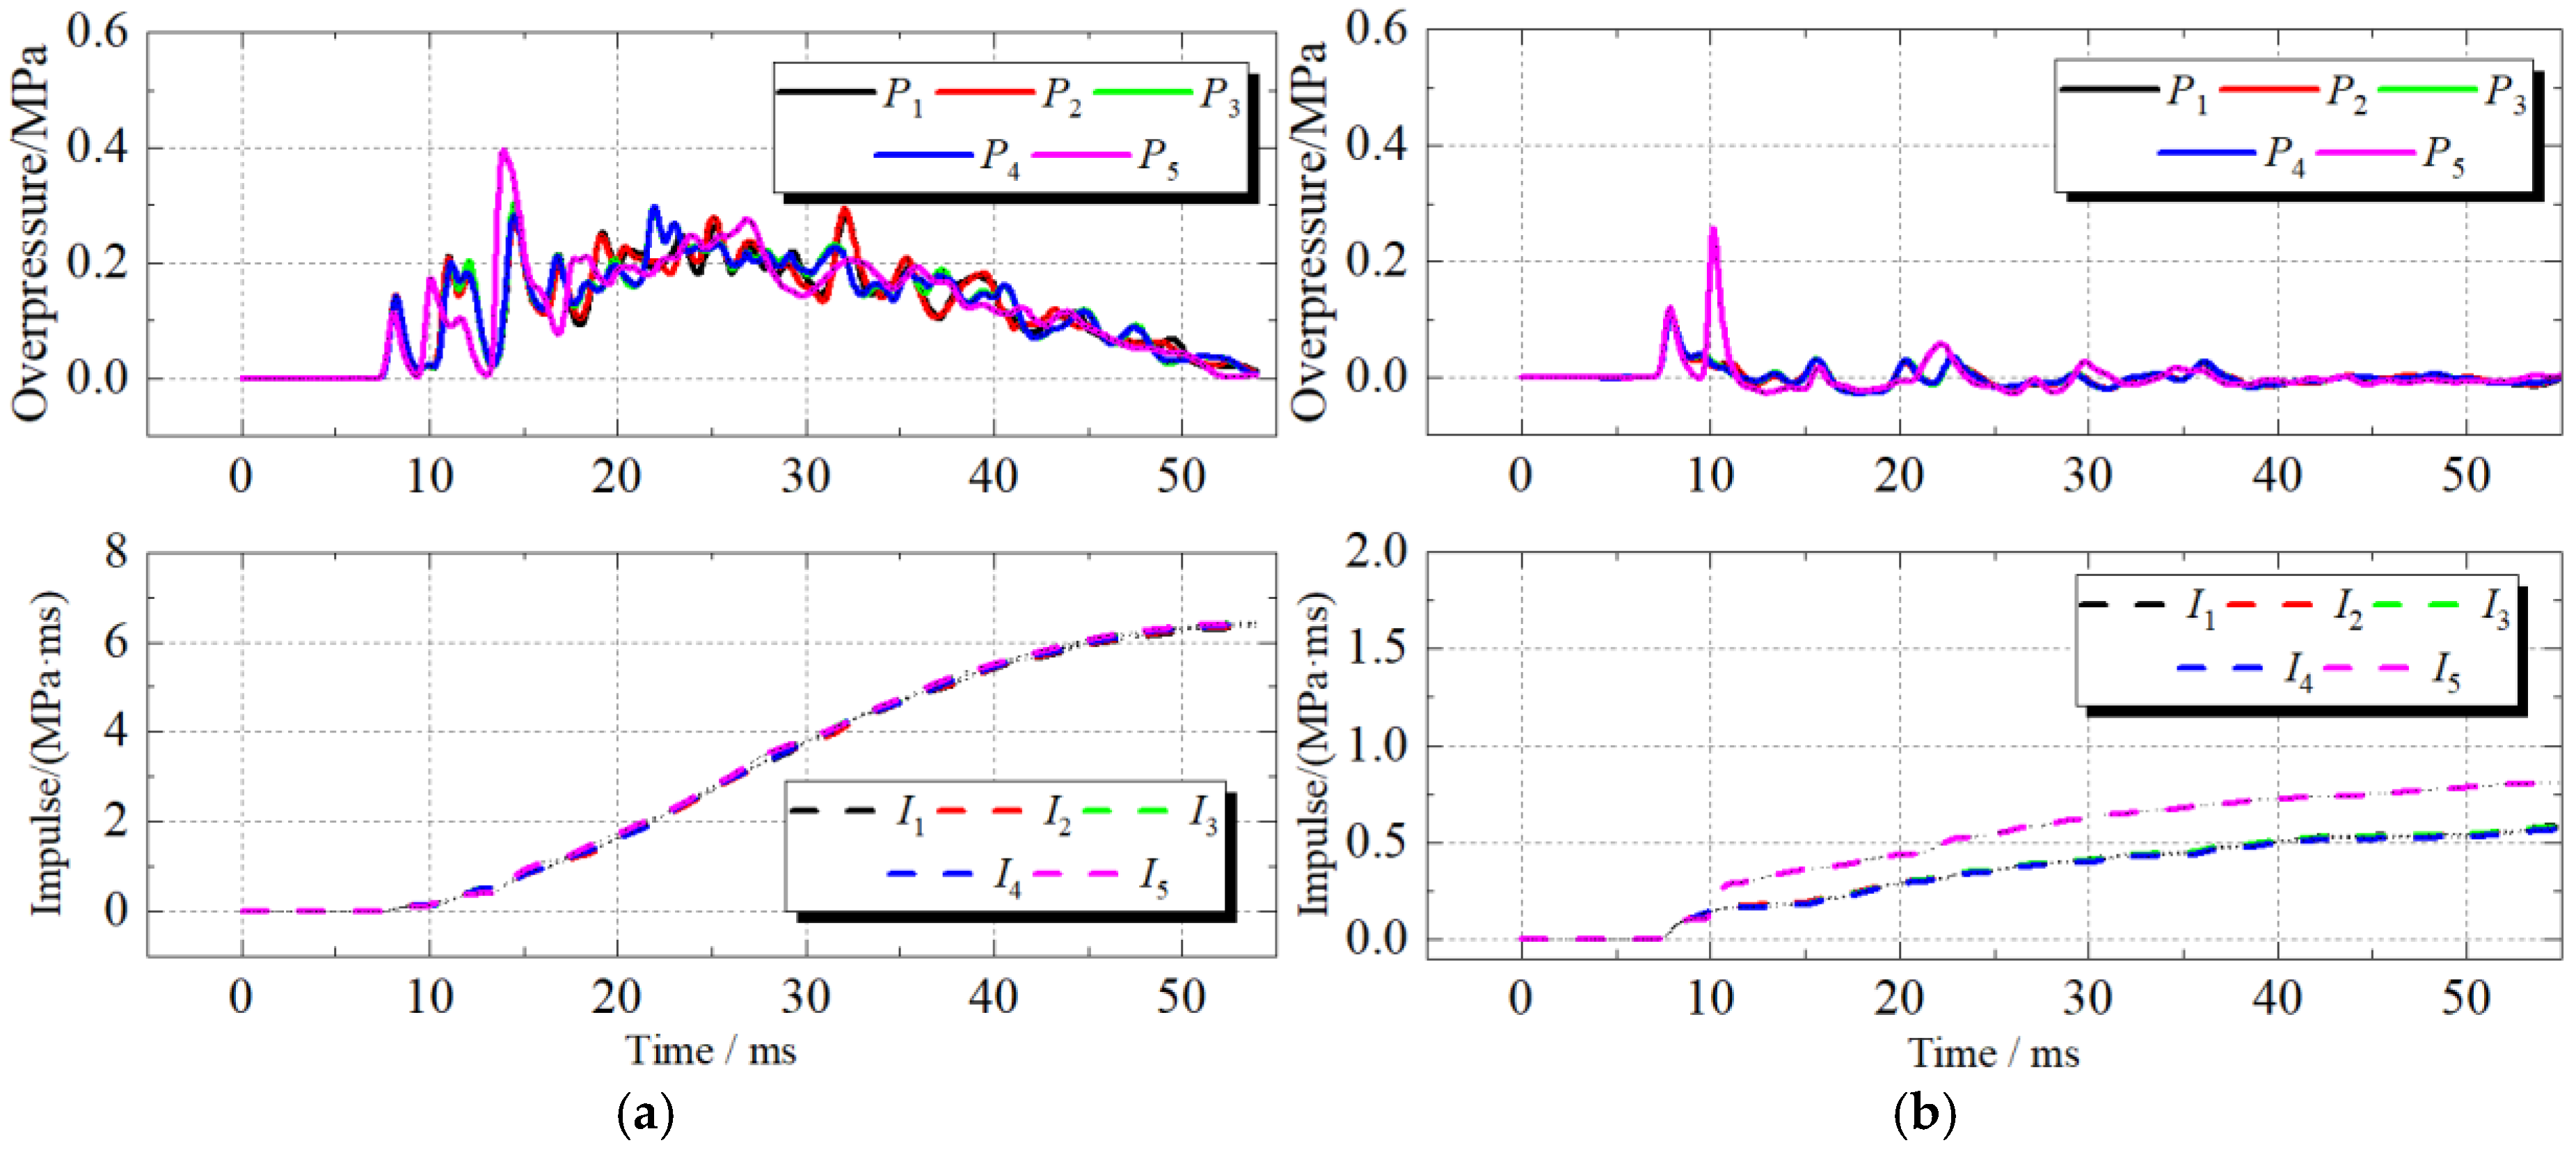
Figure 11 shows the overpressure and impulse time histories at measurement points of the roof slab in vertically adjacent Room 2. The blast wave load in Room 2 is significantly lower than in Room 1 by approximately two orders of magnitude of peak overpressure and one order of magnitude for impulse, respectively. In contrast to the load characteristics in the explosion source room, Room 2 (scenario 2) exhibits distinct pressure rising and falling phases, forming a quasi-static pressure phase with a low amplitude and longer duration. In scenario 14, however, due to substantial blast energy venting, the peak overpressure (0.1 MPa) and maximum impulse (0.61 MPa·ms) inside Room 2 are reduced by about 50% and 90%, respectively, compared to scenario 2 (0.2 MPa, 6.3 MPa·ms). It is evident that increasing the venting coefficient significantly attenuates the shock wave load propagated to the vertically adjacent room. Additionally, the overpressure-time and impulse-time history curves at measurement points in Room 2 exhibit consistent trends across all scenarios, with the deviations of maximum peak overpressure and maximum impulse less than 5%, except at P5. Subsequently, the blast wave load propagated to the vertically adjacent room can also be characterized by the maximum overpressure and impulse at the center of the roof slab.

4.3. Structural Failure Model

The damage to adjacent rooms is collectively determined by the failure of their internal structural components. Roof slabs and side walls serve as critical components that separate the internal spaces in RC frame structures, mitigating hazard propagation (i.e., shock waves, fire) to the adjacent room. Among them, infill walls primarily divide the horizontal space, while the roof slab divides the vertical space. Compared with the RC columns and beams, the roof slab has a larger load-bearing area and is more susceptible to failure. Therefore, the damage assessment for vertically adjacent rooms focuses exclusively on the dynamic behavior of the roof slab, neglecting the failure analysis on the RC columns, beams, and infill walls.
Figure 12 shows the failure process of vertically adjacent rooms for scenario 2 and scenario 14. The failure mode of the roof slab in the explosion source room (Room 1) exhibits a distinct sequence under large-scale explosions: (i) initial flexural failure, (ii) progressive shear failure along the beam-slab joints, and (iii) ultimate explosive ejection of the roof slab. The failure mode of the roof slab in Room 2 is primarily flexural failure. Comparing the failure modes of the roof slab under two venting coefficients, scenario 2 showed that the roof slab in Room 2 underwent significant flexural failure within T < 60 ms. Subsequently, the collision between roof slab 1 (from Room 1) and roof slab 2 (from Room 2) further enhanced the damage, leading to severe flexural failure for roof slab 2. However, in scenario 14, roof slab 2 showed only minor damage at T < 300 ms. The collision between roof slab 1 and roof slab 2 at T = 300 ms caused only slight damage to roof slab 2, with a damage level significantly lower than that in scenario 2. This demonstrates that increasing the venting coefficient substantially reduces structural damage. Notably, the damage to the roof slab in vertically adjacent rooms results from both shock wave loads and the explosive ejection of the roof slab from the explosion source room. With a large venting coefficient, the damage to vertically adjacent rooms caused by the shock waves can be neglected, leaving only the roof ejection velocity as the primary factor.
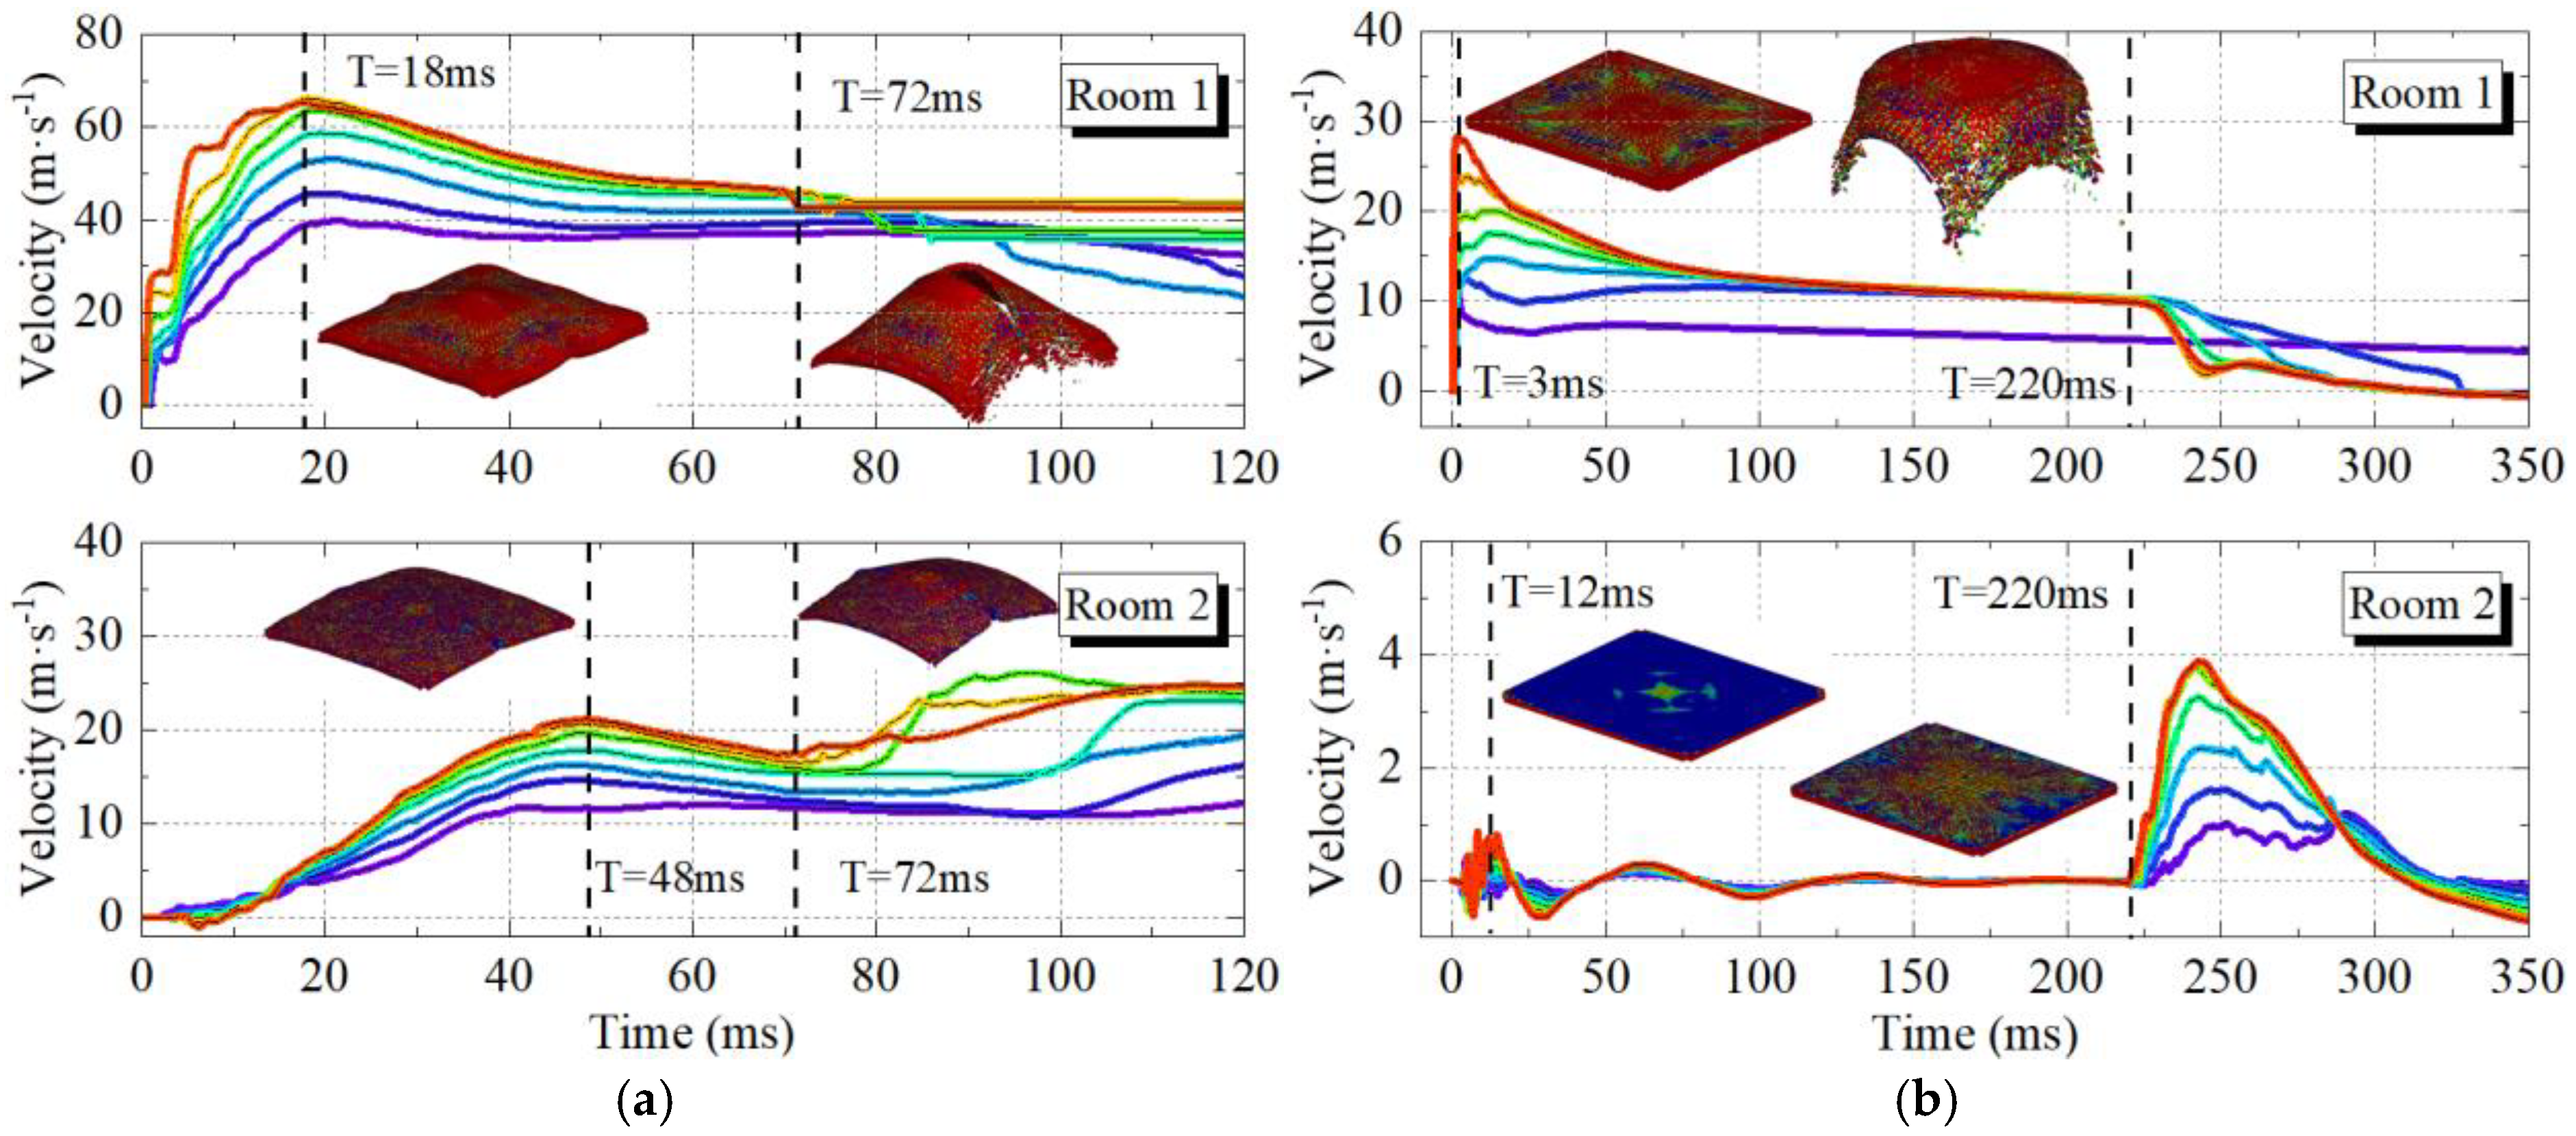
Figure 13 further shows the velocity-time history curves at measurement points on the roof slab in both scenario 2 and scenario 14. Overall, the curves show consistent characteristics across measurement points within each scenario. As the measurement point moves from the structural center to the edge, the velocity amplitude gradually decreases. In scenario 2, at T = 18 ms, owing to the reflection of shock waves by the infill walls, the ejection velocity of the roof slab in the explosion source room rapidly increased to the maximum, with an average of about 50 m/s. At T = 48 ms, influenced by the shock waves propagated into Room 2, the ejection velocity of roof slab 2 gradually increases, with an average of about 15 m/s. At T = 72 ms, roof slab 1 and roof slab 2 decelerated under gravitational acceleration and subsequently collided with significant impact. At T = 120 ms, both roof slabs were moving upward after the collision, marking the end of the structural failure process. In scenario 14, at T = 3 ms, the impact of blast waves on the roof slab ceased, and the roof ejection velocity rapidly increased to maximum, reaching an average of about 15 m/s. At T = 12 ms, the shock wave propagated into Room 2, causing slight velocity fluctuations in roof slab 2 with a maximum of about 0.9 m/s, which resulted in minor damage. At T = 220 ms, roof slab 1 decelerated to 9 m/s under gravity and subsequently impacted roof slab 2. At T = 350 ms, after the initial collision, the ejection velocity of roof slab 1 decayed rapidly. Meanwhile, although the damage to Roof Slab 2 increased, no significant failure occurred, marking the end of the structural failure process.
A comparison of Figure 13a,b reveals that an increase in venting coefficients leads to a substantial reduction in slab damage. For instance, with a venting coefficient of 0, the average velocity of the roof slab reaches 50 m/s, which is approximately a 70% increase compared to the 15 m/s at a venting coefficient of 2.618. Thus, structural damage assessments for internal explosions must account for the attenuation effect of the venting coefficient on the structural dynamic response.

5. Attenuation Coefficient of Power Parameters

5.1. Attenuation Coefficient of Power Parameters in the Explosion Source Room

Section 4 identifies three power parameters that propagate vertically in RC frame structures under internal explosions: peak overpressure, impulse, and roof ejection velocity. To quantify the attenuation effect of the venting coefficient on power parameters in the explosion source room, three corresponding attenuation coefficients were defined:
φ 1 = P 0 P η / P 0
φ 2 = I 0 I η / I 0
φ 3 = v 0 v η / v 0
where φ 1 , φ 2 , and φ 3 are the attenuation coefficients of peak overpressure, impulse, and roof ejection velocity, respectively; Pη, P0, Iη, I0, vη, and v0 are peak overpressure, impulse, and roof movement velocity when the venting coefficient is η and 0; v is the average ejection velocity of the roof slab, v = v 1 + + v N / N ; v1vN are the maximum velocities of the N-th measurement point. N is the number of measurement points.
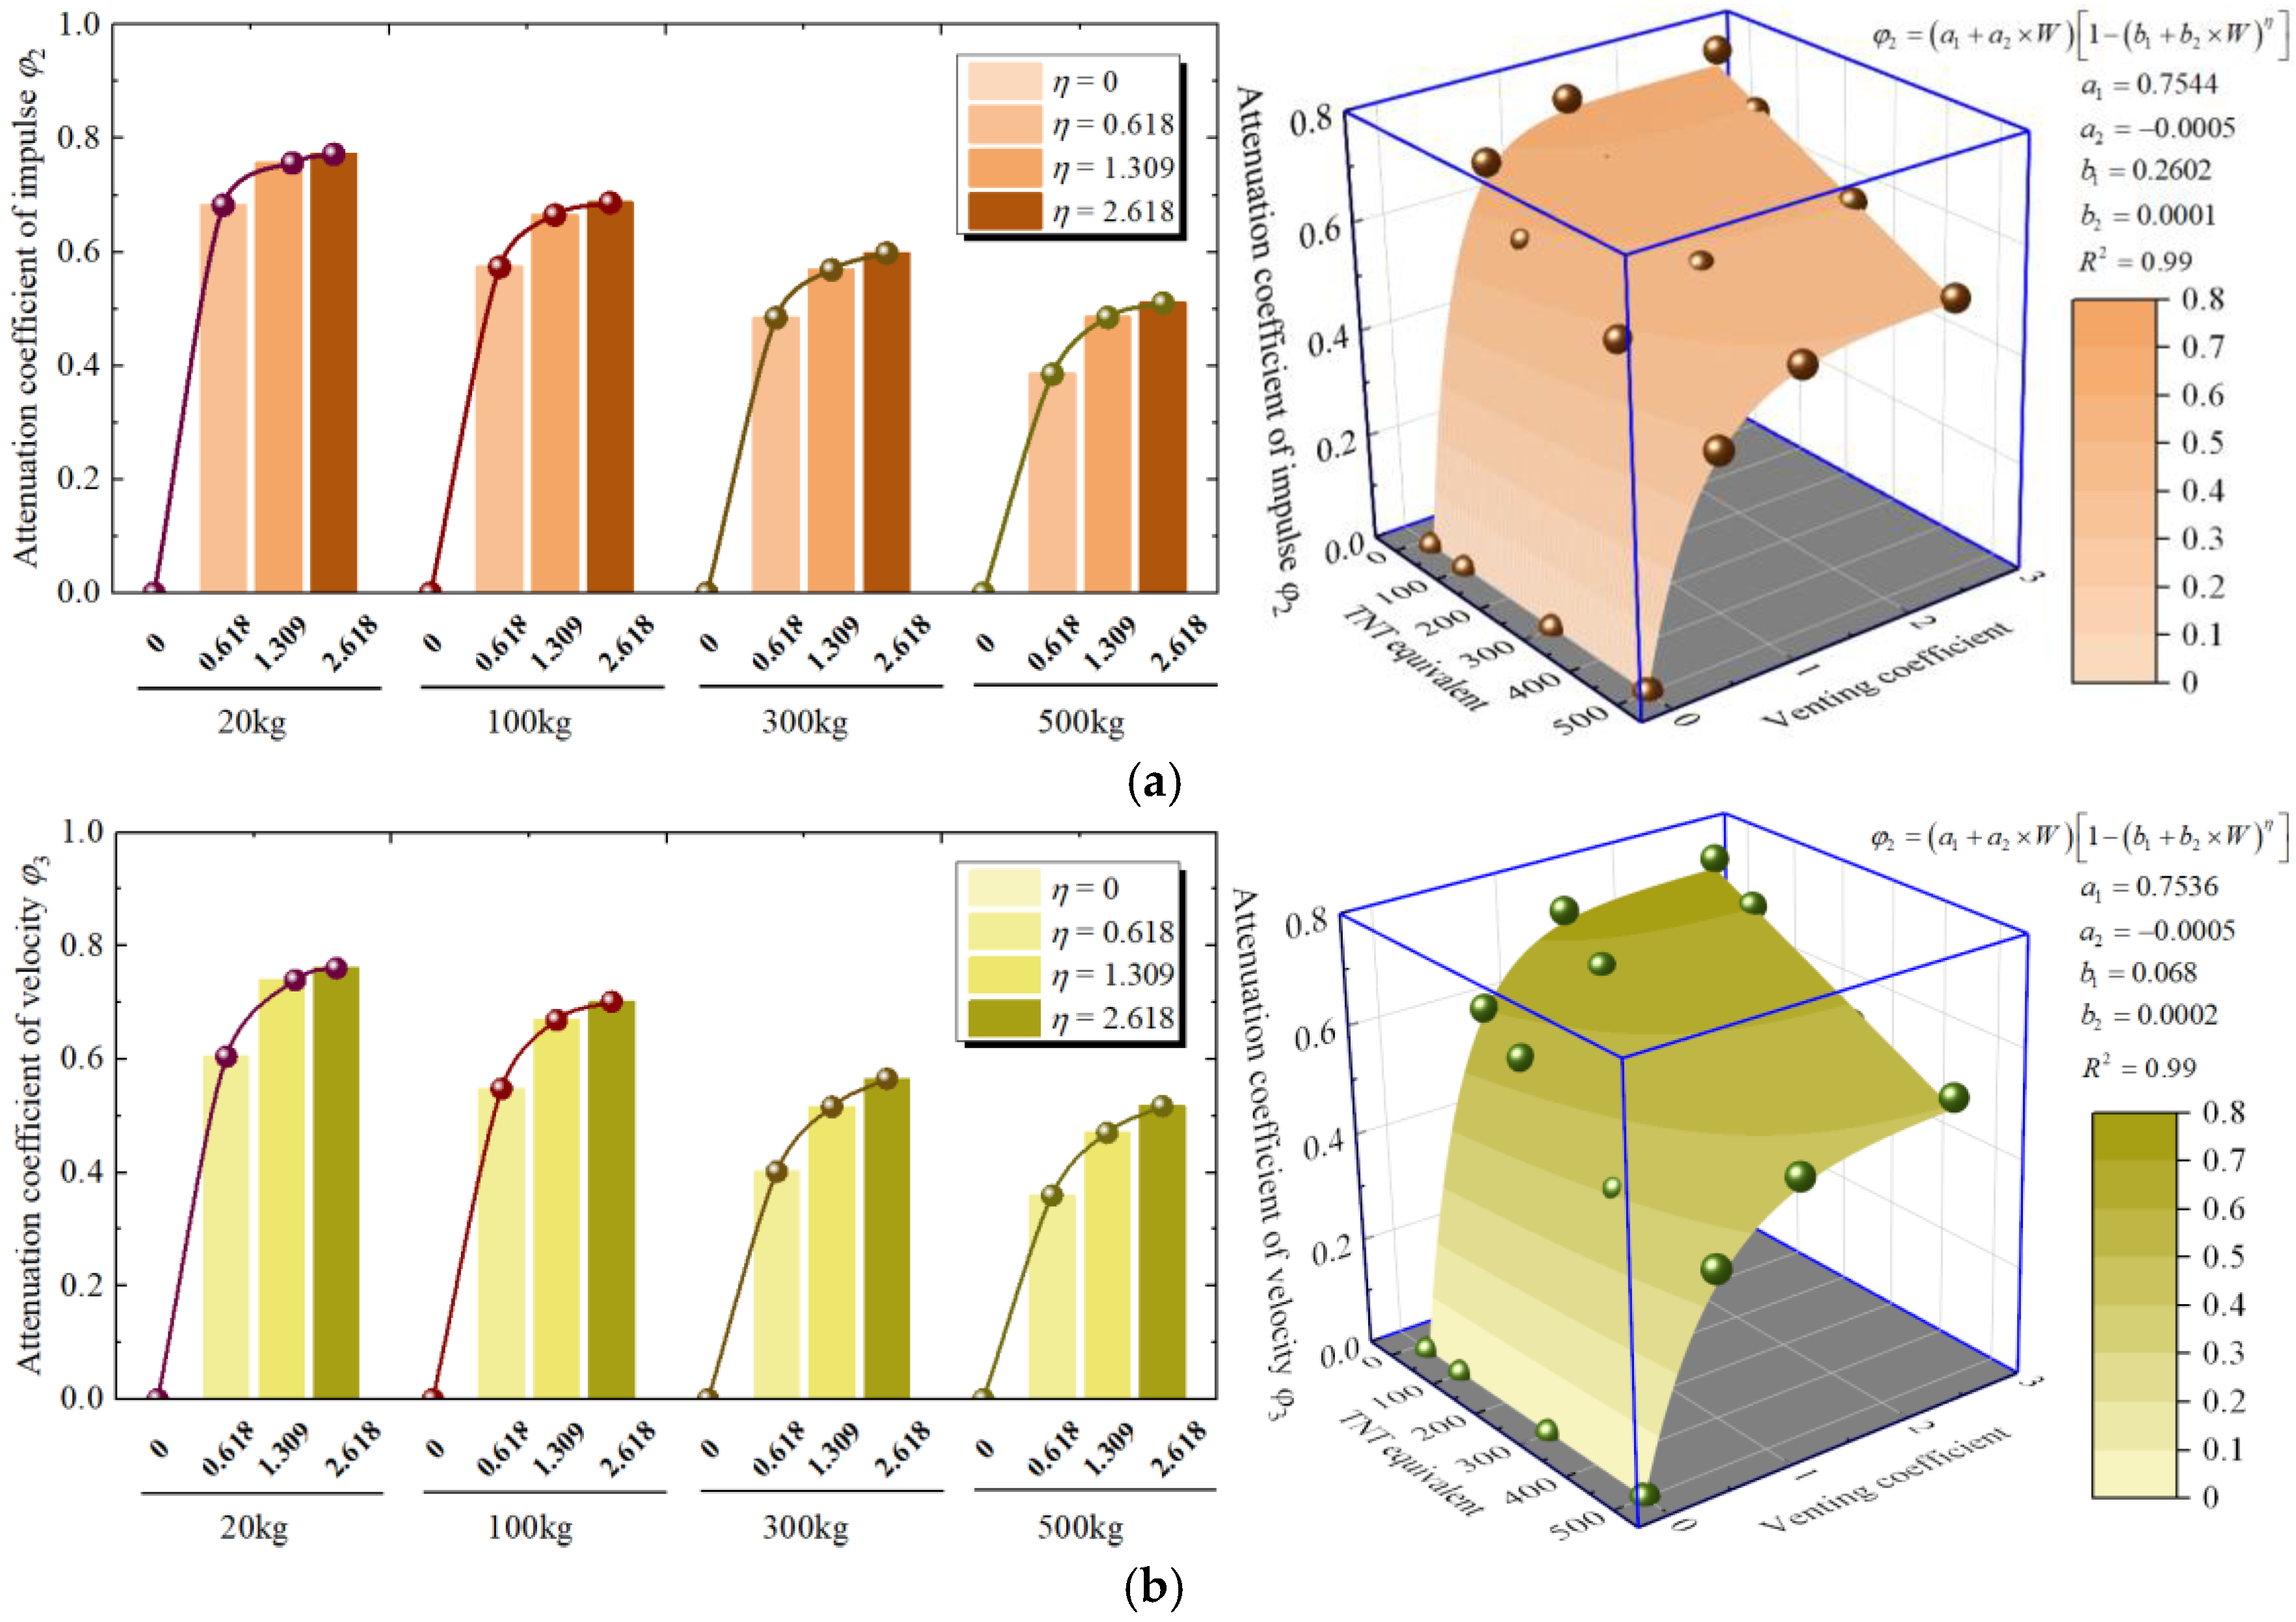
Given the negligible effect of the venting coefficient on peak overpressure in the explosion source room (i.e., φ 1 = 0), Figure 14 shows the corresponding attenuation coefficients of impulse and roof ejection velocity across all scenarios. Both coefficients demonstrate approximately logarithmic growth with the increasing venting coefficient. The attenuation coefficients of impulse and roof ejection velocity show maximum deviations of 77% and 76%, respectively, between fully ventilated (η = 2.618) and fully enclosed (η = 0) conditions, indicating significant differences in structural response. The venting coefficient plays a crucial role in structural damage assessment and blast-resistant design. The attenuation coefficients of impulse and roof ejection velocity exhibit approximately linear decreases with the increasing explosive equivalent, attributable to enhanced damage to the roof slab at larger TNT equivalents. As more energy dissipates through slab deformation and fracture, the impulse load and roof ejection velocity in the explosion source room experience a significant reduction.
An empirical model for the attenuation coefficients of power parameters in the explosion source room is derived as follows:
φ 1 = 0
φ 2 = 0.7544 0.0005 × W 1 0.2602 + 0.0001 × W η
φ 3 = 0.7536 0.0005 × W 1 0.068 + 0.0002 × W η
where W is the TNT equivalent.

5.2. Attenuation Coefficient of Power Parameters in the Vertically Adjacent Room

To quantify the attenuation effect of the venting coefficient on the power parameters propagated to the vertically adjacent room, attenuation coefficients for peak overpressure, maximum impulse, and roof slab velocity are defined:
ϕ 1 = P 1 P 2 / P 1
ϕ 2 = I 1 I 2 / I 1
ϕ 3 = v 1 v 2 / v 1
where ϕ 1 , ϕ 2 , and ϕ 3 are the attenuation coefficient of peak overpressure, impulse, and roof ejection velocity, respectively; P1, I1, and v1 are peak overpressure, impulse, and roof ejection velocity in source explosion room, respectively; P2, I2, and v2 are peak overpressure, impulse, and roof ejection velocity in a vertically adjacent room, respectively.
Figure 15 shows the attenuation coefficients of peak overpressure, impulse, and roof ejection velocity in Room 2. The attenuation coefficient of peak overpressure shows minimal sensitivity to variations in the venting coefficient and explosive equivalent, maintaining an average of 98%. In contrast, the attenuation coefficient of impulse exhibits an approximately logarithmic relationship with the venting coefficient. For a fully ventilated RC frame structure (η = 0), the attenuation coefficient of the impulse is approximately 0.75. Increasing the venting coefficient to 0.618 raises this value to 0.95, and then it increases slowly with further increases in the venting coefficient. Notably, the explosive equivalent demonstrates negligible influence on the attenuation coefficient of impulse, with the deviation remaining below 5% for a given venting coefficient. The attenuation coefficient of ejection velocity exhibits an approximately linear increase with the venting coefficient and an inverse linear relationship with the explosive equivalent. For smaller explosive equivalents, the failure velocity of side walls allows gradual energy release, resulting in the venting coefficient having a significant influence on the roof ejection velocity. Increasing the venting coefficient from 0 to 2.618 enhances the attenuation coefficient of roof ejection velocity from 0.72 to 0.96 (Δ = 0.24) under 20 kg TNT equivalent. In contrast, larger charges (i.e., 100 kg) cause rapid wall failure, allowing substantial energy release through the failure walls. Consequently, the influence of the venting coefficient diminishes significantly, with the attenuation coefficient increasing only from 0.52 to 0.62 (Δ = 0.10) for the same venting coefficient range.
An empirical model for the attenuation coefficients of power parameters propagated to the vertically adjacent room is derived as follows:
ϕ 1 = 0.988 5 × 10 5 W + 0.0031 η
ϕ 2 = 0.96 0.213 e η / 0.237
ϕ 3 = 0.765 + 0.1826 η 0.0014 W 0.037 η 2 + 1.78 × 10 6 W 2

6. Conclusions

Based on the verified FE models for internal explosions in RC frame structures, this study numerically investigates the power parameters (i.e., peak overpressure, impulse, and roof ejection velocity) across varying explosive equivalents and venting coefficients in vertically adjacent RC rooms. The main conclusions are as follows:
(i)
The roof slab can effectively block the propagation of shock waves, reducing the shock wave load propagated to the vertically adjacent room by approximately two orders of magnitude for peak overpressure and one order of magnitude for impulse, respectively, compared to the explosion source room. Besides the shock wave load (i.e., peak overpressure, impulse), the explosive ejection of the roof slab significantly impacts the damage to vertically adjacent rooms. Therefore, the vertical damage assessment in RC frame structures must account for both the shock wave load and the explosive ejection of the roof slab.
(ii)
The venting coefficient has little influence on peak overpressure in the explosion source room, while rapid energy dissipation leads to significant attenuation of both internal impulse and roof ejection velocity. Compared with a fully enclosed (η = 0) RC building, the maximum attenuation of the impulse and roof ejection velocity in the explosion source room under fully ventilated conditions (η = 2.618) are approximately 76% and 75%, respectively.
(iii)
An increase in the venting coefficient can significantly reduce the power parameters propagated to the vertically adjacent rooms. For a 100 kg TNT, increasing the venting coefficient from 0 to 2.618 reduces the power parameters by an 87.5% decrease in peak overpressure, 67.6% in impulse, and 70% in roof ejection velocity, demonstrating that enhancing the venting area can significantly improve structural blast resistance.
(iv)
The developed empirical model can accurately predict the attenuation coefficients of power parameters in the explosion source room and the vertically adjacent rooms under varying venting coefficients, enabling rapid damage assessment for RC frame structures under internal explosions.

Author Contributions

Conceptualization, J.L. and Y.L.; methodology, J.L. and H.M.; software, J.L.; validation, J.L.; investigation, H.X.; data curation, J.L. and X.F.; writing original draft preparation, J.L.; writing review andediting, Y.Y.; supervision, J.L.; project administration, X.F. All authors have read and agreed to the published version of the manuscript.

Funding

This research was funded by the President foundation of China Academy of Engineering grant number YZJJZQ2024007.

Data Availability Statement

All data, models, or codes that support the findings of this study are available from the corresponding author upon reasonable request.

Conflicts of Interest

The authors declare that they have no known competing financial interests or personal relationships that could have appeared to influence the work reported in this paper.

References

  1. Ahmet, I.T.; Yaşar, A.; Hakan, Y.; Kumbasaroglu, A. An experimental evaluation on structural performance level of corroded reinforced concrete frames. Eng. Struct. 2025, 325, 119479. [Google Scholar] [CrossRef]
  2. Wang, S.N.; Cheng, X.W.; Li, Y.; Yang, X.; Zhang, H.; Guo, R.; Song, X.; Liang, Z. Assessing progressive collapse regions of reinforced concrete frame structures using Graph Convolutional Networks. Eng. Struct. 2025, 322, 119076. [Google Scholar] [CrossRef]
  3. Federal Emergency Management Agency (FEMA). The Oklahoma City Bombing: Improving Building Performance Through Multi-Hazard Mitigation, FEMA-277; Building Performance Assessment Team: Washington, DC, USA, 1996. [Google Scholar]
  4. Sudoyo, H.; Widodo, P.T.; Suryadi, H.; Lie, Y.S.; Safari, D.; Widjajanto, A.; Kadarmo, D.A.; Hidayat, S.; Marzuki, S. DNA analysis in perpetrator identification of terrorism-related disaster: Suicide bombing of the Australian Embassy in Jakarta 2004. Forensic Sci. Int. Genet. 2008, 2, 231–237. [Google Scholar] [CrossRef] [PubMed]
  5. Souhu. Interception Failed. The Missile Penetrated the Ukrainian Decision-Making Center Building at Twice the Speed of Sound. 2023. Available online: https://www.sohu.com/a/689810854_563497 (accessed on 6 March 2025).
  6. Wang, Y.S.; Li, W.B.; Zhu, W.; Li, W.; Zhang, Q.; Wang, X. Dynamic response of steel cabin structure under blast loading from adjacent cabin. Eng. Struct. 2024, 311, 118213. [Google Scholar] [CrossRef]
  7. To, Q.B.; Shin, J.; Kim, J.; Han, S.W.; Lee, K. Finite element analysis-based blast and seismic performance evaluation for RC frame with retrofitted ENTA damper systems. Eng. Struct. 2024, 313, 118300. [Google Scholar] [CrossRef]
  8. Feldgun, V.R.; Karinski, Y.S.; Edri, I.; Yankelevsky, D.Z. Prediction of the quasi-static pressure in confined and partially confined explosions and its application to blast response simulation of flexible structures. Int. J. Impact Eng. 2016, 90, 46–60. [Google Scholar] [CrossRef]
  9. Zyskowski, A.; Sochet, I.; Mavrot, G.; Bailly, P.; Renard, J. Study of the explosion process in a small scale experiment-structural loading. J. Loss Prev. Process Ind. 2004, 17, 291–299. [Google Scholar] [CrossRef]
  10. Hu, Y.; Wu, C.Q.; Lukaszewi, Z.M.; Dragos, J.; Ren, J.; Haskett, M. Characteristics of confined blast loading in unvented structures. Int. J. Prot. Struct. 2011, 2, 21–44. [Google Scholar] [CrossRef]
  11. Santos, A.P.; Castedo, R.; López, L.M.; Chiquito, M.; Yenes, J.I.; Alañón, A.; Costamagna, E.; Martínez-Almajano, S. Reinforced concrete building with IED detonation: Test and simulation. Appl. Sci. 2022, 12, 7803. [Google Scholar] [CrossRef]
  12. Liu, S. Study on the distribution range of explosion power field in frame building space. Beijing Acad. Mil. Sci. 2024. (In Chinese) [Google Scholar]
  13. Guo, X.K.; Li, Y.; Dsniel, P.; Hu, Y.; Bai, Z.; Zhang, H.; Li, Z.; Wang, X. A reinforced concrete shear wall building structure subjected to internal TNT explosions: Test results and numerical validation. Int. J. Impact Eng. 2024, 190, 104950. [Google Scholar] [CrossRef]
  14. Li, X.D.; Yin, J.P.; Zhao, P.D.; Zhang, L.; Xu, Y.X.; Wang, Q.; Zhang, P. The effect of stand-off distance on damage to clamped square steel plates under enclosed explosion. Structures 2020, 25, 965–978. [Google Scholar] [CrossRef]
  15. Hu, B.; Fang, X.; Cheng, L.; Wen, J.; Yu, D. Attenuation of impact waves in a nonlinear acoustic metamaterial beam. Nonlinear Dyn. 2023, 111, 15801–15816. [Google Scholar] [CrossRef]
  16. Khan, M.H.; Li, B.; Tan, K.T. Impact load wave transmission in elastic metamaterials. Int. J. Impact Eng. 2018, 118, 50–59. [Google Scholar] [CrossRef]
  17. Cai, C.Q.; Zhou, J.X.; Wang, K.; Pan, H.; Tan, D.; Xu, D.; Wen, G. Flexural wave attenuation by metamaterial beam with compliant quasi-zero-stiffness resonators. Mech. Syst. Signal Process. 2022, 174, 109119. [Google Scholar] [CrossRef]
  18. Kong, X.S.; Zhou, H.; Zheng, C. An experimental study on the mitigation effects of fine water mist on confined-blast loading and dynamic response of steel plates. Int. J. Impact Eng. 2019, 134, 103370. [Google Scholar] [CrossRef]
  19. Chen, L.; Zhang, L.; Fang, Q. Performance based investigation on the construction of anti-blast water wall. Int. J. Impact Eng. 2015, 81, 17–33. [Google Scholar] [CrossRef]
  20. Eslami, M.; Keshavarz, M.M.P.; Khalilpour, H.; Parsa, H.; Kodure, V. Experimental and numerical investigation of blast wave attenuation by using barriers in different configurations and shapes. J. Struct. Eng. 2023, 149, 04022224. [Google Scholar] [CrossRef]
  21. Rose, T.A.; Smith, P.D.; Mays, G.C. The effectiveness of walls designed for the protection of structures against airblast from high explosives. Struct. Build. 1995, 110, 78–85. [Google Scholar] [CrossRef]
  22. Michaloudis, G.; Gebbeken, N. Modeling masonry walls under far-field and contact detonations. Int. J. Impact Eng. 2019, 123, 84–97. [Google Scholar] [CrossRef]
  23. Hájek, R.; Foglar, M. The reduction of peak overpressure using concrete blast barriers. WIT Trans. Built Environ. 2014, 141, 265–275. [Google Scholar] [CrossRef]
  24. MohottiCA1, D.; Wijesooriya, K.; Fernando, P.L.N.; Nishshanka, B.; Lee, C.K.; Remmenikov, A. Experimental investigation of band-beam slabs subjected to close-range blast loading. Eng. Struct. 2024, 309, 118075. [Google Scholar] [CrossRef]
  25. Mario, J.; Draganić, H.; Gazić, G.; Lukić, S. Post-blast residual static capacity of retrofitted reinforced concrete slabs. Eng. Struct. 2023, 286, 116161. [Google Scholar] [CrossRef]
  26. Park, D.; Lee, T.H.; Lee, Y.; Choi, Y.; Hong, J.W. Blast simulations of a reinforced concrete slab using the continuous surface cap model (CSCM). J. Build. Eng. 2024, 96, 110603. [Google Scholar] [CrossRef]
  27. Yankelevsky, D.Z.; Schwarz, S.; Brosh, B. Full scale field blast tests on reinforced concrete residential buildings-from theory to practice. Int. J. Prot. Struct. 2013, 4, 565–590. [Google Scholar] [CrossRef]
  28. Kim, H.J.; Hwang, K.; Yoon, Y.H.; Lee, H.J. Numerical analysis of the effect of afterburning on damage to the concrete structure under interior explosion. Int. J. Concr. Struct. Mater. 2022, 16, 6. [Google Scholar] [CrossRef]
  29. Lina, M.; López, A.P.; Anastasio, P.; Santos, A.P.; Diego, Y.G.; Castedo, R.; Chiquito, M. Experimental response and numerical modelling of a full-scale two-span concrete slab frame subjected to blast load. Eng. Struct. 2023, 296, 116969. [Google Scholar] [CrossRef]
  30. Park, Y.; Kim, K.; Park, S.W.; Yum, S.G.; Baek, J.W. Experimental evaluation on blast resistance of reinforced concrete structures under partially confined explosion. Int. J. Concr. Struct. Mater. 2024, 18, 11–13. [Google Scholar] [CrossRef]
  31. Gao, C.; Zong, Z.H.; Wu, J. Experimental study on progressive collapse failure of RC frame structures under blast loading. China Civ. Eng. J. 2013, 46, 9–20. (In Chinese) [Google Scholar] [CrossRef]
  32. Yang, J.; Hao, Y.; Peng, D.; Shi, J.; Zhang, Y. Machine learning-based methods for predicting the structural damage and failure mode of RC slabs under blast loading. Buildings 2025, 15, 1221. [Google Scholar] [CrossRef]
  33. Zhou, X.Q.; Huang, B.G.; Wang, X.Y.; Xia, Y. Deep learning-based prediction of structural responses of RC slabs subjected to blast loading. Eng. Struct. 2024, 311, 118184. [Google Scholar] [CrossRef]
  34. Zhao, C.F.; Zhu, Y.F.; Zhou, Z.H. Machine learning-based approaches for predicting the dynamic response of RC slabs under blast loads. Eng. Struct. 2022, 273, 115104. [Google Scholar] [CrossRef]
  35. Sagaseta, J.; Olmati, P.; Micallef, K.; Cormie, D. Punching shear failure in blast-loaded RC slabs and panels. Eng. Struct. 2017, 147, 177–194. [Google Scholar] [CrossRef]
  36. Gao, Z.; Chen, Y.Q.; Wang, Z.Q.; Li, S.; Wei, W.; Huang, C. Study on the failure effect of aramid reinforced concrete slab under localized blast loading. Structures 2024, 63, 106292. [Google Scholar] [CrossRef]
  37. Yao, S.J.; Zhang, D.; Chen, X.G.; Lu, F.; Wang, W. Experimental and numerical study on the dynamic response of RC slabs under blast loading. Eng. Fail. Anal. 2016, 66, 120–129. [Google Scholar] [CrossRef]
  38. Lukić, S.; Draganić, H.; Grubeša, I.N.; Gazić, G. Influence of blast load on the bond characteristic of retrofitted RC slabs. Constr. Build. Mater. 2022, 319, 126094. [Google Scholar] [CrossRef]
  39. Maazoun, A.; Matthys, S.; Atoui, O.; Belkassem, B.; Lecompte, D. Finite element modelling of RC slabs retrofitted with CFRP strips under blast loading. Eng. Struct. 2022, 252, 113597. [Google Scholar] [CrossRef]
  40. Liao, Y.; Shi, S.Q.; Chen, S.; Ming, X.; Ge, L. Numerical evaluation of the retrofit effectiveness for polyurea-woven glass fiber mesh composite retrofitted RC slab subjected to blast loading. Structures 2022, 36, 215–232. [Google Scholar] [CrossRef]
  41. Wu, J.; Yan, Q.S. Structural design and damage assessment of a chamber for internal blast with explosion vent. Mech. Adv. Mater. Struct. 2020, 27, 2052–2058. [Google Scholar] [CrossRef]
  42. Anderson, J.R.; Baker, W.E.; Wauters, D.K.; Morris, B.L. Quasi-static pressure, duration, and impulse for explosions (e.g., HE) in structures. Int. J. Mech. Sci. 1982, 25, 455–464. [Google Scholar] [CrossRef]
  43. Esparza, E.D.; Baker, W.E.; Oldham, G.A. Blast Pressures Inside and Outside Suppressive Structures; Southwest Research Institute: San Antonio, TX, USA, 1975. [Google Scholar]
  44. Weibull, H.R.W. Pressures recorded in partially closed chambers at explosion of TNT charges. Ann. N Y Acad. Sci. 1968, 152, 357–361. [Google Scholar] [CrossRef]
  45. Li, J.R.; Lu, Y.G.; Feng, X.W.; Wu, H. Analysis of Internal Explosion Load Characteristics and Dynamic Behavior in RC Box Structures. Explos. Shock Waves 2025, 4, 1–18. (In Chinese) [Google Scholar] [CrossRef]
  46. Tascon, A. Design of silos for dust explosions: Determination of vent area sizes and explosion pressures. Eng. Struct. 2017, 134, 1–10. [Google Scholar] [CrossRef]
  47. Qing, C.; Cheng, J.; Wang, Y.; Xie, T. Effect of burst pressure and vented area on vented hydrogen explosions. J. Therm. Anal. Calorim. 2024, 1–13. [Google Scholar] [CrossRef]
  48. Song, S.C.; Han, Z.W.; Li, Y.N.; Li, J.; Wang, J.; Zhao, Y.; He, G.; He, B.; Wang, B. Influence of Vent Area on Aluminized Explosive Behavior in Fast Cook-off. Propellants Explos. Pyrotech. 2025, 50, 12038. [Google Scholar] [CrossRef]
  49. Chen, Q.; Zhao, K.; Li, B.; Zhang, D.; Mensah, R.A.; Das, O.; Xie, L.; Wang, Y. Effect of hydrogen concentration, vented area, and vented shape on vented hydrogen-air explosions and its consequence analysis. Exp. Therm. Fluid Sci. 2025, 167, 111484. [Google Scholar] [CrossRef]
  50. Shi, Y.C.; Xiong, W.; Li, Z.X.; Xu, Q. Experimental studies on the local damage and fragments of unreinforced masonry walls under close-in explosions. Int. J. Impact Eng. 2016, 90, 122–131. [Google Scholar] [CrossRef]
  51. Chen, D.; Wu, H.; Fang, Q. Simplified micro-model for brick masonry walls under out-of-plane quasi-static and blast loadings. Int. J. Impact Eng. 2023, 174, 104529. [Google Scholar] [CrossRef]
  52. Chen, G.Q.; Lu, J.X.; Wu, H. Dynamic behavior and retrofitting of RC frame building under vehicular bomb explosion. Eng. Fail. Anal. 2023, 143, 106925. [Google Scholar] [CrossRef]
  53. Chen, D.; Wu, H.; Cheng, Y.H. Dynamic behaviors of unreinforced and spray polyurea retrofitted brick masonry infill walls under blast loads: Shock tube test and analyse. Int. J. Impact Eng. 2024, 190, 104975. [Google Scholar] [CrossRef]
  54. GB 50010-2010; Code for Design of Concrete Structures. China Architecture & Building Press: Beijing, China, 2015.
  55. GB 50011-2010; Code for Seismic Design of Buildings. China Architecture & Building Press: Beijing, China, 2010.
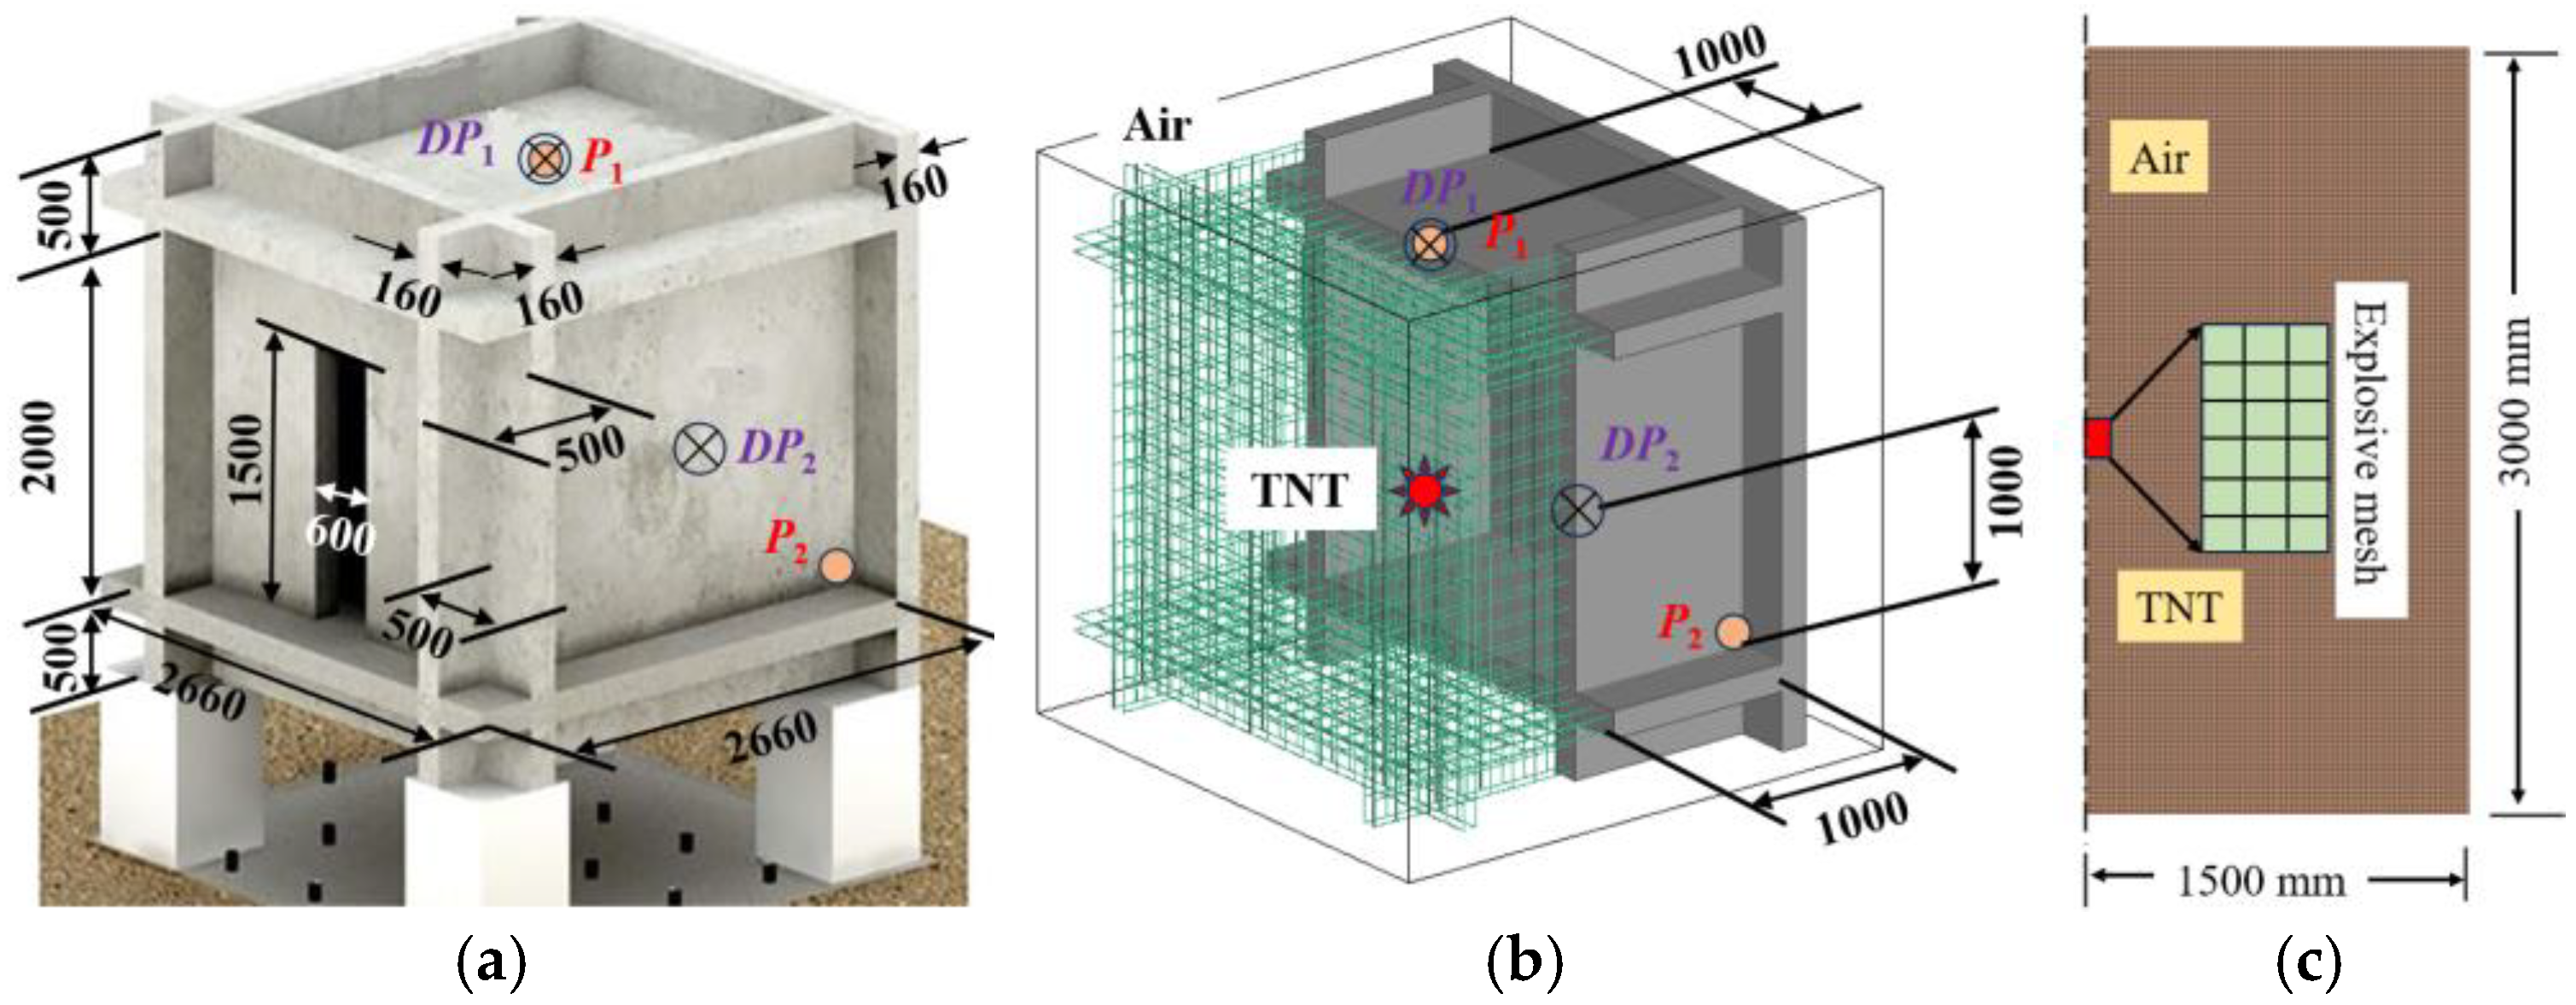
Figure 1. Internal explosion tests on RC structure with openings: (a) structure dimension; (b) 3D FE model; (c) 2D FE model.
Buildings 15 02080 g001
Figure 2. Comparisons of simulated and experimental results: (a) P1, Test-1; (b) P2, Test-1; (c) P1, Test-2; (d) P1, Test-4; (e) DP1, Test-1; (f) DP2, Test-1.
Buildings 15 02080 g002
Figure 3. Dynamic pressure distributions inside the RC structure: (a) 0.4 ms; (b) 0.6 ms, T1; (c) 1.2 ms, T2; (d) 2.0 ms, T3; (e) 4.0 ms, T4; (f) 8.0 ms.
Buildings 15 02080 g003
Figure 4. Comparison of simulated and experimental damage to RC structure: (a) Test 1; (b) Test 2.
Buildings 15 02080 g004
Figure 5. Close-in explosion tests on masonry walls: (a) test layout; (b) 3D FE model.
Buildings 15 02080 g005
Figure 6. RHT model and contact model: (a) three limit surfaces; (b) cohesive contact model.
Buildings 15 02080 g006
Figure 7. Comparison of simulated and experimental structural failure modes: (a) T = 10 ms and T = 30 ms; (b) blast-facing surface, Test 3; (c) blast-rear surface, Test 3; (d) T = 10 ms and T = 30 ms; (e) blast-facing surface, Test 4; (f) blast-rear surface, Test 4.
Buildings 15 02080 g007
Figure 8. Prototypical RC frame structures, mm: (a) η = 0.0; (b) η = 0.654; (c) η = 1.309; (d) η = 2.618; (e) RC column; (f) RC wall; (g) RC slab; (h) layout of overpressure and velocity sensors.
Buildings 15 02080 g008
Figure 9. Dynamic pressure distributions inside the RC structures for 100 kg TNT: (a) scenario 2, T = 2, 4, 8, 16, and 32 ms; (b) scenario 14, T = 2, 4, 8, 16, and 32 ms.
Buildings 15 02080 g009
Figure 10. Overpressure-time and impulse-time history curves at the center of the roof slab in Room 1: (a) η = 0; (b) η = 2.618.
Buildings 15 02080 g010
Figure 11. Overpressure-time and impulse-time history curves at the center of the roof slab in Room 2: (a) η = 0; (b) η = 2.618.
Buildings 15 02080 g011
Figure 12. Failure process of the RC structures: (a) scenario 2 at 20, 40, 60, 80, and 100 ms; (b) scenario 14 at 20, 50, 100, 300, and 500 ms.
Buildings 15 02080 g012
Figure 13. Velocity-time history curves of roof slabs: (a) scenario 2; (b) scenario 14.
Buildings 15 02080 g013
Figure 14. Attenuation coefficients in explosion source room: (a) impulse; (b) roof ejection velocity.
Buildings 15 02080 g014
Figure 15. Attenuation coefficients of power parameters in the vertically adjacent room: (a) peak overpressure; (b) impulse; (c) roof ejection velocity.
Buildings 15 02080 g015aBuildings 15 02080 g015b
Table 1. Mesh sizes of the FE models for each explosion scenario.
Test No.TNT Equivalents
(kg)
Equivalent Explosive Mesh Density [45]2D Finite Element Model3D Finite Element Model
TNT Mesh (mm)Air Mesh (mm)TNT Mesh
(mm)
Air Mesh (mm)Structure Mesh (mm)
Kim et al. [28]Test-12.0255.8107 × 10716 × 16/24 × 24 × 2424 × 24 × 24
Test-23.0255.8//122 × 122 × 12224 × 24 × 2424 × 24 × 24
Shi et al. [50]Test-31.0255.885 × 8513 × 13/36 × 36 × 3636 × 36 × 36
Test-46.0255.8//154 × 154 × 15436 × 36 × 3636 × 36 × 36
Table 2. Parameters of material models and cohesive contact model [51,52,53].
Concrete (*MAT_CONCRETE_DAMAGE_REL3)
Density
(kg·m−3)
Compressive strength fc (MPa)Maximum failure principal strain
240040.0/5.00.3
Rebar (*MAT_PLASTIC_KINMATIC)
Density
(kg·m−3)
Elasticity modulus GPaPoisson ratioYield strength (MPa)Strain rate effect C (s−1)Strain rate parameter PFailure strain
78002060.3450 (400)4050.14
TNT (*MAT_HIGH_ENERGY_BURN&EOS_JWL)
Density
(kg·m−3)
Detonation velocity D (m·s−1)Burst pressure (GPa)A/GPaB/GPaR1R2 ω Initial energy
E0 (J·m−3)
16306930213703.7474.150.90.357 × 109
Air (*MAT_NULL&*EOS_LINEAR_POLYNOMIAL)
Density
(kg·m−3)
Initial energy
E0 (J·m−3)
Dynamic viscosity
coefficient
Pressure cutoff Pc (MPa)C0, C1, C2, C3, C6C4, C5
1.292.5 × 1050000.4
Masonry wall (*MAT_RHT)
Density
(kg·m−3)
Initial porosity α0Crush pressure Pel (MPa)Compaction pressure Pcomp (MPa)Porosity exponentElasticity modulus E (GPa)Poisson ratio v
18001.32402.531.440.2
βCompressive strength fc (MPa)Relative shear strength fc*Shear strength ft*Reference tensile strain rate (s−1)Conversion strain rate (s−1)
0.012445.430.270.541 × 10−530
*CONTACT_AUTOMATIC_SURFACE_TO_SURFACE_TIEBREAK(OPTION = 9)
Normal stiffness
(MPa·mm−1)
Tangential stiffness
(MPa·mm−1)
Normal
strength (MPa)
Tangential
strength (MPa)
Normal fracture energy (MPa·mm)Tangential fracture energy (MPa·mm)λ
8203520.320.560.010.027−2
Table 3. Comparison of simulated and experimental damage area.
Parameters1 kg TNT6 kg TNT
Blast-Facing SurfaceBack-Blast SurfaceBlast-Facing SurfaceBack-Blast Surface
Simulation320 mm × 180 mm400 mm × 300 mm520 mm × 580 mm900 mm × 900 mm
Experiment370 mm × 190 mm360 mm × 330 mm500 mm × 500 mm920 mm × 930 mm
Error−18.1%1.0%18.6%−5.33%
Table 4. Design of explosion scenarios.
ScenarioS (m2) η TNT Equivalent (kg)ScenarioS (m2) η TNT Equivalent (kg)
100.00020941.681.30920
200.0001001041.681.309100
300.0003001141.681.309300
400.0005001241.681.309500
527.780.654201355.572.61820
627.780.6541001455.572.618100
727.780.6543001555.572.618300
827.780.6545001655.572.618500
Disclaimer/Publisher’s Note: The statements, opinions and data contained in all publications are solely those of the individual author(s) and contributor(s) and not of MDPI and/or the editor(s). MDPI and/or the editor(s) disclaim responsibility for any injury to people or property resulting from any ideas, methods, instructions or products referred to in the content.