Article

Alkali-Activated Slag–Fly Ash–Desert Sand Mortar for Building Applications: Flowability, Mechanical Properties, Sulfate Resistance, and Microstructural Analysis

1
School of Civil Engineering and Architecture, Xinjiang University, Urumqi 830047, China
2
Xinjiang Civil Engineering Technology Research Center, Urumqi 830017, China
3
School of Civil Engineering, Xinjiang Institute of Engineering, Urumqi 830091, China
4
College of Civil and Transportation Engineering, Hohai University, Nanjing 210024, China
*
Author to whom correspondence should be addressed.
Buildings 2025, 15(12), 2069; https://doi.org/10.3390/buildings15122069
Submission received: 12 April 2025 / Revised: 5 June 2025 / Accepted: 12 June 2025 / Published: 16 June 2025
(This article belongs to the Topic Resilient Civil Infrastructure, 2nd Edition)

Abstract

This study investigates the performance of alkali-activated mortar incorporating slag, fly ash, and desert sand, with a focus on flowability, mechanical properties, sulfate resistance, and microstructural characteristics. A four-factor, three-level orthogonal experimental design was used to analyze the effects of the fly ash substitution rate, alkali content (Na2O/b), activator modulus, and desert sand replacement rate for natural sand. The results indicate that increased slag and desert sand contents reduce mortar flowability. Despite this, the mortar exhibits excellent mechanical strength, with compressive strength reaching 77.7 MPa at 28 days and increasing to 89.34 MPa under sulfate exposure. However, after 120 days of sulfate erosion, a decline in strength is observed due to the formation of expansive products such as gypsum and caliche, leading to cracking. Microstructural analyses (XRD, SEM/EDS, MIP) reveal partial dissolution of desert sand under alkali activation, enhancing gel formation and reducing cumulative porosity. The pore structure predominantly consists of harmless pores. These findings demonstrate the potential of slag–fly ash–desert sand alkali-activated mortar as a durable and sustainable material for structural and construction engineering applications, especially in sulfate-rich environments or arid regions where desert sand is abundant.

1. Introduction

The production of ordinary Portland cement (OPC) contributes significantly to global carbon emissions, accounting for approximately 5–8% of annual emissions, with nearly one ton of CO2 released per ton of cement produced [1,2]. Furthermore, the extraction of natural resources has triggered environmental degradation, including desertification, erosion, and loss of vegetation cover [3,4]. Desert regions, expanding by 1560 km2 per year, offer abundant desert sand (DS), which could serve as a sustainable alternative to natural aggregates in construction. Utilizing DS in building materials may reduce reliance on river sand and help mitigate the adverse impacts of desertification.
Previous studies have explored the feasibility of DS in concrete. Liu et al. demonstrated the potential of desert sand powder as a supplementary cementitious material (SCM) through experimental and life cycle analyses [5]. Guettala revealed that up to 20% of Portland cement can be successfully substituted for dune sand powder without compromising compressive strength [6]. Hamada et al. examined its influence on the mechanical and microstructural properties of sustainable concrete [7]. Luo et al. further compared dune sand concrete (DSC) and plain concrete to highlight the unique behavior of DS-based materials [8]. Kai focused on screening desert sand particles (SDSs) with a size of less than 75 μm. The study showed that the strength of the mortar increases with the increase in SDS content [4].
Alkali-activated cementitious materials (AAMs) present a low-carbon alternative to OPC, offering fast strength gain, high ultimate strength, and strong durability [9,10,11]. Sulfate erosion remains a critical challenge for building applications [12,13]. Studies by Wang, Ye et al., and Zhang et al. have examined the sulfate resistance of various AAM systems and their differences from OPC in terms of degradation mechanisms [14,15]. Xia et al. investigated the performance of alkali-activated mortars containing DS and fly ash, focusing on flowability and mechanical properties [16]. However, few studies have addressed the long-term sulfate resistance of DS-based AAMs, which is essential for structural durability in buildings.
This study systematically investigated the comprehensive performance of slag–fly ash–desert sand alkali-activated mortar, with a focus on flowability, mechanical strength, sulfate resistance, and microstructural characteristics. A four-factor, three-level orthogonal experimental design was employed to analyze the influence patterns of fly ash substitution rate, alkali content (Na2O/b), activator modulus, and desert sand replacement rate. These results support the potential of desert sand-based alkali-activated mortars for sustainable and durable building applications, especially in sulfate-rich or arid regions.

2. Materials and Experimental Procedure

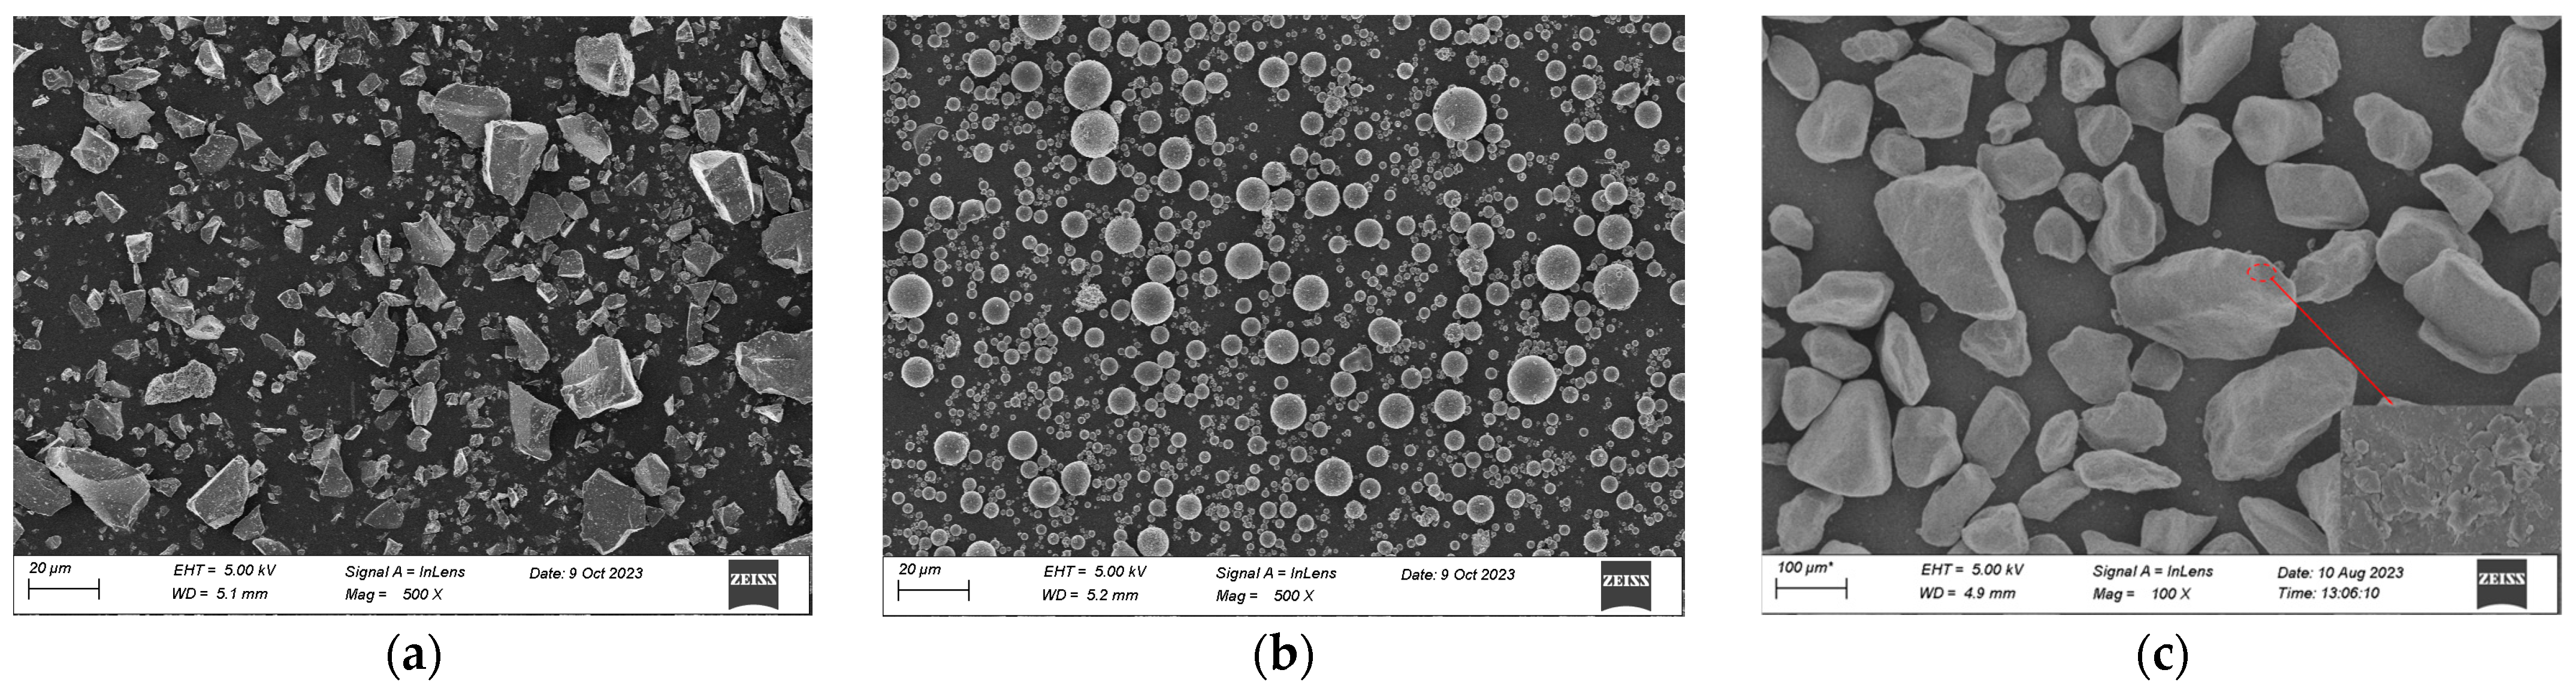
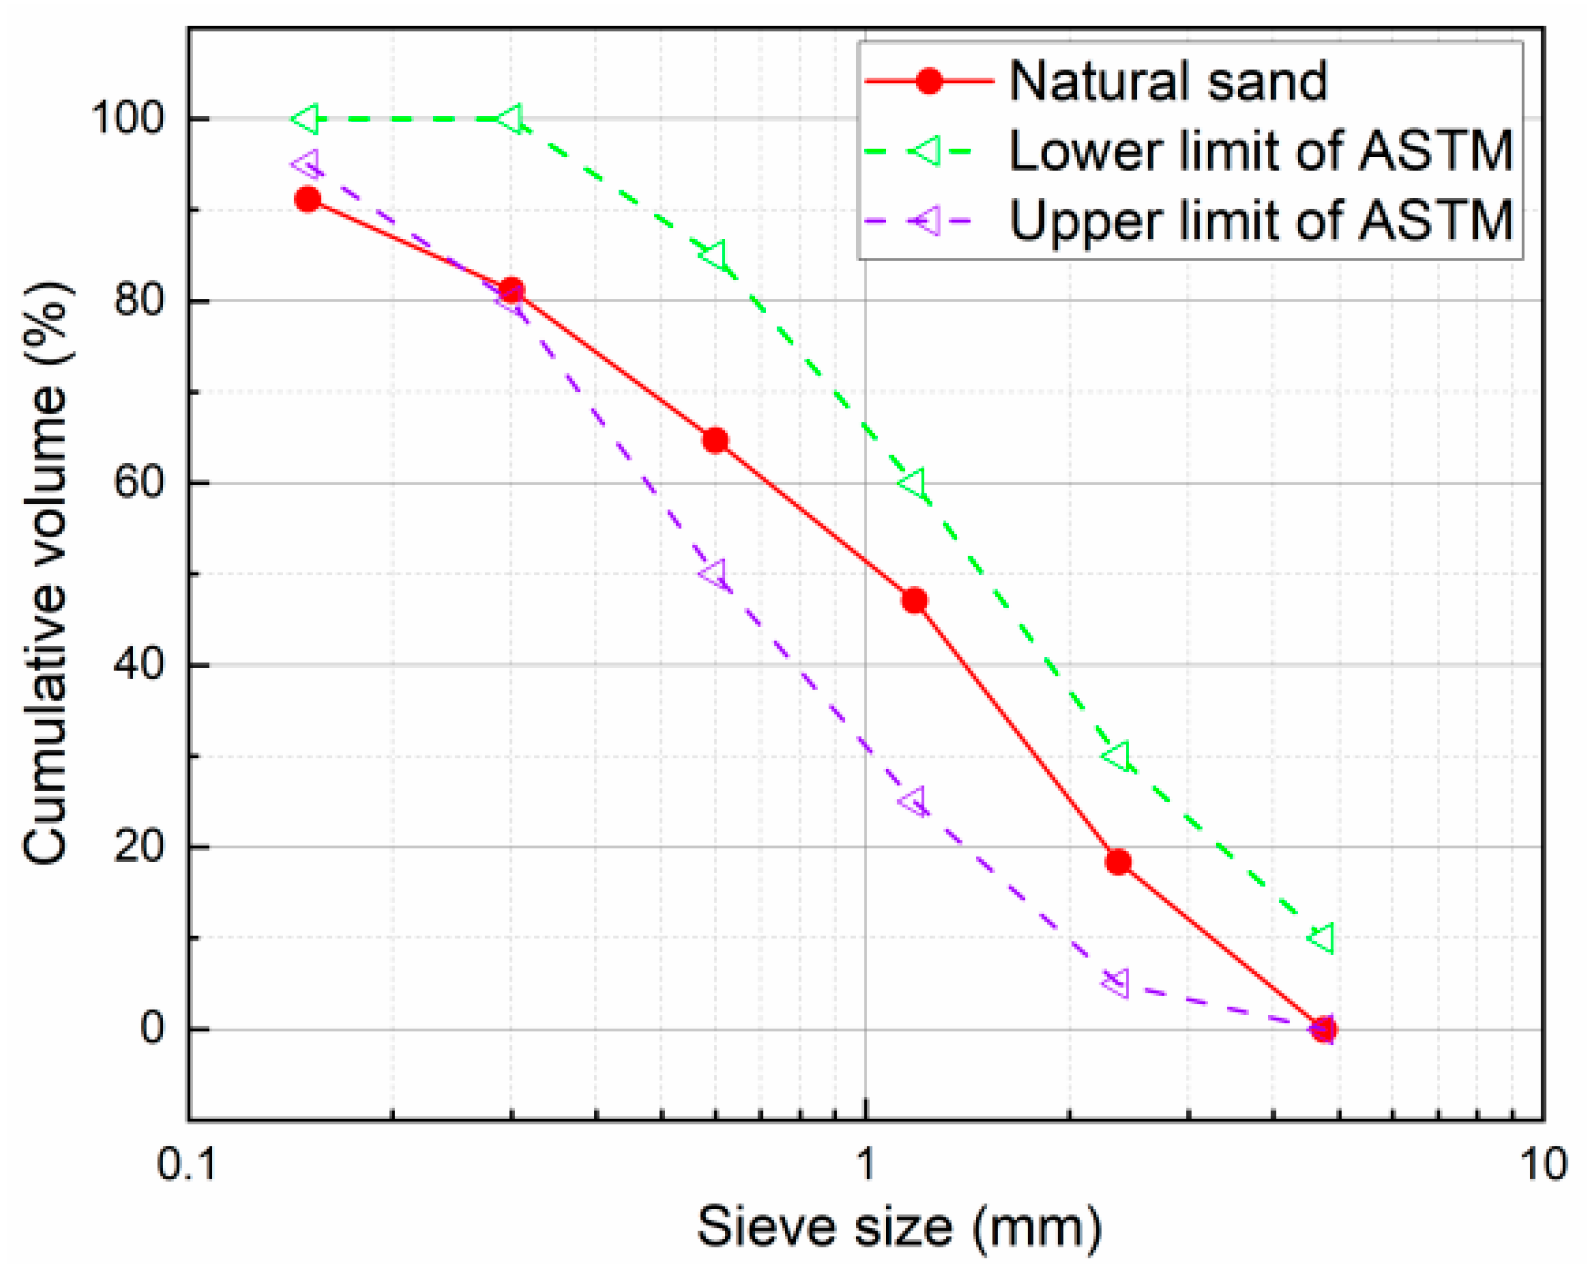
2.1. Solid Precursors

In this study, S75 grade ground granulated blast slag (GGBS) and fly ash (FA) were used as precursors; desert sand (DS) originating from the Taklamakan Desert in Xinjiang, China, was employed as a fine aggregate to partially replace natural sand. The density of DS is 2632 kg/m3, with a fineness modulus of 0.11 and a water absorption rate of 4.15%. The natural fine aggregate exhibited a particle size range of 0–4.75 mm, a fineness modulus of 3.22, and a water absorption rate of 2.2%. This sand falls within the category of coarse sand, with a density of 2586 kg/m3. The oxide compositions of FA, GGBS, and DS are detailed in Table 1. The CaO content in FA is 5.18%, and it belongs to Class F fly ash according to GB/T 1596-2017 (Chinese Standard), Fly Ash Used in Cement and Concrete [17]. The scanning electron microscopy (SEM) images of the raw materials are shown in Figure 1. In contrast to the irregularly shaped and sized particles of GGBS, FA consists of spherical particles with varying sizes. The particle gradation of DS is predominantly irregular and oval, with better roundness characteristics. The particle size distributions of FA, GGBS, natural sand, and DS were measured using a Malvern Master sizer 2000 laser particle size analyzer, and the results are presented in Figure 2 and Figure 3. The mineral phases of GGBS, FA, and DS were identified by X-ray diffraction (XRD), as shown in Figure 4. The broad humps at 2θ = 20–35° indicate the significant presence of amorphous phases in GGBS. Quartz, berlinite, and magnesium oxide were detected in FA. Quartz is the primary mineral phase in DS, accompanied by minor albite and probertite; thus, DS exhibits high crystallinity.

2.2. Alkali Activating Solution

The alkali-excited solution consists of a sodium silicate (Na2SiO3) solution, NaOH, and water. In this test, the modulus of the sodium silicate solution (M = n(SiO2)/n(Na2O), representing the ratio of the amount of substance of SiO2 to Na2O) was 3.12, with Na2O and SiO2 contents of 8.7% and 26.4%, respectively. NaOH utilized was in the form of granular with a minimum purity of 96%. By adding NaOH to the sodium silicate solution, the solution can be configured for various parameters. The preparation of the alkali activation solution took place one day prior to the experiment. Following configuration, the solution was allowed to remain at ambient temperature in order to facilitate the dissipation of heat resulting from the reaction between NaOH and sodium silicate solution.

2.3. Test Scheme and Sample Production

Based on extensive prior experimental studies, the strength of alkali-activated mortar is primarily influenced by the dosage of precursor materials, alkali equivalent, and water–glass modulus. Therefore, this study considered factors such as fly ash replacement rate of slag, desert sand substitution rate of natural sand, alkali equivalent, and alkali activator modulus. A three-level, four-factor orthogonal test scheme L9(34) was designed, comprising a total of 9 mixing ratios from G1 to G9 (detailed in Table 2 and Table 3), without considering interactions between factors. The orthogonal test scheme is chosen as a statistical method in empirical studies to efficiently analyze input parameters, filter key effects, and simplify experimental condition optimization with fewer experiments [18]. The test outcomes were analyzed using range analysis. Based on the team’s prior tests, when the fly ash replacement rate of slag is 0–40%, Na2O/b (alkali equivalent) is 6–10%, the alkali activator modulus is 1.2–1.6, and the desert sand content in mortar is 0–40%, the mortar exhibits excellent workability and mechanical properties. Therefore, the water–binder ratio was set at 0.5, the fly ash replacement rates were set at 0%, 20%, and 40%, the desert sand substitution rates were also set at 0%, 20%, and 40%, the alkali equivalents of water glass (calculated as Na2O) were designated as 6%, 8%, and 10%, paired with moduli of 1.2, 1.4, and 1.6, respectively. In this scheme, A represents the fly ash replacement rate of slag, B signifies Na2O/b, C denotes the water–glass modulus, and D indicates the desert sand substitution rate.
All powder materials were first added to a mixer and mixed at low speed for 2 min. Subsequently, the pre-prepared alkali activator solution was introduced and mixed at low speed for 30 s. Finally, desert sand was rapidly added and mixed for 90 s to ensure thorough homogenization. The freshly mixed alkali-activated mortar was cast into 40 mm × 40 mm × 160 mm molds in two layers, vibrated on a shaking table for 1 min to eliminate air bubbles, and then transferred to a standard curing chamber (maintained at 20 ± 2 °C, RH95%) for curing. After 24 h, the specimens were demolded, labeled, and returned to the standard curing chamber for further curing until the target test age. The molded mortar specimens were cured in the standard curing room for 28 days, after which their compressive strength and flexural strength were first measured. The remaining specimens were subjected to erosion tests by immersing them in water and a 5% sodium sulfate solution (by mass). The sulfate solution was replaced monthly, and the specimens were removed at erosion ages of 30 days, 60 days, 90 days, and 120 days. The evaluation of compressive and flexural strengths of the alkali-activated cementitious materials was conducted in accordance with the specifications outlined in “Test Method for Strength of Cementitious Sand (ISO Method)” (GB/T17671-2021) [19].

2.4. Testing and Characterization

2.4.1. Flowability

The flowability of the alkali-activated mortar was tested according to GB/T 2419-2005 (Chinese Standard) [20]. First, the fresh mortar was poured into a truncated cone mold (60 × 70 × 100 mm, i.e., with a top diameter of 60 mm, bottom diameter of 70 mm, and height of 100 mm), with each layer filled to a 5 mm thickness and compacted layer by layer. The mold was then carefully lifted vertically, followed by vibrating at a frequency of 1 Hz for 25 cycles, after which the spread diameter of the mortar was measured.

2.4.2. Flexural and Compressive Strength

The three-point bending test was used to determine the flexural strength of prismatic specimens. Three prismatic specimens from each group were tested at corresponding ages, and the average flexural strength results were obtained from these tests. Subsequently, the fractured parts of the prisms were used for the compressive strength test, with a loading area of 40 mm × 40 mm. Both the flexural strength and compressive strength tests were conducted in accordance with the Chinese standard GB/T 17671-2021 [19]. It should be noted that the compressive testing machine had a loading capacity of 100 kN, and the loading rate was maintained at (2.4 ± 0.2) kN/s. Additionally, the span for the flexural test was 100 mm, and the loading speed was set at (50 ± 10) N/s.

2.4.3. Microstructural Features

The morphological features of the samples were examined using an SEM (ZEISS Sigma 300, Carl Zeiss AG, Jena, Germany) equipped with an EDS analyzer. Furthermore, the crystalline phase was analyzed using XRD (Bruker D8 Advance, Bruker AXS GmbH, Karlsruhe, Germany) with parameters set within the range of 5° to 90° 2θ at a rate of 5°/min. The pore size distribution of the samples was investigated using an Auto Pore IV 9500 (Norcross, USA) Mercury Infiltration Pore Test (MIP) under pressures ranging from 0.2 to 60,000 psi.

3. Results and Discussion
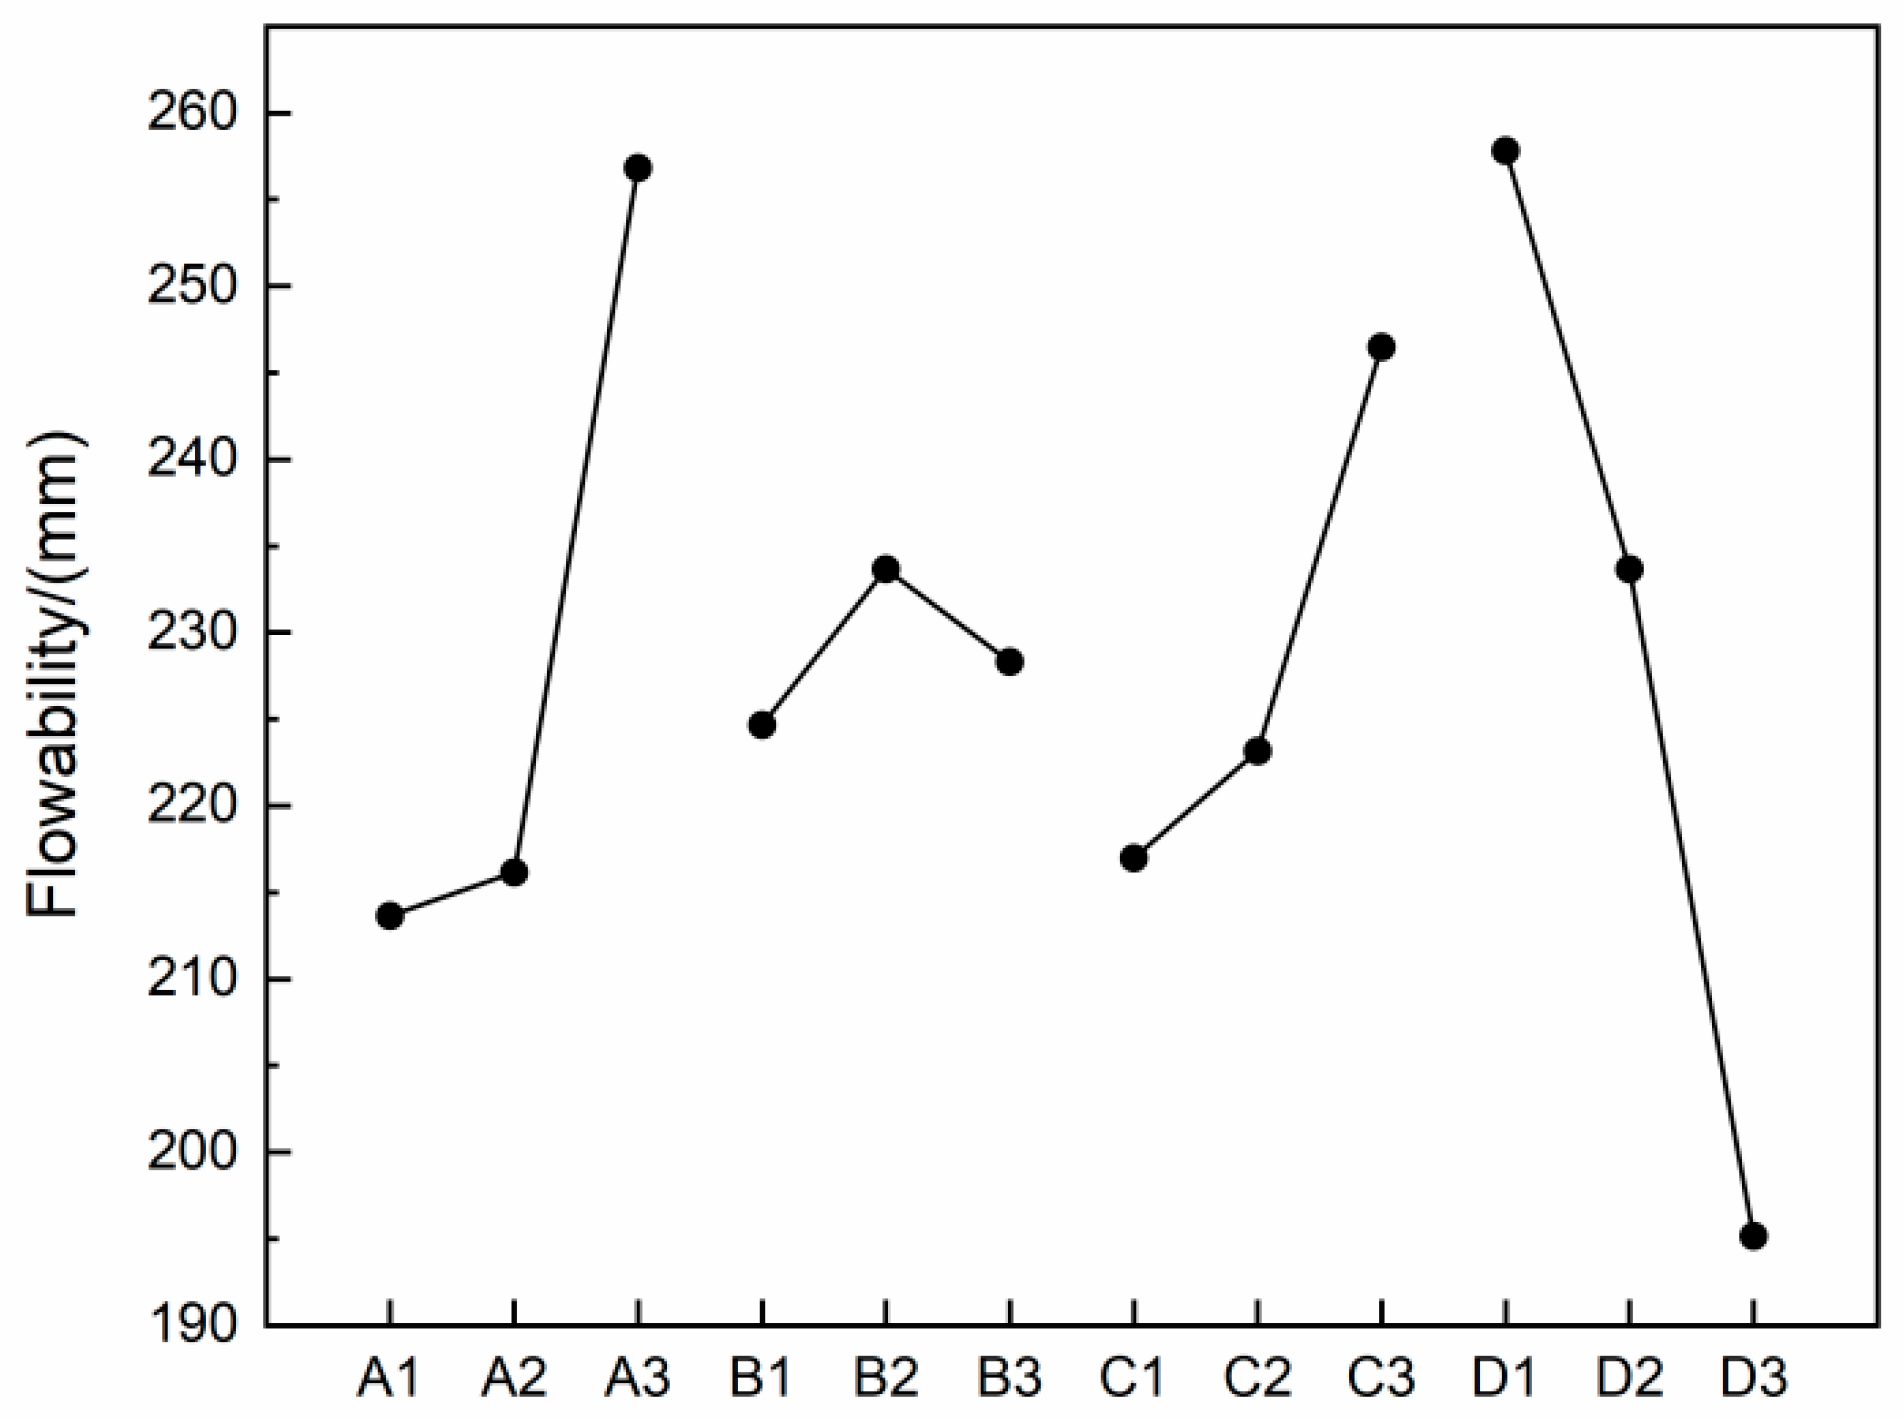
The analysis of the test results employed the range analysis method of orthogonal experiments. Taking the horizontal factor A as an example, Ki represents the sum of the data for different levels under factor A, ki denotes the average value of the data for different levels under factor A, and R is the difference between the maximum and minimum values of ki. By comparing the R values, the primary and secondary factors can be intuitively determined, and the optimal combination of levels can be derived through a smaller number of test groups.

3.1. Flowability

Table 4 and Figure 5 show the results of a range analysis of variance by orthogonal test. As the desert sand substitution rate increased from 0% to 20% and to 40%, there were corresponding decreases in the flowability rate by 9.4% and 24.3%, respectively. This phenomenon can be attributed to several factors: (1) the smaller fineness modulus of desert sand compared to natural sand leads to a larger surface area for desert sand. Consequently, the water absorption rate of desert sand is higher than that of natural sand; (2) the excess fine particles of desert sand, unable to effectively fill the pores during mixing, tend to absorb water from the adsorbed layer on their surfaces. This, in turn, diminishes the amount of free water that they absorb and ultimately reduces the mobility of the mixture; (3) the particle size distribution and shape of desert sand differ from those of natural sand. Desert sand typically features smaller particle sizes compared to natural sand, resulting in greater dry packing density and wet packing density. As a result, this inhibits the complete ingress of free water into the mixture, further contributing to a reduction in the mobility of the mixture [21,22,23].
Furthermore, an increase in the fly ash replacement rate from 20% to 40% yielded an 18.8% enhancement in mortar flowability, owing to the improved flow dynamics facilitated by the ball-bearing effect of the spherical fly ash particles [24]. However, the irregular shape of GGBS particles contributes to increased friction between the particles, leading to decreased flowability with the increasing content of GGBS [25]. Additionally, the highly reactive nature of slag, particularly in highly alkaline environments, causes the dissolved Ca2⁺ to rapidly combine with reactive SiO2 in the sodium silicate solution. This combination accelerates dissolution, results in rapid formation of C-(A)-S-H gels, encapsulates surrounding particles, and thereby causes a swift reduction in flowability [26,27].
Moreover, an increase in the alkali exciter modulus from 1.2 to 1.4 resulted in a 2.8% increase in mortar flow, while a subsequent increase from 1.4 to 1.6 led to a 13.5% rise. These outcomes suggest that at lower sodium silicate moduli, minor increases have limited impact on flow owing to the low liquid-to-solid ratio. However, with the modulus of sodium silicate continues increasing, the alkali activation solution is further augmented, promoting enhancement of flow amid particles. Simultaneously, the increased presence of silicate monomers and higher moduli promote greater electrostatic repulsion between particles, preventing flocculation and improving mortar flowability [28]. At higher moduli, a more substantial coating of the precursor particles occurs, mitigating rolling friction and satisfying lubrication, thereby manifesting increased viscosity in the alkali-inspired solution [29].
As the alkali content surged from 6% to 8%, there was a 4% increment in mortar flow, whereas a subsequent increase from 8% to 10% resulted in a 2.28% decline. This flux can be attributed to the sluggish dissolution of silica–aluminate in FA and GGBS when Na2O/b is low. Consequently, weak electrostatic repulsion fosters cluster structure formation between particles, undermining flowability. Conversely, as Na2O/b increases, the dissolved silica–aluminate ions become more adsorbed on the particles, elevating electrostatic repulsion and curtailing cluster formation, thereby enhancing flowability [29,30]. Moreover, a larger solid–liquid ratio, achieved through higher Na2O/b content, results in increased solution envelopment of the raw material, further heightening inter-particle mobility.

3.2. Flexural Strength and Compressive Strength

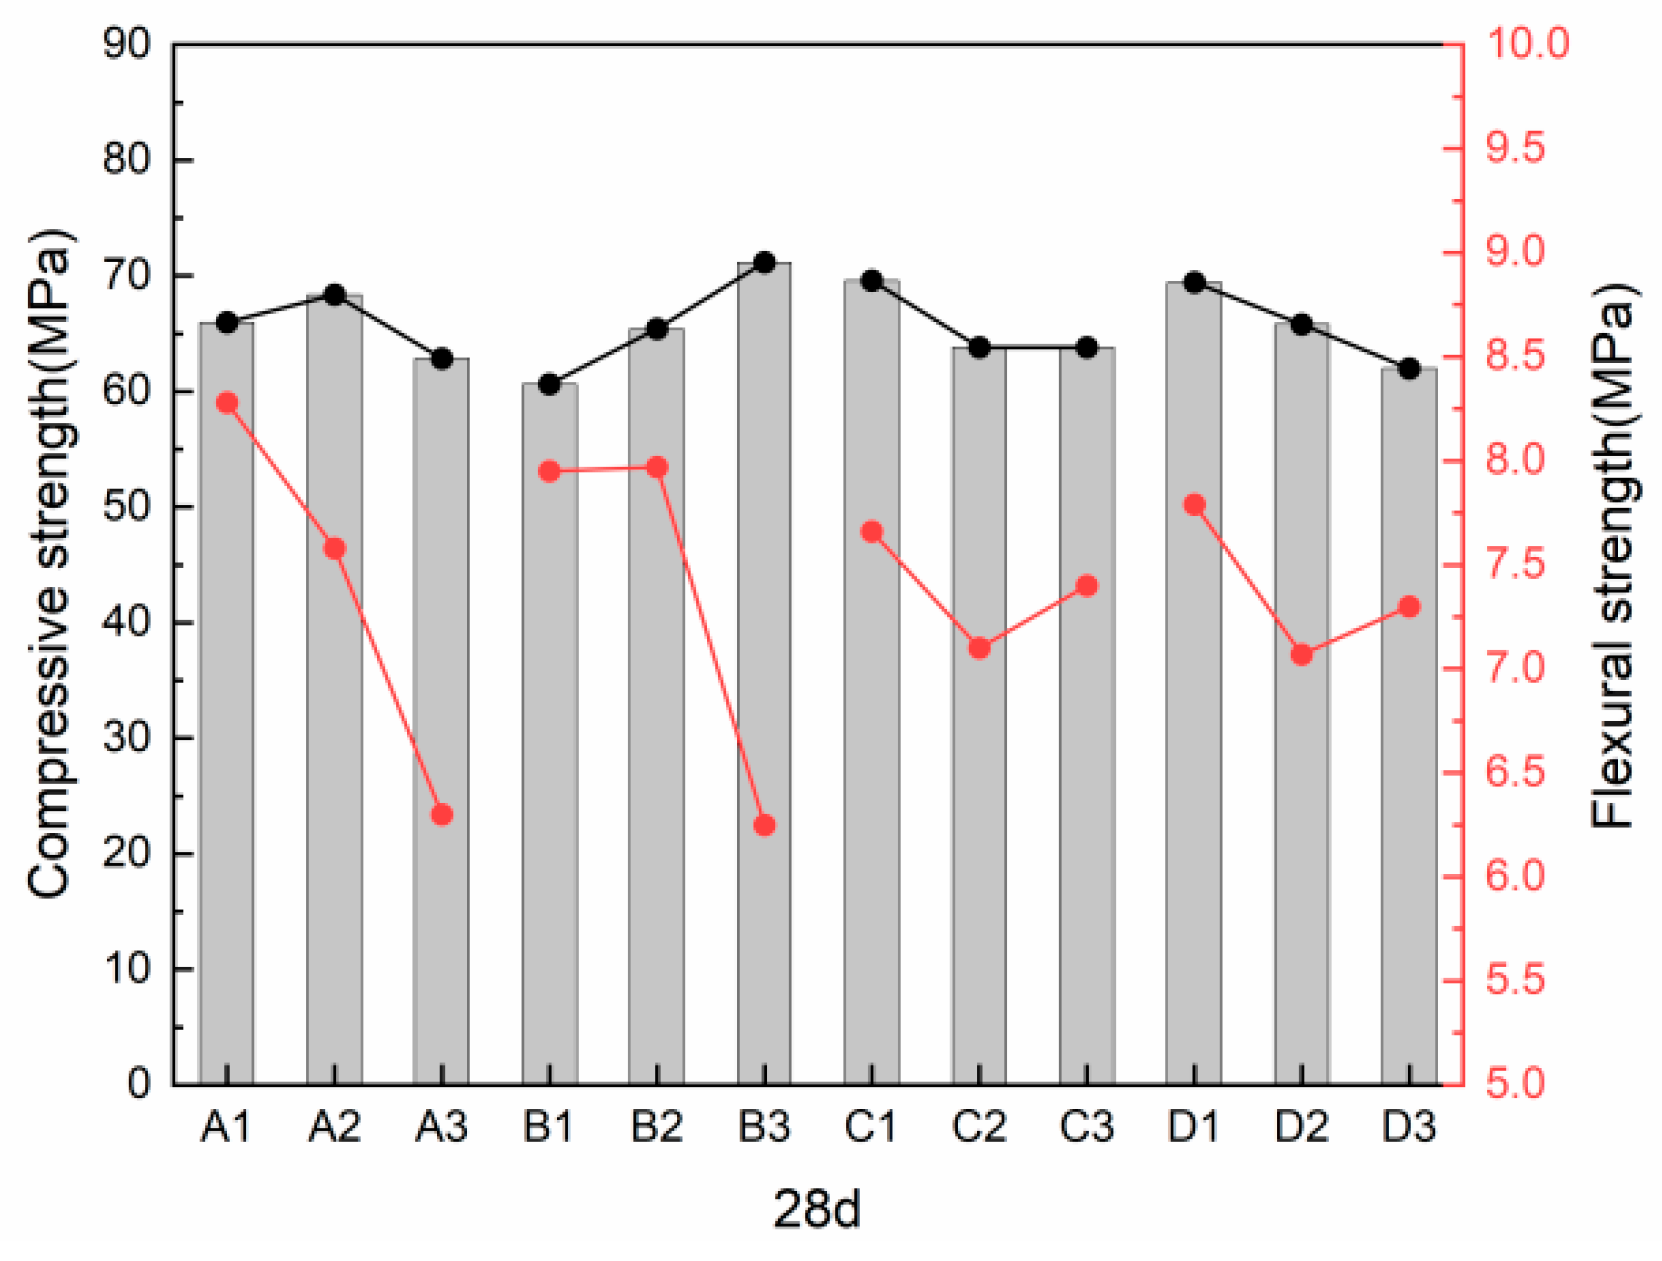
3.2.1. Twenty-Eight-Day Compressive and Flexural Strength

Table 5 and Figure 6 present the flexural and compressive strength of alkali-activated desert sand mortar at 28 days.
The lower activity of fly ash results in incomplete alkali activation reaction, which consequently increases the formation of drying-shrinkage cracks at the early stage, ultimately hindering the development of early flexural strength. When the fly ash substitution rate rises from 0% to 20%, there is an increase in compressive strength, demonstrating the superior compressive strength of alkali-activated slag–fly ash blended cements compared to single ingredient binders, consistent with numerous studies [31,32,33,34]. As the alkali equivalent increases from 6% to 8%, the flexural strength remains relatively unchanged; however, an increase from 8% to 10% results in a 21.58% decrease in flexural strength. This can be attributed to the promotion of C(N)-A-S-H gel formation with increased OH- in the solution, albeit accompanied by limited shrinkage cracking, negatively affecting flexural strength development [35]. An alteration in the compressive and flexural strengths of the specimens was observed; with an increase in the alkali excitation modulus from 1.2 to 1.4, the compressive and flexural strengths of the specimen decrease simultaneously. This indicates that an excessively high modulus adversely affects compressive strength development, while excess SiO2 will cause an overreaction leading to the rapid generation of numerous C (N)-A-S-H gels [36]. These tightly adhering gels hinder further dissolution of precursor materials, consequently affecting strength development. The compressive strength remains essentially unchanged when the modulus reaches 1.6, while the flexural strength shows an upward trend, which is due to the fact that the higher modulus seems to provide more soluble Si, more reactive ions from the precursor particles are dissolved into solution, and condensation on the nucleation sites keeps the under-saturation of reactive ions at a high level, and inevitably the reaction is accelerated [37].
From Table 5, it is evident that desert sand has a greater impact on 28 d compressive strength compared to its effect on flexural strength. When the substitution rate increases from 0% to 20%, both flexural and compressive strengths are reduced. This is due to the fact that desert sand negatively affects the strength of concrete due to the trapping of air bubbles, which occupy the space between the cement particles and ultimately form a more porous slurry, leading to a reduction in the strength of the concrete [8]. However, it should be noted that the strength differences cannot be explained by differences in air content alone, and the results indicate that the contribution of the addition of dune sand powder to the cement cementitious activity comes mainly from three effects: physical, physicochemical, and chemical. These effects act simultaneously and in a complementary manner on the compressive strength of the cement paste [6]. Additionally, research indicates that the average particle size of DS is larger than those of FA, GGBS, and OPC, with the large particle size leading to low specific surface area (SSA) values that negatively affect adhesion and consequently decrease concrete strength [38]. When the substitution rate continues to rise from 20% to 40%, the flexural strength shows improvement. This phenomenon can be attributed to the pore-filling capacity of desert sand, subsequently reducing cracks. When small amounts of smaller particles are added to larger particles, the smaller particles will fill the voids between the larger particles, thereby increasing the packing density (filling effect), whereas when small amounts of larger particles are added to smaller particles, the larger particles will occupy the solid volume within the body and porous volume of the smaller particles (occupancy effect) [22]. Therefore, desert sand should not be viewed solely as an inert filler; rather, it should be recognized as an active component due to its volcanic ash reactivity and heterogeneous nucleation effect.

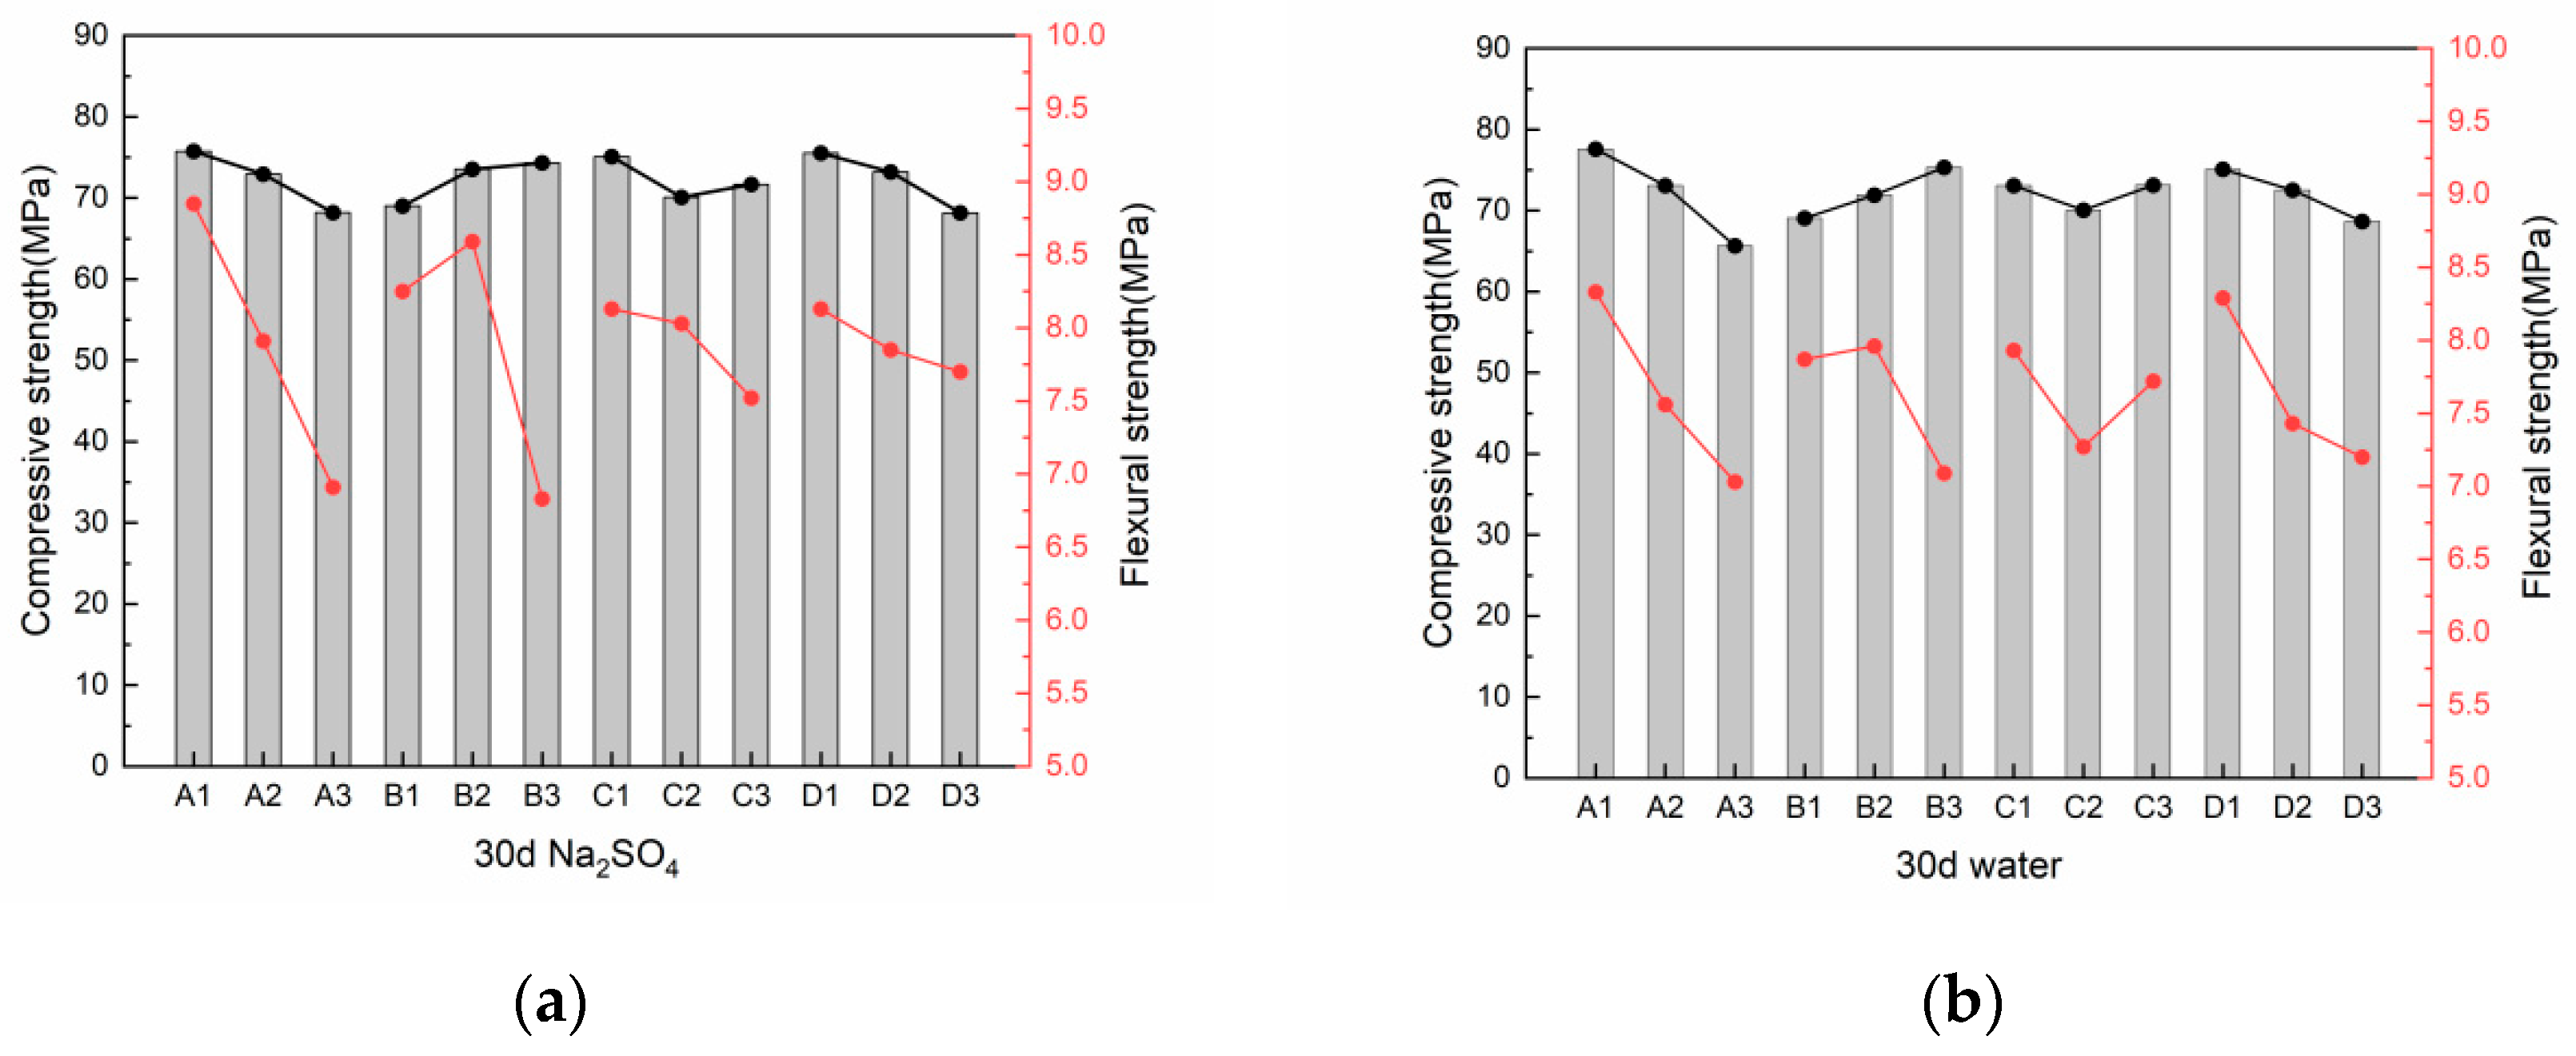
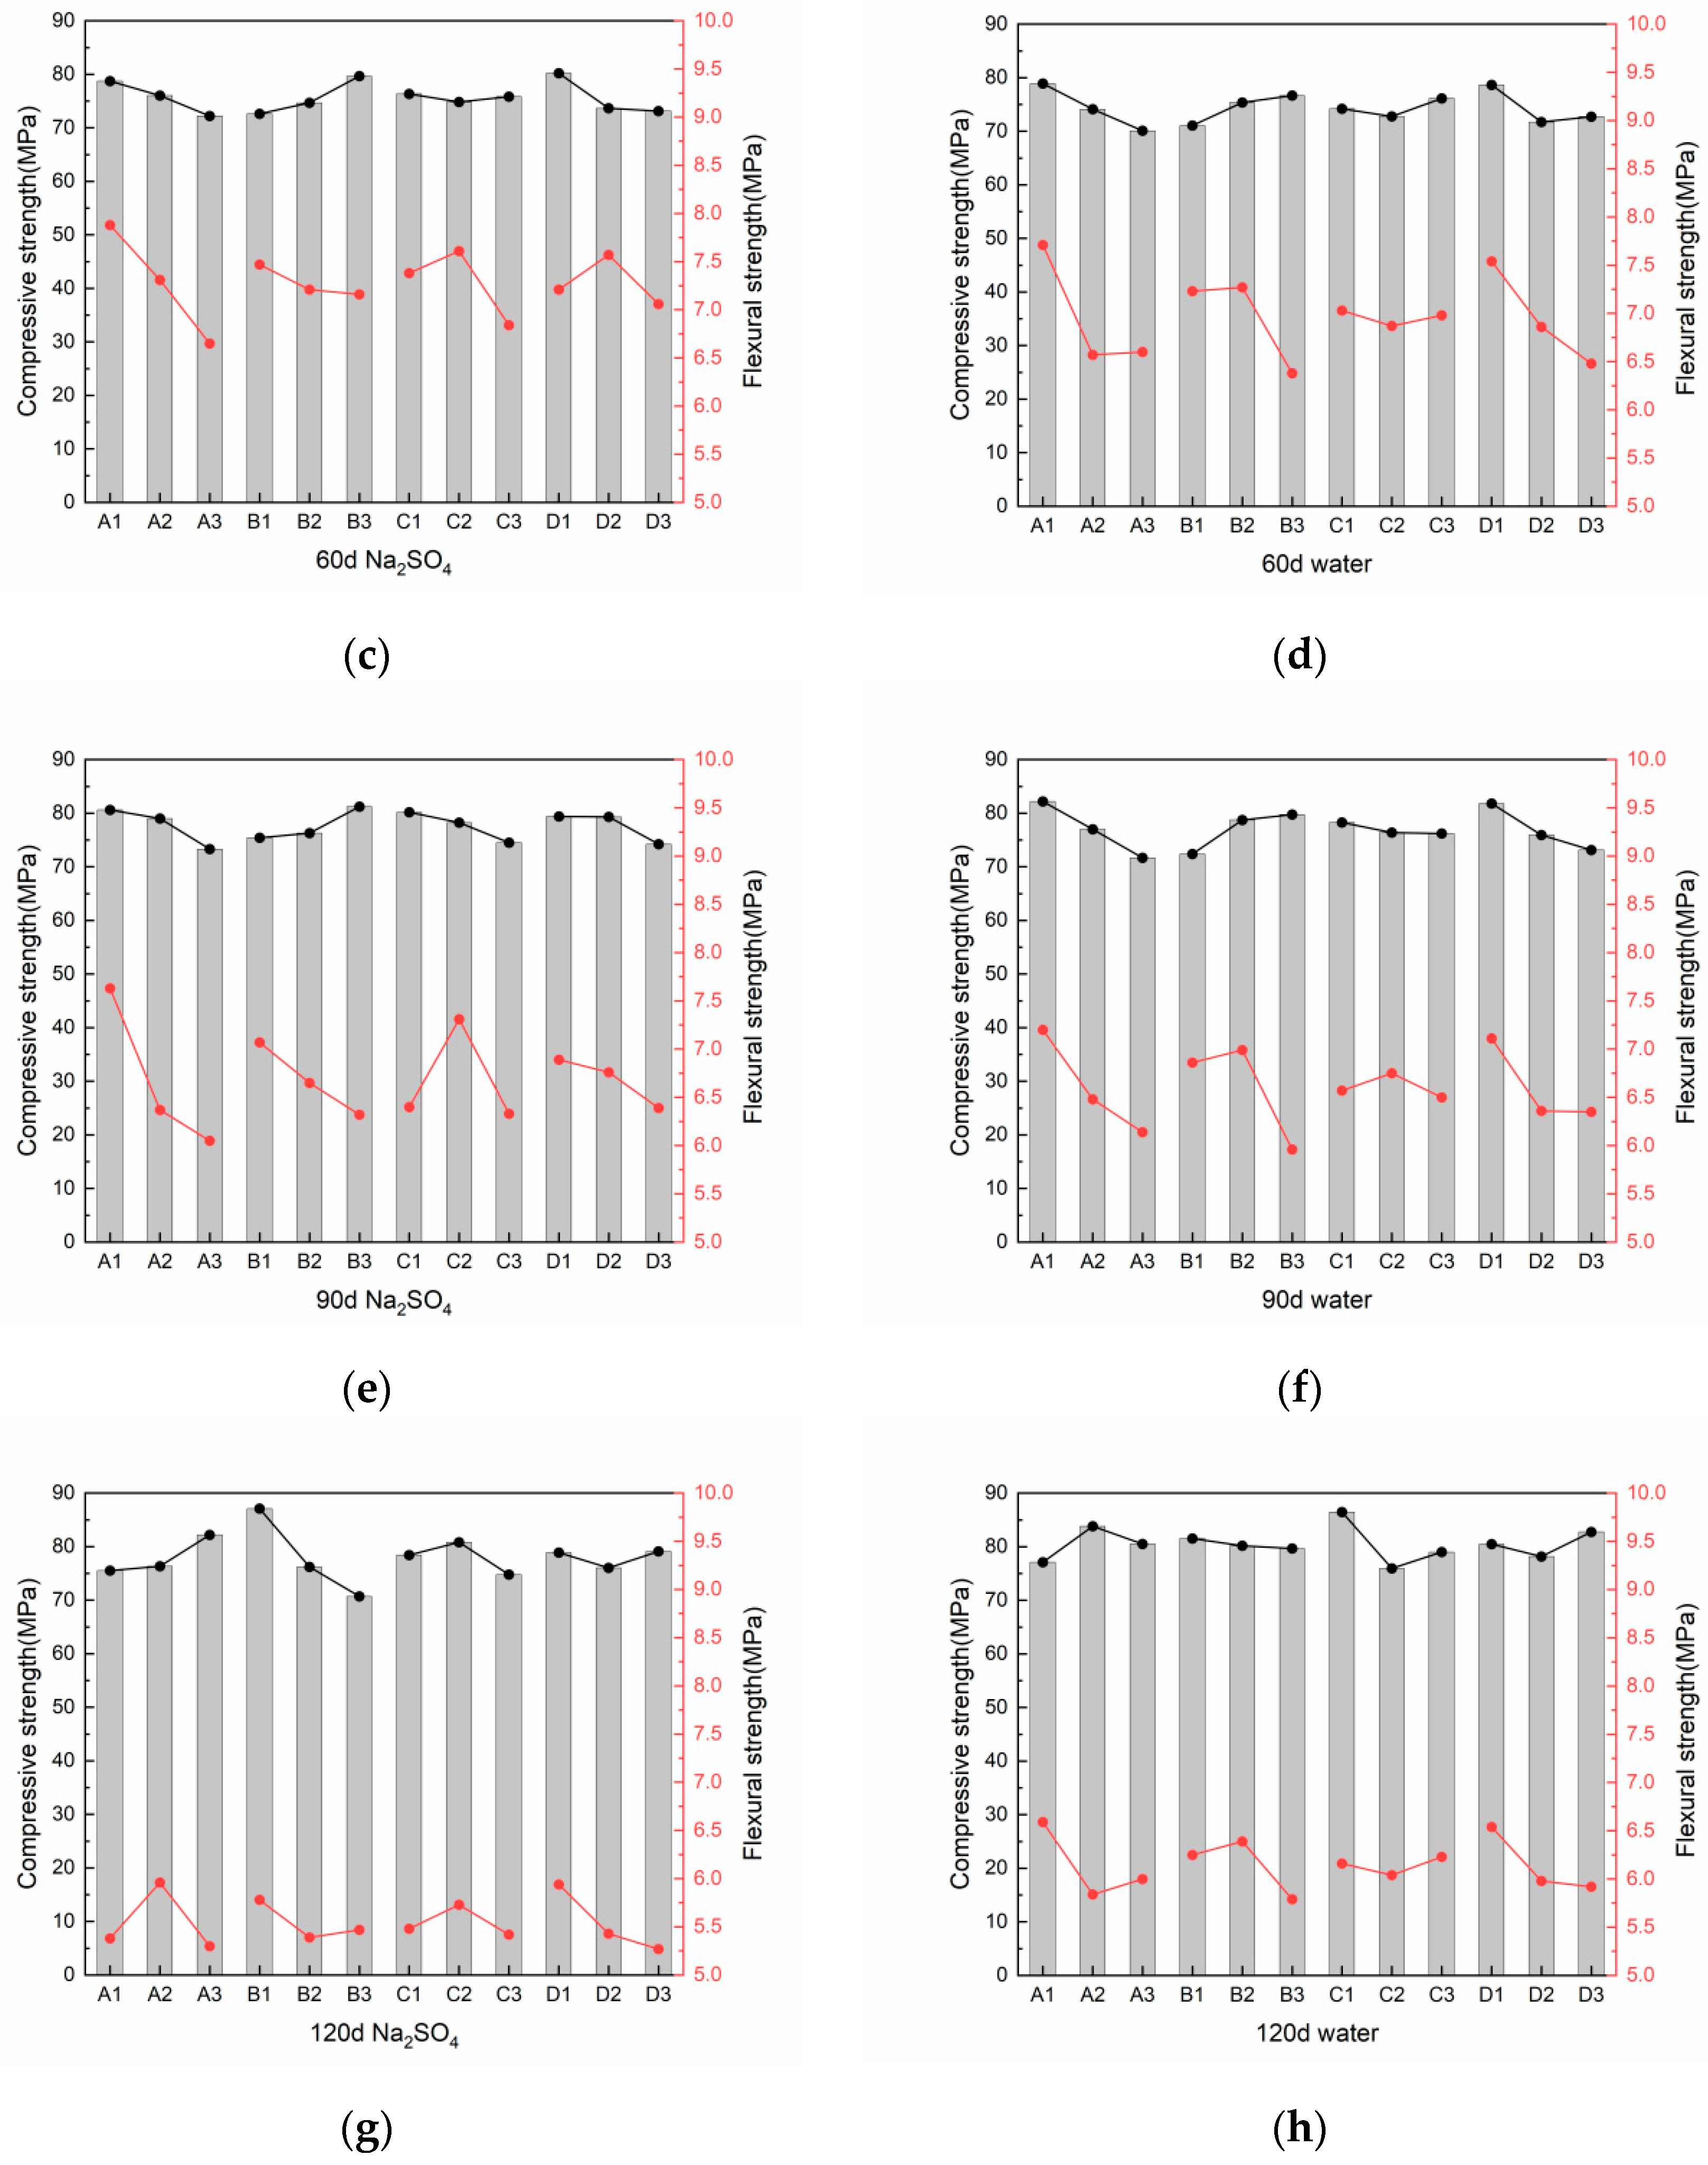
3.2.2. Compressive and Flexural Strength After Sulfate Attack

Figure 7 illustrates that the flexural strength decreases as the age increases. This phenomenon can be attributed to continuous depolymerization and condensation during the processes of product hydration and sulfate attack, leading to the generation of microcracks that detrimentally impact the flexural strength. The 90 d compressive strength showed an increase when the fly ash substitution rate was 0%. This is due to the higher calcium content in GGBS, resulting in faster dissolution under alkali activation. Concurrently, a substantial amount of dissolved Ca rapidly combined with dissolved silica–aluminum compounds to form C-(A)-S-H gel, consequently enhancing the compressive strength of the specimens [39,40]. Similarly, it has been reported by Locher [41] that the sulfate resistance of concrete depends on the content and composition of the mixed slag. When slag is added at high levels, the alumina phase is bound by the C-S-H gel. The effect of slag on the resistance to sulfate attack is dependent on the degree of slag substitution and the content of Al2O3 in slag. Specifically, when the content of Al2O3 in slag reaches 18%, the sulfate erosion resistance of the blends containing 50% slag is lower than that of the blends without slag. Conversely, when the content of Al2O3 is below 11%, the sulfate erosion resistance of the blends is improved. This can be attributed to the higher Al content in slag compared to PC cement, making the reaction of C3A with SO42⁻ more likely to deteriorate. On the contrary, with the increase in Al2O3 content in slag, most of the Al2O3 is adsorbed in hydrotalcite, which is not conducive to the formation of calcium aluminate. It is evident that the reinforcing effect of slag becomes more apparent in concrete with a larger admixture of slag. However, this effect diminishes at 120 d, possibly due to alkali-inspired mortar reacting with sulfate as it ages, resulting in the generation of a large number of expansion products such as calcium aluminate and gypsum. This structural expansion and cracking ultimately lead to a loss of strength [42]. The compressive strength at 120 d exhibited a decrease when the alkali content was at 6%. This can be attributed to the negative impact of excessive alkali content on strength due to several reasons: (1) the presence of a Ca(OH)2 layer on the BFS particles impedes CASH gel formation; (2) early precipitation of Al-Si gel on the FA particles affects subsequent polymerization; (3) weathering induced by the excess of Na reduces microstructure density [43]. When the modulus is at 1.4, the compressive strength is relatively low in the early stage and subsequently increases as the age reaches 120 d. This trend is attributed to the propensity of compressive strength to increase with the modulus, and the structural-forming element (Si) in the solution acting as a nucleation site to promote strength development in two ways [44]. Firstly, condensation on the nucleation sites maintains a high level of under saturation of reactive ions, and secondly, a denser microstructure can be produced as the reaction products form not only on the surface of the slag particles but also in the solution. However, the compressive strength began to decrease with increasing modulus, which may be attributed to continuous saturation of Si in the solution. Additionally, Si remaining on the precursor particles acts as a barrier layer that impedes further dissolution of other reactive ions. Furthermore, excess SiO2 material may precipitate as polymerized SiO4, inhibiting the precipitation of zeolite crystals and affecting the stable polymerization of N-A-S-H gel.

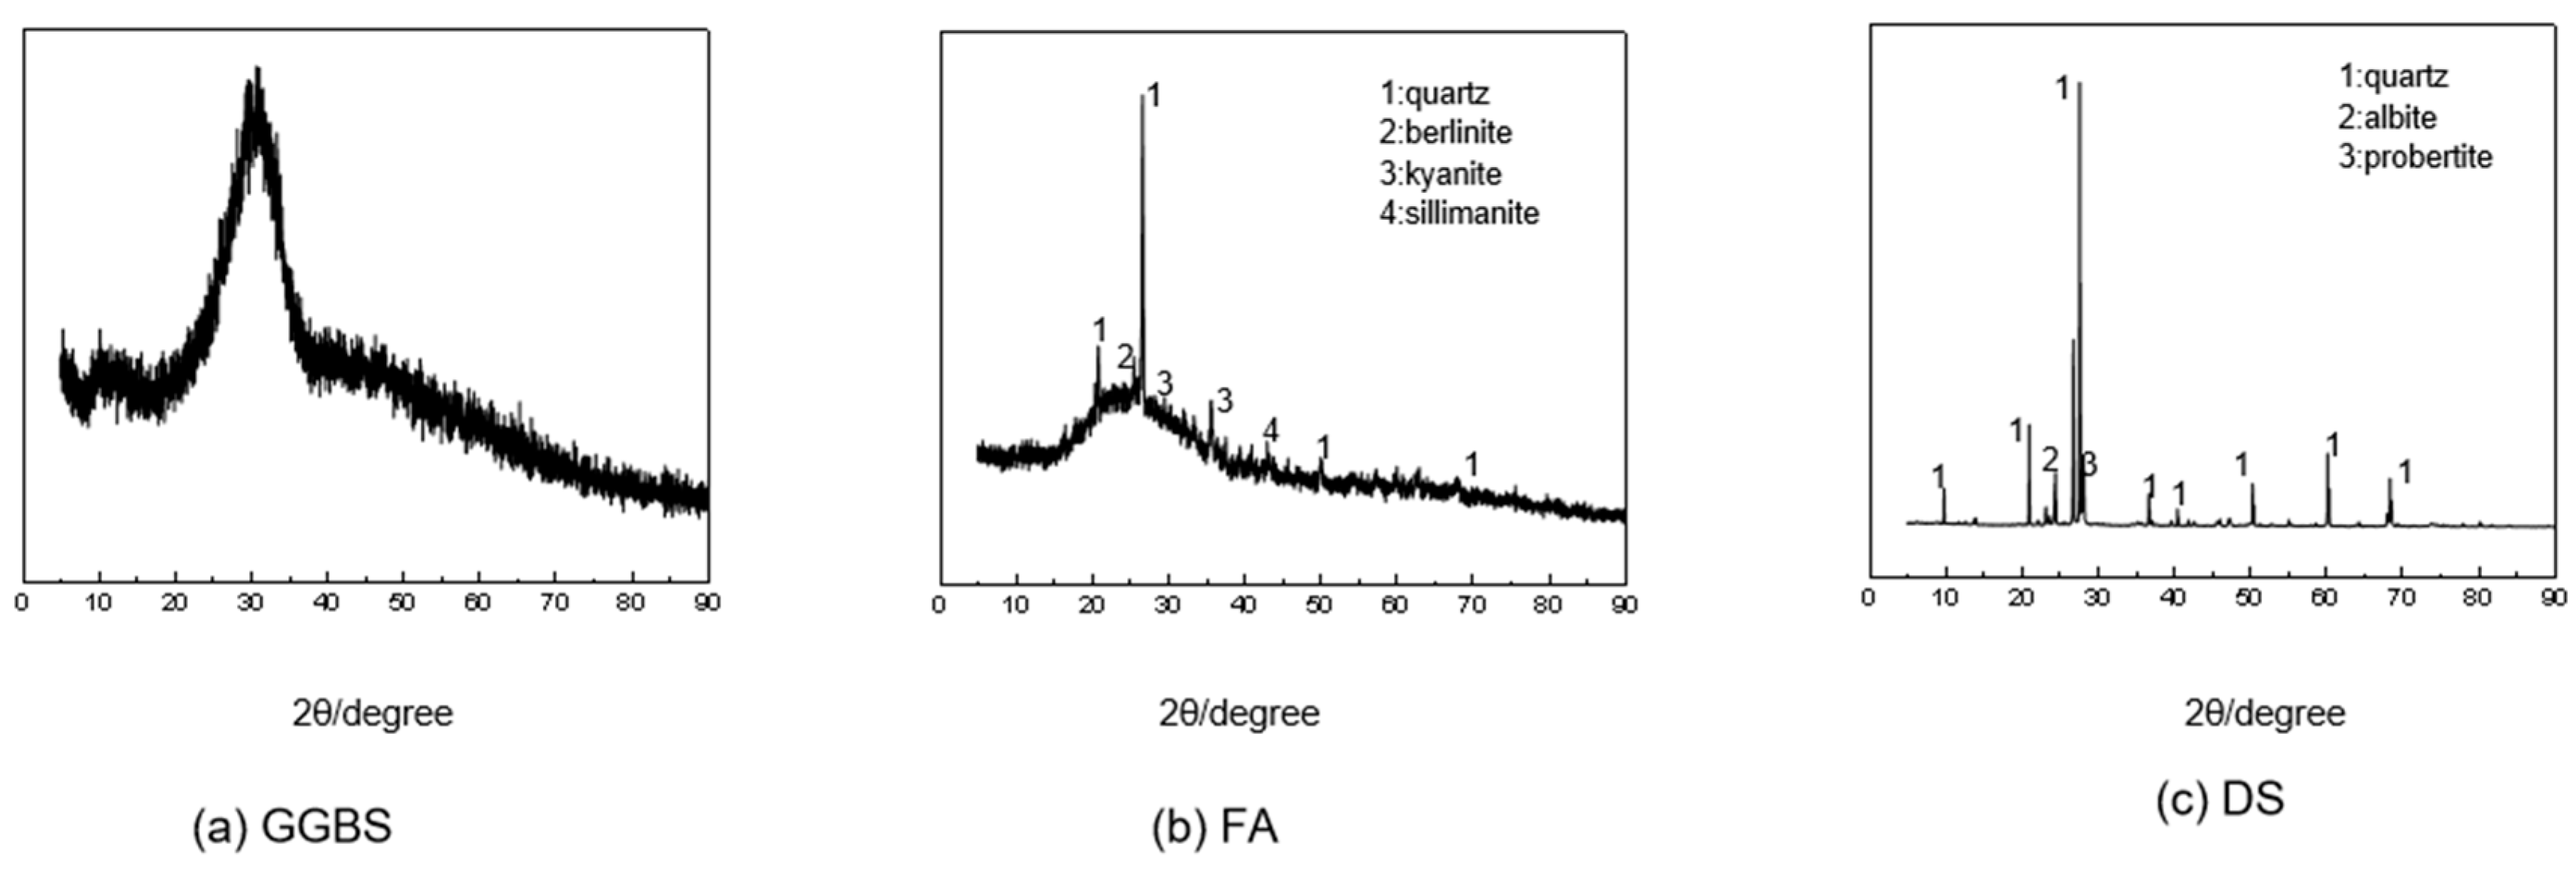
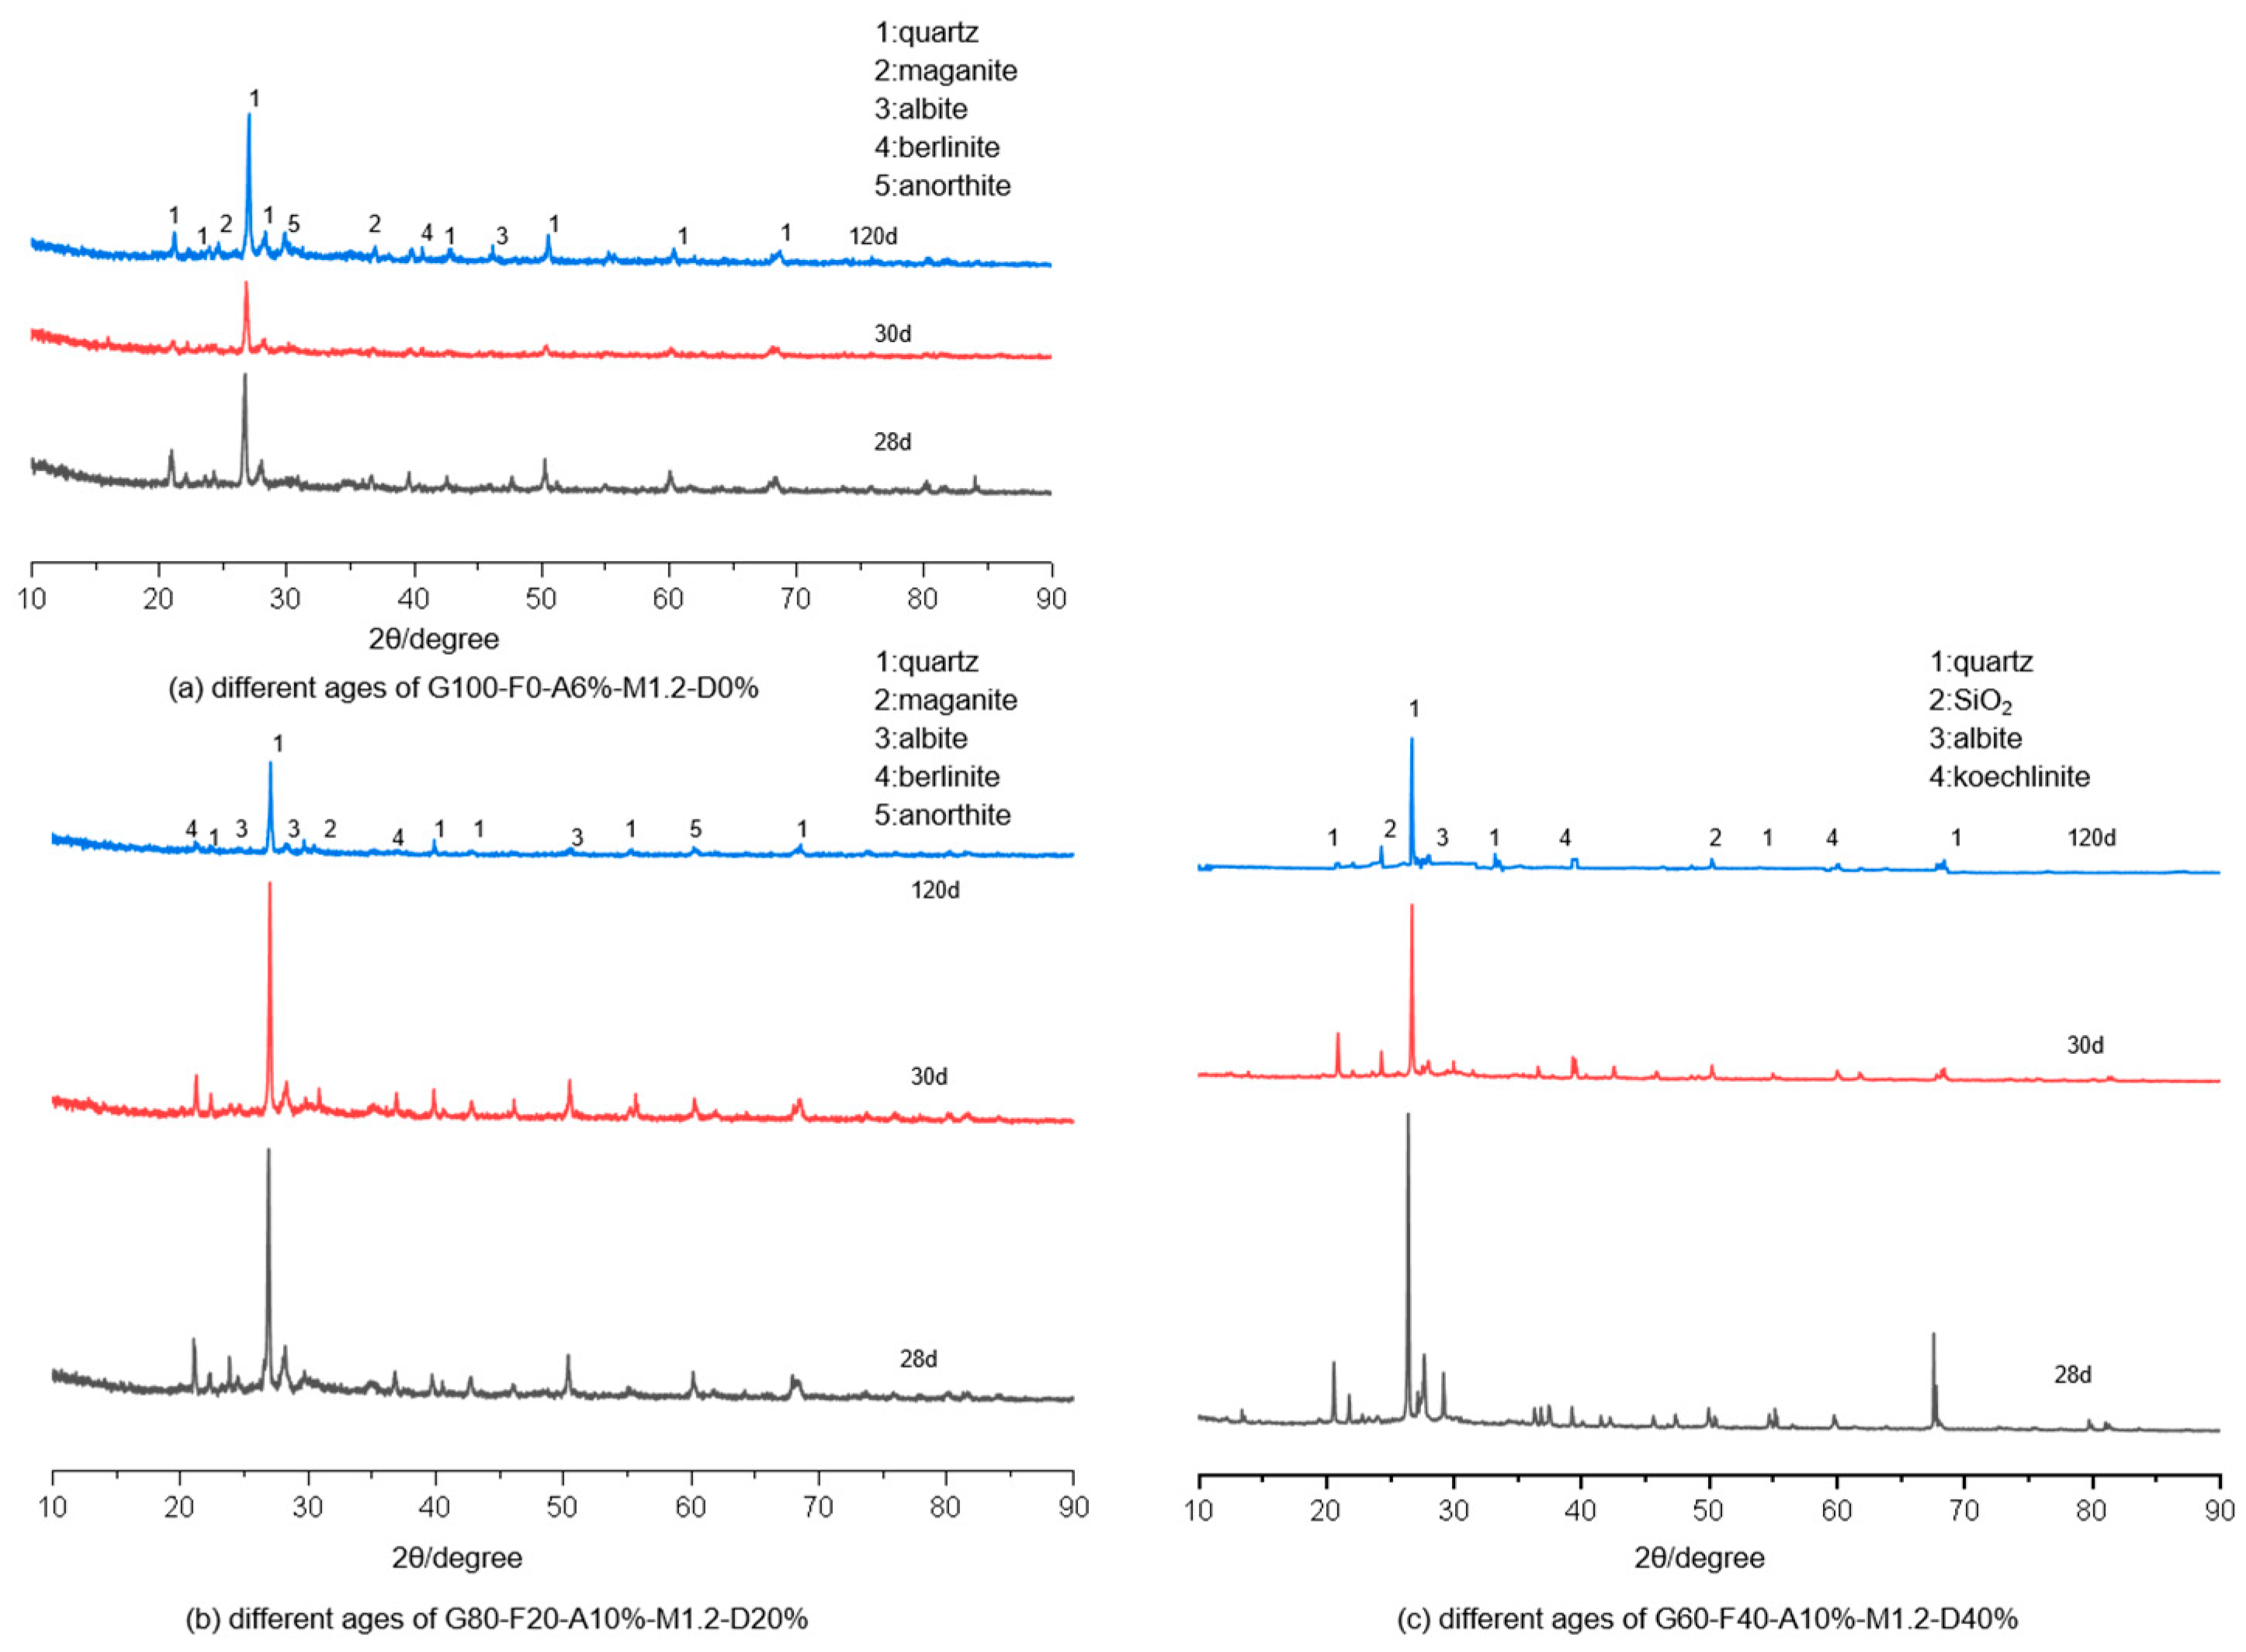
3.3. X-Ray Diffraction Analysis

According to the above trends of flexural and compressive strength of each group and the compositional characteristics of the material, G1, G6, and G8 were selected to XRD. Figure 8a,b exhibit that the hydration products consist predominantly of quartz, albite, magnetite, berlinite, and anorthite. The composition of fly ash, as depicted in Figure 4, is mainly composed of quartz, berlinite, kyanite, and sillimanite. In Figure 8b,c, it is observed that the intensity of the diffraction peak at 2θ 26.5° diminishes as the age of sulfate erosion progresses, indicating that the fly ash in the material continues to dissolve in a strongly alkaline environment. Additionally, XRD analysis of desert sand in Figure 4 detected albite. From Figure 8b,c, it can be observed that the intensity of the diffraction peak of albite at 2θ 27.9° significantly varies at different erosion stages, with the intensity decreasing as the age of sulfate erosion increases. The XRD patterns of samples with varying GGBS contents are illustrated in Figure 8a–c, revealing a gradual broadening of the diffraction pattern with increased slag doping in the interval at 2θ of 20 nm to 40 nm. Furthermore, the intensity of the diffraction peaks in Figure 8a at 2θ becomes stronger, signifying a continuous increase in the content of C-A-S-H gels and a decrease in N-A-S-H gels. With higher GGBS content, the Ca2+ concentration in the matrix increases, leading to a transition from partially amorphous N-A-S-H gel to ordered C-A-S-H gel [45,46,47].

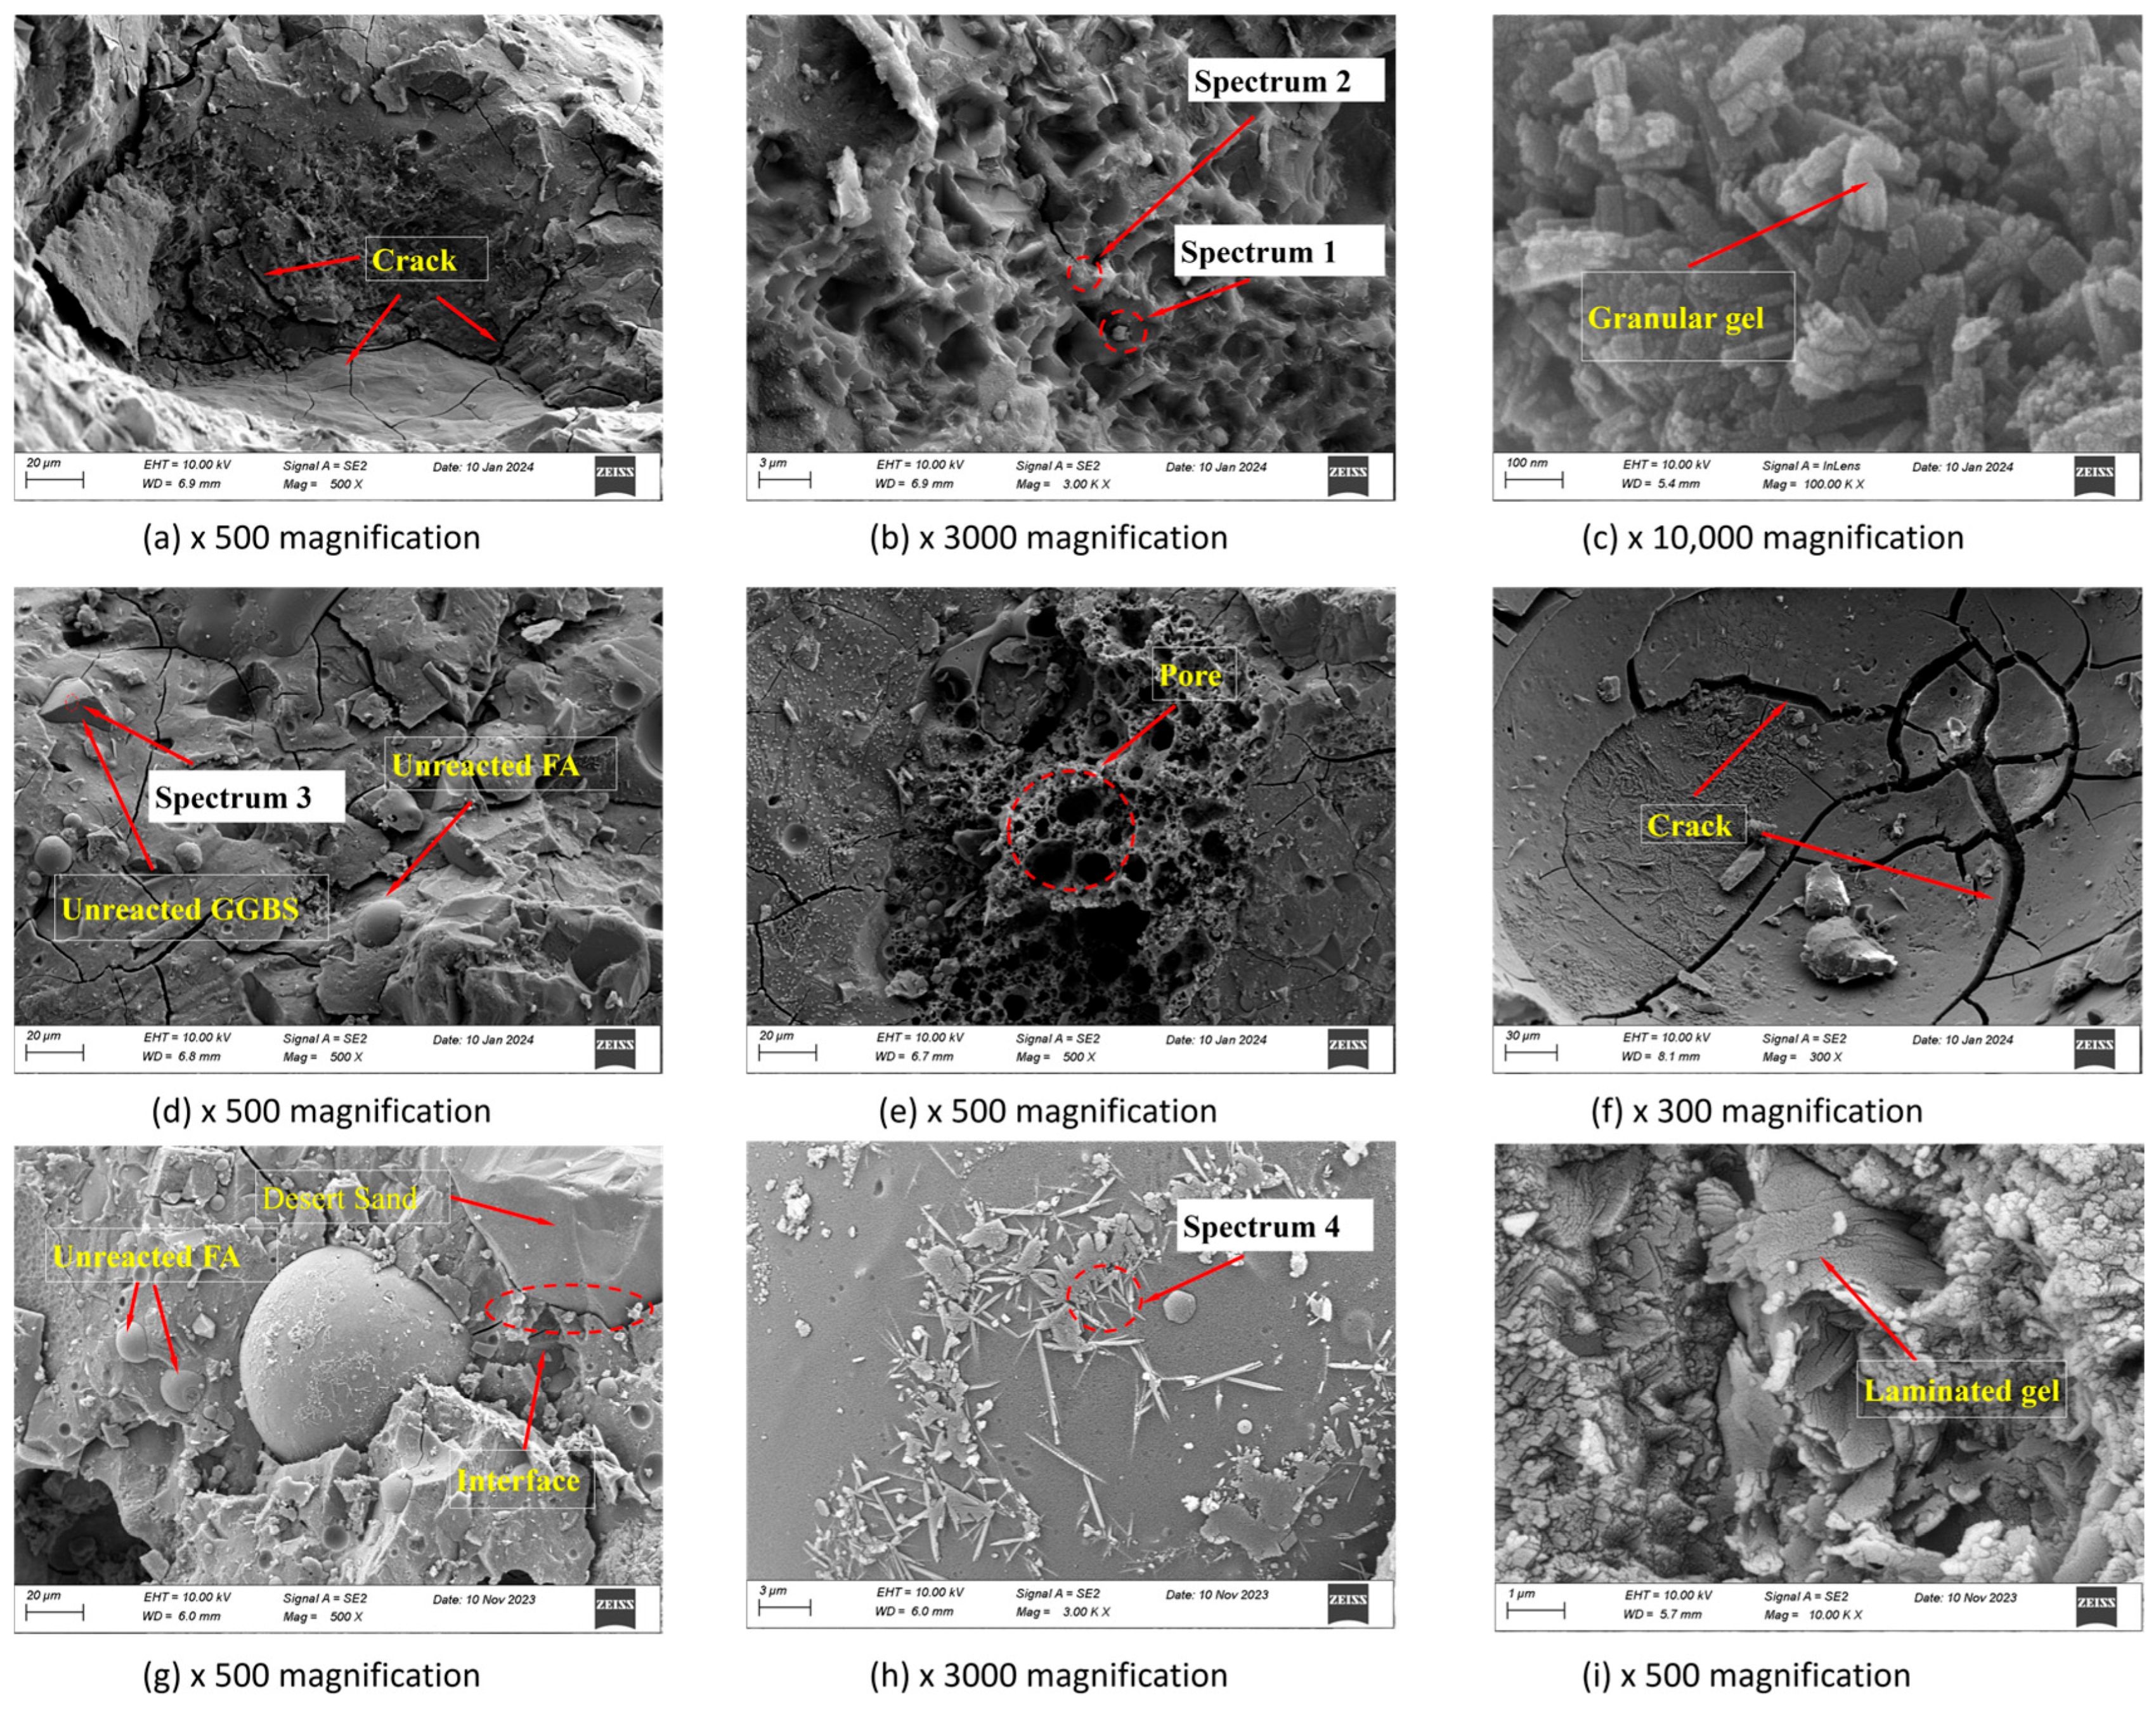
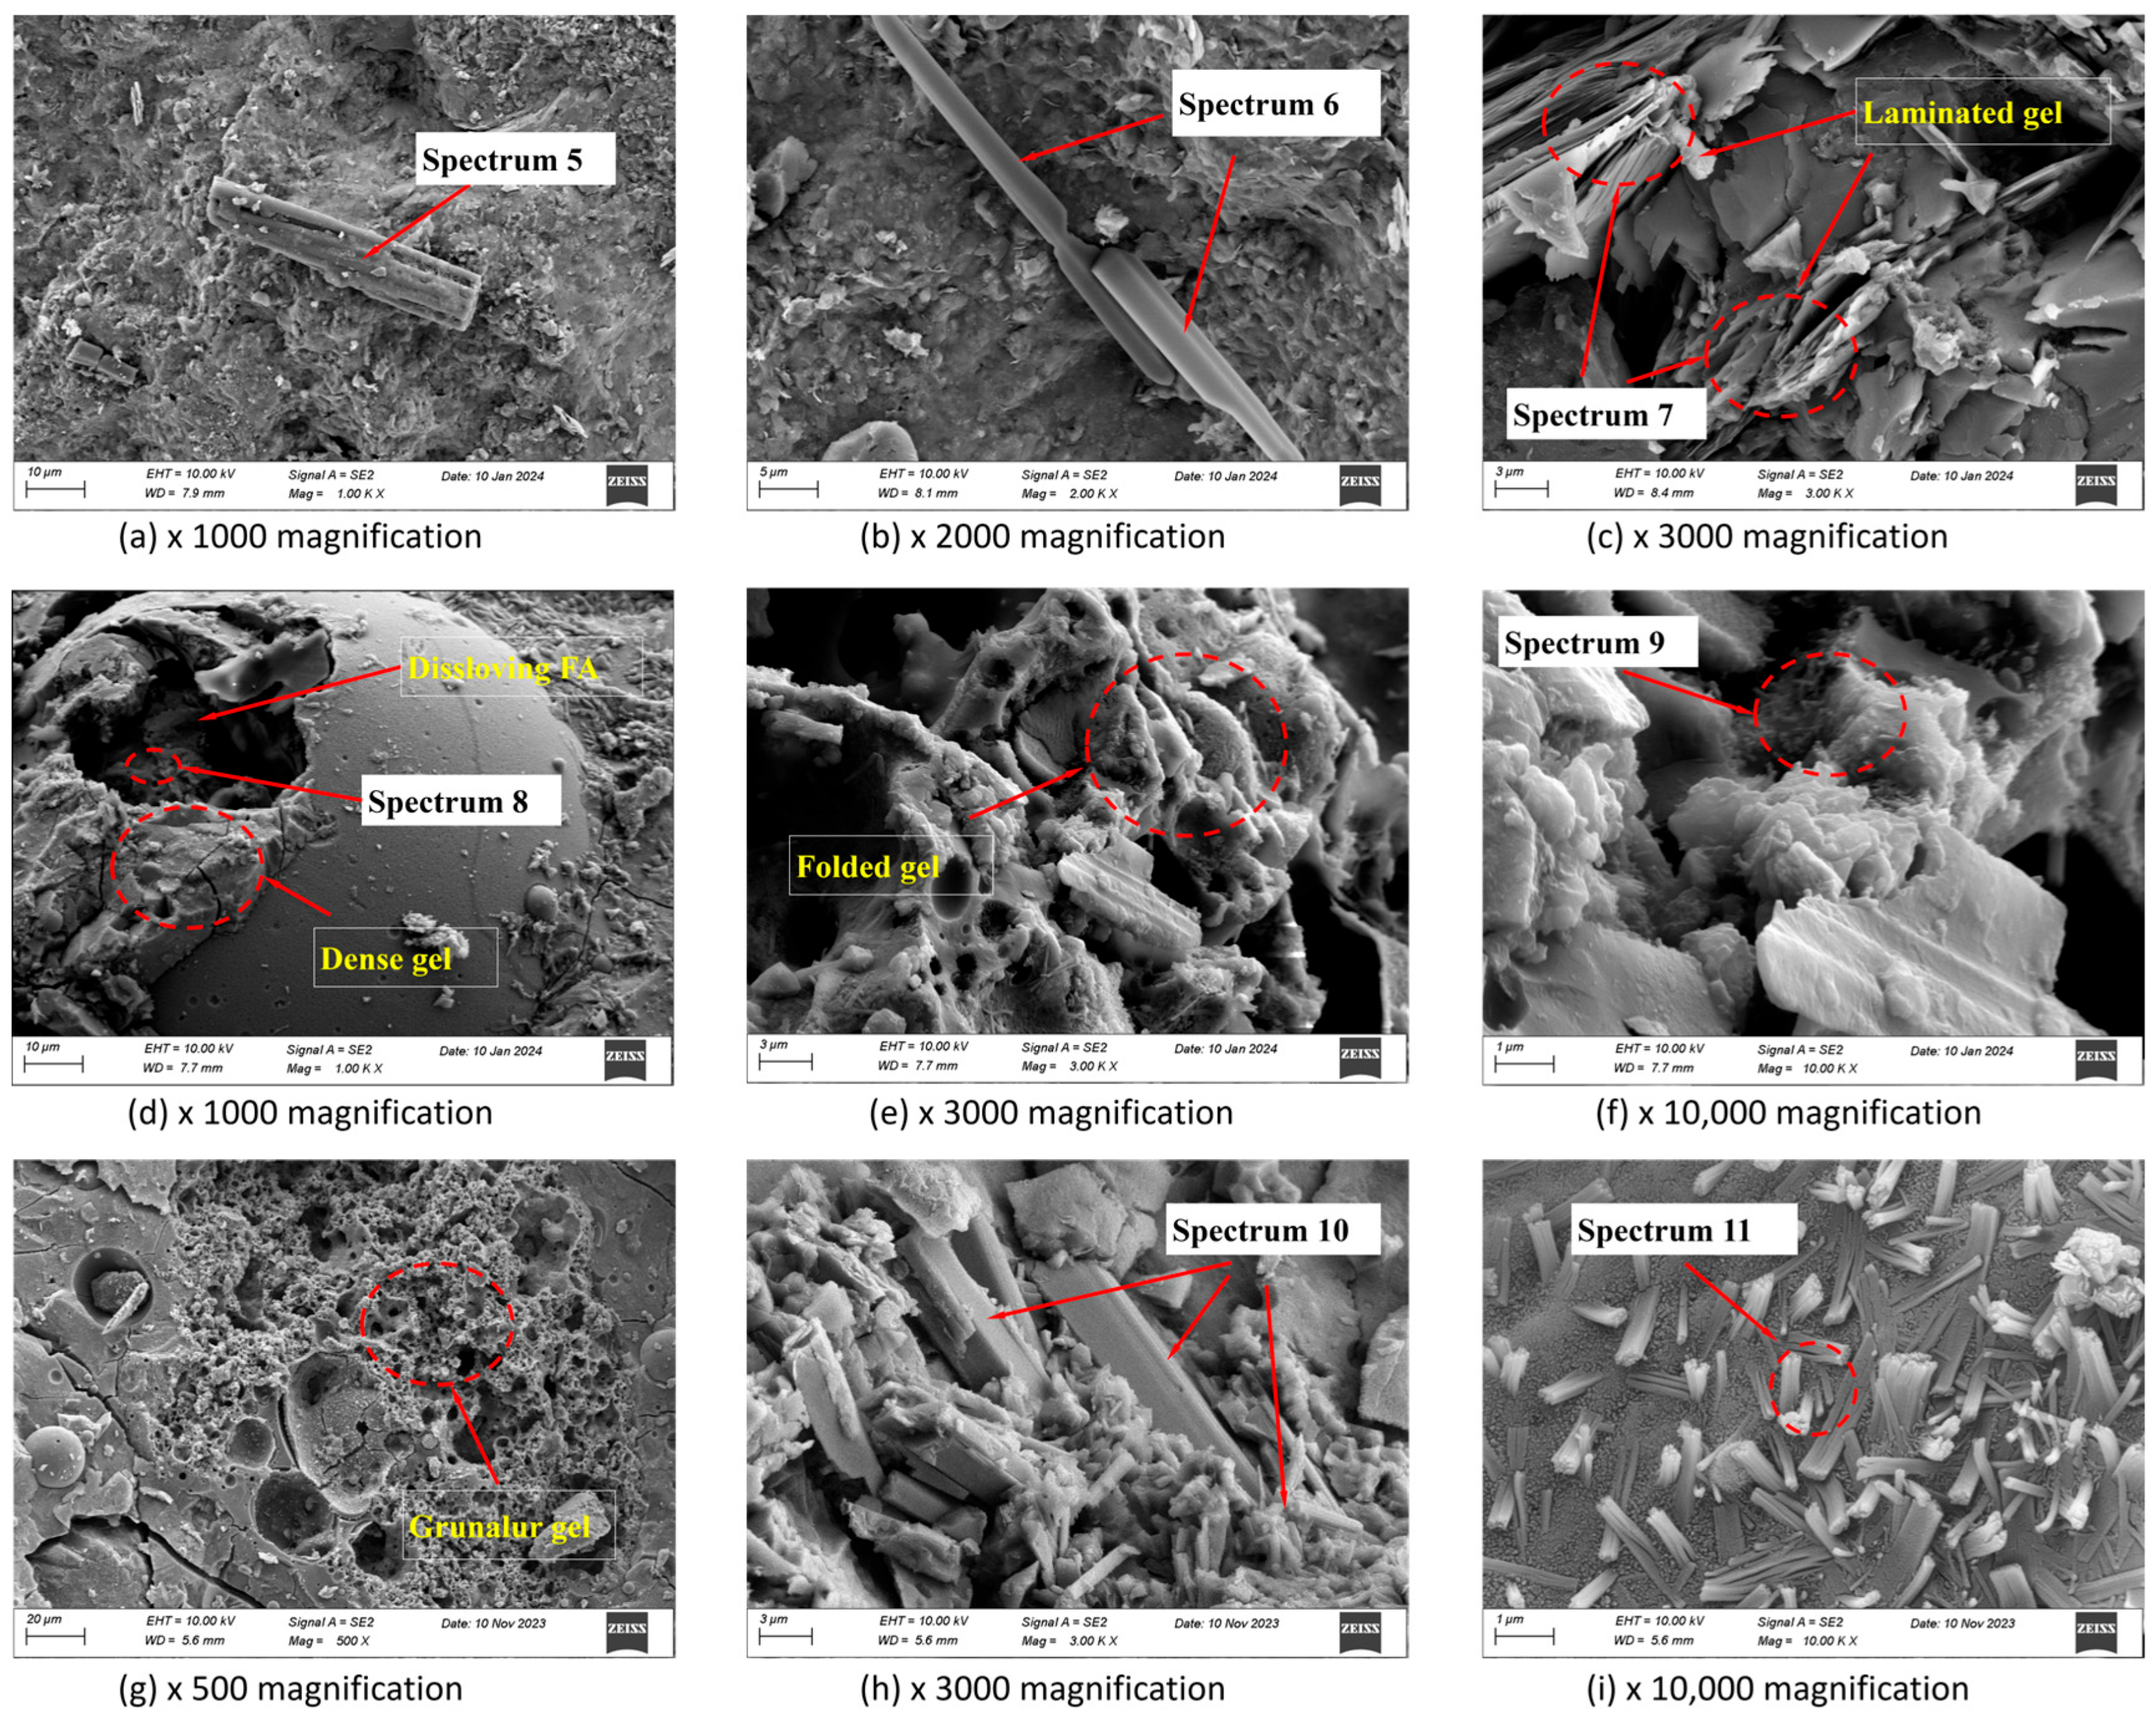
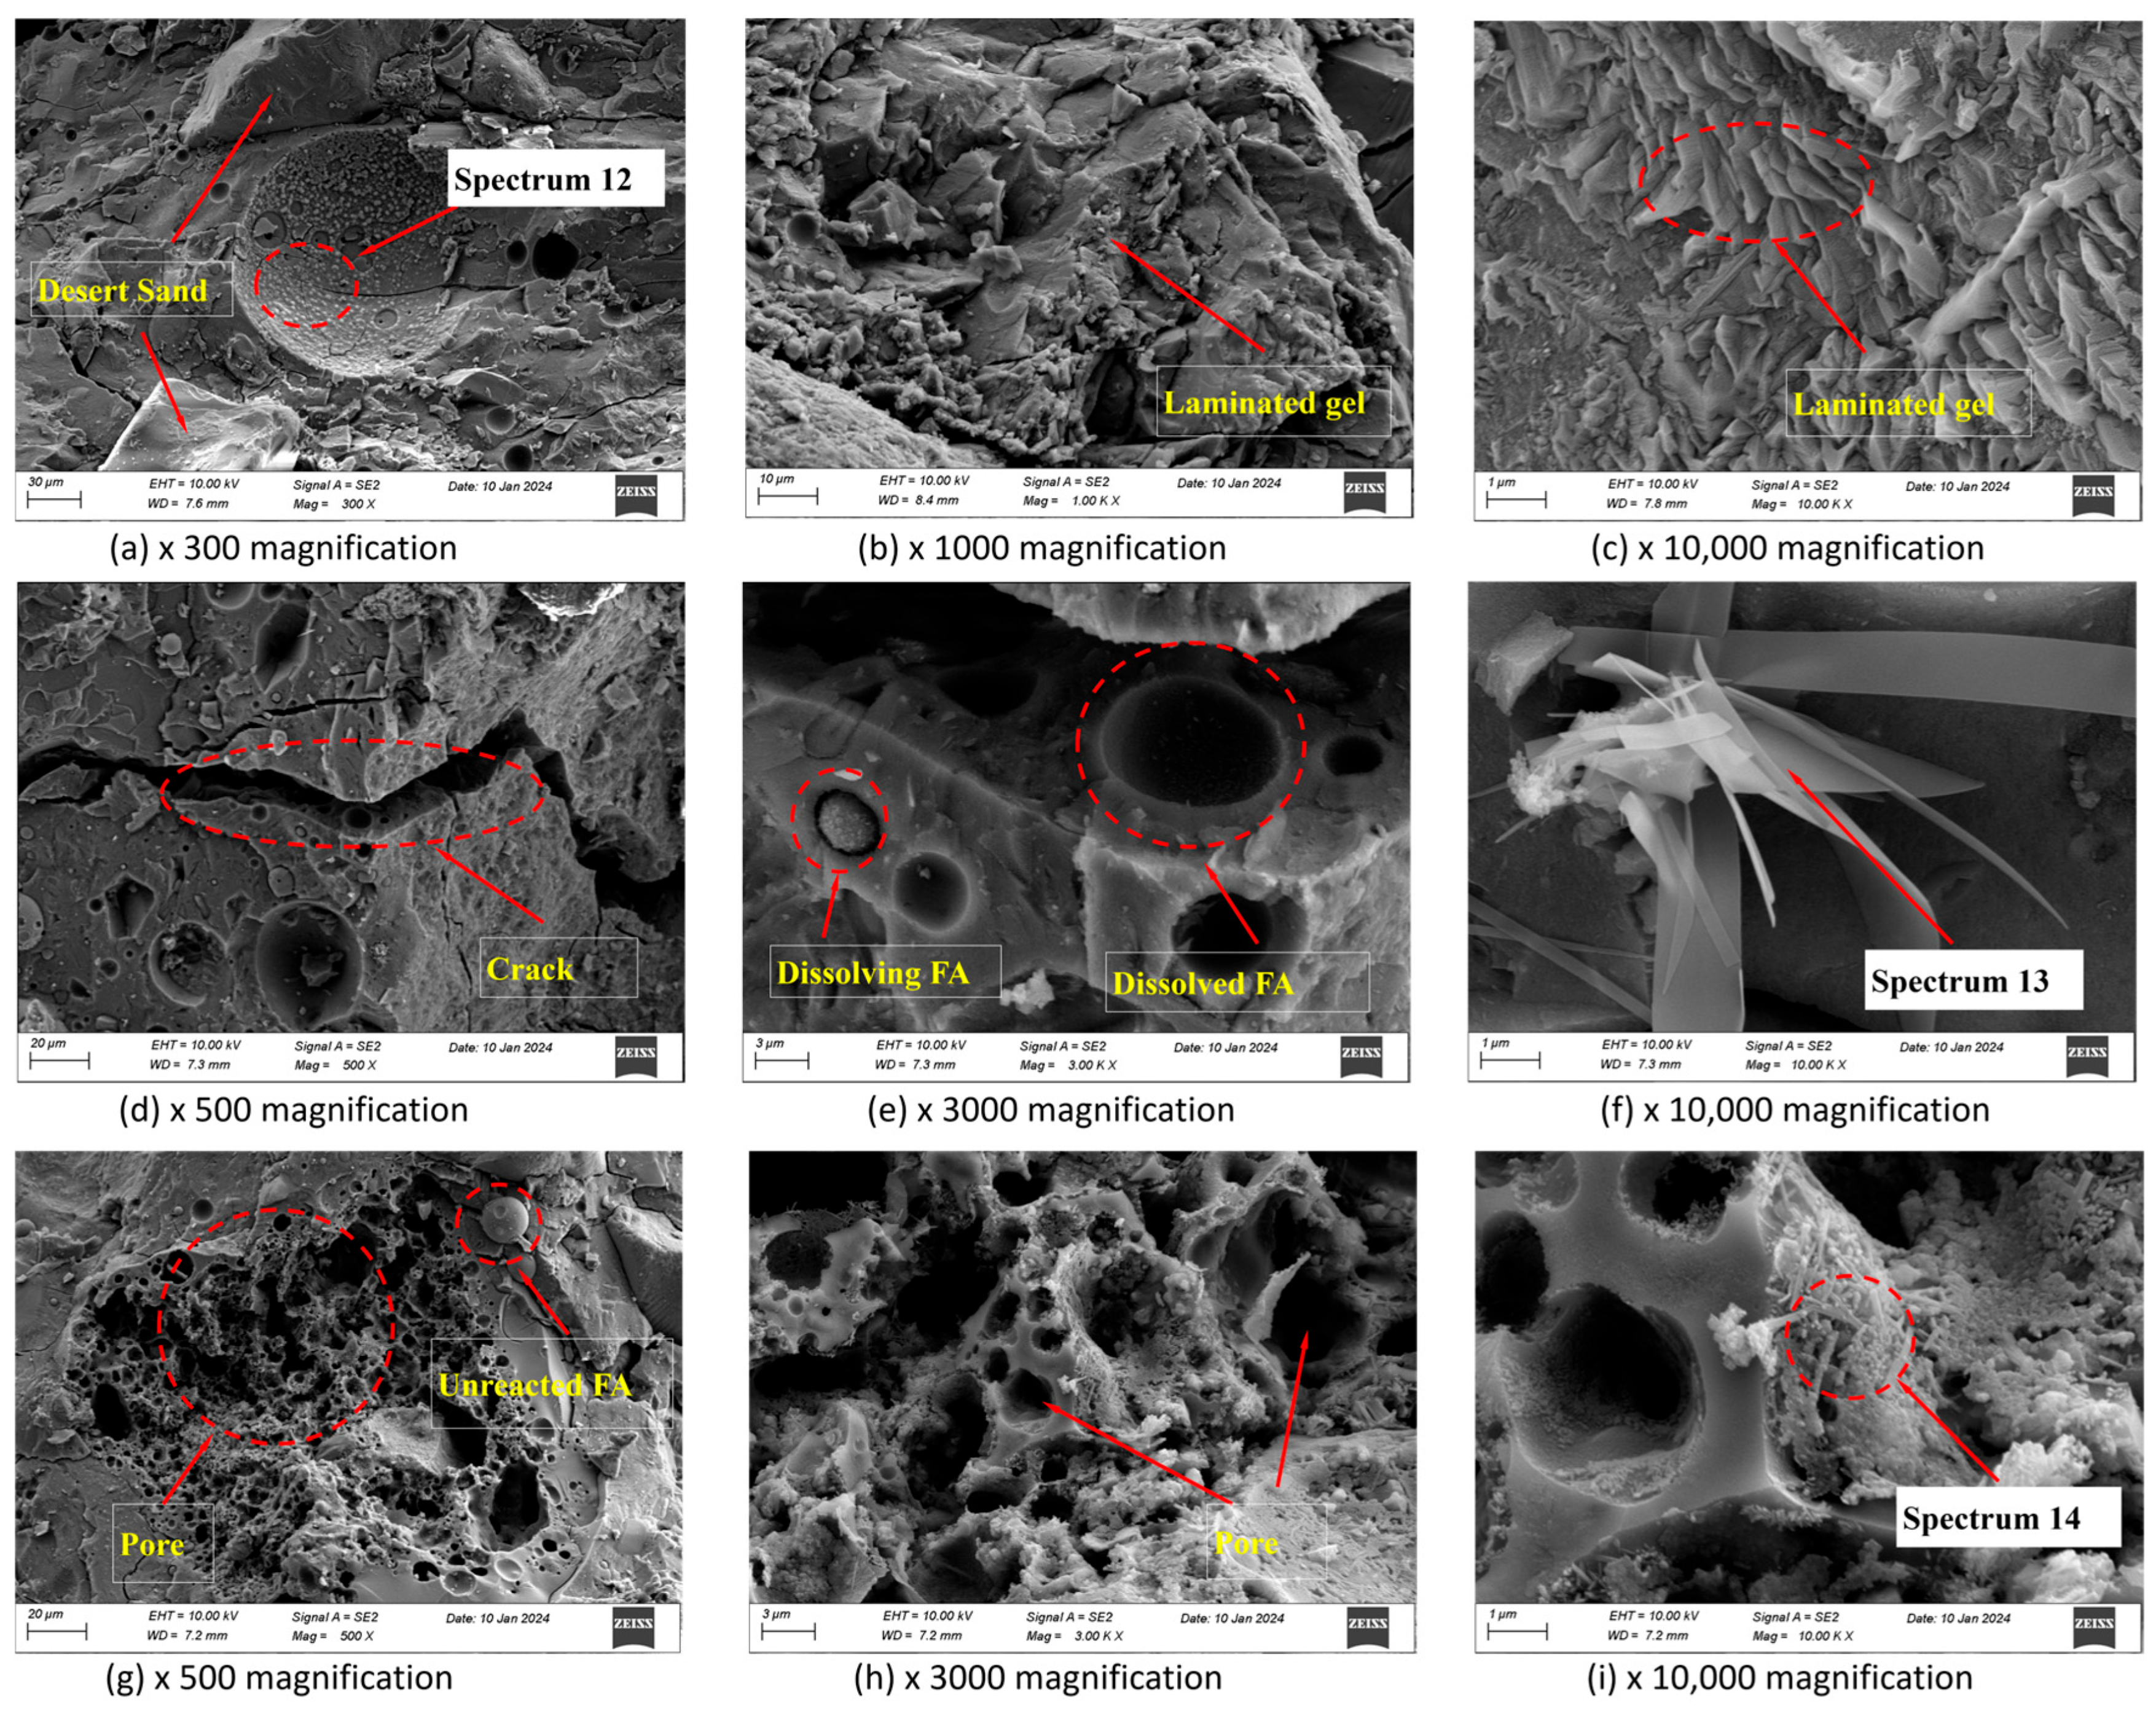
3.4. SEM Analysis and EDS Tests

Figure 9 showcases the scanning electron microscopy (SEM) images of alkali-inspired slag, fly ash, and desert sand mortar specimens after 28 d of standard curing. In Figure 9a,d,g, it can be observed that the fly ash particles in the matrix continue to increase, while the surfaces of the specimens with 100% GGBS doping appear relatively dense. Additionally, some microcracks are visible in Figure 9a. However, when compared to Figure 9d,g, fewer microcracks are present, which is due to the more active nature of slag than fly ash. Figure 9b,c reveal granular gels, which, together with Spectrum1 and Spectrum2 in Table 6, indicate that the predominant products formed are C-(A)-S-H gels, characterized by a lower Ca/Si ratio, longer chain lengths, and higher degree of polymerization compared to hydrated calcium silicate C-S-H. Moreover, based on Spectrum2, Spectrum3, and Spectrum4 in Table 6, it can be inferred that, with increasing fly ash dosage, the Al/Si ratio gradually increases, causing the transformation of C-S-H gel into C-A-S-H gel [47,48]. Figure 9g illustrates the micrographs of the bond between the DS and the matrix, demonstrating the tight wrapping of parts of the C-(A)-S-H gel around the DS particles, significantly enhancing the bonding ability of fine aggregate to slurry and improving the mechanical properties of the sample. Additionally, the surface in Figure 9h exhibits needle-like products on the fly ash surface, speculated to be needle-like Al(OH)3 precipitation in combination with energy-dispersive X-ray spectroscopy (EDS).
Figure 10 displays the scanning electron microscopy (SEM) images of alkali-excited slag, fly ash, and desert sand mortar after 30 d of sulfate immersion. In Figure 10a, the analysis in conjunction with Spectrum5 of Table 6 suggests the presence of unreacted quartz, while in Figure 10b, the analysis using Spectrum6 of Table 6 indicates potential Na2SO4 crystals undergoing dissolution. It can be observed that these crystals react with surrounding C-(A)-S-H dense gels to produce swelling products such as calcium alumina or gypsum. Further, Figure 10c is identified as a layered hydrotalcite, and Figure 10d depicts dissolving fly ash (FA) particles, with the gradual formation of a shell layer as fine reaction products emerge on the FA particle surface due to the dissolution of soluble phases from the FA and the release of alumina and silica [49]. Moreover, in Figure 10f, after magnification of Figure 11d, the presence of alumina and silica reacting with the matrix gel is apparent. Moving on to Figure 10g, SEM analysis at a 40% fly ash substitution rate shows a relatively high content of fly ash, with numerous unreacted fly ash particles still present. Analysis from Spectrum10 reveals that Figure 10h shows CaO and SiO2 undergoing hydration reactions, yielding a multitude of short columnar products and dense gel products. Lastly, Figure 10i exhibits a large number of flocculent products, which can be attributed to the swelling product calomelite.
The findings presented in Figure 11 depict the products of mortar after 120 d of sulfate immersion. A dense C-(A)-S-H gel was observed to form from Figure 11b,c, while Figure 11a illustrates the presence of dissolving desert sand particles, and there are no obvious interface transition areas. Analysis of Figure 11f using Table 6 Spectrum13 suggests the potential presence of a banded gypsum product, leading to the generation of expansive products and subsequent crack formation. In Figure 11g–i, a substantial number of pores are evident, suggesting that higher fly ash admixture leads to increased pore formation. Figure 11i further indicates that sulfate penetrated the interior of these pores, reacting with the gel within to generate a significant number of calcite crystals, resulting in internal stresses and matrix destruction.
The findings presented in Figure 11 depict the products of mortar after 120 d of sulfate immersion. A dense C-(A)-S-H gel was observed to form, as shown in Figure 11b,c, while Figure 11a illustrates the presence of dissolving desert sand particles, and there are no obvious interface transition areas. Analysis of Figure 11f using Table 6 Spectrum13 suggests the potential presence of a banded gypsum product, leading to the generation of expansive products and subsequent crack formation. Figure 11g–i, a substantial number of pores are evident, suggesting that higher fly ash admixture leads to increased pore formation. Figure 11i further indicates that sulfate penetrated the interior of these pores, reacting with the gel within to generate a significant number of calcite crystals, resulting in internal stresses and matrix destruction.

3.5. Pore Structure

To gain deeper insights into the erosion mechanism, mercury-in-pressure pore (MIP) experiments were conducted to investigate the pore structure of samples G1, G6, and G8 at different erosion ages. Both differential and cumulative pore size distributions are presented in Figure 12 and Figure 13. Figure 12 illustrates that the sample exhibits the highest number of micropores [44], with most pore size distributions falling below 10 nm, indicative of harmless pores. The formation of pores in cementitious materials primarily arises from the following processes: (a) the water occupying space during hydration and subsequent drying processes, gradually forming pores; (b) the entrapment of bubbles during mixing which eventually solidify into closed pores upon hardening. In Figure 13, both G1 and G8 display a gradual decrease in cumulative pore volume as the duration of sulfate erosion extends, attributed to the increasing degree of hydration filling pore spaces with newly formed products, subsequently reducing overall porosity.
Notably, the cumulative pore volume of G6 at 120 d exceeds that at 30 d, which may be related to the high alkali content, rapid hydration, cumulative pore formation, accelerated sulfate erosion, and interaction with hydration products to generate expansive cracking in G6. This is confirmed by the 120 d SEM images of G6 and the decrease in its compressive strength over the same period; meanwhile, this trend is not observed in G1 and G8, whose compressive strengths show a significant upward trend. Additionally, the fast hydration rate of G6 indicates that an appropriate amount of desert sand can promote a hydration reaction. Its enhancement mechanism can be summarized as micro-filling effect, nucleation effect, dilution effect, and weak chemical effect [50,51,52,53]. Desert sand can be chemically activated by Na2SO4 solution, leading to the dissolution of certain substances in the desert sand powder.

4. Conclusions

(1)
The replacement rate of natural sand by desert sand had the most significant impact on the flow properties, followed by slag content, while alkali content and alkali excitation modulus had a relatively minor effect on the flow properties.
(2)
The factors influencing the 28 d flexural strength, in descending order, were slag, alkali content, desert sand content, and alkali excitation modulus. At a slag content of 100%, alkali content of 6%, alkali excitation modulus of 1.2, and a desert sand substitution rate of 0%, the maximum flexural strength reached 9.52 MPa. Conversely, the factors affecting the 28 d compressive strength were, in sequence, alkali content, desert sand content, alkali excitation modulus, and slag content. The highest 28 d compressive strength of 77.7 MPa was achieved with an alkali content of 10%, a fly ash substitution rate of 20%, and a desert sand substitution rate of 20%.
(3)
As the erosion duration lengthens, fly ash and desert sand contribute favorably to the late-stage increase in compressive strength. Furthermore, higher levels of slag and alkali content correspond to accelerated reaction rates and increased production of expansion products in the presence of sulfates, ultimately resulting in a reduction in compressive strength.
(4)
Through microscopic analysis methods such as XRD, SEM/EDS, and MIP, it was demonstrated that the slag exhibited high activity and a rapid reaction dissolution rate. However, the fly ash and certain portions of the desert sand continued to dissolve under sulfate exposure, forming C (N)-A-S-H gel that ultimately enhanced strength in the later stages. The voids created by alkali-excited desert sand mortar primarily consist of harmless pores, which are filled by expansion products generated during sulfate attack, leading to a reduction in cumulative porosity. Nonetheless, as the reaction progresses, the mortar continuously produces expansion products like gypsum calcium alumina, causing the internal structure to deteriorate and the cumulative porosity to increase.
(5)
Combining desert sand with an alkali-activated slag–fuel ash system can leverage the benefits of a well-performing, high-strength, and durable alkali-activated slag–fuel ash system. Nevertheless, challenges persist for alkali-activated desert sand, including the procurement, preparation, and use of slag in the mass production of concrete, and the high transportation costs associated with desert sand and large-scale production of concrete.

Author Contributions

Conceptualization, W.Y., H.C. and M.Z.; methodology, W.Y., H.C. and J.C.; software, W.Y. and H.C.; validation, W.Y., H.C. and M.Z.; formal analysis, W.Y., H.C., J.C. and M.Z.; investigation, W.Y., H.C., J.C. and M.Z.; resources, M.Z.; data curation, M.Z.; writing—original draft preparation, W.Y., H.C. and M.Z.; writing—review and editing, W.Y., H.C., M.Z., Y.Q. and X.C.; visualization, W.Y. and H.C.; supervision, M.Z., Y.Q. and X.C.; project administration, M.Z. and Y.Q.; funding acquisition, M.Z. and Y.Q. All authors have read and agreed to the published version of the manuscript.

Funding

This research was funded by Science & Technology Department of Xinjiang Uygur Autonomous Region, grant number 2024B04013-1; Basic Scientific Research Project Fund for Universities in the Xinjiang Uygur Autonomous Region, Finance Department of Xinjiang Uygur Autonomous Region, grant number: XJEDU2025P012; National College Students’ Innovation Training Program of Xinjiang University: 20242207210.

Data Availability Statement

The data presented in this study are available on request from the corresponding author due to confidentiality agreements with research collaborators.

Conflicts of Interest

The authors declare no conflicts of interest.

References

  1. Wang, Y.; Tan, Y.; Wang, Y.; Liu, C. Mechanical Properties and Chloride Permeability of Green Concrete Mixed with Fly Ash and Coal Gangue. Constr. Build. Mater. 2020, 233, 117166. [Google Scholar] [CrossRef]
  2. Xiao, J.; Ma, Z.; Sui, T.; Akbarnezhad, A.; Duan, Z. Mechanical Properties of Concrete Mixed with Recycled Powder Produced from Construction and Demolition Waste. J. Cleaner Prod. 2018, 188, 720–731. [Google Scholar] [CrossRef]
  3. Yang, M.; Chen, L.; Wang, J.; Msigwa, G.; Osman, A.I.; Fawzy, S.; Rooney, D.W.; Yap, P.-S. Circular Economy Strategies for Combating Climate Change and Other Environmental Issues. Environ. Chem. Lett. 2023, 21, 55–80. [Google Scholar] [CrossRef]
  4. Kai, L.; Liu, X.; Xie, X.; Liu, R.; Li, T.; Shah, S.P. The Feasibility of Utilizing Sifted Desert Sand (<75 μm) as Sustainable Supplementary Cementitious Materials (SCM). Constr. Build. Mater. 2023, 406, 133375. [Google Scholar]
  5. Liu, M.; Liu, E.; Hao, J.L.; Sarno, L.D.; Xia, J. Hydration and Material Properties of Blended Cement with Ground Desert Sand. Constr. Build. Mater. 2023, 389, 131624. [Google Scholar] [CrossRef]
  6. Guettala, S.; Mezghiche, B. Compressive Strength and Hydration with Age of Cement Pastes Containing Dune Sand Powder. Constr. Build. Mater. 2011, 25, 1263–1269. [Google Scholar] [CrossRef]
  7. Hamada, H.M.; Abed, F.; Al-Sadoon, Z.A.; Elnassar, Z.; Hassan, A. The Use of Treated Desert Sand in Sustainable Concrete: A Mechanical and Microstructure Study. J. Build. Eng. 2023, 79, 107843. [Google Scholar] [CrossRef]
  8. Luo, F.J.; He, L.; Pan, Z.; Duan, W.H.; Zhao, X.L.; Collins, F. Effect of Very Fine Particles on Workability and Strength of Concrete Made with Dune Sand. Constr. Build. Mater. 2013, 47, 131–137. [Google Scholar] [CrossRef]
  9. Pacheco-Torgal, F.; Castro-Gomes, J.; Jalali, S. Alkali-Activated Binders: A Review Part 1. Historical Background, Terminology, Reaction Mechanisms and Hydration Products. Constr. Build. Mater. 2008, 22, 1305–1314. [Google Scholar] [CrossRef]
  10. Fang, Y.; Hu, T.; Qiao, L.; Yu, F.; Zhang, L.; Sun, H.; Li, C. Alkali-Activated Metakaolin-Blast Furnace Slag Blends as an Alternative Inorganic Adhesive for FRP-Based Structural Rehabilitation. J. Build. Eng. 2025, 103, 112163. [Google Scholar] [CrossRef]
  11. Terzi, C.; Kutuk, S.; Kutuk-Sert, T. Influence of Processed Tea Waste Ash on the Hydration Products and Mechanical Property of Hybrid Cement as an Eco-Friendly Solution. Waste Manag. 2025, 191, 242–252. [Google Scholar] [CrossRef] [PubMed]
  12. Li, Y.; Shen, J.; Lin, H.; Li, Y. Optimization Design for Alkali-Activated Slag-Fly Ash Geopolymer Concrete Based on Artificial Intelligence Considering Compressive Strength, Cost, and Carbon Emission. J. Build. Eng. 2023, 75, 106929. [Google Scholar] [CrossRef]
  13. Bawab, J.; El-Hassan, H.; El-Dieb, A.; Khatib, J. Effect of Mix Design Parameters on the Properties of Cementitious Composites Incorporating Volcanic Ash and Dune Sand. Dev. Built Environ. 2023, 16, 100258. [Google Scholar] [CrossRef]
  14. Ye, H.; Chen, Z.; Huang, L. Mechanism of Sulfate Attack on Alkali-Activated Slag: The Role of Activator Composition. Cem. Concr. Res. 2019, 125, 105868. [Google Scholar] [CrossRef]
  15. Zhang, J.; Shi, C.; Zhang, Z.; Hu, X. Reaction Mechanism of Sulfate Attack on Alkali-Activated Slag/Fly Ash Cements. Constr. Build. Mater. 2022, 318, 126052. [Google Scholar] [CrossRef]
  16. Xia, D.; Chen, R.; Cheng, J.; Tang, Y.; Xiao, C.; Li, Z. Desert Sand-High Calcium Fly Ash-Based Alkali-Activated Mortar: Flowability, Mechanical Properties, and Microscopic Analysis. Constr. Build. Mater. 2023, 398, 131729. [Google Scholar] [CrossRef]
  17. GB/T 1596-2017; Fly Ash Used in Cement and Concrete. General Administration of Quality Supervision, Inspection and Quarantine of the People’s Republic of China, Standardization Administration of China: Beijing, China, 2017.
  18. Kutuk, S. Morphology, Crystal Structure and Thermal Properties of Nano-Sized Amorphous Colemanite Synthesis. Arab. J. Sci. Eng. 2024, 49, 11699–11716. [Google Scholar] [CrossRef]
  19. GB/T 17671-2021; Method of Testing Cement Strength. General Administration of Quality Supervision, Inspection and Quarantine of the People’s Republic of China, Standardization Administration of China: Beijing, China, 2021.
  20. GB/T 2419-2005; Test Method for Fluidity of Cement Mortar. General Administration of Quality Supervision, Inspection and Quarantine of the People’s Republic of China, Standardization Administration of China: Beijing, China, 2005.
  21. Kuang, F.; Long, Z.; Kuang, D.; Guo, R.; Sun, J. Experimental Study on Preparation and Properties of Low Content Rubberized Geopolymer Mortar. Constr. Build. Mater. 2022, 352, 128980. [Google Scholar] [CrossRef]
  22. Kwan, A.; Fung, W. Packing Density Measurement and Modelling of Fine Aggregate and Mortar. Cem. Concr. Compos. 2009, 31, 349–357. [Google Scholar] [CrossRef]
  23. Lai, M.H.; Chen, Z.H.; Wang, Y.H.; Ho, J.C.M. Effect of Fillers on the Mechanical Properties and Durability of Steel Slag Concrete. Constr. Build. Mater. 2022, 335, 127495. [Google Scholar] [CrossRef]
  24. De La Varga, I.; Castro, J.; Bentz, D.P.; Zunino, F.; Weiss, J. Evaluating the Hydration of High Volume Fly Ash Mixtures Using Chemically Inert Fillers. Constr. Build. Mater. 2018, 161, 221–228. [Google Scholar] [CrossRef] [PubMed]
  25. Ji, X.; Gu, X.; Wang, Z.; Xu, S.; Jiang, H.; Yilmaz, E. Admixture Effects on the Rheological/Mechanical Behavior and Micro-Structure Evolution of Alkali-Activated Slag Backfills. Minerals 2022, 13, 30. [Google Scholar] [CrossRef]
  26. Deb, P.S.; Sarker, P.K.; Barbhuiya, S. Sorptivity and Acid Resistance of Ambient-Cured Geopolymer Mortars Containing Nano-Silica. Cem. Concr. Compos. 2016, 72, 235–245. [Google Scholar] [CrossRef]
  27. Huseien, G.F.; Tahir, M.M.; Mirza, J.; Ismail, M.; Shah, K.W.; Asaad, M.A. Effects of POFA Replaced with FA on Durability Properties of GBFS Included Alkali Activated Mortars. Constr. Build. Mater. 2018, 175, 174–186. [Google Scholar] [CrossRef]
  28. Yuan, Q.; Huang, Y.; Huang, T.; Yao, H.; Wu, Q. Effect of Activator on Rheological Properties of Alkali-Activated Slag-Fly Ash Pastes. J. Cent. South Univ. 2022, 29, 282–295. [Google Scholar] [CrossRef]
  29. Sun, B.; Sun, Y.; Ye, G.; De Schutter, G. A Mix Design Methodology of Slag and Fly Ash-Based Alkali-Activated Paste. Cem. Concr. Compos. 2022, 126, 104368. [Google Scholar] [CrossRef]
  30. El-Hassan, H.; Ismail, N. Effect of Process Parameters on the Performance of Fly Ash/GGBS Blended Geopolymer Composites. J. Sustain. Cem.-Based Mater. 2018, 7, 122–140. [Google Scholar] [CrossRef]
  31. Nath, P.; Sarker, P.K. Effect of GGBFS on Setting, Workability and Early Strength Properties of Fly Ash Geopolymer Concrete Cured in Ambient Condition. Constr. Build. Mater. 2014, 66, 163–171. [Google Scholar] [CrossRef]
  32. Nedeljković, M.; Li, Z.; Ye, G. Setting, Strength, and Autogenous Shrinkage of Alkali-Activated Fly Ash and Slag Pastes: Effect of Slag Content. Materials 2018, 11, 2121. [Google Scholar] [CrossRef]
  33. Lee, N.K.; Lee, H.K. Setting and Mechanical Properties of Alkali-Activated Fly Ash/Slag Concrete Manufactured at Room Temperature. Constr. Build. Mater. 2013, 47, 1201–1209. [Google Scholar] [CrossRef]
  34. Li, N.; Shi, C.; Zhang, Z.; Zhu, D.; Hwang, H.-J.; Zhu, Y.; Sun, T. A Mixture Proportioning Method for the Development of Performance-Based Alkali-Activated Slag-Based Concrete. Cem. Concr. Compos. 2018, 93, 163–174. [Google Scholar] [CrossRef]
  35. Atabey, İ.İ.; Karahan, O.; Bilim, C.; Atiş, C.D. The Influence of Activator Type and Quantity on the Transport Properties of Class F Fly Ash Geopolymer. Constr. Build. Mater. 2020, 264, 120268. [Google Scholar] [CrossRef]
  36. Tian, L.; Chen, X.; Liu, X.; Li, H.; Ge, Y. Mechanisms of Recycled Fine Brick Aggregate in Autogenous Shrinkage Mitigation, Mechanical Properties Enhancement and Microstructure Improvement of Alkali-Activated Slag-Fly Ash Mortar. Constr. Build. Mater. 2023, 373, 130755. [Google Scholar] [CrossRef]
  37. Lloyd, R.R.; Provis, J.L.; Van Deventer, J.S.J. Microscopy and Microanalysis of Inorganic Polymer Cements. 2: The Gel Binder. J. Mater. Sci. 2009, 44, 620–631. [Google Scholar] [CrossRef]
  38. Kara, C.; Kutuk, S.; Kutuk-Sert, T. Improvement of the Durability of Concrete by Substitution of Raw Ground Colemanite. Case Stud. Constr. Mater. 2023, 19, e02393. [Google Scholar] [CrossRef]
  39. Puligilla, S.; Mondal, P. Role of Slag in Microstructural Development and Hardening of Fly Ash-Slag Geopolymer. Cem. Concr. Res. 2013, 43, 70–80. [Google Scholar] [CrossRef]
  40. Abdollahnejad, Z.; Mastali, M.; Woof, B.; Illikainen, M. High Strength Fiber Reinforced One-Part Alkali Activated Slag/Fly Ash Binders with Ceramic Aggregates: Microscopic Analysis, Mechanical Properties, Drying Shrinkage, and Freeze-Thaw Resistance. Constr. Build. Mater. 2020, 241, 118129. [Google Scholar] [CrossRef]
  41. Veiga, K.K.; Gastaldini, A.L.G. Sulfate Attack on a White Portland Cement with Activated Slag. Constr. Build. Mater. 2012, 34, 494–503. [Google Scholar] [CrossRef]
  42. Yan, X.; Jiang, L.; Guo, M.; Chen, Y.; Song, Z.; Bian, R. Evaluation of Sulfate Resistance of Slag Contained Concrete under Steam Curing. Constr. Build. Mater. 2019, 195, 231–237. [Google Scholar] [CrossRef]
  43. Škvára, F.; Šmilauer, V.; Hlaváček, P.; Kopecký, L.; Zuzan, K. A Weak Alkali Bond in (n, k)–a–s–h Gels: Evidence from Leaching and Modeling. Ceram-Silik. 2012, 56, 374–382. [Google Scholar]
  44. Jia, Z.; Cao, R.; Chen, C.; Zhang, Y. Using In-Situ Observation to Understand the Leaching Behavior of Portland Cement and Alkali-Activated Slag Pastes. Composites Part B 2019, 177, 107366. [Google Scholar] [CrossRef]
  45. Fang, G.; Wang, Q.; Zhang, M. In-Situ X-Ray Tomographic Imaging of Microstructure Evolution of Fly Ash and Slag Particles in Alkali-Activated Fly Ash-Slag Paste. Composites Part B 2021, 224, 109221. [Google Scholar] [CrossRef]
  46. Fu, Q.; Bu, M.; Zhang, Z.; Xu, W.; Yuan, Q.; Niu, D. Hydration Characteristics and Microstructure of Alkali-Activated Slag Concrete: A Review. Engineering 2023, 20, 162–179. [Google Scholar] [CrossRef]
  47. Song, W.; Zhu, Z.; Pu, S.; Wan, Y.; Xu, X.; Song, S.; Zhang, J.; Yao, K.; Hu, L. Multi-Technical Characterization and Correlations between Properties of Standard Cured Alkali-Activated High-Calcium FA Binders with GGBS as Additive. Constr. Build. Mater. 2020, 241, 117996. [Google Scholar] [CrossRef]
  48. Li, S.; Chen, X.; Zhang, W.; Ning, Y.; Casas, J.R. Utilization of Ultra-Fine Dredged Sand from the Yangtze River in Alkali-Activated Slag/Fly Ash Mortars: Mechanical Properties, Drying Shrinkage and Microstructure. Case Stud. Constr. Mater. 2023, 19, e02264. [Google Scholar] [CrossRef]
  49. Chen, W.; Li, B.; Wang, J.; Thom, N. Effects of Alkali Dosage and Silicate Modulus on Autogenous Shrinkage of Alkali-Activated Slag Cement Paste. Cem. Concr. Res. 2021, 141, 106322. [Google Scholar] [CrossRef]
  50. Li, W.G.; Huang, Z.; Zu, T.; Shi, C.; Duan, W.H.; Shah, S.P. Influence of Nanolimestone on the Hydration, Mechanical Strength, and Autogenous Shrinkage of Ultrahigh-Performance Concrete. J. Mater. Civ. Eng. 2016, 28, 04015068. [Google Scholar] [CrossRef]
  51. Craeye, B.; De Schutter, G.; Desmet, B.; Vantomme, J.; Heirman, G.; Vandewalle, L.; Cizer, Ö.; Aggoun, S.; Kadri, E.H. Effect of Mineral Filler Type on Autogenous Shrinkage of Self-Compacting Concrete. Cem. Concr. Res. 2010, 40, 908–913. [Google Scholar] [CrossRef]
  52. Vance, K.; Aguayo, M.; Oey, T.; Sant, G.; Neithalath, N. Hydration and Strength Development in Ternary Portland Cement Blends Containing Limestone and Fly Ash or Metakaolin. Cem. Concr. Compos. 2013, 39, 93–103. [Google Scholar] [CrossRef]
  53. Deschner, F.; Winnefeld, F.; Lothenbach, B.; Seufert, S.; Schwesig, P.; Dittrich, S.; Goetz-Neunhoeffer, F.; Neubauer, J. Hydration of Portland Cement with High Replacement by Siliceous Fly Ash. Cem. Concr. Res. 2012, 42, 1389–1400. [Google Scholar] [CrossRef]
Figure 1. SEM images of (a) GGBS ×500 magnification, (b) FA ×500 magnification, and (c) DS ×100 magnification.
Buildings 15 02069 g001
Figure 2. Particle size distribution of natural sand.
Buildings 15 02069 g002
Figure 3. Particle size distribution of GGBS, FA, and DS.
Buildings 15 02069 g003
Figure 4. XRD patterns of (a) GGBS, (b) FA, and (c) DS.
Buildings 15 02069 g004
Figure 5. Flowability of mortar (A—FA replacement of slag rate; B—Na2O/b; C—modulus; D—substitution rates of desert sand).
Buildings 15 02069 g005
Figure 6. Compressive and flexural strength at 28 d (A—FA replacement of slag rate; B—Na2O/b; C—modulus; D—substitution rates of desert sand).
Buildings 15 02069 g006
Figure 7. Compressive and flexural strength after sulfate attack (A—FA replacement of slag rate; B—Na2O/b; C—modulus; D—substitution rates of desert sand) (a,c,e,g) display the sulfate erosion results at 30 d, 60 d, 90 d, and 120 d, respectively. (b,d,f,h) show the corresponding clear water control group results at the same time points (30 d, 60 d, 90 d, 120 d).
Buildings 15 02069 g007aBuildings 15 02069 g007b
Figure 8. XRD analysis of mortar: (a) G1, (b) G6, and (c) G8.
Buildings 15 02069 g008
Figure 9. SEM images at 28 d: (ac) G1, (df) G6, and (gi) G8.
Buildings 15 02069 g009
Figure 10. SEM image of 30 d: (ac) G1, (df) G6, and (gi) G8.
Buildings 15 02069 g010
Figure 11. SEM imaged at 120 d: (ac) G1, (df) G6, and (gi) G8.
Buildings 15 02069 g011
Figure 12. Differential pore size distribution of the pastes of (a) G1, (b) G6, and (c) G8.
Buildings 15 02069 g012
Figure 13. Cumulative pore size distribution of the pastes of (a) G1, (b) G6, and (c) G8.
Buildings 15 02069 g013
Table 1. Main chemical components and loss on ignition (LOI) of mineral powder (%).
MaterialsMass FractionLOI
CaOSiO2Al2O3MgOSO3Fe2O3Cl
GGBS41.8336.7710.079.780.531.890.0230.9
FA5.1853.5130.841.681.464.811.0
DS15.0865.4312.390.463.16
Table 2. Orthogonal experimental factor design table.
LevelsFactors
FA Replacement of Slag Rate (A)Na2O/b (B)Sodium Silicate Modulus (C)Substitution Rates of Desert Sand (D)
106%1.20
220%8%1.420%
340%10%1.640%
Table 3. Orthogonal experimental design table.
GroupFactors
FA Replacement of Slag Rate (A)Na2O/b (B)Sodium Silicate Modulus (C)Substitution Rates of Desert Sand (D)
G1-A1B1C1D106%1.20
G2-A1B2C2D208%1.420%
G3-A1B3C3D3010%1.640%
G4-A2B1C2D320%6%1.440%
G5-A2B2C3D120%8%1.60
G6-A2B3C1D220%10%1.220%
G7-A3B1C3D240%6%1.620%
G8-A3B2C1D340%8%1.240%
G9-A3B3C2D140%10%1.40
Table 4. Results of flowability.
GroupFactorsFlowability/(mm)S/N Ratio
ABCD
G11111226.5−47.10
G21222217.5−46.75
G31333197.0−45.89
G42123172.5−44.74
G52231267.5−48.55
G62312208.5−46.38
G73132275.0−48.79
G83213216.0−46.69
G93321279.5−48.93
K1641.00674.00651.00773.50
K2648.50701.00669.50701.00
K3770.50685.00739.50585.50
k1213.67224.67217.00257.83
k2216.17233.67223.17233.67
k3256.83228.33246.50195.17
R43.179.0029.5062.67
Factor orderD > A > C > B
Superior levelA3B2C3D1
Excellent combinationA3 B2 C3 D1
Table 5. Range analysis of 28 d flexural strength and compressive strength.
Indicator28 d Flexural Strength28 d Compressive Strength
factorsABCDABCD
K124.8423.8422.9923.38197.98181.88208.78208.29
K222.7523.9221.3021.21205.08196.25191.44197.38
K318.9118.7522.2121.91188.59213.51191.43185.98
k18.287.957.667.7965.9960.6369.5969.43
k27.587.977.107.0768.3665.4263.8165.79
k36.306.257.407.3062.8671.1763.8161.99
R1.981.720.570.725.5010.555.787.44
Factor orderA > B > D > CB > D > C > A
Superior levelA1B2C1D1A2B3C1D1
Excellent combinationA1 B2 C1 D1A2 B3 C1 D1
Table 6. EDS test results.
Element (wt%) OSiCaNaMgAlSCa/SiNa/SiAl/Si
28 dSpectrum153.4637.894.402.240.461.060.440.120.060.03
Spectrum222.2024.8641.224.291.554.371.041.660.170.18
Spectrum322.9421.3440.011.265.116.402.071.870.060.30
Spectrum428.5427.241.580.541.0628.1412.900.060.021.03
30 dSpectrum569.858.095.593.180.890.0012.400.690.390.00
Spectrum641.8638.760.9711.321.194.5338.760.030.290.12
Spectrum737.8929.880.340.241.2219.780.530.010.010.66
Spectrum829.0832.1516.353.480.9812.2332.150.510.110.38
Spectrum935.0731.561.432.230.9325.320.980.050.070.80
Spectrum1033.1728.9323.672.346.371.881.360.820.080.06
Spectrum1134.2310.988.137.130.632.9020.260.740.650.26
120 dSpectrum1246.5620.6021.693.312.343.631.581.050.160.18
Spectrum1335.7023.1726.184.281.925.103.101.130.180.22
Spectrum1446.4024.970.641.760.2221.612.800.030.070.87
Disclaimer/Publisher’s Note: The statements, opinions and data contained in all publications are solely those of the individual author(s) and contributor(s) and not of MDPI and/or the editor(s). MDPI and/or the editor(s) disclaim responsibility for any injury to people or property resulting from any ideas, methods, instructions or products referred to in the content.

