
How Does the Built Environment Influence Social Capital in the Community Context: The Mediating Role of Subjective Residential Satisfaction


Abstract
1. Introduction
2. The Relationship Between the Built Environment and Social Capital
2.1. The Built Environment
- Density: Many studies have shown a significant relationship between density and social capital, but the nature of this relationship remains controversial. Some studies suggest that increased community density generally has a positive impact on social capital. For example, Lau et al. [4] (pp. 163–176) found that more social contacts help alleviate loneliness and enhance trust in the community. Guo et al. [5] explained that high-density areas may provide more opportunities for social activities. However, Brueckner et al. [6] argued that excessive density could lead to urban problems such as congestion, crime, pollution, and public health issues. Wirth [7] pointed out that increased population density might lead residents to withdraw from social interactions, thereby weakening social capital.
- Diversity: Mixed land use is one of the basic land planning principles for maintaining urban vitality [8]. However, some studies suggest that mixed land use may attract too many external visitors, inhibiting the formation of local social relationships and reducing community identity [9]. This could negatively impact residents’ daily lives, as a higher density of points of interest may reduce residents’ sense of security. Some scholars argue that mixed land use inevitably includes facilities that may harm social interactions, while others believe that the high presence of commercial uses may attract too many external visitors, thereby inhibiting the formation of social capital [9].
- Design: Road network design is generally considered to have a significant impact on the built environment. For example, better connectivity in road networks increases walkability, encouraging residents to walk more and providing more opportunities for informal interactions among neighbors. Bonaiuto et al. [10] found that street spaces are important for fostering emotional bonds between residents and their neighbors. Moudon et al. [11] discovered that smaller block sizes increase walking activities and opportunities for residents to interact.
- Destination Accessibility: Van et al. [12] found that residents in communities with higher accessibility to public spaces tend to have higher levels of trust and more opportunities to establish common norms and mutually beneficial relationships. Adlakha et al. [13] studied community environments in India and found that community participation provides opportunities for the elderly to interact with others, while various facilities offer social spaces. Cultural and commercial amenities such as cafes, restaurants, and shopping malls also provide venues for residents to meet and interact, serving as important places for forming and maintaining social relationships.
- Distance to Transit: It is generally believed that the closer residents are to public transport stations, the more likely they are to walk, increasing the chances of interaction. Mouratidis et al. [14] found that accessibility to public transport is positively correlated with community social cohesion. Conversely, inconvenient transport conditions can hinder residents from achieving their travel goals, such as visiting friends and relatives [15].
2.2. Community’s Social Capital
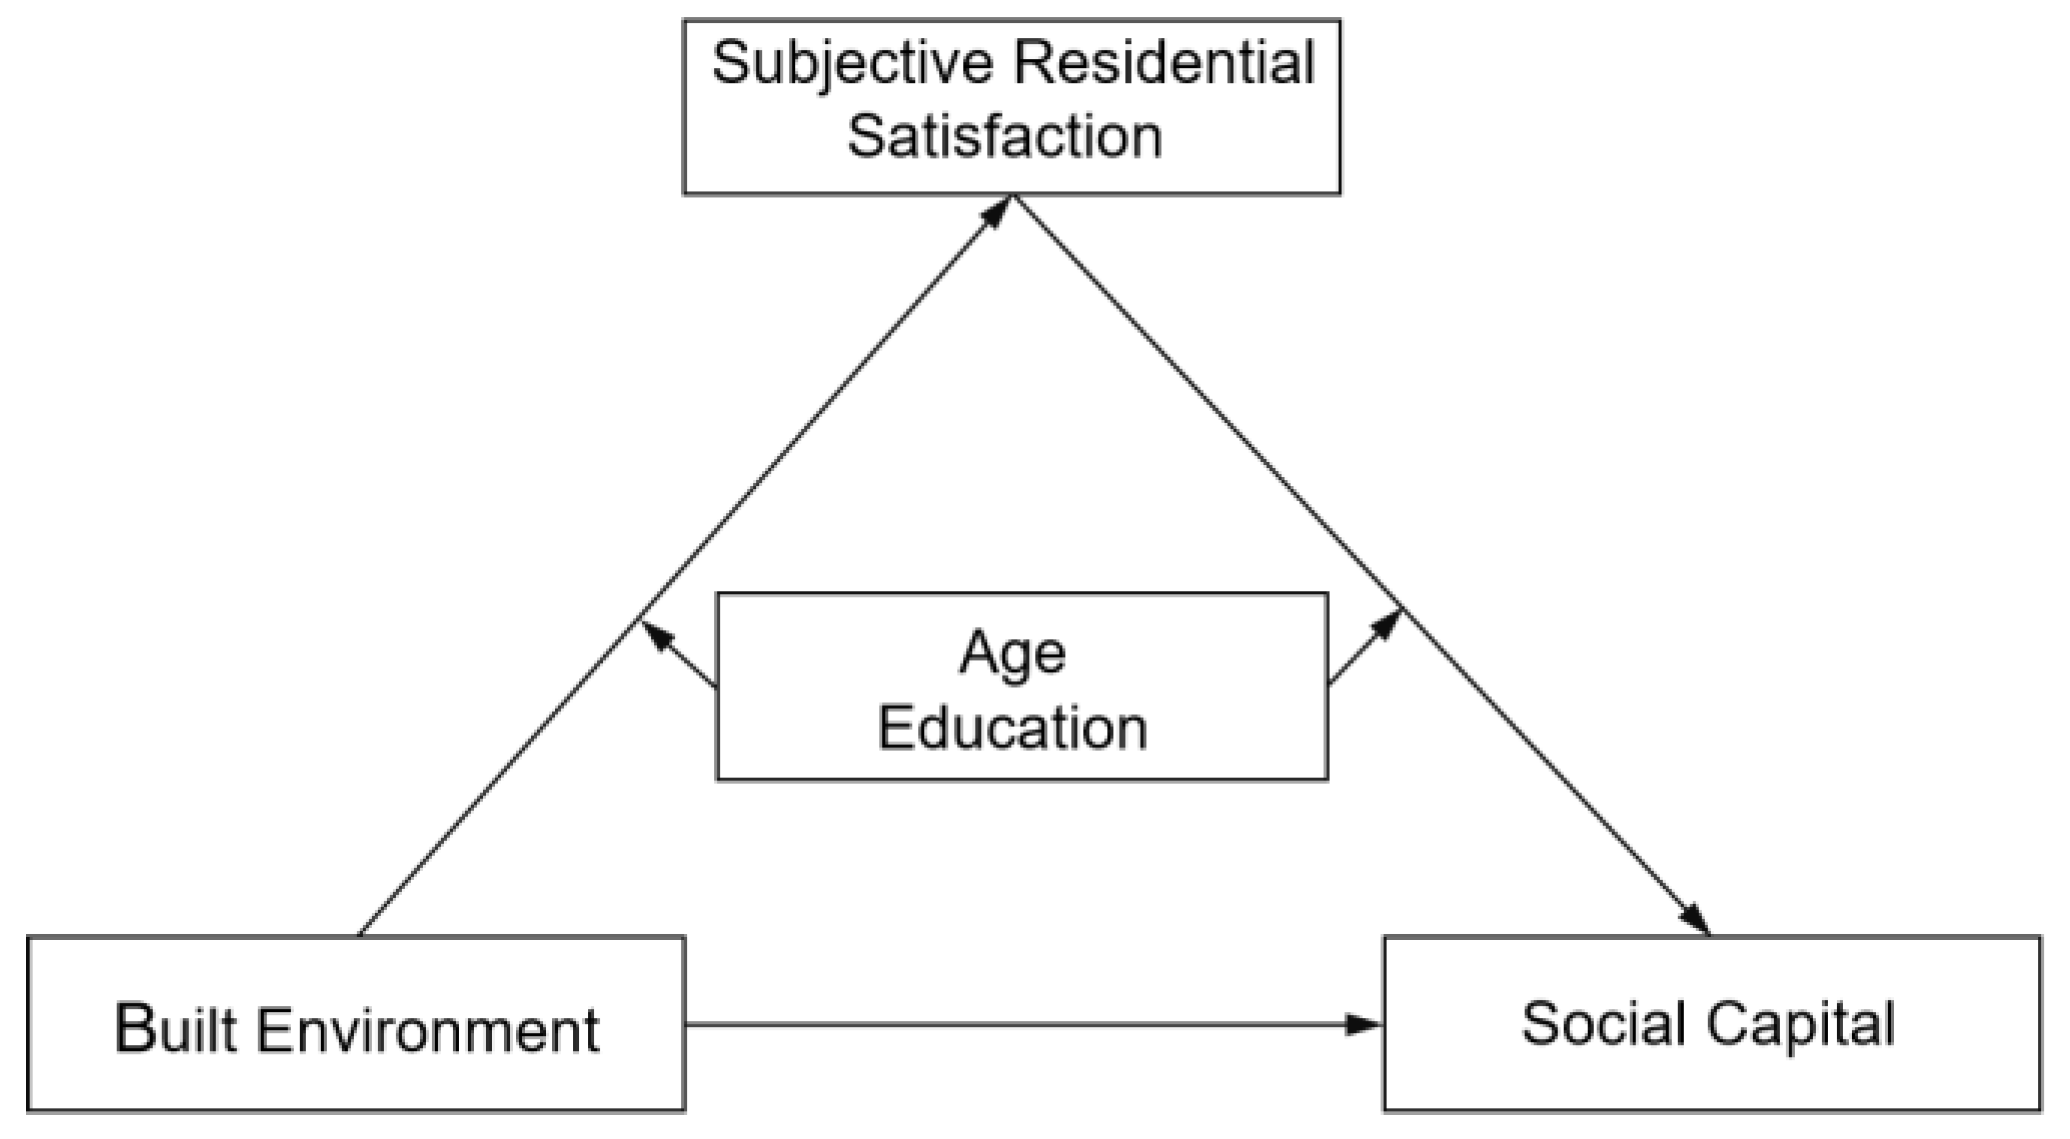
2.3. The Mediating Role of Subjective Residential Satisfaction
2.4. Moderating Variables
3. Research Methods
3.1. Data Collection and Sources
3.1.1. Local Built Environment: Indicators and Measurements
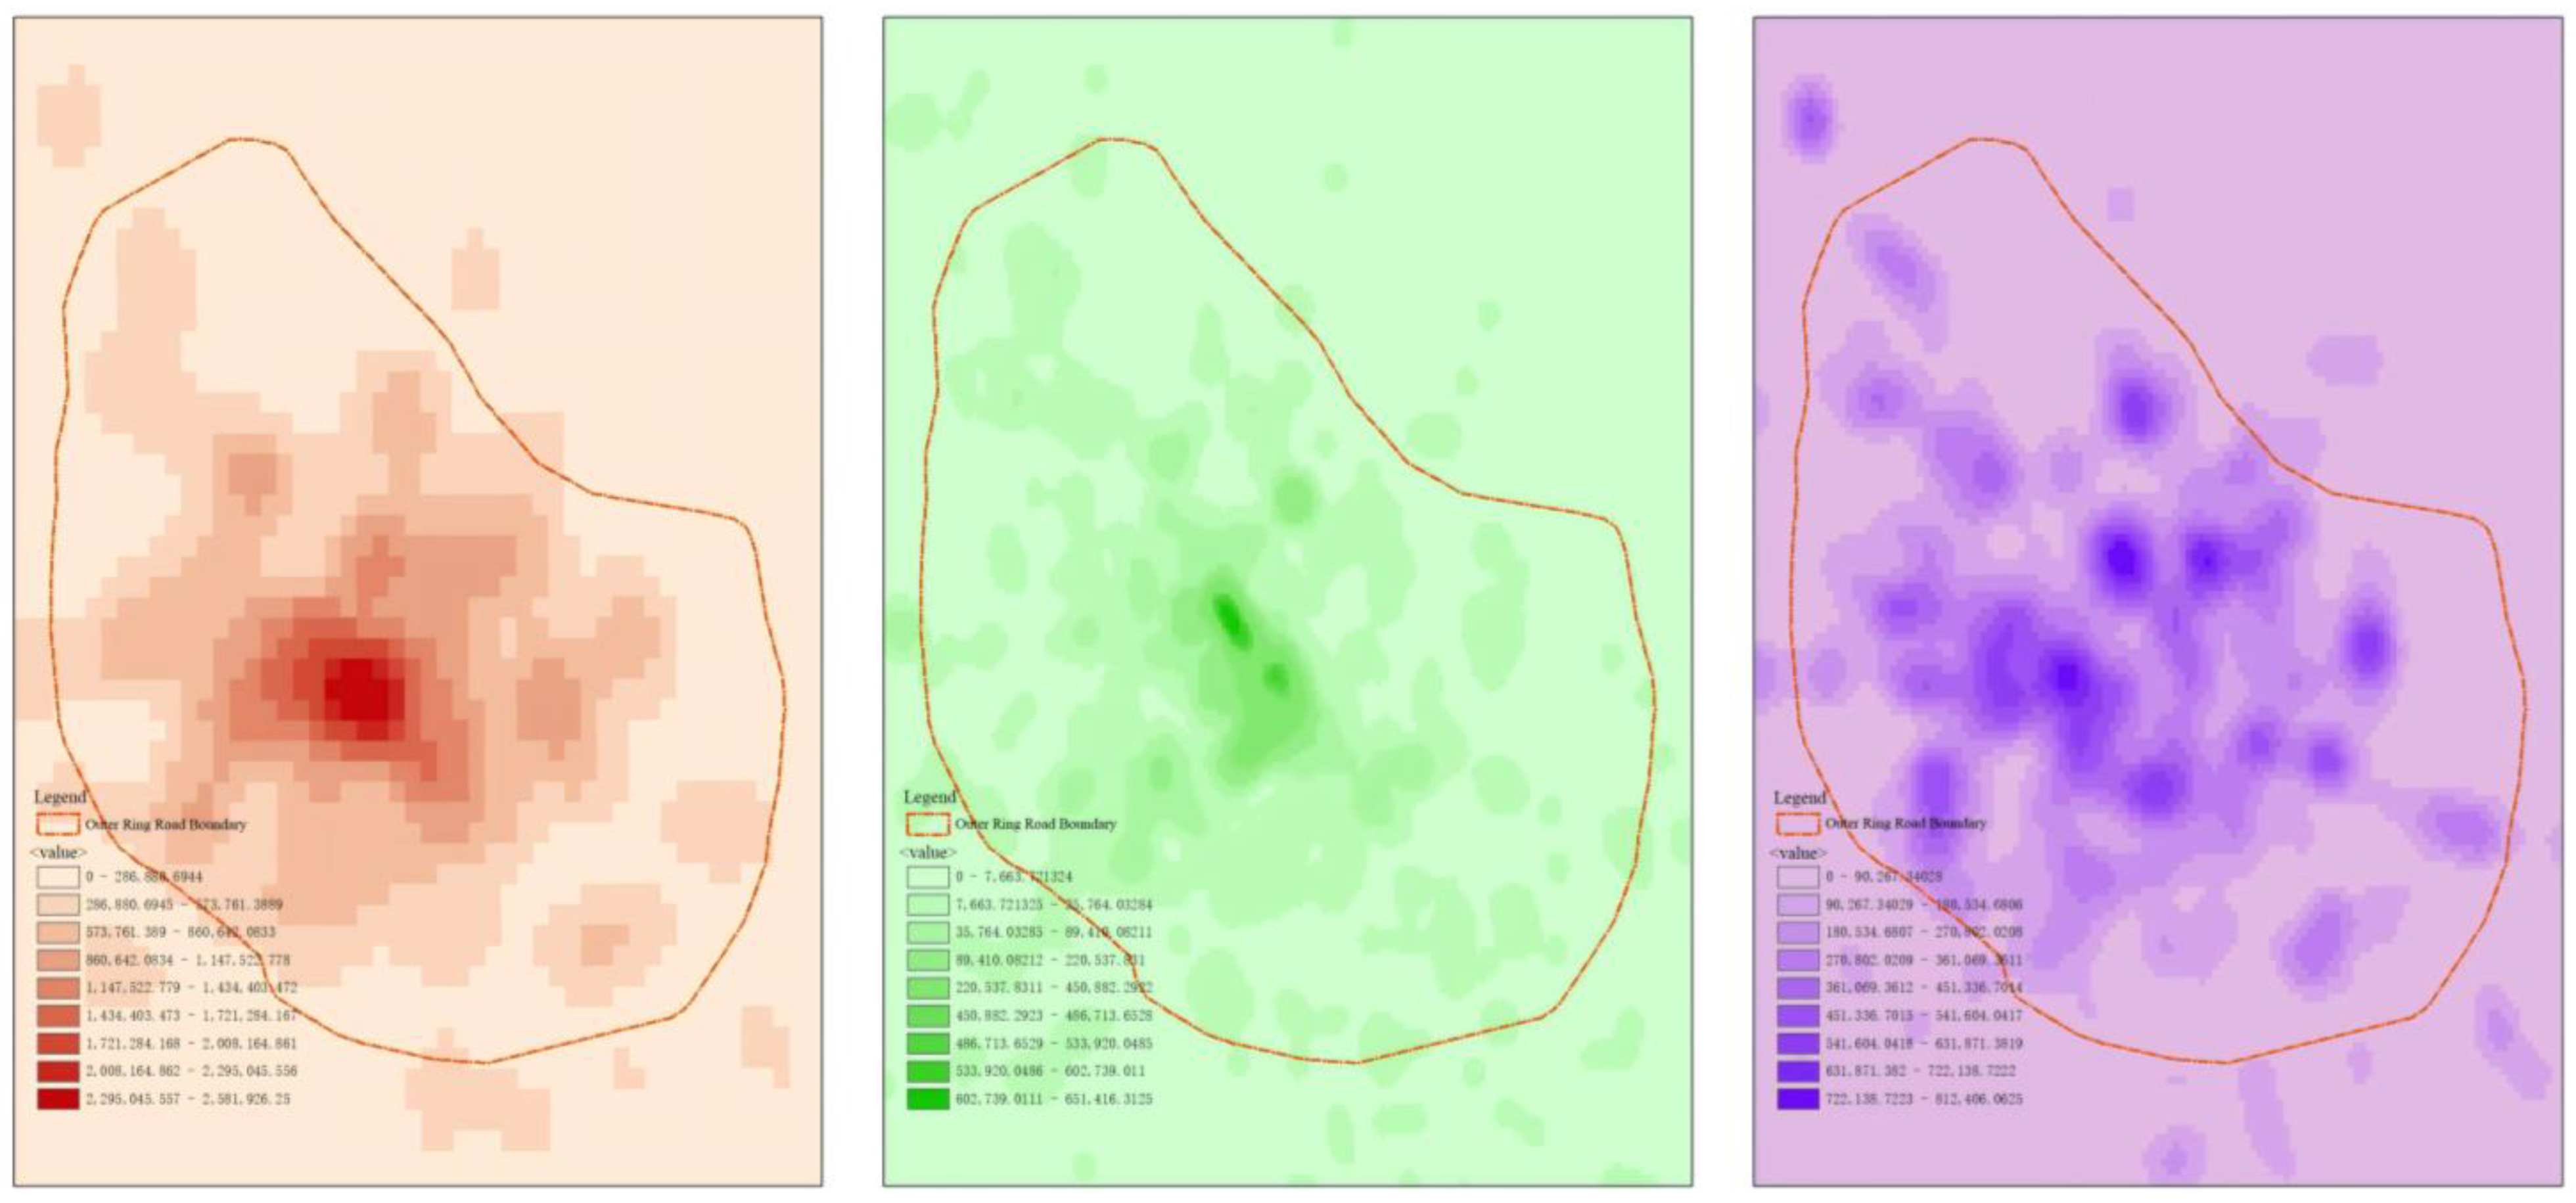
- Density: Micro-level population density data were sourced from Worldpop, which provides global population grid maps based on publicly available population data (grid size: 100 m × 100 m).
- Diversity: Land use mix entropy (Entropy Index) was used to measure diversity, calculated based on the proportion of different POI types within a 500 m buffer zone. It is calculated as in Equation (1)Si—the proportion of the number of POIs of category i to the total number of POIs within each 500 m buffer. The higher the entropy value, the closer the proportion of each type of POI in the study unit, and the more balanced the land use, that is, the higher the land use diversity.
- Design: Intersection density was used as an indicator of design, with higher intersection density indicating better street connectivity. The intersection density is calculated as in Equation (2)c—number of roadway intersections in each study unit (n); A—area of each study unit (m2). High intersection density characterizes better street connectivity, and it is generally believed that better street connectivity better meets the needs of people’s daily activity destinations, and improves the convenience and willingness of residents to travel.
- Destination Accessibility: Measurement of the respective total number of categories including parks and green spaces, commercial facilities (restaurants, cafes, supermarkets, markets, shopping centers, convenience stores, etc.), and public service facilities (hospitals, schools, community service facilities, etc.) within each community’s 15 min walkable range. Accessibility is the sum of the accessibility of each type.
- Distance to Transit: Number of accessible bus stops within walkable distance, measured by the number of bus stations within the study unit. It is calculated as in Equation (3)b—number of transit stops in each study unit (pcs); A—area of each study unit (km2).
- Enclosed pattern: The study’s measurement system for the built environment incorporates the characteristics of gated communities, which are prevalent in Asia, particularly in China. The city is now a mixture of new gated housing types and old lanes, alleys, and open blocks. The enclosed degree was measured based on physical barriers and control measures, such as walls, gates, and security checks (Table 2).
3.1.2. Social Capital: Indicators and Measurements
3.1.3. Subjective Residential Satisfaction: Indicators and Measurements
3.2. Structural Equation Modeling
4. Results
5. Discussions
6. Conclusions
7. Limitations and Future Scope
Author Contributions
Funding
Data Availability Statement
Conflicts of Interest
References
- Stedman, R.C. Is it really just a social construction?: The contribution of the physical environment to sense of place. Soc. Nat. Resour. 2003, 16, 671–685. [Google Scholar] [CrossRef]
- Ewing, R.; Cervero, R. Travel and the Built Environment. J. Am. Plann. Assoc. 2010, 76, 265–294. [Google Scholar] [CrossRef]
- Cervero, R.; Kockelman, K. Travel demand and the 3Ds: Density, diversity, and design. Transp. Res. Part D 1997, 2, 3. [Google Scholar] [CrossRef]
- Lau, S.; Wang, J.; Giridharan, R.; Ganesan, S. High-density, high-rise and multiple and intensive land use in Hong Kong: A future city form for the new millennium. In Achieving Sustainable Urban Form; Routledge: London, UK, 2006; pp. 163–176. [Google Scholar]
- Guo, Y.; Chang, S.S.; Chan, C.H.; Chang, Q.; Hsu, C.Y.; Yip, P.S. Association of neighbourhood social and physical attributes with depression in older adults in Hong Kong: A multilevel analysis. J. Epidemiol. Community Health 2020, 74, 120–129. [Google Scholar] [CrossRef]
- Brueckner, J.K.; Largey, A.G. Social interaction and urban sprawl. J. Urban Econ. 2008, 64, 18–34. [Google Scholar] [CrossRef]
- Wirth, L. Urbanism as a Way of Life. Am. J. Sociol. 1938, 44, 1–24. [Google Scholar] [CrossRef]
- Coupland, A. Reclaiming the City: Mixed Use Development; E & FN Spon: London, UK, 1997. [Google Scholar]
- Strauch, L.; Takano, G.; Hordijk, M. Mixed-use spaces and mixed social responses: Popular resistance to a megaproject in Central Lima, Peru. Habitat Int. 2015, 45, 177–184. [Google Scholar] [CrossRef]
- Bonaiuto, M.; Fornara, F.; Bonnes, M. Indexes of perceived residential environment quality and neighbourhood attachment in urban environments: A confirmation study on the city of Rome. Landsc. Urban Plan. 2003, 65, 41–52. [Google Scholar] [CrossRef]
- Moudon, A.V.; Lee, C.; Cheadle, A.D.; Garvin, C.; Johnson, D.B.; Schmid, T.L.; Weathers, R.D.; Lin, L. Operational definitions of walkable neighborhood: Theoretical and empirical insights. J. Phys. Act. Health 2006, 3, S99–S117. [Google Scholar] [CrossRef]
- Van den Berg, P.; Sharmeen, F.; Weijs-Perrée, M. On the subjective quality of social interactions: Influence of neighborhood walkability, social cohesion and mobility choices. Transp. Res. Part A 2017, 106, 309–319. [Google Scholar] [CrossRef]
- Adlakha, D.; Krishna, M.; Woolrych, R.; Ellis, G. Neighbourhood supports for active ageing in urban India. Psychol. Dev. Soc. 2020, 32, 254–277. [Google Scholar] [CrossRef]
- Mouratidis, K.; Poortinga, W. Built environment, urban vitality and social cohesion: Do vibrant neighborhoods foster strong communities? Landsc. Urban Plan. 2020, 204, 103951. [Google Scholar] [CrossRef]
- Pan, H.; Shen, Q.; Zhang, M. Influence of Urban Form on Travel Behaviour in Four Neighbourhoods of Shanghai. Urban Stud. 2009, 46, 275–294. [Google Scholar] [CrossRef]
- Putnam, R.D. Bowling alone: America’s declining social capital. J. Democr. 1995, 6, 65–78. [Google Scholar] [CrossRef]
- Dekker, P.; Uslaner, E.M. Social Capital and Participation in Everyday Life; Routledge: London, UK, 2001. [Google Scholar]
- Liu, Z.L.; Liao, L.; Niu, C.L. Residential Satisfaction of Community Social Capital: An Empirical Study of Middle and Low Income Residents In Urban Beijing. Hum. Geogr. 2015, 30, 21–27. [Google Scholar]
- Li, C.; Zhang, Y.; Liu, Z.; Chai, Y. The influence of commute duration and community activities on community social capital: A study based on 26 communities survey in Beijing. Sci. Geogr. Sin. 2021, 41, 1606–1614. [Google Scholar]
- Zhu, Y. Toward community engagement: Can the built environment help? Grassroots participation and communal space in Chinese urban communities. Habitat Int. 2015, 46, 44–53. [Google Scholar] [CrossRef]
- Leyden, K.M. Social capital and the built environment: The importance of walkable neighborhoods. Am. J. Public Health 2003, 93, 1546–1551. [Google Scholar] [CrossRef]
- Sun, B.; Lin, J.; Yin, C. Impacts of the built environment on social capital in China: Mediating effects of commuting time and perceived neighborhood safety. Travel Behav. Soc. 2022, 29, 350–357. [Google Scholar] [CrossRef]
- Yoo, C.; Lee, S. Neighborhood Built Environments Affecting Social Capital and Social Sustainability in Seoul, Korea. Sustainability 2016, 8, 1346. [Google Scholar] [CrossRef]
- Ettema, D.; Schekkerman, M. How do spatial characteristics influence well-being and mental health? Comparing the effect of objective and subjective characteristics at different spatial scales. Travel Behav. Soc. 2016, 5, 56–67. [Google Scholar] [CrossRef]
- Carbone, J.T. Bonding social capital and collective action: Associations with residents’ perceptions of their neighbourhoods. J. Community Appl. Soc. Psychol. 2019, 29, 504–519. [Google Scholar] [CrossRef]
- Wang, Y.; Shaw, D.; Yuan, K. Gated Neighborhoods, Privatized Amenities and Fragmented Society: Evidence from Residential Experience and Implications for Urban Planning. Sustainability 2018, 10, 4301. [Google Scholar] [CrossRef]
- Guo, Y.; Liu, Y.; Lu, S.; Chan, O.F.; Chui, C.H.K.; Lum, T.Y.S. Objective and perceived built environment, sense of community, and mental wellbeing in older adults in Hong Kong: A multilevel structural equation study. Landsc. Urban Plan. 2021, 209, 104058. [Google Scholar] [CrossRef]
- Du, Y.; Jiang, H.; Huang, Z.; Yang, H. Associations between neighborhood environment and sense of community belonging in urban China: Examining mediation effects of neighborly interactions and community satisfaction. Front. Public Health 2022, 10, 1105473. [Google Scholar] [CrossRef]
- Hidalgo, M.C.; Hernández, B. Attachment to the Physical Dimension of Places. Psychol. Rep. 2002, 91, 1177–1182. [Google Scholar] [CrossRef]
- Lehning, A.J.; Smith, R.J.; Kim, K. “Friendly” initiatives: An emerging approach to improve communities for vulnerable populations. J. Policy Pract. 2017, 16, 46–58. [Google Scholar] [CrossRef]
- Hipp, J.R.; Perrin, A.J. The simultaneous effect of social distance and physical distance on the formation of neighborhood ties. City Community 2009, 8, 5–25. [Google Scholar] [CrossRef]
- Wiles, J.L.; Allen, R.E.; Palmer, A.J.; Hayman, K.J.; Keeling, S.; Kerse, N. Older people and their social spaces: A study of well-being and attachment to place in Aotearoa New Zealand. Soc. Sci. Med. 2009, 68, 664–671. [Google Scholar] [CrossRef]
- Liu, Z.; Wang, K.; He, S.; Liu, Y. Gated Community in Guangzhou: Community Environment Analysis and its Effects on Community Attachment. Mod. Urban Res. 2017, 05, 16–24, 43. [Google Scholar]
- Preacher, K.J.; Rucker, D.D.; Hayes, A.F. Addressing moderated mediation hypotheses: Theory, methods, and prescriptions. Multivar. Behav. Res. 2007, 42, 185–227. [Google Scholar] [CrossRef] [PubMed]
- Greiner, K.A.; Li, C.; Kawachi, I.; Hunt, D.C.; Ahluwalia, J.S. The relationships of social participation and community ratings to health and health behaviors in areas with high and low population density. Soc. Sci. Med. 2004, 59, 2303–2312. [Google Scholar] [CrossRef] [PubMed]
- Zhang, W.; Lawson, G. Meeting and greeting: Activities in public outdoor spaces outside high-density urban residential communities. Urban Des. Int. 2009, 14, 207–214. [Google Scholar] [CrossRef]
- Henderson-Wilson, C. Sustainable highrise developments: Factors impacting on residents’ health and well-being. In Environment, Health, and Sustainable Development; Abdel-Hadi, A., Tolba, M.K., Soliman, S., Eds.; Hogrefe Publishing: Cambridge, MA, USA, 2010; pp. 59–72. [Google Scholar]
- Williams, K. Does intensifying cities make them more sustainable? In Achieving Sustainable Urban Form; Routledge: London, UK, 2000. [Google Scholar]
- Gans, H.J. The Urban Villagers: Group and Class in The Life of Italian-Americans. Am. Sociol. Rev. 1963, 28, 476. [Google Scholar]
- Makhale, S.; Landman, K. Gating and conflicting rationalities: Challenges in practice and theoretical implications. Int. Plan. Stud. 2018, 23, 130–143. [Google Scholar] [CrossRef]
- Ruiu, M.L. Differences between Cohousing and Gated Communities. A Literature Review. Sociol. Inq. 2014, 84, 316–335. [Google Scholar] [CrossRef]

| Author(s) | Dimensions | Measuring Indicators/Questionnaire Items |
|---|---|---|
| Putnam [16], Liu et al. [18], Li et al. [19] | Social Trust | Informal social capital on which we happen to have reasonably reliable time-series data involves neighborliness, measured by social time spent with neighbors. The number of neighbors that residents frequently acknowledged with a greeting and the number of neighbors considered as friends within a community. |
| Leyden [21], Zhu [20] | Social Network | Mutual trust among neighbors in the community, shared values, willingness to help each other, and residents’ trust in community organizations. |
| Liu et al. [18], Zhu [20], Putnam [16] | Community Trust | Resident relationships, children’s safety, and night-time safety, a vibrant civic life in soils traditionally inhospitable to self-government. |
| Dekke & Uslaner [17], Zhu [20] | Neighborhood Reciprocity | Accessibility of medical facilities, mutual trust in helping, sense of responsibility, neighborhood connection, and community identity. |
| Zhu [20], Adlakh [13], Mouratidis & Poortinga [14] | Social Support | Family support and community support; social participation in community spaces; feel that neighbors help one another. |
| Dimension | Observation Indicator | Scoring Method |
|---|---|---|
| Physical Measures | The community has walls or fences at its boundaries. | Score 1 if present in the community, 0 if not |
| There are signs at the entrance restricting strangers from entering. | ||
| There are electronic surveillance devices inside and outside the community. | ||
| Control Measures | Visitors need to be questioned and registered when entering the community. | |
| There are security guards at the entrance. |
| Dimension | Item | Measure |
|---|---|---|
| Community Interaction | Interact with your neighbors, such as chatting and having casual conversations in daily life. | 1 = Never interact, 2 = Rarely interact, 3 = Just know each other but don’t interact, 4 = Interact quite a lot, 5 = Interact a great deal |
| Neighbors often take care of each other. | 1 = Strongly disagree, 2 = Disagree, 3 = Neutral, 4 = Agree, 5 = Strongly agree | |
| There is a lot of interaction among neighbors. | ||
| Community Trust | Most residents can be trusted. | 1= Strongly distrust, 2 = Distrust, 3 = Neutral, 4 = Trust, 5 = Strongly trust |
| How much do you trust the neighborhood committee/village committee staff? | ||
| How much do you trust the property service staff? | ||
| How much do you trust the members of the homeowners’ committee? | ||
| How much do you trust the community workers? |
| Evaluation Dimension | Evaluation Indicator | Evaluation Method |
|---|---|---|
| satisfaction with the environment | The community has excellent sanitation. | Likert Scale, scored from 1–5 |
| The community has excellent greening. | ||
| satisfaction with services | The schools near the community are very good. | |
| The medical facilities near the community are very convenient. | ||
| There are good vegetable markets/convenience stores in and around the community. | ||
| There are good restaurants in and around the community. | ||
| The public transportation around the community is very convenient. | ||
| satisfaction with livability | The community is very suitable for children to grow up in. | |
| The community is very suitable for the elderly to live in. |
| Community-Level Variance | Individual-Level Variance | ICC | |
|---|---|---|---|
| Social Capital | 0.023 | 0.041 | 0.360 |
| Subjective Residential Satisfaction | 0.196 | 9.219 | 0.021 |
| Variable | Variable Type | Definition | Mean | Standard Deviation | Minimum | Maximum |
|---|---|---|---|---|---|---|
| Population Density | Continuous Variable | Population/Research Unit Area | 29,800 people/km2 | 24,700 | 300 people/km2 | 87,900 people/km2 |
| Plot Ratio | Variable Type | Total Building Area/Research Unit Area | 1.60 | 0.57 | 0.80 | 3.87 |
| Land Use Mix | Continuous Variable | Mixture degree | 1.86 | 0.22 | 1.42 | 2.46 |
| Road Intersection Density | Continuous Variable | Number of Intersections/Research Unit Area | 53.48 | 30.70 | 7.52 intersections/km2 | 104.96 intersections/km2 |
| Bus Stop Density | Continuous Variable | Number of Bus Stops/Research Unit Area | 10.3 | 8.78 | 2 | 24 |
| Accessibility of Commercial Amenities | Continuous Variable | Distance to amenities | 14.54 | 10.45 | 3 | 45 |
| Accessibility of Green Space and Parks | Continuous Variable | Distance to spaces | 6.19 | 8.91 | 0 | 43 |
| Accessibility of Public Service | Continuous Variable | Distance to services | 26.64 | 84.96 | 19 | 327 |
| Community Enclosed pattern | Continuous Variable | Enclosed Degree | 4.60 | 1.76 | 1 | 7 |
| Kaiser–Meyer–Olkin Measure of Sampling Adequacy | Kaiser–Meyer–Olkin Measure of Sampling Adequacy | 0.857 |
|---|---|---|
| Bartlett’s Test of Sphericity | Approximate Chi-Square | 2245.717 |
| df | 190 | |
| Sig. | 0.000 |
| Fit Index | CMIN/DF | RMSEA | SRMR | SRMR | CFI | TLI |
|---|---|---|---|---|---|---|
| Standard | ≤3 for good fit; ≤5 for reasonable fit | <0.08 | ≤0.05 for good fit; ≤0.08 for reasonable fit | ≤0.05 for good fit; ≤0.08 for reasonable fit | >0.90 | >0.90 |
| Calculation Results | 3.213 | 0.072 | 0.021 | 0.067 | 0.942 | 0.913 |
| Item | Categories | Frequency | Percentage |
|---|---|---|---|
| Gender | Male | 923 | 54.8 |
| Female | 761 | 45.2 | |
| Age | 18–29 | 145 | 8.6 |
| 30–39 | 254 | 15.1 | |
| 40–49 | 381 | 22.6 | |
| 50–59 | 334 | 19.8 | |
| 60 and above | 570 | 33.8 | |
| Educational Level | Never attended school | 15 | 0.9 |
| Elementary School | 69 | 4.1 | |
| Middle School | 394 | 23.4 | |
| High School/Vocational school | 484 | 28.7 | |
| Associate Degree | 303 | 18.0 | |
| Bachelor’s degree | 339 | 20.1 | |
| Graduate student | 80 | 4.8 | |
| Occupation | General staff | 510 | 30.3 |
| Middle and senior managers | 198 | 11.8 | |
| Retired | 893 | 53.0 | |
| Individual business and freelancers | 34 | 2.0 | |
| Students | 45 | 2.7 | |
| Others | 4 | 0.2 |
| Model 1 (Social Capital) | Model 2-a (Subjective Residential Satisfaction) | Model 2-b (with Mediating Variable—Social Capital) | |||||
|---|---|---|---|---|---|---|---|
| Coefficient | Standard Error | Coefficient | Standard Error | Coefficient | Standard Error | ||
| B | Standard Error | B | Standard Error | B | Standard Error | ||
| Intercept | −0.836 ** | 0.087 | 0.148 ** | 0.193 | −0.504 ** | 0.102 | |
| Variables | |||||||
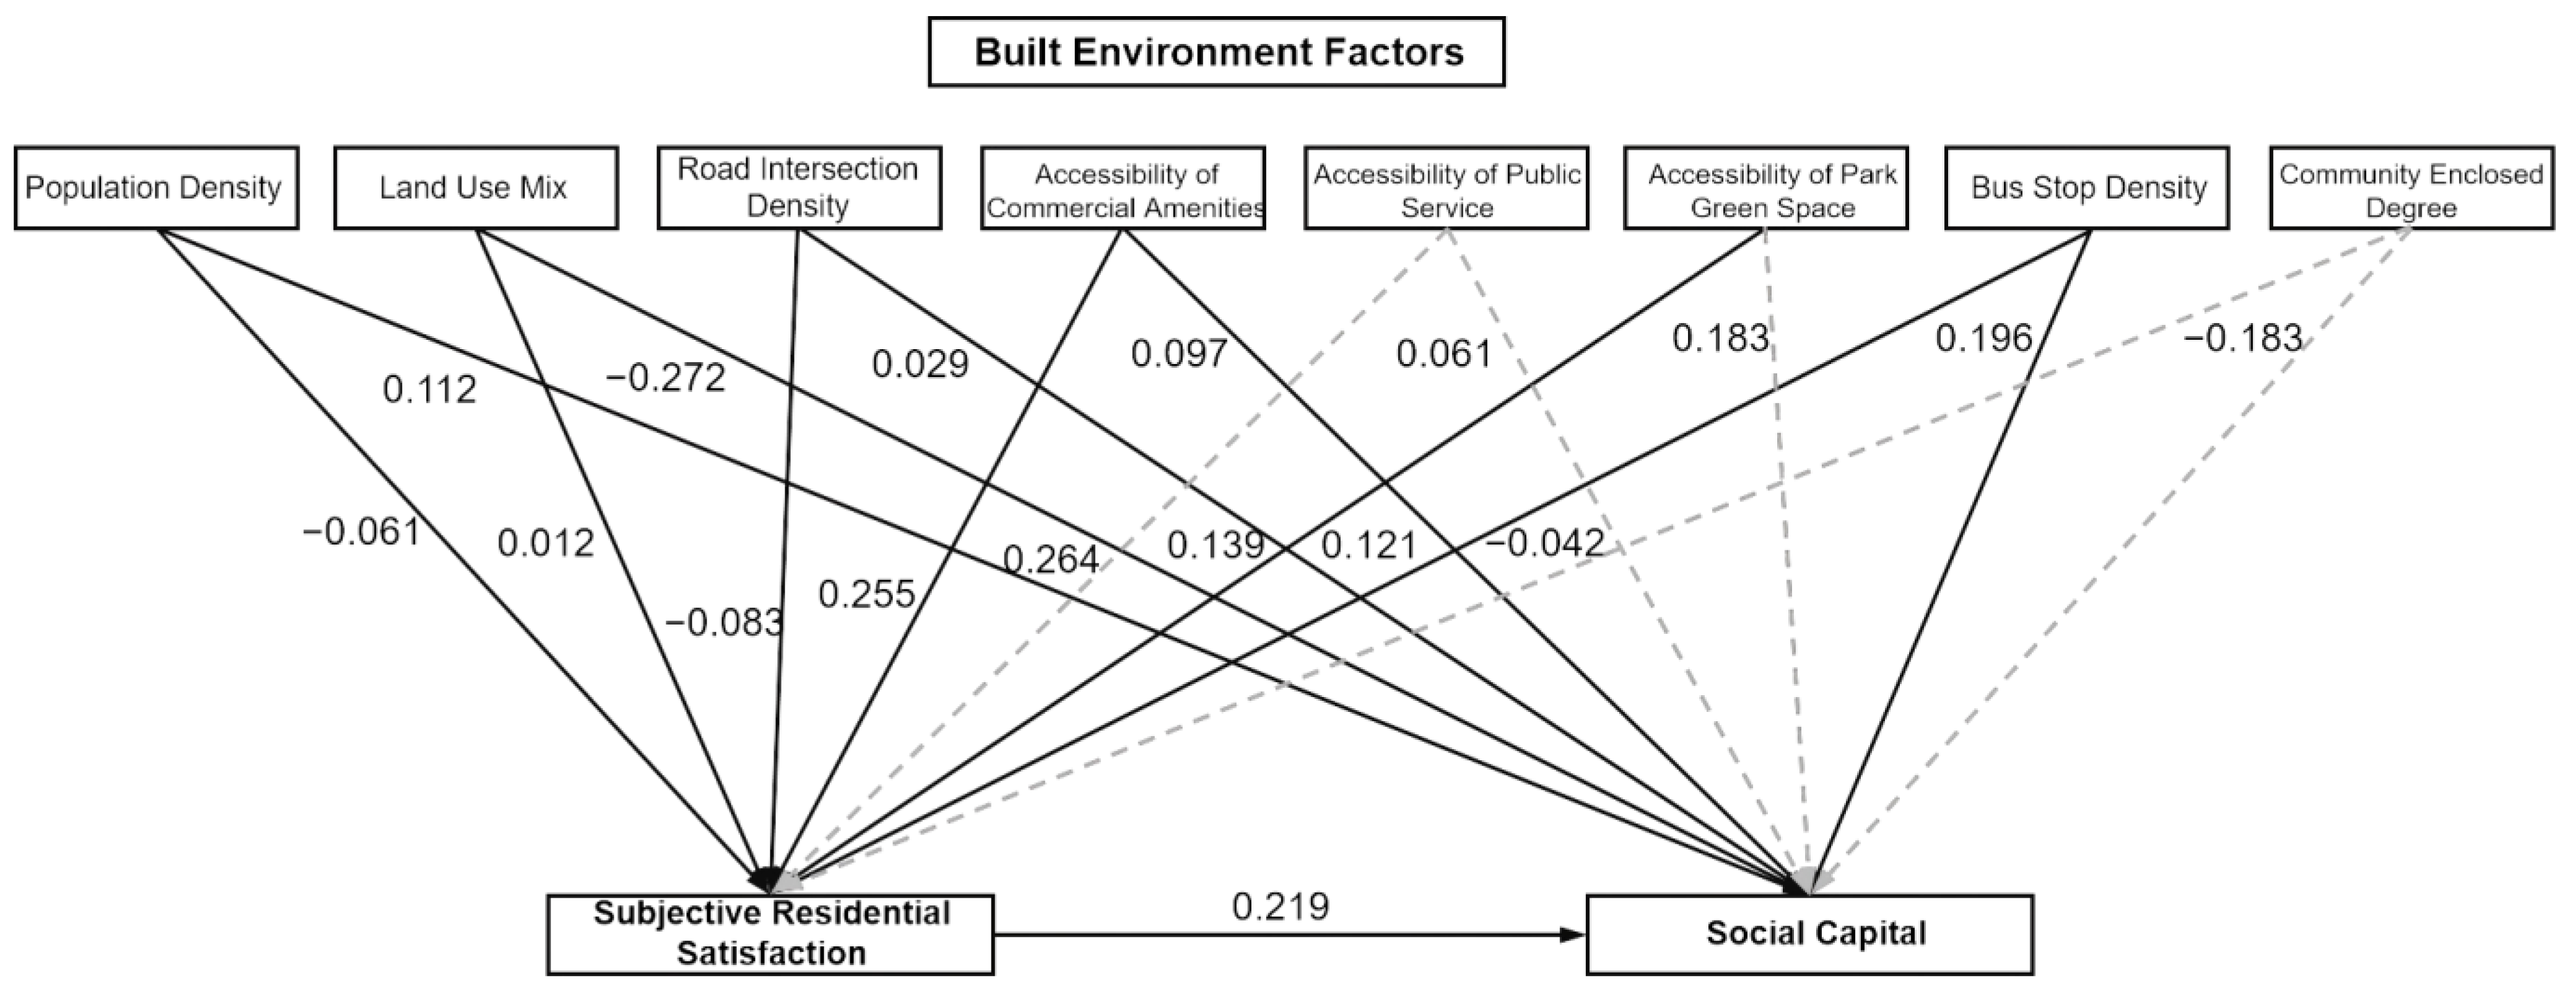
| Community-level Variables | Population Density | 0.112 ** | 0.026 | 0.061 ** | 0.064 | 0.12 ** | 0.324 |
| Land Use Mix | −0.272 ** | 0.103 | 0.012** | 0.008 | −0.271 ** | 0.204 | |
| Road Intersection Density | 0.029 ** | 0.063 | 0.083 ** | 0.062 | 0.03 ** | 0.101 | |
| Accessibility of Commercial Amenities | 0.097 ** | 0.313 | 0.255 ** | 0.386 | 0.027 ** | 0.068 | |
| Accessibility of Public Service | 0.061 | 0.211 | 0.264 | 0.061 | 0.176 | 0.188 | |
| Accessibility of Park Green Space | 0.183 ** | 0.051 | 0.139 | 0.084 | 0.184 | 0.06 | |
| Bus Stop Density | 0.196 ** | 0.053 | 0.121 * | 0.121 | 0.128 * | 0.088 | |
| Community Enclosed Pattern | −0.018 | 0.051 | −0.042 | 0.155 | −0.018 | 0.176 | |
| Individual-level Variables | age | 0.132 | 0.142 | 0.014 | 0.033 | 0.054 | 0.039 |
| education | −0.07 | 0.04 | -0.057 | 0.012 | −0.052 | 0.193 | |
| Mediating Variable | Subjective Residential Satisfaction | 0.219 ** | 0.512 | ||||
| Model Fit | CMIN/DF | 3.801 | 2.231 | ||||
| CFI | 0.901 | 0.974 | |||||
| RMSEA | 0.071 | 0.062 | |||||
| SRMR(within) | 0.035 | 0.021 | |||||
Disclaimer/Publisher’s Note: The statements, opinions and data contained in all publications are solely those of the individual author(s) and contributor(s) and not of MDPI and/or the editor(s). MDPI and/or the editor(s) disclaim responsibility for any injury to people or property resulting from any ideas, methods, instructions or products referred to in the content. |
© 2025 by the authors. Licensee MDPI, Basel, Switzerland. This article is an open access article distributed under the terms and conditions of the Creative Commons Attribution (CC BY) license (https://creativecommons.org/licenses/by/4.0/).
Share and Cite
Wang, Y.; Su, H.; Zeng, P.; Wang, Y.P.; Sun, T.; Cheng, L. How Does the Built Environment Influence Social Capital in the Community Context: The Mediating Role of Subjective Residential Satisfaction. Buildings 2025, 15, 2068. https://doi.org/10.3390/buildings15122068
Wang Y, Su H, Zeng P, Wang YP, Sun T, Cheng L. How Does the Built Environment Influence Social Capital in the Community Context: The Mediating Role of Subjective Residential Satisfaction. Buildings. 2025; 15(12):2068. https://doi.org/10.3390/buildings15122068
Chicago/Turabian StyleWang, Yu, Hang Su, Peng Zeng, Ya Ping Wang, Tao Sun, and Lingcan Cheng. 2025. "How Does the Built Environment Influence Social Capital in the Community Context: The Mediating Role of Subjective Residential Satisfaction" Buildings 15, no. 12: 2068. https://doi.org/10.3390/buildings15122068
APA StyleWang, Y., Su, H., Zeng, P., Wang, Y. P., Sun, T., & Cheng, L. (2025). How Does the Built Environment Influence Social Capital in the Community Context: The Mediating Role of Subjective Residential Satisfaction. Buildings, 15(12), 2068. https://doi.org/10.3390/buildings15122068