Article

Numerical Simulation of Freezing-Induced Crack Propagation in Fractured Rock Masses Under Water–Ice Phase Change Using Discrete Element Method

1
School of Transportation and Civil Engineering, Nantong University, Nantong 226019, China
2
Department of Mechanical Engineering, Huzhou University, Huzhou 313002, China
*
Authors to whom correspondence should be addressed.
Buildings 2025, 15(12), 2055; https://doi.org/10.3390/buildings15122055
Submission received: 16 May 2025 / Revised: 10 June 2025 / Accepted: 13 June 2025 / Published: 15 June 2025
(This article belongs to the Special Issue Low Carbon and Green Materials in Construction—3rd Edition)

Abstract

In cold-region rock engineering, freeze–thaw cycle-induced crack propagation in fractured rock masses serves as a major cause of disasters such as slope instability. Existing studies primarily focus on the influence of individual fissure parameters, yet lack a systematic analysis of the crack propagation mechanisms under the coupled action of multiple parameters. To address this, we establish three groups of slope models with different rock bridge distances (d), rock bridge angles (α), and fissure angles (β) based on the PFC2D discrete element method. Frost heave loads are simulated by incorporating the volumetric expansion during water–ice phase change. The Parallel Bond Model (PBM) is used to capture the mechanical behavior between particles and the bond fracture process. This reveals the crack evolution laws under freeze–thaw cycles. The results show that, at a short rock bridge distance of d = 60 m, stress concentrates in the fracture zone. This easily leads to the rapid penetration of main cracks and triggers sudden instability. At a long rock bridge distance where d ≥ 100 m, the degree of stress concentration decreases. Meanwhile, the stress distribution range expands, promoting multiple crack initiation points and the development of branch cracks. The number of cracks increases as the rock bridge distance grows. In cases where the rock bridge angle is α ≤ 60°, stress is more likely to concentrate in the fracture zone. The crack propagation exhibits strong synergy, easily forming a penetration surface. When α = 75°, the stress concentration areas become dispersed and their distribution range expands. Cracks initiate earliest at this angle, with the largest number of cracks forming. Cumulative damage is significant under this condition. When the fissure angle is β = 60°, stress concentration areas gather around the fissures. Their distribution range expands, making cracks easier to propagate. Crack propagation becomes more dispersed in this case. When β = 30°, the main crack rapidly penetrates due to stress concentration, inhibiting the development of branch cracks, and the number of cracks is the smallest after freeze–thaw cycles. When β = 75°, the freeze–thaw stress dispersion leads to insufficient driving force, and the number of cracks is 623. The research findings provide a theoretical foundation for assessing freeze–thaw damage in fractured rock masses of cold regions and for guiding engineering stability control from a multi-parameter perspective.

1. Introduction

Freeze–thaw damage causes rock mass instability, a common natural disaster in high-cold regions [1,2,3,4]. Under long-term geological and environmental effects, initial damage structures form in rocks, including pores, joints, cracks, and discontinuities. These structures result in rock heterogeneity [5,6]. The heterogeneity of rocks has a significant impact on their failure processes, failure modes, and macroscopic mechanical properties [7,8]. In cold regions with low-temperature environments, day–night freeze–thaw cycles occur. These cycles accelerate the development of micro-damage within the rock [9]. During continuous freeze–thaw cycles, the tips of adjacent discontinuous joints are subjected to external forces. This causes mineral particles to slide and dislocate. Such movements promote the continuous initiation and propagation of microcracks within the rock [10]. As shown in Figure 1, discontinuous structural planes rapidly evolve into connected slip surfaces. This ultimately leads to the loss of rock bearing capacity. These developments thereby become a potential cause of geological hazards in cold regions, such as rockfalls and landslides [11,12]. Thus, understanding the mechanical behavior and cracking patterns of flawed rocks under freeze–thaw cycles and loading is critical for rock engineering in cold regions, especially in rock slope and tunnel engineering [13].
The mechanical properties of rocks during freeze–thaw cycles have long received extensive attention from domestic and foreign scholars. For example, Shi et al. [12] developed an elastoplastic damage constitutive model for fractured rocks by integrating energy conservation principles, fracture mechanics, and statistical damage theory, focusing on fracture behavior under uniaxial loading. Tang et al. [14] carried out a set of freeze–thaw tests on rock-analogous materials. The research was intended to explore the crack propagation and interaction caused by freezing, which were influenced by stress states and pre-existing fractures. Yu et al. [1] conducted freeze–thaw cycle tests to analyze the effects of these inclinations on the mechanical properties of rocks, crack propagation, and fracture mechanisms. Wang et al. [15] carried out shear tests on “concrete-rock” composite specimens to study the shear stress characteristics of the “concrete-rock” interface during freeze-thaw damage. Yu et al. [16] performed physical and mechanical tests on Sichuan sandstone samples exposed to long-term freeze–thaw (F-T) cycles. The study aimed to quantify and investigate the relationship between cycle numbers and the deterioration of rock physical and mechanical properties. Zhang et al. [17] carried out laboratory tests on enclosed unsaturated soil columns undergoing freeze–thaw cycles. Based on the experimental data, a thermo-hydro-mechanical (THM) coupling model was developed to simulate freeze–thaw processes in unsaturated soils. Wang et al. [18] carried out triaxial compression tests on silty mudstone under different freeze–thaw temperatures and cycle counts, evaluating the impact of these factors on the physical and mechanical properties of the specimens. Zhang et al. [19] used field and laboratory tests to study the degradation of compressive and shear strengths in basalt under freeze–thaw cycles. They analyzed the microscopic damage mechanisms on fracture surfaces before and after cycling. Hou et al. [20] conducted uniaxial compression tests on low-porosity quartzite subjected to different amounts of freeze–thaw cycles. They investigated the mechanical deterioration of low-porosity quartzite following freeze–thaw cycling. Liang et al. [21] conducted physical model tests on the instability of planar sliding slopes under repeated freeze–thaw cycles. The tests revealed the instability mechanisms of planar sliding rock slopes during freeze–thaw cycling. Zhang et al. [22] performed freeze–thaw tests on water-saturated red sandstone. They explored the evolution of pores from a mesoscopic perspective and analyzed the mesoscopic mechanisms of damage development. Yin et al. [23] investigated the mechanical behavior and failure mechanisms of sandstone with defects under freeze–thaw (F-T) cycles and uniaxial compression. They analyzed how varying cycle numbers affect crack propagation and failure modes in defective specimens. Chen et al. [24] conducted freeze–thaw cycle tests on rock mass specimens with varying fracture densities. They observed freeze–thaw damage and fracture mechanisms in these specimens and analyzed the mechanical properties of fractured rock masses under different fracture densities and freeze–thaw conditions. Huang et al. [25] performed freeze–thaw and uniaxial compression tests on cracked rock-like materials. They investigated crack propagation induced by freeze–thaw and failure modes under loading in saturated cracked specimens after freeze–thaw cycles. Li et al. [26] conducted dynamic loading tests on sandstone after freeze–thaw cycles using the SHPB system. They analyzed the rock’s dynamic parameters to clarify how freeze–thaw cycles influence pore structure evolution and dynamic mechanical properties. However, theoretical and experimental studies struggle to investigate the underlying mechanical mechanisms of freeze–thaw damage in rock.
During freeze–thaw cycles, water in rock fissures undergoes a water–ice phase change. This induces freeze–thaw damage cracks within the rock and affects its mechanical properties. The particle flow method based on the discrete element method (DEM) can well simulate the full process of crack initiation and propagation within rock. It can further explore the freeze–thaw degradation mechanisms of rock. For example, Gou et al. [27] used PFC2D to analyze rock–concrete composite specimens with different interface angles via quantitative and qualitative methods. They studied the cracking stress and evolution of crack types in these specimens during freeze–thaw (F-T) cycles. Zhang et al. [28] used PFC to simulate single-crack sandstone-like specimens with different crack angles and F-T cycle numbers. They proposed five crack propagation modes for such specimens under freeze–thaw cycles. Wang et al. [29] used PFC software to conduct discrete element analysis on rock with pre-existing cracks. They investigated the micro-crack propagation patterns under freeze–thaw cycles and analyzed the characteristics of energy changes from a microscale perspective. Li et al. [30] adopted discrete element method (DEM)-based numerical models to simulate slopes featuring randomly distributed initial cracks. They simulated the whole process of landslide initiation in these slopes during freeze–thaw cycles. Zhang et al. [31] utilized PFC 3D software to conduct simulations of freeze–thaw (F-T) cycles and shear tests on rock masses. They studied the micro-damage evolution of fracture behavior at rock–concrete interfaces after F-T cycles during loading. Li et al. [32] used PFC2D to simulate the changes in physical and mechanical properties of rock-like materials under freeze–thaw (F-T) cycles. They investigated the mechanisms of crack propagation during specimen failure. Sun et al. [33] developed a particle flow model for simulating freeze–thaw cycles in rock samples based on experimental data and the theory of water–ice phase-induced volume expansion. They revealed the laws of mesoscopic fracture evolution in rock samples during freeze–thaw cycles. Li et al. [34] used PFC2D to study mesoscopic damage in fractured rock under freeze–thaw cycles and loading via a water particle expansion method. They explored the macro-mesoscopic damage mechanisms of cross-jointed sandstone during freeze–thaw. Sun et al. [35] proposed a new 3D FDEM numerical framework. They integrated key processes like water–ice phase transition and ice–rock interaction to study frost cracking mechanisms. Shi et al. [36] employed the discrete element method (DEM) to discuss the fracture features of sandstone during freeze–thaw fatigue cycles by examining crack propagation, crack types, and mesoscopic force field responses. Yu et al. [37] used an improved DEM to analyze temperature field distributions within rock during freeze–thaw (F-T) cycles. They quantified the correlation between rock mechanical parameters and F-T cycle numbers. Therefore, the discrete element method (DEM) can effectively simulate the freeze–thaw damage mechanisms in rock [38].
In research on freeze-heave crack propagation in fractured slopes, most studies only focus on individual fissure parameters, such as rock bridge spacing, rock bridge angle, and fissure angle. Most studies have not fully considered the synergistic mechanisms of crack propagation under combined multiple parameters. This has limited the understanding of mesoscopic evolution patterns in fractured slopes experiencing freeze-heave failure. To tackle this limitation, this study employed the PFC2D discrete element method to design three groups of fractured slope models. These models incorporate varying rock bridge spacings (d), rock bridge angles (α), and fracture angles (β). To simulate freeze-heave loading, we used water–ice phase-change volume expansion. The Parallel Bond Model (PBM) was employed to reproduce inter-particle mechanical behavior and bond breaking processes. Using numerical simulation results, this study analyzed crack initiation mechanisms and propagation patterns under various parameter settings. This study provides a theoretical basis for freeze–thaw damage assessment and stability control of fractured rock masses in cold-region engineering projects such as those in rock slopes.

2. Numerical Simulation Based on PFC2D

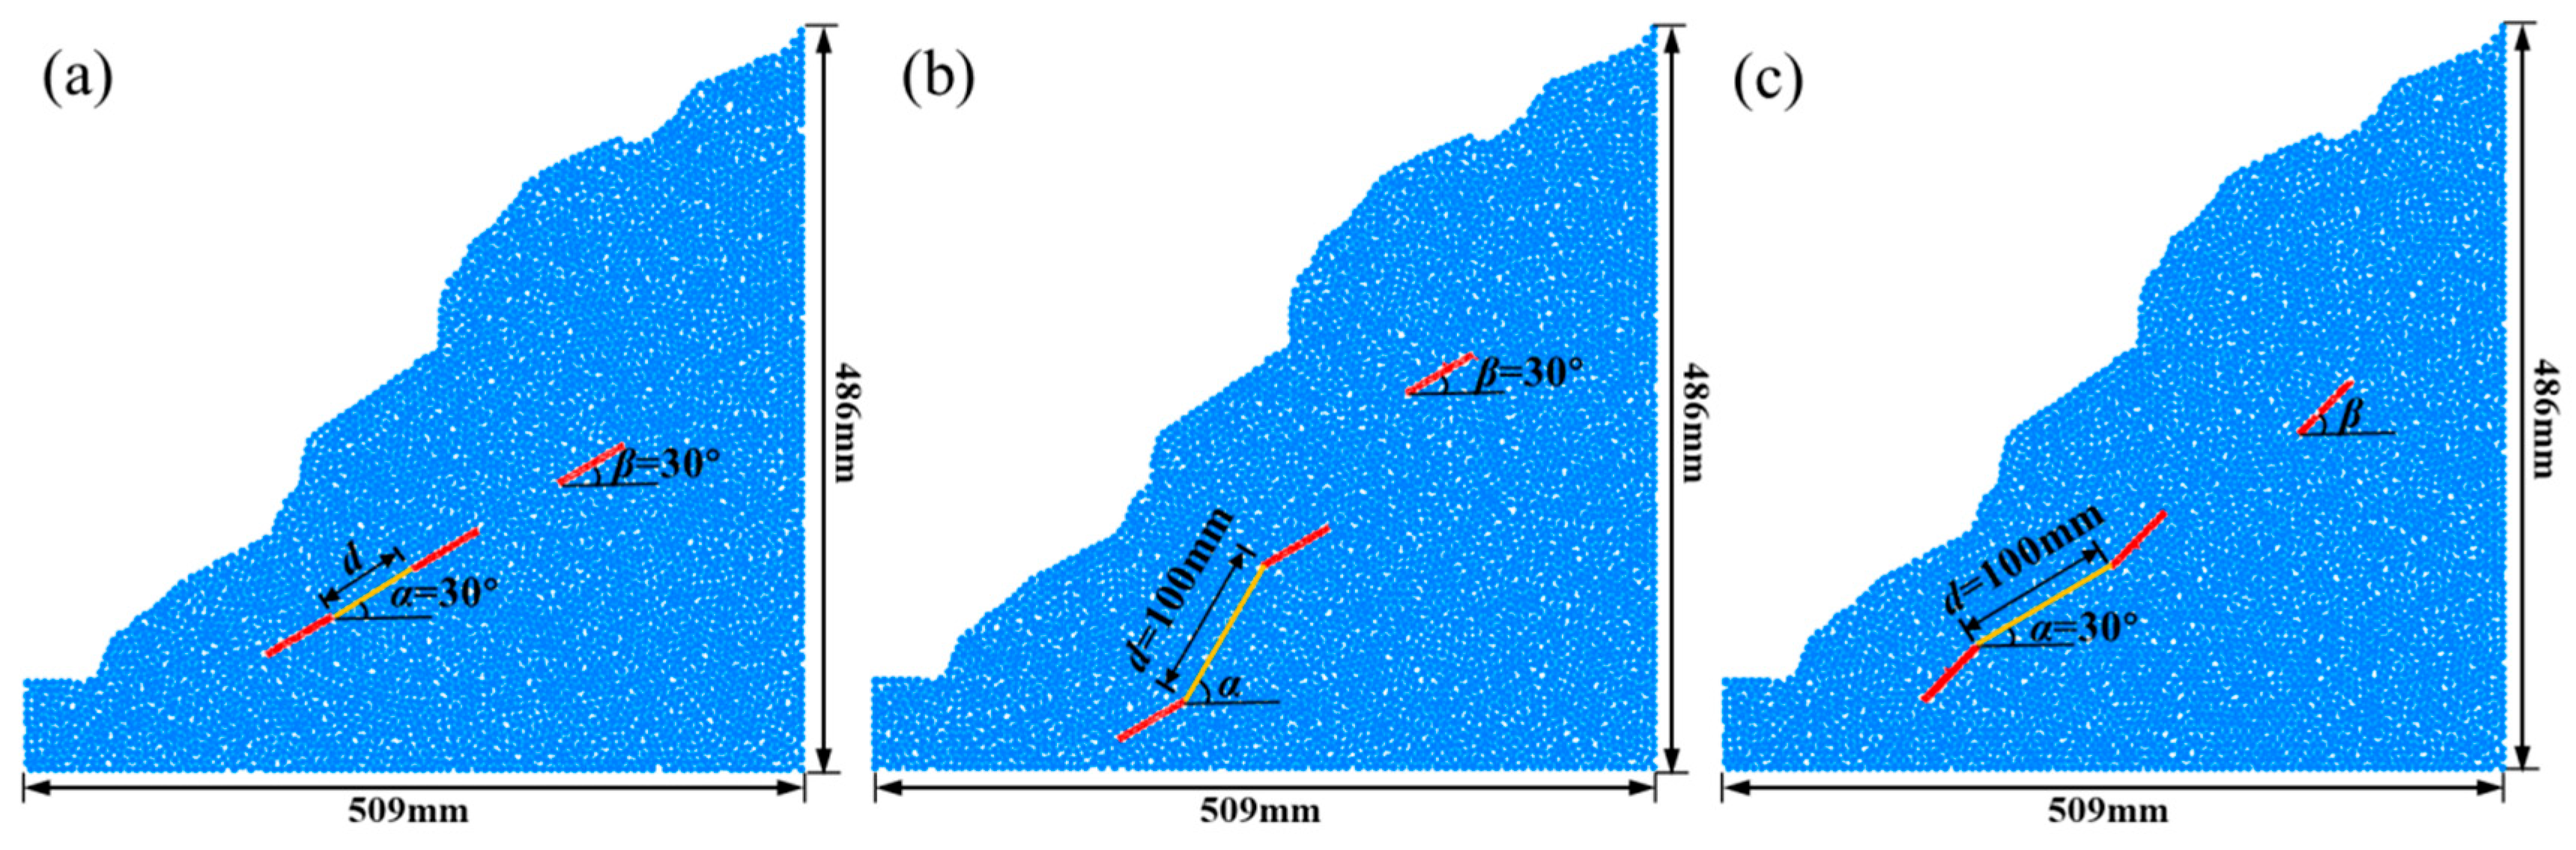
2.1. Numerical Simulation Scheme

This study designed three groups of specimen models to simulate fissures distributed across different ranges, the specific scheme is shown in Table 1. The slope model is 486 m in height and 509 m in length, as shown in Figure 2. Specimens are divided into three groups: Group A includes a rock bridge angle α = 30°, fissure angle β = 30°, with rock bridge spacing d set as 60 m, 80 m, 100 m, or 120 m; Group B includes a fissure angle β = 30°, rock bridge spacing d = 100 m, with rock bridge angle α set as 30°, 45°, 60°, or 75°; Group C includes a rock bridge angle α = 30°, rock bridge spacing d = 100 m, with fissure angle β set as 30°, 45°, 60°, 75°. The model is divided into a total of 5359 particles. The bottom and both sides of the model are subject to fixed constraints (u = 0, v = 0), and the top is a free boundary; the temperature field is loaded according to the cosine function T = 20 · cos ( π t / 30 ) with a period of 60 h. The model also applies self-weight stress with ρ = 2600 kg/m3 and g = 9.8 m/s2 to simulate the gravitational effect of actual slopes. It undergoes freeze–thaw cycles between −20 °C and 20 °C. The physical and mechanical parameters of the model are as follows: density of the rock specimen: 2600 kg/m3; elastic modulus: 30 GPa; Poisson’s ratio: 0.2; thermal expansion coefficient of rock (λrock): 3 × 10 6 /°C; specific heat capacity (c): 0.69 kJ/kg·°C; thermal conductivity (k): 2340 W/(m°C); equivalent thermal expansion coefficient of ice (λice): −0.00015/°C.

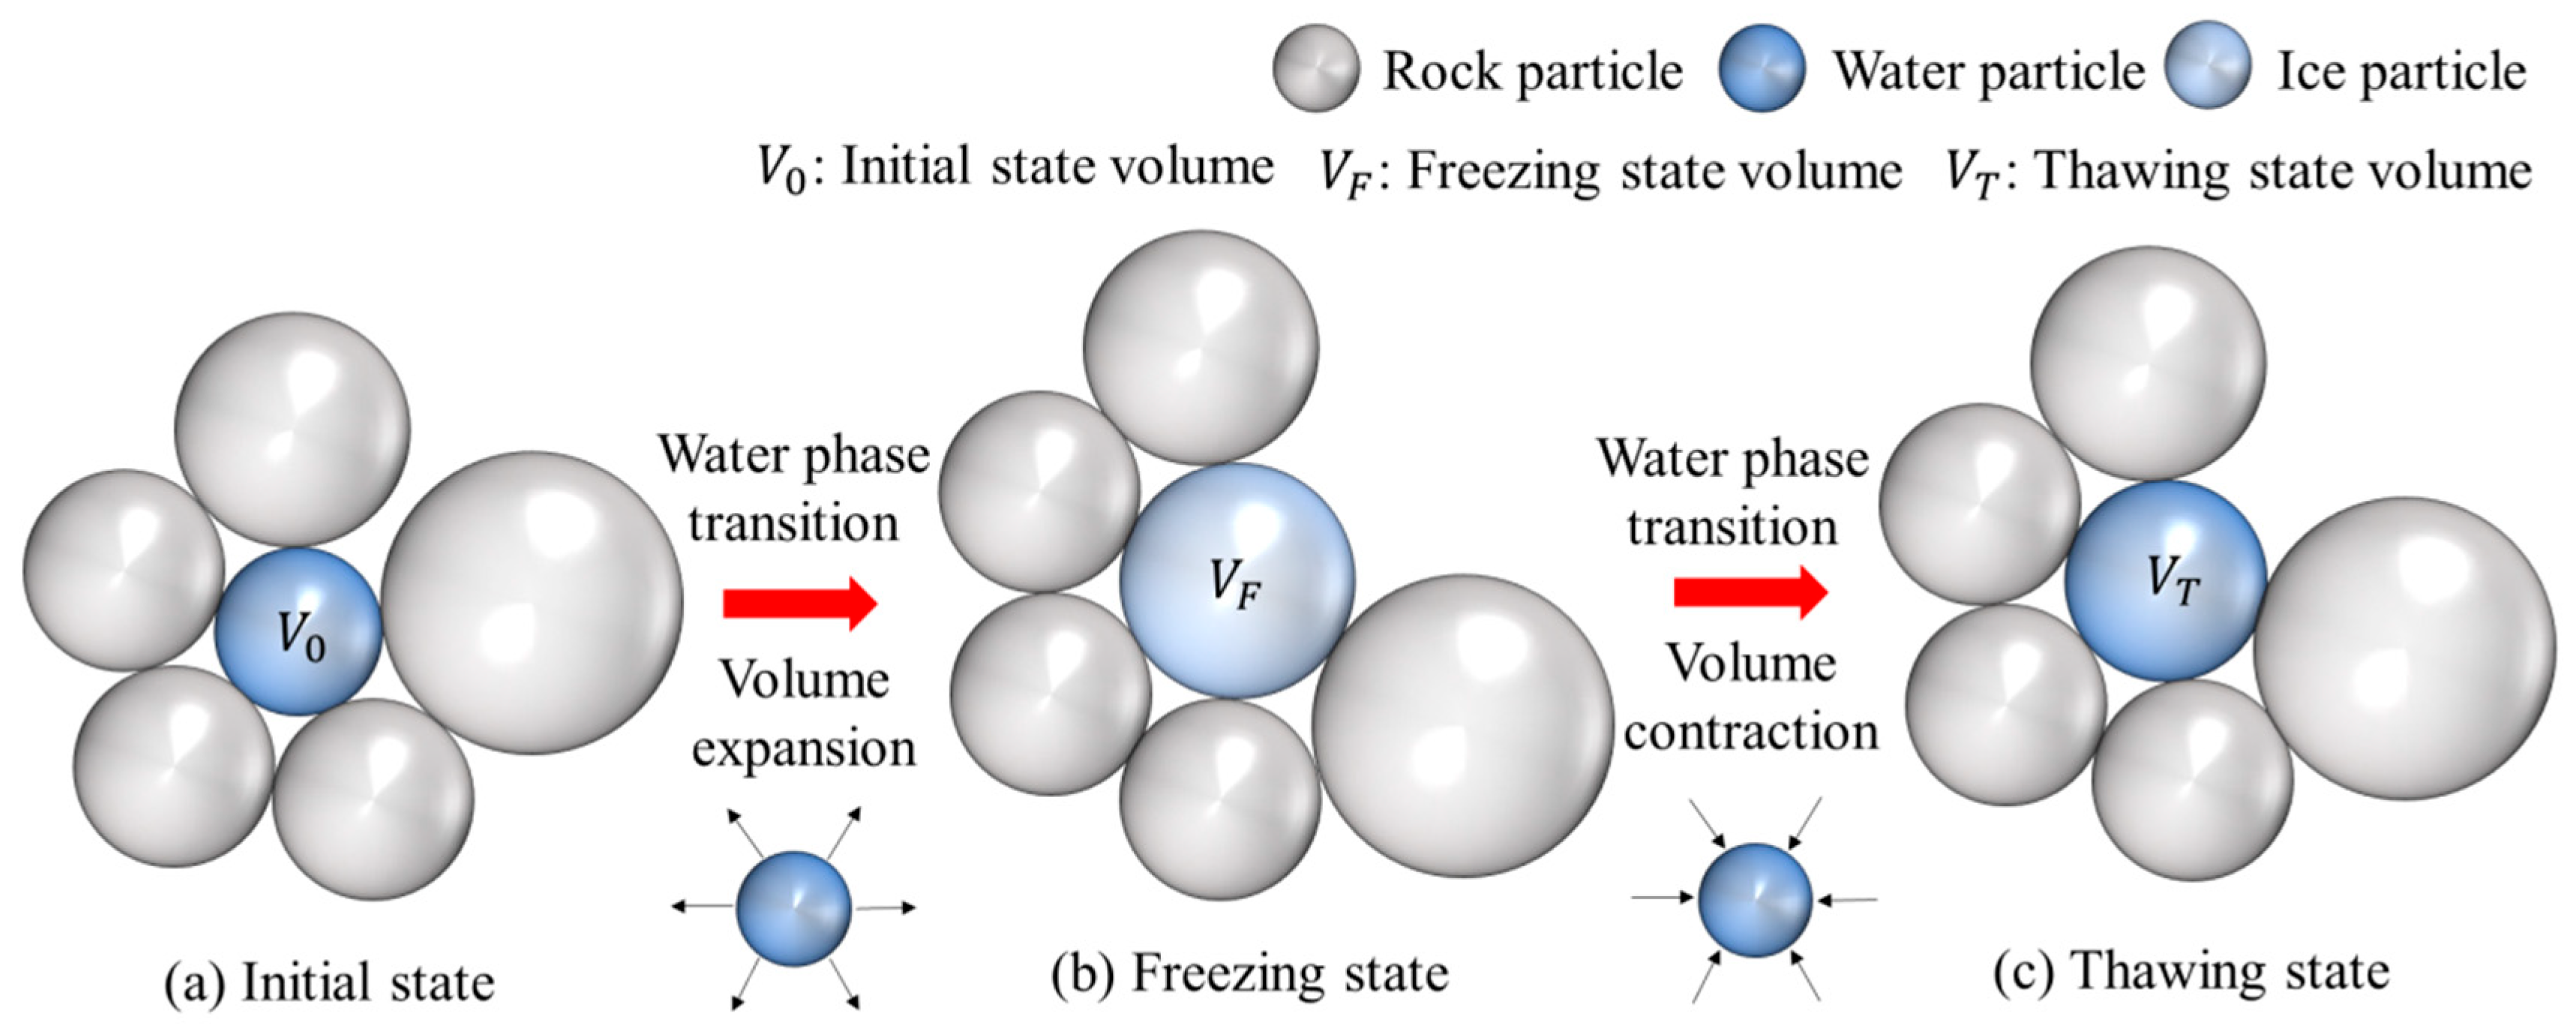
2.2. Freeze–Thaw Cycle Implementation Method

The pore water in the specimen experiences repeated water–ice phase transitions during freeze–thaw (F-T) cycles, causing irreversible damage. When liquid water freezes into ice, its volume increases; when solid ice thaws into water, its volume shrinks accordingly. The repeated freeze–thaw cycling generates frost heave forces that continuously exert stress on adjacent mineral particles, ultimately leading to the fracture of inter-particle bonding. The heat conduction process is realized through the particle contact heat conduction module of PFC2D, and the temperature field is loaded according to the cosine function T = 20 · cos ( π t / 30 ) with a period of 60 h. The volume expansion during water–ice phase transition is calculated using Δ V = V 0 · λ i c e · T , where λ i c e = −0.00015/°C. Particles are traversed and their states are updated via Fish language: the expansion of ice particles is activated when T ≤ 0 °C, and particles revert to water particles when T > 0 °C to simulate the water replenishment process. In this research, the saturated rock–water coupling system is modeled as a binary system comprising mineral and water particles. The physical mechanism of F-T cycles is depicted in Figure 3, with the volume variation in water particles described by V 0   <   V T   <   V F .

2.3. Contact Model Selection in PFC2D

PFC2D employs the discrete element method (DEM) for numerical simulation, where the model is constructed using discrete circular particles. An explicit time-stepping algorithm is utilized to compute particle motion, with inter-particle contact forces governed by a force-displacement constitutive model. Particle motion states are iteratively updated based on Newton’s second law. By tracking the dynamic evolution of inter-particle interactions and particle-boundary contact forces, the software can effectively capture particle dynamic behaviors and crack propagation processes.
Contact models in PFC2D are critical for describing particle interactions. These models accurately describe the mechanical interactions between particles. The Parallel Bond Model (PBM) describes particle–particle contacts through two interfacial mechanisms: (1) a micro-scale elastic-frictional interface lacking tensile strength, which facilitates force transmission while permitting relative rotation; (2) a cohesive elastic interface with finite thickness, capable of transmitting both normal/tangential forces and rotational resistance. The model shows linear elastic behavior, and fractures form when the strength limit is reached. The ultimate tensile and shear strengths that control fracturing are given by Equations (2) and (3), respectively. As shown in Figure 4, microcracks arising from relative displacement directions between particles are divided into the following categories. The normal resultant force F c and tangential resultant moment M c of parallel bonds are updated using the force-displacement constitutive relation, as specified in Equation (1). Due to its high efficiency in identifying crack propagation patterns and classifying their types, this model has become one of the most widely applicable contact models for failure analysis of rock materials. The Parallel Bond Model (PBM) enables the quantitative calculation of independent mechanical parameters.
F c = F l + F d + F ¯ , M c = M ¯
In the formula, F d denotes the dashpot force, F l denotes the linear force, F ¯ denotes the parallel bond force, and denotes M ¯ the parallel bond moment.
σ max = F i n ¯ A + M i s ¯ I R ¯
τ max = F i S ¯ A + M i n ¯ J R ¯
In the formula, σ m a x denotes the ultimate tensile strength, τ m a x denotes the ultimate shear strength, F i n ¯ denotes the normal contact force, F i S ¯ denotes the tangential contact force, M i S ¯ denotes torque, M i n ¯ denotes bending moment, A denotes the contact cross-sectional area, I denotes the moment of inertia, J denotes the polar moment of inertia, and R ¯ denotes the average radius of two contacting particles, as shown for Particles 1 and 2 in Figure 4b.

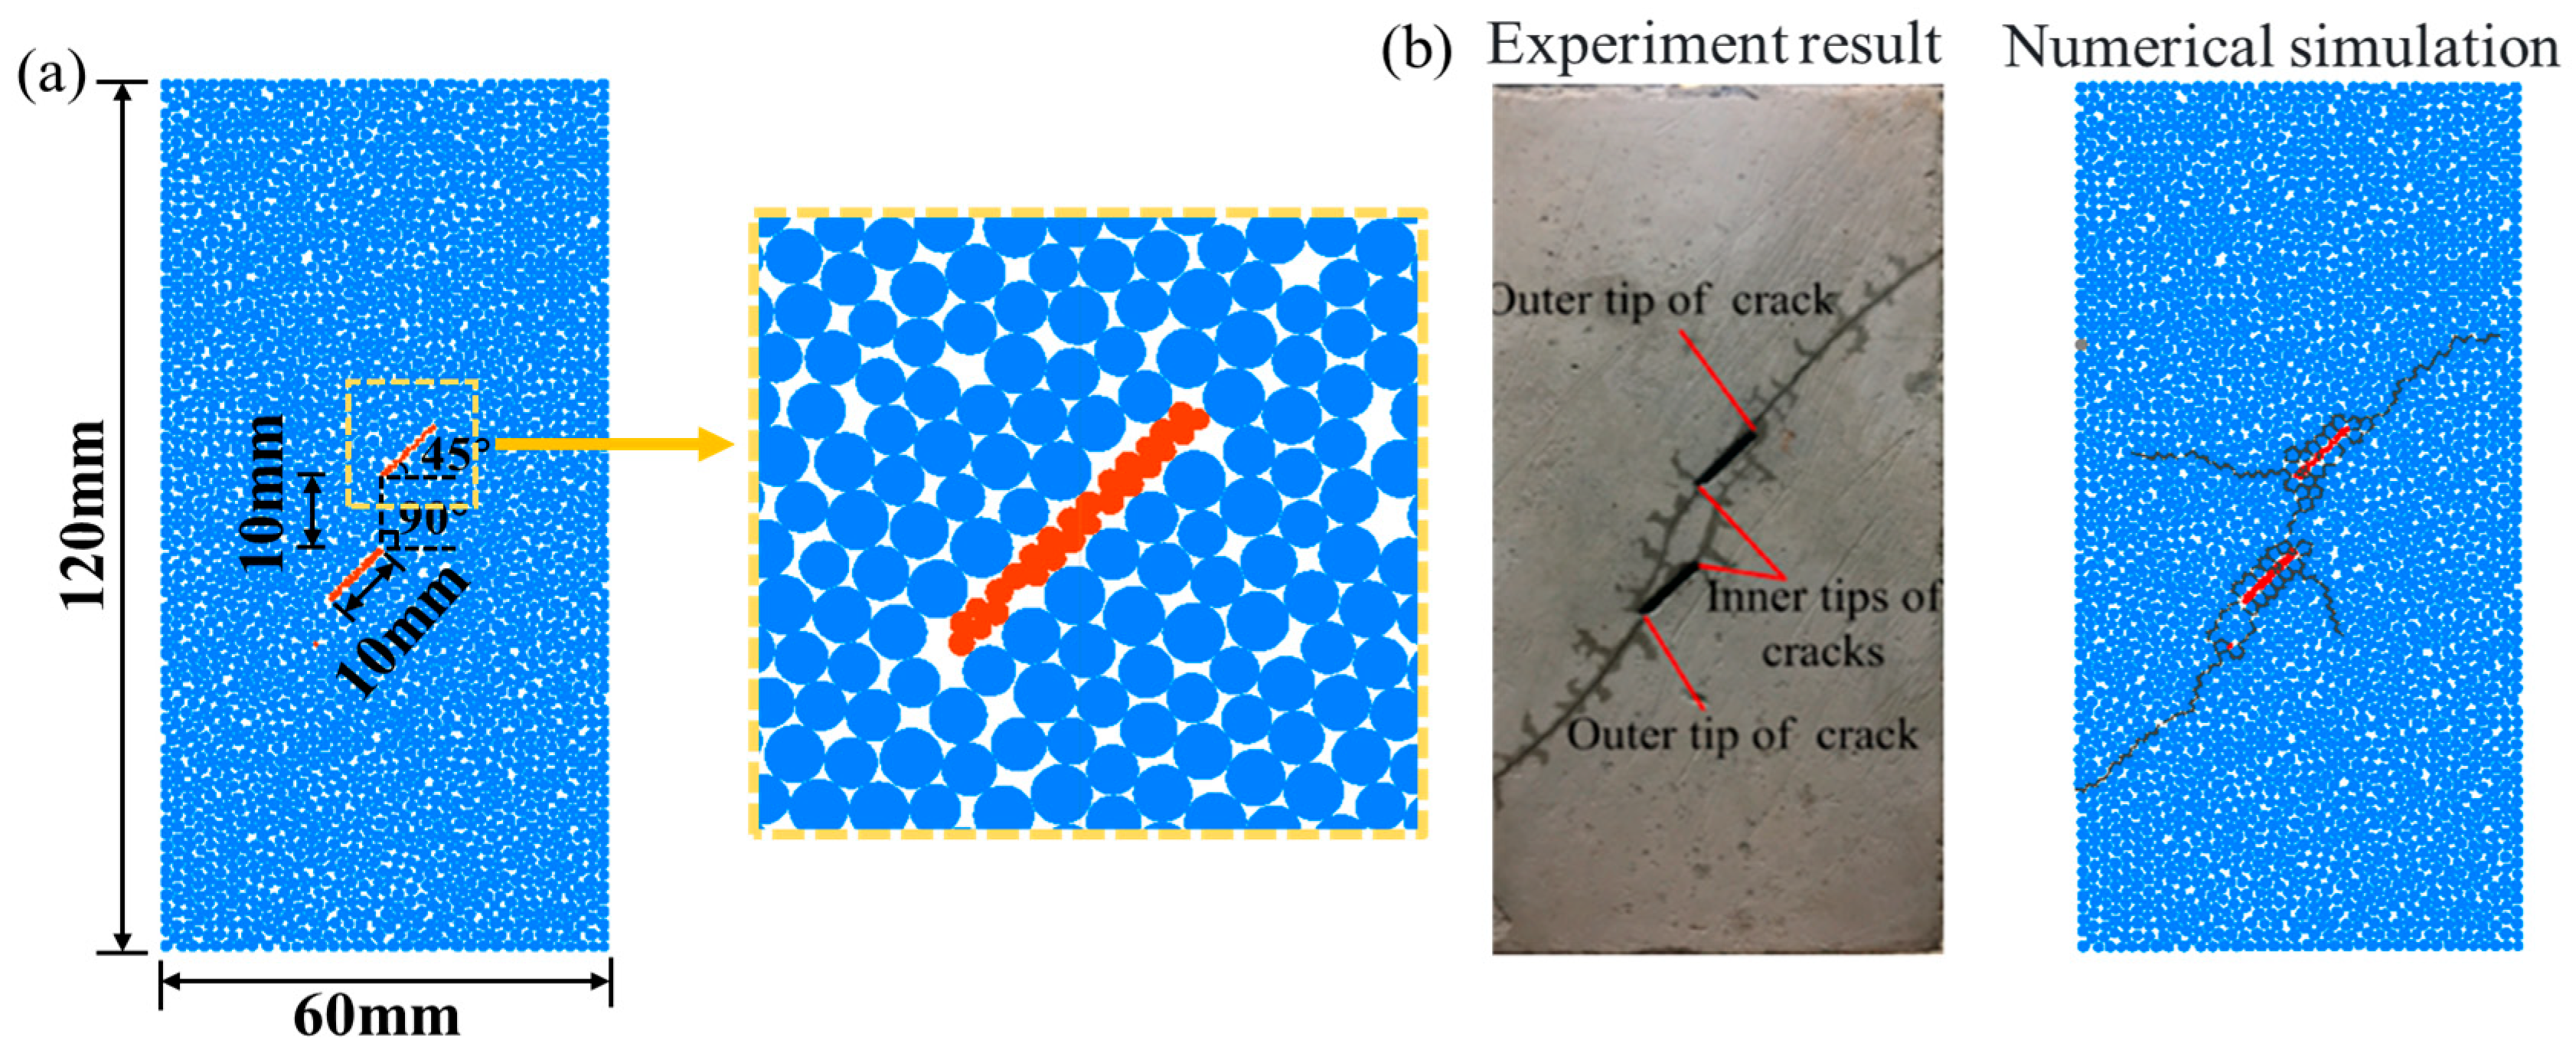
3. Freeze–Thaw Cycle Validation Case for Double-Fractured Rock Specimens

To validate the correctness of the DEM, an validation numerical example is carried out. As shown in Figure 5, the model has dimensions of 60 mm × 120 mm. The rock specimen includes two preformed fissures, each measuring 10 mm in length, and a 10 mm-long rock bridge. The angle between the fissures and horizontal is defined as α = 45°, while the rock bridge–horizontal angle β is set to 90°. The model is discretized into 3018 particles, which undergo freeze–thaw cycles from −20 °C to 20 °C. The micro-mechanical parameters of the model are listed in Table 2. The numerical simulation results in this study agree well with previous experimental findings [39], demonstrating that the mesoscopic parameters adopted here are suitable for simulating the freeze–thaw damage process in actual rock slopes.
The key parameters of the discrete element method, including particle elastic modulus Emod, parallel bond tensile strength pb_ten, parallel bond cohesion pb_coh, rock particle radius Yanshi_Rmax, and parallel bond friction angle pb_fa = 0°, were obtained through parameter calibration against the results of laboratory freeze–thaw tests on double-fractured rock specimens. As shown in Figure 5b, the simulated crack initiation positions are highly consistent with the experimental results in Reference [39] with fissures marked in red and cracks in black., proving the validity of the parameter system. Gradient variation tests with ±20% changes were conducted for parameters of elastic modulus and tensile strength to analyze the sensitivity of model parameters. When the elastic modulus (Emod) increases by 20%, the number of cracks after 43 freeze–thaw cycles decreases by 17%, and the stress concentration degree increases. This indicates that the model is sensitive to rock stiffness, but the variation trend is consistent with the rock mechanics theory. When the parallel bond tensile strength (pb_ten) decreases by 20%, the crack initiation time is advanced and the final crack density increases, which validates the controlling role of bond strength in freeze–thaw damage.

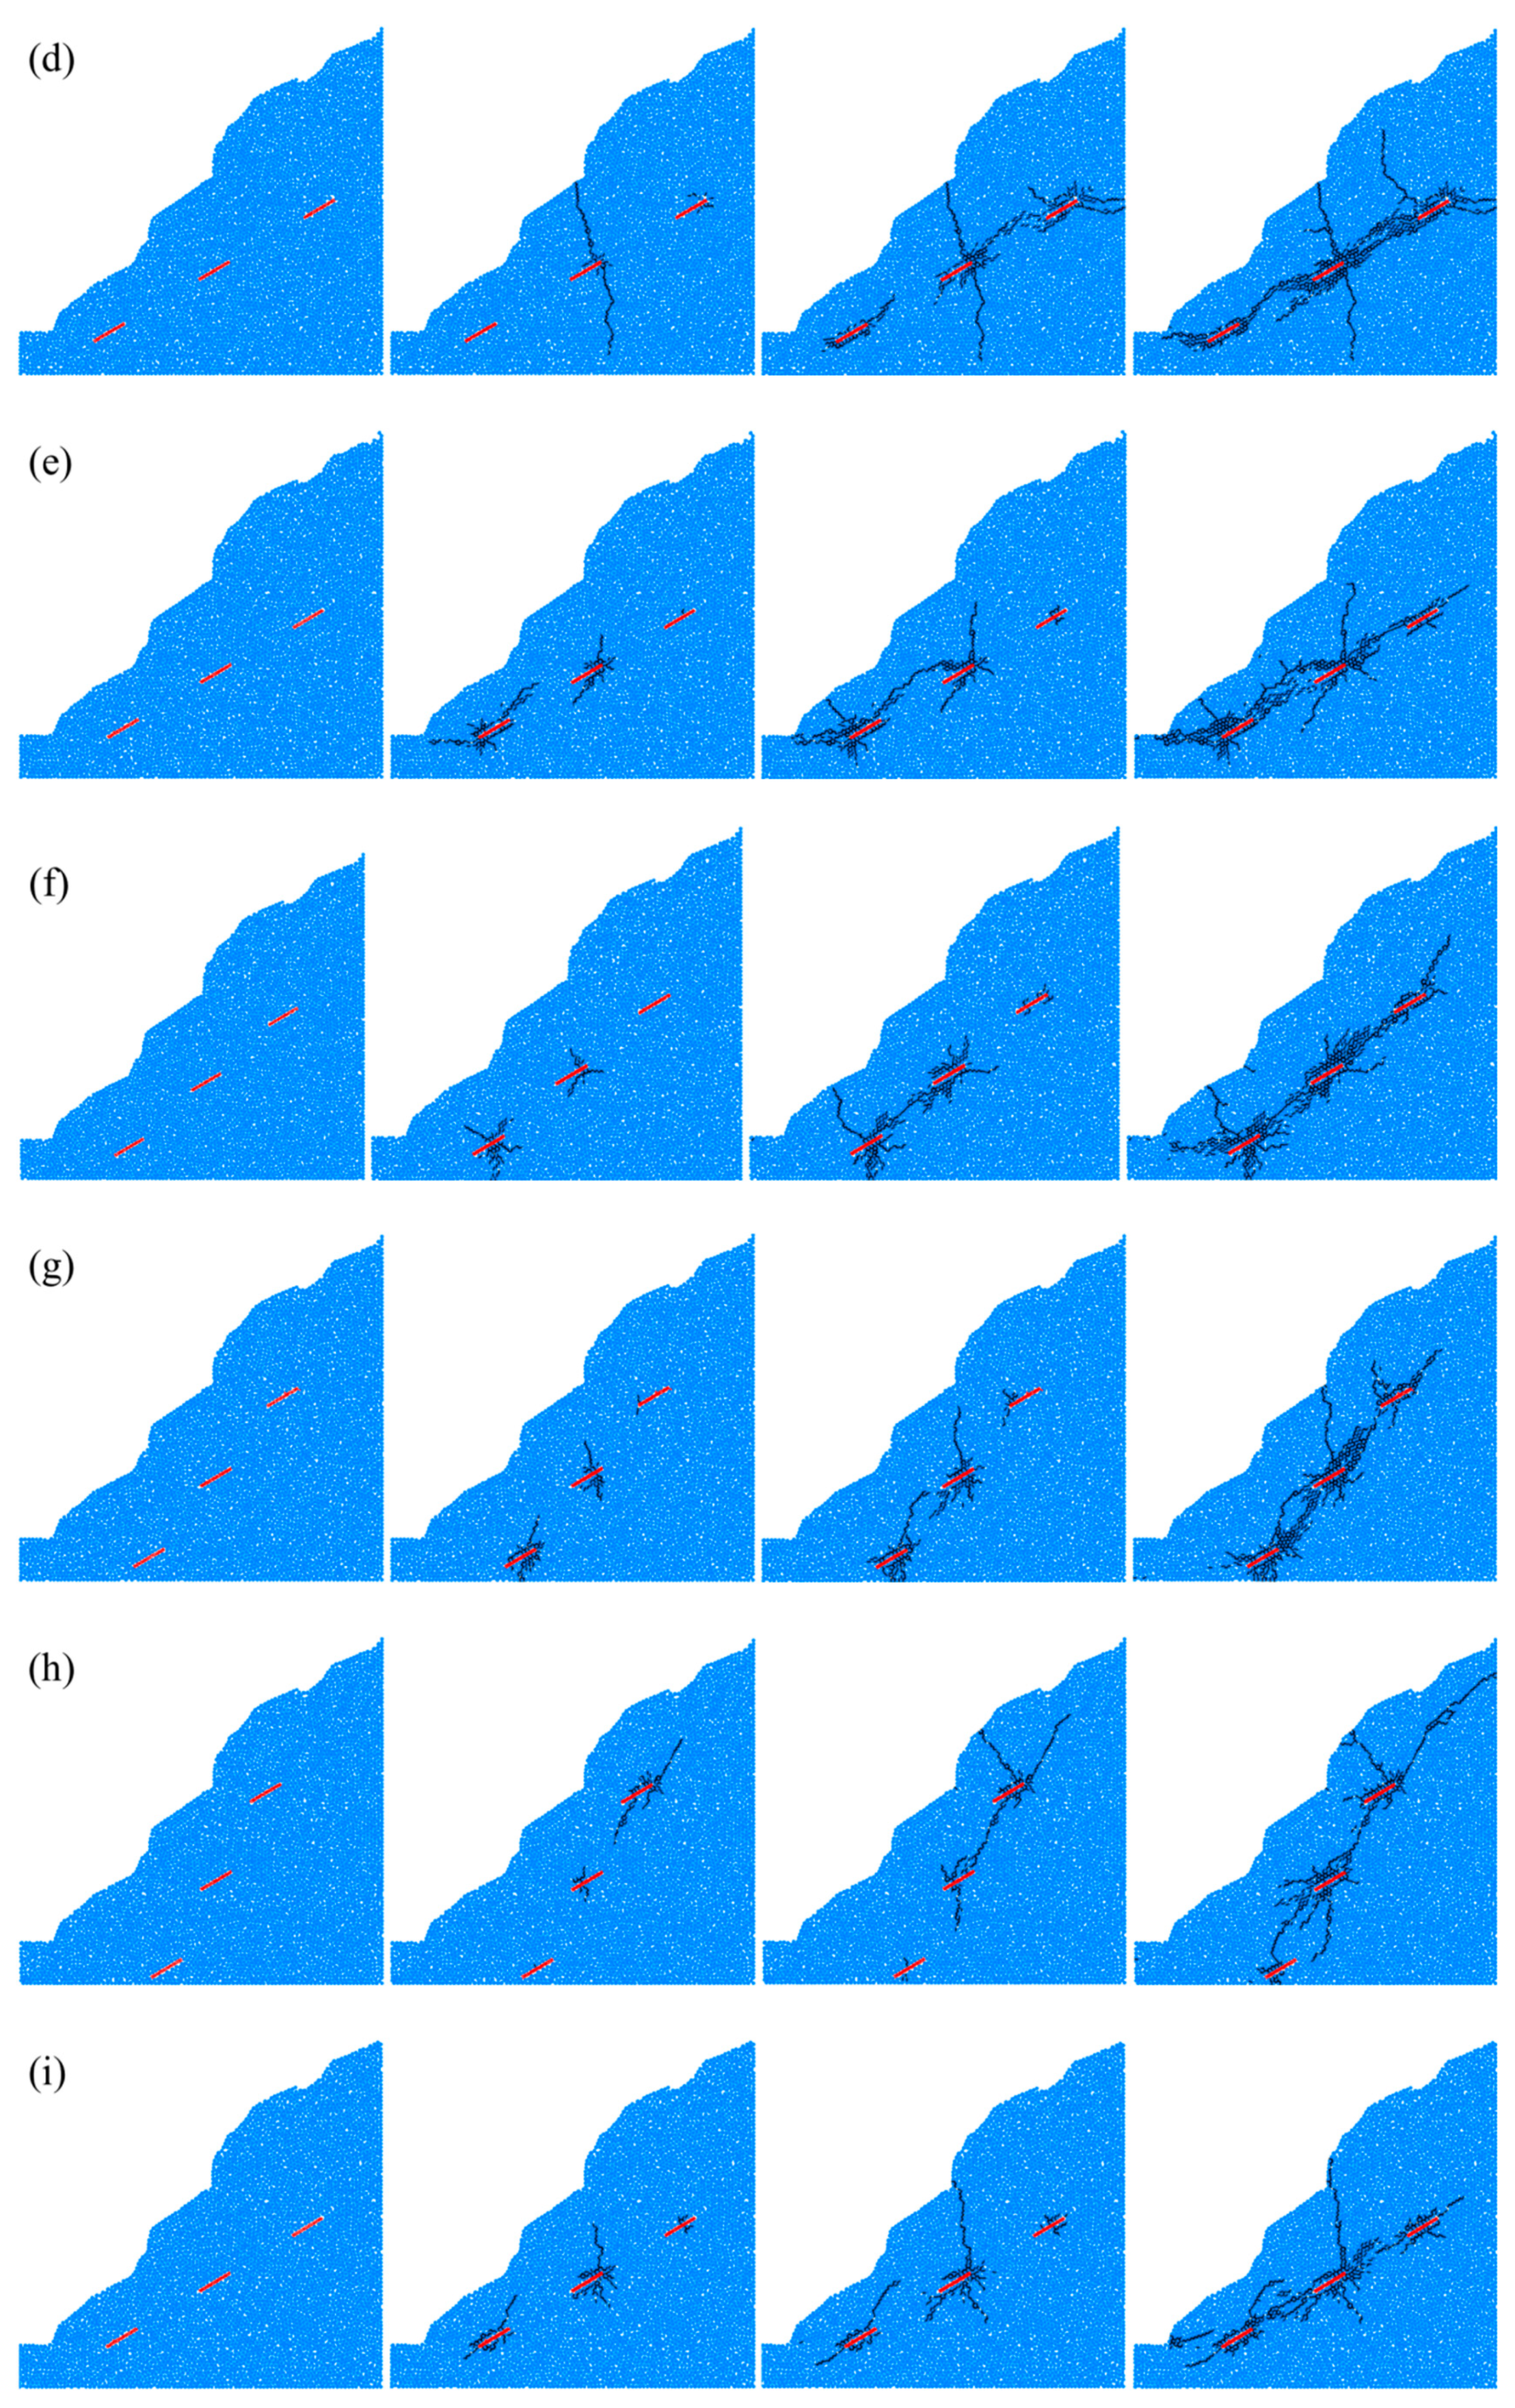
4. Numerical Simulation Results of Crack Propagation

Figure 6 shows the numerical simulation results of crack propagation processes in slope models under different fissure configurations, with fissures marked in red and cracks in black. For Group A specimens, the rock bridge angle α is 30°, the fissure angle β is 30°, and the rock bridge distances d are set as 60 m, 80 m, 100 m, and 120 m, corresponding to the images in Figure 6a, Figure 6b, Figure 6c, and Figure 6d, respectively. Considering the data on the number of freeze–thaw cycles for crack initiation and the number of cracks in the 43rd freeze–thaw cycle shown in Figure 7, a comparative analysis reveals that when the rock bridge distance d is 60 m (in Figure 6a), crack initiation occurs at the 22nd freeze–thaw cycle, which is later than that in Figure 6d. Moreover, the number of cracks in the 43rd freeze–thaw cycle is 719, which is significantly fewer than that when the rock bridge distance d is 120 m. A short rock bridge distance does not result in the fastest crack initiation speed or the largest number of cracks. This indicates that under the condition of a short rock bridge, cracks exhibit strong synergy during propagation, facilitating the formation of a main through surface. The failure mode is predominantly sudden overall instability. Moreover, the density of the crack network is lower than that of the long rock bridge scenario, suggesting that the stress concentration effect of a short rock bridge leads to rapid crack penetration instead of continuous crack growth. As the value of d increases, when the rock bridge distance d is 80 m and 100 m (Figure 6b,c), the crack initiation occurs at the 29th and 30th freeze–thaw cycles, respectively. When the rock bridge distance increases from 80 m to 100 m, the number of cycles for crack initiation increases by only one. This suggests that when the rock bridge distance is within the range of 80 to 100 m, the impact of the accumulation of freeze–thaw stress on crack initiation tends to stabilize, and there is no significant change in the stress transfer efficiency. Some cracks show an isolated and branched morphology. This indicates that with the increase in the rock bridge distance, the stress transfer between the fractures weakens. The crack propagation induced by freeze–thaw is limited by the longer rock bridge distance, making it difficult to form large-scale connectivity. When the rock bridge distance d is 120 m (Figure 6d), cracks initiate at the 17th freeze–thaw cycle, which is the earliest crack initiation among all the schemes. Moreover, the number of cracks reaches 1034 during the 43rd freeze–thaw cycle, hitting the maximum value. This shows that when the rock bridge distance is at its longest, crack initiation happens the earliest and the expansion speed is the fastest. In this scheme, although the spacing between the fissures is large, the fissure angles or arrangement patterns lead to the formation of a local high-stress zone in the middle of the rock bridge due to the tensile and compressive stresses induced by freeze–thaw, which accelerates the generation of initial cracks. With the earliest crack initiation and the largest quantity of cracks, it indicates that the internal stress distribution of the rock bridge is the most uneven. Despite the scattered crack expansion process, the cumulative damage is serious, presenting the highest risk to the overall stability. For a short rock bridge within the range of d = 60 to 80 m, the stress concentration between the fissures leads to a rapid penetration of early cracks. After the formation of the main crack, the development of branch cracks is inhibited. At a rock bridge distance of d = 80 m, more independent cracks can initiate. Although crack initiation is delayed, their cumulative propagation potential is stronger. This indicates that the effect of rock bridge distance on crack initiation is governed by multiple factors, such as the initial fracture angle and the rock’s freeze–thaw damage threshold. For long rock bridges within the range of d = 100 to 120 m, the numbers of cracks are 902 and 1034, respectively, showing that the greater the rock bridge distance, the larger the final number of cracks. Long rock bridges offer greater room for crack propagation. Microcracks induced by freeze–thaw cycles are less likely to rapidly coalesce within long rock bridges; instead, they primarily develop in branched and isolated forms, giving rise to a more complex crack network.
For Group B’s simulated specimens with a fissure angle β = 30° and a rock bridge distance d = 100 m, the rock bridge angles α are successively 30°, 45°, 60°, and 75°, corresponding to the four sets of images in Figure 6e–h. Comparative analysis shows that when the rock bridge angle α is 30° (Figure 6e), crack initiation occurs only at the 30th freeze–thaw cycle, which is significantly later than that for α = 45°, 60°, and 75°. Despite significant stress concentration, the crack propagation path remains relatively simple. Once the main crack rapidly penetrates, it restricts the formation of branch cracks, leading to a smaller final number of cracks. As the rock bridge angle increases, at α = 45° (Figure 6f) and α = 60° (Figure 6g), crack initiation occurs at the 26th and 28th freeze–thaw cycles, respectively, with minimal difference in their initiation times. Within the angle range of 45° to 60°, the sensitivity of crack initiation to freeze–thaw stress diminishes. The number of cracks shows a downward trend with increasing angle, as stress distribution within this range tends to balance, constraining continuous crack propagation. When the rock bridge angle α = 75° (Figure 6h), crack initiation occurs as early as the 22nd freeze–thaw cycle, making it the earliest observed initiation time. At the 43rd freeze–thaw cycle, the number of cracks reaches 1212, greatly exceeding those in schemes with rock bridge angles of 30°, 45°, and 60°. Freeze–thaw-induced cracks are more likely to branch and redirect during propagation, forming numerous isolated cracks that together result in a substantial accumulation of cracks. At a larger rock bridge angle α = 75°, tensile and compressive stresses induced by freeze–thaw form a more concentrated stress state in localized regions of the rock bridge. This accelerates crack initiation and provides more complex path options for crack propagation. When the rock bridge angle α is ≤60°, crack propagation demonstrates strong directionality and cooperative behavior. This promotes the formation of through-going main cracks, leading to the sudden catastrophic failure of the slope. Although the number of cracks is not the largest, rapidly coalescing main cracks pose a more immediate and severe threat to structural stability. In contrast, at a rock bridge angle of α = 75°, while the crack increment per freeze–thaw cycle is small, the complex crack network formed through long-term accumulation continuously weakens rock mass strength, slowing the overall instability process. Overall stability risk increases nonlinearly with the number of freeze–thaw cycles. In particular, the risk of local damage propagation triggered by increased crack density under long-term freeze–thaw cycles demands close attention.
For Group C’s simulated specimens with a rock bridge angle α = 30° and rock bridge distance d = 100 m, the fissure angles β are 30°, 45°, 60°, and 75° in sequence, corresponding, respectively, to the four sets in Figure 6l–k. Comparative analysis shows that for the fissure angle β = 30° (Figure 6i), crack initiation occurs only at the 30th freeze–thaw cycle, making it the latest observed crack initiation time among all schemes. Although stress concentration is pronounced, the rapid coalescence of main cracks suppresses the development of branch cracks, thus leading to a limited final crack count. Due to their direct propagation paths and strong synergy, these cracks easily trigger sudden overall slope instability, posing an instantaneous threat to structural stability. For fissure angles β = 45° (Figure 6j) and β = 75° (Figure 6l), crack initiation occurs at the 25th cycle in both cases, which is significantly earlier than that for β = 30°. Additionally, for the fissure angle β = 60° (Figure 6k), crack initiation occurs at the 26th cycle, with minimal difference in initiation time compared to the 45° and 75° schemes. This indicates that within the angle range of 45° to 75°, the effect of freeze-thaw stress on crack initiation shows little variation. After the 43rd freeze–thaw cycle, the number of cracks reaches 898, which is significantly higher than in the β = 30°, 45°, and 75° schemes. While the crack number is the highest, the dispersed crack network reduces the local stress concentration, leading to progressive and localized characteristics in slope failure. These findings suggest that at a moderate fissure angle β = 60°, freeze–thaw-induced stress not only ensures continuous crack initiation but also prevents both stress dispersion from excessively large angles and rapid main crack coalescence from excessively small angles. For a larger fissure angle of β = 75°, the tensile and compressive stresses induced by freeze–thaw cycles result in a more concentrated stress state at fissure tips, thereby accelerating crack initiation. Overly large angles cause excessive stress dispersion, leading to insufficient driving force for crack propagation and consequently reducing the crack count. The fewest cracks, mostly in isolated and branched morphologies, indicate the lowest stress transfer efficiency and relatively higher overall slope stability. However, it is essential to remain vigilant against the cumulative damage effect of cracks under long-term freeze–thaw cycles. Within the fissure angle range of 45° to 75°, fissures exhibit the characteristics of multi-point crack initiation and dispersed propagation. During each freeze–thaw cycle, the incremental crack growth remains minimal, and cracks propagate along tortuous, independent paths. This characteristic delays the overall coalescence process.
In summary, through comparative simulations of three sets of independent parameters (rock bridge distance d, rock bridge angle α, and fissure angle β), we have revealed the independent influence laws of each parameter on crack propagation. We have further elucidated the synergistic mechanisms of these parameters on crack propagation under freeze–thaw cycles. The synergistic effect between the rock bridge spacing d and rock bridge angle α significantly exists. When d = 60 m and α ≤ 60°, stress concentration leads to the rapid penetration of main cracks (as shown in Figure 6a,e–g). While when d ≥ 100 m and α = 75°, the dispersed stress distribution promotes the abundant initiation of branch cracks (as shown in Figure 6c,d,h). There is a synergistic effect between rock bridge angle α and fissure angle β. When α = 30° and β = 60°, the stress concentration areas expand around the fissures (as shown in Figure 6e,k). While when α = 75° and β = 30°, the rapid penetration of main cracks inhibits the formation of branch cracks (as shown in Figure 6h,i).

5. Discussion

5.1. Effect of Rock Bridge Distance on Freeze–Thaw Damage of Rock Slopes

Figure 8 shows a comparison of maximum principal stress distributions after 15 freeze–thaw cycles for rock bridge distances d = 60 m, 80 m, 100 m, and 120 m. When the rock bridge distance d = 60 m and 80 m, high-stress regions are relatively concentrated. This indicates that shorter rock bridges cause stress to more easily concentrate in fracture zones. The stress transfer within the slope rock mass is influenced by the short rock bridge length, leading to significant energy accumulation. As the rock bridge distance d increases to 100 m and 120 m, high-stress concentration regions gradually disperse and weaken. This indicates that an increase in rock bridge distance lengthens stress transfer paths. As a result, stress diffuses over a larger area. Overall, rock bridge distance significantly affects the maximum principal stress distribution in rock mass after freeze–thaw cycles. The shorter the rock bridge distance, the more obvious the stress concentration, which is mainly concentrated in fissure areas. The longer the rock bridge distance, the lower the stress concentration and the wider its distribution range.

5.2. Effect of Rock Bridge Angle on Freeze–Thaw Damage of Rock Slopes

Figure 9 shows a comparison of maximum principal stress distributions after 15 freeze–thaw cycles for different rock bridge angles of α = 30°, 45°, 60°, and 75°. When α = 45°, high-stress regions around the fissures are more concentrated compared to those around α = 30°. As α increases to 60°, the concentration of high-stress regions changes compared to α = 45°. Stress concentration around the fissures becomes more evident at this angle. This indicates that when rock bridge angles are smaller, stress concentration in fissure regions is more dispersed. For α = 75°, high-stress concentration regions further disperse, and the stress distribution becomes more extensive. This indicates that as the rock bridge angle increases, stress concentration gradually decreases. Stress diffuses over a larger area and becomes more uniformly distributed. Overall, when the rock bridge angle α ≤ 60°, stress is more likely to concentrate in fissure regions. As the angle increases, stress concentration regions gradually disperse, and the distribution range expands. This demonstrates that rock bridge angles significantly regulate the maximum principal stress distribution in rock mass after freeze–thaw cycles.

5.3. Effect of Fissure Angle on Freeze–Thaw Damage of Rock Slopes

Figure 10 shows a comparison of maximum principal stress distributions after 15 freeze–thaw cycles for different fissure angles of β = 30°, 45°, 60°, 75°. When β = 30°, compared with slope rock masses at fissure angles of 45°, 60°, and 75°, the stress concentration around the fissures is lower, especially in the directions of the fissure tips. As the fissure angle β increases to 45°, high-stress concentration regions start to gather in the fissure zones. This shows the initial effect of fissure angle changes on stress transfer paths. When β = 60°, the stress distribution further adjusts and high-stress regions expand in and around the fissures. This indicates that increasing the fissure angle complicates stress transfer paths and expands the stress distribution range in the rock mass. It also reduces stress concentration. For β = 75°, the high-stress concentration regions are more dispersed compared to the slope rock mass at β = 60°. This indicates that as the fissure angle increases, stress concentration decreases and the stress distribution becomes more uniform. Overall, when β ≤ 30°, stress concentration at both fissure tips and around the fissures is low. As the fissure angle increases from 45° to 75°, the stress transfer paths and distribution patterns within the rock mass change. High-stress concentration regions gather around the fissures, and their distribution range expands.

6. Conclusions

This study employs the PFC2D discrete element method to conduct numerical simulations on crack propagation in fractured slope rock masses with different rock bridge distances d, rock bridge angles α, and fissure angles β under freeze–thaw cycles. It reveals the complex laws of crack evolution under frost heave stress. The main conclusions are as follows:
(1) Rock bridge distance d critically governs stress distribution and crack propagation patterns. Short distances at d = 60 m induce concentrated stress in fracture zones, promoting rapid main crack coalescence and sudden instability. Longer distances at d ≥ 100 m expand stress distribution, triggering multi-point crack initiation and complex branch networks, with crack count increasing as d grows.
(2) Rock bridge angle α significantly modulates stress synergy and damage accumulation. At α ≤ 60°, stress concentrates in fracture zones, driving coordinated crack growth and main crack penetration. Larger angles at α = 75° disperse stress, accelerate early crack initiation, and yield the highest cumulative crack density despite slower instability progression.
(3) Fracture angle β determines crack dispersion and propagation efficiency. Moderate angles at β = 60° balance stress concentration and dispersion, maximizing crack initiation and expansion. Smaller angles at 30° or larger angles at 60° reduce crack counts due to rapid main crack coalescence or excessive stress scattering, respectively.
(4) Rock bridge distance, angle, and fissure angle interact to govern stress distribution and crack evolution in fractured rock masses. Distance determines stress concentration and crack connectivity; angles regulate stress patterns and initiation sites. This provides a theoretical basis for freeze–thaw damage assessment and stability control in cold-region rock engineering.

Author Contributions

H.X.: Writing—original draft, Validation, Investigation, Formal analysis, Data curation. B.P.: Writing—review & editing, Writing—original draft, Visualization, Supervision. S.Y.: Writing—review & editing, Writing—original draft, Validation, Supervision, Resources, Methodology, Investigation, Conceptualization. J.Y.: Writing—original draft, Investigation. Y.L.: Writing—original draft, Investigation. P.G.: Writing—original draft, Investigation. All authors have read and agreed to the published version of the manuscript.

Funding

This work is supported by the Social Welfare Science Project of Nantong (MS2023064).

Data Availability Statement

Data will be made available on request.

Conflicts of Interest

The authors declare no conflict of interest.

References

  1. Yu, M.; Wang, Z.; Xu, Y.; Chang, Y.; Wang, L.; Zhu, Y. The failure behavior of prefabricated fractured sandstone with different rock bridge inclination angles under freeze-thaw cycles. Unconv. Resour. 2025, 6, 100152. [Google Scholar] [CrossRef]
  2. Zhang, S.; Song, Y.; Wang, X.; Ren, J. Multi-dimensional real-time data-driven identification for progressive fracturing characteristics of sandstone under freeze-thaw cycles and seepage-stress coupling. Eng. Appl. Artif. Intell. 2025, 152, 110803. [Google Scholar] [CrossRef]
  3. Xiao, J.; Shuai, J.; Deng, W.; Liu, L.; Wang, P.; Li, L. Low-Carbon and Green Materials in Construction: Latest Advances and Prospects. Buildings 2025, 15, 1508. [Google Scholar] [CrossRef]
  4. Zhu, T.; Zhu, H.; Li, A.; Zong, X.; Zeng, B.; He, X. Physical properties and anisotropy of sandstone during freeze-thaw cycle under unidirectional constraint. Cold Reg. Sci. Technol. 2024, 228, 104324. [Google Scholar] [CrossRef]
  5. Qiu, P.; Tang, L.; Zheng, J.; Wang, W.; Li, Y.; Li, G.; Jin, L.; Yu, Y.; Duan, X. Experimental investigations on the shear strength and creep properties of soil-rock mixture under freeze-thaw cycles. Cold Reg. Sci. Technol. 2024, 217, 104037. [Google Scholar] [CrossRef]
  6. Li, B.; Zhu, Z.; Zhang, F.; Chunyu, Z.; Li, T. Impact mechanical properties of frozen soil after experiencing freeze–thaw cycles: Experimental and numerical study. Cold Reg. Sci. Technol. 2023, 213, 103914. [Google Scholar] [CrossRef]
  7. Wang, W.; Yuan, K.; Ren, J.; Liu, Q.; Wang, L.; Liu, Z. Estimating rock fracture characteristics based on determined mechanical properties and simulation parameters calibration methodology. Theor. Appl. Fract. Mech. 2025, 139, 104984. [Google Scholar] [CrossRef]
  8. Zhou, T.; Lin, Y.; Chen, J. Macro-meso crack propagation characteristics and safety performance assessment of flawed rock mass. Theor. Appl. Fract. Mech. 2025, 137, 104867. [Google Scholar] [CrossRef]
  9. Shi, S.; Wang, G.; Zhu, F.; Feng, D.; Zhang, F. Investigation on fracture mechanism of rock containing pre-existing fissures subjected to freeze–thaw cycles under different stress conditions. Theor. Appl. Fract. Mech. 2025, 138, 104948. [Google Scholar] [CrossRef]
  10. Zhou, Y.; Ma, W.; Tan, X.; Chen, W.; Yang, D.; Su, Z.; Zhang, X.; Xu, F. Numerical simulation of fracture propagation in freezing rocks using the extended finite element method (XFEM). Int. J. Rock Mech. Min. Sci. 2021, 148, 104963. [Google Scholar] [CrossRef]
  11. Ali, M.; Zubair, A.; Farooq, Z.; Farooq, K.; Masoud, Z. Prediction of small-strain elastic stiffness of natural and artificial soft rocks subjected to freeze-thaw cycles. J. Rock Mech. Geotech. Eng. 2025, 17, 104963. [Google Scholar] [CrossRef]
  12. Yahaghi, J.; Liu, H.; Chan, A.; Fukuda, D. Experimental and numerical studies on failure behaviours of sandstones subject to freeze-thaw cycles. Transp. Geotech. 2021, 31, 100655. [Google Scholar] [CrossRef]
  13. Sun, K.; Jia, J.; Xiong, Z.; Wu, J.; Liu, Y.; Wei, Y. Investigation of hydro-thermal variations and mechanical properties in cold region tunnels under long-term freeze–thaw cycles. Tunn. Undergr. Space Technol. 2024, 143, 105469. [Google Scholar] [CrossRef]
  14. Tang, X.; Tao, S.; Li, P.; Rutqvist, J.; Hu, M.; Sun, L. The propagation and interaction of cracks under freeze-thaw cycling in rock-like material. Int. J. Rock Mech. Min. Sci. 2022, 154, 105112. [Google Scholar] [CrossRef]
  15. Wang, X.; Li, L.; Mu, W.; Yang, T.; Du, Y.; Lu, J. Damage characteristics and mechanisms of shear strength at the interface between fiber-reinforced concrete and rock under freeze-thaw cycles. J. Build. Eng. 2024, 98, 111191. [Google Scholar] [CrossRef]
  16. Yu, J.; Zhang, Q.; Jia, C.; Lei, M.; Zhao, C.; Pang, R.; Li, Z.; Zeng, T. Experimental and DEM simulations of the mechanical properties of rock under freeze–thaw cycles. Cold Reg. Sci. Technol. 2023, 211, 103866. [Google Scholar] [CrossRef]
  17. Zhang, C.; Liu, E.; Wei, X.; Yin, X.; Xiao, W.; Yu, D.; He, C. Experimental study and numerical modeling of the thermo-hydro-mechanical process in unsaturated soil under freeze-thaw cycles. Cold Reg. Sci. Technol. 2024, 218, 104063. [Google Scholar] [CrossRef]
  18. Wang, Z.; Shi, Z.; Duan, X.; Wu, J. Mesoscopic Mechanism of Deterioration of Silty Mudstone under Freeze-Thaw Cycles with Different Freezing Temperatures. J. Chang. Univ. Sci. Technol. (Nat. Sci. Ed.) 2025, 1–11. [Google Scholar]
  19. Zhang, Z. Study on the Mechanical Properties and Damage Mechanism of Basalt in Highway Cutting Slope under Wet-Dry and Freeze-Thaw Cycles. Highway 2025, 70, 41–49. [Google Scholar]
  20. Hou, Z.; Liu, X.; Wang, T.; Zhang, J.; Yuan, S.; Hu, J. Mechanical Properties and Damage Constitutive Model of Quartzite with Freeze-Thaw Damage. J. Yangtze River Sci. Res. Inst. 2025, 42, 177–185. [Google Scholar]
  21. Liang, B.; Yang, G.; Feng, W.; Pan, Z.; Sun, J.; Liu, H.; Chen, Q. Model Test Study on the Instability of Rock Slopes with Planar Slip Induced by Freeze-Thaw. J. Xi’an Univ. Sci. Technol. 2024, 44, 1118–1126. [Google Scholar]
  22. Zhang, H.; Hao, L.; Chen, S.; Cheng, R. Anisotropic Analysis of Mesoscopic Damage Evolution of Freeze-Thaw Sandstone. Min. Res. Dev. 2024, 44, 99–106. [Google Scholar]
  23. Yin, F.; Li, Y.; Li, K.; Zhang, S.; Wang, C.; Dai, F.; Wang, K. Mechanical behaviors and failure mechanism of flawed sandstone containing infillings under freeze-thaw cycles and uniaxial compression. Theor. Appl. Fract. Mech. 2023, 126, 103979. [Google Scholar] [CrossRef]
  24. Chen, Y.; Lin, H.; Liang, L. Freeze-thaw failure characteristics and strength loss of non-penetrating fractured rock mass with different fracture densities. Theor. Appl. Fract. Mech. 2023, 124, 103792. [Google Scholar] [CrossRef]
  25. Huang, S.; Liu, Y.; Guo, Y.; Zhang, Z.; Cai, Y. Strength and failure characteristics of rock-like material containing single crack under freeze-thaw and uniaxial compression. Cold Reg. Sci. Technol. 2019, 162, 1–10. [Google Scholar] [CrossRef]
  26. Li, J.; Kaunda, R.B.; Zhou, K. Experimental investigations on the effects of ambient freeze-thaw cycling on dynamic properties and rock pore structure deterioration of sandstone. Cold Reg. Sci. Technol. 2018, 154, 133–141. [Google Scholar] [CrossRef]
  27. Gou, D.; Li, Y.; Hu, Y.; Zhou, Z.; Zhang, S.; Li, K.; Wang, K. Investigations on mechanical behaviors and failure mechanisms of rock-concrete composite specimens with different interface inclinations subjected to freeze-thaw cycles and uniaxial compression. Eng. Fract. Mech. 2025, 322, 111196. [Google Scholar] [CrossRef]
  28. Zhang, J.; Chen, Y.; Du, R.; Zhao, X.; Wu, J. Macroscopic and microscopic mechanical characteristics and crack propagation behavior of sandstone-like samples with single cracks under freeze–thaw cycles: Experimental and numerical simulation. Theor. Appl. Fract. Mech. 2024, 129, 104201. [Google Scholar] [CrossRef]
  29. Wang, J.; Li, J.; Zhou, K.; Jiang, C.; Shen, Y.; Jia, H. Fracture mechanical properties of sandstone with pre-fabricated cracks under freeze–thaw cycles. Theor. Appl. Fract. Mech. 2024, 131, 104444. [Google Scholar] [CrossRef]
  30. Li, T.; Zhang, L.; Gong, W.; Tang, H.; Jiang, R. Initiation mechanism of landslides in cold regions: Role of freeze-thaw cycles. Int. J. Rock Mech. Min. Sci. 2024, 183, 105906. [Google Scholar] [CrossRef]
  31. Zhang, J.; Chen, Y.; Du, R.; Huang, Z.; Zhao, X. Experimental study and numerical simulation verification of the macro- and micromechanical properties of the sandstone–concrete interface under freeze–thaw cycles. Constr. Build. Mater. 2024, 432, 136584. [Google Scholar] [CrossRef]
  32. Li, K.; Li, Y.; Yin, F.; Dai, F.; Wang, C.; Zhang, S.; Wang, K. Mechanical properties and failure mechanism of rock-like specimens with arc-shaped flaws under freeze–thaw cycles. Theor. Appl. Fract. Mech. 2024, 130, 104275. [Google Scholar] [CrossRef]
  33. Sun, C.; Pu, Y.; Ao, Y.; Tao, Q. Study on Mechanical Properties and Mesoscopic Fracture Evolution Characteristics of Frozen-Thawed Saturated Fractured Sandstone. Rock Soil Mech. 2025, 8, 1–14. [Google Scholar]
  34. Li, H.; Yao, Z.; Zeng, Z.; Li, L. Study on Deformation and Failure Characteristics of Sandstone with Unequal-Length Intersecting Fractures under Uniaxial Compression during Freeze-Thaw Cycles. J. China Three Gorges Univ. (Nat. Sci.) 2024, 46, 65–72. [Google Scholar]
  35. Sun, L.; Grasselli, G.; Liu, Q.; Aboayanah, K.R.; Huang, S.; Tang, X. Investigating the frost cracking mechanism and the related shallow alpine rockfall initiation process using three-dimensional FDEM. Eng. Geol. 2025, 348, 107960. [Google Scholar] [CrossRef]
  36. Shi, Z.; Li, J.; Wang, J.; Chen, J.; Lin, H.; Cao, P. Experimental and numerical study on fracture characteristics and constitutive model of sandstone under freeze-thaw-fatigue. Int. J. Fatigue 2023, 166, 107236. [Google Scholar] [CrossRef]
  37. Yu, J.; Zhang, B.; Zhao, J.; Wang, Y.; Jia, C.; Zhang, Q. An improved model for discrete element method simulation of spatial gradient distributions of freeze-thaw-induced damage to sandstone. Comput. Geotech. 2024, 171, 106412. [Google Scholar] [CrossRef]
  38. Huang, S.; Xu, L.; Ye, Y.; Musonda, K. Evaluation of the frost resistance of sandstones from the aspect of frost deformation. Bull. Eng. Geol. Environ. 2025, 84, 25. [Google Scholar] [CrossRef]
  39. Yu, S.; Ren, X.; Zhang, J. Modeling the rock frost cracking processes using an improved ice-Stress-Damage coupling method. Theor. Appl. Fract. Mech. 2024, 131, 104421. [Google Scholar] [CrossRef]
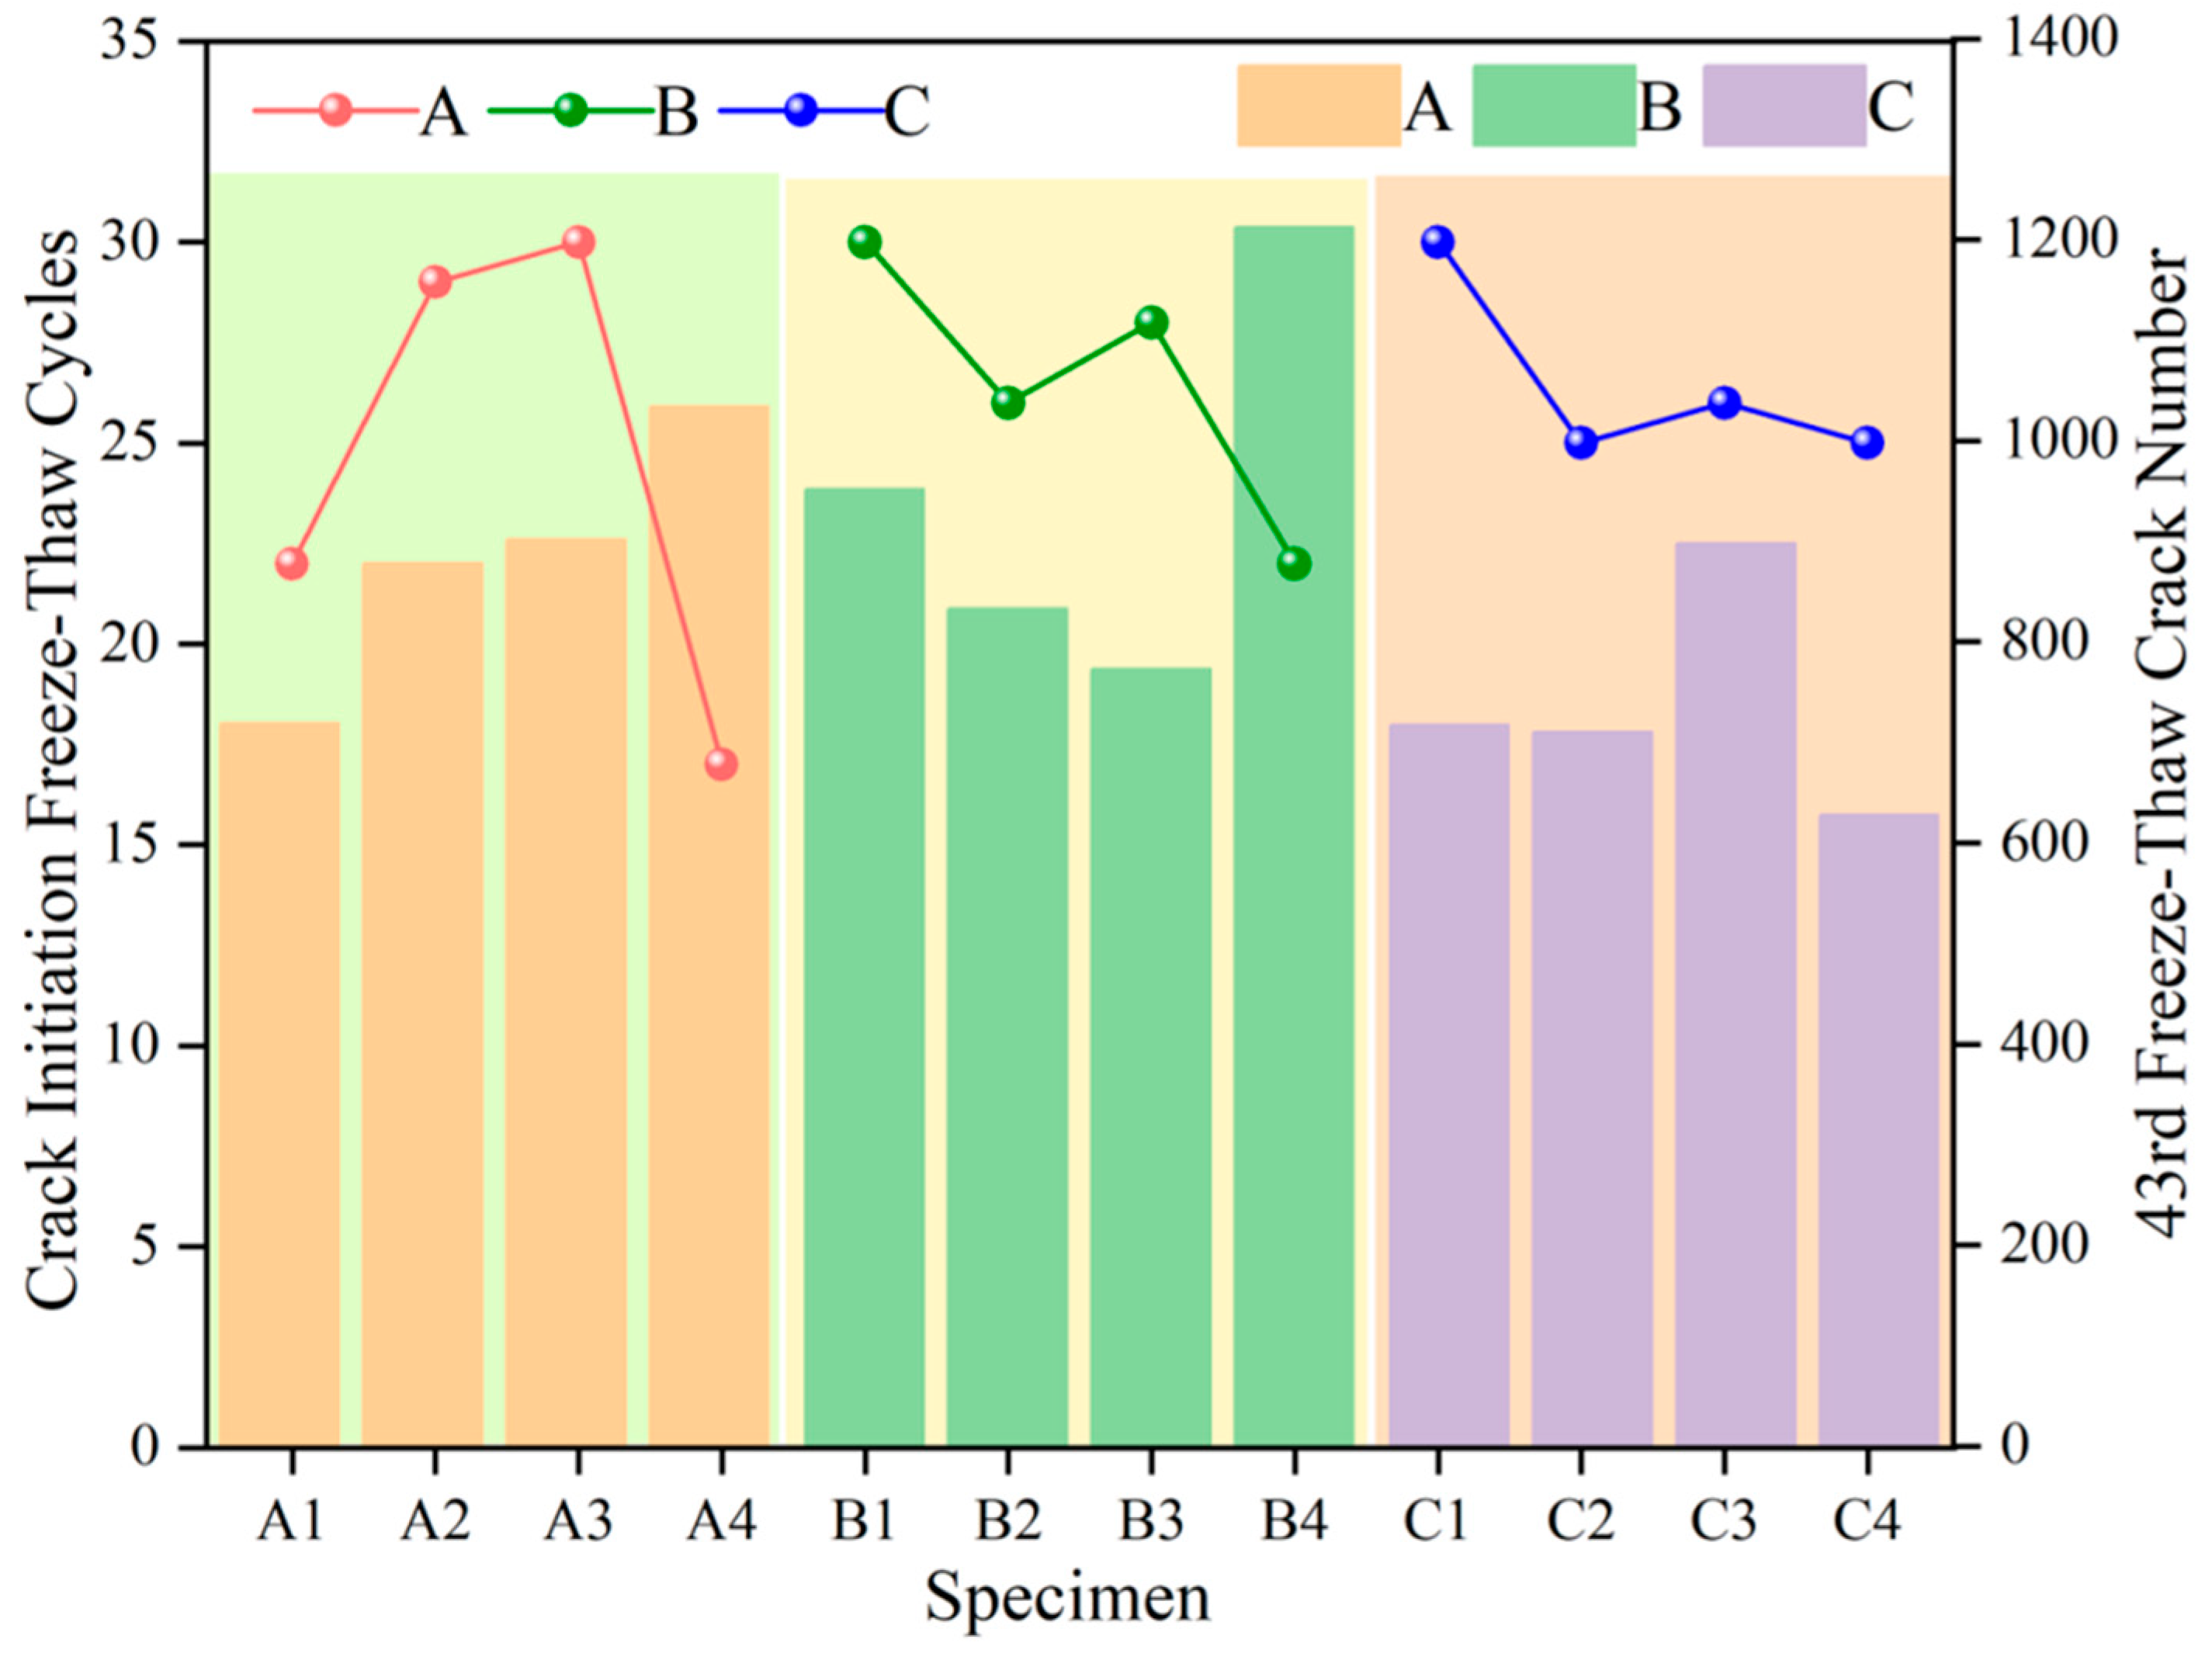
Figure 1. Freeze–thaw cycles cause slope landslides.
Buildings 15 02055 g001
Figure 2. Dimensions of freeze–thaw cycle models for fractured rock slopes with different schemes. (a) Group A; (b) Group B; (c) Group C.
Buildings 15 02055 g002
Figure 3. State changes in pore water particles during the freeze–thaw (F-T) process.
Buildings 15 02055 g003
Figure 4. Mechanisms of contact model and crack initiation. (a) Parallel Bond Model (PBM); (b) different crack types generated by particles with relative displacements (where V 1 and V 2 denote the representation of disconnected particles).
Buildings 15 02055 g004
Figure 5. (a) Numerical model and particle discretization of double-fractured rock specimen; (b) comparison between previous experimental results and numerical simulation results [39].
Buildings 15 02055 g005
Figure 6. Crack propagation in slope models under different schemes. (a) A1; (b) A2; (c) A3; (d) A4; (e) B1; (f) B2; (g) B3; (h) B4; (i) C1; (j) C2; (k) C3; (l) C4.
Buildings 15 02055 g006aBuildings 15 02055 g006bBuildings 15 02055 g006c
Figure 7. Comparison of freeze–thaw cycle counts for crack initiation and crack numbers at the 43rd cycle across different samples.
Buildings 15 02055 g007
Figure 8. Maximum principal stress distributions under different rock bridge distances after 15 freeze–thaw cycles. (a) d = 60 m; (b) d = 80 m; (c) d = 100 m; (d) d = 120 m.
Buildings 15 02055 g008
Figure 9. Maximum principal stress distributions under different rock bridge angles after 15 freeze–thaw cycles. (a) α = 30°; (b) α = 45°; (c) α = 60°; (d) α = 75°.
Buildings 15 02055 g009
Figure 10. Maximum principal stress distributions under different fissure angles after 15 freeze–thaw cycles. (a) β = 30°; (b) β = 45°; (c) β = 60°; (d) β = 75°.
Buildings 15 02055 g010
Table 1. Specimen scheme.
Specimen NumberSpecimen SchemeSpecimen NumberSpecimen Scheme
A1d = 60B3α = 60°
A2d = 80B4α = 75°
A3d = 100C1β = 30°
A4d = 120C2β = 45°
B1α = 30°C3β = 60°
B2α = 45°C4β = 75°
Table 2. Microcosmic parameters of the specimen for PFC2D simulation.
Micro-ParametersValueBall-ParametersValue
Emod(Pa)2.8 × 10⁹Yanshi_Rmax(m)0.9 × 10⁻³
Yanshi_pb_emod(Pa)2.8 × 10⁹Yanshi_Rmin(m)0.7 × 10⁻³
Yanshi_pb_ten(Pa)3.03 × 10⁵Yanshi_density2600
Yanshi_pb_coh(Pa)5.06 × 10⁴Shui_Rmax(m)0.4 × 10⁻³
Yanshi_Pb_fa(°)30Shui_Rmin(m)0.3 × 10⁻³
Shui_pb_emod(Pa)2.8 × 10⁹Shui_density2600
Shui_pb_ten(Pa)1.5 × 10⁸Shui_zhanbi0.05
Shui_pb_coh(Pa)1.5 × 10⁸fric0.5
Shui_Pb_fa(°)0damp0.7
Disclaimer/Publisher’s Note: The statements, opinions and data contained in all publications are solely those of the individual author(s) and contributor(s) and not of MDPI and/or the editor(s). MDPI and/or the editor(s) disclaim responsibility for any injury to people or property resulting from any ideas, methods, instructions or products referred to in the content.

