Article

Meshless Numerical Simulation on Dry Shrinkage Cracking of Concrete Piles for Offshore Wind Power Turbine

1
China Renewable Energy Engineering Institute, Beijing 100120, China
2
Institute of Ocean Energy and Intelligent Construction, Tianjin University of Technology, Tianjin 300384, China
3
College of Ocean Science and Engineering, Shanghai Maritime University, Shanghai 201306, China
4
State Key Laboratory of Hydraulic Engineering Intelligent Construction and Operation, Tianjin University, Tianjin 300072, China
*
Authors to whom correspondence should be addressed.
Buildings 2025, 15(12), 2006; https://doi.org/10.3390/buildings15122006
Submission received: 12 May 2025 / Revised: 8 June 2025 / Accepted: 9 June 2025 / Published: 11 June 2025
(This article belongs to the Special Issue Low Carbon and Green Materials in Construction—3rd Edition)

Abstract

Against the backdrop of the global energy transition, offshore wind power has undergone rapid development. As a vital component of offshore wind power infrastructure, dry shrinkage cracking in concrete piles poses a significant threat to the safe and stable operation of offshore wind power systems. However, the fundamental mechanism of concrete pile cracking during dry shrinkage—particularly the coupled effects of moisture diffusion, meso-structural heterogeneity, and stress evolution—remains poorly understood, lacking a unified theoretical framework. This knowledge gap hinders the development of targeted anti-cracking strategies for offshore concrete structures. Hence, investigating the mechanism of dry shrinkage cracking is of substantial importance. This paper employs numerical simulation to explore the patterns and influencing factors of dry shrinkage cracking in concrete piles for offshore wind turbines, aiming to provide theoretical support for enhancing pile performance. A meshless numerical simulation method based on the smoothed particle hydrodynamics (SPH) framework is developed, which generates concrete meso-structures via a specific algorithm, discretizes the moisture diffusion equation, defines dry shrinkage stress terms, and introduces a fracture coefficient to characterize particle failure, enabling the simulation of concrete dry shrinkage cracking processes. Simulation schemes are designed for varying aggregate percentages, aggregate particle sizes, dry shrinkage coefficients, and moisture diffusion coefficients, using a 100 mm-diameter circular concrete model. Qualitative results reveal the following: Increased aggregate percentages lead to more uniform moisture diffusion, with dry shrinkage crack number and length first increasing and then decreasing; larger aggregate particle sizes exacerbate moisture diffusion non-uniformity and intensify dry shrinkage cracking; higher dry shrinkage coefficients correlate with increased crack number and length; elevated moisture diffusion coefficients accelerate surface water loss, with cracking severity first increasing and then decreasing. The proposed SPH-based meshless method effectively simulates dry shrinkage cracking in offshore wind turbine concrete piles, demonstrating the significant impact of different factors on moisture diffusion and cracking patterns. This study offers insights for applying the SPH method in related fields, deepens the understanding of concrete dry shrinkage cracking mechanisms, and provides a theoretical foundation for the design and optimization of offshore wind power concrete piles.

1. Introduction

In the context of the global energy transition, offshore wind power, as a clean and renewable energy source, is gradually becoming a crucial force in alleviating the energy crisis and addressing climate change. In recent years, countries around the world have been increasing their investment in the offshore wind power industry, driving its continuous expansion. The construction of offshore wind farms relies on reliable infrastructure. As a vital foundation structure for supporting wind turbines, concrete piles play a key role in transferring the loads of the upper structure to the foundation. The performance of concrete piles directly affects the safety and stable operation of the entire offshore wind power system [1,2]. However, the offshore environment is extremely complex and harsh. The water level of the sea is constantly changing dynamically, subjecting concrete piles to long-term alternating wet–dry cycles. During the drying stage, the internal moisture of the concrete gradually dissipates, causing volume shrinkage and generating shrinkage stress. When the piles are submerged in seawater again during the wet stage, the concrete will expand to a certain extent. This cycle repeats. During this periodic wet–dry process, micro-cracks in the concrete continuously initiate, expand, and penetrate, leading to dry shrinkage cracking [3,4], as shown in Figure 1. Once cracks appear, seawater and a large number of corrosive media contained therein, such as chloride ions and sulfate ions, can easily penetrate into the interior of the concrete through the cracks, accelerating the deterioration process of the concrete. At the same time, the presence of cracks destroys the protective barrier of the concrete for the internal steel bars, exposing the steel bars directly to a corrosive environment and exacerbating the problem of steel bar corrosion [5]. Steel bar corrosion not only reduces the mechanical properties of the steel bars themselves but also further squeezes the concrete due to the volume expansion of the corrosion products, causing the cracks to expand further and forming a vicious cycle, which seriously threatens the stability and durability of offshore wind power concrete piles. Therefore, it is of great significance to conduct research on the dry shrinkage cracking mechanism of offshore wind power concrete piles.
Drying shrinkage cracking of concrete is one of the core challenges facing the long-term performance of concrete piles in offshore wind power. Its mechanism involves the multi-physical field coupling of moisture diffusion, meso-structural heterogeneity, and stress evolution. Existing research mainly proceeds through three technical approaches: experiments, theoretical analysis, and numerical simulation. However, a unified theoretical framework has not yet been established, and the specific issues are as follows: Experimental research on concrete dry shrinkage cracking can directly obtain data such as shrinkage deformation, cracking time, and crack width of concrete under different mix ratios and environmental conditions, visually demonstrating the dry shrinkage cracking characteristics of concrete. For example, Chen et al. [6] designed four groups of cylindrical specimens with different secondary vibration time intervals, continuously monitored the shrinkage strain for 17 weeks, and carried out compressive strength, water expansion, and other tests; Oualid Belabbas et al. [7] prepared natural aggregate concrete (NAC) and third-generation recycled aggregate concrete (RAC), with some RAC added with silica fume, and tested their mechanical properties, microstructure, and total shrinkage; Sun et al. [8] experimentally studied the influence of the water-binder ratio and silica fume content on the early-age shrinkage. Nine mix ratios were designed, and parameters such as shrinkage, temperature, and humidity under different conditions were measured; Samouh et al. [9] conducted experiments on self-compacting concrete cylindrical specimens to monitor internal relative humidity, shrinkage, and microstructure changes. However, field tests require the construction of complex test devices and consume a large amount of materials such as concrete and steel bars, resulting in a high investment of manpower and material resources. Although laboratory tests have relatively lower costs, the acquisition and operation costs of equipment for simulating complex marine environments are also high. In addition, concrete dry shrinkage cracking is a long-term process. Especially for tests simulating actual service environments, it may take several years or even longer to obtain complete data. Moreover, the actual marine environment is complex and changeable. It is difficult to accurately control factors such as seawater erosion and the frequency of wet–dry cycles in field tests, and it is also difficult to fully reproduce the real environment in laboratory simulations, resulting in certain deviations in the test results. Theoretical research involves inductive analysis of experimental data, establishing mathematical models to describe the concrete dry shrinkage cracking process, and summarizing the quantitative relationships between influencing factors and cracking characteristics for prediction and analysis. For example, Chen et al. [6] used methods such as designing secondary vibration and shrinkage test devices, conducting comparative tests, and data fitting to propose a calculation model for early-age shrinkage strain of concrete, considering the influence of secondary vibration. Kim et al. [10] used the improved large-scale consolidation theory, introduced empirical relationships, and performed CFD analysis to propose a numerical method and related equations for evaluating the surface moisture balance of concrete to determine the plastic shrinkage cracking risk. Gao et al. [11] proposed a shrinkage and creep prediction model for recycled polyester fiber-reinforced sustainable self-compacting concrete (RPET-R-RSCC), considering the influence of recycled coarse aggregates (RCAs), supplementary cementitious materials (SCMs), and recycled polyester fibers (RPET). However, for the convenience of mathematical processing, theoretical models often simplify the complex microstructure and physicochemical processes of concrete, resulting in certain errors between theoretical calculation results and actual situations. At the same time, different theoretical models are established based on specific experimental conditions and assumptions, with narrow applicable ranges and are difficult to generalize to various actual engineering situations.
Different from experimental and theoretical research, numerical simulation research only needs to be carried out on a computer, without the need for a large number of experimental materials and equipment. It can complete multiple simulation analyses in a short time and obtain results quickly, greatly reducing research costs and time. At the same time, it can easily simulate various complex boundary conditions and multi-physical field coupling effects, such as simultaneously considering the influence of seawater erosion, temperature changes, and wet–dry cycles on concrete dry shrinkage cracking, which is difficult to achieve in experimental and theoretical research. Among them, the finite element method discretizes the solution domain into a finite number of elements and obtains the approximate solution of the entire domain by solving the element equations. It has the advantages of wide application and mature theory and can handle various complex geometric shapes and boundary conditions. For example, Wang et al. [12] proposed a dry shrinkage model that can simulate the shrinkage deformation of the concrete matrix and aggregates and carried out finite element numerical simulation research. Xu et al. [13] established a FEM-SBFEM (finite element method-scaled boundary finite element method) coupling model to conduct meso-scale dry shrinkage cracking simulation of concrete. Zhang et al. [14] modeled a real concrete meso-scale model and carried out meso-scale dry shrinkage cracking simulation of concrete. However, the finite element method has difficulties in discretizing irregular regions, has a strong dependence on grids, and its accuracy is limited when simulating large-deformation problems. The discrete element method discretizes materials into particle elements and calculates the interactions between particles through contact forces, which can intuitively simulate the mechanical behavior of granular materials and has advantages in studying the internal microstructure damage of concrete. For example, Zhu et al. [15] established a discrete element model considering real aggregates and steam-curing damage indicators based on DEM and carried out cyclic triaxial numerical simulations. Zhao et al. [16] developed a high-fidelity concrete meso-scale model of DEM and carried out numerical simulations of concrete crack propagation. However, the discrete element method requires a large amount of calculation, it struggles to simulate the overall performance of macro-structures, and it is difficult to use it to determine the model parameters. In recent years, emerging numerical simulation methods include the peridynamics method, the material point method, the numerical manifold method, etc. The peridynamics method is based on the non-local continuum mechanics theory and uses an integral-type constitutive relation instead of the traditional differential-type constitutive relation. It can naturally handle discontinuous problems, does not need to pre-define the crack path, and can automatically simulate the initiation and expansion of cracks. It has strong adaptability to complex materials and structures. For example, Jin et al. [17] proposed a numerical simulation method for concrete meso-scale fracture based on peridynamics and carried out numerical simulations of concrete dry shrinkage cracking under dry shrinkage stress. Wang et al. [18] proposed a thermo-mechanical coupling model based on peridynamics and carried out simulations of the concrete cracking process. Yaghoobi et al. [19] proposed a peridynamics method that can simulate the cracking process of fiber-reinforced concrete. However, it has a large amount of calculation, the physical meaning of the model parameters is not clear, and the determination process is relatively complex. Currently, it still faces challenges in high-dimensional problems and large-scale calculations. The numerical manifold method is based on topological manifolds and covering technology and unifies continuous and discontinuous deformations in one calculation format. It can flexibly handle complex boundary conditions and discontinuous problems and has unique advantages in simulating discontinuous media such as jointed rock masses. At the same time, it can be easily combined with other numerical methods such as the finite element method. For example, Xu et al. [20] introduced a modified Mohr–Coulomb criterion into the numerical manifold method and carried out simulations of crack propagation in concrete gravity dams. However, the theory and algorithm of this method are relatively complex, have high requirements for users in practical applications, and the calculation efficiency needs to be improved in some cases.
The smoothed particle hydrodynamics method (SPH) is a mesh-free Lagrangian numerical method that discretizes a continuous medium into interacting particles and approximately calculates physical quantities between particles through a kernel function [21,22,23,24,25,26,27,28,29,30,31]. It has strong adaptability to complex boundaries and large-deformation problems, does not require grid division, and avoids the problem of grid distortion which exists in FEM. Meanwhile, its parameters are strictly derived from PDEs, which have actual physical meanings, unlike DEM. It is suitable for simulating the dry shrinkage cracking process of concrete in the seawater wet–dry cycle environment. Currently, SPH has certain applications in rock fracture mechanics [32,33,34,35,36,37,38,39,40,41,42,43,44], but it has few applications in the simulation of dry shrinkage cracking of offshore wind power concrete piles because the dry shrinkage cracking modelling technology in SPH has not been widely investigated.
Based on the shortcomings of previous research, as shown in Table 1, this paper developed a mesh-free numerical simulation method that can simulate the dry shrinkage cracking of offshore wind power concrete piles based on the SPH program framework. A SPH generation method for the concrete meso-structure was proposed, including random aggregates, the transition layer, and the concrete matrix inside the concrete. The simulation method of concrete failure was defined, and the failure of SPH particles was characterized by introducing a fracture coefficient k. The humidity diffusion equation was discretized and incorporated into the SPH program, and the dry shrinkage stress term was defined to achieve the simulation of the change in concrete dry shrinkage stress during the humidity change process. Finally, the dry shrinkage cracking of concrete under different aggregate percentages, different aggregate particle sizes, different dry shrinkage coefficients, and different humidity conduction coefficients was simulated. The research results provide a reference for the application of the SPH method in the simulation of dry shrinkage cracking of offshore wind power concrete piles.

2. SPH Basic Principles

2.1. Kernel Approximation Method and Particle Approximation Method in SPH

The smoothed particle hydrodynamics method (SPH), as a mesh-free Lagrangian numerical method, discretizes a continuous medium into a series of interacting particles. In SPH, the kernel approximation method is a key technique for describing the interactions between particles.
The kernel approximation method is implemented based on the kernel function. The kernel function W(x, h) is a function with compact support, where x represents the distance between particles, and h is the smoothing length, which determines the range of action of the kernel function. The kernel function reaches its maximum value when x = 0 and gradually decreases as x increases. When x exceeds a certain range (usually 2h), the value of the kernel function approaches 0, which means that only particles in close proximity have significant interactions.
Therefore, through the kernel function, the approximate value of any physical quantity f(x) at x can be expressed as:
f ( x ) = Ω f ( x ) W ( x     x , h ) d x
where 〈 〉 is the approximation symbol; 〈f(x)〉 is the approximate form of the function f(x) at x; Ω is the size of the domain of influence of a specific particle x.
Another approximate expression of the kernel function for the first-order derivative of the SPH function is:
· f ( x ) = Ω f ( x ) · W ( x     x , h ) d x
When applying the kernel function approximation to the numerical simulation process, particle approximation operations are required. Rewrite Equation (1) into a discrete form, and its expression is:
f ( x i )   = j = 1 N m j ρ j f ( x j ) · W i j  
where i and j are particle labels; N is the total number of particles in the compact support domain. According to the particle approximation method with reference to Equation (2), it can be further rewritten as:
· f ( x i )   = j = 1 N m j ρ j f ( x j ) · W i j  

2.2. SPH Governing Equations

In the SPH method, the continuity equation and the momentum equation are crucial for describing the mechanical behavior of solids. The continuity equation essentially reflects the law of conservation of mass, while the momentum equation is used to describe the law of conservation of momentum during the motion of solids. Their expressions can be written as:
d ρ i d t = j = 1 N m j v i j β W i j , β
d v i α d t = j = 1 N m j ( σ i j α β ρ i 2 + σ i j α β ρ j 2 + T i j ) W i j , β
where α and β are Einstein notations.

3. Concrete Shrinkage Cracking Modelling

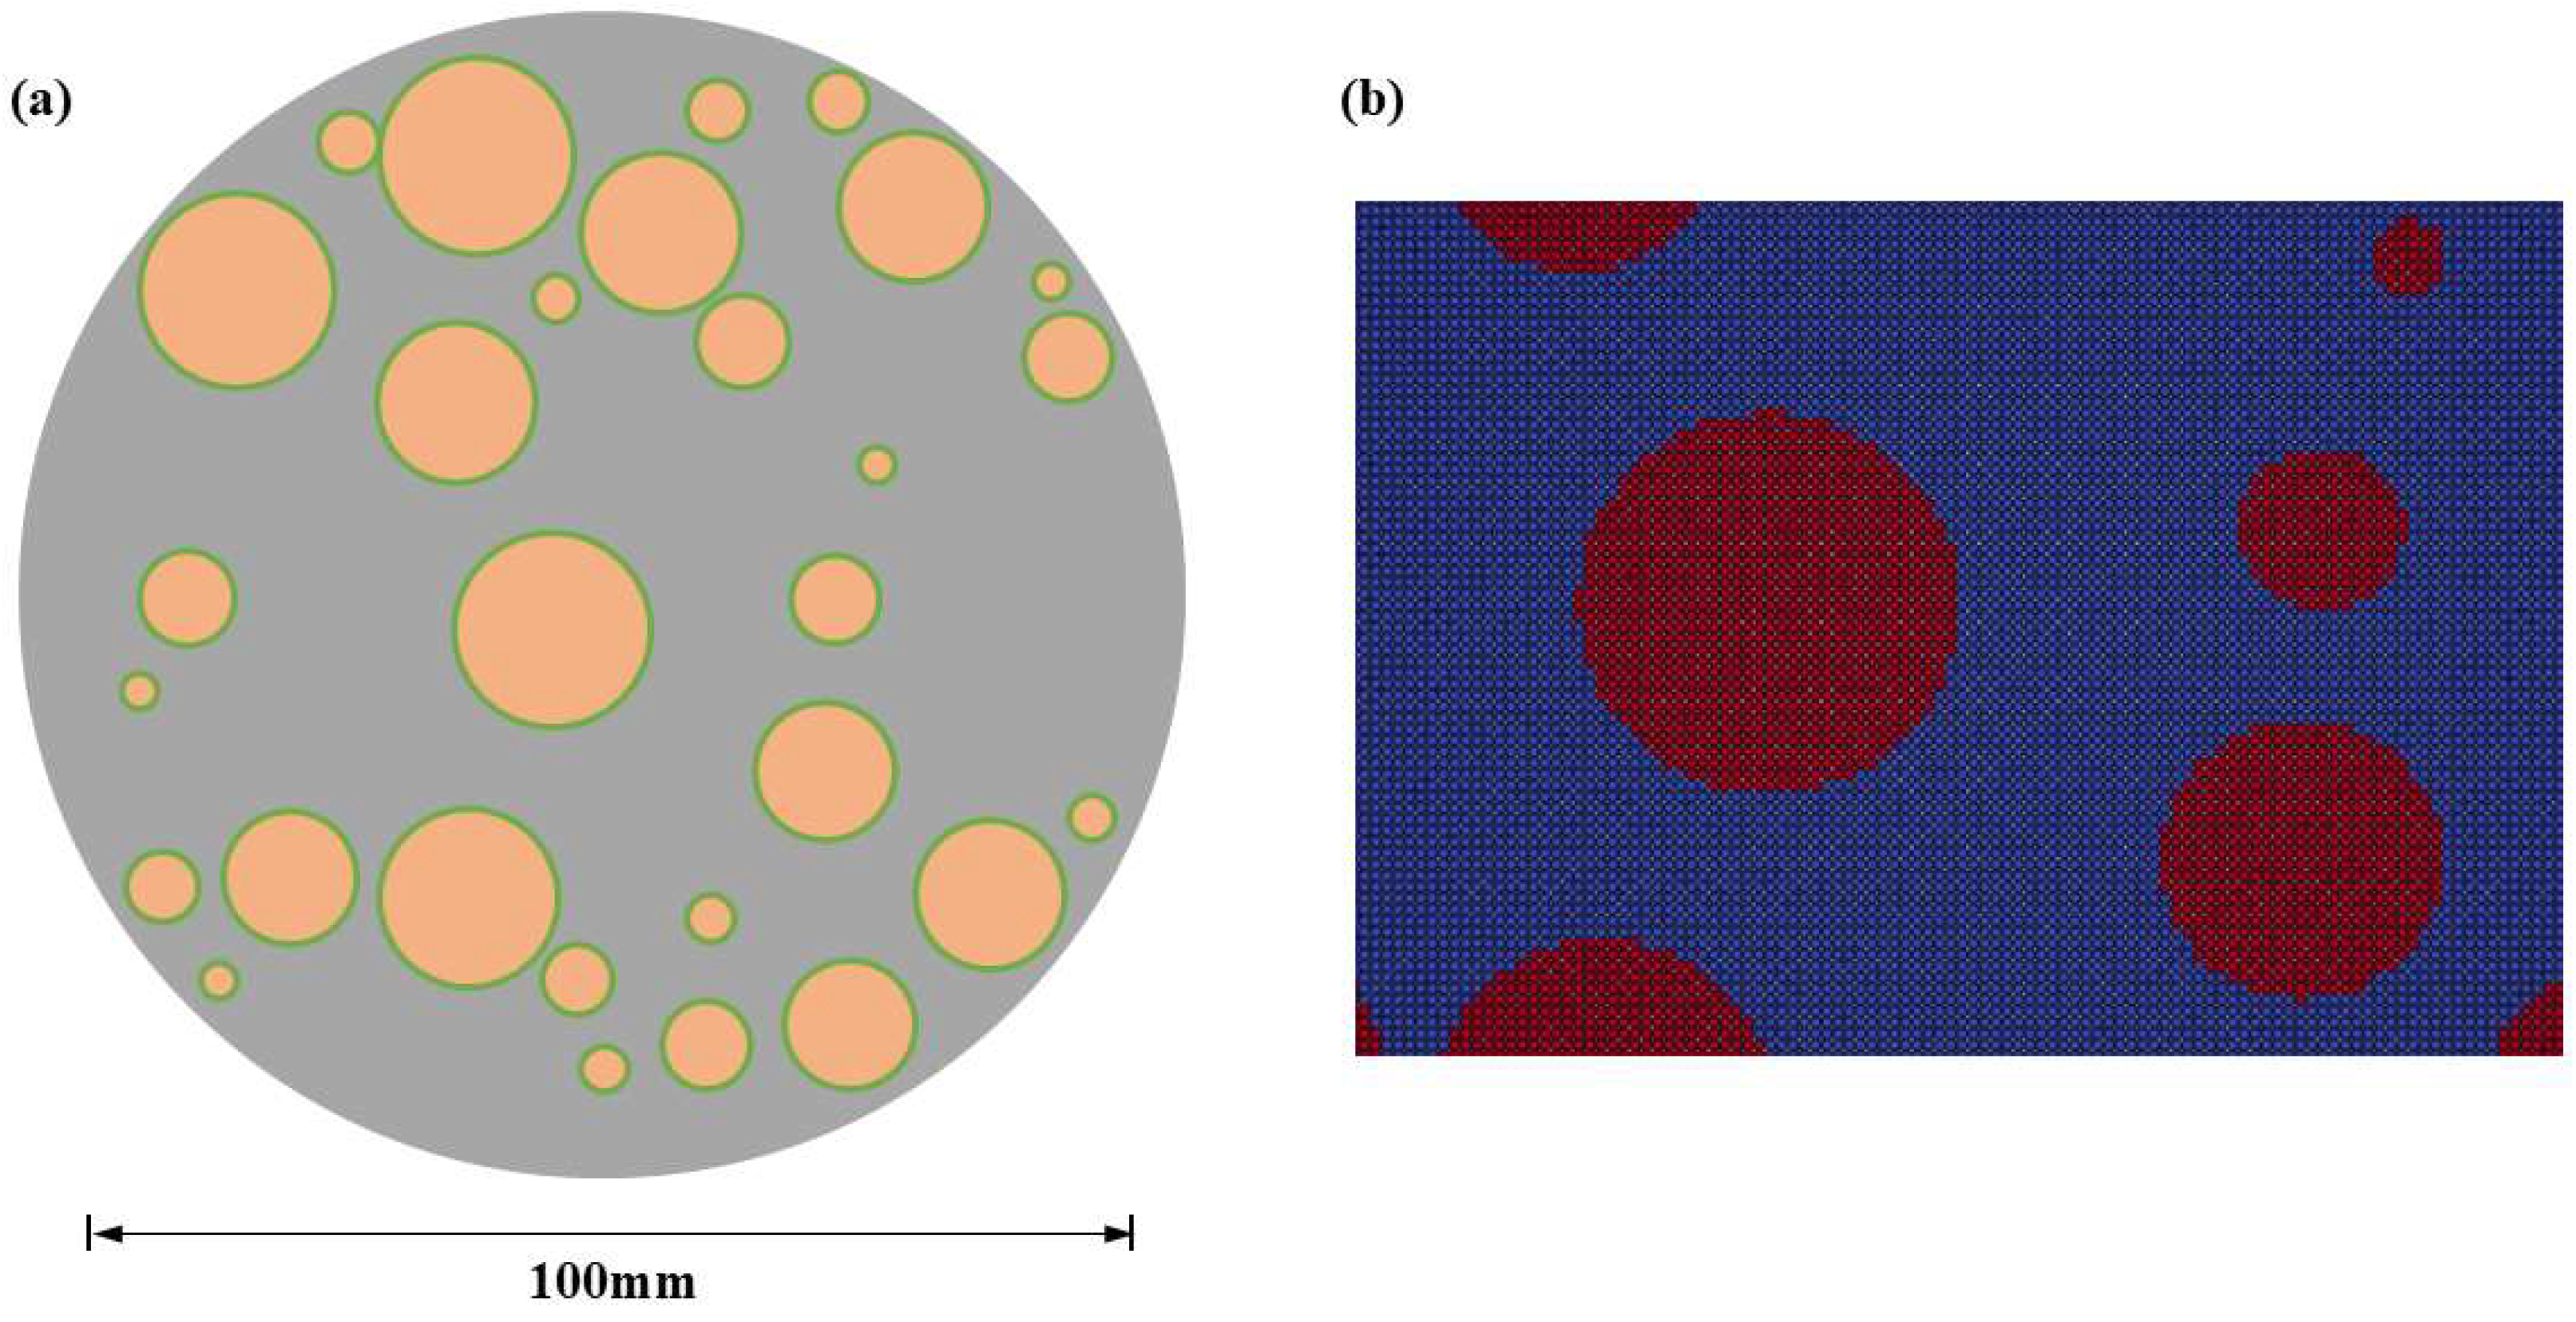
3.1. Generation of Concrete Meso-Structures

The generation of the concrete meso-structure mainly focuses on the generation of random aggregates in concrete. For programming convenience, it is generally assumed that the shape of concrete aggregates is circular. The key to determining circular aggregates lies in determining their center coordinates and radii. Therefore, the steps to determine the concrete meso-structure are as follows:
(1)
Assume that the size of the concrete (in two-dimensions) is x1 in length and y1 in width. The aggregate generation percentage is defined as the percentage of the generated aggregate area in the two-dimensional area of the concrete, denoted as Pa. Meanwhile, there are differences in the sizes of circular aggregates. The maximum aggregate diameter is statistically D1, and the minimum is D2.
(2)
Assume that the center coordinates of the aggregate are (xg, yg) and the radius of the circular aggregate is rg. Considering the random distribution of circular aggregates, random numbers q1, q2, and q3 with values in the range of (0–1) are introduced. Thus, the expressions for the abscissa xg, ordinate yg of the aggregate center, and the radius rg of the circular aggregate can be written as relationships with the circular aggregate diameters D1, D2, and the random numbers q1, q2, and q3:
x g = x 1 q 1
y g   =   y 1 q 2
r g =   ( D 2   +   ( D 1 D 2 ) q 3 ) / 2
(3)
Determine whether there is an overlap between the newly generated aggregate and the previously generated aggregates. The judgment method is to compare the distance between the centers of the two aggregates with the sum of their radii. If the distance between the centers is greater than the sum of the radii, there is no overlap; if the distance between the centers is less than the sum of the radii, there is an overlap, and the aggregate needs to be regenerated.
(4)
Finally, check whether the generated aggregate percentage reaches the target aggregate percentage Pa. If it reaches Pa, stop generating aggregates.
The interface transition zone is set by designating a circle of particles around the aggregate as interface transition zone particles.

3.2. Concrete Humidity Equation and Dry Shrinkage Stress

The humidity diffusion equation can be written as a second-order partial differential equation:
t h = D h ( 2 h x 2 + 2 h y 2 + 2 h z 2 )
In Equation (10), h is the relative humidity, and Dh is the humidity diffusion coefficient.
To avoid numerical instability when SPH directly discretizes the second-order partial differential equation, this paper discretizes the second-order partial differential equation into two first-order partial differential equations [30]. Therefore, its expressions are as follows:
h v β = D h β ( h x β )
h t = · h v
During the discretization of the second-order partial differential equation, a humidity diffusion flux, hv, is introduced, which represents the humidity diffusion equation.
Through the particle approximation method (4) for Equations (11) and (12), the humidity diffusion equation in SPH form can be obtained:
( h v β ) i = ( D h β ) i j = 1 N m j ρ j ( h i h j ) i β W i j
h i t = j = 1 N m j ρ j ( ( h v ) i ( h v ) j ) i W i j
When the external moisture evaporates, the solid loses water and shrinks, generating tensile stress that leads to dry shrinkage cracking. To characterize the dry shrinkage cracking characteristics of the solid due to water loss, the dry shrinkage strain, εs, is introduced. The relationship between the dry shrinkage strain and the relative humidity h can be expressed as [31,32,33]:
ε s = δ i j α ( h 0 h t ) = δ i j α Δ h
where α is the dry shrinkage coefficient, h0 represents the initial humidity inside the solid, and ht represents the instantaneous humidity inside the solid. According to the linear elastic theory, the dry shrinkage stress, σs, can be expressed as:
σ s = 3 δ i j α K Δ h = 3 K ε s
where K is the bulk modulus.
In SPH, the stress tensor σαβ, considering dry shrinkage stress, consists of three parts: shear stress, isotropic pressure, and the dry shrinkage stress σs in Equation (16). Therefore, its expression can be written as:
σ α β = p δ α β + τ α β + δ α β σ s

3.3. Concrete Failure Simulation Method

In SPH, to characterize the failure state of particles, a failure coefficient η is introduced. When a particle is damaged, η = 0; otherwise, η = 1. Therefore, considering the failure of concrete particles, the SPH control equations can be written in the following form:
d ρ i d t = j = 1 N m j v i j β η i W i j , β
d v i α d t = j = 1 N m j ( σ i j α β ρ i 2 + σ i j α β ρ j 2 + T i j ) η i W i j , β

4. Analysis of Numerical Simulation Results

4.1. Numerical Simulation Scheme and Calculation Parameters

To explore the influence of different factors on the dry shrinkage cracking process of offshore wind power concrete piles, four schemes were set up: Scheme A with different aggregate percentages, Scheme B with different aggregate particle sizes, Scheme C with different dry shrinkage coefficients, and Scheme D with different humidity diffusion coefficients. The specific schemes are shown in Table 2. The model is a circular concrete model with a diameter of 100 mm, and the entire model is divided into 31,417 particles in total. The initial relative humidity of the circular concrete model is h0 = 1.0, and the relative humidity at the model boundary is h = 0.45. The mesoscopic parameters of the concrete model are set as follows: the elastic modulus of mortar E = 28 Gpa, Poisson’s ratio μ = 0.2, and tensile strength σt = 2 MPa; it is assumed that the aggregate does not break, its elastic modulus E = 72 Gpa, Poisson’s ratio μ = 0.2; the elastic modulus of the transition layer E = 24 Gpa, Poisson’s ratio μ = 0.2, and tensile strength σt = 1 MPa. The model size in shown in Figure 2.

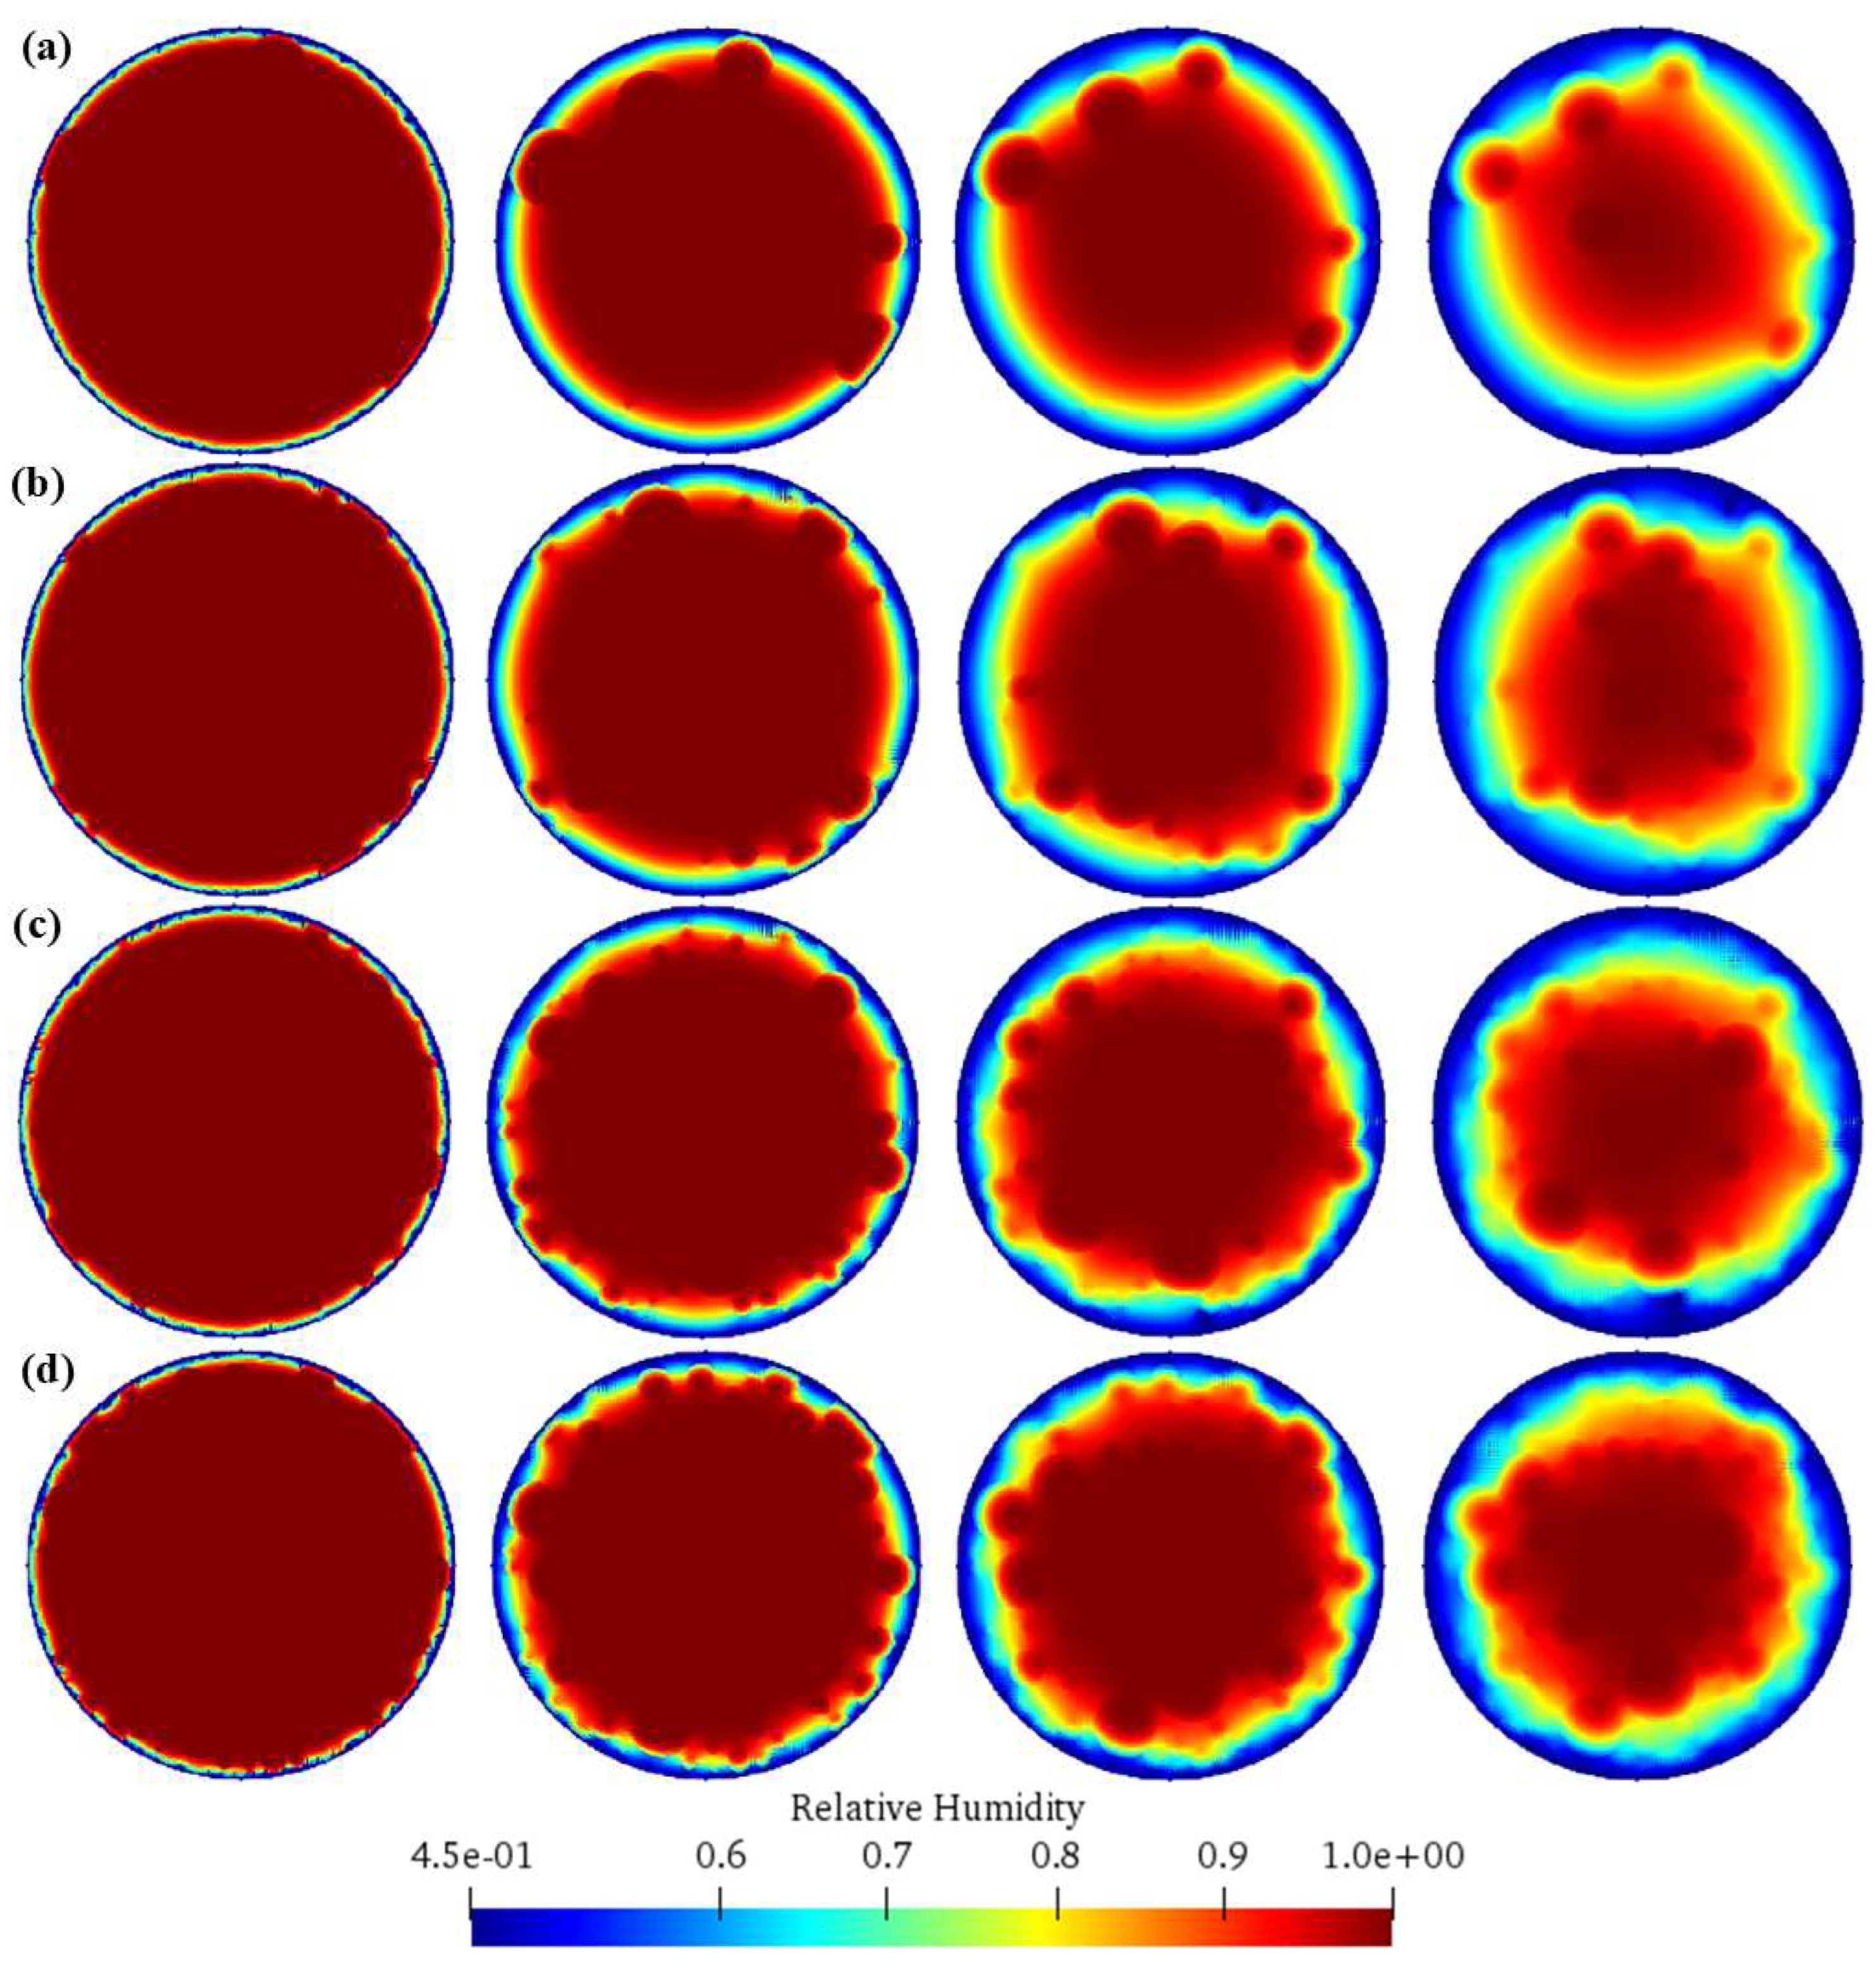
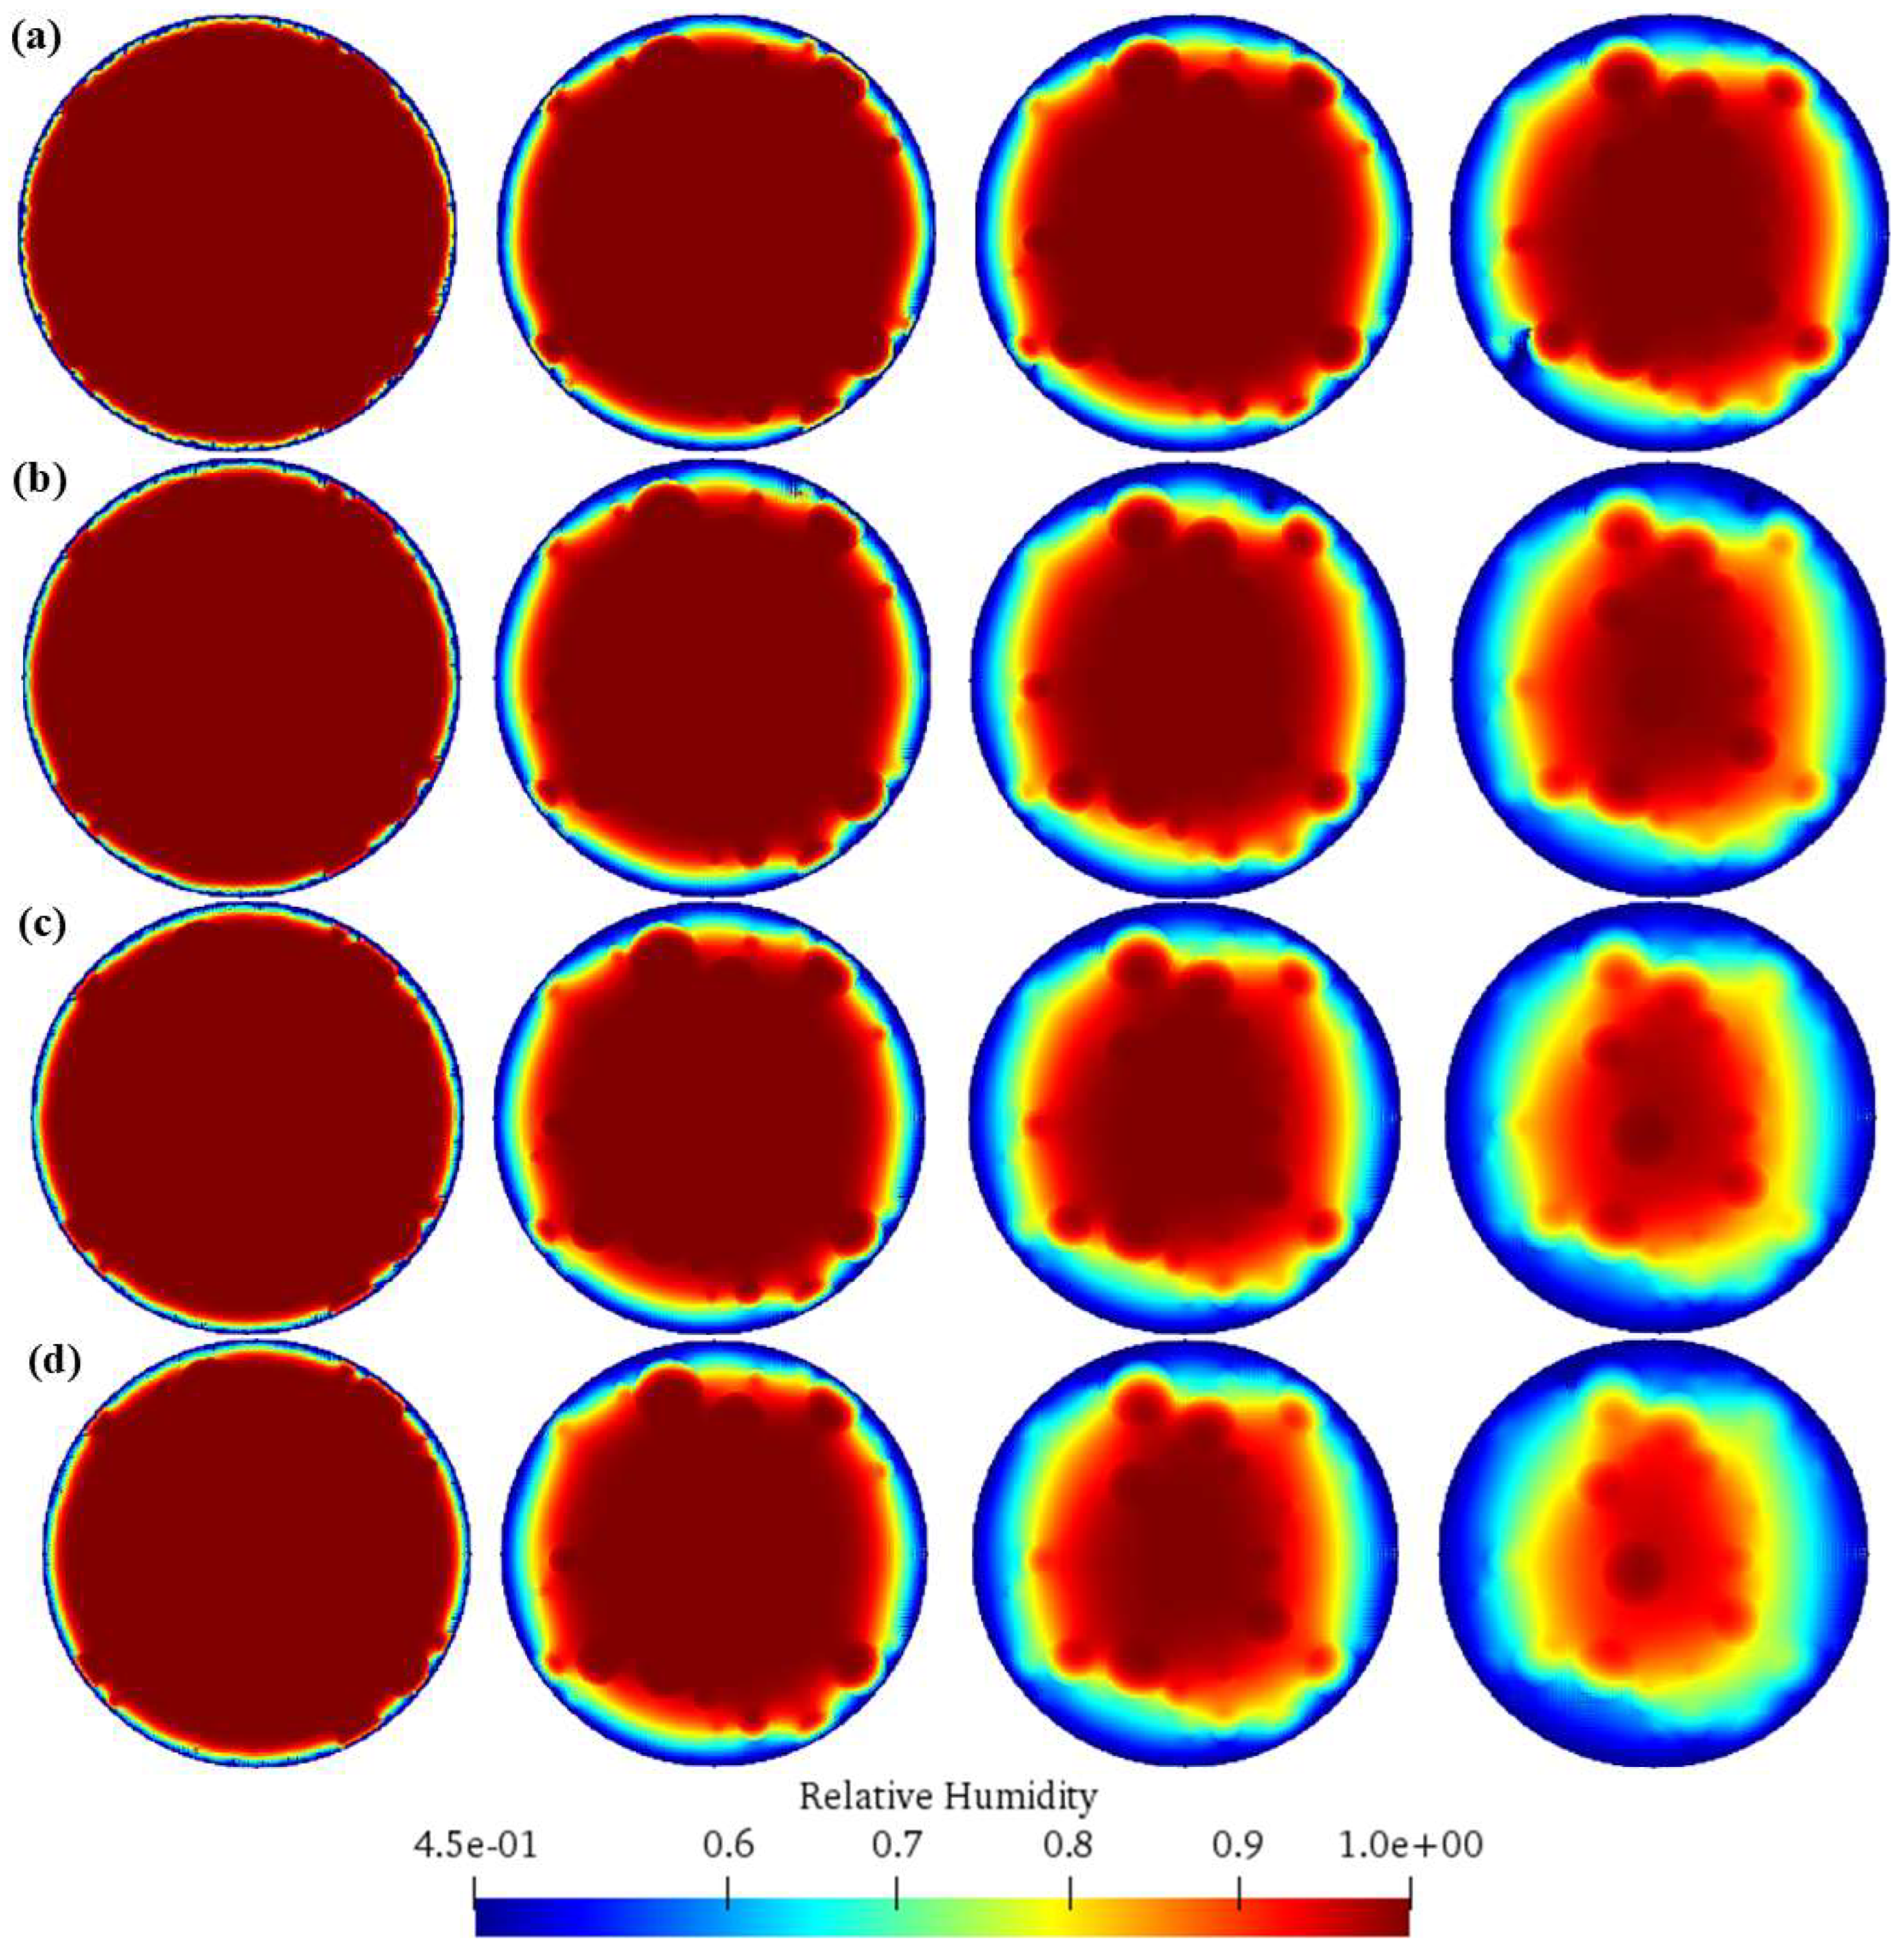
4.2. Analysis of Humidity Diffusion Process Under Different Schemes

4.2.1. Scheme A: Different Aggregate Percentages

Figure 3 shows the numerical simulation results of the humidity diffusion process under different aggregate percentage schemes. It can be seen from the figure that different aggregate percentages affect the diffusion law of the concrete surface humidity. When the aggregate percentage Pa = 10%, the low humidity gradually spreads from the outer periphery of the model to the interior. Since the aggregate content is low at this time, the humidity diffusion shape is relatively irregular. Affected by the outer aggregates, the humidity diffusion coefficient is lower near the aggregates, resulting in a lower humidity diffusion degree, while the humidity diffusion coefficient is higher away from the aggregates, with a higher humidity diffusion degree. Therefore, there is an uneven humidity diffusion phenomenon. Specifically, the humidity diffusion degree is lower in the upper-left and lower-right parts of the model, and higher in other parts. When the aggregate percentage Pa = 20%, it can be clearly seen from the simulation results that the areas with a small humidity diffusion degree are concentrated in the upper-left, lower-left, upper-right, and lower-right parts of the model. Further observation reveals that these areas are exactly where the aggregates are concentrated. This is because the water absorption and water permeability of the aggregates themselves are different from those of the concrete matrix. The aggregate-concentrated areas hinder the diffusion of water. When water migrates from the inside of the concrete to the surface, it encounters the aggregate-concentrated areas, and its diffusion path becomes complex, and the diffusion speed slows down, resulting in a relatively small humidity diffusion degree in these areas. When the aggregate percentage is increased to Pa = 30%, the distribution of aggregates in the model gradually becomes more uniform. From the perspective of the humidity diffusion process, compared with the case of Pa = 20%, the humidity diffusion of the entire model becomes more uniform. However, upon careful observation, it can be found that the humidity diffuses in a curved shape along the edges of the aggregates. This is because the properties of the interface transition zone between the aggregates and the concrete matrix are different from those of both. When water diffuses to the interface transition zone, the resistance it encounters changes, causing the diffusion direction to change, resulting in a curved diffusion path. Overall, due to the increased uniformity of aggregate distribution, the uniformity of humidity diffusion in the entire model has been significantly improved. When Pa = 40%, the humidity diffusion process is more uniform than that when Pa = 30%. At this time, the aggregates in the model are more uniformly distributed, further weakening the impact of local aggregate aggregation or uneven distribution on humidity diffusion. In this case, the diffusion of water in the concrete is more stable and uniform. During the process of humidity diffusing from the model surface to the interior, the humidity changes in each area are relatively more consistent, and there are no obvious areas with large humidity diffusion differences. The humidity diffusion path is also more regular and orderly. This indicates that as the aggregate percentage increases and reaches a certain level, the influence of the internal structure of the concrete on humidity diffusion becomes more stable and balanced, making the humidity diffusion process more uniform.

4.2.2. Scheme B: Different Aggregate Particle Sizes

Figure 4 shows the numerical simulation results of the humidity diffusion process under different aggregate particle size schemes. Different aggregate particle sizes have a significant impact on the humidity diffusion process of concrete. The general rule is that as the particle size increases, the humidity diffusion becomes more uneven. When the aggregate particle size range is 1 mm ≤ d ≤ 10 mm, the humidity diffusion is relatively uniform. From the overall perspective of the model, during the process of low humidity diffusing from the model boundary to the interior, the path is relatively regular. This is because the smaller-sized aggregates are distributed relatively densely and uniformly in the concrete, and the resistance encountered by water during migration is relatively consistent, so the humidity diffusion shows a relatively uniform state. When the aggregate particle size range is 2 mm ≤ d ≤ 20 mm, the humidity diffusion begins to show a certain degree of unevenness. In the model, it can be observed that the humidity diffusion around the larger-sized aggregates is different from that in other areas. Due to the presence of large-sized aggregates, their physical properties and interactions with the surrounding concrete matrix change. When water encounters large-sized aggregates, the diffusion path is disturbed. Near the large-sized aggregates, the water diffusion speed slows down, resulting in a lag in humidity changes in these areas compared to other parts, thus reducing the uniformity of humidity diffusion. When the aggregate particle size range is 3 mm ≤ d ≤ 30 mm, the unevenness of humidity diffusion becomes more obvious. The large-sized aggregates occupy a larger space in the concrete, and their hindering effect on water diffusion is more prominent. Around the large-sized aggregates, a “low-speed zone” of humidity diffusion will be formed, showing a significant humidity difference from other areas. Moreover, the spacing between large-sized aggregates is relatively large, which makes the diffusion path of water in these areas with large spacing more tortuous, further exacerbating the unevenness of humidity diffusion. In the simulation results, obvious local differences in humidity distribution can be clearly seen. The humidity in some areas drops rapidly, while the humidity in the areas where large-sized aggregates are concentrated drops slowly. When the aggregate particle size range is 4 mm ≤ d ≤ 40 mm, the unevenness of humidity diffusion reaches its maximum. At this time, the influence of large-sized aggregates dominates, and the diffusion of water in the concrete is greatly hindered. In the areas where large-sized aggregates are concentrated, the humidity can hardly diffuse in, forming obvious humidity “islands”. In the void areas with large spacing between aggregates, the water diffusion speed is relatively fast, resulting in a serious uneven distribution of humidity in the model.

4.2.3. Scheme C: Different Dry Shrinkage Coefficients

Figure 5 shows the numerical simulation results of the humidity diffusion process under different dry shrinkage coefficient schemes. Since different dry shrinkage coefficients have no effect on the distribution of concrete aggregates and the humidity diffusion coefficient, the humidity diffusion processes under different dry shrinkage coefficients are similar. The humidity diffuses relatively smoothly from the model boundary to the interior. In the initial stage, the humidity inside the model is high. As time goes by, the water gradually diffuses to the boundary, and there is a lag at the aggregates.

4.2.4. Different Humidity Diffusion Coefficients

Figure 6 shows the numerical simulation results of the humidity diffusion process under different humidity diffusion coefficient schemes. It can be seen from the figure that as the humidity diffusion coefficient increases, the degree of water loss from the concrete surface becomes larger and larger, and the rate and range of humidity diffusion change significantly. When Dh = 2 × 10⁻¹⁰ m/s, the water on the concrete surface begins to gradually deplete, but the loss speed is relatively slow. In the initial stage, the humidity inside the model is high, and the water diffuses to the surface at a relatively stable speed. From the figure, it can be seen that the low-humidity area expands a small range from the model boundary to the interior, and most of the area inside the model still maintains a high humidity. This indicates that the humidity diffusion is limited to a certain extent at this time, the water migration is relatively slow, and the humidity distribution inside the concrete is relatively uniform, with little difference in humidity changes in each area. When Dh = 4 × 10⁻¹⁰ m/s, the water loss speed on the concrete surface increases significantly. The low-humidity area expands a larger range into the model interior, and obvious humidity gradient changes begin to appear inside the model. The humidity in the area near the boundary drops rapidly, while the humidity in the interior area drops relatively slowly. This is because the increase in the humidity diffusion coefficient allows water to pass through the concrete interior more quickly and reach the surface for evaporation. During this process, the unevenness of the water distribution inside the concrete gradually increases, and the humidity differences in different areas begin to emerge. When Dh = 6 × 10⁻¹⁰ m/s, the degree of water loss from the concrete surface further increases. The low-humidity area expands to a wider range inside the model, and the humidity gradient becomes more obvious. At this time, the humidity in some areas near the boundary has approached the relative humidity at the model boundary, while the humidity inside the model is still at a relatively high level, forming a large humidity difference. This humidity difference will cause uneven shrinkage stress inside the concrete, which has a certain impact on the structural stability of the concrete. When Dh = 8 × 10⁻¹⁰ m/s, the degree of water loss from the concrete surface reaches its maximum. The low-humidity area quickly expands into the model interior and almost occupies most of the model area. The humidity inside the model drops sharply, and the humidity distribution is extremely uneven.

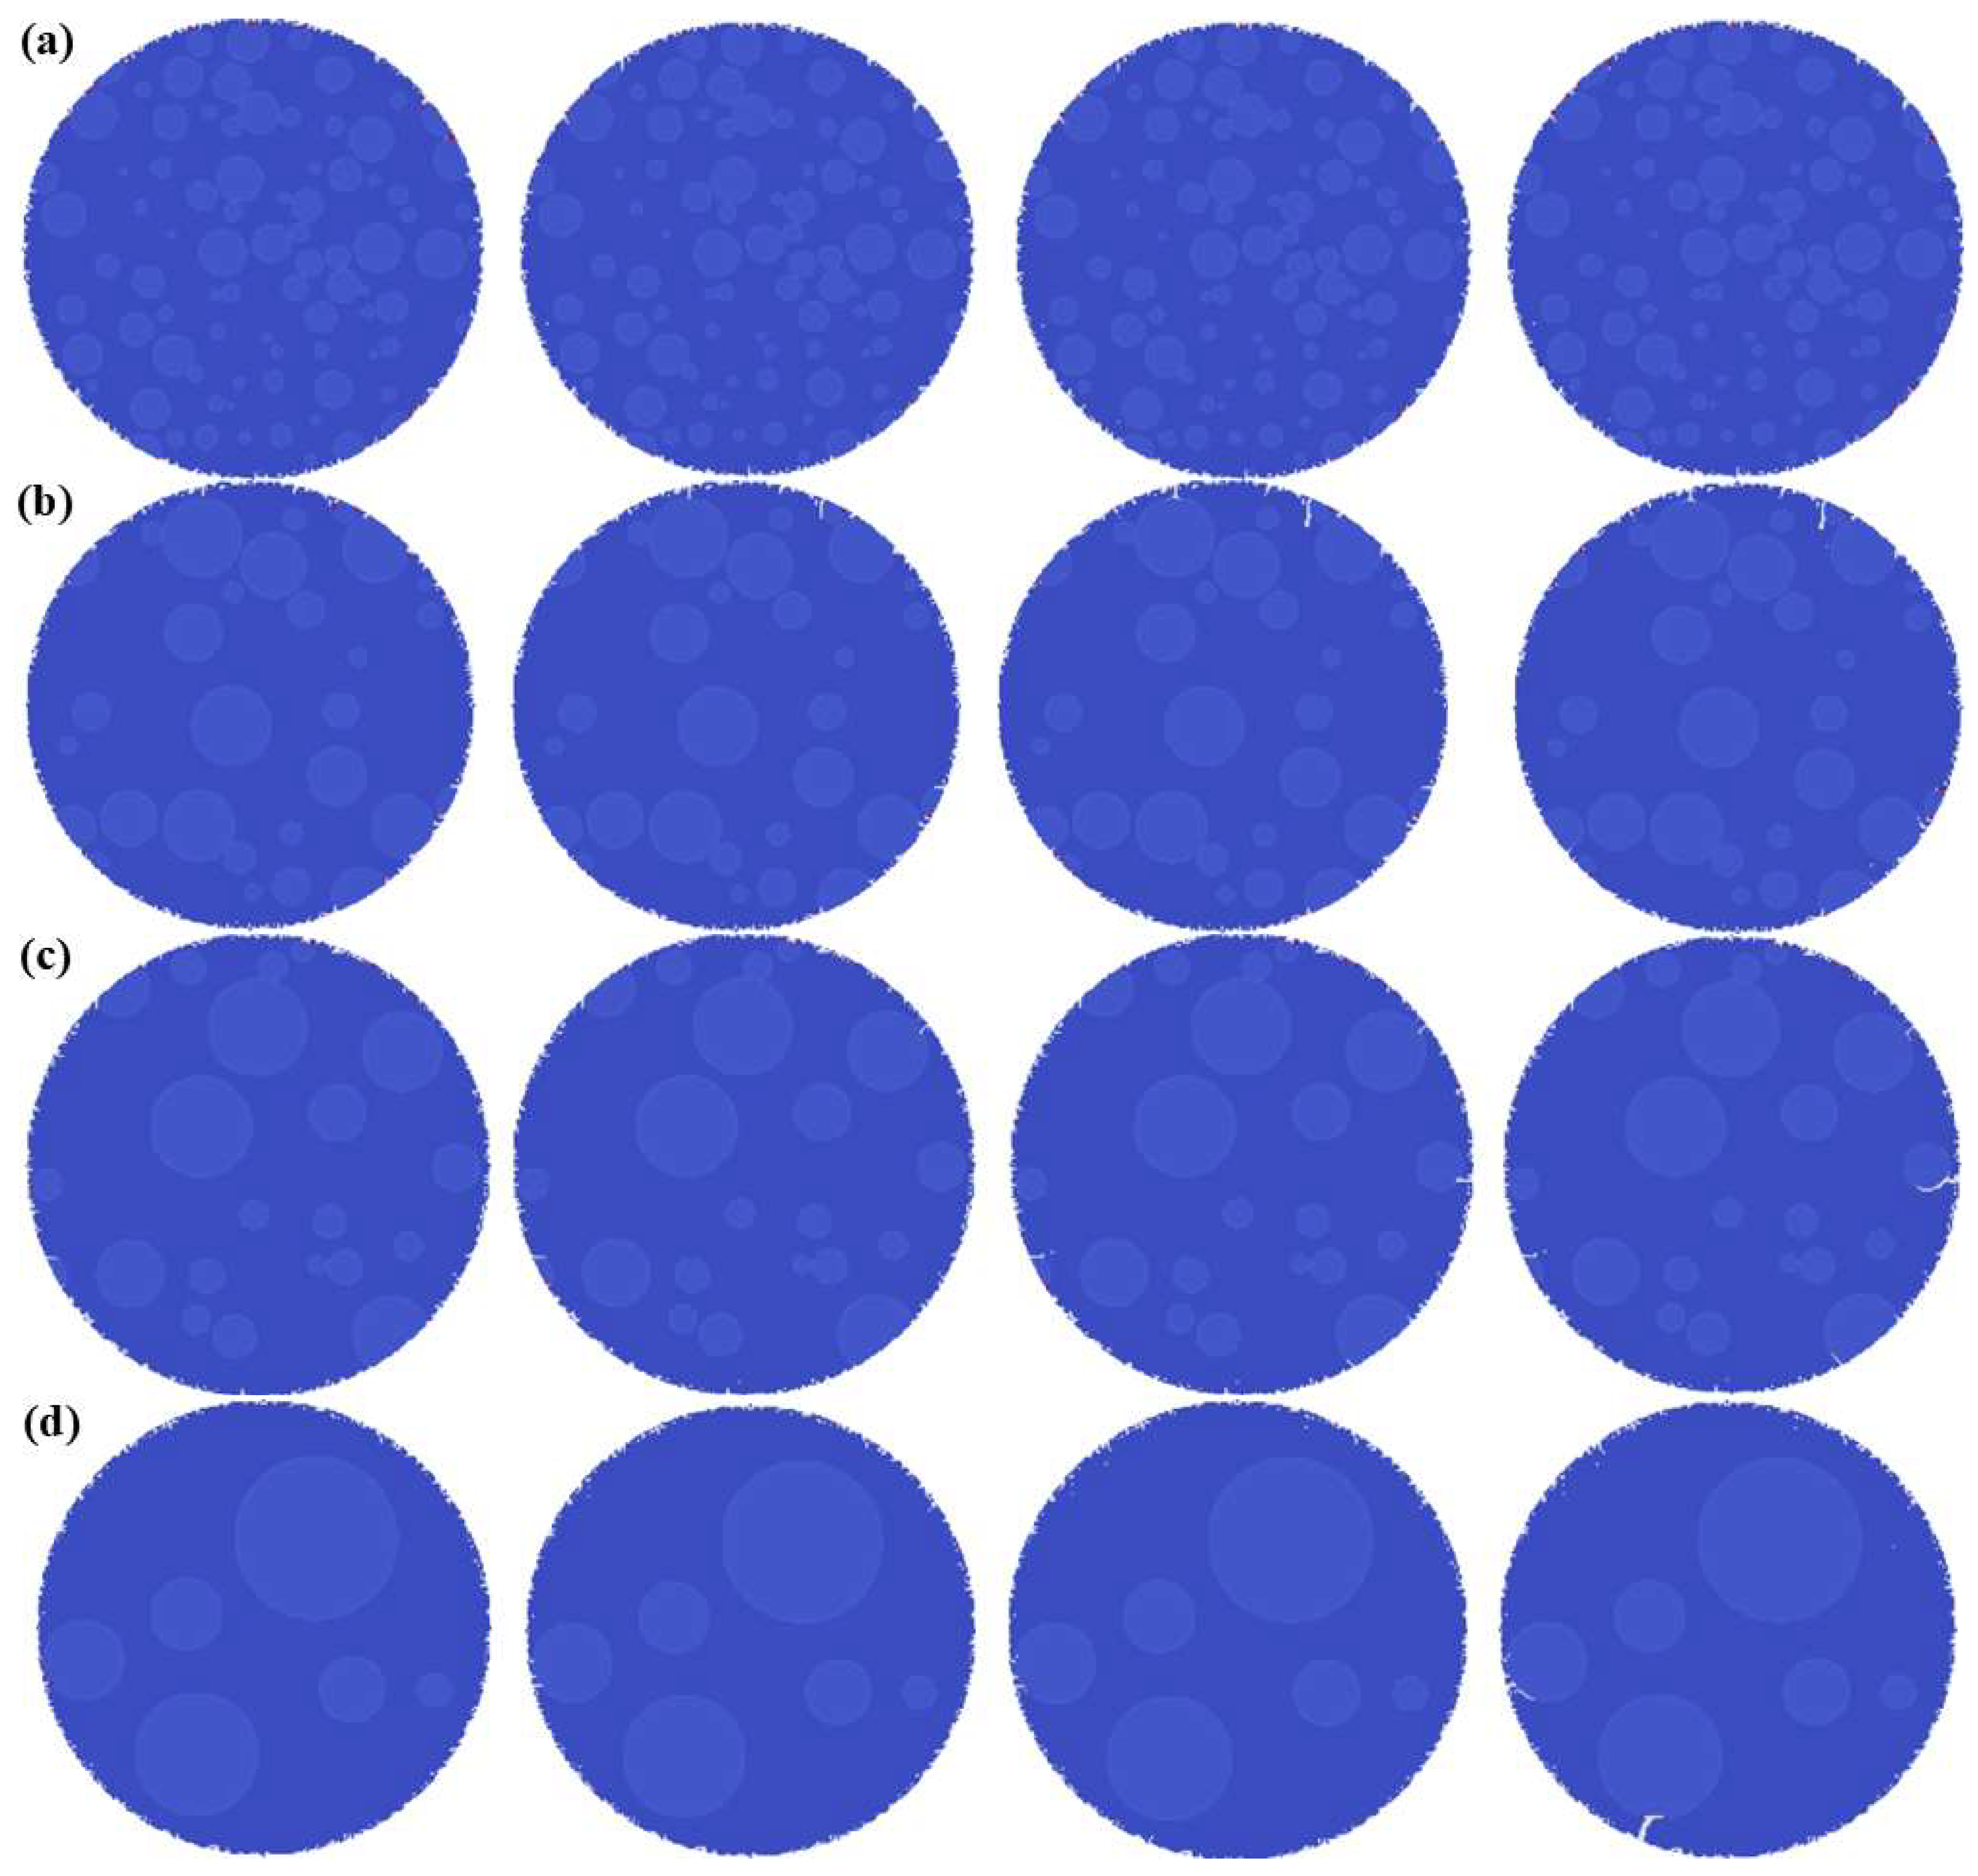
4.3. Analysis of Concrete Dry Shrinkage Cracking Process Under Different Schemes

4.3.1. Scheme A: Different Aggregate Percentages

Figure 7 shows the concrete dry shrinkage cracking process under different aggregate percentages. When the aggregate percentage is Pa = 10%, it can be clearly seen from the figure that cracks are generated along the periphery of the circular model. Further observation reveals that the dominant cracks are mainly generated at the parts connected to the transition layer around the aggregates. This is because when the aggregate content is low, the internal structure of the concrete is relatively uniform, but the transition layer between the aggregates and the surrounding matrix is a weak link in the structure. During the drying shrinkage process, stress concentration is more likely to occur in the transition layer. When the stress exceeds its tensile strength, cracks preferentially initiate and expand at these positions. Since the number of aggregates is small at this time, the cracks can expand relatively freely, so obvious crack distributions are formed along the periphery of the model, and the cracks connected to the aggregate transition layer become dominant cracks due to more serious stress concentration. As the aggregate percentage increases to Pa = 20%, the number of dominant cracks increases significantly. This is mainly because the increase in the aggregate percentage leads to a corresponding increase in the area of the aggregate transition zone. More weak areas provide conditions for the generation of cracks. During the dry shrinkage of concrete, these increased weak areas are likely to become crack sources, resulting in an increase in the number of dominant cracks. At the same time, due to the increase in aggregates, the influence on the internal stress distribution of the concrete is more complex, and the interaction between different aggregate transition zones may also promote the further expansion and increase in the size of cracks, making the overall cracking situation more serious than when Pa = 10%. When the aggregate percentage reaches Pa = 30%, the number and length of the dominant cracks reach their maximum. At this time, the aggregates in the concrete are distributed relatively more densely, and the area of the transition zone further expands. The number of stress concentration points increases, and their interactions are more intense. More stress-concentrated areas trigger more cracks. Moreover, due to the stress transfer and superposition effects, these cracks can obtain greater driving force during the expansion process, resulting in the maximum length of the dominant cracks. This phenomenon indicates that at this aggregate percentage, the internal stress distribution and structural characteristics of the concrete make the development of dry shrinkage cracking the most significant, and the concrete structure is relatively more severely damaged. When the aggregate percentage is Pa = 40%, a different situation occurs. The length of the dominant cracks decreases and gradually becomes consistent with the length of the dry shrinkage cracks. This is because at this time, the aggregate content reaches its maximum, and the overall strength of the concrete is significantly enhanced. A large number of aggregates are evenly distributed in the concrete, strengthening the skeleton structure of the concrete and making the internal stress distribution more uniform, reducing the stress concentration phenomenon. Although the transition zone is still a relatively weak part, due to the increase in overall strength, the cracks encounter greater resistance during the expansion process and are difficult to form long-dominant cracks as before. Therefore, the length of the dominant cracks decreases and tends to be the same as that of the general dry shrinkage cracks, reflecting that the structural response of the concrete during the dry shrinkage cracking process is significantly different from that in the case of low aggregate percentages, and the anti-cracking performance of the overall structure is improved.

4.3.2. Scheme B: Different Aggregate Particle Sizes

Figure 8 shows the drying shrinkage cracking process of concrete under different aggregate sizes. When the aggregate size range is 1 mm ≤ d ≤ 10 mm, the internal structure of the concrete is relatively uniform. The smaller-sized aggregates are densely and uniformly distributed, and the resistance to water migration is relatively consistent, resulting in relatively uniform humidity diffusion. During the drying shrinkage process, the stress generated inside the concrete is also relatively uniform. At this time, the number of dominant cracks is small, and their lengths are short. This is because the smaller aggregate size leads to smaller differences in the mechanical properties of various parts inside the concrete, and the stress concentration phenomenon is not obvious, making it difficult for cracks to initiate and expand in large numbers. When the aggregate size range increases to 2 mm ≤ d ≤ 20 mm, the humidity diffusion begins to show non-uniformity. The presence of large-sized aggregates interferes with the water diffusion path, forming “low-speed zones” of humidity diffusion around the large-sized aggregates. During the drying shrinkage process, larger stress concentrations occur in these areas with lagging humidity changes, resulting in an increase in the number of dominant cracks and an increase in their lengths. Due to the different interactions between large-sized aggregates and the surrounding concrete matrix compared to small-sized aggregates, the stress distribution around the aggregates becomes more complex, making it easier to trigger the initiation and expansion of cracks. When the aggregate size range reaches 3 mm ≤ d ≤ 30 mm, the non-uniformity of humidity diffusion becomes more obvious. The large-sized aggregates occupy more space, and their obstructive effect on water diffusion is more prominent, forming obvious humidity differences. Under the action of drying shrinkage stress, the stress concentration inside the concrete intensifies. The number of dominant cracks further increases, and their lengths also increase further. The spacing between large-sized aggregates is relatively large, and the water diffusion path in these areas with large spacing is tortuous, resulting in an increase in the difference in drying shrinkage degrees of different regions, thus generating more and longer cracks. When the aggregate size range is 4 mm ≤ d ≤ 40 mm, the non-uniformity of humidity diffusion reaches its maximum. The humidity in the areas where large-sized aggregates gather can hardly diffuse in, forming humidity “isolated islands”. At this time, the internal stress distribution of the concrete is extremely non-uniform, and the lengths and numbers of dominant cracks reach their maximum. At the gathering places of large-sized aggregates, the stress concentration phenomenon is extremely serious. A large number of cracks initiate and expand here. Due to the superposition and transfer of stress, the cracks can obtain sufficient driving force to continue to extend, making the dominant cracks not only numerous but also very long, seriously damaging the structural integrity of the concrete.

4.3.3. Scheme C: Different Dry Shrinkage Coefficients

Figure 9 shows the drying shrinkage cracking process of concrete under different drying shrinkage coefficients. When the drying shrinkage coefficient α = 0.0001, the drying shrinkage strain caused by the loss of internal moisture in the concrete is relatively small, and the resulting drying shrinkage stress is also low. In this case, only a few weak parts inside the concrete develop cracks due to stress concentration. The number of drying shrinkage cracks is small, the number of dominant cracks is not large, and their lengths are short. These cracks mainly initiate at the transition layer between the aggregate and the mortar, as well as at the internal defects of the concrete. Due to the small stress, there is insufficient driving force for crack propagation, so it is difficult for the cracks to extend over a long distance. When the drying shrinkage coefficient increases to α = 0.0002, the drying shrinkage strain increases with the change of relative humidity, and the resulting drying shrinkage stress increases accordingly. At this time, more weak areas reach the cracking stress, and the number of drying shrinkage cracks begins to increase. Stress is more likely to concentrate around the aggregates, in the interfacial transition zone, and at the internal micro-defects of the concrete, causing the number of dominant cracks to increase to some extent and their lengths to grow. Because a larger drying shrinkage stress can provide greater power for crack propagation, enabling the cracks to break through more resistance and extend further. When the drying shrinkage coefficient reaches α = 0.0003, the drying shrinkage stress further increases, and the stress distribution inside the concrete becomes more uneven. More areas generate cracks due to the stress exceeding the tensile strength of the material, and the number of drying shrinkage cracks increases significantly. In the areas with severe stress concentration, not only does the number of dominant cracks increase, but their lengths also increase significantly. At this time, the interaction between cracks begins to appear. Some cracks will connect and penetrate each other during the propagation process, further exacerbating the cracking degree of the concrete. When the drying shrinkage coefficient increases to α = 0.0004, the drying shrinkage stress reaches a relatively high level, and the shrinkage deformation of the concrete due to water loss becomes more intense. A large number of cracks initiate inside the concrete, and the number of drying shrinkage cracks reaches its maximum. Due to the increase in the number of stress concentration areas and the large stress values, the number of dominant cracks increases significantly. Driven by strong stress, they can continue to expand, and their lengths also reach their maximum. At this time, the structural integrity of the concrete is severely damaged. A large number of cracks are intertwined, resulting in a sharp decline in the mechanical properties of the concrete, posing a great threat to the stability and durability of the concrete piles for offshore wind turbines.

4.3.4. Scheme D: Different Humidity Diffusion Coefficients

Figure 10 shows the drying shrinkage cracking process of concrete under different humidity diffusion coefficients. When the humidity diffusion coefficient is Dh = 2 × 10⁻¹⁰ m/s, the water loss rate from the concrete surface is relatively slow, and the internal humidity distribution is relatively uniform. The time required for water migration is long. In this case, the drying shrinkage strain accumulates slowly inside the concrete, and the drying shrinkage stress gradually increases, causing a certain degree of drying shrinkage cracking in the concrete. At this time, dominant cracks begin to initiate in the areas of stress concentration inside the concrete, such as the interface transition zone between the aggregate and the mortar, and the micro-defects inside the concrete. Due to the slow humidity diffusion and continuous stress accumulation, the dominant cracks have sufficient time and driving force to expand, with a large degree of expansion and long lengths, which significantly damages the concrete structure. When the humidity diffusion coefficient is increased to Dh = 4 × 10⁻¹⁰ m/s, the water loss rate accelerates, and the humidity diffusion range and rate increase accordingly. The humidity gradient inside the concrete begins to increase. However, due to the accelerated water migration speed, the excessive concentration of drying shrinkage stress is suppressed to a certain extent. Compared with the case of Dh = 2 × 10⁻¹⁰ m/s, the degree of drying shrinkage cracking is reduced. The number of dominant cracks is relatively reduced, and the degree of expansion becomes smaller. Some micro-cracks that might have developed into long cracks originally, due to the rapid water migration and the change of the surrounding stress state, lack the driving force for crack expansion, resulting in a significant shortening of their lengths and a reduced degree of damage to the concrete structure. When the humidity diffusion coefficient reaches Dh = 6 × 10⁻¹⁰ m/s, the water loss from the concrete surface intensifies, and the internal water can migrate to the surface more quickly. This further reduces the humidity difference inside the concrete, and the generation and accumulation rate of drying shrinkage stress decrease significantly. The degree of drying shrinkage cracking is further reduced, and cracks only appear in a few areas with severe stress concentration. The number of dominant cracks is significantly reduced, and their expansion is greatly restricted. Most cracks stop expanding shortly after initiation and are difficult to cause serious damage to the concrete structure. When the humidity diffusion coefficient is increased to Dh = 8 × 10⁻¹⁰ m/s, the water diffuses extremely rapidly inside the concrete, and a relatively uniform humidity field can be formed almost instantaneously. In this case, the drying shrinkage stress hardly concentrates, and the degree of drying shrinkage cracking is minimal. Only a very small number of fine cracks can be observed. Dominant cracks almost do not exist. Even if an extremely small number of cracks appear, their degree of expansion is almost negligible. The concrete structure can maintain good integrity under the condition of a high humidity diffusion coefficient, and its mechanical properties are less affected by drying shrinkage cracking.

5. Discussions

5.1. Comparison Between the Numerical Simulation Results of This Study and Previous Experimental Results

Figure 11 shows the comparison between the numerical simulation results of this study and previous experimental results [34]. It can be seen that the numerical simulation results are in good agreement with the experimental results. In terms of the generation location of drying shrinkage cracks, the numerical simulation results show that a circle of drying shrinkage cracks is generated along the periphery of the model, and the dominant cracks are connected to the aggregates, resulting in relatively serious damage to the surface layer of the circular concrete. This is highly consistent with the phenomena observed in previous experiments. During the experiment, when the concrete specimen undergoes the drying shrinkage stage, due to the faster water loss rate on the surface layer of the concrete than inside, tensile stress is generated on the surface layer. Moreover, due to the differences in the elastic modulus and shrinkage characteristics between the aggregates and the concrete matrix, stress concentration is likely to occur in the interface transition zone between the aggregates and the concrete. When the tensile stress exceeds the tensile strength of the concrete, cracks will initiate at these weak positions. With the continuous progress of drying shrinkage, the cracks gradually expand and connect with each other, eventually forming a circle of drying shrinkage cracks around the model, and the dominant cracks often connect with the aggregates. This similarity indicates that the SPH-based numerical simulation method used in this study can effectively capture the basic laws of crack generation and expansion during the drying shrinkage cracking process of concrete.

5.2. Application Prospects of the SPH Method in the Simulation of Concrete Drying Shrinkage Cracking

The smoothed particle hydrodynamics (SPH) method exhibits unique and significant advantages in the field of concrete drying shrinkage cracking simulation. Compared with traditional finite element methods and discrete element methods, it has broad development prospects.
In the simulation of concrete drying shrinkage cracking, the advantages of the SPH method are reflected in multiple key aspects. In terms of the ability to handle complex boundaries and large-deformation problems, the SPH method does not require mesh generation, which fundamentally avoids the difficulties in discretizing irregular regions and the problem of mesh distortion faced by the finite element method. During the drying shrinkage cracking process of concrete, as the cracks continue to expand and the concrete structure deforms, the quality of the finite element mesh will seriously decline, affecting the calculation accuracy. In contrast, the SPH method discretizes the continuous medium into interacting particles and uses the kernel function to approximately calculate the physical quantities between particles. It can flexibly and accurately simulate the drying shrinkage cracking behavior of concrete under complex deformations, ensuring the reliability of the calculation results.
Compared with the discrete element method, the SPH method has obvious advantages in simulating the overall performance of macroscopic structures. The discrete element method discretizes materials into particle elements, which has a large computational amount and often struggles to simulate macroscopic structures. Moreover, the determination process of model parameters is relatively complex. The SPH method, on the other hand, can more efficiently simulate and analyze macroscopic concrete structures. At the same time, by reasonably setting the interactions between particles and relevant parameters, it can better reflect the influence of the internal microstructure of concrete on the macroscopic drying shrinkage cracking performance, achieving an effective combination of micro- and macro-perspectives and providing a more comprehensive view for studying the mechanism of concrete drying shrinkage cracking.
However, currently, most simulations of concrete drying shrinkage cracking based on the SPH method remain at the two-dimensional level. Although two-dimensional simulations can reveal the basic laws of concrete drying shrinkage cracking to a certain extent and help researchers understand the relevant mechanical processes, the actual concrete piles for offshore wind turbines are complex three-dimensional structures. Two-dimensional simulations cannot fully reflect their real stress and deformation states. Therefore, the future research focus of the SPH method in the simulation of concrete drying shrinkage cracking should be on three-dimensional problems. Achieving the expansion from two-dimensional to three-dimensional can not only more realistically simulate the drying shrinkage cracking process of concrete under actual working conditions but also more accurately evaluate the influence of various factors on the performance of concrete structures, providing a more reliable theoretical basis for the design and optimization of concrete piles for offshore wind turbines. At present, the concrete model in the two-dimensional simulation only contains 31,417 particles. However, when extended to three-dimensional scenarios, the number of particles will significantly increase, leading to a substantial reduction in computational efficiency. Therefore, it is necessary to develop parallel algorithms to optimize computational performance. The impact of the SPH smoothing length on computational accuracy is not deeply discussed in this paper, and a special follow-up article will be written to elaborate on this. Regarding the precise application of complex boundary conditions in actual engineering (such as wet–dry cycles and multi-physical field coupling effects in marine environments), the existing model uses fixed-boundary conditions for simplified processing. In the future, relevant research will be further carried out to improve the adaptability of simulations to real service environments.
In addition, the current simulations simplify the shape of concrete to a large extent, which is different from real concrete. Future research should also focus on simulating the real shape of concrete. The internal aggregates of real concrete have complex and diverse shapes, not simply circular, and there are various mineral components and micro-pore structures. These factors will have an important impact on the drying shrinkage cracking performance of concrete. By further improving the SPH method to more accurately simulate the microstructure and morphological characteristics of real concrete, such as using more complex aggregate generation algorithms to simulate the real shape of aggregates and considering the influence of micro-pore structures on water diffusion and stress distribution, the accuracy and reliability of the simulation results can be greatly improved, making them closer to the requirements of practical engineering applications.
Although the SPH method has achieved certain results in the field of concrete drying shrinkage cracking simulation, there is still much room for development. By overcoming the problems of three-dimensional simulation and real-concrete-shape simulation, the SPH method is expected to play a greater role in the research of drying shrinkage cracking of concrete piles for offshore wind turbines and other concrete structures, promoting technological progress and engineering practice development in related fields.

6. Conclusions

(1)
The meshless numerical simulation method developed based on the SPH program framework in this paper can effectively simulate the drying shrinkage cracking process of concrete piles for offshore wind turbines. By discretizing the humidity diffusion equation, defining the drying shrinkage stress term, and combining with the generation of the concrete meso-structure and the failure simulation method, the simulation analysis of drying shrinkage cracking under the influence of different factors is realized, providing a reference basis for the application of this method in related fields.
(2)
Different aggregate percentages have a significant impact on the humidity diffusion and drying shrinkage cracking of concrete. As the aggregate percentage increases, the humidity diffusion first becomes more uniform and then tends to be stable. In terms of drying shrinkage cracking, the number and length of dominant cracks first increase and then decrease. The cracking is most severe when the aggregate percentage is 30%. When the aggregate percentage reaches 40%, due to the enhanced overall strength of the concrete, the crack-resistance performance is improved, and the length of the dominant cracks decreases.
(3)
As the aggregate size increases, the humidity diffusion of concrete becomes more and more non-uniform, and the degree of drying shrinkage cracking intensifies. Small-sized aggregates make the humidity diffusion uniform, disperse the drying shrinkage stress, and result in a small number of short cracks. Large-sized aggregates interfere with water diffusion, leading to non-uniform humidity distribution and stress concentration, increasing the number and length of cracks. The impact is most significant in the particle size range of 4–40 mm, seriously damaging the structural integrity of the concrete.
(4)
As the drying shrinkage coefficient increases, the drying shrinkage strain and stress of the concrete increase, the number and length of cracks increase, and the damage to the structure intensifies. When the humidity diffusion coefficient increases, the water loss from the concrete surface accelerates, and the rate and range of humidity diffusion change significantly. The degree of drying shrinkage cracking first increases and then decreases. Under a high humidity diffusion coefficient, the concrete structure has good integrity and is less affected by drying shrinkage cracking.
(5)
The SPH method has advantages such as strong adaptability to complex boundaries and large deformations, and the ability to combine micro- and macro-perspectives in the simulation of concrete drying shrinkage cracking. However, most current simulations are two-dimensional, and there are differences from the shape of real concrete. Future research should be extended to three-dimensional simulations and improve the simulation of the shape of real concrete to more accurately evaluate the performance of concrete structures and promote the development of concrete piles for offshore wind turbines and related fields.

Author Contributions

Writing—original draft, C.H.; validation, C.H. and T.L., investigation, C.H.; data curation, J.X.; conceptualization, J.X.; methodology, T.L.; funding acquisition, H.M.; writing—reviewing and editing, H.M.; supervision, H.C. and W.Z. All authors have read and agreed to the published version of the manuscript.

Funding

This work was supported in part by the Natural Science Foundation of Guangxi Province (Grant number: 2025GXNSFHA069178).

Data Availability Statement

The data used to support the findings of this study are available from the corresponding author upon request.

Conflicts of Interest

The authors declare no conflicts of interest.

References

  1. Xu, L.; Wan, Z.; Dai, G. Full-scale field investigations and numerical analyses of grouting effect for large-diameter steel-concrete composite piles in offshore wind turbines. Appl. Ocean Res. 2025, 155, 104437. [Google Scholar] [CrossRef]
  2. Zhang, W.; Xie, X.; Shi, D.; Shao, W.; Zhang, J. Experimental insights into the mechanical properties and constitutive models of coral aggregate seawater concrete mixed with natural aggregates. J. Build. Eng. 2025, 107, 112756. [Google Scholar] [CrossRef]
  3. Shao, L.; Wang, H.; Qiao, H. Numerical simulation study of fatigue damage in high pile cap foundation for offshore wind power. Structures 2025, 74, 108627. [Google Scholar] [CrossRef]
  4. Chen, W.; Jiang, Y.; Huang, L. Nonlinear seismic performance of offshore wind turbines on hybrid pile-bucket foundation in sand: Combined earthquake and wind-wave loads. Soil Dyn. Earthq. Eng. 2024, 187, 108981. [Google Scholar] [CrossRef]
  5. Ju, S.; Chiu, C.; Huang, Y. Comparing traditional and suction piles in steel design of wind turbine structures. J. Constr. Steel Res. 2025, 224, 109169. [Google Scholar] [CrossRef]
  6. Chen, P.; Xu, L.; Zhang, W.; Lu, X. Experimental study of secondary vibration on improving the early-age shrinkage properties of concrete. Constr. Build. Mater. 2024, 435, 136762. [Google Scholar] [CrossRef]
  7. Belabbas, O.; Bouziadi, F.; Boulekbache, B.; Hamrat, M.; Haddi, A.; Amziane, S. Mechanical properties of multirecycled coarse aggregate concrete, with particular emphasis on experimental and numerical assessment of shrinkage at different curing temperatures. J. Build. Eng. 2024, 89, 109333. [Google Scholar] [CrossRef]
  8. Sun, M.; Bennett, T.; Visintin, P. Plastic and early-age shrinkage of ultra-high performance concrete (UHPC): Experimental study of the effect of water to binder ratios, silica fume dosages under controlled curing conditions. Case Stud. Constr. Mater. 2022, 16, e00948. [Google Scholar] [CrossRef]
  9. Samouh, H.; Roziere, E.; Loukili, A. The differential drying shrinkage effect on the concrete surface damage: Experimental and numerical study. Cem. Concr. Res. 2017, 102, 212–224. [Google Scholar] [CrossRef]
  10. Kim, H.; Kwak, H. A simplified but improved numerical approach to determine moisture balance for plastic shrinkage cracking in concrete. Case Stud. Constr. Mater. 2024, 21, e03780. [Google Scholar] [CrossRef]
  11. Gao, Z.; Miao, Q.; Bai, R.; Chen, C.; Sun, Q.; Guo, Z.; Jiang, T.; Zhou, L. Shrinkage and creep characteristic of recycled plastic fiber reinforced sustainable self-compacting concrete with recycled concrete aggregates. J. Build. Eng. 2025, 103, 112022. [Google Scholar] [CrossRef]
  12. Wang, Y.; Luzio, G.; Vorel, J. Coupled mesoscale analysis of concrete shrinkage. Cem. Concr. Compos. 2025, 160, 106007. [Google Scholar] [CrossRef]
  13. Xu, W.; Zhou, Y.; Guo, Y. Mesoscopic representation of conventional concrete and rock-filled concrete: A novel FEM-SBFEM coupled approach. Comput. Geotech. 2025, 177, 106820. [Google Scholar] [CrossRef]
  14. Zhang, M.; Li, W.; Li, M. Mesoscopic simulation of concrete drying shrinkage with hydration kinetics. Int. J. Mech. Sci. 2024, 283, 109716. [Google Scholar] [CrossRef]
  15. Zhu, X.; Lei, P.; Chen, X. Influence of steam curing on cyclic triaxial characteristics of recycled aggregate concrete: Experimental analysis and DEM simulation. Eng. Fract. Mech. 2024, 312, 110643. [Google Scholar] [CrossRef]
  16. Zhao, H.; Zhou, A.; Zhang, L. A novel three-dimensional DEM model for recycled aggregate concrete considering material heterogeneity and microcrack evolution. Compos. Struct. 2025, 352, 118677. [Google Scholar] [CrossRef]
  17. Jin, Y.; Li, L.; Jia, Y. Numerical study of shrinkage and heating induced cracking in concrete materials and influence of inclusion stiffness with Peridynamics method. Comput. Geotech. 2021, 133, 103998. [Google Scholar] [CrossRef]
  18. Wang, S.; Zhang, X.; Li, K. Thermo-mechanical coupled peridynamics simulation of concrete failure under fire scenarios. Eng. Fract. Mech. 2024, 301, 110031. [Google Scholar] [CrossRef]
  19. Yaghoobi, A.; Chorzepa, M. Fracture analysis of fiber reinforced concrete structures in the micropolar peridynamic analysis framework. Eng. Fract. Mech. 2017, 169, 238–250. [Google Scholar] [CrossRef]
  20. Xu, Y.; Wang, Y.; Zhou, L. An improved numerical manifold method for crack propagation of concrete gravity dams under seismic loads. Comput. Geotech. 2024, 165, 105927. [Google Scholar] [CrossRef]
  21. Feng, C.; Kong, L.; Wang, Y. Numerical simulation of cohesive bed impinging by submerged pulsed and continuous waterjet based on SPH algorithm. Ocean Eng. 2024, 314, 119720. [Google Scholar] [CrossRef]
  22. Chen, C.; Sun, Y. Numerical simulation of melt flow and heat transfer in casting filling process based on SPH. Comput. Fluids 2024, 280, 106351. [Google Scholar] [CrossRef]
  23. Cui, J.; Yao, Q.; Chen, X. Numerical simulation of wedges slamming non-Newtonian fluids based on SPH method. Ocean Eng. 2024, 301, 117575. [Google Scholar] [CrossRef]
  24. Liu, W.; Duan, Z.; Liu, Y. Numerical simulation of the damage and ignition responses of high explosives under low-velocity impact using the SPH method. Eng. Anal. Bound. Elem. 2024, 166, 105830. [Google Scholar] [CrossRef]
  25. Ceri, S.; Khodaei, Z. Numerical investigation of hypervelocity impact simulation with FEM/SPH formulation for space structures. Int. J. Impact Eng. 2024, 187, 104926. [Google Scholar] [CrossRef]
  26. Zhang, Y.; Li, J.; Xu, Y. Numerical simulation of dike failure using a GPU-based coupled DEM–SPH model. Comput. Fluids 2023, 267, 106090. [Google Scholar] [CrossRef]
  27. Bu, S.; Li, D.; Chen, S. Numerical simulation of landslide-generated waves using a SPH-DEM coupling model. Ocean Eng. 2022, 258, 111826. [Google Scholar] [CrossRef]
  28. Zhang, G.; Chen, J.; Qi, Y. Numerical simulation of landslide generated impulse waves using a δ+-LES-SPH model. Adv. Water Resour. 2021, 151, 103890. [Google Scholar] [CrossRef]
  29. Vacondio, R.; Mignosa, P.; Pagani, S. 3D SPH numerical simulation of the wave generated by the Vajont rockslide. Adv. Water Resour. 2013, 59, 146–156. [Google Scholar] [CrossRef]
  30. Sun, P.; Ming, F.; Zhang, A. Numerical simulation of interactions between free surface and rigid body using a robust SPH method. Ocean Eng. 2015, 98, 32–49. [Google Scholar] [CrossRef]
  31. Zhang, A.; Yang, W.; Huang, C. Numerical simulation of column charge underwater explosion based on SPH and BEM combination. Comput. Fluids 2013, 71, 169–178. [Google Scholar] [CrossRef]
  32. Yu, S.; Ren, X.; Zhang, J.; Sun, Z. Numerical simulation on the excavation damage of Jinping deep tunnels based on the SPH method. Geomech. Geophys. Geo-Energy Geo-Resour. 2023, 9, 1. [Google Scholar] [CrossRef]
  33. Yu, S.; Sun, Z.; Yu, J.; Yang, J. An improved meshless method for modeling the mesoscale cracking processes of concrete containing random aggregates and initial defects. Constr. Build. Mater. 2023, 363, 129770. [Google Scholar] [CrossRef]
  34. Yu, S.; Ren, X.; Zhang, J. Simulating the chemical-mechanical-damage coupling problems of cement-based materials using an improved smoothed particle hydrodynamics method. Case Stud. Constr. Mater. 2023, 18, e2018. [Google Scholar] [CrossRef]
  35. Yu, S.; Ren, X.; Zhang, J. Using an improved SPH algorithm to simulate thermo-hydro-mechanical-damage coupling problems in rock masses. Case Stud. Therm. Eng. 2023, 47, 103085. [Google Scholar] [CrossRef]
  36. Yu, S.; Zhou, Y.; Yang, J. Hydraulic fracturing modelling of glutenite formations using an improved form of SPH method. Geoenergy Sci. Eng. 2023, 277, 211842. [Google Scholar] [CrossRef]
  37. Hu, S.; Huang, S.; Yu, S.; Li, Y.; Dong, J. Investigations on the fracture mechanisms of Z-shaped fissured rock-like specimens. Theor. Appl. Fract. Mech. 2024, 134, 104748. [Google Scholar] [CrossRef]
  38. Hu, X.; Yu, S.; Ying, P. Effects of fissure locations on the crack propagation morphologies of 3D printing tunnel models: Experiments and numerical simulations. Theor. Appl. Fract. Mech. 2024, 133, 104631. [Google Scholar] [CrossRef]
  39. Hu, X.; Yu, S.; Gao, Y. Experimental and meshless numerical simulation on the crack propagation processes of marble SCB specimens. Eng. Fract. Mech. 2024, 308, 110354. [Google Scholar] [CrossRef]
  40. Xiang, Z.; Yu, S.; Wang, X. Modeling the Hydraulic Fracturing Processes in Shale Formations Using a Meshless Method. Water 2024, 16, 1855. [Google Scholar] [CrossRef]
  41. Bi, J. The Fracture Mechanisms of Rock Mass Under Stress, Seepage, Temperature and Damage Coupling Condition and Numerical Simulations by Using the General Particle Dynamics (GPD) Algorithm. Ph.D. Thesis, Chongqing University, Chongqing, China, 2016. [Google Scholar]
  42. Bolander, J.; Berton, S. Simulation of shrinkage induced cracking in cement composite overlays. Cem. Concr. Compos. 2004, 26, 861–871. [Google Scholar] [CrossRef]
  43. Chen, D.; Mahadevan, S. Cracking analysis of plain concrete under coupled heat transfer and moisture transport processes. J. Struct. Eng. 2007, 133, 400–410. [Google Scholar] [CrossRef]
  44. Granger, L.; Torrenti, J.; Acker, P. Thoughts about drying shrinkage: Experimental results and quantification of structural drying creep. Mater. Struct. 1997, 30, 588–598. [Google Scholar] [CrossRef]
Figure 1. Dry shrinkage cracking of concrete.
Buildings 15 02006 g001
Figure 2. Model size and particle divisions. (a) Model size; (b) particle divisions.
Buildings 15 02006 g002
Figure 3. Humidity diffusion process under different aggregate percentage schemes. (a) Pa = 10%; (b) Pa = 20%; (c) Pa = 30%; (d) Pa = 40%.
Buildings 15 02006 g003
Figure 4. Humidity diffusion process under different aggregate particle size schemes. (a) 1 mm ≤ d ≤ 10 mm; (b) 2 mm ≤ d ≤ 20 mm; (c) 3 mm ≤ d ≤ 30 mm; (d) 4 mm ≤ d ≤ 40 mm.
Buildings 15 02006 g004aBuildings 15 02006 g004b
Figure 5. Humidity diffusion process under different dry shrinkage coefficients. (a) α = 0.0001; (b) α = 0.0002; (c) α = 0.0003; (d) α = 0.0004.
Buildings 15 02006 g005aBuildings 15 02006 g005b
Figure 6. Humidity diffusion process under different humidity diffusion coefficients. (a) Dh = 2 × 10⁻¹⁰ m/s; (b) Dh = 4 × 10⁻¹⁰ m/s; (c) Dh = 6 × 10⁻¹⁰ m/s; (d) Dh = 8 × 10⁻¹⁰ m/s.
Buildings 15 02006 g006
Figure 7. Concrete dry shrinkage cracking process under different aggregate percentages. (a) Pa = 10%; (b) Pa = 20%; (c) Pa = 30%; (d) Pa = 40%.
Buildings 15 02006 g007aBuildings 15 02006 g007b
Figure 8. Concrete dry shrinkage cracking process under different aggregate particle size schemes. (a) 1 mm ≤ d ≤ 10 mm; (b) 2 mm ≤ d ≤ 20 mm; (c) 3 mm ≤ d ≤ 30 mm; (d) 4 mm ≤ d ≤ 40 mm.
Buildings 15 02006 g008
Figure 9. Concrete dry shrinkage cracking process under different dry shrinkage coefficients. (a) α = 0.0001; (b) α = 0.0002; (c) α = 0.0003; (d) α = 0.0004.
Buildings 15 02006 g009
Figure 10. Concrete dry shrinkage cracking process under different humidity diffusion coefficients. (a) Dh = 2 × 10⁻¹⁰ m/s; (b) Dh = 4 × 10⁻¹⁰ m/s; (c) Dh = 6 × 10⁻¹⁰ m/s; (d) Dh = 8 × 10⁻¹⁰ m/s.
Buildings 15 02006 g010aBuildings 15 02006 g010b
Figure 11. Comparisons between the numerical results and previous experimental results [34]. (a) Numerical simulation results in this study; (b) previous experimental results [34].
Buildings 15 02006 g011
Table 1. Identification of scientific deficiencies.
Research FieldExisting Research MethodsLimitations
Mechanism of Concrete Dry Shrinkage CrackingExperimental research1 Requires complex equipment and large amounts of materials, with high costs;
2 Difficulty in simulating marine environments with long cycles;
3 Precise control of multi-factor coupling is challenging.
Theoretical research1 Simplifies microstructures and physicochemical processes, leading to errors;
2 Narrow applicability of models, difficult to generalize.
Numerical simulation (FEM/DEM, etc.)1 FEM meshes are prone to distortion, struggling with large deformations;
2 DEM has high computational costs, making it inefficient for macro-scale simulations.
Table 2. Calculation schemes.
Numerical SchemesDetailsNumerical SchemesDetails
A1Pa = 10%C1α = 0.0001
A2Pa = 20%C2α = 0.0002
A3Pa = 30%C3α = 0.0003
A4Pa = 40%C4α = 0.0004
B11 mm ≤ d ≤ 10 mmD1Dh = 2 × 10⁻¹⁰ m/s
B22 mm ≤ d ≤ 20 mmD2Dh = 4 × 10⁻¹⁰ m/s
B33 mm ≤ d ≤ 30 mmD3Dh = 6 × 10⁻¹⁰ m/s
B44 mm ≤ d ≤ 40 mmD4Dh = 8 × 10⁻¹⁰ m/s
Disclaimer/Publisher’s Note: The statements, opinions and data contained in all publications are solely those of the individual author(s) and contributor(s) and not of MDPI and/or the editor(s). MDPI and/or the editor(s) disclaim responsibility for any injury to people or property resulting from any ideas, methods, instructions or products referred to in the content.

