
Fatigue Design Research on Notch–Stud Connectors of Timber–Concrete Composite Structures

Abstract
1. Introduction
2. Experimental Study
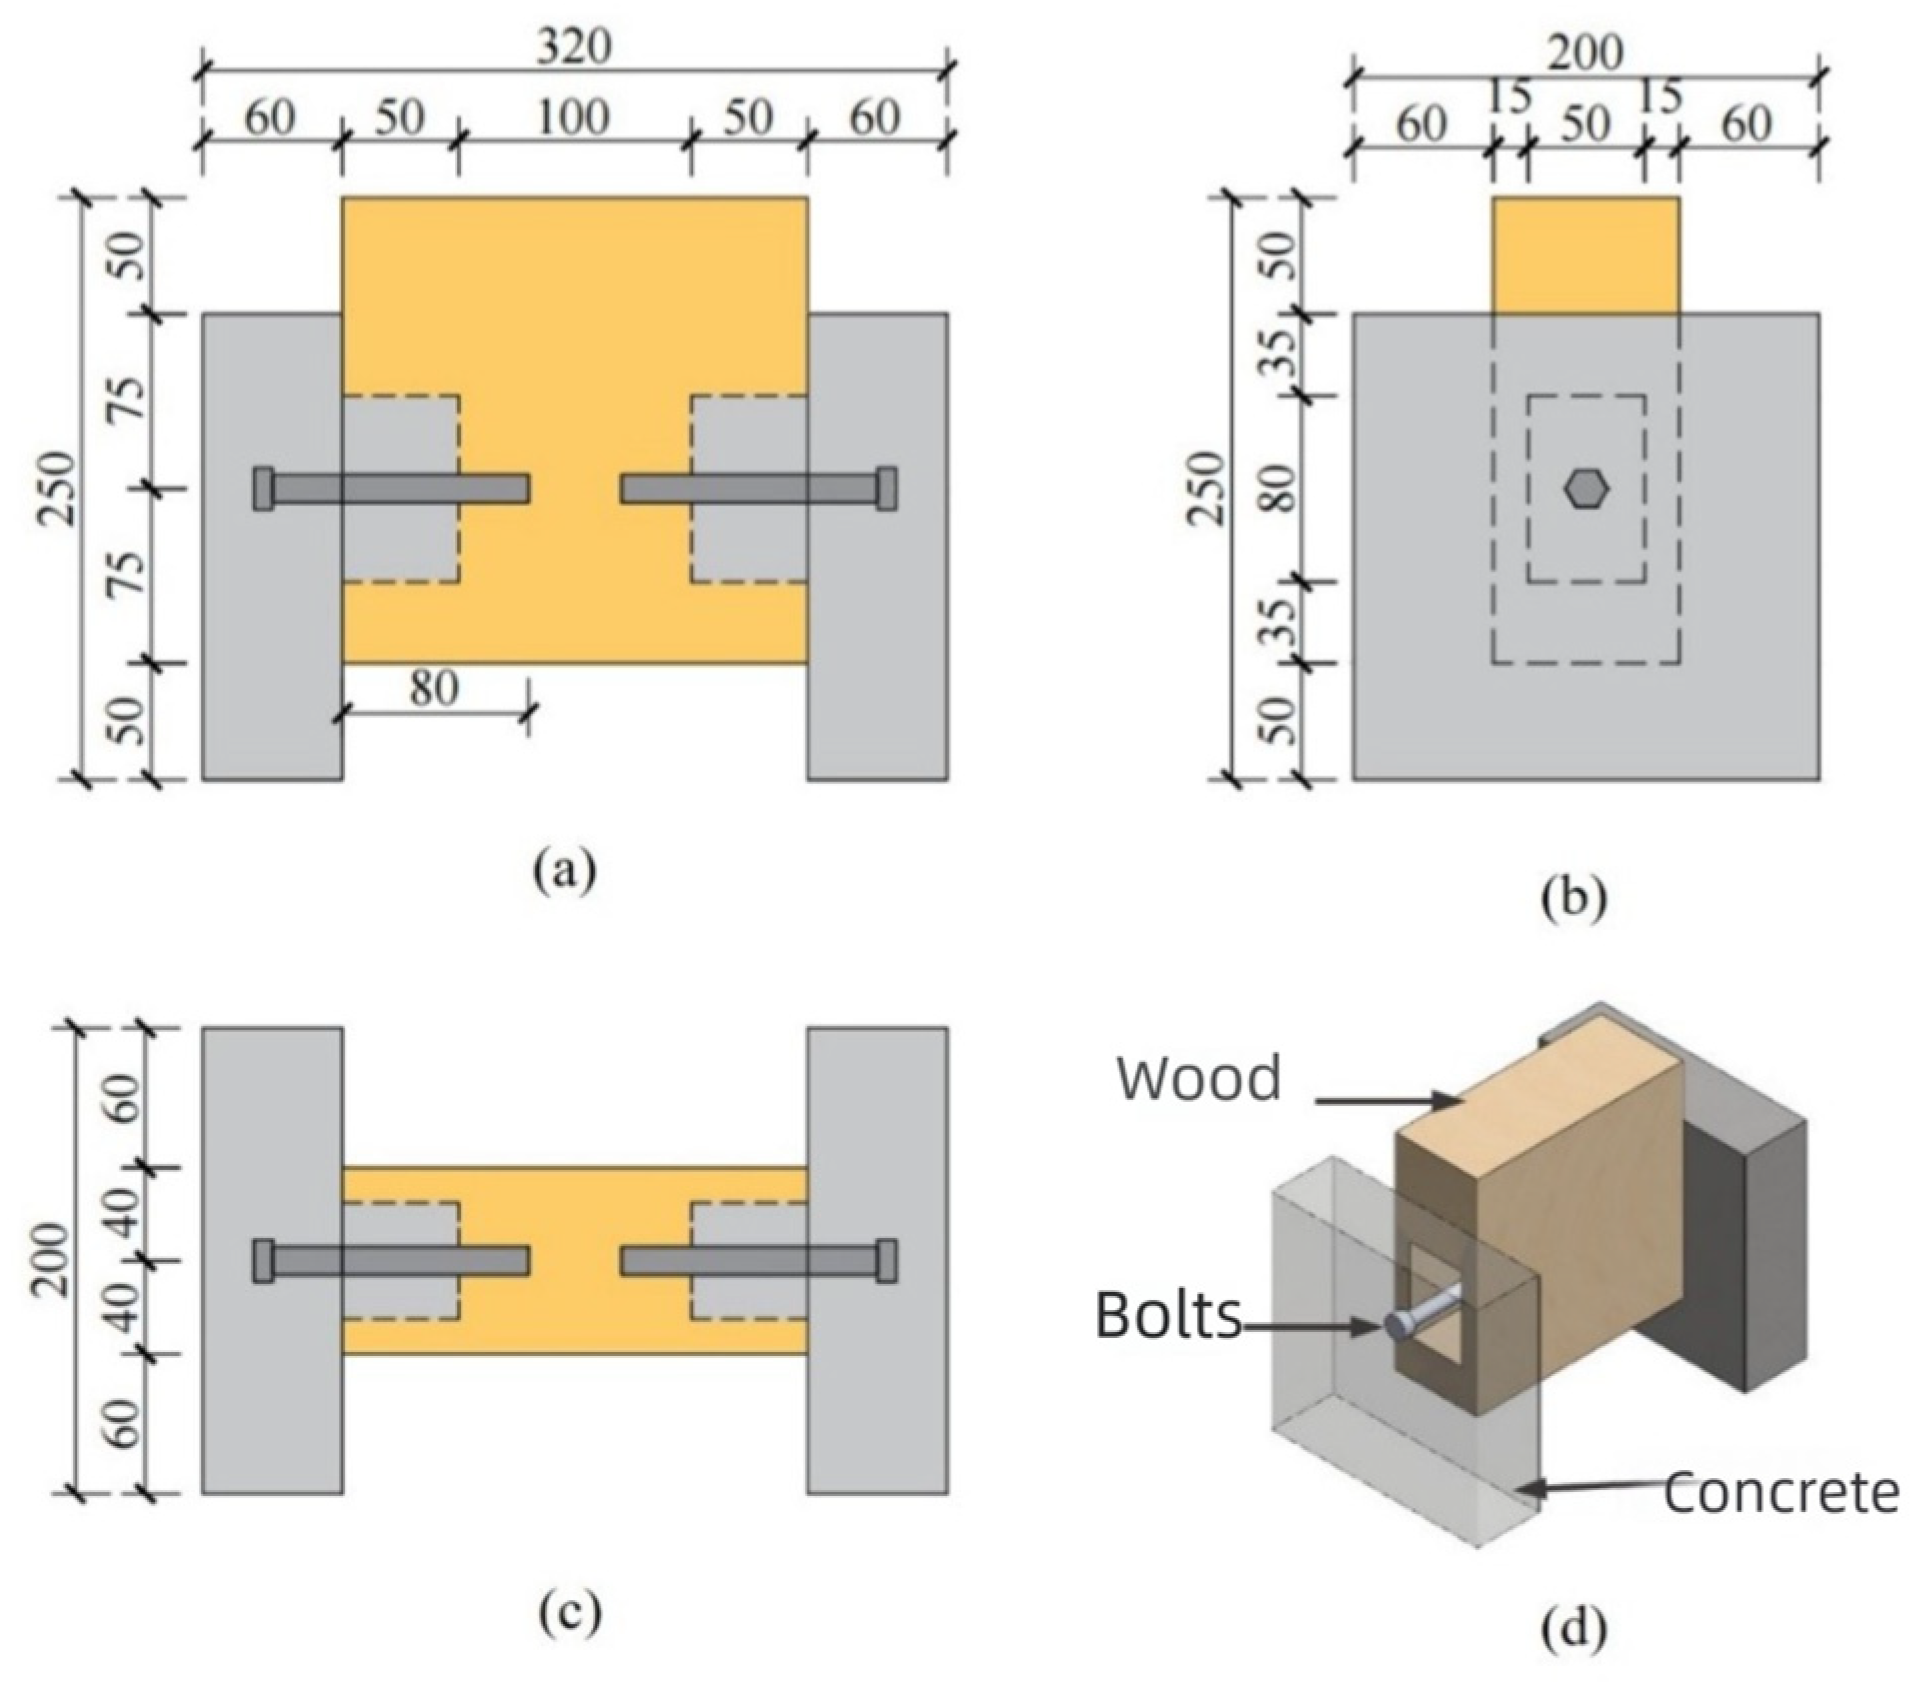
2.1. Specimen Design and Fabrication
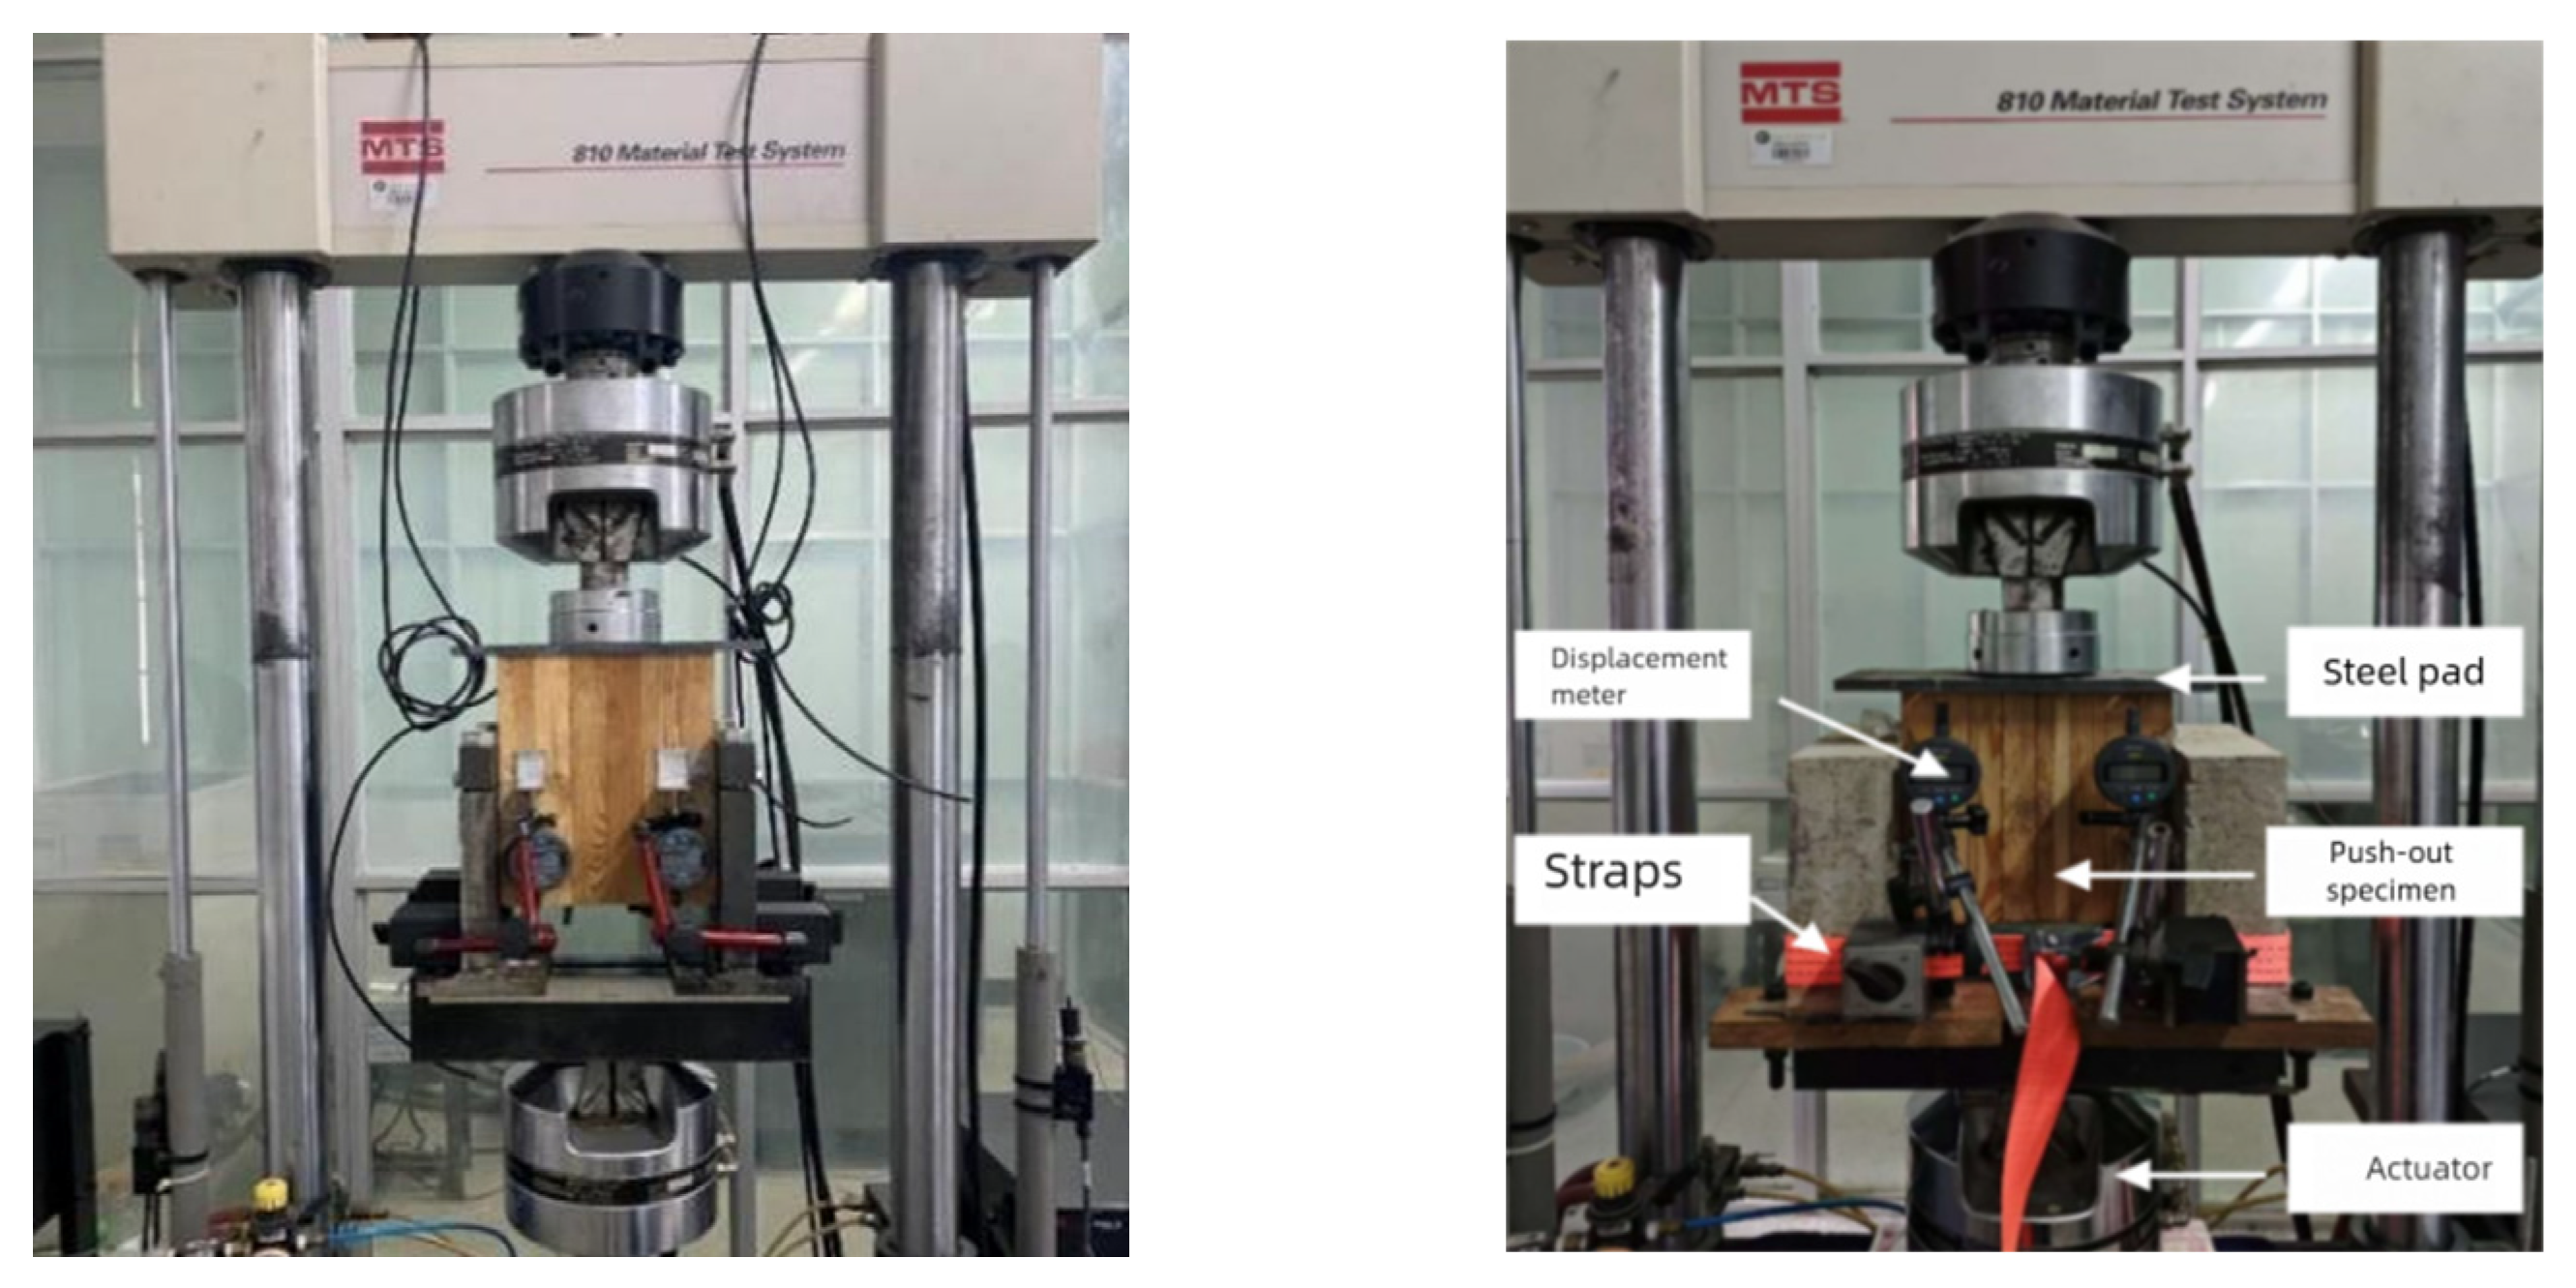
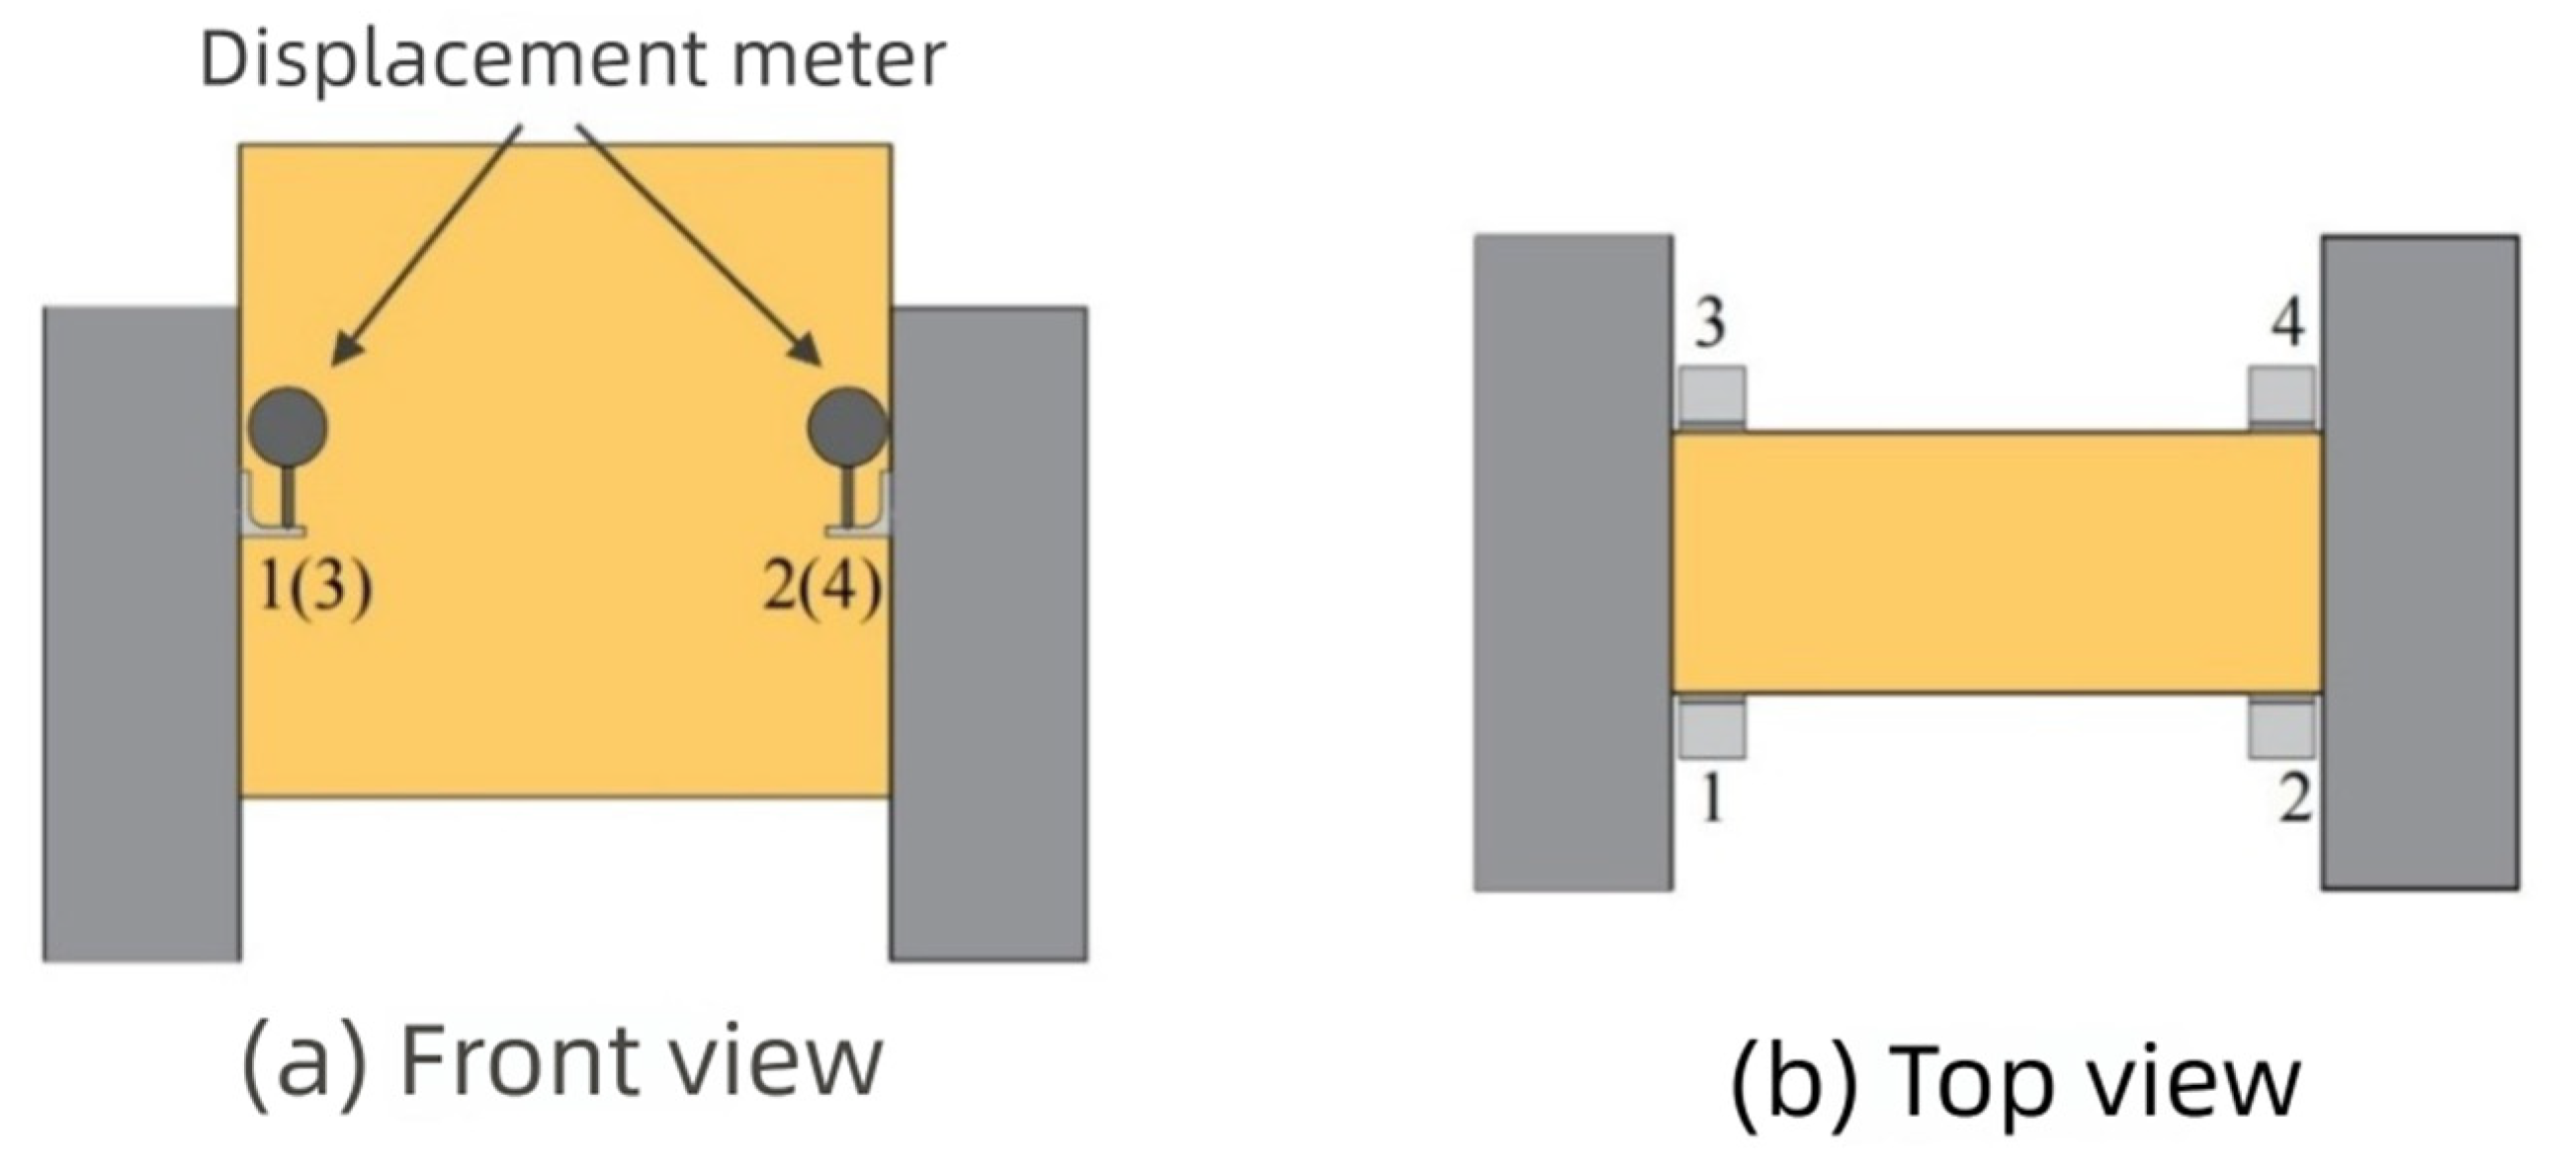
2.2. Loading Protocol and Test Configuration
- (1)
- Static Loading Failure Test
- (2)
- Complete Fatigue Failure Test
- (3)
- Incomplete Fatigue Failure Test
3. Experimental Results and Analysis
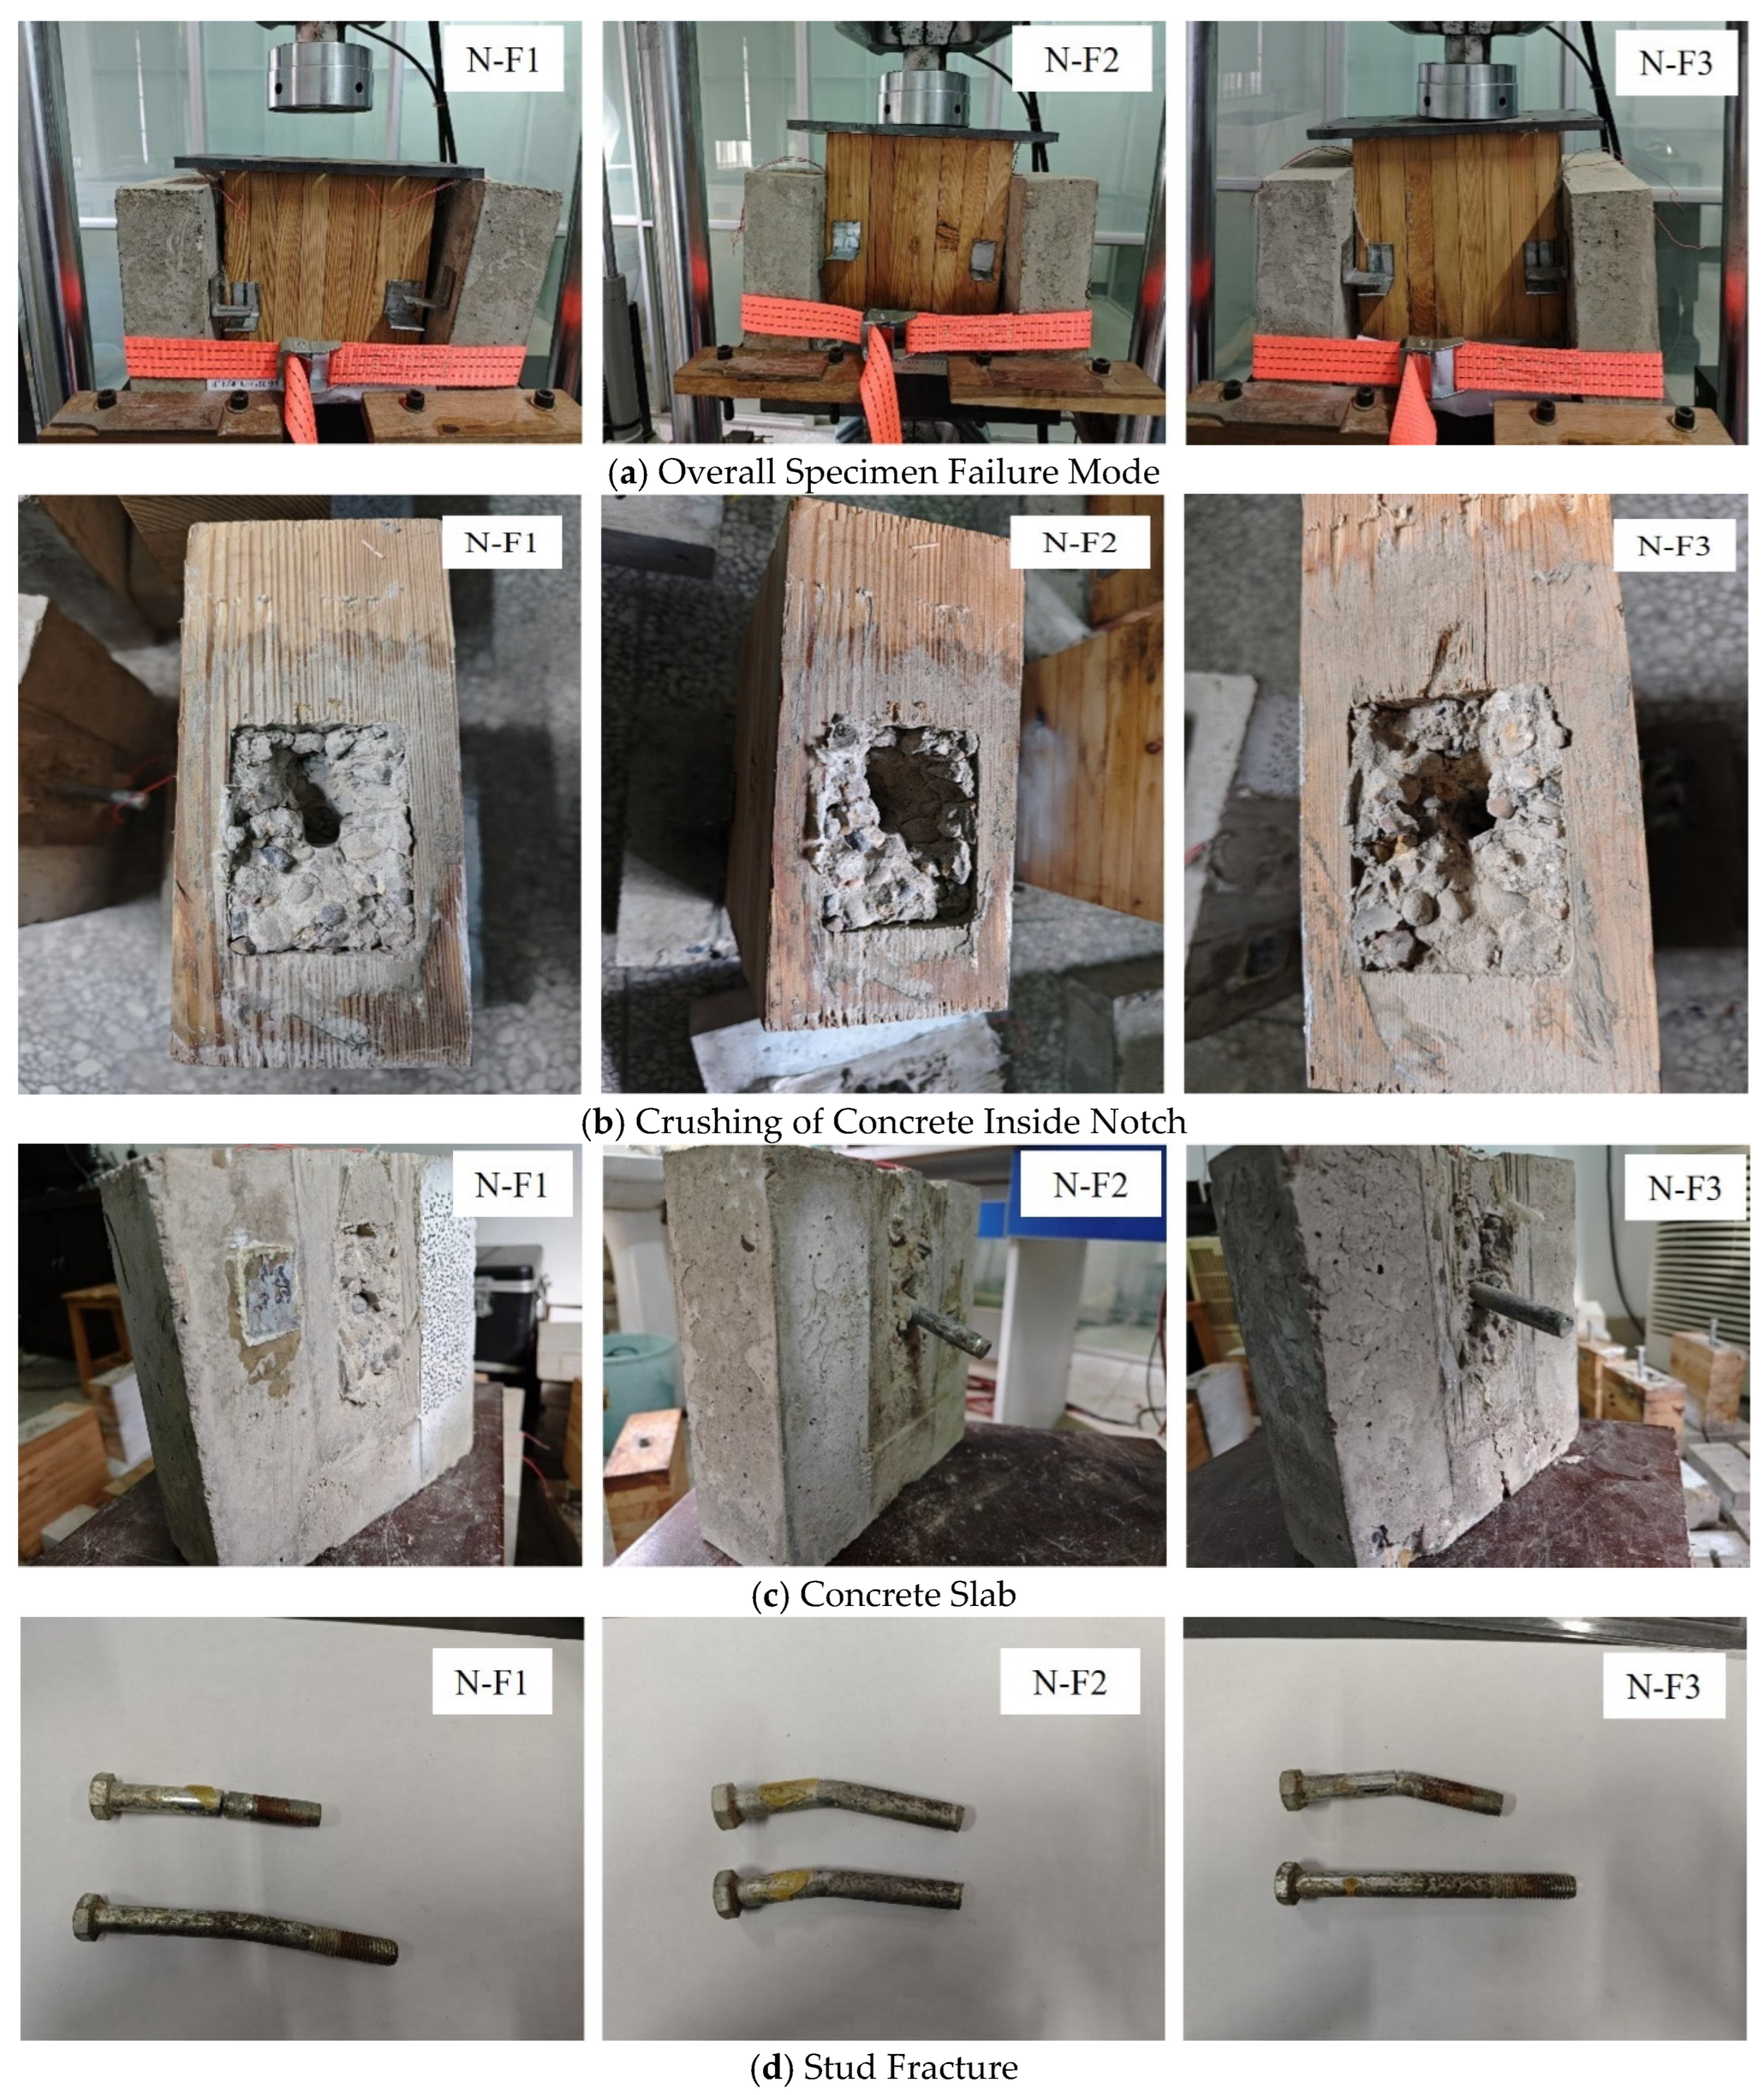
3.1. Failure Modes
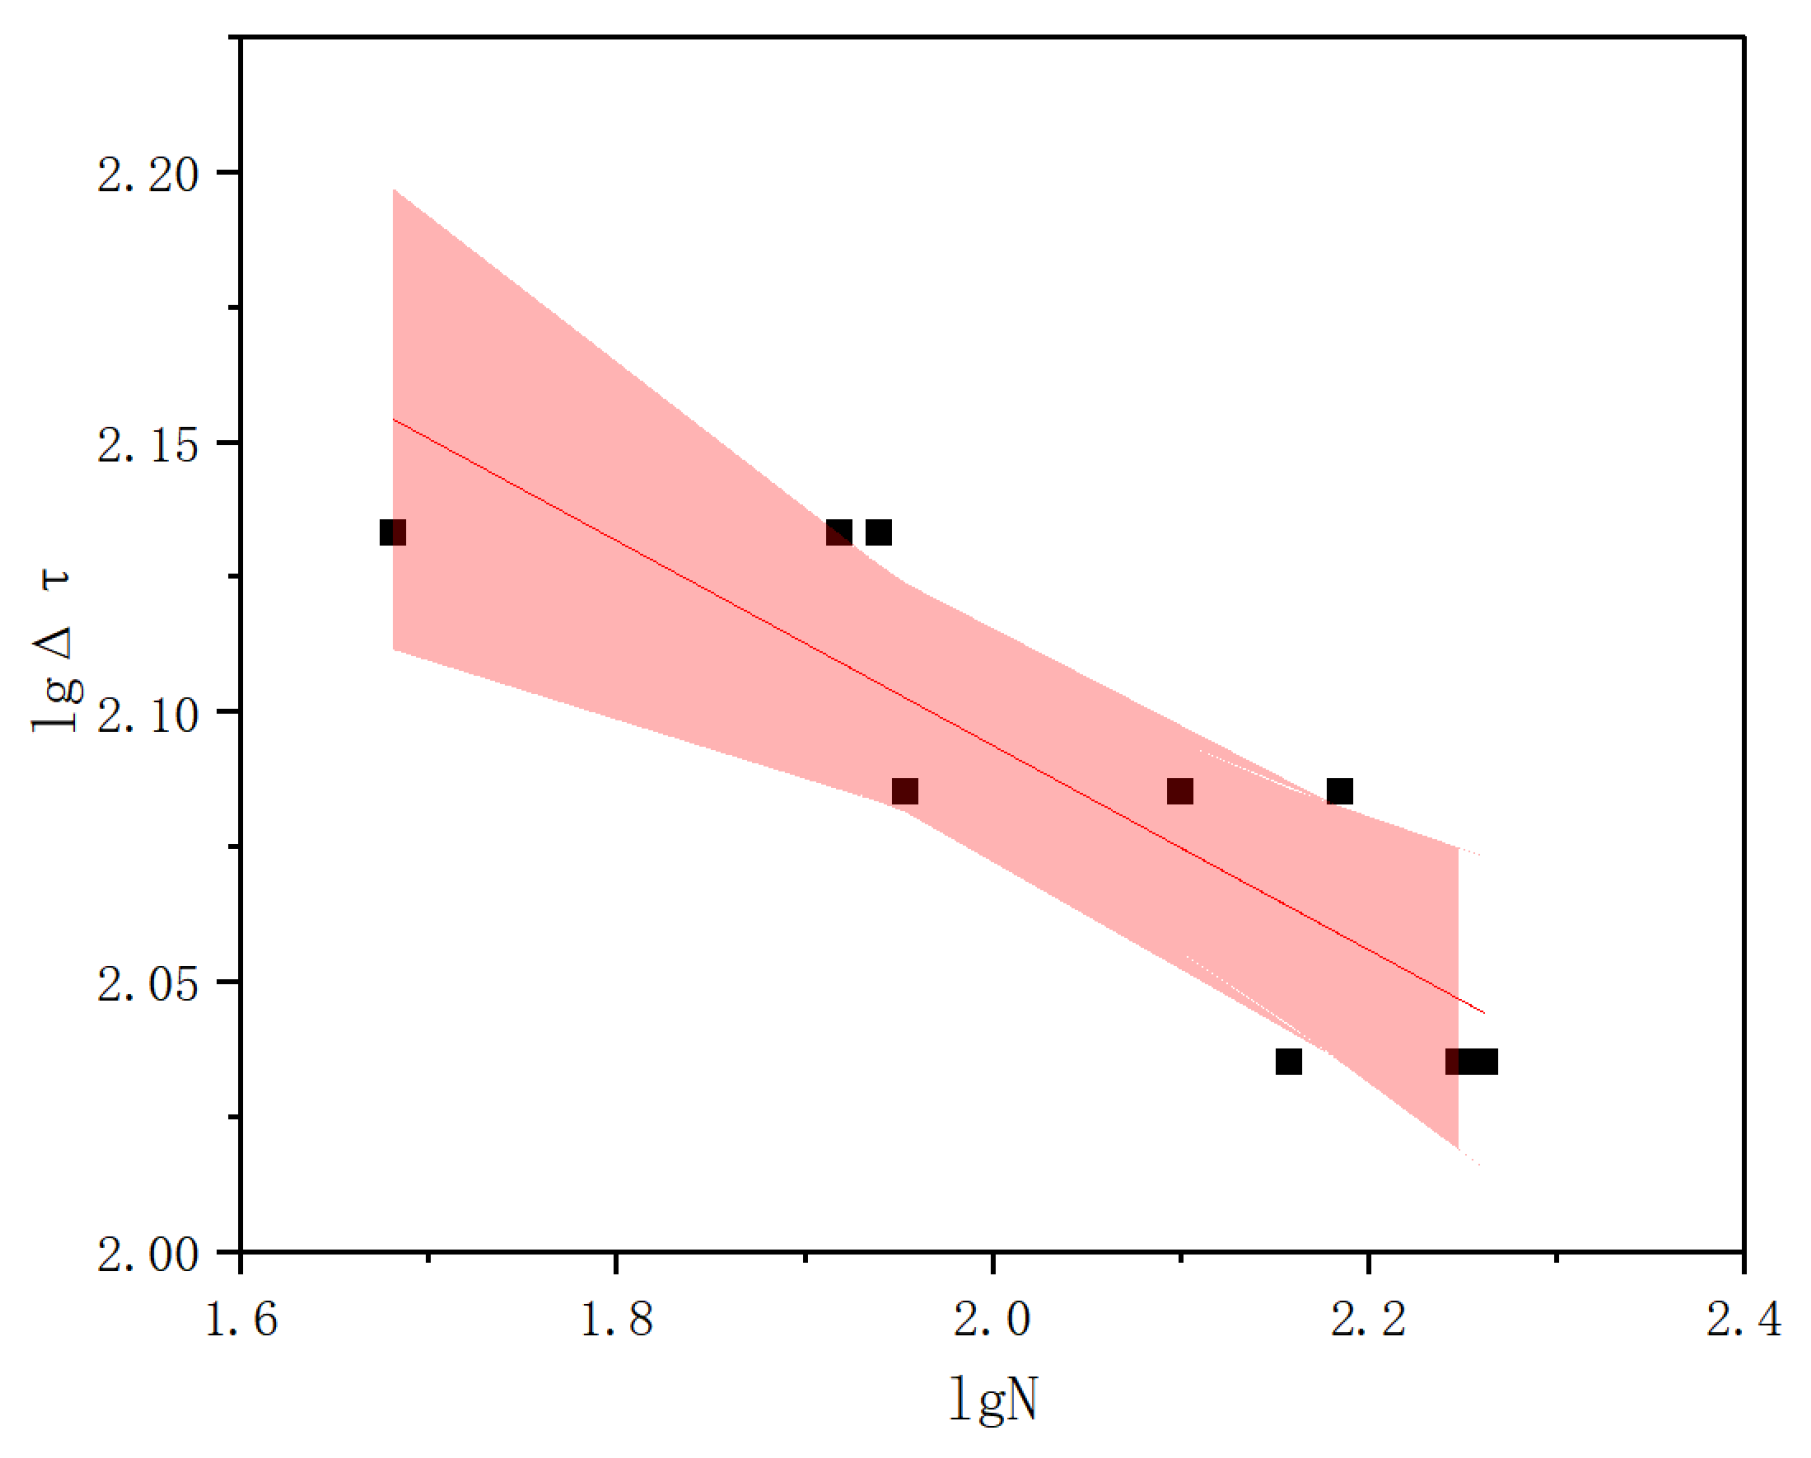
3.2. S-N Curve
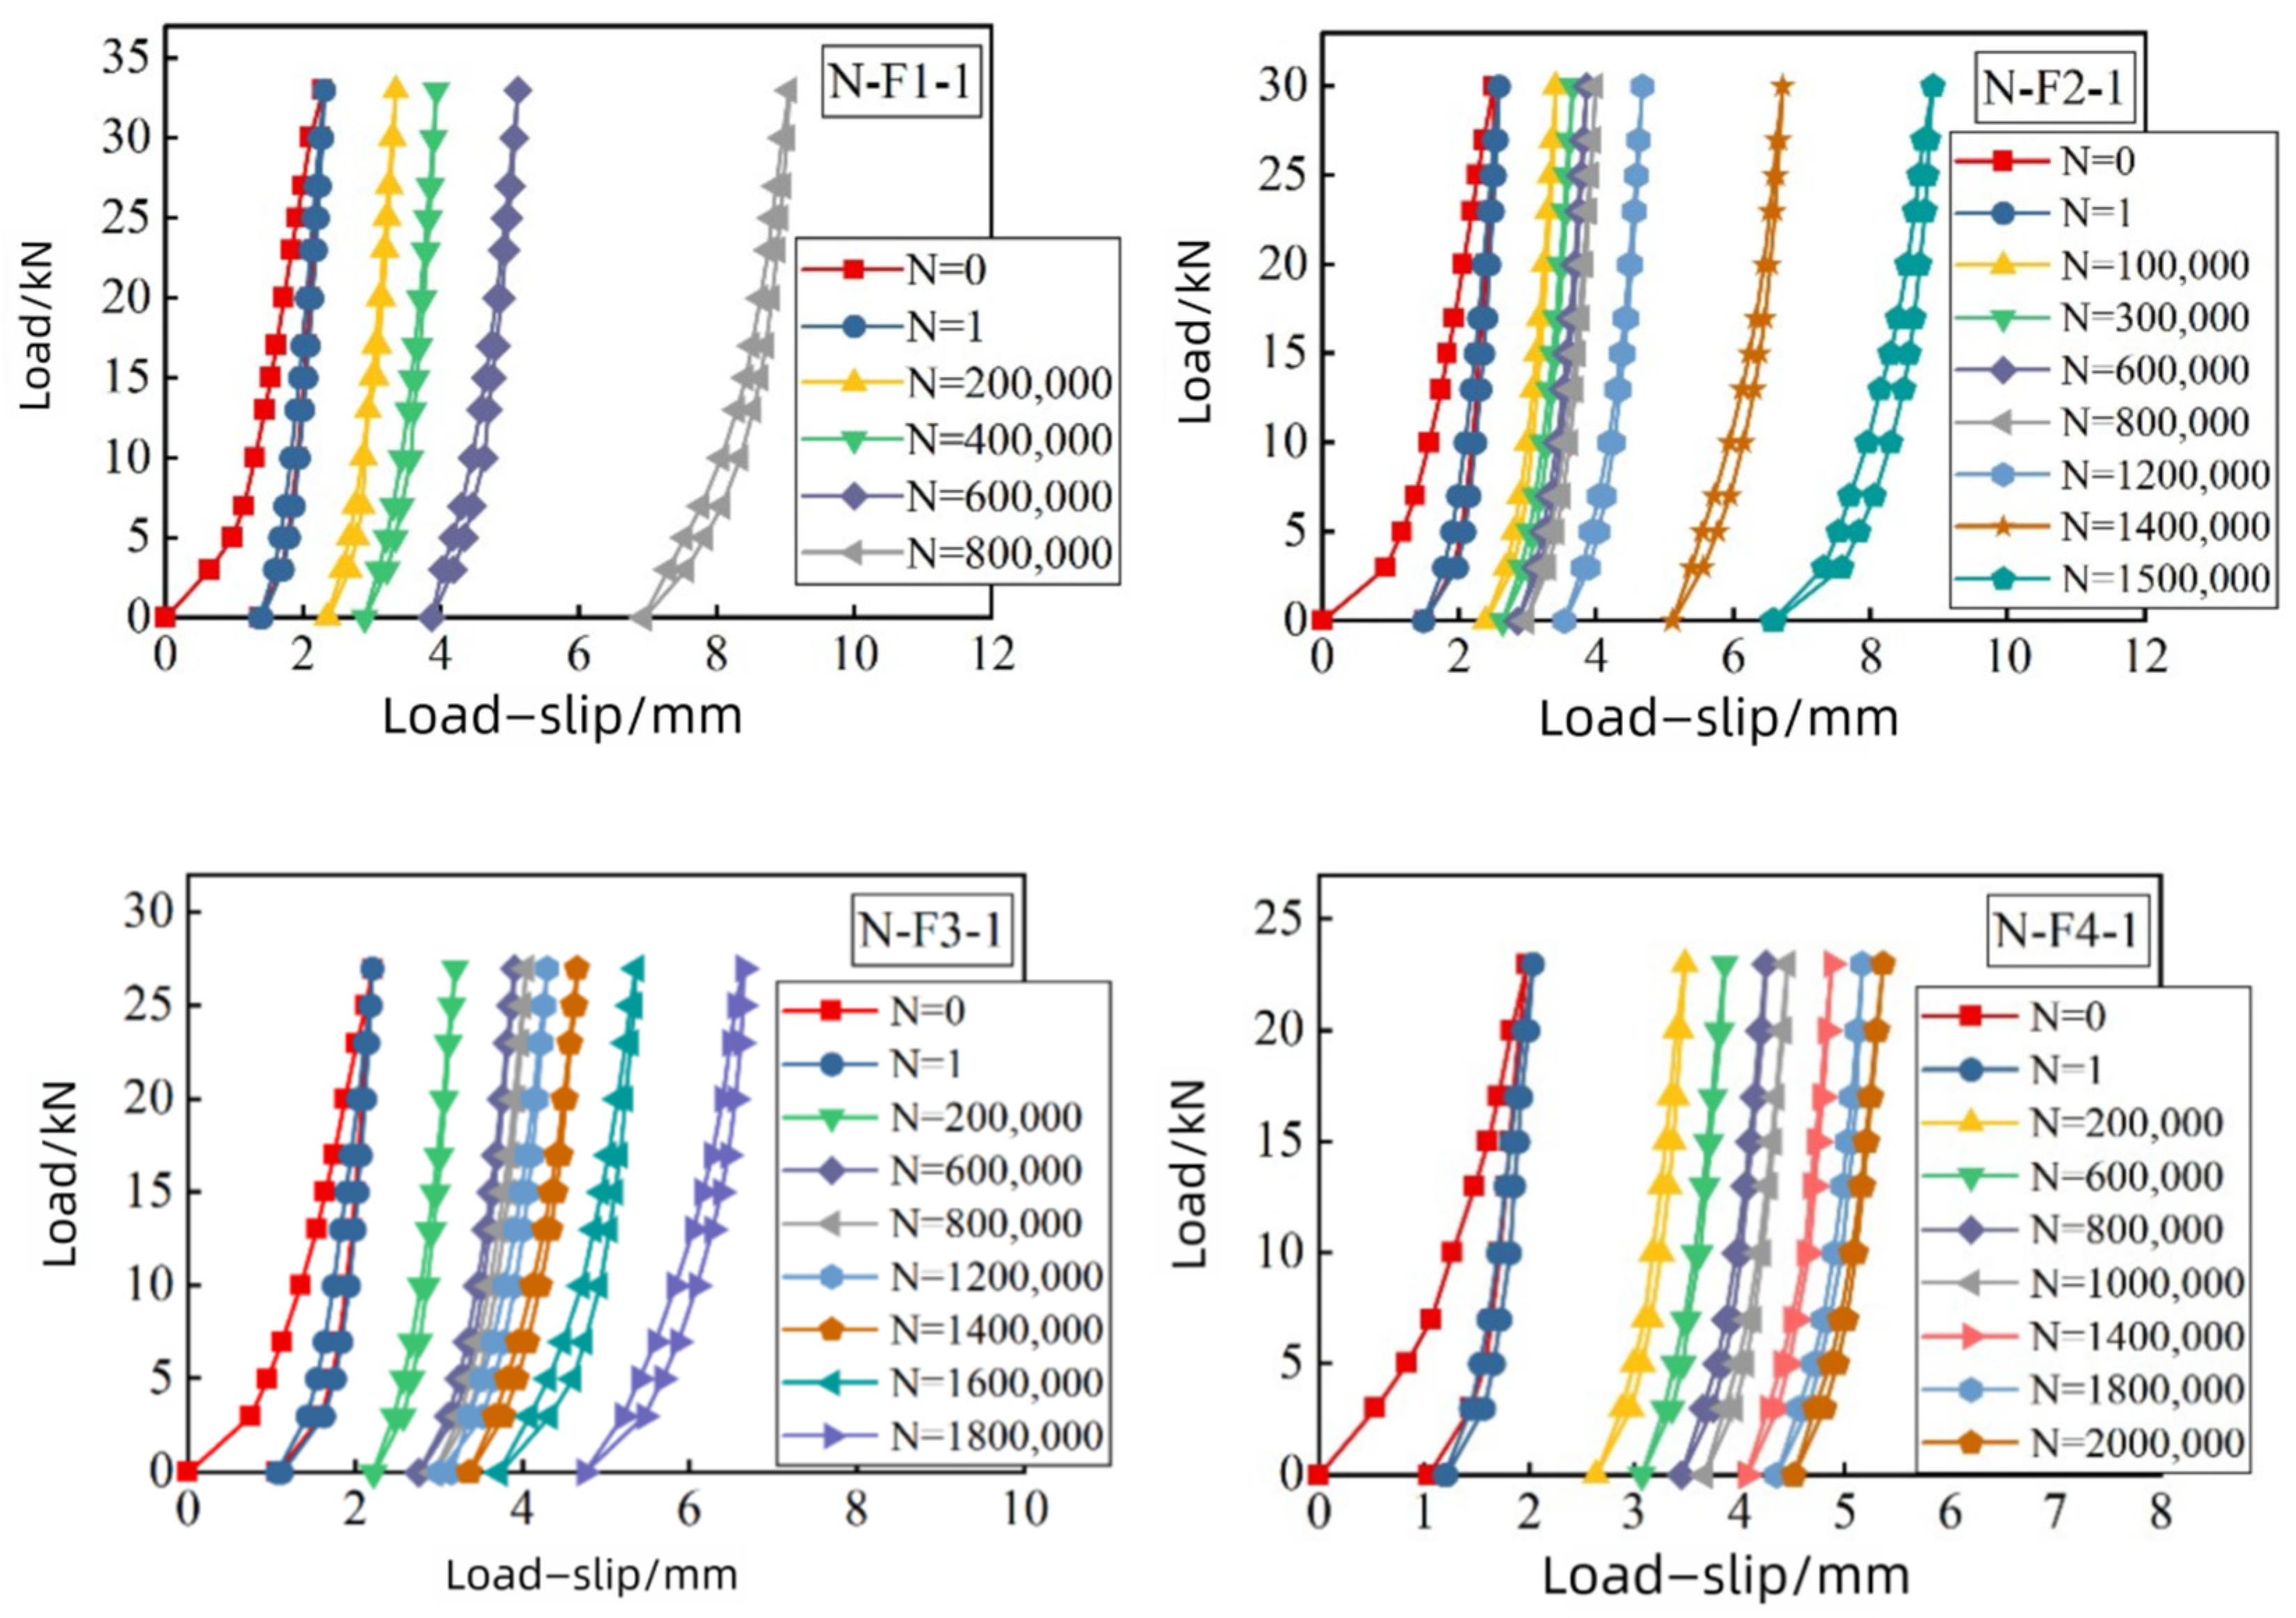
3.3. Analysis of Slip Magnitude and Stiffness Degradation
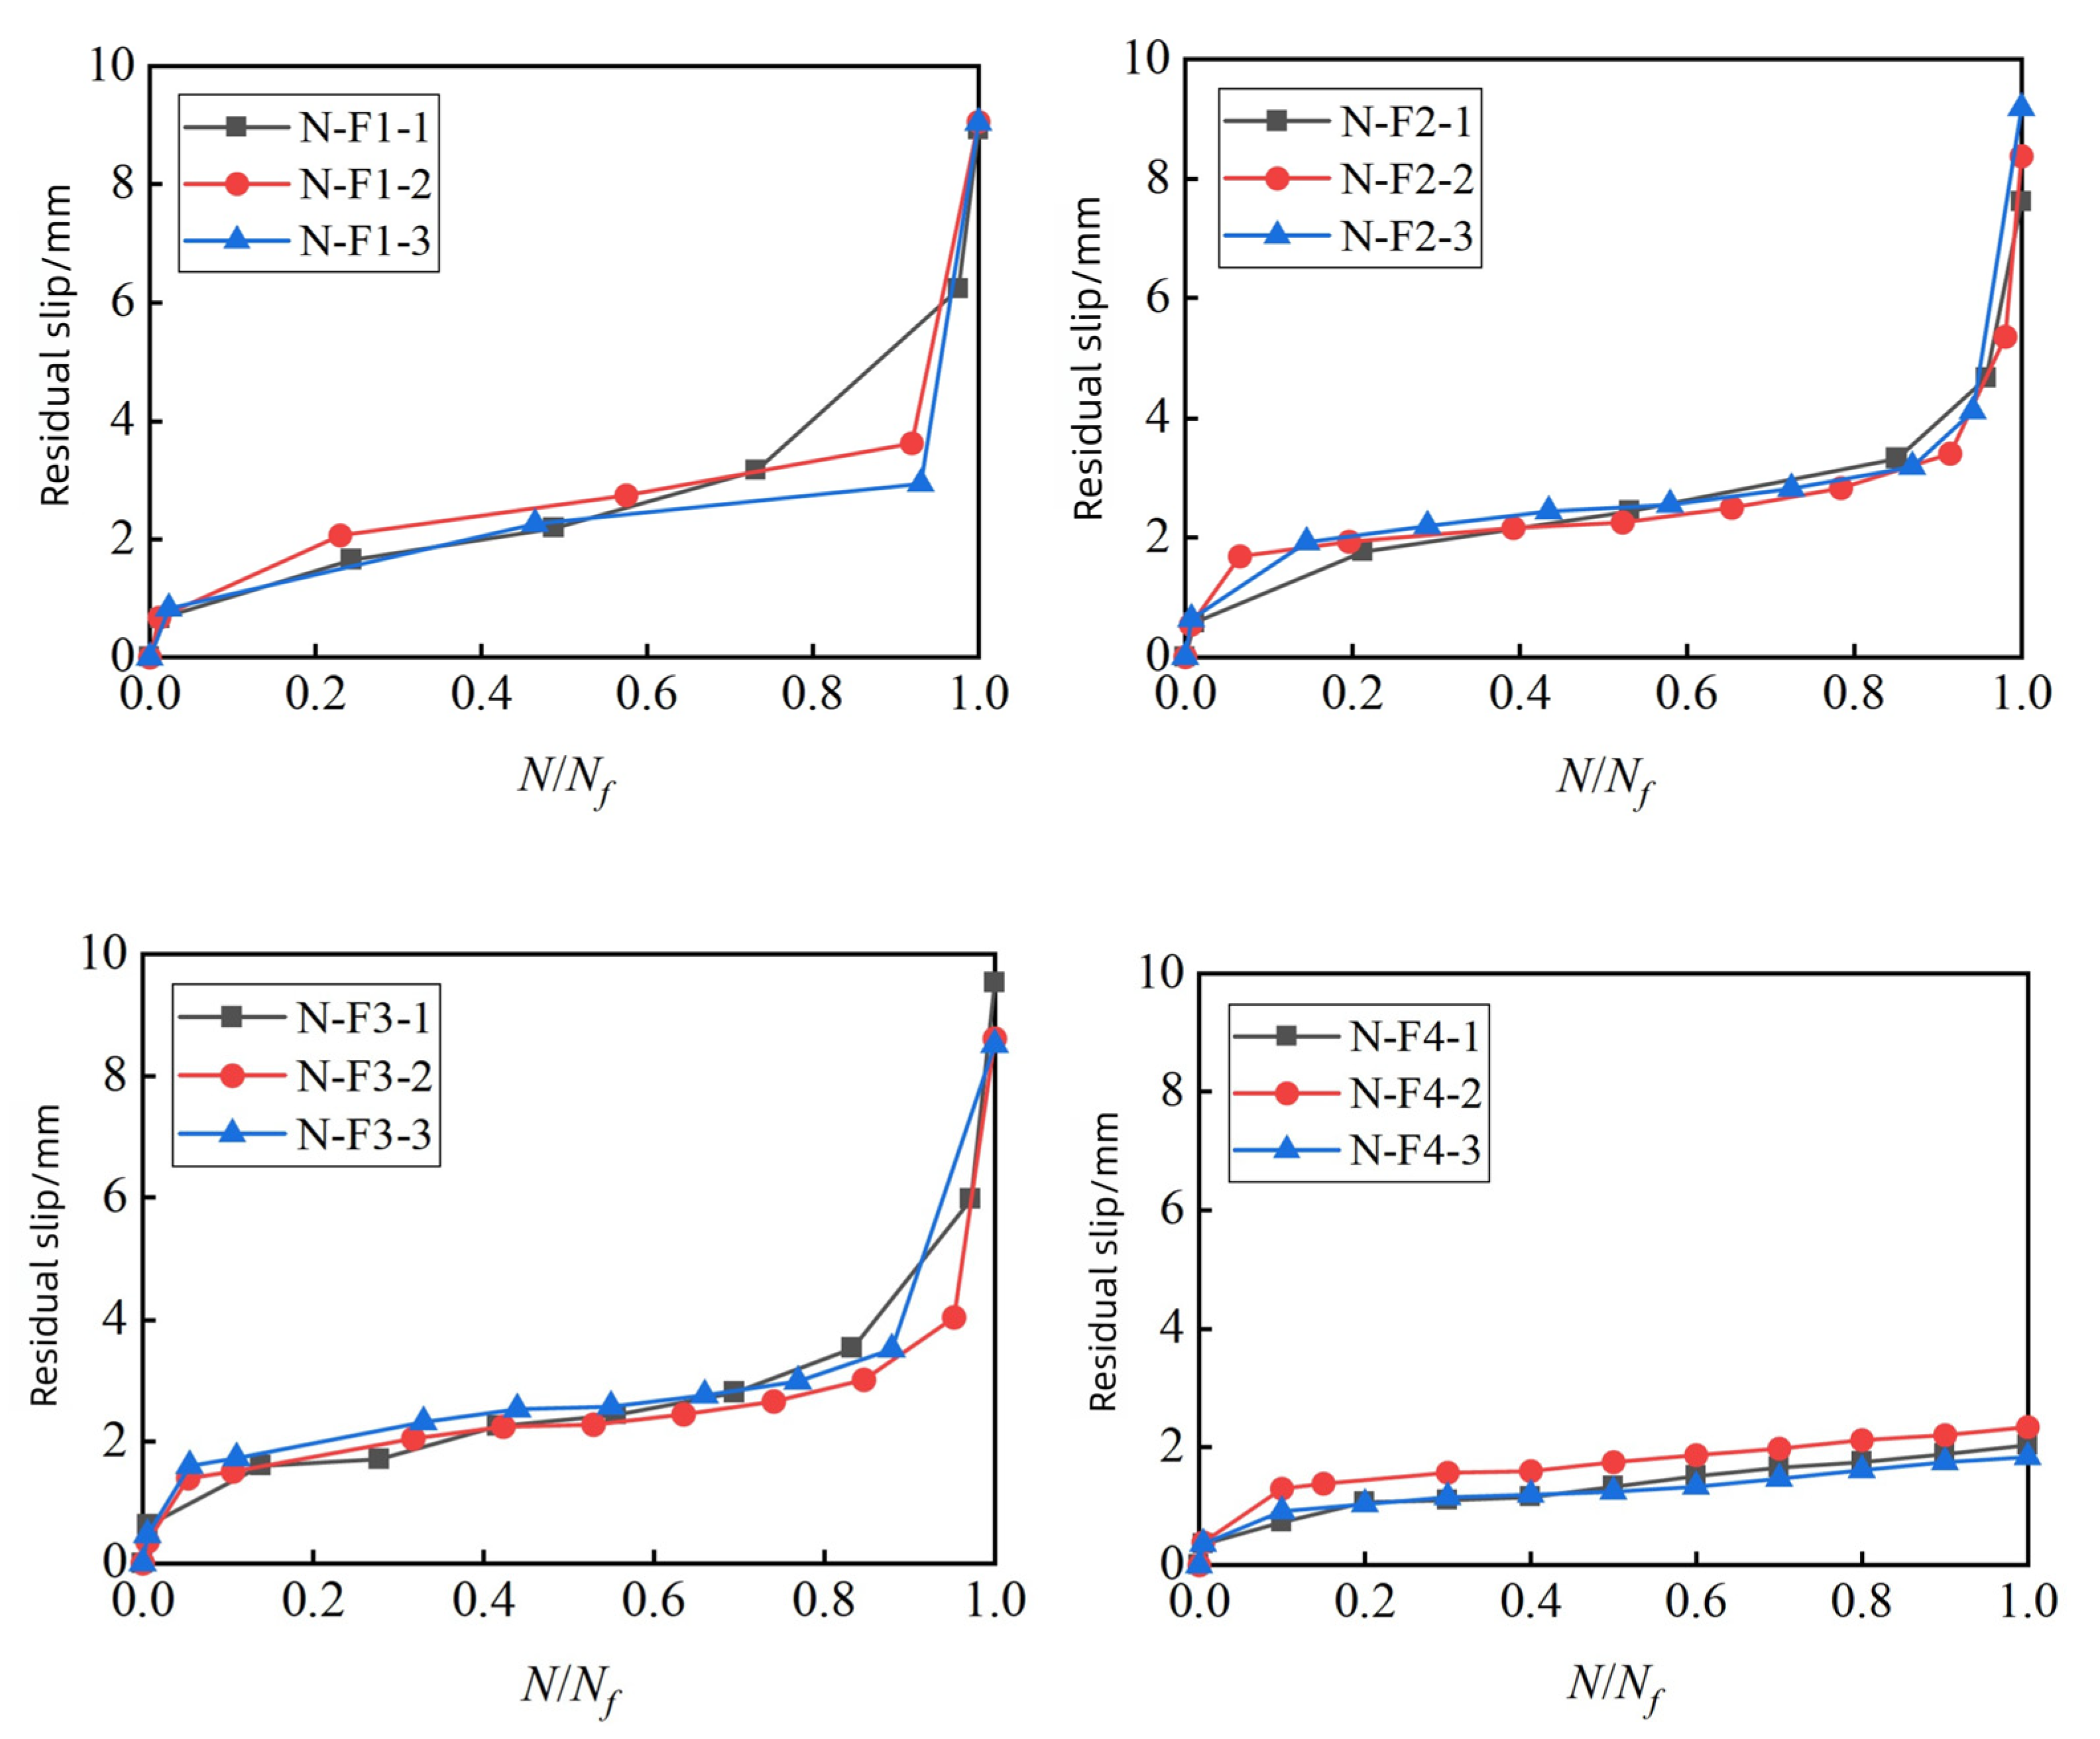
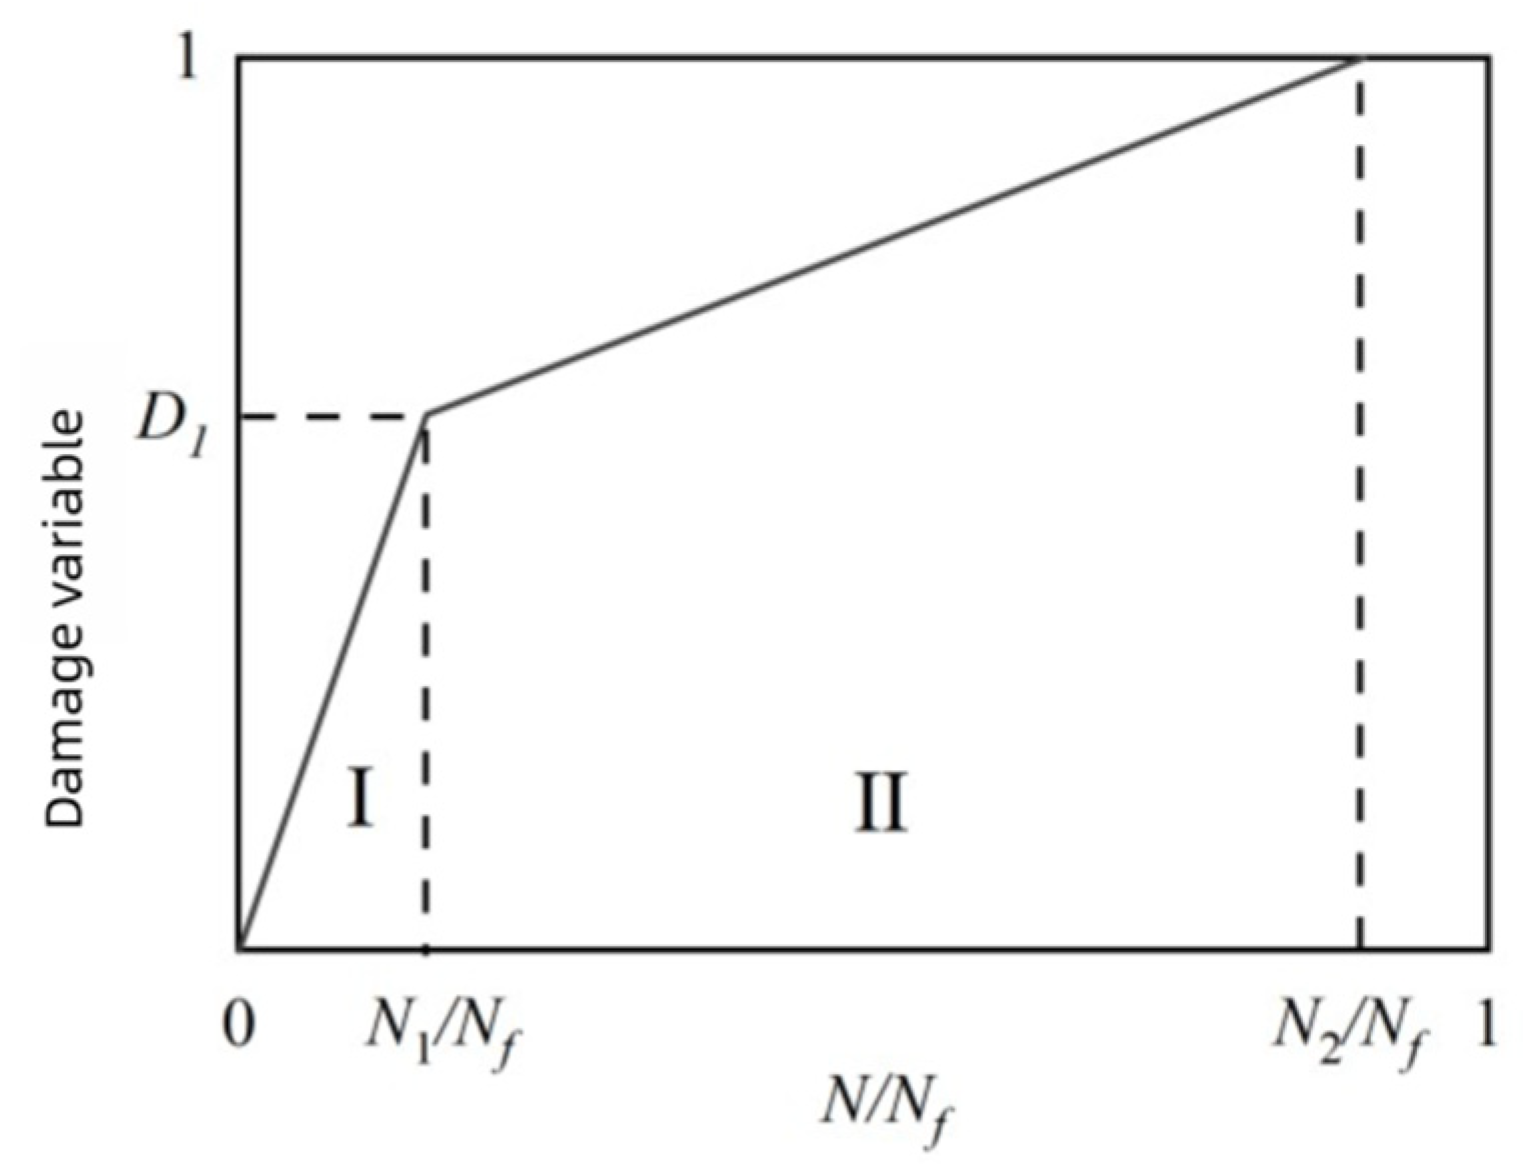
3.4. Analysis of Residual Slip and Cumulative Damage
3.5. Remaining Life Analysis
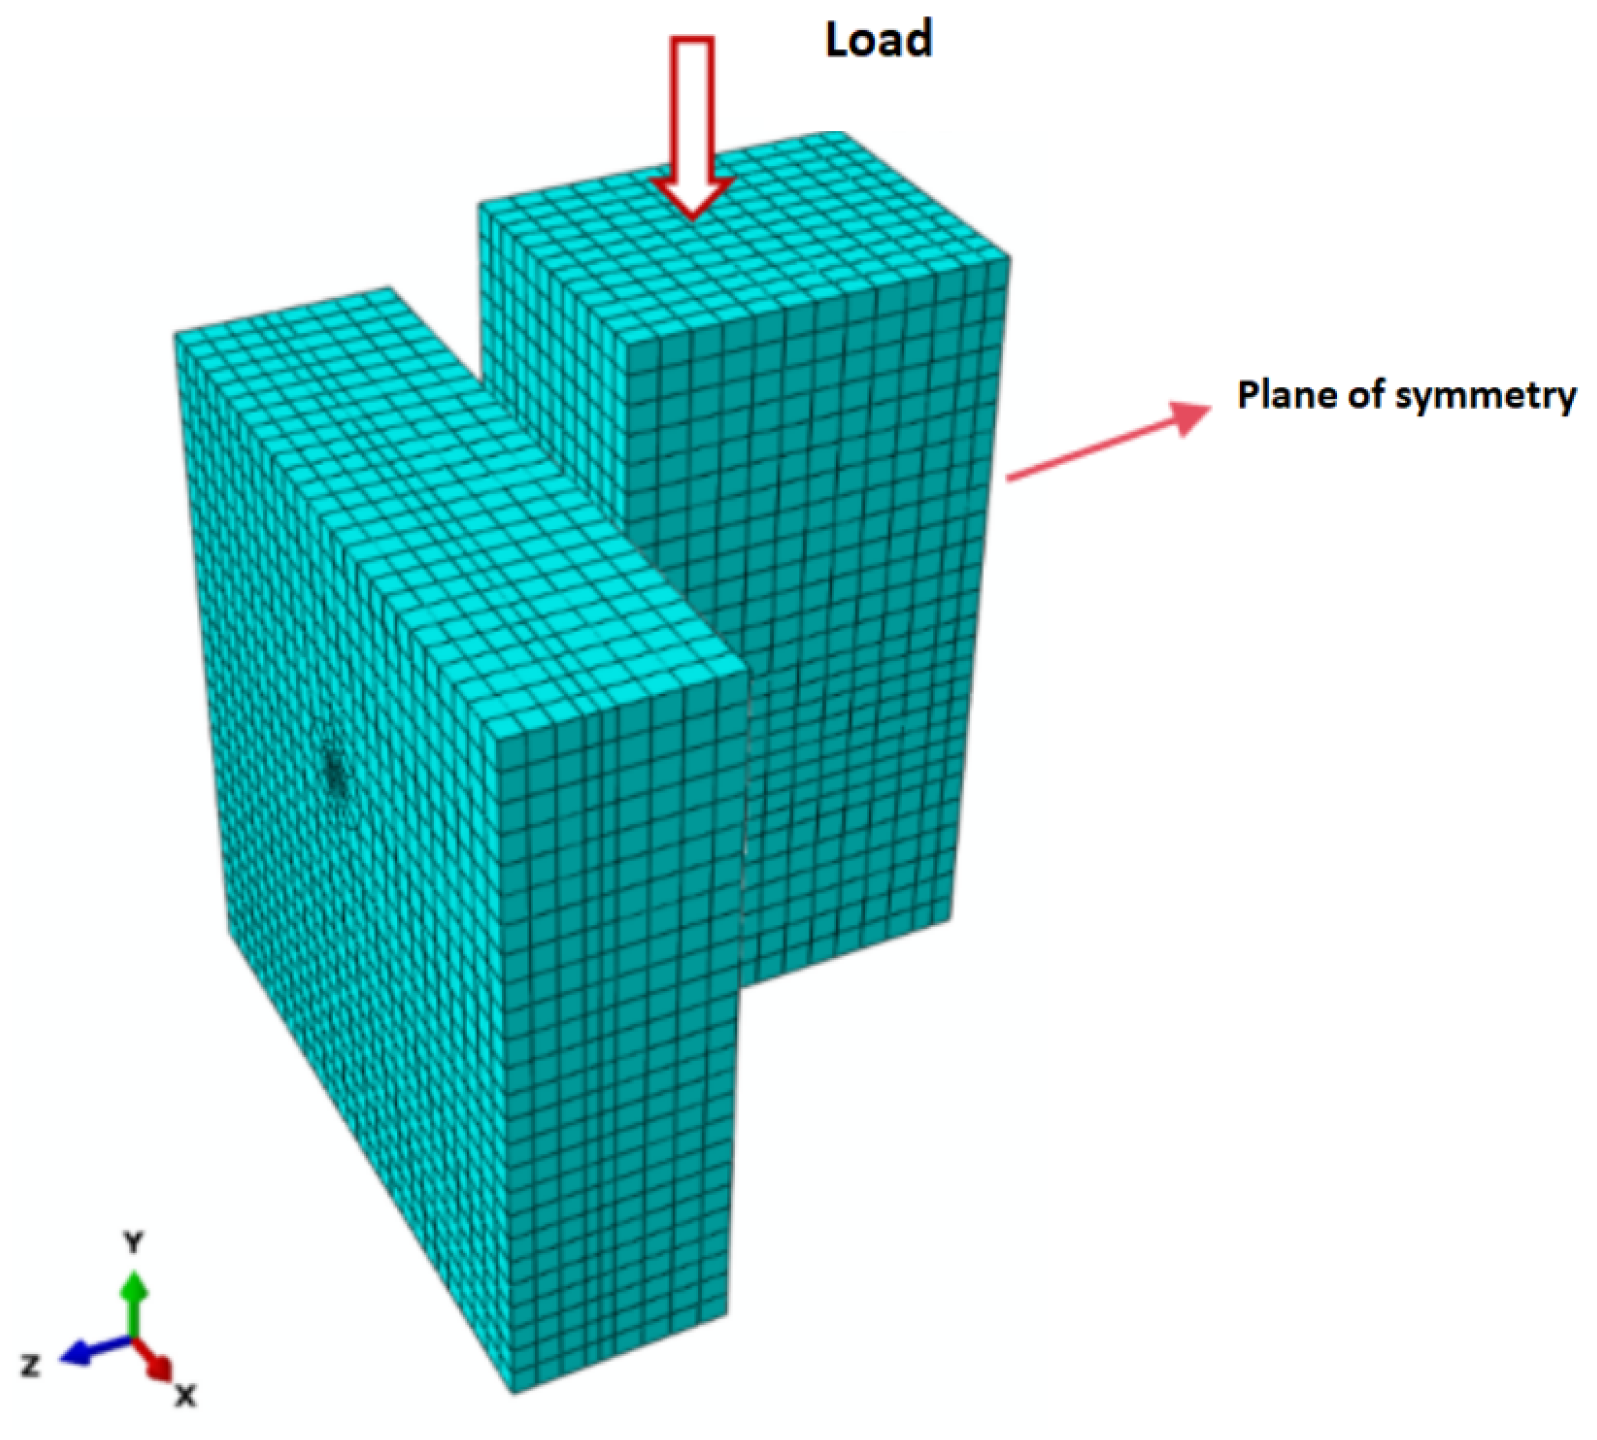
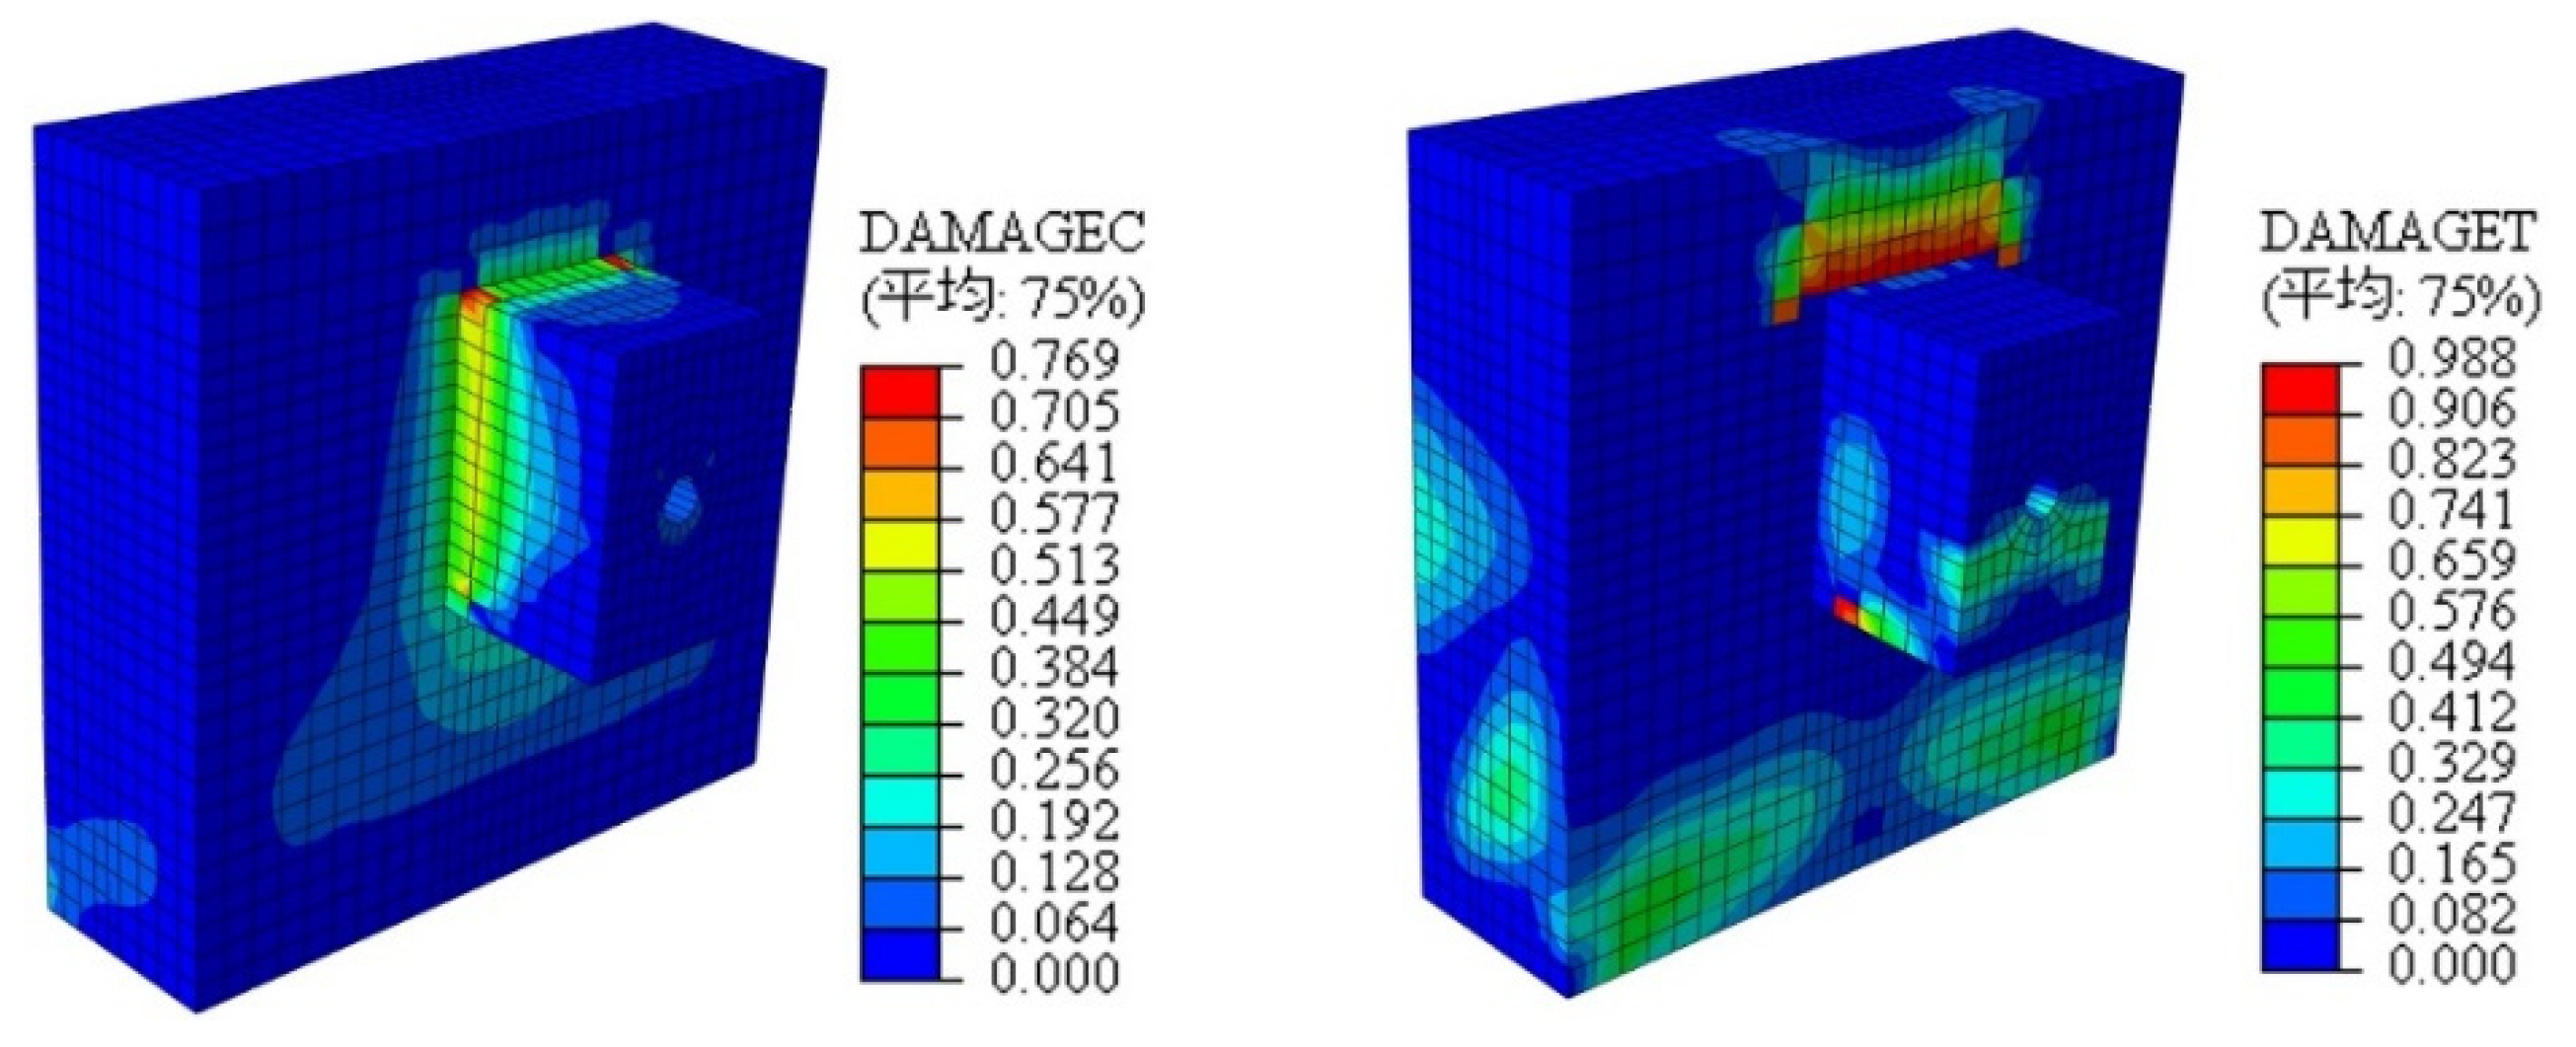
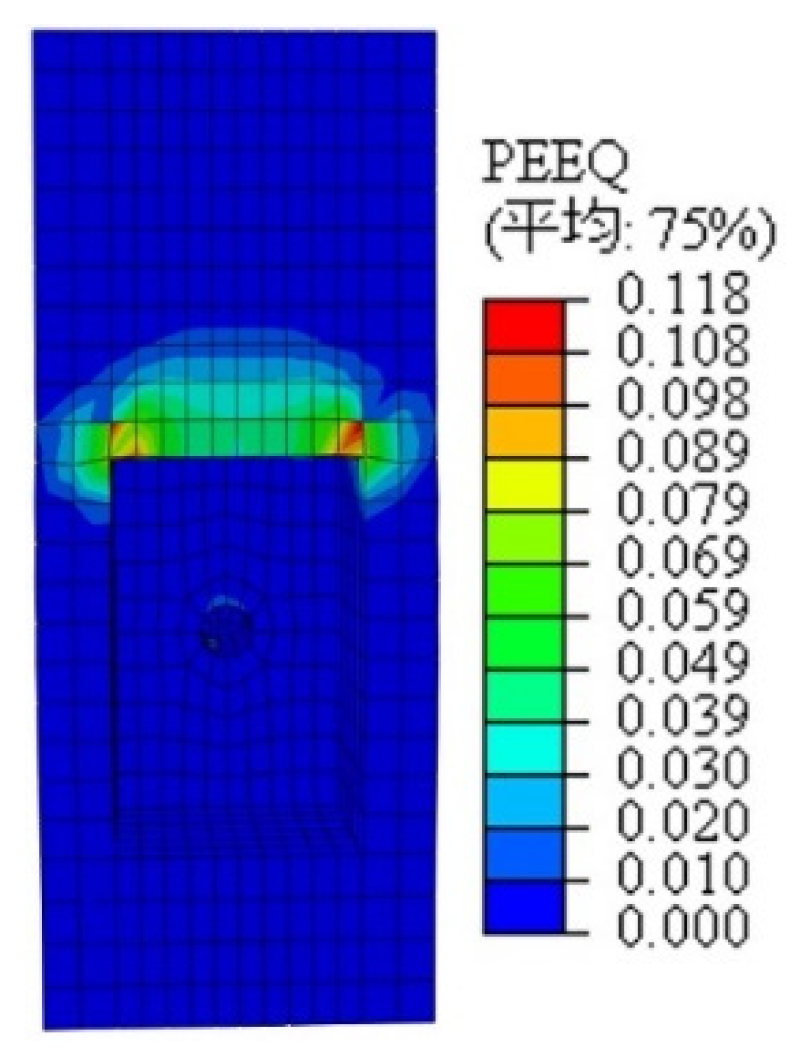
4. Finite Element Analysis
4.1. Finite Element Modeling and Validation
- (1)
- The destruction mode
- (2)
- Load–slip curve
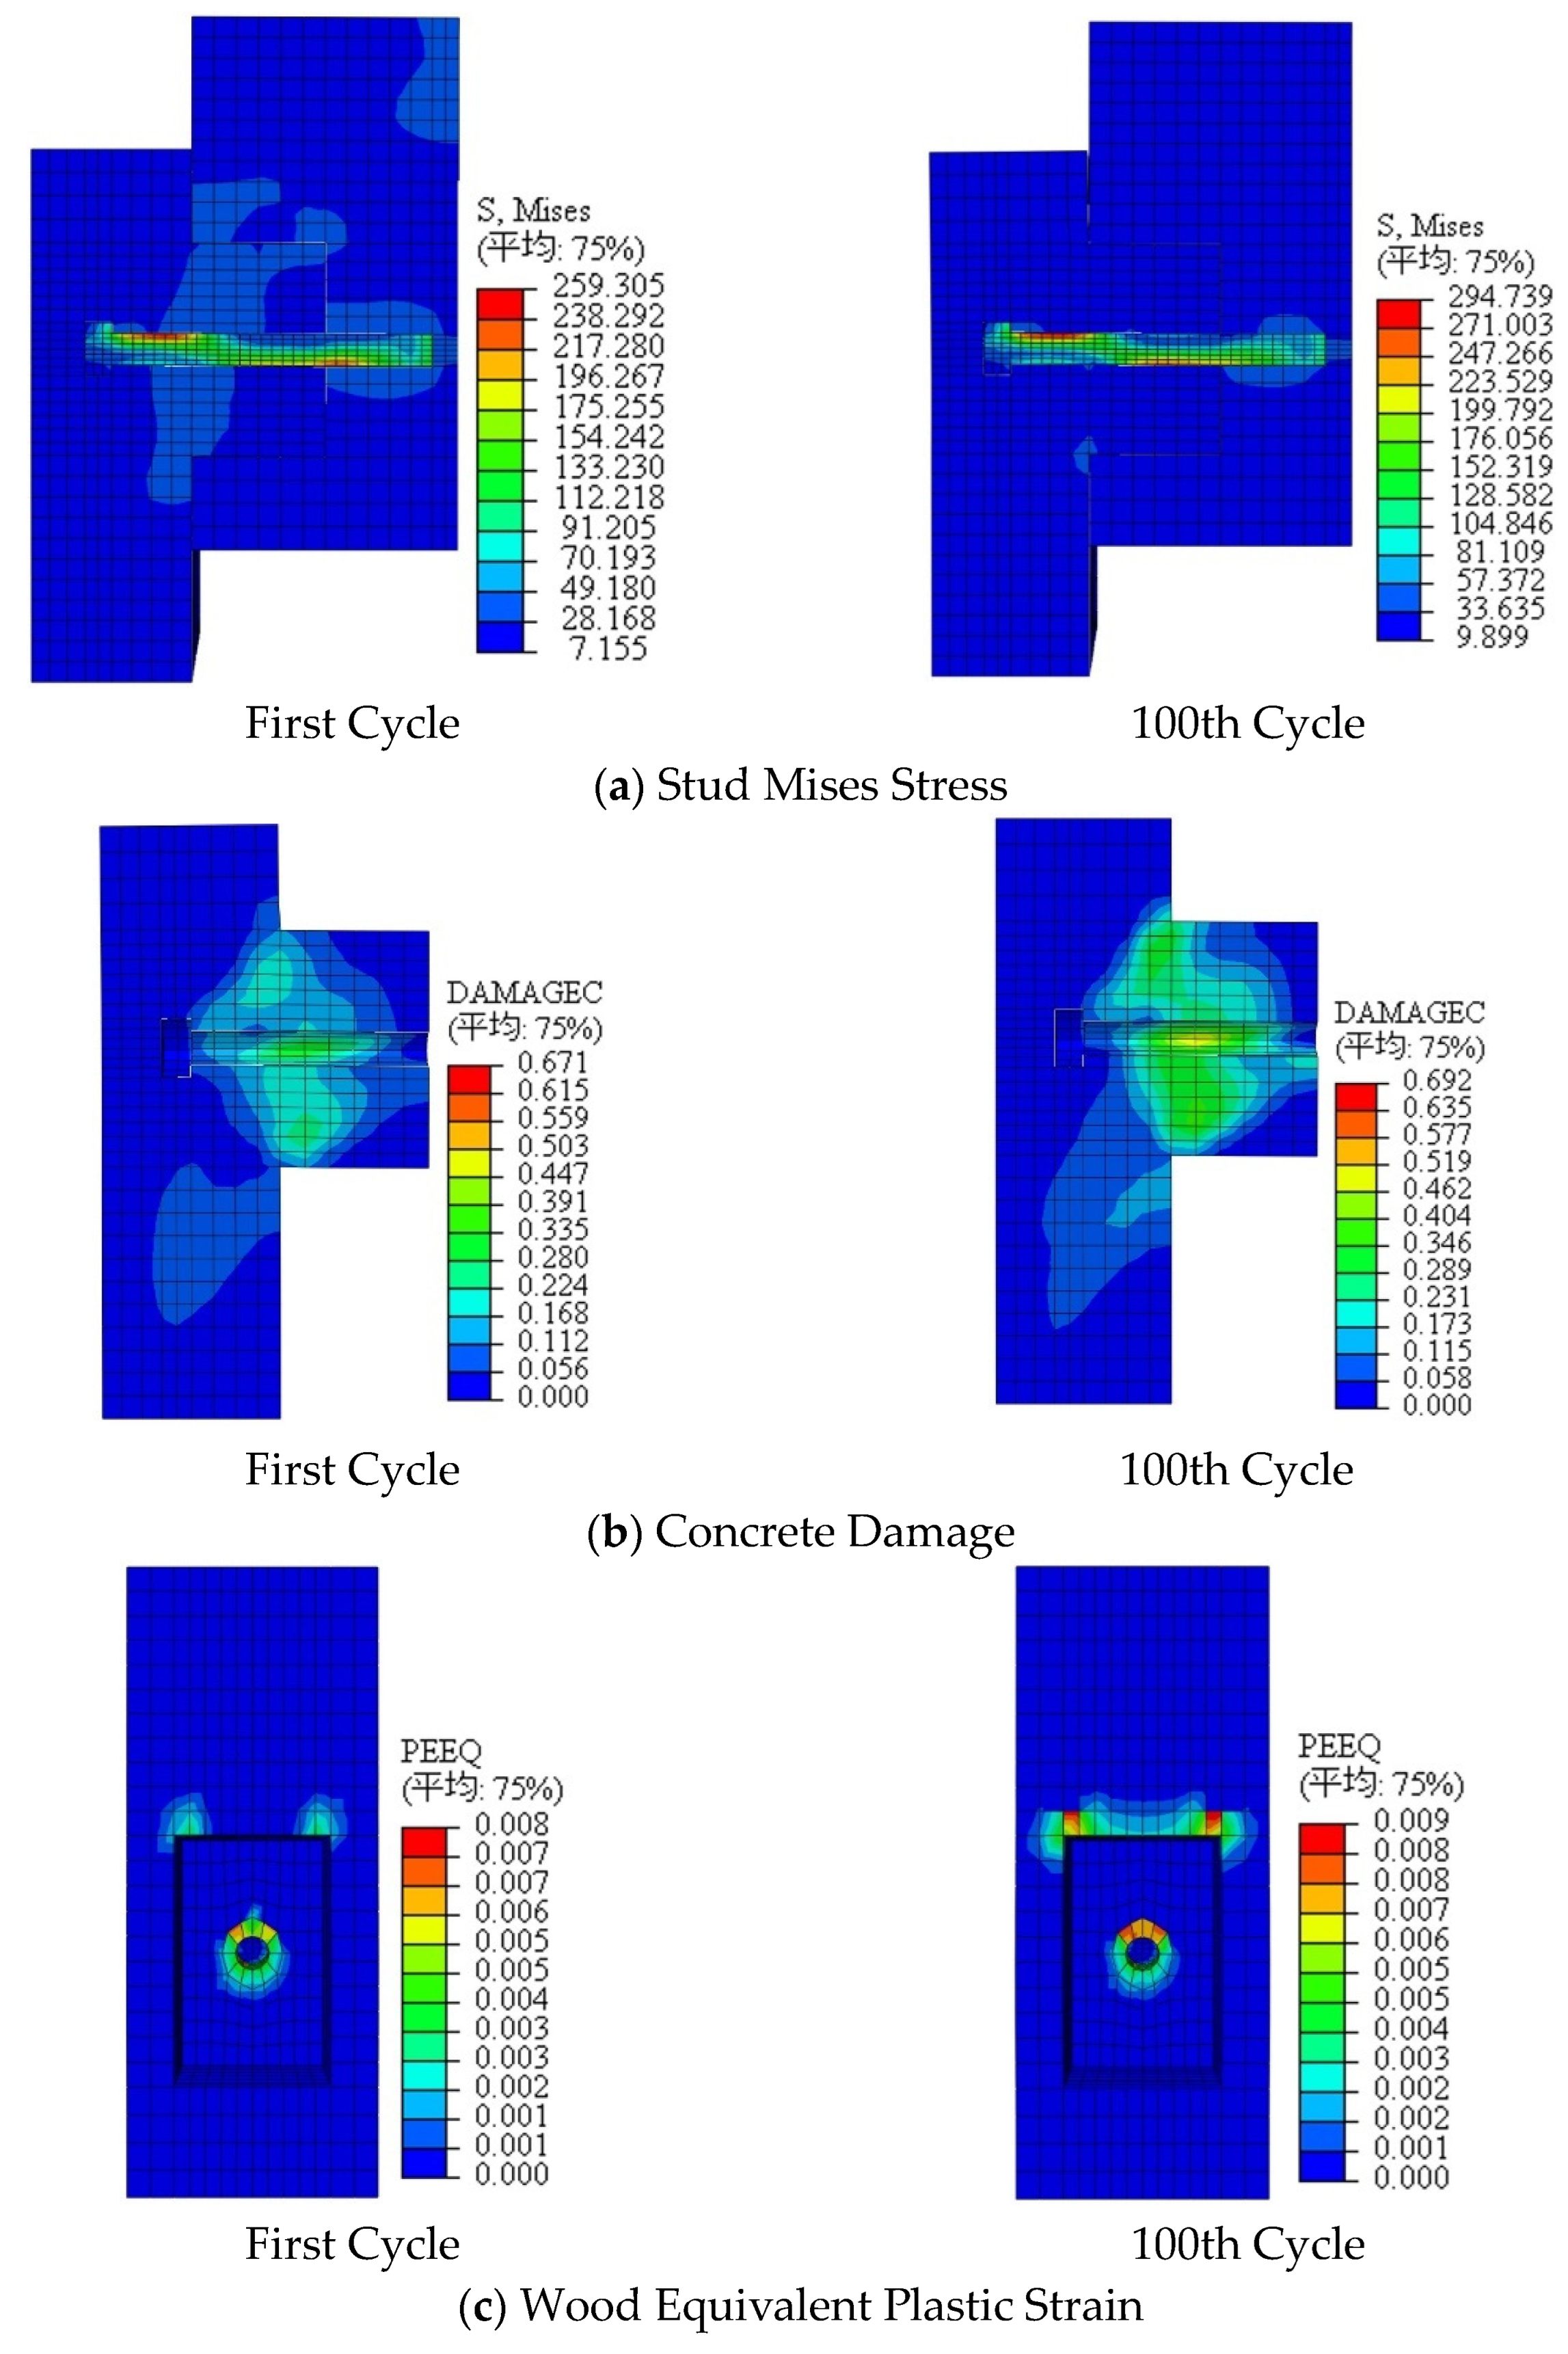
4.2. Fatigue Analysis
5. Fatigue Design
5.1. Basic Assumptions
- (1)
- The load ratio η ≤ 0.5 (η = Pmax/Pu) to ensure that all components of the TCC structure remain in the elastic state.
- (2)
- Timber and concrete are ideal elastic materials.
- (3)
- The timber beam and concrete slab each conform to the plane section assumption and exhibit the same curvature, respectively.
5.2. Fatigue Calculation
5.3. Example Analysis
5.4. Engineering Design Guide
6. Conclusions
- (1)
- Under fatigue loading, the failure mode of all push-out specimens was stud fracture, with the fracture position consistent with the double plastic hinge yielding observed in static failure. Local crushing of the notch concrete was evident, and slight spalling occurred on the concrete slab, but no obvious cracks were found in other areas.
- (2)
- As the peak fatigue load increased, the fatigue life of the specimens showed a decreasing trend. When the peak fatigue load was controlled within 0.35 times the ultimate bearing capacity, the fatigue life of the specimens could reach 2 million cycles. The fatigue failure mechanism of the specimens transitioned from “stud fracture” to “dominated by interfacial slip accumulation”, with no significant surface damage occurring in the specimens and minimal reduction in ultimate bearing capacity. An S-N curve relationship between stress amplitude (ordinate) and the logarithmic value of fatigue life (abscissa) was established. Finite element analysis results showed good agreement with test results, verifying the reliability of this functional relationship.
- (3)
- The stiffness of the specimens degraded in an inverted S-shaped “fast–slow–fast” pattern with increasing cycles, decreasing significantly at the start and end of loading and only slightly during the intermediate stage. Specimens approached fatigue failure when stiffness degradation exceeded 20%.
- (4)
- Numerical analysis indicated that fatigue damage in wood had a more significant impact on the fatigue performance of studs. Compared with pure stud connectors, cutting notches around studs and filling them with concrete improved connector stiffness, reduced stud bending deformation under cyclic loading, and effectively delayed the initiation of fatigue cracks.
- (5)
- Residual slip, reflecting the plastic deformation of specimens macroscopically, can serve as an indicator for measuring the fatigue damage of notch–stud connectors. Based on the evolution of residual slip, the fatigue failure process of notch–stud connectors was divided into three stages: initial fatigue damage, fatigue damage development, and fatigue failure. A fatigue cumulative damage model was established according to the failure mechanism, enabling a quantitative description of fatigue damage and prediction of the remaining fatigue life for similar composite structure connectors.
- (6)
- The ABAQUS/nCode model achieved 93% accuracy in static load–slip curves. Fatigue life predictions aligned well with tests and theoretical values, capturing the full mechanical behavior, from elasticity to fatigue fracture.
- (7)
- A fatigue design methodology for timber–concrete composite structures was established, providing a reference for fatigue design and refining the design process for timber–concrete composite systems.
Author Contributions
Funding
Data Availability Statement
Conflicts of Interest
References
- Ceccotti, A. Composite concrete-timber structures. Prog. Struct. Eng. Mater. 2002, 4, 264–275. [Google Scholar] [CrossRef]
- Yeoh, D.; Fragiacomo, M.; De Franceschi, M.; Buchanan, A.H. Experimental tests of notched and plate connectors for LVL-concrete composite beams. J. Struct. Eng. 2011, 137, 261–269. [Google Scholar] [CrossRef]
- Rasmussen, P.K.; Sørensen, J.H.; Hoang, L.C.; Feddersen, B.; Larsen, F. Notched connection in timber-concrete composite deck structures: A literature review on push-off experiments & design approaches. Constr. Build. Mater. 2023, 397, 131761. [Google Scholar]
- Estévez-Cimadevila, J.; Martín-Gutiérrez, E.; Suárez-Riestra, F.; Vázquez-Rodríguez, J.; Otero-Chans, D. Timber-concrete composite structural flooring system. J. Build. Eng. 2022, 49, 104078. [Google Scholar] [CrossRef]
- Tao, H.; Yang, H.; Liu, W.; Wang, C. Mechanical behavior of crossed inclined coach screw shear connections for prefabricated timber-concrete composite structures. J. Build. Struct. 2022, 43, 164–174. [Google Scholar]
- Xie, L. Shear Property of Timber-Concrete Composite Structure with Nail Type Connectors. Ph.D. Thesis, Central South University of Forestry and Technology, Changsha, China, 2017. (In Chinese). [Google Scholar]
- Fragiacomo, M.; Amadio, C.; Macorini, L. Short-and long-term performance of the “Tecnaria” stud connector for timber-concrete composite beams. Mater. Struct. 2007, 40, 1013–1026. [Google Scholar] [CrossRef]
- Fernandez-Cabo, J.L.; Arriaga, F.; Majano-Majano, A.; Iñiguez-González, G. Short-term performance of the HSB® shear plate-type connector for timber–concrete composite beams. Constr. Build. Mater. 2012, 30, 455–462. [Google Scholar] [CrossRef]
- Auclair, S.C.; Sorelli, L.; Salenikovich, A. A new composite connector for timber-concrete composite structures. Constr. Build. Mater. 2016, 112, 84–92. [Google Scholar] [CrossRef]
- Du, H.; Hu, X.; Wang, H.; Zhang, J.; Sun, Z. Study on shear performance of oblique screw connectors in glulam-concrete composite structures. J. Build. Struct. 2020, 41, 191–200. [Google Scholar]
- Tao, H.; Yang, H.; Zhou, Z.; Wu, Y.; Ju, G.; Shi, B. Influence of slab composite effect on the seismic performance of a six-story timber-concrete composite moment-resisting frame. J. Build. Eng. 2025, 101, 111815. [Google Scholar] [CrossRef]
- Tao, H.; Yang, H.; Tang, L.; Shi, B. Seismic Performance of Joint between Timber-Concrete Composite Beams and Steel Column with Innovative Semirigid Connections: Experimental and Numerical Studies under Quasi-Static Cyclic Loading Conditions. J. Struct. Eng. 2023, 149, 555–565. [Google Scholar] [CrossRef]
- Tao, H.; Yang, H.; Wu, Y.; Ju, G.; Liu, J.; Shi, B. Seismic performance of a six-story timber moment-resisting frame with timber-steel hybrid beam-to-column joints. Structures 2025, 71, 108070. [Google Scholar] [CrossRef]
- Aldi, P.; Kuhlmann, U. Fatigue strength of timber-concrete-composite bridges: Determination of a s-n-line for the grooved connection and the “x-connector”. In Proceedings of the World Conference on Timber Engineering: WCTE, Riva Del Garda, Italy, 20–24 June 2010. [Google Scholar]
- Balogh, J.; Fragiacomo, M.; Gutkowski, R.M.; Fast, R.S. Influence of repeated and sustained loading on the performance of layered wood–concrete composite beams. J. Struct. Eng. 2008, 134, 430–439. [Google Scholar] [CrossRef]
- Yeoh, D.; Fragiacomo, M.; Carradine, D. Fatigue behaviour of timber-concrete composite connections and floor beams. Eng. Struct. 2013, 56, 2240–2248. [Google Scholar] [CrossRef]
- Yeo, K.J.T.; Yeoh, D.E.C. Stiffness and strength degradation of timber concrete composite under fatigue loading. IOP Conf. Ser. Mater. Sci. Eng. 2020, 713, 012024. [Google Scholar] [CrossRef]
- Lamothe, S.; Sorelli, L.; Blanchet, P. Engineering ductile notch connections for composite floors made of laminated timber and high or ultra-high performance fiber reinforced concrete. Eng. Struct. 2020, 211, 110415. [Google Scholar] [CrossRef]
- Khelil, A.; Kiniagi, C.; Boissière, R. Development of new wood-concrete connectors. IOP Conf Ser. Mater. Sci. Eng. 2019, 652, 12034. [Google Scholar] [CrossRef]
- Deam, B.; Fragiacomo, M.; Buchanan, A. Connections for composite concrete slab and LVL flooring systems. Mater. Struct. 2007, 41, 495–507. [Google Scholar] [CrossRef]
- GB 50017-2017; Code of Design of Steel Structures. China Architecture & Building Industry Press: Beijing, China, 2017. (In Chinese)
- EN 1994; Eurocode 4: Design of Composite Concrete and Steel Structures. European Committee for Standardization: Brussels, Belgium, 2005.
- EN 26891:1991; Timber Structures—Joints Made with Mechanical Fasteners—General Principles for the Determination of Strength and Deformation Characteristics. Comity European de Normalization (CEN): Brussels, Belgium, 1991.
- Nie, J. Steel-Concrete Composite Bridges; China Comunications Press: Beijing, China, 2011. (In Chinese) [Google Scholar]
- USDA. Wood Handbook; USDA Forest Products Laboratory: Madison, WI, USA, 2010; pp. 5-40–5-41. [Google Scholar]
- GB 50010-2010; Code for design of concrete structures. China Architecture and Building Press: Beijing, China, 2010. (In Chinese)
- Chen, J.; Xiong, H.; Wang, Z. Experimental study and parametric analysis on mechanical performance of CLT-concrete bolted connection. J. Build. Struct. 2021, 42, 203–214+222. [Google Scholar]
- He, J.; Wang, Z.; Vasdravellis, G.; Wang, L.; Xin, H.; Correia, J.; Berto, F. Fatigue tests and fatigue-life prediction models for hybrid welded-bolted demountable shear connectors. Int. J. Fatigue 2023, 175, 107826. [Google Scholar] [CrossRef]
- Viswanath, S.; Lafave, J.M.; Kuchma, D.A. Concrete compressive strain behavior and magnitudes under uniaxial fatigue loading. Constr. Build. Mater. 2021, 296, 123718. [Google Scholar] [CrossRef]
- Oudjene, M.; Khelifa, M. Elasto-plastic constitutive law for wood behaviour under compressive loadings. Constr. Build. Mater. 2009, 23, 3359–3366. [Google Scholar] [CrossRef]
- Miner, M.A. Cumulative damage in fatigue. J. Appl. Mech.-Trans. ASME 1945, 12, A159–A164. [Google Scholar] [CrossRef]
- Grover, H.J. An observation concerning the cycle ratio in cumulative damage. In Symposium on Fatigue of Aircraft Structures; ASTM STP 274; ASTM International: West Conshohocken, PA, USA, 1960; pp. 120–124. [Google Scholar]
- Manson, S.S.; Freche, J.C.; Ensign, S.R. Application of a double linear damage rule to cumulative fatigue. In Fatigue Crack Propagation; ASTM STP 415; ASTM International: West Conshohocken, PA, USA, 1967; pp. 384–412. [Google Scholar]
- Marco, S.M.; Starkey, W.L. A concept of fatigue damage. Trans. Am. Soc. Mech. Eng. 1954, 76, 627–632. [Google Scholar] [CrossRef]
- Huang, B.T.; Li, Q.H.; Xu, S.L. Fatigue deformation model of plain and fiber-reinforced concrete based on Weibull function. J. Struct. Eng. 2019, 145, 04018234. [Google Scholar] [CrossRef]
- Oehlers, D.J.; Coughlan, C.G. The shear stiffness of stud shear connections in composite beams. J. Constr. Steel Res. 1986, 6, 273–284. [Google Scholar] [CrossRef]
- Chen, A.; He, G.; Wang, Z.; Wang, X. Numerical simulation of bolted connections with steel plate in glued wood based on the macroscopic modeling method. J. Railw. Sci. Eng. 2020, 17, 1244–1251. [Google Scholar]
- Miarka, P.; Seitl, S.; Bílek, V.; Cifuentes, H. Assessment of fatigue resistance of concrete: SN curves to the Paris’ law curves. Constr. Build. Mater. 2022, 341, 127811. [Google Scholar] [CrossRef]
- Cao, L.; Zhang, Z.; Zeng, D.; He, G. Experimental research on fatigue behavior of larch glulam beams. J. Build. Struct. 2016, 37, 27–35. [Google Scholar]
- Chen, L. Study on the Static and Fatigue Properties and Design Methods of Q690 High-Strength Steel-UHPC Composite Beams. Ph.D. Dissertation, Tongji University, Shanghai, China, 2022. [Google Scholar]
- Tomasi, R.; Jorge L. M., S. Lopes. Experimental analysis of timber-concrete composite beams with notch-screw connections. J. Struct. Eng. 2018, 144, 04018006. [Google Scholar]


| Specimen ID | Number | Compressive Strength of Concrete (MPa) | Elastic Modulus of Concrete (MPa) | Compressive Strength of Timber (Parallel to Grain, MPa) | Elastic Modulus of Timber (Parallel to Grain, GPa) | Yield Strength of Bolts (MPa) | Ultimate Tensile Strength of Bolts (MPa) |
|---|---|---|---|---|---|---|---|
| N-F1 | 3 | 34.3 | 30,000 | 40.34 | 11.02 | 391.97 | 505.67 |
| N-F2 | 3 | ||||||
| N-F3 | 3 | ||||||
| N-F4 | 3 | ||||||
| N-S | 3 |
| Speci-men ID | Static Ultimate Load Capacity, Pu (kN) | Fatigue Loading Lower Bound, Pmin (kN) | Fatigue Loading Upper Bound, Pmax (kN) | Load Amplitude, ΔP (kN) | Load Ratio, η | Shear Stress Amplitude, Δτ (MPa) | Fatigue Cycles, TT (×104) | Loading Condition |
|---|---|---|---|---|---|---|---|---|
| N-F1-1 | 3.4 | 34.1 | 30.7 | 0.50 | 135.8 | 48 | Fatigue | |
| N-F1-2 | 3.4 | 34.1 | 30.7 | 0.50 | 135.8 | 87 | ||
| N-F1-3 | 3.4 | 34.1 | 30.7 | 0.50 | 135.8 | 83 | ||
| N-F2-1 | 3.1 | 30.6 | 27.5 | 0.45 | 121.7 | 90 | Fatigue | |
| N-F2-2 | 3.1 | 30.6 | 27.5 | 0.45 | 121.7 | 153 | ||
| N-F2-3 | 3.1 | 30.6 | 27.5 | 0.45 | 121.7 | 126 | ||
| N-F3-1 | 2.7 | 27.2 | 24.5 | 0.40 | 108.4 | 144 | Fatigue | |
| N-F3-2 | 2.7 | 27.2 | 24.5 | 0.40 | 108.4 | 183 | ||
| N-F3-3 | 2.7 | 27.2 | 24.5 | 0.40 | 108.4 | 177 | ||
| N-F4-1 | 61.8 | 2.4 | 23.8 | 21.4 | 0.35 | 94.7 | 200 | Post-Fatigue Static Load |
| N-F4-2 | 2.4 | 23.8 | 21.4 | 0.35 | 94.7 | 200 | ||
| N-F4-3 | 2.4 | 23.8 | 21.4 | 0.35 | 94.7 | 200 | ||
| N-S1 | 68.1 | - | - | - | - | - | - | Static Load |
| N-S2 | - | - | - | - | - | - | ||
| S3 |
| Specimen ID | Ultimate Shear Capacity | Error % (①②) | |
|---|---|---|---|
| S ① | F4 ② | ||
| N-S/N-F | 68.1 | 61.8 | −9.25 |
| Specimen ID | Experimental ① | FEA Result ② | Error % (①②) |
|---|---|---|---|
| S1–S3 | 68.1 | 72.6 | 6.61 |
| Specimen ID | Fatigue Life/×104 | Error % (① vs. ②) | Error % (② vs. ③) | Error % (① vs. ③) | ||
|---|---|---|---|---|---|---|
| Experimental (Avg.) ① | FEA Result ② | Theoretical ③ | ||||
| N-F1 | 72 | 83.5 | 86.1 | 16.0 | 3.1 | 19.6 |
| N-F2 | 123 | 122.4 | 119.0 | 0.4 | −2.8 | 3.3 |
| N-F3 | 168 | 170.1 | 168.5 | 1.3 | −0.9 | 0.3 |
| Specimen ID | Remaining Fatigue Life/×104 | Error % (① vs. ②) | Error % (② vs. ③) | Error % (① vs. ③) | |||
|---|---|---|---|---|---|---|---|
| D | Experimental ① | FEA Result ② | Theoretical ③ | ||||
| N-F1 | 0.67 | 32.4 | 41.5 | 43.4 | 28 | 4.6 | 34.0 |
| N-F2 | 0.65 | 55.4 | 60.3 | 63 | 8.8 | 4.4 | 13.7 |
| N-F3 | 0.62 | 67.2 | 71.6 | 73.8 | 6.5 | 3.0 | 9.8 |
Disclaimer/Publisher’s Note: The statements, opinions and data contained in all publications are solely those of the individual author(s) and contributor(s) and not of MDPI and/or the editor(s). MDPI and/or the editor(s) disclaim responsibility for any injury to people or property resulting from any ideas, methods, instructions or products referred to in the content. |
© 2025 by the authors. Licensee MDPI, Basel, Switzerland. This article is an open access article distributed under the terms and conditions of the Creative Commons Attribution (CC BY) license (https://creativecommons.org/licenses/by/4.0/).
Share and Cite
Zheng, Z.; Yuan, S.; He, G. Fatigue Design Research on Notch–Stud Connectors of Timber–Concrete Composite Structures. Buildings 2025, 15, 2033. https://doi.org/10.3390/buildings15122033
Zheng Z, Yuan S, He G. Fatigue Design Research on Notch–Stud Connectors of Timber–Concrete Composite Structures. Buildings. 2025; 15(12):2033. https://doi.org/10.3390/buildings15122033
Chicago/Turabian StyleZheng, Zuen, Shuai Yuan, and Guojing He. 2025. "Fatigue Design Research on Notch–Stud Connectors of Timber–Concrete Composite Structures" Buildings 15, no. 12: 2033. https://doi.org/10.3390/buildings15122033
APA StyleZheng, Z., Yuan, S., & He, G. (2025). Fatigue Design Research on Notch–Stud Connectors of Timber–Concrete Composite Structures. Buildings, 15(12), 2033. https://doi.org/10.3390/buildings15122033