Article

Digital Twin Framework for Bridge Slab Deterioration: From 2D Inspection Data to Predictive 3D Maintenance Modeling

Department of Civil and Environmental Engineering, Chung-Ang University, Seoul 06974, Republic of Korea
*
Author to whom correspondence should be addressed.
Buildings 2025, 15(12), 1979; https://doi.org/10.3390/buildings15121979
Submission received: 15 April 2025 / Revised: 9 May 2025 / Accepted: 3 June 2025 / Published: 8 June 2025
(This article belongs to the Special Issue Knowledge Management in the Building and Construction Industry)

Abstract

:
Bridge slabs are critical structural components that directly sustain vehicle loads and generally have the shortest service life among bridge elements, leading to increased maintenance needs and costs. In many countries, damage and repair histories have been systematically recorded for over four decades. In this study, a digital twin framework for predicting the future performance of bridge slabs by integrating long-term inspection data was proposed. Historical 2D damage drawings were digitized using the YOLOv7 deep-learning model to extract the spatial coordinates of the damaged locations. Based on this data, eight representative damage states were defined to support the prediction of the service life. The damage and repair history was embedded into the 3D bridge models using a unique coding system to enable temporal and spatial tracking. As the corrosion of the reinforcement cannot be directly observed by visual inspection, its development and progression is estimated using empirical models. The digital twin concept is validated using historical inspection records to demonstrate its applicability to existing bridge slabs. The integration of cumulative deterioration data significantly improves the accuracy of the performance predictions and facilitates data-driven maintenance and rehabilitation strategies.

1. Introduction

1.1. Background

Bridge slabs, which act as primary structural components that directly support vehicular loads, play a critical role in the serviceability of bridges. Their deterioration, especially cracking and reinforcement corrosion, directly affects the structural integrity and the safety of the bridge deck, which is the main interface between the infrastructure and the traffic flow. As slab replacement often requires partial or complete lane closures, this causes significant disruption to traffic and the continuity of operations. Therefore, decisions regarding the slab replacement are often delayed or avoided, despite severe damage, to minimize the interruptions to the transportation services.
As the primary load-bearing elements, the bridge slabs distribute the traffic loads to the supporting beams and piers, ensuring the stability and safety of the entire structure. Over time, the exposure to heavy traffic, the environmental conditions, and cyclic loading can lead to the degradation of the internal reinforcing bars in the form of cracking, water infiltration, and corrosion [1]. These problems weaken the slab, reduce its load-carrying capacity, and accelerate the deterioration of the structure. Proper design, material selection, and regular maintenance are essential for minimizing these effects and extending the lifespan of the bridges. Preventive measures such as waterproofing, corrosion-resistant reinforcements, and timely repairs play a crucial role in maintaining the integrity of the slab, which ultimately improves the overall durability and serviceability of the bridge.
Bridge slabs are considered to have the shortest service life because structural members are exposed to harsh external conditions such as de-icing chemicals and primary vehicle loads. These chemicals accelerate the deterioration of the slab by creating a highly corrosive environment. To mitigate the reinforcement corrosion and prevent associated problems, such as delamination and spalling, the selection of effective preventative maintenance strategies is critical. Many studies have investigated the effects of deck cracking on the durability and the remaining service life of bridges using data from visual inspections [2,3,4]. Cracks provide a direct pathway for the corrosive chemicals to reach the embedded reinforcing bars, triggering corrosion that progresses over time. As the reinforcing steel corrodes, its volume expands, leading to further cracking, debonding, and spalling of the surrounding concrete, ultimately compromising the structural integrity of the slab.
Many countries have collected inspection reports of bridge slab damage and conducted condition rating evaluations based on these data. However, current maintenance practices lack a method for tracking individual damages, making it difficult to provide design feedback that could help minimize maintenance costs and extend the service life while accounting for specific design and environmental factors. With the growing number of aging bridges, developing effective strategies to prolong the service life and reduce the maintenance costs has become an urgent research priority. To achieve this, there is an urgent need for studies focusing on the definition and prediction of damage models through the digitization of maintenance data.

1.2. Problem Statement

The service life specified in the current design criteria does not accurately represent the actual service life of a typical bridge. The service life of a bridge can be significantly extended by appropriate repair, strengthening, and partial replacement. However, effective maintenance decisions require a clear definition of the service life of both the individual structural components and the bridge system as a whole. The digital twin model provides a valuable approach for this purpose, enabling data-driven evaluation and predictive analysis. In this study, a digital twin framework was used to predict the progression of damage and determine the service life of bridge slabs affected by cracking.
To determine the service life of a bridge slab, it is essential to create a damage model for the concrete slab, as it directly affects the serviceability limit. In this study, the cracking damage in cast-in-place concrete slabs was categorized into five stages, as illustrated in Figure 1. The model was designed to leverage the long-term collected data from the visual inspections performed at each stage. Initially, transverse cracks may form due to the girder restraints during the curing process after the concrete slab is poured. These cracks can propagate or lead to longitudinal cracks under the repeated loading of moving vehicles. Over time, moisture infiltration, which often accompanies the degradation of the waterproofing layer, can lead to the efflorescence and corrosion of the reinforcement. If this deterioration process continues, the bond between the reinforcing bars and the concrete will weaken, eventually leading to spalling. Concrete spalling represents the final stage of the deterioration as it poses a significant hazard to vehicles and pedestrians passing beneath the bridge.
Building a data-driven digital twin model requires large amounts of high-quality training data. However, in current bridge inspection practice, the damage is mainly recorded in two-dimensional drawings, which often contain inaccurate location and size information. In addition, the tracking of individual damage over time is challenging, as some records are lost owing to surface repairs, and discrepancies arise when inspectors observe the damage from a distance, making it difficult to reconcile the new inspection data with the previous records.
Given these limitations, it is a major challenge to develop a system that accurately maps individual damage onto a 3D bridge model and uses it as training data. In this study, a method was proposed to extract crack damage as discrete objects from two-dimensional inspection records and integrate them into a 3D maintenance model. This approach was used to analyze the crack progression, and investigate the possibility of developing a prediction model to estimate the service life of the bridge slabs.

2. Literature Review

2.1. Digitalized Data Delivery for Bridges

The application of Building Information Modeling (BIM) technology in bridge construction has primarily focused on the design and construction stages. BIM significantly increases the productivity of prefabrication and preconstruction processes by streamlining the design and construction tasks [5]. Its digitalized and shared information delivery enables seamless data exchange throughout the entire workflow from design–fabrication–assembly and facilitates a comprehensive analysis of assemblability by incorporating fabrication deviation data. A case study on prefabricated bridges demonstrates how the technology effectively identifies and mitigates assembly errors prior to the construction phase and reduces the risks on-site. In addition, a construction digital twin (CDT) framework has been developed to optimize crane-lifting operations for prefabricated bridge decks [6]. By integrating 3D site modeling, BIM, and crane simulations within the Unity engine, the CDT improves the planning accuracy and operational efficiency. Moreover, as-built BIM models with digitized information can be delivered to asset owners to support the maintenance and long-term management of structures. The use of the digital models for information delivery improves knowledge retention and contributes to greater efficiency in the construction industry.
ISO 19650 is an international standard for the management of information over the lifecycle of built assets using BIM [7]. ISO 19650-2 builds on these principles by setting out the specific requirements for information management during the delivery phase of the assets, including the designation of parties, the definition of information requirements, and the implementation of standardized workflows for better coordination [8]. ISO 19650-3 extends these principles to the operational phase to ensure consistent information management for the asset maintenance, modification, and decommissioning [9]. For the digital information delivery in a construction project, the information requirements must be defined, taking into account the inspection and management tasks. Three-dimensional digital models provide an interface between the input and output of the relevant data. Substantial amounts of data from inspection, repair, and monitoring systems can be collected and analyzed using data analytics. The difficult task of predicting the future performance has been solved by using the accumulated damage data.
Recent research on digital twins (DTs) for bridge maintenance has been strongly influenced by developments in BIM, especially the concept of 6D BIM. 6D BIM extends the conventional BIM functionalities by integrating lifecycle considerations such as sustainability, cost, and operation and maintenance [10,11]. Although it has been proposed as a tool to streamline facility management (FM), several challenges have been identified, including unclear roles and responsibilities, inadequate FM input during the early project stages, interoperability concerns, and a general resistance to change. A significant issue in bridge maintenance is the loss of the information generated during the design and construction when transitioning to the maintenance phase, as the BIM does not inherently incorporate the maintenance data. To overcome these limitations, the introduction of DTs has been proposed, which offers a more dynamic and interconnected approach. Unlike the static BIM models, the DTs create a digital representation of the physical assets in real time, ensuring a continuity of data flow and enabling better decision-making in bridge maintenance [12].
Despite the benefits of the DTs, their application in bridge maintenance comes with some challenges. A major limitation is the cost and scalability of the DT implementation. Many existing studies have focused on high-quality sensing systems and a detailed finite element analysis, making the DT solutions expensive and mainly applicable to critical infrastructure rather than the wider network of bridges managed by the authorities [13]. In addition, DTs have yet to be fully integrated into the national maintenance standards that define the essential maintenance methods and data requirements for safe and consistent asset management [14]. The lack of clear guidelines and system architecture has led to misconceptions about DTs, as they are often equated with BIM rather than recognizing their distinct capabilities. To make DTs more viable for bridge maintenance, researchers have emphasized the need for robust data modeling and the analytics to develop a structured approach to lifecycle management [15]. Recent efforts such as the DT architecture for concrete bridges by Jeon et al. aim to bridge this gap by proposing information systems and data schemas that align the DT functionalities with the bridge maintenance requirements [14].

2.2. Service Life Design of Bridge Slab

The Federal Highway Administration conducted a study that used the National Bridge Inventory database to develop probabilistic tools for predicting the service life of concrete bridge decks [4,16,17]. By analyzing 150,136 data entries from 1992 to 2014, this study identified key factors that influence the deck longevity, including the climatic region, average daily truck traffic (ADTT), maintenance responsibility, and structure type. The study introduced the concept of time-in-condition rating, which indicates the length of time a bridge deck remains in a specific condition before deteriorating. Survival analysis techniques were applied to compute the probability of a deck maintaining its condition over time. This led to the creation of survival curves that illustrate how variables such as the ADTT affect the durability of the deck. For example, the results indicate that higher ADTT levels correlate with a lower likelihood of a bridge deck remaining in good condition [4]. These insights can assist bridge owners in making informed maintenance and design decisions, to improve the longevity of bridge decks.
Gode proposed a novel method for predicting the remaining service life of concrete bridges using quantitative deterioration analysis [3]. This approach aims to improve the accuracy of service-life estimates through a systematic evaluation of deterioration patterns. This method involves collecting and analyzing quantitative data on the factors that contribute to the bridge degradation, allowing for more accurate predictions of a bridge’s remaining service life. Predictive capabilities are critical for effective maintenance planning and resource allocation in bridge management. The NCHRP Project 12-108 led to the development of the “Guide Specification for Service Life Design of Highway Bridges,” which was adopted by AASHTO in 2019 [18]. This guide fills a gap in the AASHTO LRFD specifications by providing the structured methods for ensuring a defined service life for highway bridges. Using a probabilistic approach, the guide accounts for the environmental exposure, material properties, maintenance strategies, durability optimization, and cost-effectiveness. It emphasizes performance-based design to reduce risks such as corrosion and fatigue by integrating the standardized procedures for durability assessment.
A study has also been proposed on how much the deterioration of the deck member unit affects the overall system unit. Shim et al. experimentally showed that the flexural stiffness decreases after crack stabilization in the negative moment section through experiments on two continuous composite beams with precast decks [19]. However, the change of the flexural stiffness is less than 5%. Li analyzed the effect of the deck damage on the overall stiffness and first natural frequency of a simply supported T-girder bridge through finite element analysis and experiments. The analysis results showed that serious damage to the medium-span T-beam reduces the first natural frequency by up to 15.63%, suggesting that the damage in an actual bridge can be detected by the changes in the vibration characteristics [19]. Gheitasi and Harris investigated the effects of various damage scenarios—such as changes in the damage location, depth, and material degradation—on composite steel girder bridges [20]. Their findings indicate that while rebar corrosion and subsurface delamination influence individual deck system behavior, the overall impact on system-level behavior is minimal [21].
To date, the condition rating data from inspections has primarily focused on evaluating the service life of bridge slabs and advancing the studies related to digital twins. However, to drive design improvements that extend the service life and reduce the repair costs, it is essential to develop a data-driven digital twin capable of tracking individual damages. Such a system would facilitate the optimal repair planning by the integration of long-term inspection data and digital modeling of damage progression.
To achieve this, an efficient methodology is required to digitize the collected inspection data and effectively translate them into a digital twin model. In this study, a framework for a digital twin system that predicts the service life of a bridge slab and tracks the progression of crack damage was proposed. The proposed model has been validated using real-world bridge case studies, demonstrating its potential to improve maintenance strategies and optimize repair decisions.

3. Methodology

3.1. Definition of a Digital Twin Model Framework for Bridge Slabs

The progression of damage in bridge slabs follows a systematic deterioration pattern that is influenced by environmental, mechanical, and chemical factors. According to various studies, one of the most important deterioration mechanisms is the corrosion of the reinforcing steel, which leads to cracking, spalling, and an eventual delamination of the concrete [22]. The process begins with the ingress of chlorides and moisture through cracks, which accelerates corrosion, which in turn expands the steel reinforcement and causes additional cracking and concrete cover loss [23]. Preventative strategies, such as optimizing the concrete mix designs, using shrinkage-reducing admixtures, and ensuring proper curing, are important to reduce early-stage cracking and extend the service life of the bridge slabs [24]. By implementing these measures, infrastructure managers can significantly slow the progression of damage, reduce long-term repair costs, and increase the bridge durability.
To effectively assess and monitor the damage progression in bridge slabs, bridge management systems must integrate service life prediction models and performance prediction tools that leverage large-scale data to evaluate deterioration trends. The introduction of digitalized damage objects allows bridge managers to systematically prioritize maintenance and perform targeted interventions, such as overlays, sealing, or full-depth repairs, based on the severity and classification of damage, as outlined in Table 1. By incorporating a data-driven digital twin, the progression of the damage can be dynamically analyzed and forecasted while accounting for the design parameters, material properties, and environmental conditions. This approach improves the predictive maintenance capabilities and enables proactive decision-making to extend the service life of the bridge slabs and optimize the maintenance strategies.
Damage states 5–7 could not be easily identified nor quantified during a visual inspection. Therefore, it is essential to conduct material tests to assess whether corrosive conditions, such as carbonation depth and chloride content, have developed. The onset of corrosion is determined using the diagnostic thresholds of these parameters, and further progression can be estimated using established empirical models.
F i c k s   s e c o n d   l a w   :   C t = D 2 C x 2 C = A t
where C denotes the carbonation depth determined by field investigations, A represents the carbonation rate coefficient, and t is the current service year. In this study, based on the empirical data, the service life corresponding to the time t at which the carbonation front reaches a predetermined threshold depth y l i m was estimated by deriving the carbonation coefficient from Equation (1) and substituting it into Equation (2). This point was identified as corresponding to the sixth stage of damage progression. The formulation of Equation (2) is represented by the following derivation process,
C = A t 0   ,   y l i m = A t d t 0 = C 2 A 2 ,   t d = y l i m 2 A 2 t d = y l i m 2 C 2 A 2 + t 0
where t d denotes the time required from the present to the point at which the carbonation reaches the reinforcement; y l i m represents the critical depth of the carbonation beyond which the corrosion of the reinforcement may begin; A is the carbonation rate coefficient derived from the carbonation tests; and t 0 refers to the current service life of the structure. The critical depth y l i m can be calculated using Equation (3). It is important to note that the carbonation threshold depth, c k , varies in different studies, with different researchers proposing distinct values based on their experimental or theoretical approaches [24]. In this paper, the threshold depth is assumed to be 10 mm, where d c is the cover thickness (in mm) of the reinforcing bar, which was determined by on-site measurements.
y l i m = d c c k
According to NT Build 443, the durability against the chloride ions was evaluated using Equation (4) to predict the remaining service life [25]. Similar to the assessment of carbonation, the assessment of durability to chloride ions involves determining the effective diffusion coefficient of chloride ions, D d , and using it to estimate the time t d required for the chloride concentration to reach the critical threshold, C d , that triggers the corrosion of the reinforcing steel. In this study, the value of t d was considered as the time at which the structure reached the sixth state of deterioration,
C d C i = C S C i 1 e r f x 2 D d t  
where C d is the design chloride ion concentration at position x and at time t ; C i is the initial chloride ion concentration, assumed to be the maximum value; C S is the measured chloride ion concentration at the surface; and e r f is the error function, defined as ( e r f x = 2 π 0 x e λ 2 d λ ) , D d is the effective diffusion coefficient of the chloride ions, x is the concrete cover depth to the reinforcing bar, and t is the service life in years.
The procedure for assessing the durability of the chloride ions includes the following steps: Firstly, the effective diffusion coefficient of the chloride ions was derived through nonlinear regression based on the measured chloride concentrations at three or more depths. Secondly, Equation (4) was used to predict the chloride concentration at the measured depth of the concrete cover using the derived diffusion coefficient. Thirdly, the value of t d is estimated as the time at which the predicted chloride concentration reaches a critical threshold.
Once the environmental conditions conducive to corrosion initiation have been determined, it is important to predict the subsequent rate of the corrosion progression. While visible signs such as corrosion products or concrete spalling can directly indicate ongoing deterioration in their absence, the prediction must rely on established empirical models. Among these models, the time required for cracking due to expansive corrosion products, as proposed by Liu et al. [26], provides a practical basis for forecasting deterioration,
t c r = W c r i t 2 2 · k p
where t c r is the time of cracking, W c r i t is the critical mass of the rust, and k p  is the rust production. The critical mass of the rust was calculated using Equation (6) [26],
W c r i t = ρ r u s t ρ s t e e l ρ s t e e l α ρ r u s t π · D · d c · f t E a 2 + b 2 b 2 a 2 + υ c + d 0
where ρ r u s t is the density of the corrosion products, ρ s t e e l is the density of the steel, α is the ratio between the molecular weights of the steel and corrosion products, D is the diameter of the steel bar, d c is the thickness of the cover concrete, f t is the tensile strength of the concrete, E is the elastic modulus, a is the distance from the center of the reinforcing bar to the boundary of the void region between the concrete and the reinforcing bar, b is the distance from the center of the reinforcing bar to the surface of the concrete, υ c is the Poisson’s ratio of the concrete at the service limit state, and d 0 is the thickness of the porous zone.
In this study, the parameters required for Liu’s model were assumed as listed in Table 2. The corrosion current density, which is a critical input for the model, was estimated based on the annual average temperature and relative humidity specific to the geographical location of the bridge under study.
In Equation (5), the rust production k p is defined by Equation (7) and is assumed to be proportional to the corrosion current i c o r r [26],
k p = 0.000383 · D · i c o r r
i c o r r = 0.926 · e 7.98 + 0.7771 · l n ( 1.69 · C t 3006 T 0.000116 · R c + 2.24 t 0.215 )
R c = e 8.03 0.54 · l n 1 + 1.69 · C t
where i c o r r is the corrosion rate ( μ A / cm 2 ) at time t; C t is the chloride content at the reinforcement position ( kg / m 3 ); T is the temperature in degrees Kelvin at the position of the reinforcement; R c is the ohmic resistance of concrete (Ohm); and t is the corrosion propagation time (years). In Equation (8), t represents the crack initiation time derived from experimental observations. However, as no experiments were conducted in this study, a numerical iterative approach was chosen to match the t value in Equation (8) with t c r in Equation (5) to determine the corrosion current density i c o r r .
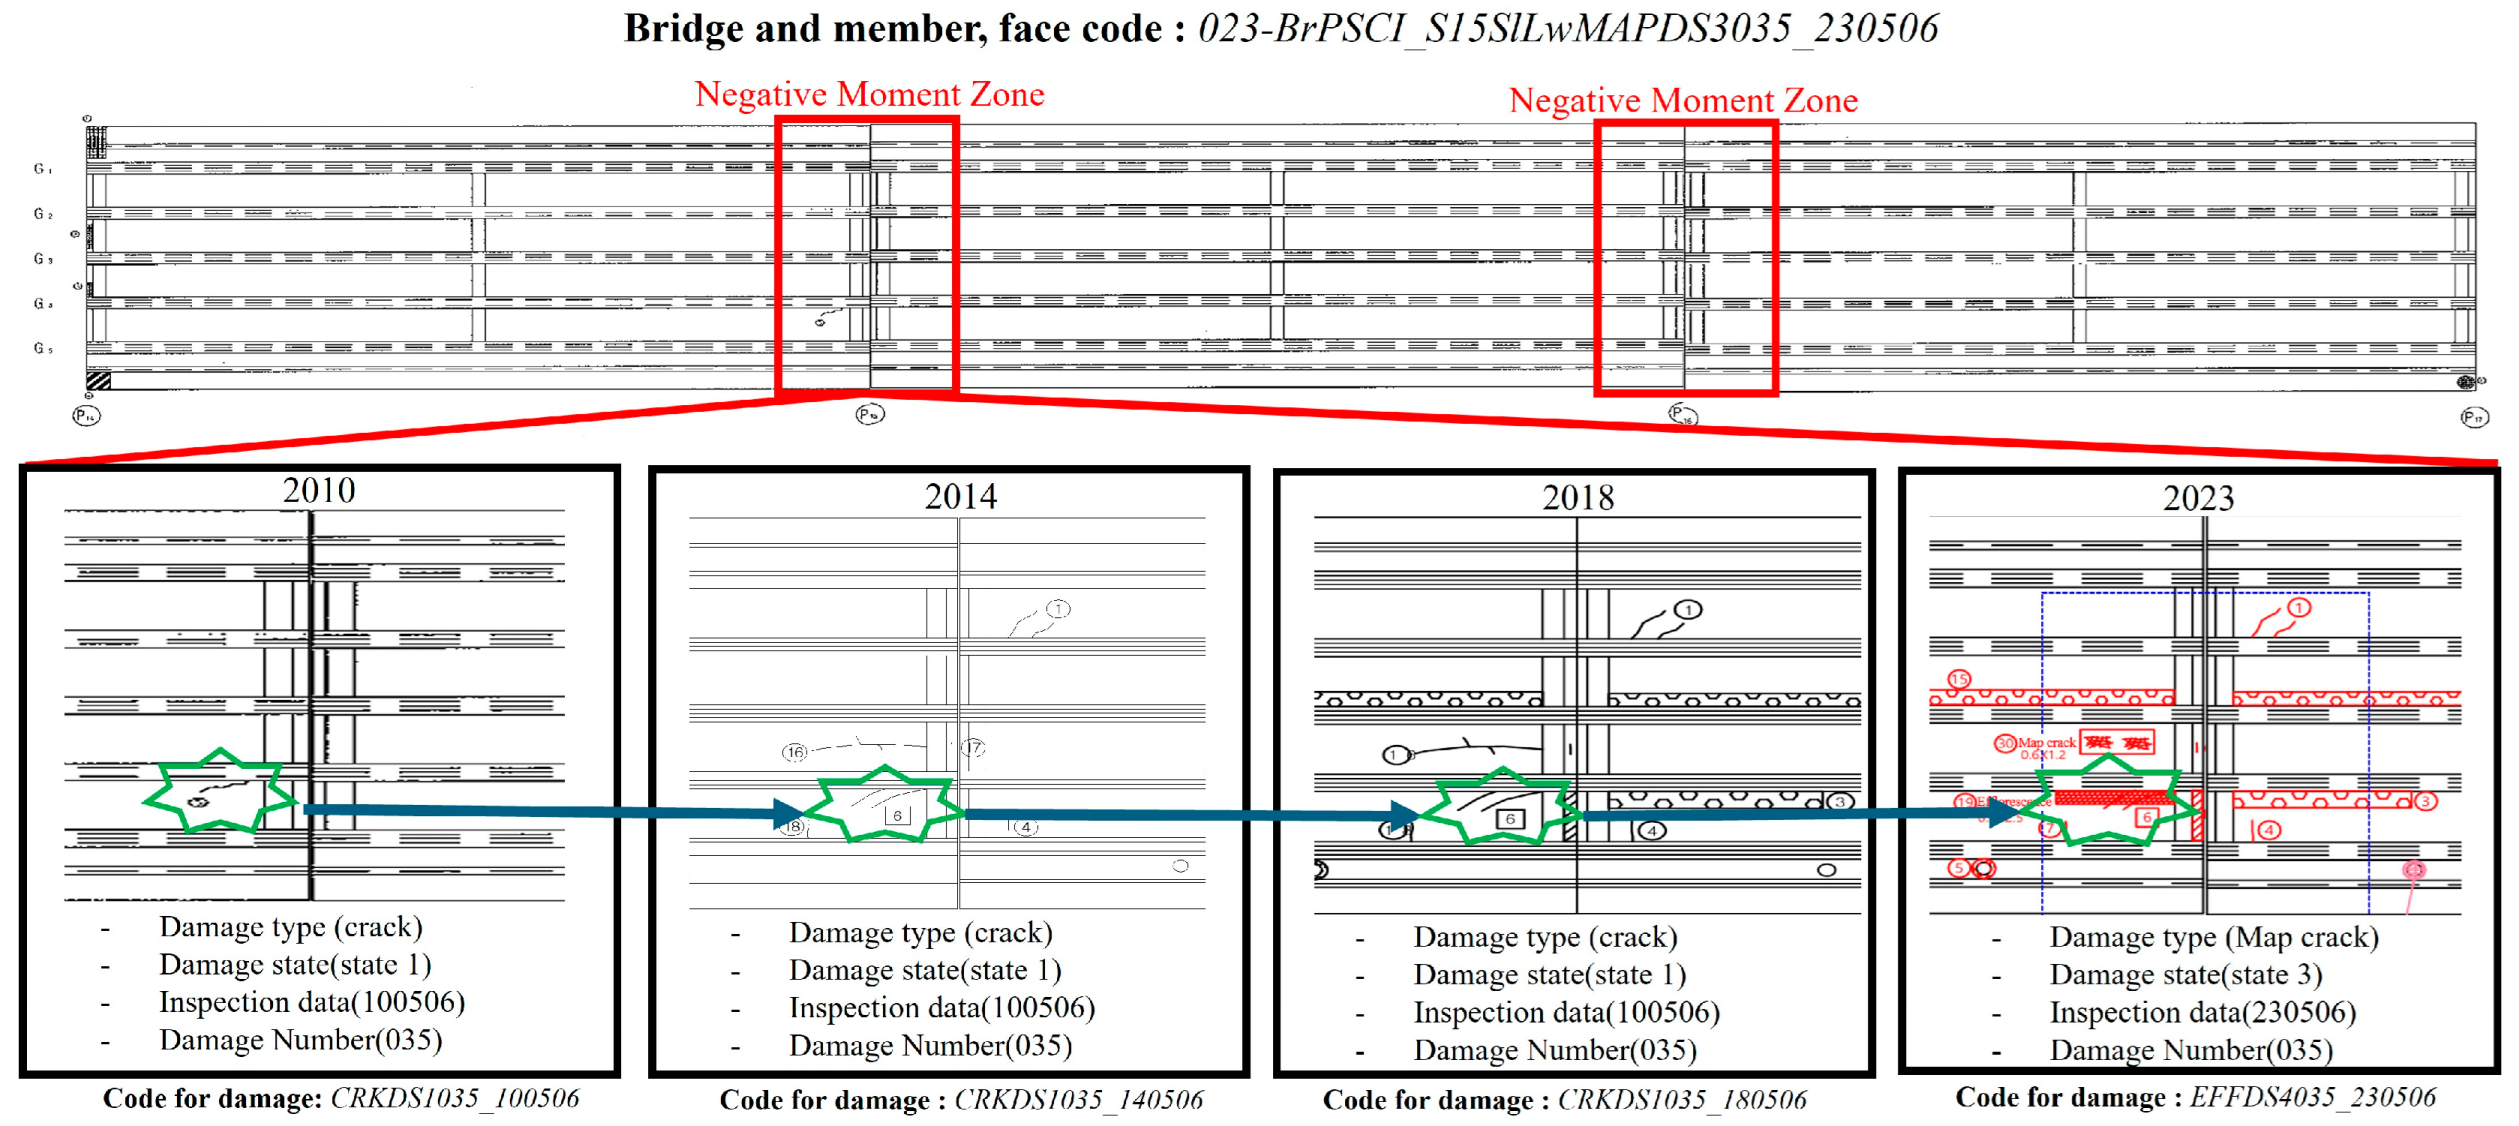
As illustrated in Figure 2, data obtained from current bridge inspections are usually presented in two-dimensional drawings. These drawings are valuable because they systematically record the type, location, and extent of the damage and summarize the information in a usable data format. Although it is difficult to track the progression of individual damage over time, it is possible to retrospectively analyze the final state of the damage. As these drawings are produced at regular intervals, a method has been developed that enables automatic data extraction, facilitates more efficient integration into digital bridge management systems, and increases the potential for damage propagation analysis.

3.2. Digitalization of the Damage Report of the Bridge Slab

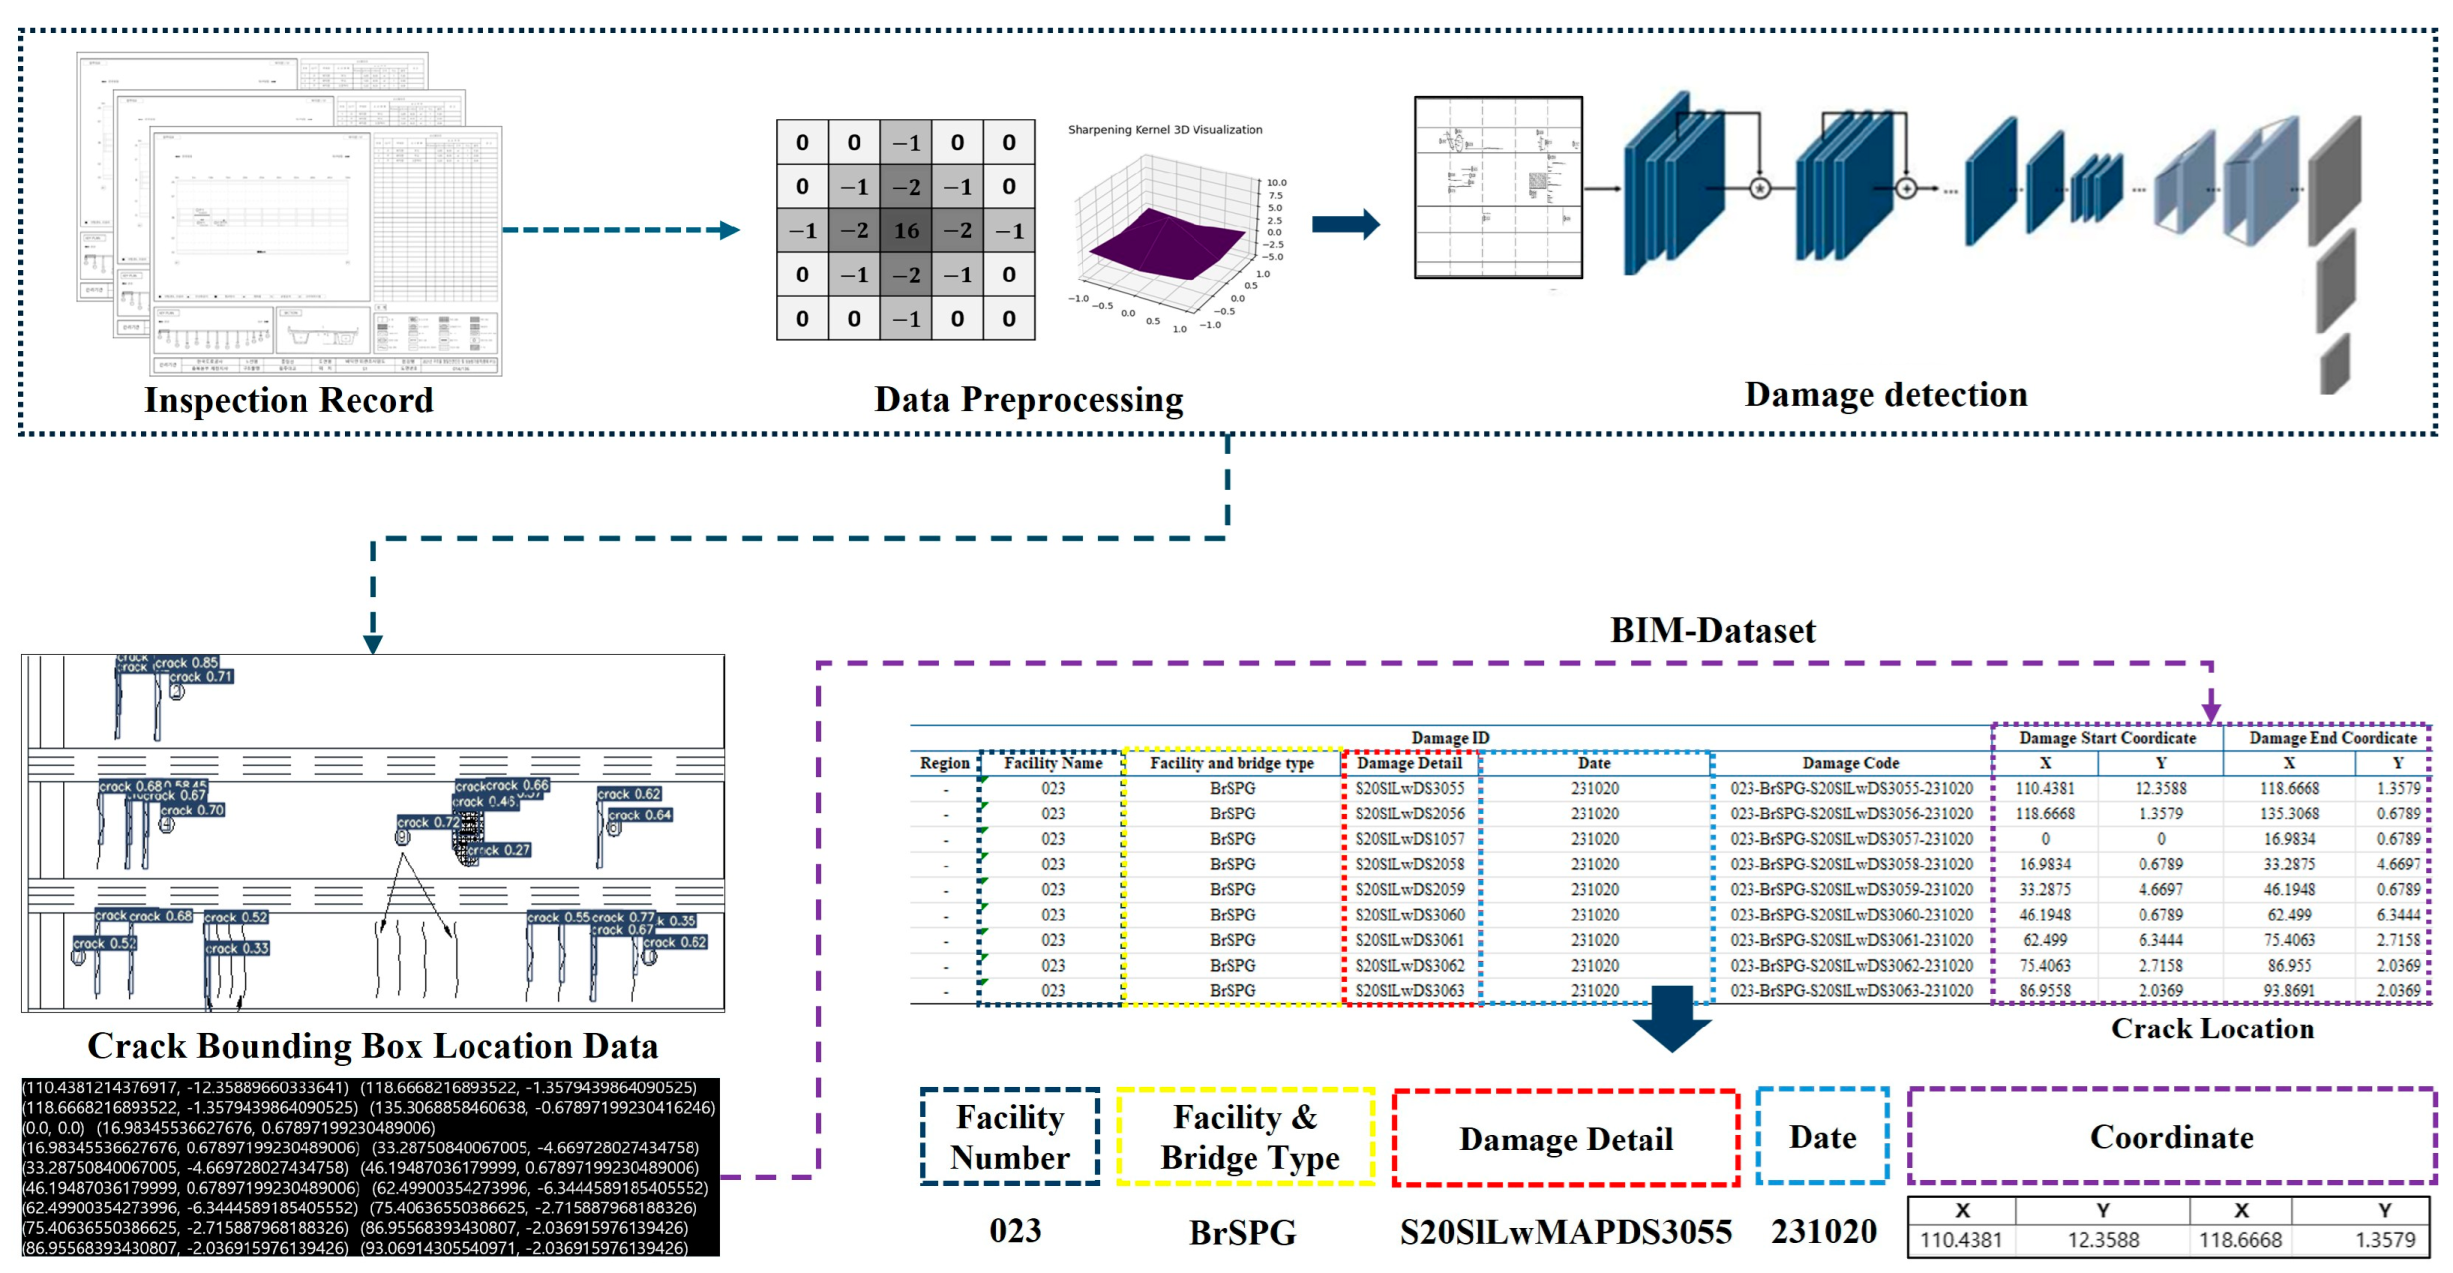
The damage to the bridge slab was initially documented by manual field inspections. The 2D images of the damage report were then used to extract the coordinates of the damage location using the YOLOv7 deep learning model [27] Instead of relying on two-stage models such as Mask R-CNN, which typically necessitate large-scale annotated datasets and considerable computational resources, this study employs the YOLOv7 model [28], which offers competitive object detection accuracy and rapid inference speed, even under limited data conditions. The results were digitized using the process illustrated in Figure 3. The main hyperparameters used to train the YOLOv7 model are listed in Table 3. To extract the coordinates of the damage location coordinates, RoboFlow was used to create a dataset consisting of 10,000 data pairs of images and JSON files containing Bounding Box coordinate information.
Image preprocessing is essential to improve the performance of image-based object detection. In this study, sharpening was applied to highlight the object boundaries and clarify their shapes [28]. Once the preprocessing step is completed, the dataset is divided into a ratio of ‘Train: Validation: Test = 7:2:1’ to prevent model overfitting and improve the generalization performance, after which the object detection model is trained [29,30]. Through this process, the damage locations on the bridge slab can be detected, and the corresponding Bounding Box coordinates can be extracted. Consequently, the damage report was digitalized.

3.3. Maintenance Model for Damage Objects

The bridges in operation have accumulated damage reports over long periods of time. An inspection was performed every 2 years, and a detailed assessment was carried out every 4 years. As shown in Figure 4, the recorded damage data must be digitized for data analysis. The digital objects of a bridge serve as a platform for linking data. In CAD drawings for damages, quantitative data for damages are used for digitization. The photographs were collected by engineers to check the reliability of the recorded data. Essential data includes the damage pattern, location, quantity, time, and repair history. The digitization of the inspection report requires a huge investment.
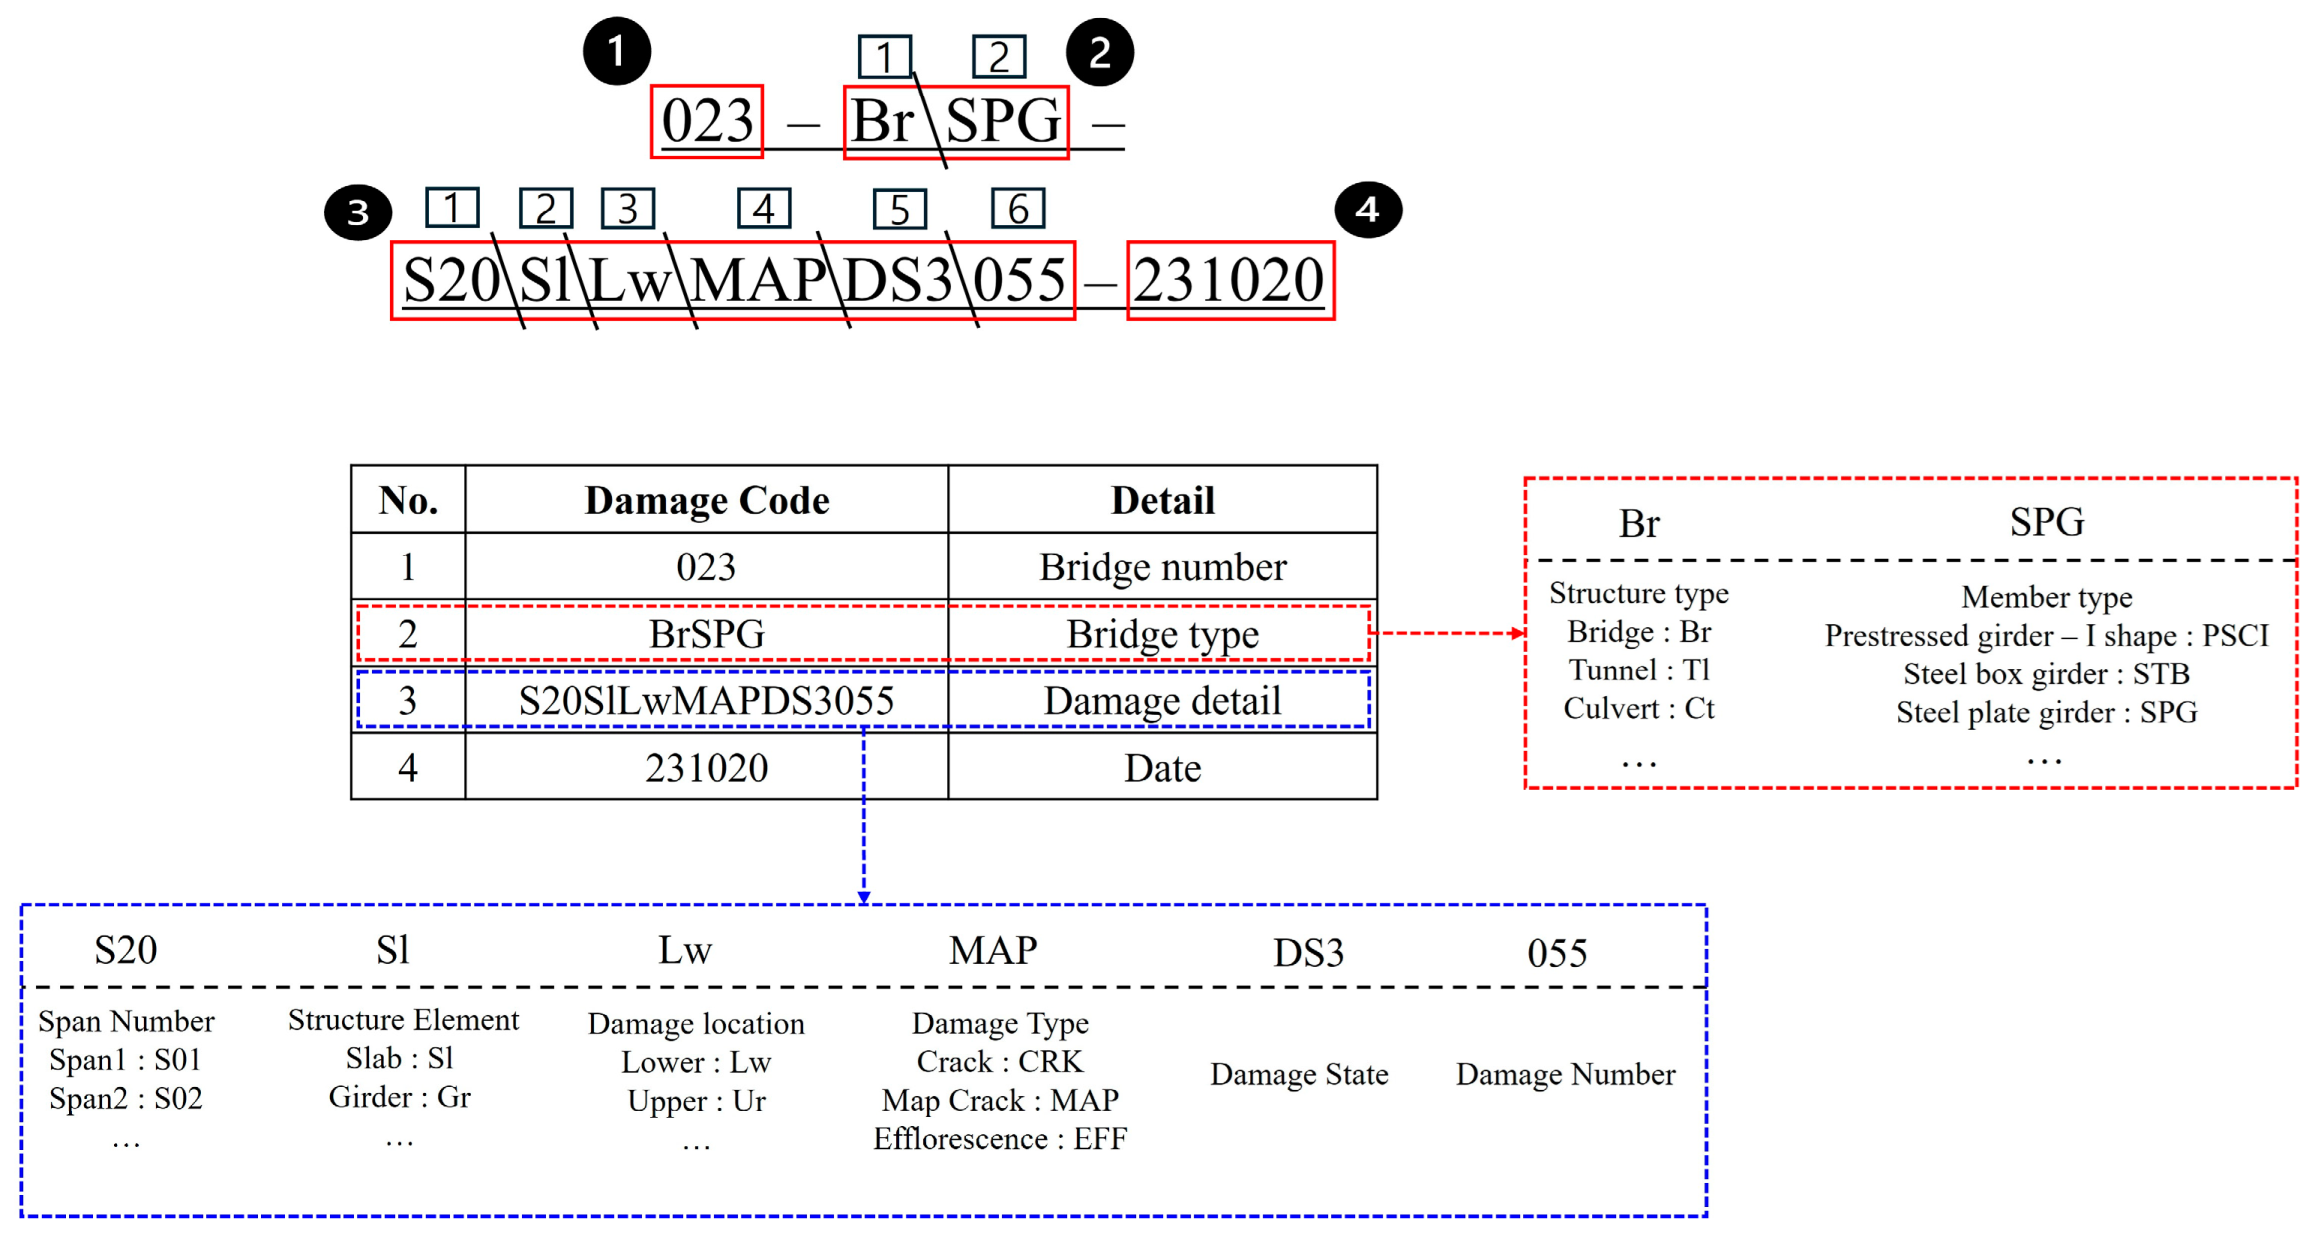
For network-level decision making in bridge maintenance, it is necessary to define a code system for a certain object and its damage. Figure 4 shows the code system used to define the damage. In practice, the bridge members have their own code numbers, damage conditions, grades, and dates. In current inspection practice, each damage has defined grades such as A, B, C, D, and E. Only critical damage has these codes to minimize the cost of digitization. When this code system is used to record damage, the future performance of a structure can be predicted based on the recorded history of existing structures.s
The existing 2D-based mapping systems for visual inspections do not account for the actual scale of the structure. Damage legends were marked on the plan by the inspector according to the relative scaling and managed by recording their relative positions. For bridges, the damage records are managed separately for superstructure and substructure. The superstructure was managed by span units, whereas the substructure was divided into piers and abutments. Because the damage codes have been previously defined, this information must be input accordingly. The information template is similar in composition to an existing input system for visual inspection mapping. The data consists of three main components: Damage ID, Damage Location, and Damage Information.
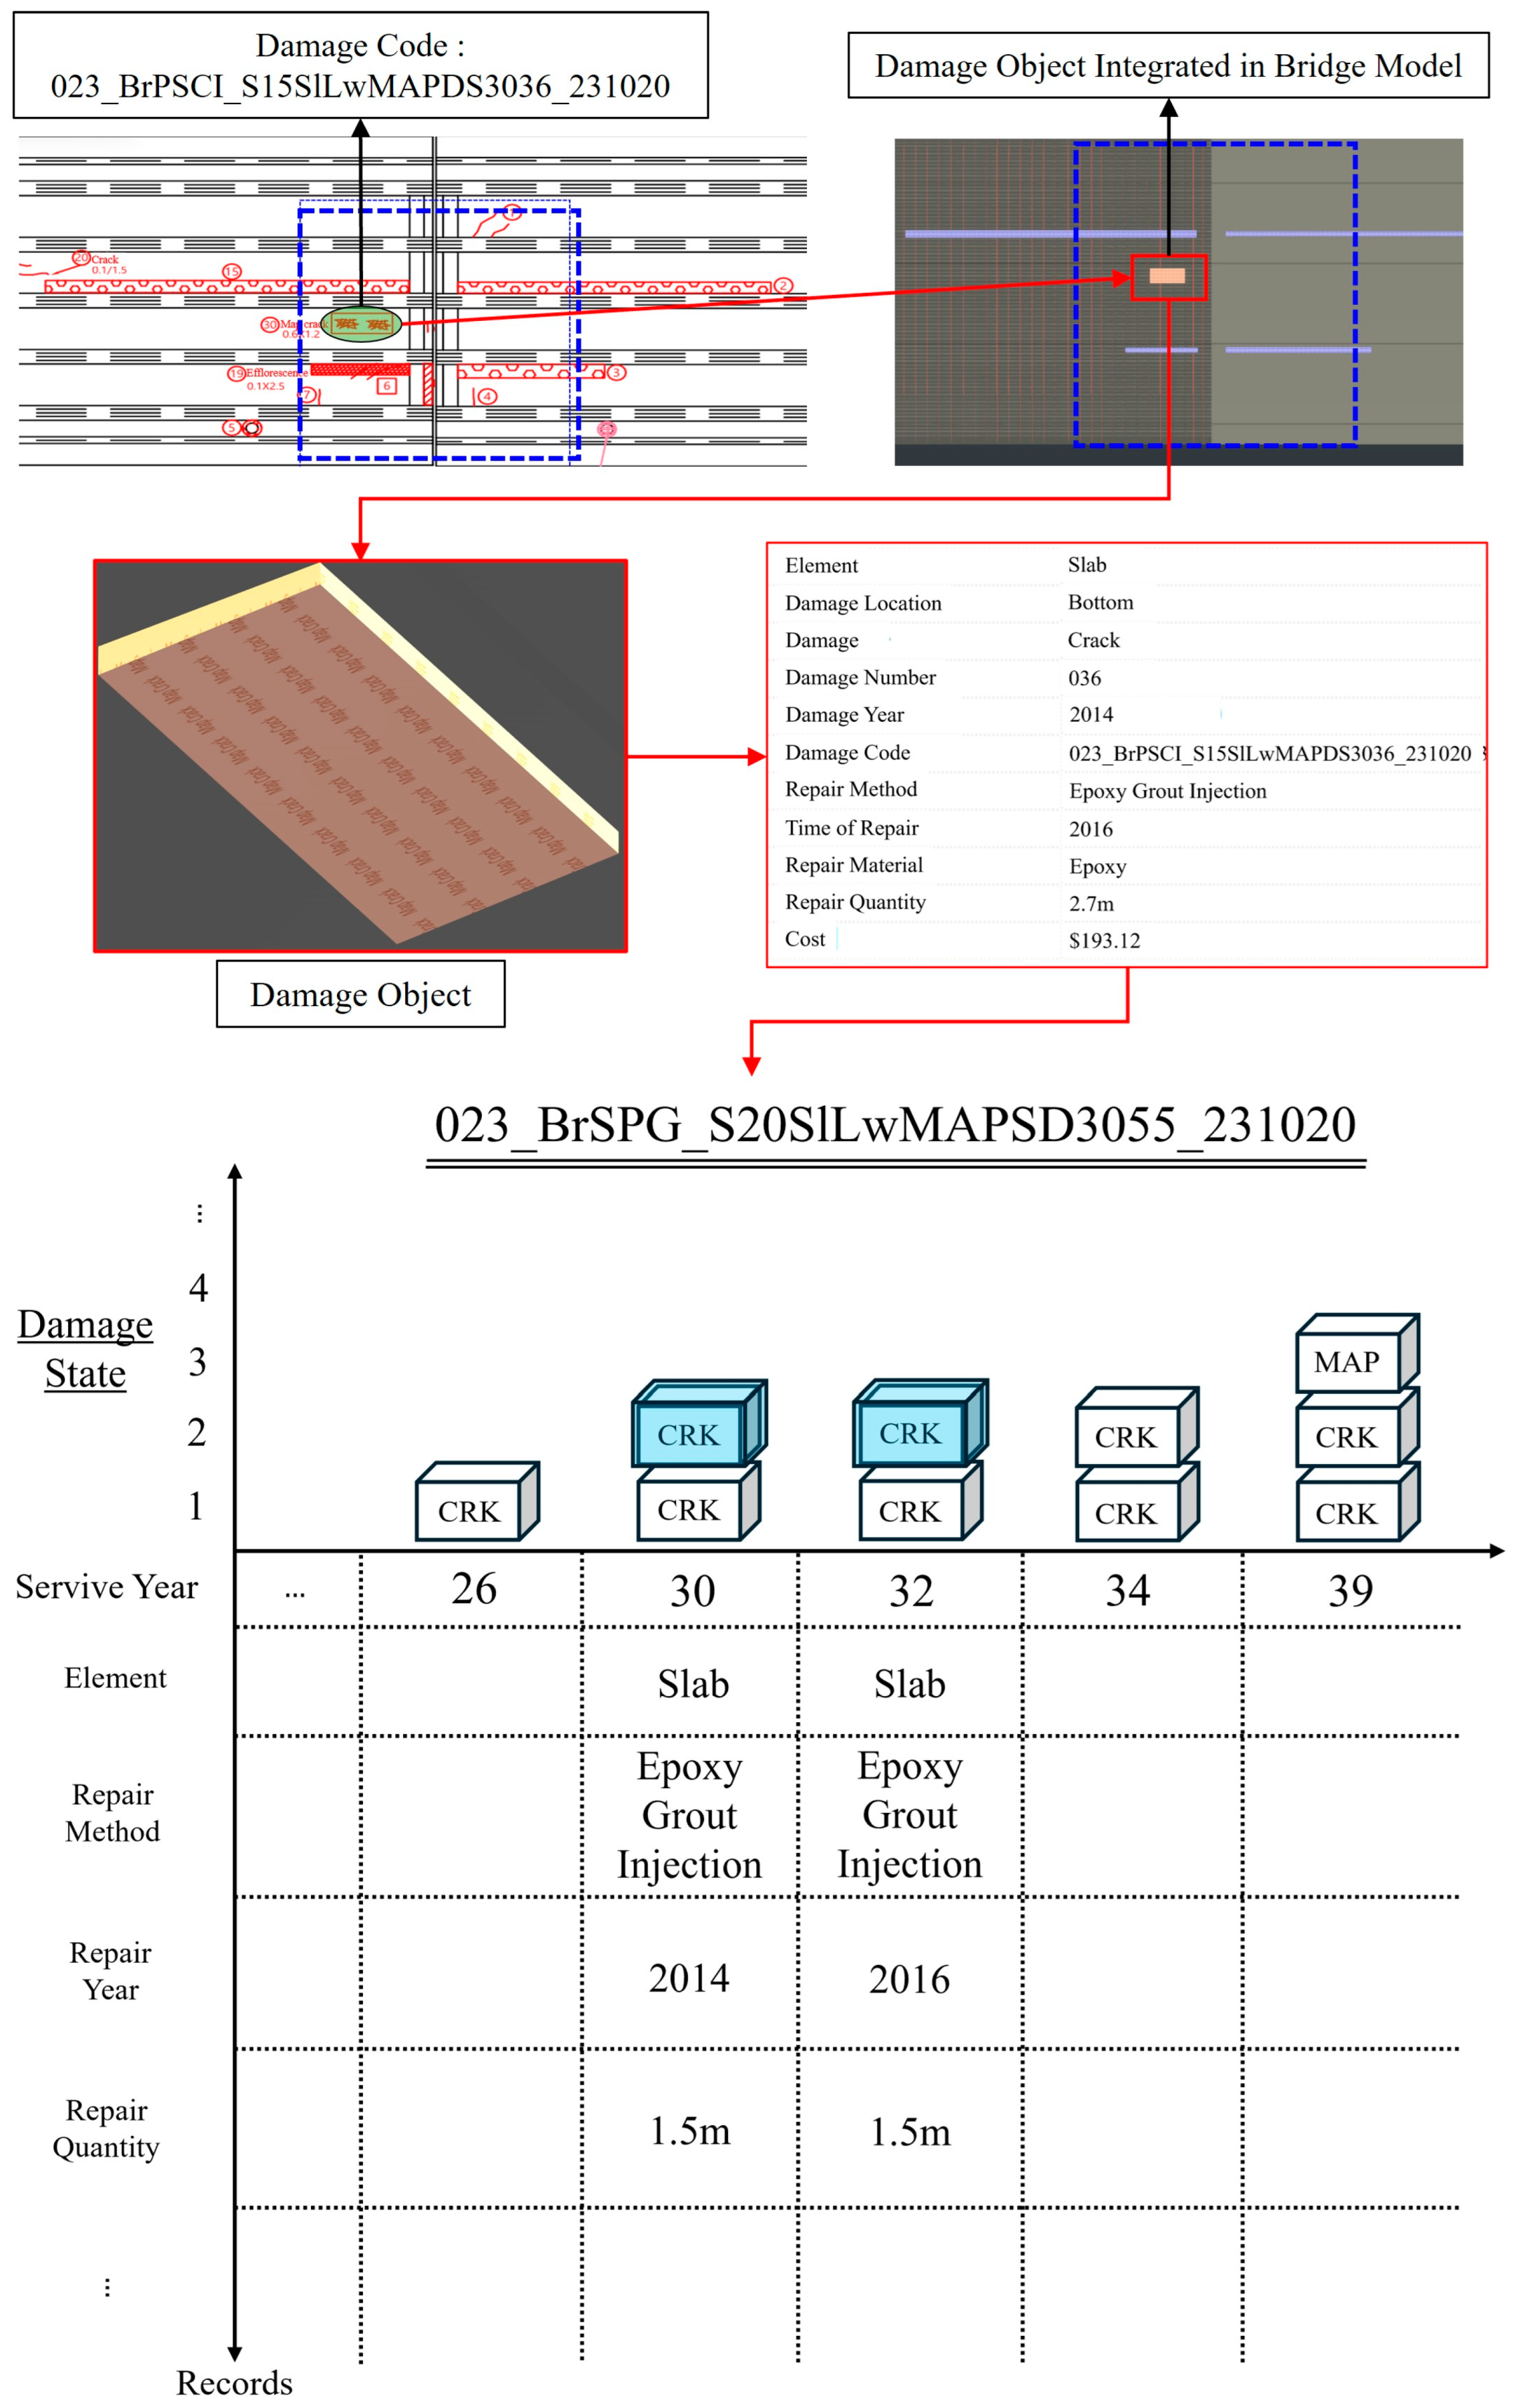
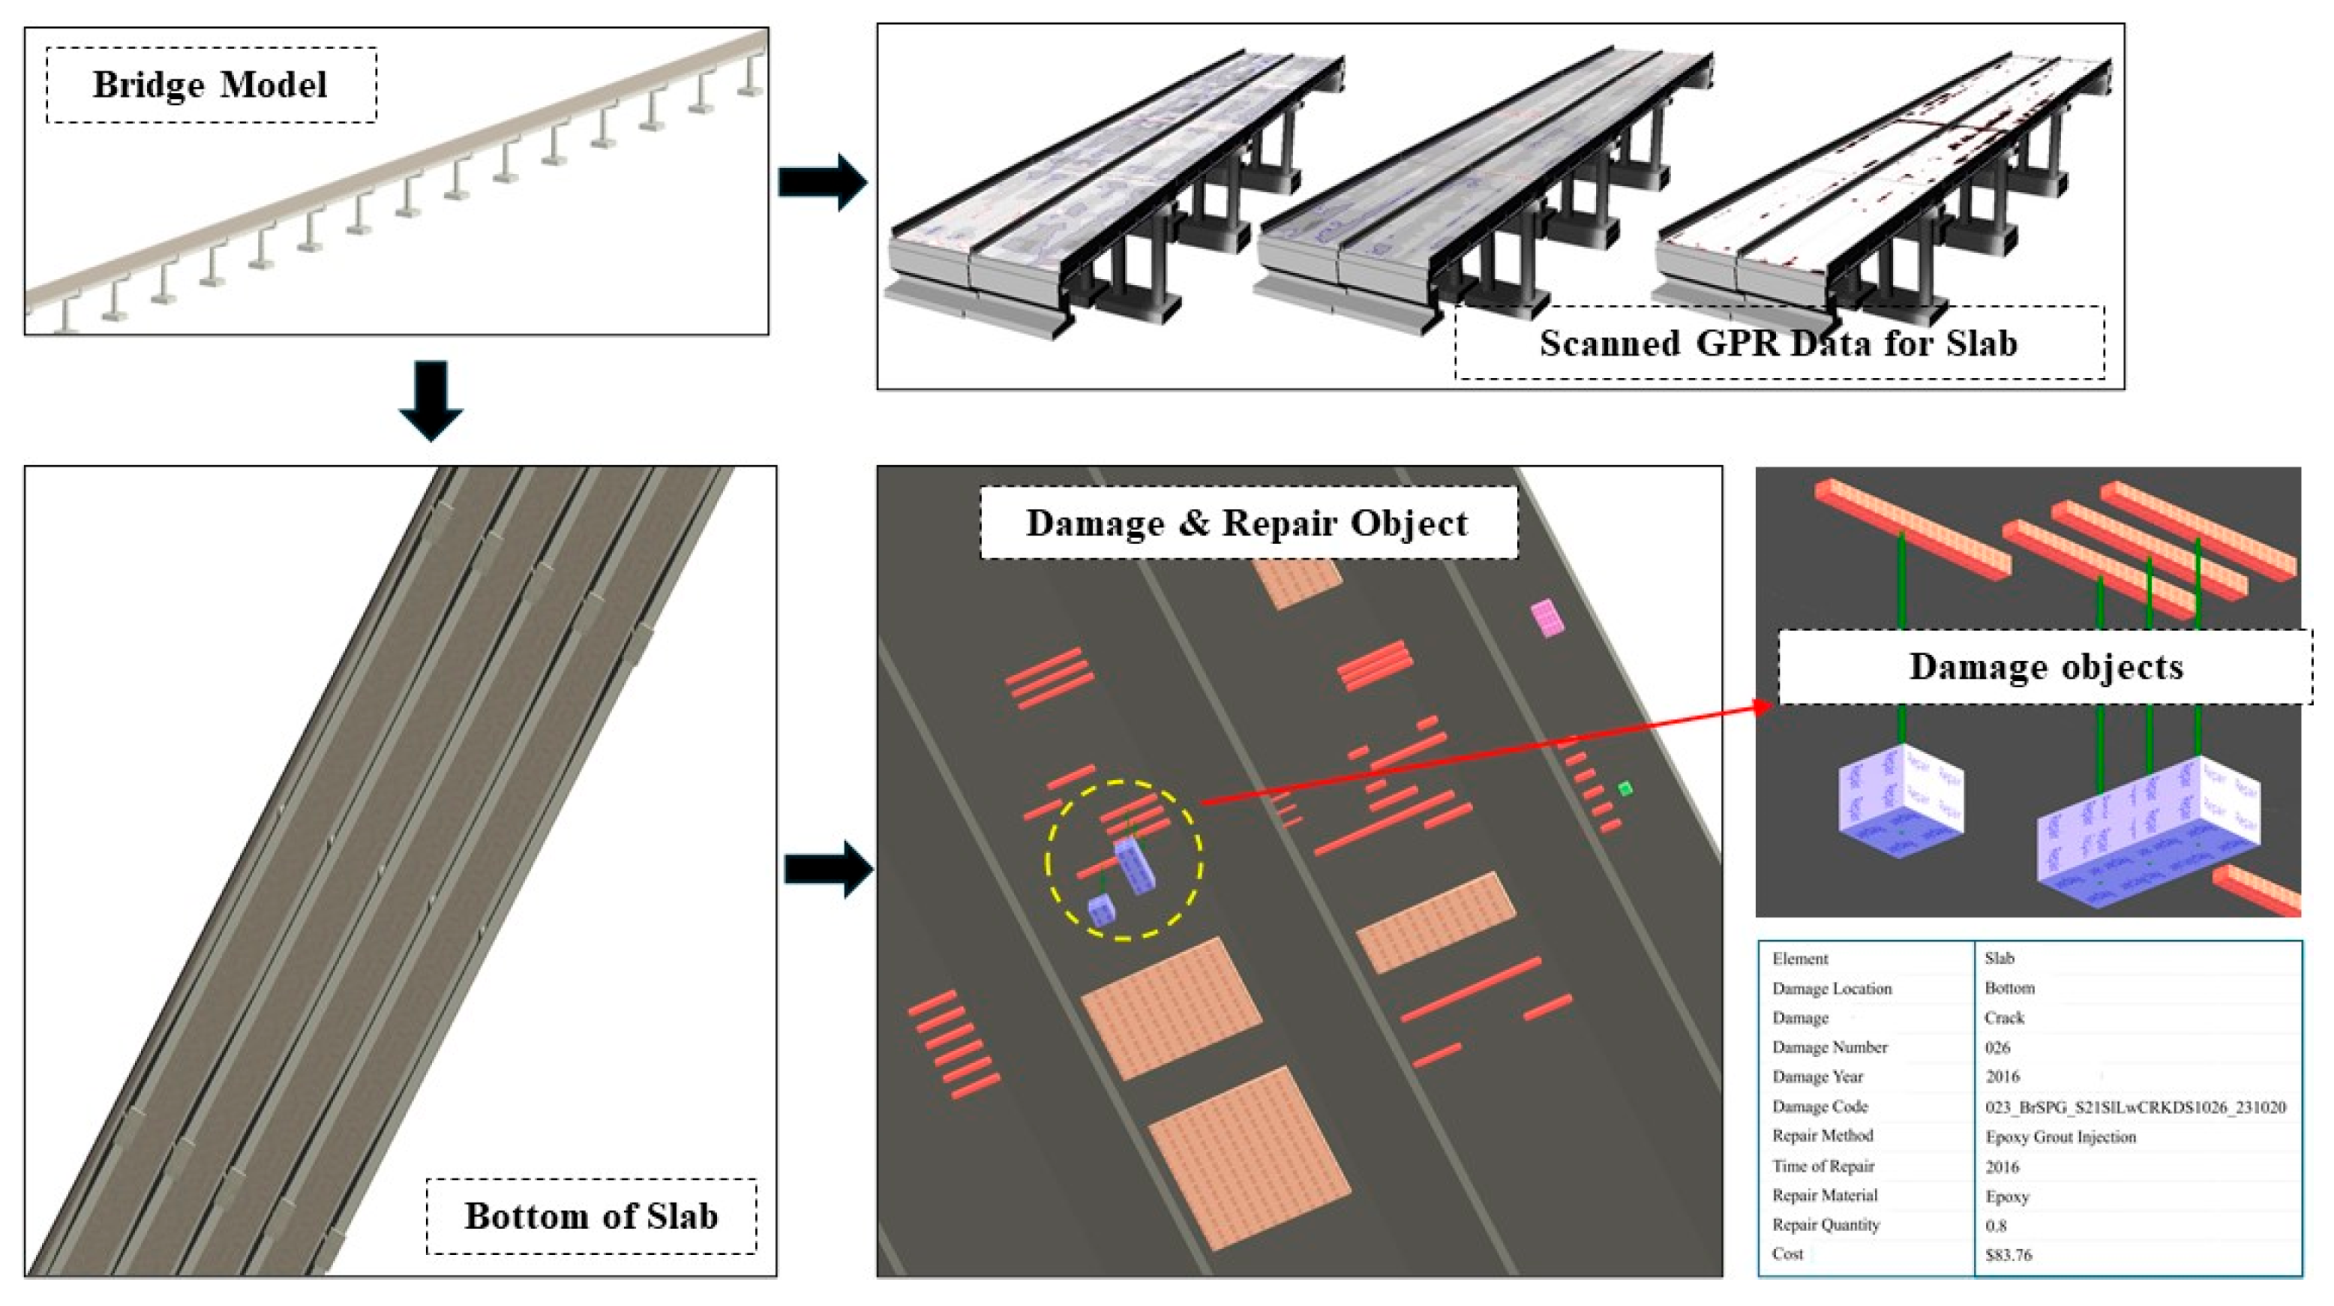
The Damage ID contains data related to the damage code and the code itself. The Damage Location requires the input of X and Y coordinates based on unique reference points for each damaged surface. When creating a data template, the BIM model must align with the actual bridge dimensions. Therefore, a coordinate system was created for the damage that corresponds to the real-world dimensions. Finally, the Damage Information is entered in the format used in the visual inspection mapping system and linked to each information object model. The information object model for the generated deterioration model was integrated into the 3D bridge model based on the location data from the information data template (see Figure 5).
These algorithms can be broadly divided into model generation and data organization. Starting with the data organization, the process is as follows: First, the user specifies the information data template and the year. By specifying the year, the user can view the damage and repair information limited to that year. Secondly, the information data received are used to create a dictionary using the damage code as the key and the damage and repair information as the value. Once the data are formatted into a dictionary, the corresponding information can be accurately retrieved when the damage code is entered.
Once the information dictionary is created, the damage and repair data are layered. As this process involves processing large amounts of damage and repair information for an entire bridge, the correct classification of this information is essential. Each layer of the information data is divided into a superstructure and a substructure, with the first level classified according to each damaged surface. On the second level, the superstructure is categorized by the span, whereas the substructure is categorized by abutments and piers. At the last level, the data are classified according to three types of deterioration models. Ultimately, the classified information data remains in the form of damage codes. These damage codes, which are categorized by each piece of information, become the keys that ensure the correct information model is loaded when the information object model is integrated into the bridge model. Finally, the information model is integrated into the bridge model, as shown in Figure 6 and Figure 7. As each integrated information model contains time information, the users managing damaged bridges may be able to check when the damage is repaired, the damage code, and other relevant details.
The proposed framework for defining the service life of a bridge slab using digitized maintenance records marks a fundamental advancement over conventional BIM, including extended 6D and 7D BIM frameworks. While 6D and 7D BIM enhance traditional 3D modeling by incorporating time, cost, sustainability, and maintenance data to support the lifecycle management, they generally function as static or semi-dynamic systems. These models typically depend on predefined deterioration curves and scheduled updates, lacking the capacity to incorporate detailed, time-stamped data from successive inspections. In contrast, the data-driven digital twin framework enables real-time or near-real-time integration of inspection-derived damage objects—such as cracks, efflorescence, or rebar exposure—mapped directly onto 3D structural models. This dynamic and iterative linkage supports the continuous tracking of individual damage instances over time and facilitates the inference of deterioration patterns, as demonstrated in the digital twin development stage [30]. The core distinction lies in the digital twin’s ability to deliver automated, data-rich, and feedback-responsive modeling of actual deterioration processes, thus transcending the static lifecycle assumptions inherent in existing BIM methodologies.

4. Case Study

4.1. Deteriorated Bridge Slab with Different Girder Types

The procedures and methods developed in this study were applied to a highway bridge with a service life of 40 years. The bridge structure consisted of 17-span PSC-I girder sections with a span length of 30.6 m, and 5-span plate girder sections with spans of 55.5 and 60.5 m. In the PSC-I girder section, the spacing between the girders was 2.3 m, whereas in the plate girder section, it was 4 m. The reinforced concrete slab was designed with a compressive strength of 27.0 MPa, and non-destructive testing (NDT) conducted during the diagnosis showed a strength of 28.4 MPa—approximately 5% above the design value. The concrete cover was 40 mm and the maximum measured carbonation depth was 16 mm. The thickness of the concrete slab was 250 mm in the PSC-I girder section and 320 mm in the plate girder section. The steel reinforcement of the slab consisted of D19 bars with a spacing of 250 mm. At the time of design, the safety factor for the strength limit state ( M n / M u ) was 2.07.
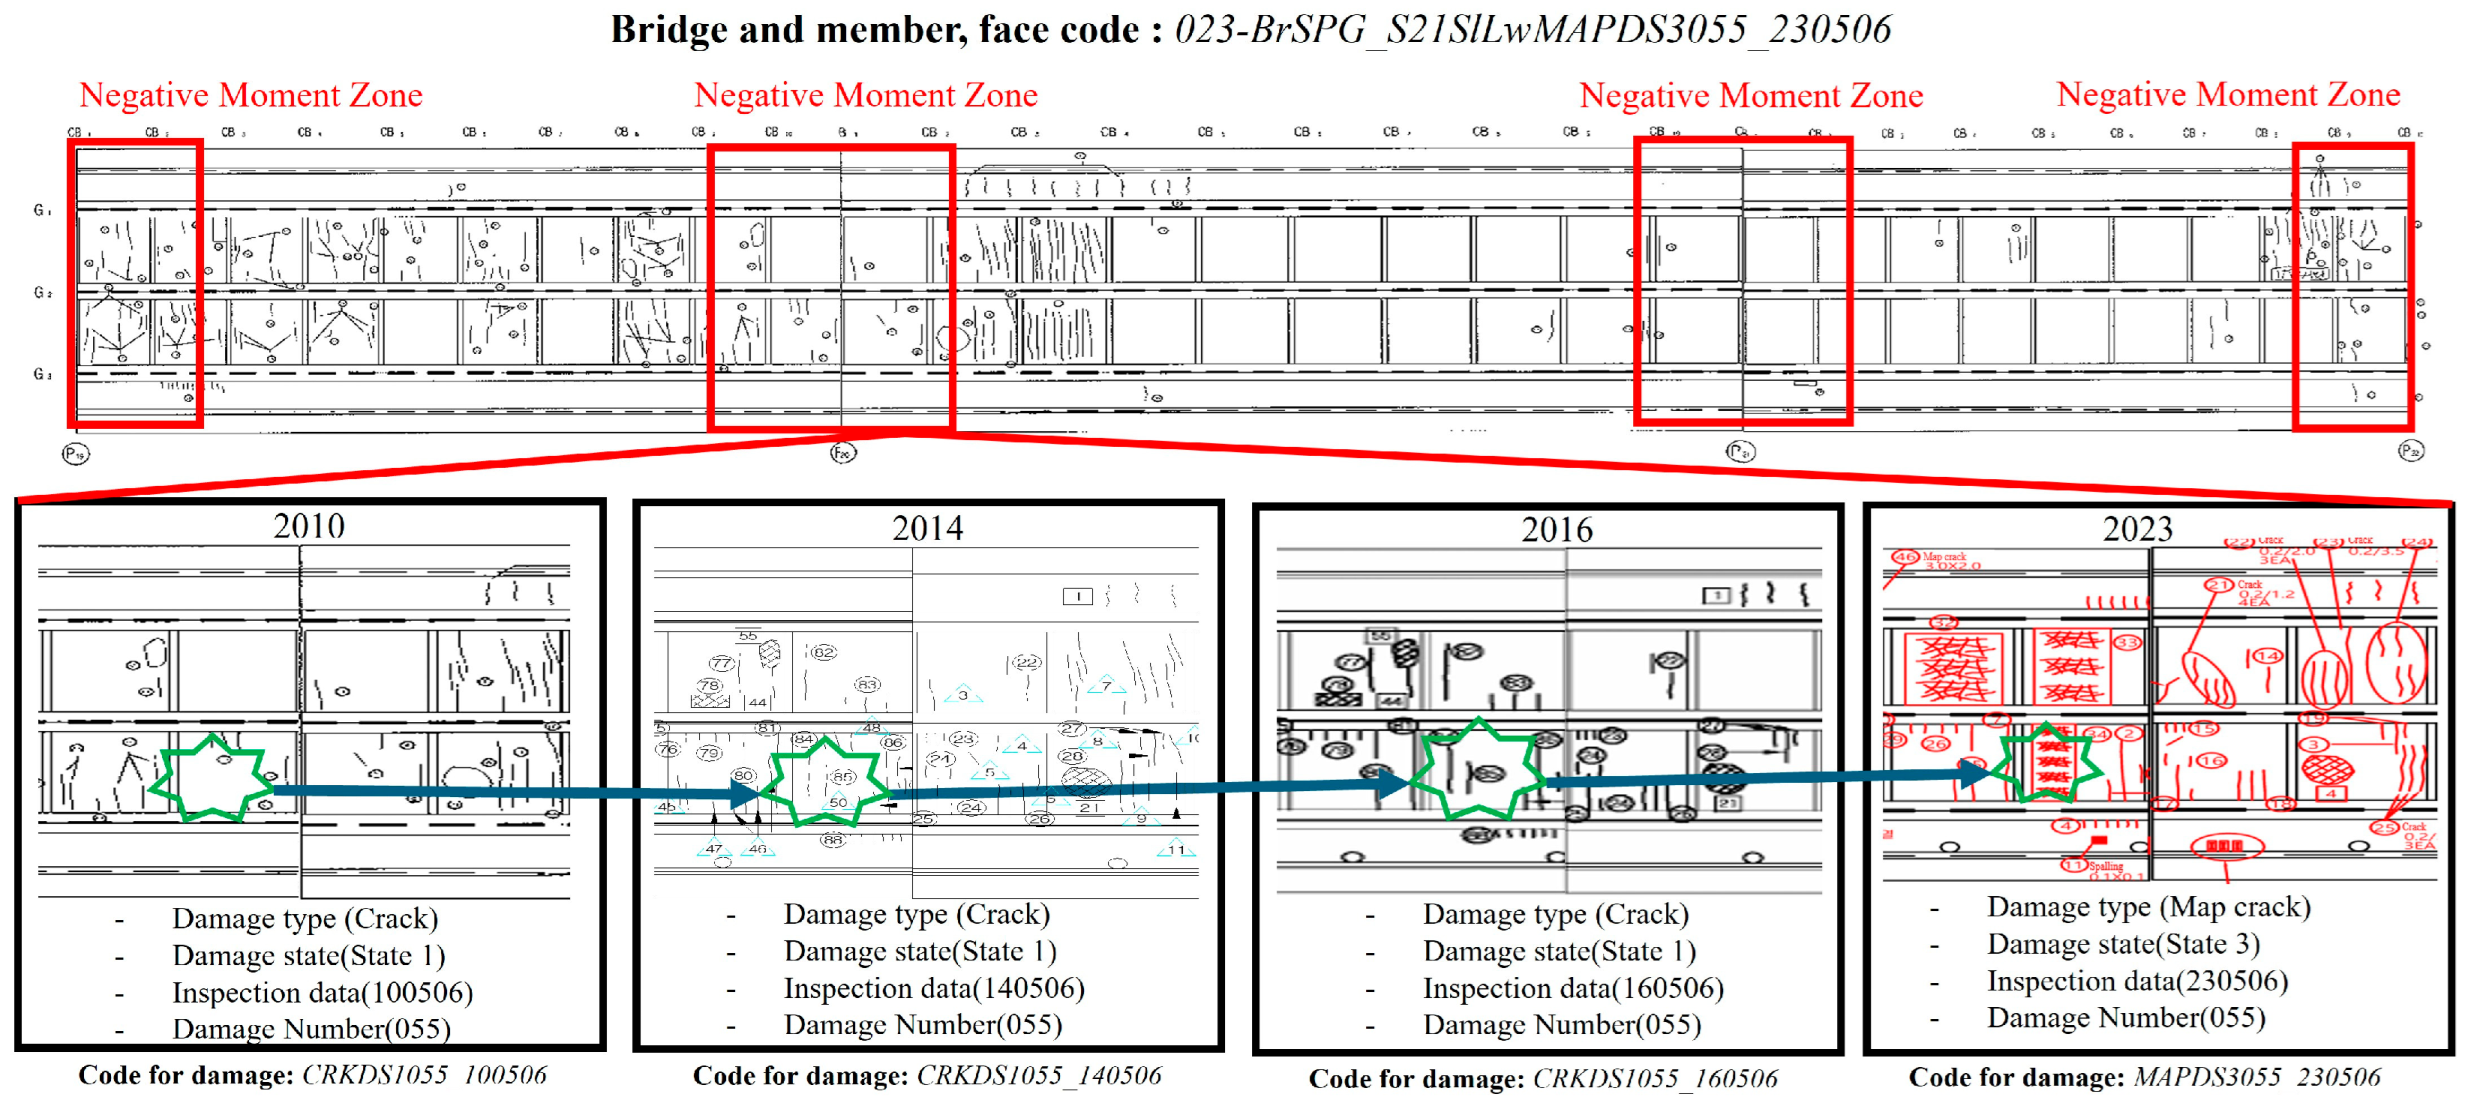
The bridge selected for damage modeling included both PSC-I girders and steel plate girders, which allowed for a controlled comparison where all the other factors except for the girder type remained constant. This configuration provides a unique opportunity to isolate and evaluate the influence of the girder type on the progression of the slab damage. Figure 8 and Figure 9 illustrate the temporal distributions of the slab damage types. These damage records were digitized using the method proposed in this study, allowing the modeling of individual damage progression over time.

4.2. Definition of Crack Damage and Repair History in Negative Moment Region

Current condition rating methods based on visual inspection integrate all damage types at the span level, which limits their ability to monitor the progression of individual damage types or track specific deterioration mechanisms over time. This generalization represents a significant drawback for maintenance planning and durability assessment. To solve this problem, a damage-modeling approach was introduced in this study that focuses on the transverse cracking in the negative-moment regions of bridge slabs. By isolating this specific damage mechanism, the model improves the understanding of the mechanical behavior and enables the classification of the causes of cracking, thereby supporting more targeted and predictive maintenance strategies.
Transverse cracks in concrete bridge slabs are usually caused by the constraining effects of the girders during the curing of the cast-in-place concrete. These early age cracks are influenced by the type of girder and the relative stiffness contrast between the girder and the slab. The subsequent propagation of crack damage under repeated vehicular loading is governed by structural parameters, such as the slab thickness, the girder spacing, and the frequency and magnitude of heavy vehicle traffic. If the cracks develop into map cracking patterns, they can cause secondary deterioration phenomena such as efflorescence, corrosion of the embedded reinforcement, and delamination of the concrete cover. The severity of this advanced stage of damage was assessed by measuring the depth of carbonation and chloride-ion concentration. Correspondingly, the progression of the deterioration is modeled using empirical formulations that relate the environmental exposure and material properties to the corrosion initiation and propagation behavior.
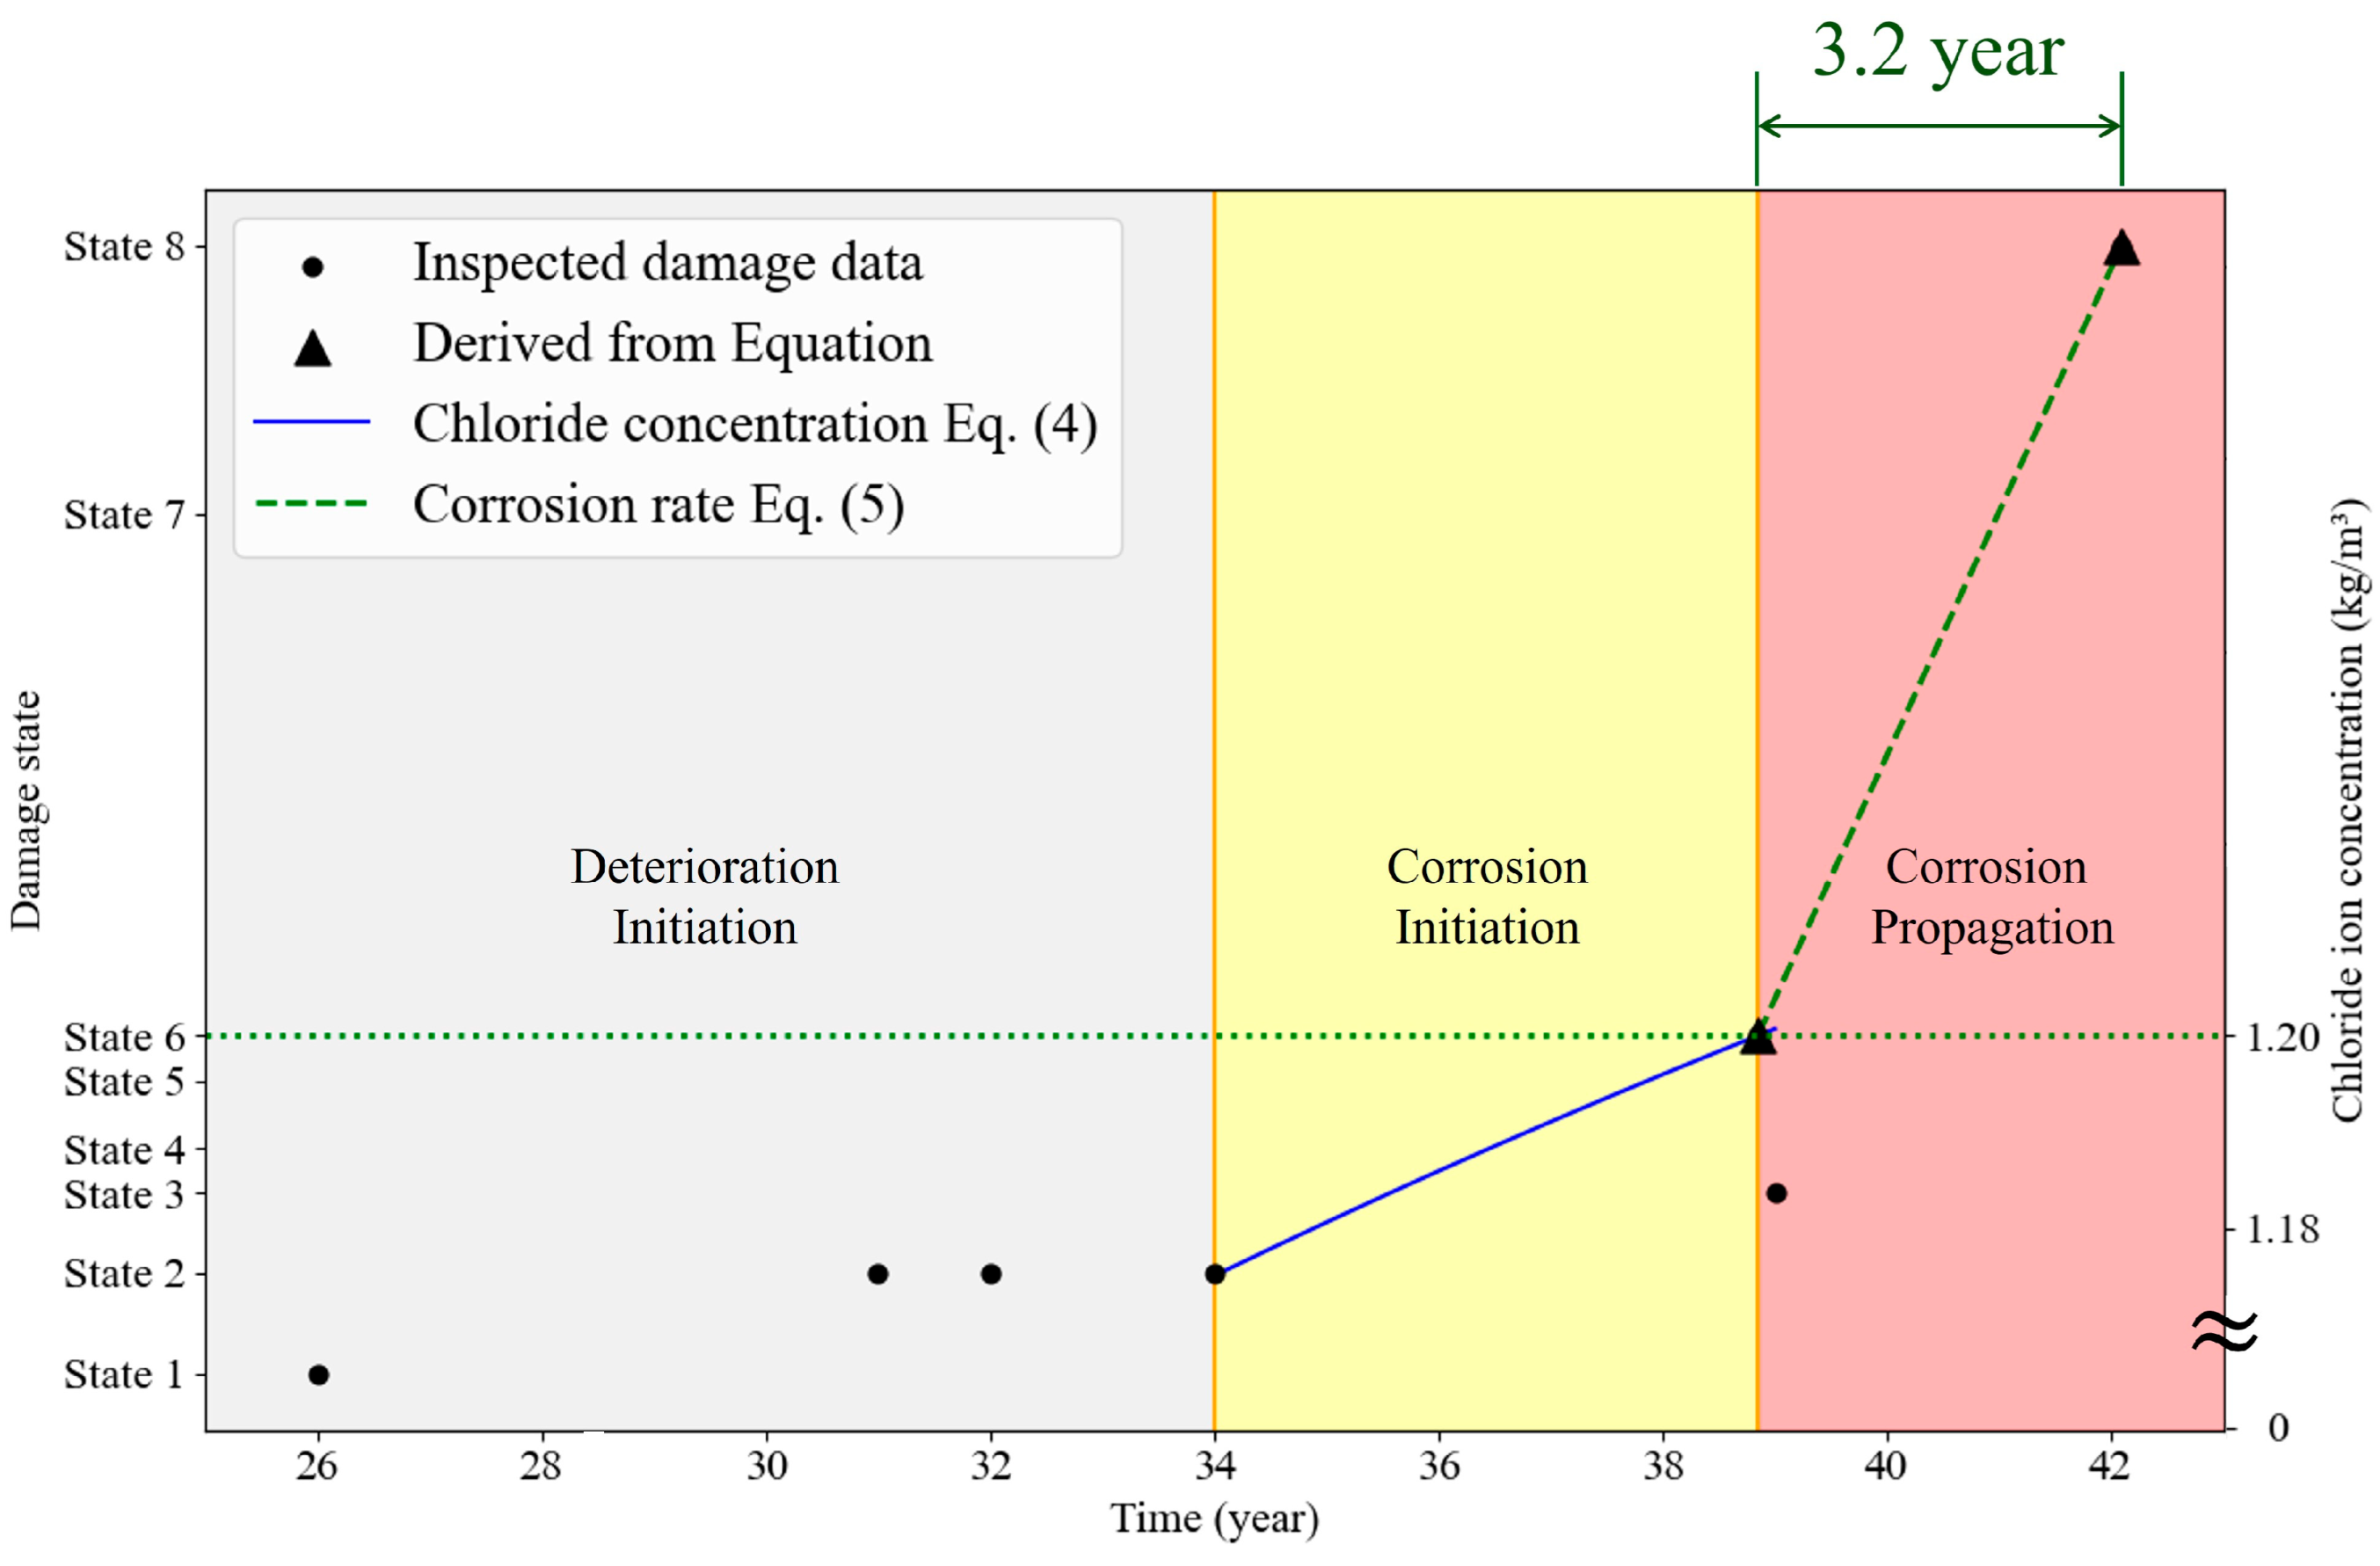
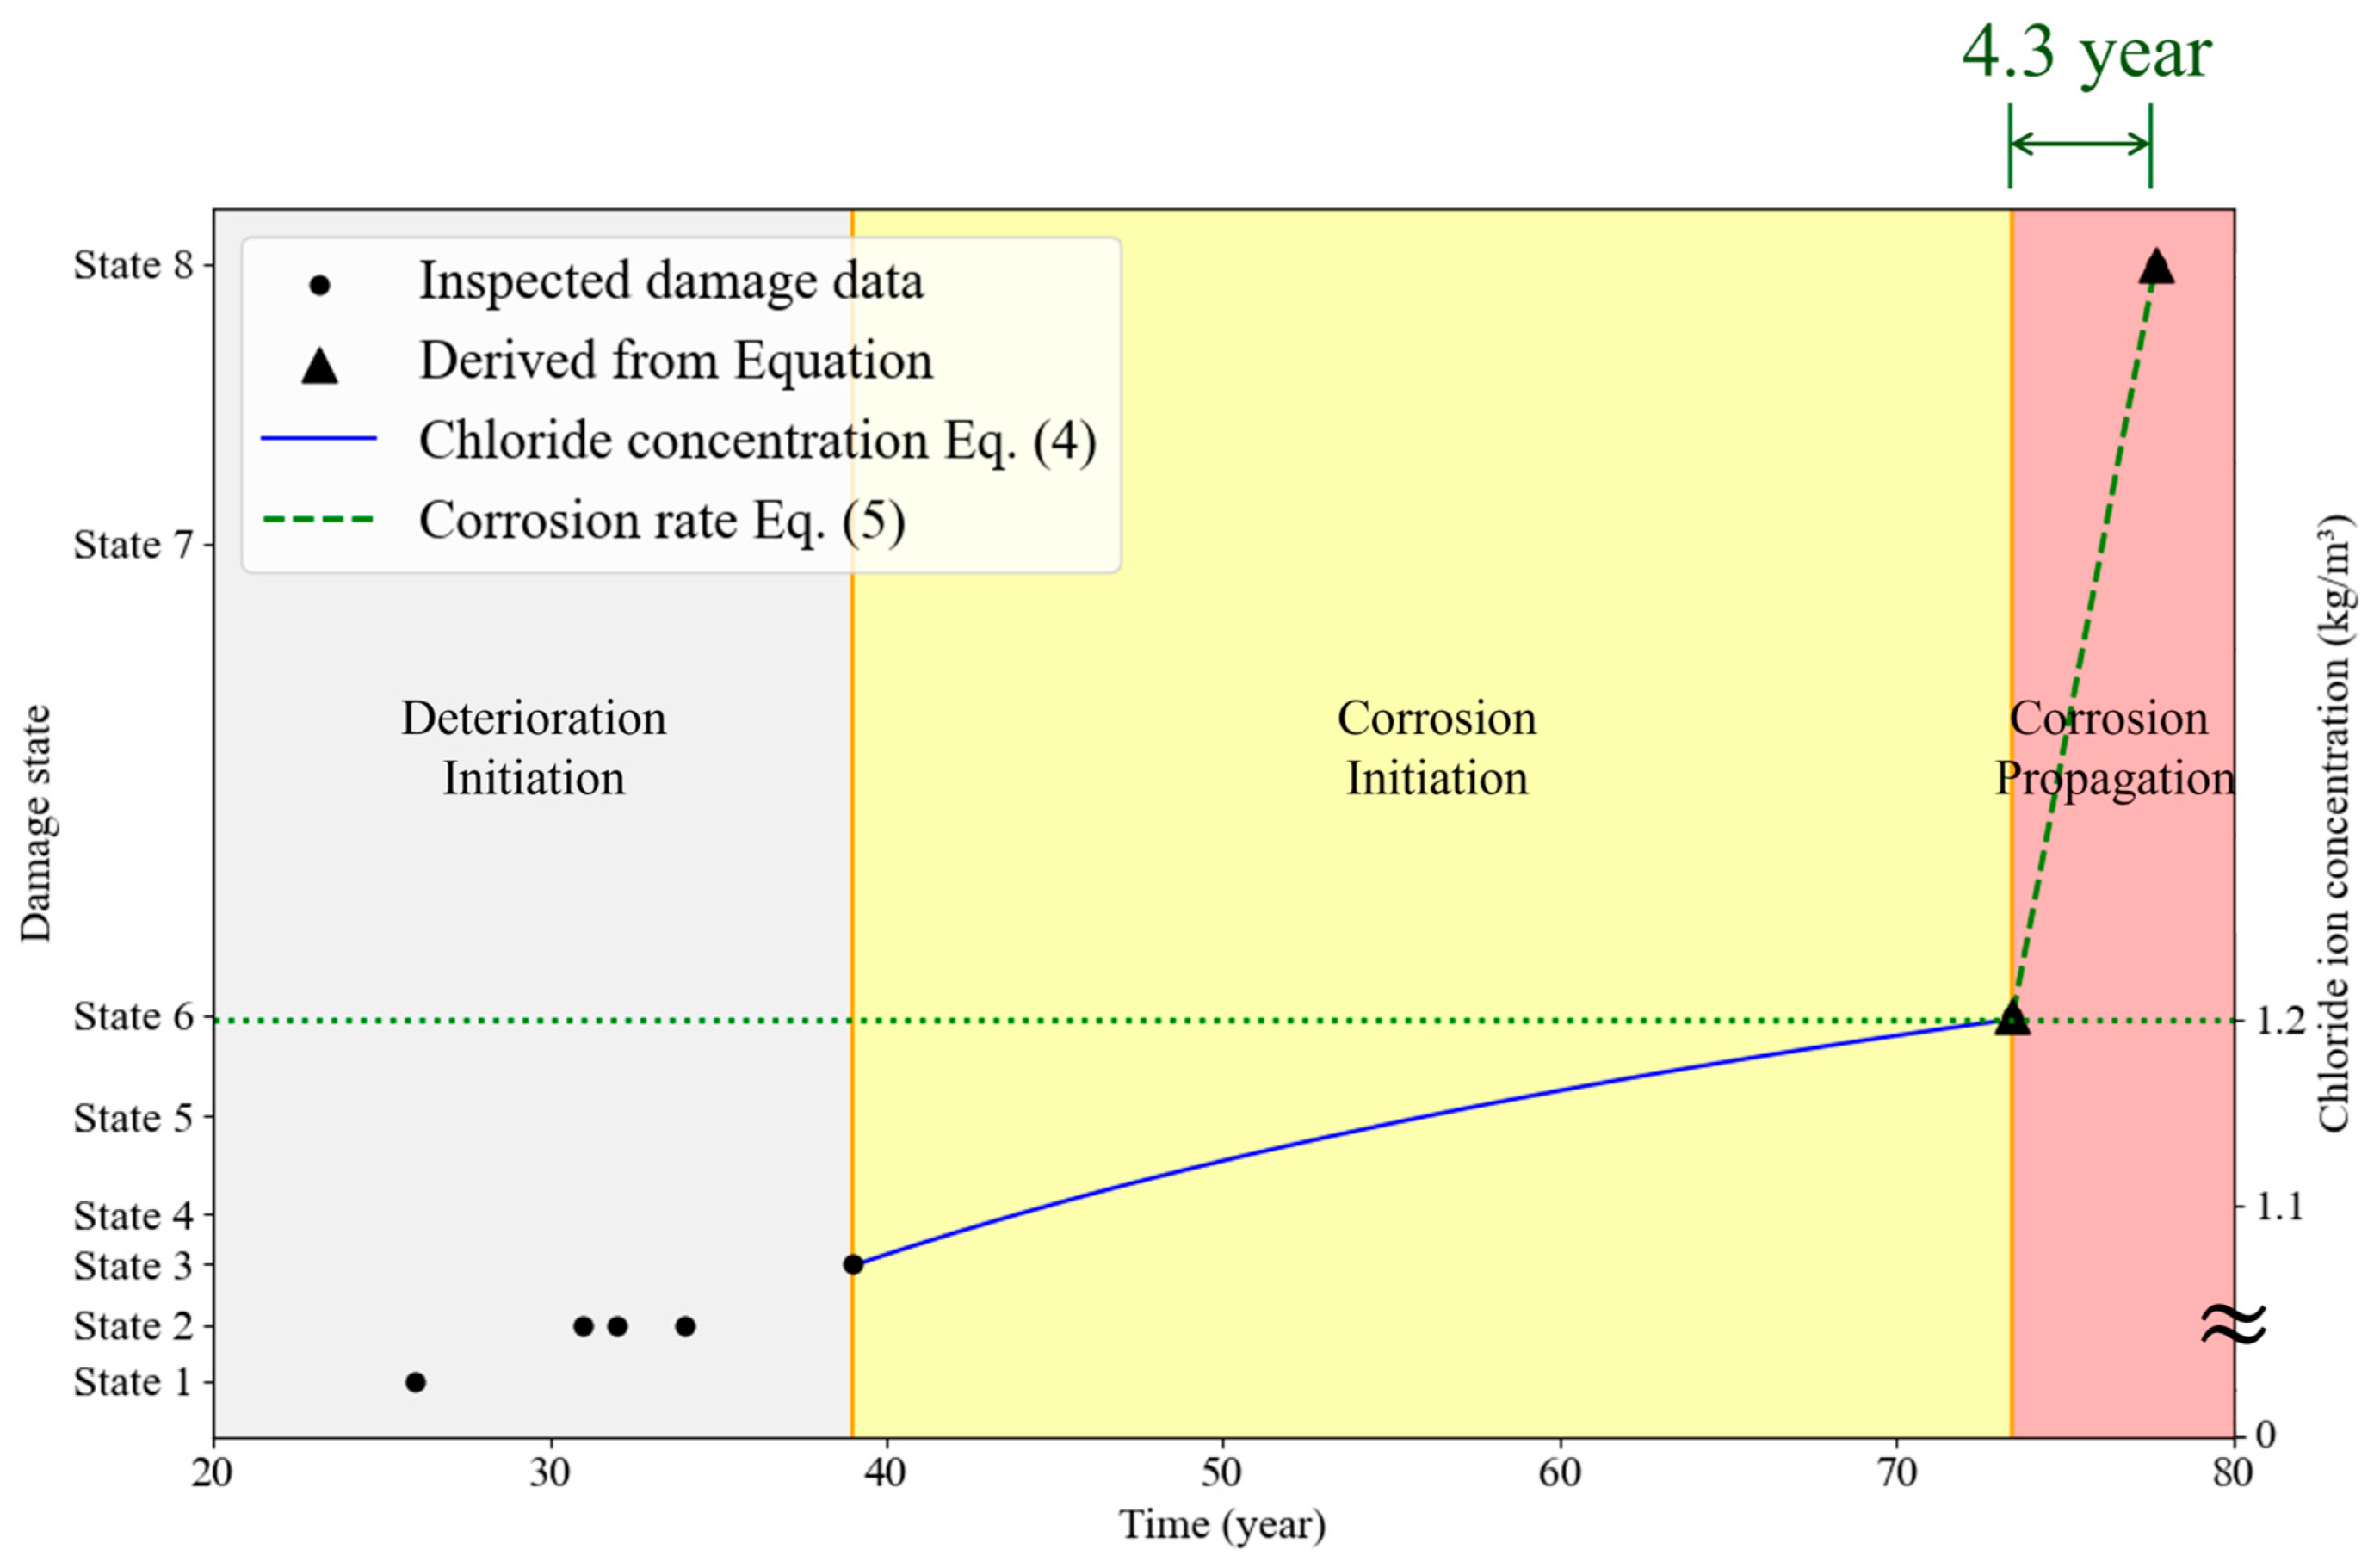
To implement the proposed damage model for bridge slabs, it is essential to establish a baseline model that is able to characterize the progression of eight distinct damage states. This basic framework was constructed using the damage data of bridge slabs supported by both PSC-I and plate girders. In particular, the damage evolution in the negative moment regions, where cracks usually occur, was selected for detailed modeling. As shown in Figure 10 and Figure 11, these data illustrate the time-progression of damage, starting with transverse cracking. These cracks are often caused by different constraint effects during early-age concrete curing, which are particularly influenced by the type of girder and the relative stiffness.
After the initial cracking, the damage scenario progresses through the development of map cracking, which subsequently facilitates the ingress of chlorides and carbon dioxide, leading to the creation of a corrosive environment. The onset of corrosion marks a critical transition in the damage state that promotes further deterioration such as delamination and spalling. This staged progression is quantified using empirical models, including Fick’s Second Law and the associated probabilistic or parametric equations, namely, Equations (1) and (4), which incorporate variables such as chloride diffusion coefficients, surface chloride concentration, and depth of carbonation.
This generalized framework for damage progression serves as a reference model and can be adapted to different structural and environmental contexts. Variability in the girder spacing, slab thickness, exposure conditions, and traffic loads can be integrated into the model to refine the predictions of the deterioration patterns. Research has shown that the crack width, location, and duration of exposure have a critical influence on the rate of chloride ingress and subsequent corrosion, particularly in flexural cracks or in regions subject to alternating wet-dry cycles. Therefore, the damage model must be calibrated to reflect site-specific conditions to enable a more accurate prediction of service life and more effective maintenance planning.
Due to the lack of sufficient data to directly verify the chloride content of the target bridge, an error rate was calculated in place of using error bars, by comparing the target bridge with a verification bridge exhibiting similar conditions. To ensure the highest degree of comparability, a verification bridge located in the same region and showing the most similar surface chloride concentration to the target bridge was selected. After 10 years of service, the target bridge exhibited a surface chloride content of 1.575 kg/m3, with corresponding concentrations of 1.113 kg/m3 at a depth of 10–20 mm and 0.997 kg/m3 at 20–40 mm. Using Fick’s Second Law, the effective diffusion coefficient was calculated as 5.1816 × 10⁻¹² m2/s. Based on this model, the estimated time to reach Damage Stage 6 was 38.85 years for the PSC-I section and 73.35 years for the SPG section. At these respective service times, the chloride content of the verification bridge was 1.309 kg/m3 in both sections, resulting in an estimated error rate of 8.3%.

4.3. Damage and Repair Objects in BIM Models

The integration of maintenance history data with 3D BIM technology has been investigated in previous studies [13] to improve the visualization and management of structural conditions. Building on this foundation, each damaged object was defined according to an eight-stage damage-condition model in this study, systematically linking the corresponding repair histories to each damage event, as illustrated in Figure 12. This structured approach enabled the collection of time-series data to capture the progression of damage to bridge slabs under similar structural and environmental conditions. By organizing and indexing the damage and repair history in this manner, it becomes possible to extract patterns of deterioration and maintenance action in comparable cases. Using these collected datasets, the feasibility of constructing a data-driven digital twin model was validated, demonstrating its potential for simulating and predicting damage evolution and developing condition-based maintenance strategies.

4.4. Digital Twin Model for Predicting the Service Life of the Bridge Slab

The most critical variables that affect the damage caused by transverse cracking in the negative moment region include the type of girder, span length, spacing between girders, and slab thickness. Accordingly, ten bridge slabs with similar structural configurations were selected from a digitalized database of bridge slab maintenance records, which are listed in Table 4. The damage progression for these selected cases was modeled using the framework proposed in this study, slowing for a consistent representation and comparative analysis of deterioration patterns under analogous conditions.
As bridge slab design is influenced by evolving design codes, slabs constructed within similar time periods were selected for analysis to ensure consistency in the design standards. The previous code specified the minimum slab thickness of 180 mm, whereas the current bridge design code mandates a minimum thickness of 220 mm. In addition, some clients require a minimum thickness of 250 mm to improve the durability and extend the service life of the slab. The selected dataset included bridge slabs with documented crack repair histories, some of which included an increase in the slab thickness as part of the rehabilitation strategy. In this study, the effect of the crack repair on the slab service life was not directly considered.
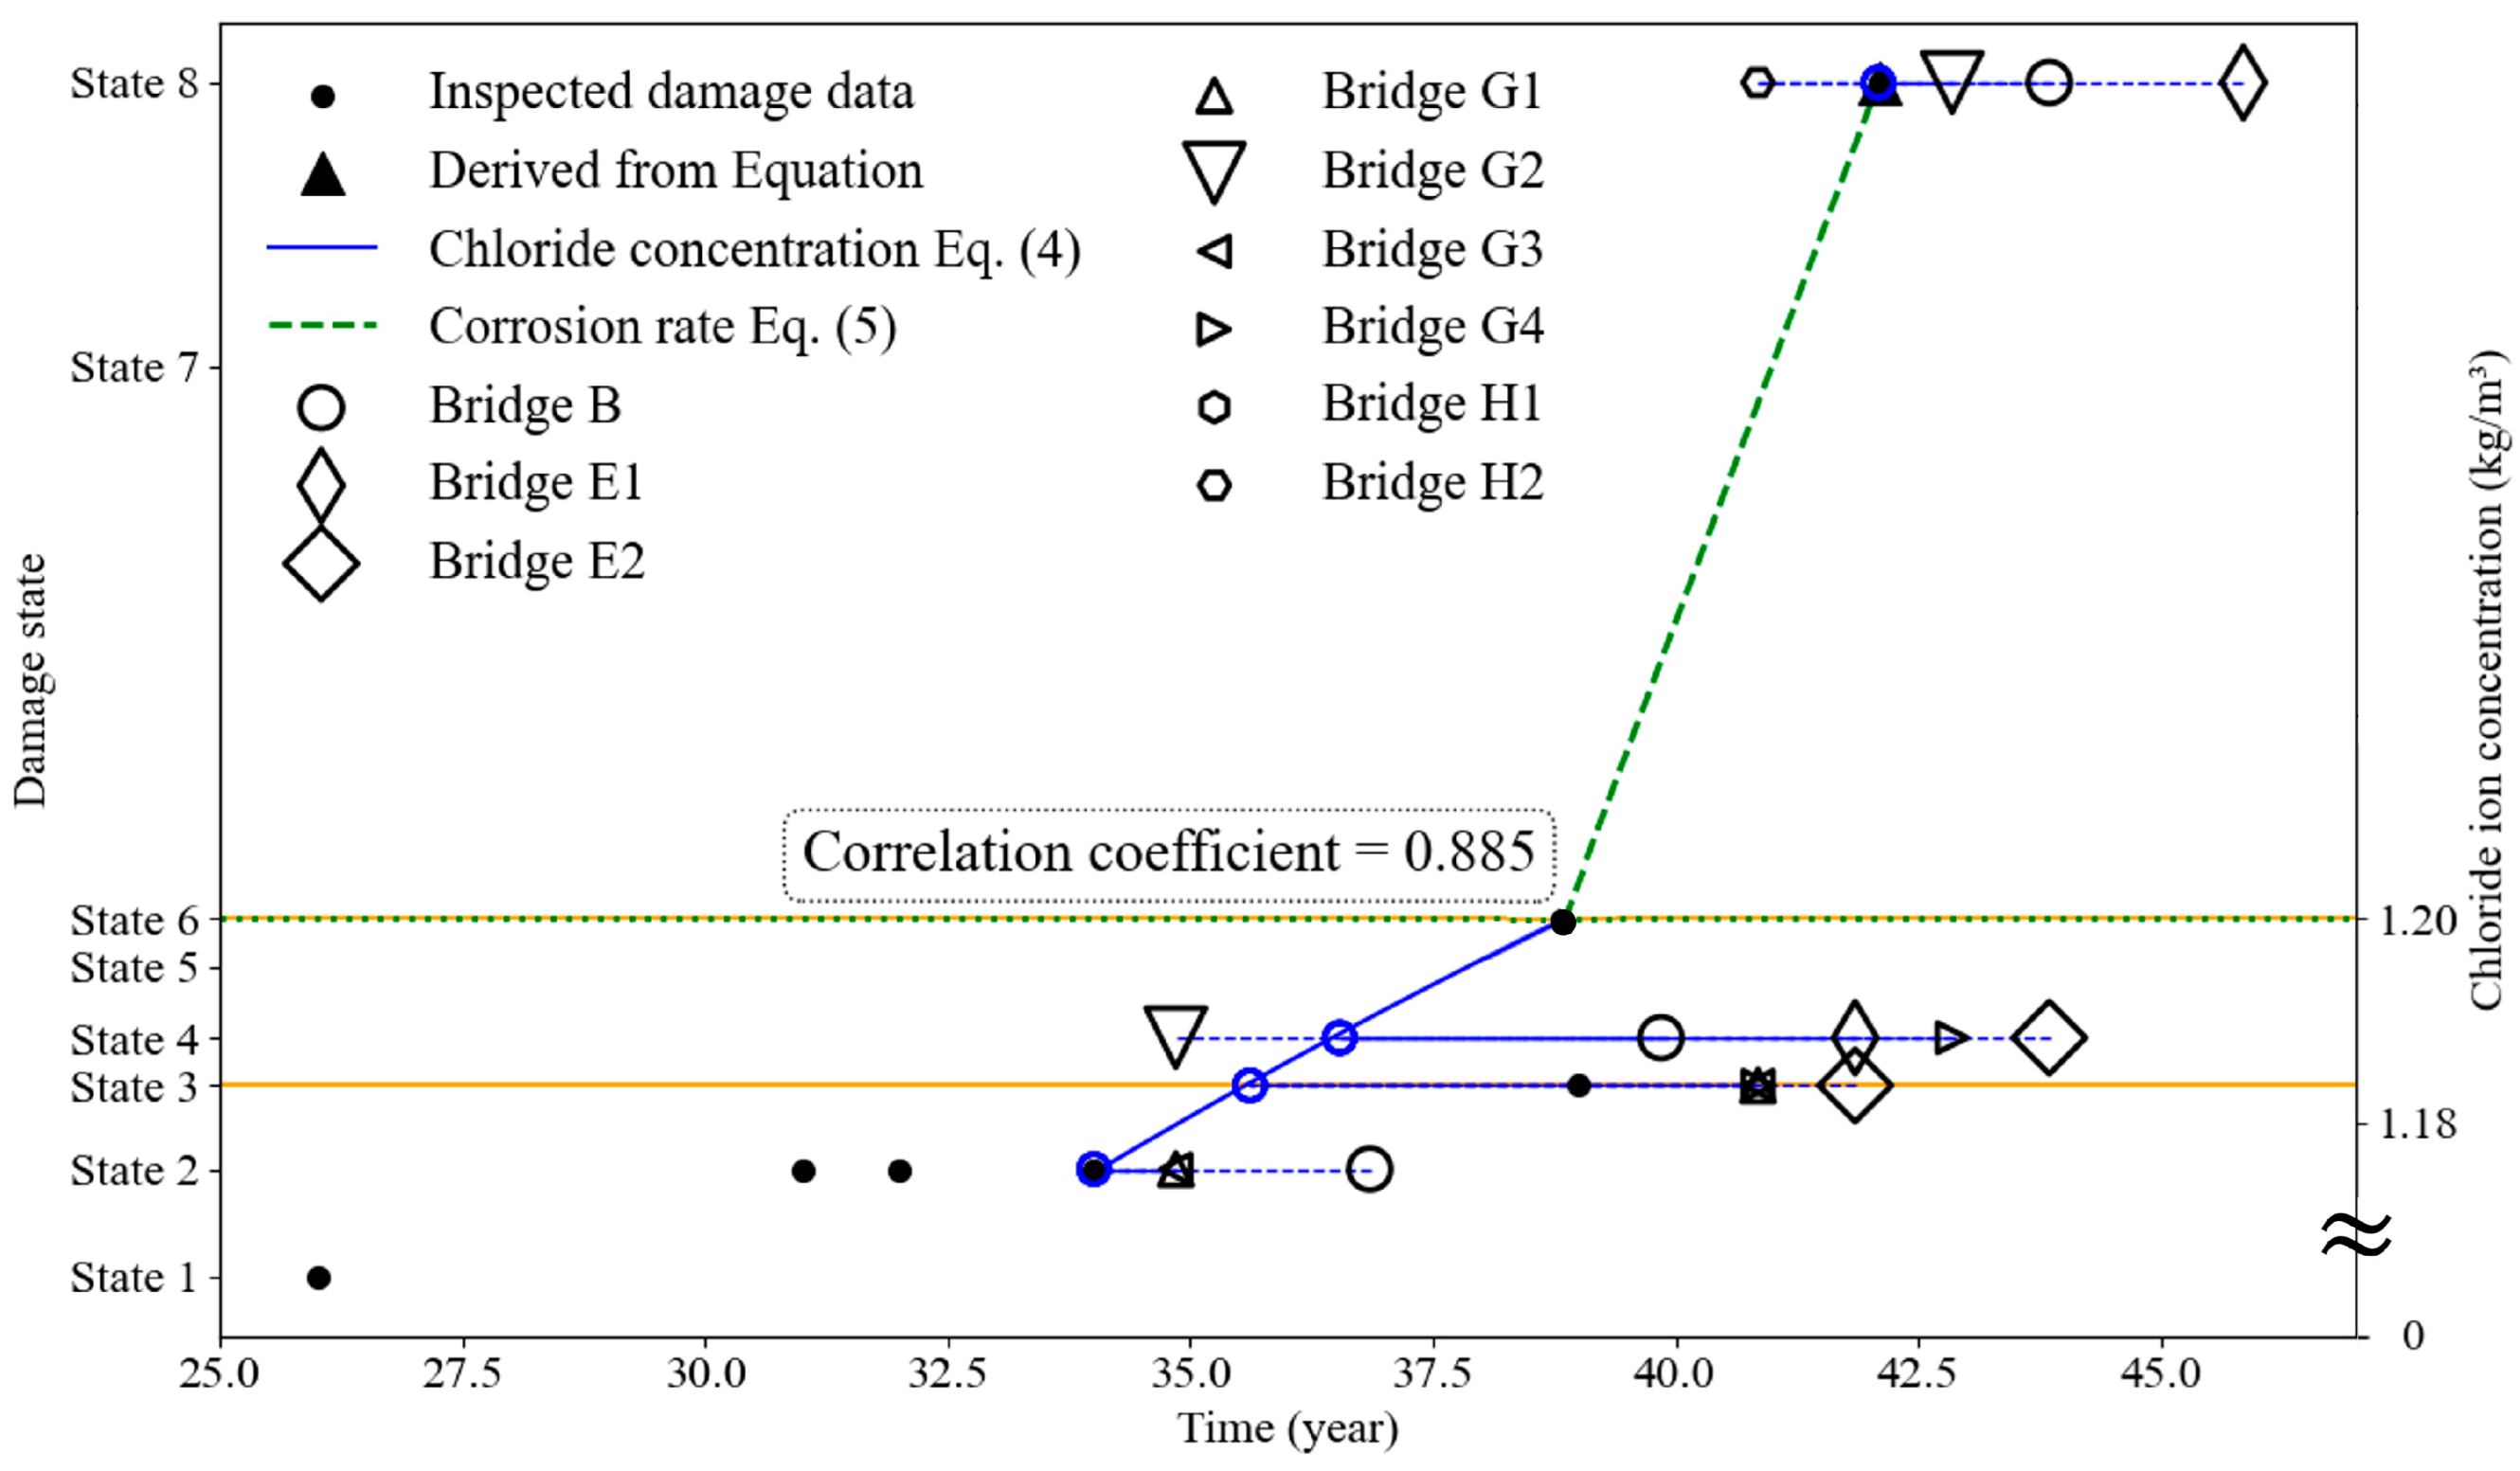
The predictive performance of the proposed data-driven digital twin framework for bridge slabs was evaluated by analyzing the time of occurrence of the main damage stages in several bridge cases. For the map cracking stage, five bridges showed a standard deviation of 0.468 (years) in onset timing, whereas efflorescence, observed in eight bridges, showed a standard deviation of 1.904 (years). These results indicate a reasonable degree of consistency in the damage progression among bridges with similar structural and environmental conditions. Consequently, the methodology presented in this study showed strong potential as a reliable data-driven digital twin model for predicting the bridge-slab deterioration and supporting the maintenance planning.
Figure 13 shows the temporal progression of the damage emanating from transverse cracks in the negative moment regions of the bridge slabs of the ten selected bridges, as modeled in the basic framework proposed in this study. The damage data are based on detailed inspection records collected over five-year intervals and reflect the mechanical properties that are representative of similar bridge slabs. The resulting high correlation coefficient underpins the validity of the methodology presented in this study to define the damage condition. As no observed damage corresponded to Damage State 8, the occurrence of damage was estimated using the proposed prediction equation. This method shows the potential for forecasting future damage progression and assessing the remaining service life of the bridge slabs based on their current condition and deterioration trends.

5. Conclusions

5.1. Summary of Findings

This paper presents a data-driven digital twin framework for modeling and predicting the deterioration of bridge slabs, focusing on crack progression and repair history. The framework facilitates the structured modeling of deterioration by delineating the damage states across eight distinct stages and correlating them with maintenance records derived from digitalized inspection data. An analysis of bridges with similar structural conditions, such as girder type, span length, girder spacing, and slab thickness, has shown that the framework was able to consistently capture the progression of damage. The predictability of key damage stages, including map cracking, efflorescence, rebar exposure, and delamination, exhibited relatively low standard deviations across the different cases, confirming the robustness of the model. This approach accounted for the influence of evolving design codes and varying slab thickness requirements, including cases where the thickness was increased to prolong the service life. The main findings of this paper are as follows.
(1) To overcome the limitations of the current condition rating systems used in maintenance decision-making, which primarily rely on visual inspection, a data-driven framework that can predict the service life of bridge slabs by tracking the progression of individual damages was proposed in this study. This framework introduces an eight-stage damage classification that allows for a more detailed and temporal assessment and offers significant improvements over conventional maintenance.
(2) The 2D images of the damage recording were then used to extract the coordinates of the damage location using the YOLOv7 deep learning model. A dataset was created to train the model and the model was trained with clarity-enhancing preprocessing and appropriate hyperparameter settings. This enabled the extraction of damage coordinates and the digitization of damage records from existing 2D drawings of inspections during the service life of a bridge.
(3) In reinforced concrete structures, rebar corrosion usually progresses internally and is not readily visible on the surface, making quantitative evaluation difficult. To overcome this limitation, a carbonation depth prediction model and chloride ion diffusion model based on Fick’s Second Law was introduced in this study to numerically estimate the corrosion onset time. In this way, the onset of corrosion, which corresponds to a specific stage of damage progression was quantitatively defined. Furthermore, the equations were able to predict the time-dependent corrosion current density ( i c o r r ) for damage states beyond state 6. This enables the quantitative estimation of corrosion progression and crack occurrence and facilitate data-driven diagnosis and the service life prediction beyond conventional visual assessment.
(4) Conventional inspection records rely primarily on 2D drawings that only indicate the relative locations of damage, limiting their ability to accurately track individual damage over time and link the repair history with precision. To overcome this limitation, the damage locations and repair logs extracted from historical inspection drawings were mapped onto a BIM-based 3D bridge model with high spatial accuracy. In this way, the damage and repair information was integrated with temporal, spatial, and attribute-based data. This enabled the chronological tracking of individual damage progression and the evaluation of which type of repair was performed on which damage and how effective it was.
Based on the defined framework for damage and repair objects, the impact of repair interventions on delaying damage progression can be systematically evaluated. However, a current limitation lies in the inability to directly link the existing repair history data to specific damage instances. Once this framework is implemented in practice, it will enable the accumulation of repair records at the level of individual damage objects. This will allow for the quantitative assessment of how different repair methods contribute to extending service life. Ultimately, it is anticipated that service life-based design principles for bridge slabs can be advanced by leveraging behavioral histories observed during the maintenance phase.

5.2. Contributions to the Field

The main contribution of this study is the operationalization of historical maintenance and damage data into a predictive digital twin model tailored to bridge slabs. This model provides infrastructure managers with a practical and scalable tool for forecasting deterioration patterns, optimizing inspection cycles, and planning timely interventions. By bridging the gap between the empirical deterioration data and digital modeling, the proposed framework promotes the implementation of data-centric lifecycle management in bridge infrastructure. A predictive model based on machine learning could be developed in a future study by accumulating the proposed dataset.

Author Contributions

Conceptualization, C.S.; methodology, J.S., K.K. and G.R.; validation, C.S.; investigation, H.S. and G.R.; resources, C.S.; writing—original draft preparation, C.S.; writing—review and editing, H.S.; supervision, C.S.; project administration, C.S.; funding acquisition, C.S. All authors have read and agreed to the published version of the manuscript.

Funding

This research was conducted with the support of the “National R&D Project for Smart Construction Technology (RS-2020-KA156007)” funded by the Korea Agency for Infrastructure Technology Advancement under the Ministry of Land, Infrastructure and Transport, and managed by the Korea Expressway Corporation. This research was also supported by a Chung-Ang University Graduate Research Scholarship in 2023.

Data Availability Statement

The data presented in this study are available on request from the corresponding author.

Conflicts of Interest

The authors declare no conflict of interest.

Abbreviations

The following abbreviations are used in this manuscript:
BIMBuilding Information Modeling
CDTConstruction Digital Twin
FMfacility management
ADTTaverage daily truck traffic

References

  1. Kanavaris, F.; Coelho, M.; Ferreira, N.; Azenha, M.; Andrade, C. A review on the effects of cracking and crack width on corrosion of reinforcement in concrete. Struct. Concr. 2023, 24, 7272–7294. [Google Scholar] [CrossRef]
  2. Pape, J.F. Impact of Bridge Deck Cracking on Durability. Master’s Thesis, Iowa State University, Ames, IA, USA, 1998. [Google Scholar]
  3. National Academies of Sciences, Engineering, and Medicine. Guide Specification for Service Life Design of Highway Bridges; The National Academies Press: Washington, DC, USA, 2020. [Google Scholar] [CrossRef]
  4. Federal Highway Administration (FHWA). Performance of Concrete Highway Bridge Decks Using Nation-Wide Condition Data; FHWA-HIF-18-082; FHWA: Washington, DC, USA, 2018. [Google Scholar]
  5. Nguyen, D.C.; Jeon, C.H.; Roh, G.; Shim, C.S. BIM-based preassembly analysis for design for manufacturing and assembly of prefabricated bridges. Autom. Constr. 2024, 160, 105338. [Google Scholar] [CrossRef]
  6. Jang, D.H.; Roh, G.T.; Jeon, C.H.; Shim, C.S. Simulation-based optimization of crane lifting position and capacity using a construction digital twin for prefabricated bridge deck assembly. Buildings 2025, 15, 475. [Google Scholar] [CrossRef]
  7. BS EN ISO 19650–1; Organization and Digitization of Information About Buildings and Civil Engineering Works, Including BIM—Information Management Using Building Information Modelling. Part 1: Concepts and Principles. British Standards Institution (BSI): London, UK, 2018. Available online: https://www.iso.org/standard/68078.html (accessed on 14 April 2025).
  8. BS EN ISO 19650–2; Organization and Digitization of Information About Buildings and Civil Engineering Works, Including BIM—Information Management Using BIM. Part 2: Delivery Phase of the Assets. British Standards Institution (BSI): London, UK, 2018. Available online: https://www.iso.org/standard/68080.html (accessed on 14 April 2025).
  9. BS EN ISO 19650–3; Organization and Digitization of Information About Buildings and Civil Engineering Works, Including BIM—Information Management Using BIM. Part 3: Operational Phase of the Assets. British Standards Institution (BSI): London, UK, 2020. Available online: https://www.iso.org/standard/75109.html (accessed on 15 April 2025).
  10. Nicał, A.K.; Wodyński, W. Enhancing facility management through BIM 6D. Procedia Eng. 2016, 164, 299–306. [Google Scholar] [CrossRef]
  11. Lu, Q.; Xie, X.; Parlikad, A.K.; Schooling, J.M.; Konstantinou, E. Moving from building information models to digital twins for operation and maintenance. Proc. Inst. Civ. Eng. Smart Infrastruct. Constr. 2021, 174, 46–56. [Google Scholar] [CrossRef]
  12. Fang, Z.; Lu, Q.; Xie, X.; Parlikad, A.K.; Schooling, J.; Pitt, M. Definitions and principles of digital twins. In Digital Twins in the Built Environment; ICE Publishing: Leeds, UK, 2022; pp. 5–27. [Google Scholar] [CrossRef]
  13. Jeon, C.H.; Shim, C.S.; Lee, Y.H.; Schooling, J. Prescriptive maintenance of prestressed concrete bridges considering digital twin and key performance indicator. Eng. Struct. 2024, 302, 117383. [Google Scholar] [CrossRef]
  14. Roh, G.; Park, J.; Jeon, C.H.; Shim, C.S. Development of a baseline digital twin model as a prerequisite for the digital twin definition of a PSC-I bridge with model updating considering member stiffness. Buildings 2025, 15, 17. [Google Scholar] [CrossRef]
  15. Holt, R. Concrete bridge deck service-life prediction tools. ASPIRE Winter 2019, 30–31. Available online: https://www.aspirebridge.com/magazine/2019Winter/winter-2019.pdf (accessed on 14 April 2025).
  16. Ghonima, O.; Schumacher, T.; Unnikrishnan, A.; Fleischhacker, A. Advancing Bridge Technology, Task 10: Statistical Analysis and Modeling of US Concrete Highway Bridge Deck Performance; Portland State University: Portland, OR, USA, 2018; Available online: https://pdxscholar.library.pdx.edu/cengin_fac/443 (accessed on 14 April 2025).
  17. Gode, K. Predicting the service life of concrete bridges based on quantitative research. Constr. Sci. 2014, 15, 11–18. [Google Scholar] [CrossRef]
  18. Shim, C.-S.; Chang, S.-P. Cracking of continuous composite beams with precast decks. J. Constr. Steel Res. 2003, 59, 201–214. [Google Scholar] [CrossRef]
  19. Li, S. Analysis of influence of bridge deck damage on first order natural frequency of simply supported T-beam bridge. Vibroeng. Procedia 2021, 36, 43–48. [Google Scholar] [CrossRef]
  20. Gheitasi, A.; Harris, D.K. Performance assessment of steel–concrete composite bridges with subsurface deck deterioration. Structures 2015, 2, 8–20. [Google Scholar] [CrossRef]
  21. Hopper, T.; Manafpour, A.; Radlinska, A.; Warn, G.; Rajabipour, F.; Morian, D.; Jahangirnejad, S. Bridge Deck Cracking: Effects on In-Service Performance, Prevention, and Remediation; FHWA-PA-2015-006-120103; FHWA: Washington, DC, USA, 2015. [Google Scholar]
  22. Fanous, F.; Wu, H.; Pape, J. Impact of Deck Cracking on Durability; Iowa State University: Ames, IA, USA, 2000. [Google Scholar]
  23. Yang, J.W. A Study on Evaluation of Probability Based Service Life in Carbonated RC Structure; Hanyang University: Seoul, Republic of Korea, 2011. (In Korean) [Google Scholar]
  24. Nordic Council of Ministers. NT Build 492: Concrete, Mortar and Cement-Based Repair Materials—Chloride Migration Coefficient from Non-Steady-State Migration Experiment. 1999. Available online: https://www.nordtest.info/wp/1999/11/21/concrete-mortar-and-cement-based-repair-materials-chloride-migration-coefficient-from-non-steady-state-migration-experiments-nt-build-492/ (accessed on 14 April 2025).
  25. Liu, Y. Modeling time-to-corrosion cracking in chloride contaminated reinforced concrete structures. ACI Mater. J. 1999, 96, 611–613. [Google Scholar]
  26. Ouzaa, K.; Oucif, C. Numerical model for prediction of corrosion of steel reinforcements in reinforced concrete structures. Undergr. Space 2019, 4, 72–77. [Google Scholar] [CrossRef]
  27. Sapkota, R.; Ahmed, D.; Karkee, M. Comparing YOLOv8 and Mask R-CNN for instance segmentation in complex orchard environments. Artif. Intell. Agric. 2024, 13, 100233. [Google Scholar] [CrossRef]
  28. Gonzalez, R.C.; Woods, R.E. Digital Image Processing; Pearson: London, UK, 2018. [Google Scholar]
  29. Shalev-Shwartz, S.; Ben-David, S. Understanding Machine Learning: From Theory to Algorithms; Cambridge University Press: Cambridge, UK, 2014. [Google Scholar]
  30. Fang, X.; Wang, H.; Liu, G.; Tian, X.; Ding, G.; Zhang, H. Industry application of digital twin: From concept to implementation. Int. J. Adv. Manuf. Technol. 2022, 121, 4289–4312. [Google Scholar] [CrossRef]
Figure 1. A model of the damage progression of the cracks in the bridge slab.
Buildings 15 01979 g001
Figure 2. Current damage report in 2D drawings.
Buildings 15 01979 g002
Figure 3. An object detection of the external inspection map for the bridge slab.
Buildings 15 01979 g003
Figure 4. Code system for damage.
Buildings 15 01979 g004
Figure 5. A diagram of the damage and repair information integrated into the 3D bridge model.
Buildings 15 01979 g005
Figure 6. Visualization of the damage and repair object model.
Buildings 15 01979 g006
Figure 7. Damage and repair information.
Buildings 15 01979 g007
Figure 8. The damage records of a PSC-I bridge slab in a bridge.
Buildings 15 01979 g008
Figure 9. Damage records of a steel plate girder bridge slab in a bridge.
Buildings 15 01979 g009
Figure 10. The damage progression on a PSC-I bridge.
Buildings 15 01979 g010
Figure 11. Damage progression on a steel plate girder bridge.
Buildings 15 01979 g011
Figure 12. The damage and repair records in a 3D bridge model.
Buildings 15 01979 g012
Figure 13. Validation of proposed model with damage data from similar bridges.
Buildings 15 01979 g013
Table 1. Definition of damage states for bridge slabs.
Damage StageDescriptionRemarks
State 1Transverse crack (width is less than 0.1 mm)
State 2Transverse crack (width is less than 0.3 mm)
State 3Map crack or transverse crack greater than 0.5 mm
State 4Efflorescence near cracks
State 5Corrosion conditionLeakage, chloride (>0.4%), carbonation depth (>cover)
State 6Corrosion initiationRust stains on the concrete surface
State 7Severe corrosionCalculation under given conditions (chloride, carbonation depth)
State 8Delamination and Spalling Service life limit
Table 2. Parameters for the calculation of the corrosion product.
ParameterValue
Density of rebar ρ s t   g / cm 3 7.85
Density of corrosion products ρ r u s t   g / cm 3 4.00
Poisson’s ratio of the concrete υ c   0.18
Ratio between the molecular weights of steel and corrosion products α 0.57
Tensile strength of concrete f t   kgf / cm 2 29.2
Elastic modulus of concrete E   kgf / cm 2 280,624.3
Thickness of pore band around the steel/concrete interface d 0   μ m 12.5
Table 3. Main training hyperparameters of YOLOv7.
ParameterValue
Number of epochs300
Batch size4
Image resolution640 × 640
Initial learning rate0.005
Table 4. Bridge information for damage records.
BridgeGirder TypeSpan Length (m)Girder Spacing (m)Slab Thickness (mm)
APSC-I30.02.30200
BPSC-I25.02.45200
CPSC-I30.02.10200
DPSC-I30.02.48250
EPSC-I24.22.30180
FPSC-I32.02.0250
GPSC-I30.02.18200
HPSC-I30.02.0200
IPSC-I29.252.2200
JPSC-I39.92.4200
Disclaimer/Publisher’s Note: The statements, opinions and data contained in all publications are solely those of the individual author(s) and contributor(s) and not of MDPI and/or the editor(s). MDPI and/or the editor(s) disclaim responsibility for any injury to people or property resulting from any ideas, methods, instructions or products referred to in the content.