1. Introduction
In a context where energy demand continues to increase and temperature extremes are being affected by climate change, plans for improving building operations should consider not only the physical aspects of buildings but also the factors that drive the use of cooling and heating energy within the buildings. This study focuses on university buildings, which can be considered a “small city” within the building sector, as they contain numerous people and complex activities [
1]. Depending on its organizational and technological efforts, a university’s energy consumption can directly impact the green transition of its local community [
2]. Campus buildings account for a large portion of greenhouse gas (GHG) emissions globally. This has led to different studies focusing on reducing energy consumption in university campus buildings. These studies analyze the factors that consume energy and aim to produce quantitative effects by applying sustainable building design [
3,
4] and green energy systems [
5,
6,
7], improving equipment, techniques, and operational efficiency through energy diagnosis and simulation.
However, in a review of previous studies, Pacheco et al. [
8] argued that even an energy-efficient building can produce different results depending on the physical environmental conditions. Because university campuses comprise various structures with multiple uses, even though they are all for the same purpose, it can be challenging to devise measures to achieve energy and GHG reduction targets. Therefore, some studies have considered spatial characteristics when analyzing campus buildings as factors that affect final energy consumption [
9,
10]. For example, Chung et al. [
11] categorized university buildings based on construction completion dates and energy consumption criteria. The relationship between construction completion dates and energy performance was also clear in a study conducted on educational facilities in major cities in England [
12].
Conversely, Tiina et al. [
13] argued that in universities, energy consumption is affected by the diversity of space composition or structural changes rather than by the construction completion date. For buildings with the same use, Abdelalimet al. [
14] contended that energy consumption varies according to the different types of energy usage, depending on the building’s use and the system’s operation schedule. Faghihi et al. [
15] also noted that energy performance varied according to users and facilities. Because improving the building envelope or system requires extensive investment, Mata et al. [
16] proposed a university energy-efficiency plan focusing on building management, arguing that if there are financial limitations, energy conservation efforts should be made by changing the behavior of facility users rather than by increasing infrastructural efficiency.
To reduce the energy consumption of university buildings, plans to improve space use and operation must be prepared. Gul et al. [
17] noted that power consumption generally remains constant throughout the year in university buildings, even when there is no building use or activity, indicating operational issues. These authors suggested that implementing optimal scheduling while considering space usage patterns would reduce energy consumption. In response to this call, this study aims to propose energy-efficient operational and management strategies for reducing the heating and cooling loads of university buildings, with a focus on optimizing space utilization within the buildings. The significance of this study lies in its aim to identify the energy consumption characteristics associated with the use and operation of university buildings, thereby providing crucial evidence for the importance of space utilization when considering energy reduction strategies in these facilities. To achieve this aim, this study investigates the human factors in conjunction with physical building characteristics and classifies university building types based on their intended usage. Heating and cooling energy consumption is also compared with space usage patterns.
2. Efforts for Low-Carbon Green Growth in Universities
Countries worldwide have been working to create a low-carbon environment by voluntarily setting GHG reduction goals, referred to as Nationally Determined Contributions (NDCs), to help mitigate the climate crisis. Beginning with a vision of low-carbon green growth in 2000, the Korean government has been actively preparing and strengthening policies to reduce GHG emissions and energy consumption. Since the energy sector accounts for the largest share of greenhouse gas (GHG) emissions, enhancing the energy-efficiency of buildings and transitioning to low-carbon energy sources are recognized as effective strategies for reducing GHG emissions [
18]. In Korea, efforts have been made to reduce GHG emissions through various energy policies, and as a result, energy consumption levels have decreased in most building types. In the building sector, universities are one of the largest emitters of GHGs because they utilize building types with high energy consumption; therefore, it is critical to find ways to reduce GHG emissions in campus buildings as part of efforts to promote a green transition toward carbon neutrality.
In 2013, 34 universities in Seoul organized the Seoul Green Campus Council and signed an agreement to reduce energy consumption by 10% by 2017. However, the energy use of universities in Seoul, which are required to submit energy usage reports yearly according to the Energy Use Rationalization Act (2007), decreased only slightly in the year the contract was signed. Except for the year (2020–2022) when classes were held online because of COVID-19, energy use in Seoul’s universities continued to increase after that. For example, energy consumption increased by about 10.3% from 2012 to 2017 [
19]. The universities’ responses to GHG reductions have relied on implementing energy-efficient measures to maintain “spatial conditions”, emphasizing technological approaches such as passive or active controls and the use of renewable energy, as outlined in policies implemented by central or local governments.
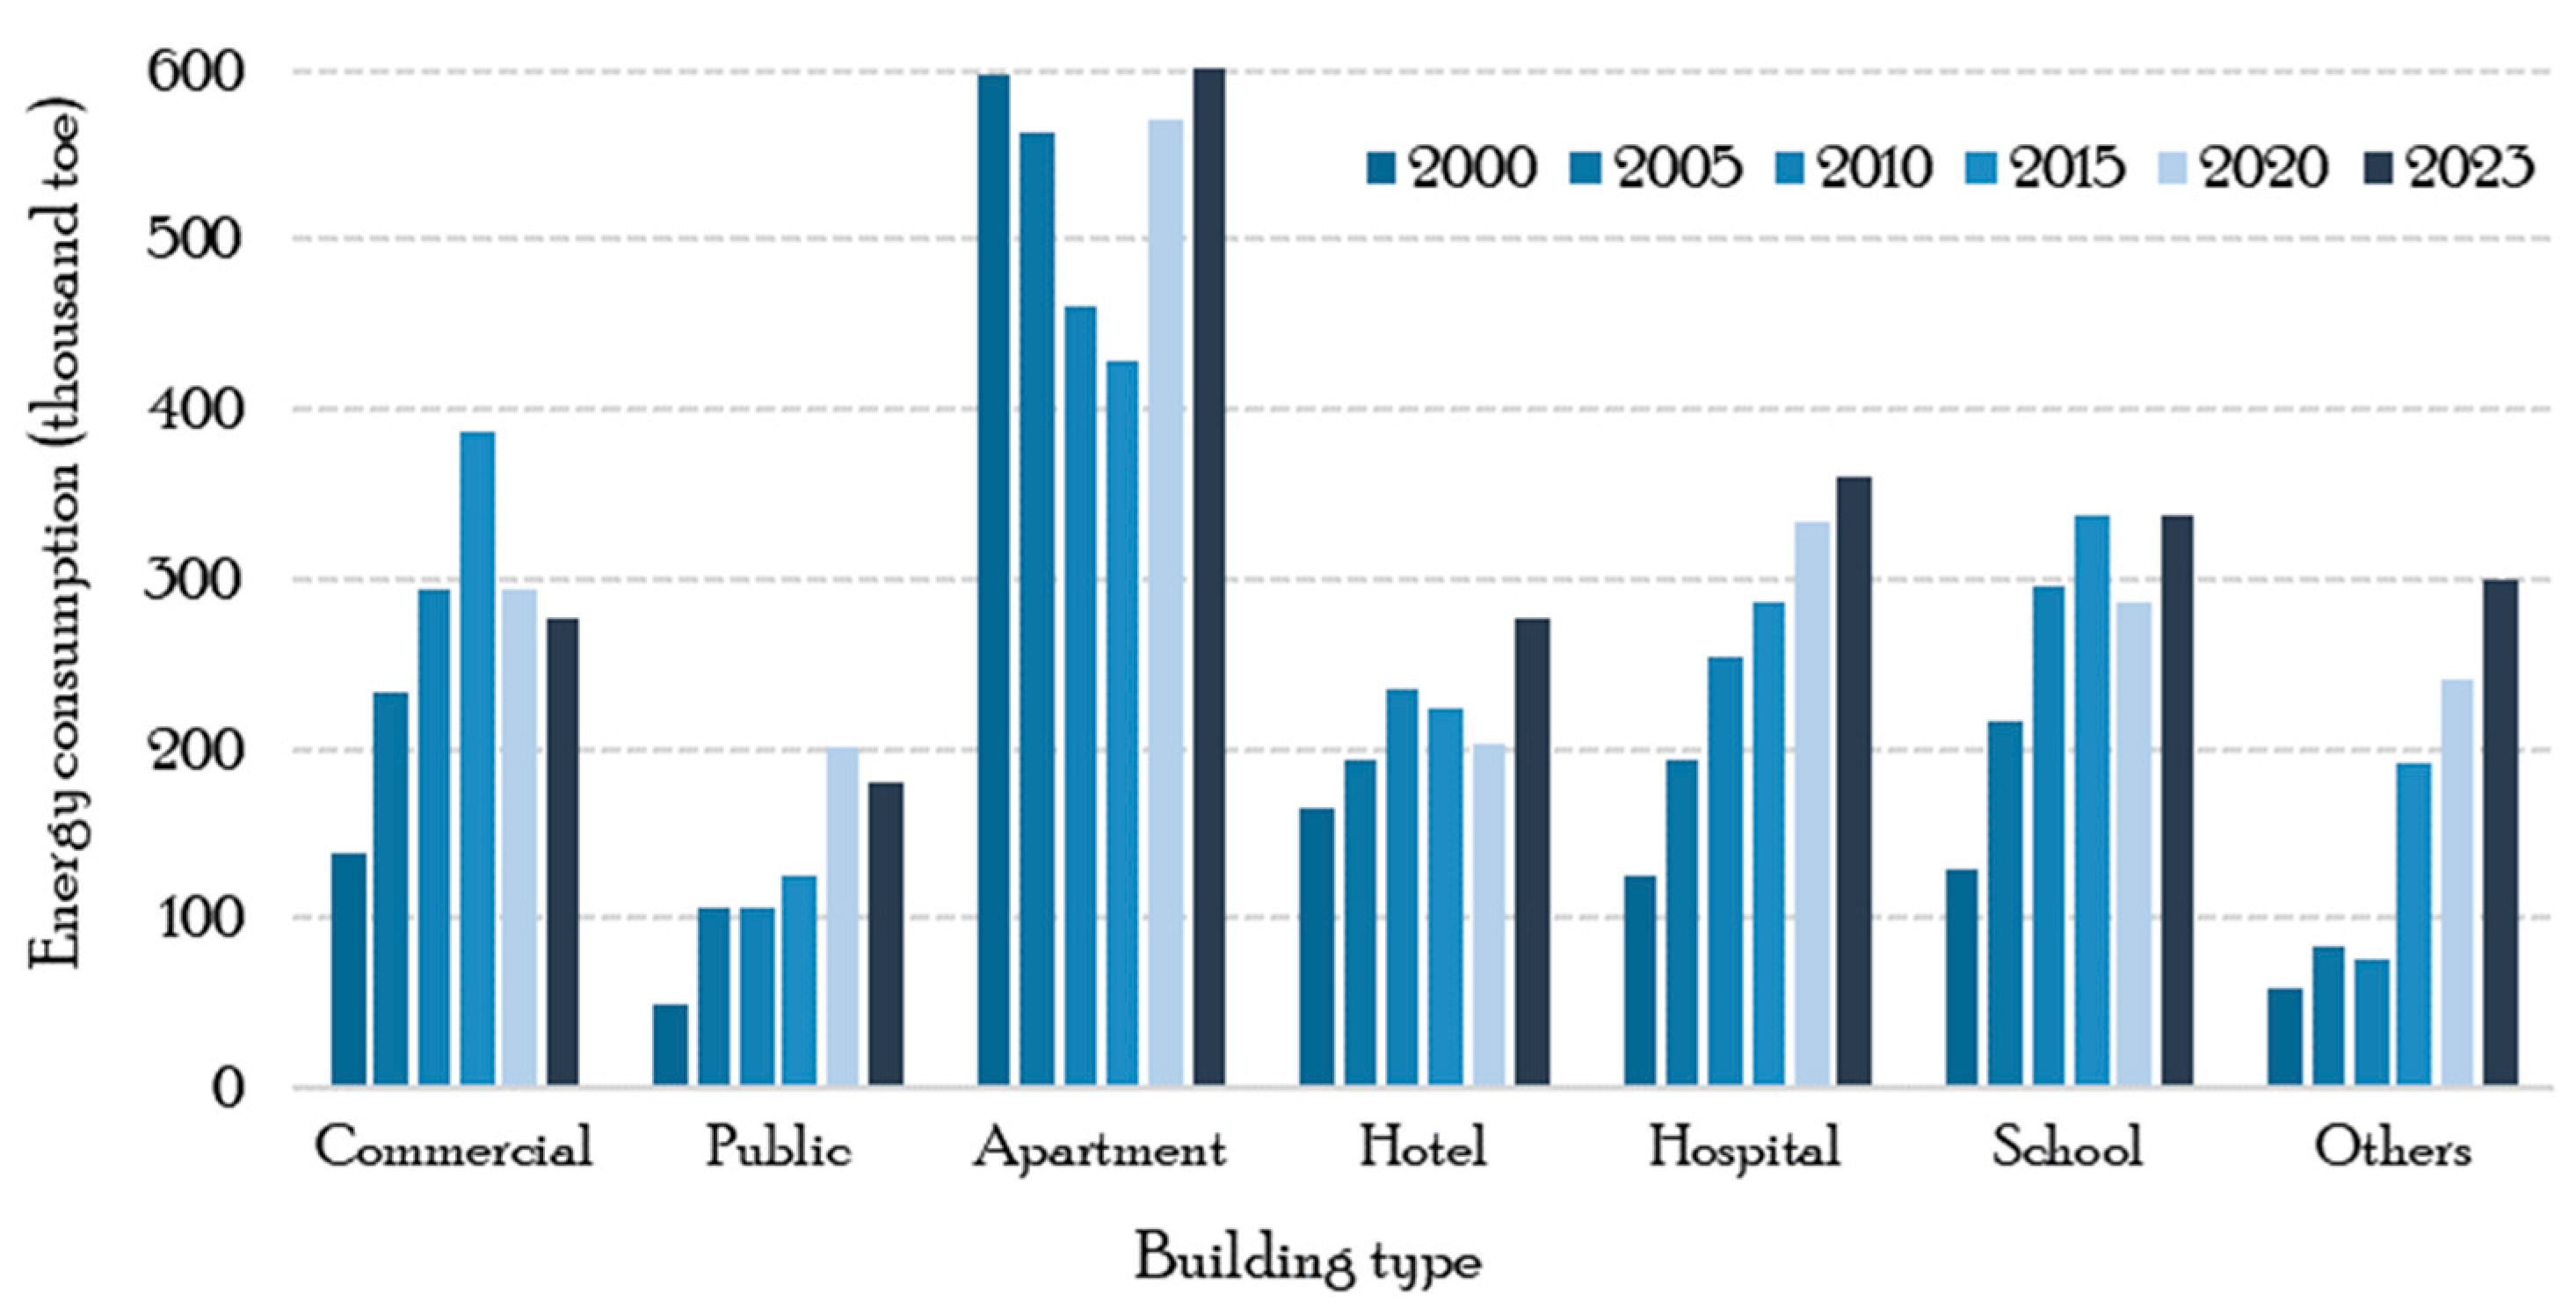
The government’s greenhouse gas and energy regulations apply only to a limited number of universities identified as high greenhouse gas emitters and significant energy consumers. As
Figure 1 illustrates, in contrast to other building types where energy consumption is decreasing or slowing, universities are not achieving satisfactory results. Most of these universities follow the GHG reduction and green building policies implemented by central or local governments in the building sector. Those policies require both building energy-efficiency ratings and zero-energy building certifications, which quantitatively evaluate a building’s energy performance, as well as green building certification (G-SEED), which qualitatively assesses the factors that impact the environment. However, the simulation tool used for quantitative evaluation focuses only on physical improvements—such as passive and active design techniques and renewable energy application plans—and it is challenging for universities to achieve energy reduction through these approaches [
20]. Therefore, universities should adopt different improvement strategies compared to those applied in other types of buildings, where energy consumption and GHG emissions are reduced in line with local and central government policies.
The difficulty of physical improvement is related to the operating environment of university buildings, which differs from the building operation environment in other contexts [
21]. For example, some universities pursue physical improvements, such as refurbishing or replacing facades and facilities, with support from the government or institutions. This support includes the low-interest loan program for renewable energy supply and the Building Retrofit Project, which the Seoul Metropolitan Government has implemented as part of its Green Campus Development since 2012. This low-interest loan program provides affordable rates for energy-efficiency improvements in homes and buildings. However, because a stable fund management system has not been established at universities, these improvements cannot continue, and the green campus ideal is becoming increasingly irrelevant, except in a few universities.
Projects for energy-efficiency improvement do not generate immediate profits for university stakeholders. When university presidents and committees allocate annual or long-term budgets, such projects slip down the priority list, making it challenging to allocate new budgets. Because many universities worldwide have a strict hierarchical structure, it is difficult to allocate a budget when decision-making is complex or when the decision-maker needs to be aware of GHG emissions. Even when universities implement a master plan for energy reduction, budget allocations may vary from year to year, as budget-makers and approvers may prioritize short-term strategies for institutional development. Given that they often face limited budgets, universities should prioritize developing strategies to reduce energy consumption in their operations rather than focusing exclusively on enhancing building performance. However, collaboration across the university to minimize energy consumption proves challenging due to the existence of departmental divisions. Achieving energy reduction through efficient building operation can be difficult, as service companies responsible for managing facilities often have short contract durations and prioritize low unit prices.
3. Research Methodology
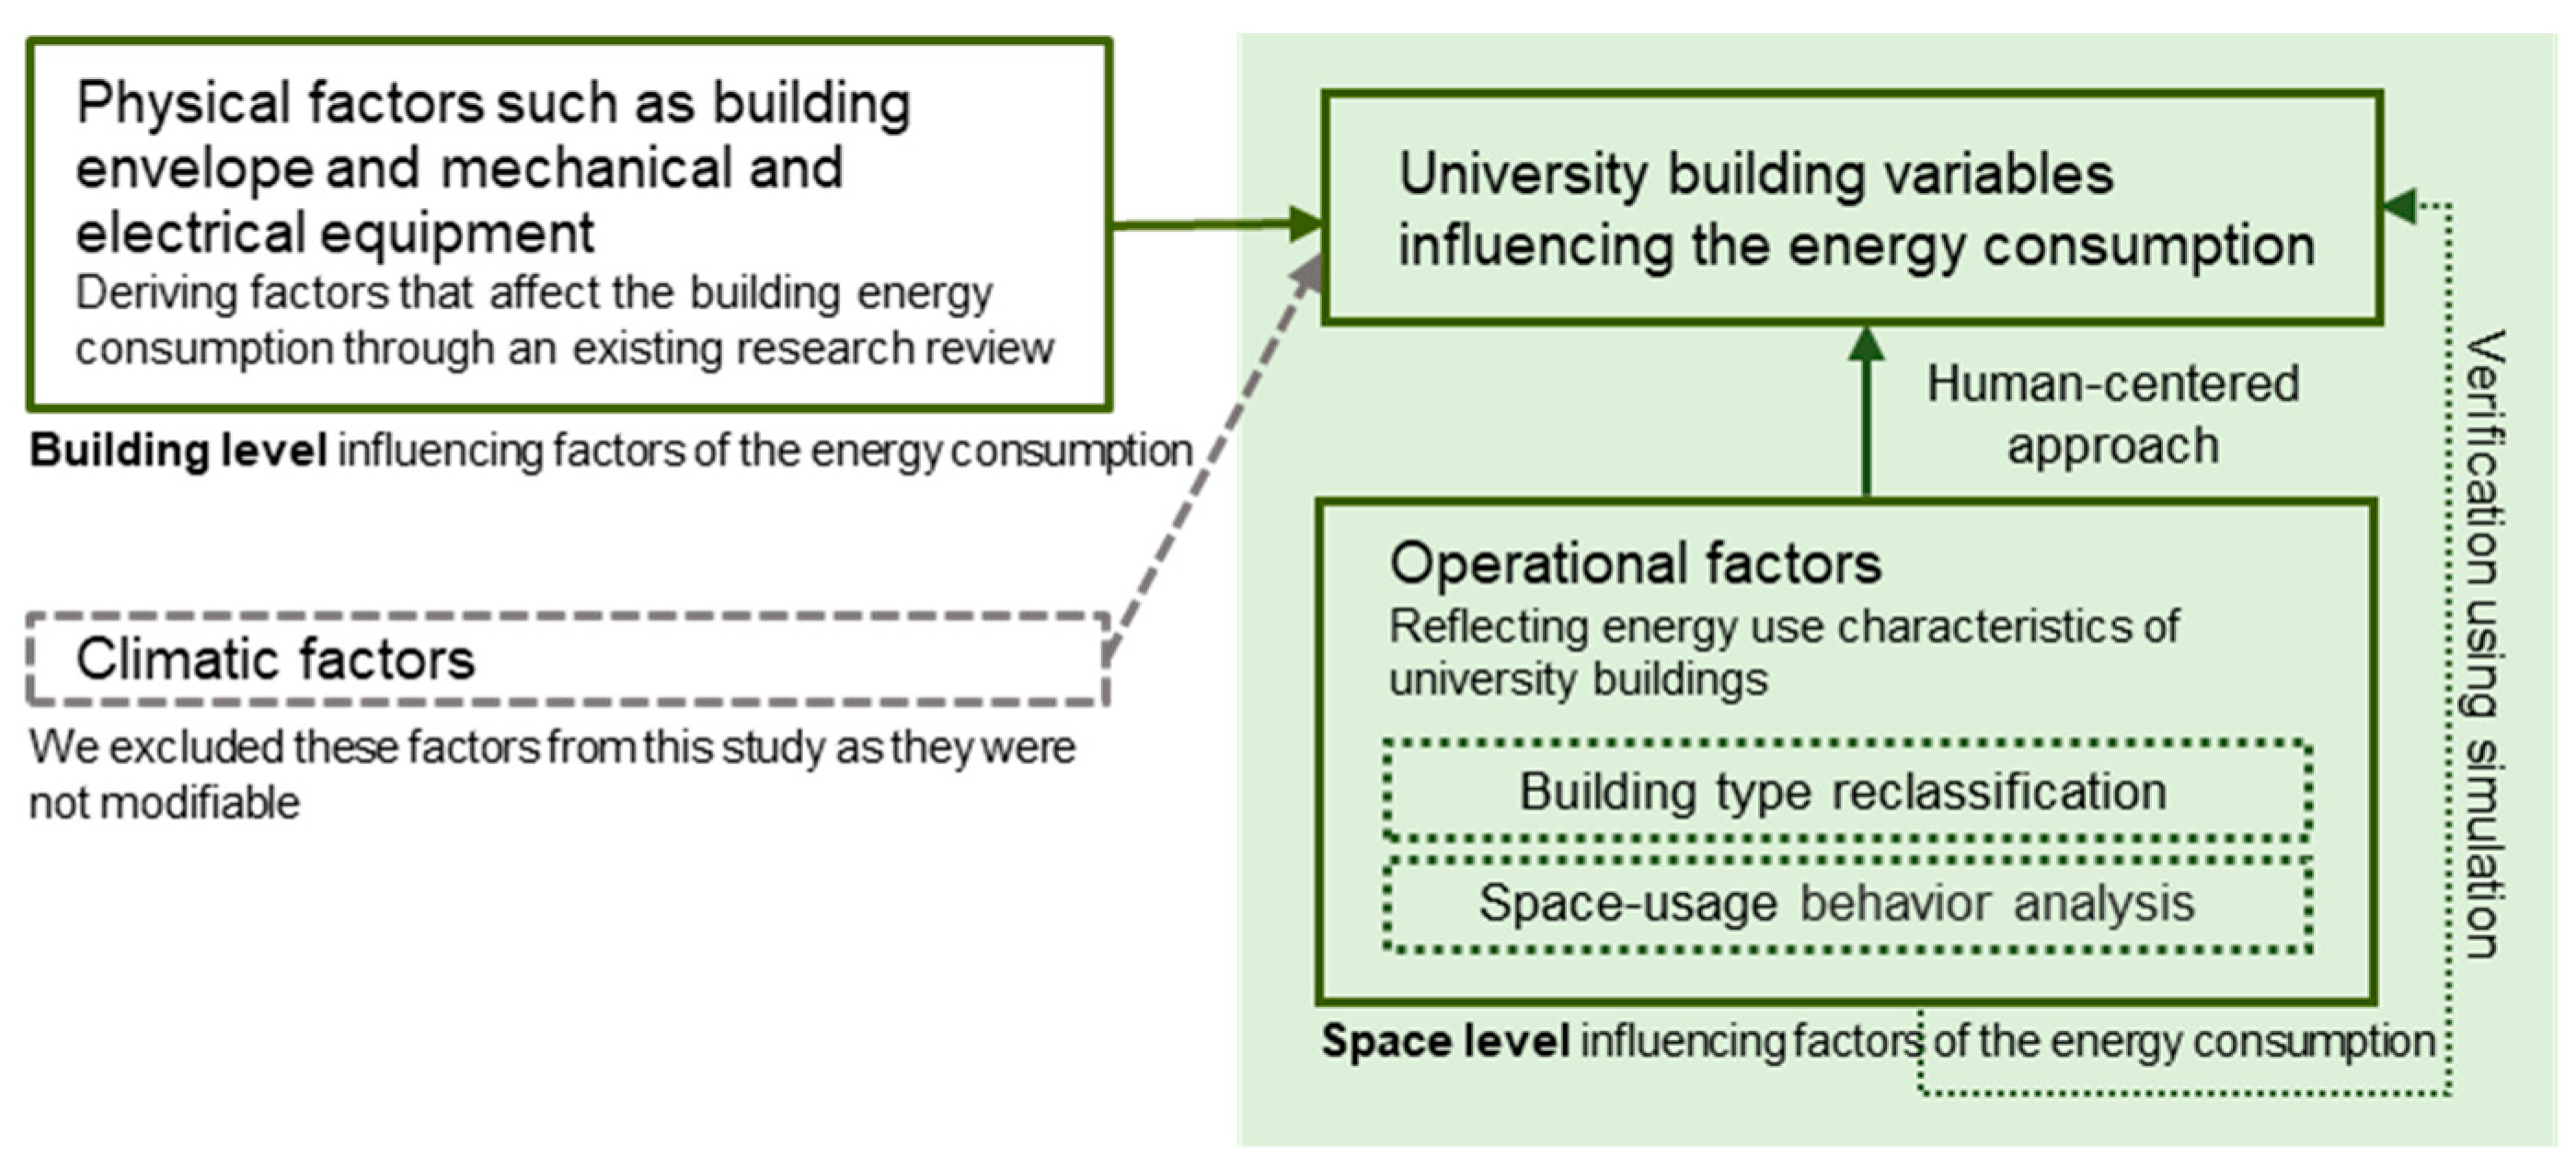
This research employed an exploratory study design that investigated university buildings’ energy consumption characteristics and space usage and proposed operation directions to reduce the heating and cooling load of university buildings (see
Figure 2). To achieve the study aim, variables affecting energy consumption were determined through a critical review of previous studies on energy reduction in university campus buildings, and a case study was conducted on Korea University’s buildings. For data collection, we determined the spatial and temporal scope of the university buildings and analyzed the characteristics and energy consumption of the campus buildings. Then, we classified buildings by type and investigated heating and cooling energy consumption by space use behavior.
Korea University is one of the universities identified by the Building GHG & Energy Target Management Scheme as emitting a significant amount of GHGs and using a considerable amount of energy. The university is subject to energy diagnosis as a large energy consumption business under Korea’s Energy Use Rationalization Act. The campus buildings of Korea University were categorized into three areas—the humanities, the sciences and engineering, and the green area—but our analysis was limited to the humanities building. This is because science and engineering encompass many buildings that contain experimental equipment, leading to high energy consumption, and research institutes and dormitories located in the green area do not distinguish energy consumption by building.
The 15 academic buildings identified in our study were reclassified into categories such as lecture, research, office, public, and other uses, excluding libraries and administrative facilities due to their unique purposes and space usage requirements. For our study, we analyzed the usage patterns of three buildings with a high proportion of lectures as a case study. We also examined patterns of space usage and energy consumption for building types which were expected to show a significant energy reduction. Heating and cooling energy usage was then calculated based on the improvements in space use behavior, which were verified using simulation software. These findings informed a proposal to reduce energy consumption for heating and cooling. Data on energy use were derived from actual usage records spanning January 2011 to December 2020. This period aligned with the study’s purpose, because it was relevant to universities, with no significant changes in annual usage. More recent data may be atypical because of the effects of COVID-19 on space use.
4. A Case Study of Campus Buildings in Korea University
Unlike buildings whose purposes are primarily affected by the weather, the use of university buildings is dependent on the academic calendar. For example, while Seoul’s average electricity consumption per unit floor area typically increases from June, the electricity consumption of Korea University temporarily increases in March, when the semester starts, and increases again in May before the central cooling system is implemented. The energy consumption of humanities buildings in Korea University was analyzed with reference to the total floor area; building type; and completion date. The completion date meant the date when the building was constructed and approved. The reason for using the completion date as one of the critical factors is that energy performance standards for buildings are becoming more stringent over time. The results revealed a statistically significant variation regarding the total floor area. However, there was no significance regarding building type and completion date. For example, we categorized buildings based on their completion date, which corresponded to when the government significantly improved building laws. Buildings constructed after 2001, when energy performance standards improved, exhibited higher energy consumption per unit of gross floor area. This was evaluated in terms of space utilization, focusing on user convenience and quality of life [
22]. Pertinent factors included space composition and use, increased window area ratio, and digital device enlargement and higher quality.
4.1. Energy Consumption Characteristics
Among the factors affecting energy consumption, the physical characteristics of the buildings were used as independent variables to analyze the correlation between buildings’ heating and cooling energy consumption. Although the performance of heating and cooling systems varied according to the completion date, there was no significant difference in the Korea University buildings. The building’s heating and cooling systems remained within the same operating guidelines, given the characteristics of universities. Accordingly, heating and cooling systems were classified into three types according to the heat source and terminal unit. Given that buildings were the same type (absorption chiller and heater; constant air volume plus fan-coil unit), heating and cooling systems were excluded from this analysis.
Table 1 presents the Pearson’s correlation analysis results between the ten independent variables and the dependent variable of heating and cooling energy consumption.
Interestingly, some variables (surface-to-volume ratio, wall area, and wall-area-weighted thermal transmittance) had a negative relationship with heating and cooling energy consumption. Given that the wall area, except for windows, was targeted, different results were obtained in new constructions because the wall area decreased as the proportion of windows increased. Generally, an increase in surface area results in increased potential for heat gain and loss. In the surface-to-volume ratio of the target buildings, energy consumption increased, although the new buildings were built to have greater energy-efficiency. Factors other than the performance of buildings also influence energy consumption. Thus, this research analyzed the human factors that affect heating and cooling energy use by considering the characteristics of universities with various space usage patterns. For example, the attributes of space usage included occupancy density, usage time, and user behavior, even in buildings with the same purpose.
4.2. Classifying Building Types Reflecting Space Use Patterns
Universities use various spaces for academic activities and human training. However, the composition and use of such spaces change depending on situations or activities, sometimes leading to economic inefficiencies in space usage [
23]. Spaces were mainly subdivided into the categories of “study”, “classroom”, and “common”. The study category spaces were used by faculty and graduate students who stayed and worked for a long time, and classroom category spaces were used for lecture and seminar rooms where lectures and seminars were held regularly according to the academic schedule. These spaces were classified with reference to the Facilities Inventory and Classification Manual requirements [
24]. The common category spaces included seminar rooms, lounges, meeting rooms, multi-purpose rooms used irregularly as needed, and lecture rooms where classes were not held regularly.
Research on space usage has been conducted to reduce mismatches between demand and supply for space, and most of this research provides building planning and design criteria, such as occupancy density [
25]. Space use is one of the factors that affect energy load; thus, addressing space usage in energy consumption can provide an effective way to reduce energy load without incurring additional costs. To facilitate the analysis of space usage, the 15 academic facilities examined in this study were reclassified according to their utilization rates, considering both the number of users and the frequency of use (
Table 2). The reclassification was based on the UFO formula (utilization consisting of two components—frequency and occupancy) proposed by the United Kingdom National Audit Office, specifically according to “scheduling load” (where frequency and occupancy change according to the schedule); “dead load” (fixed frequency and occupancy); and “live load” (variable frequency and occupancy).
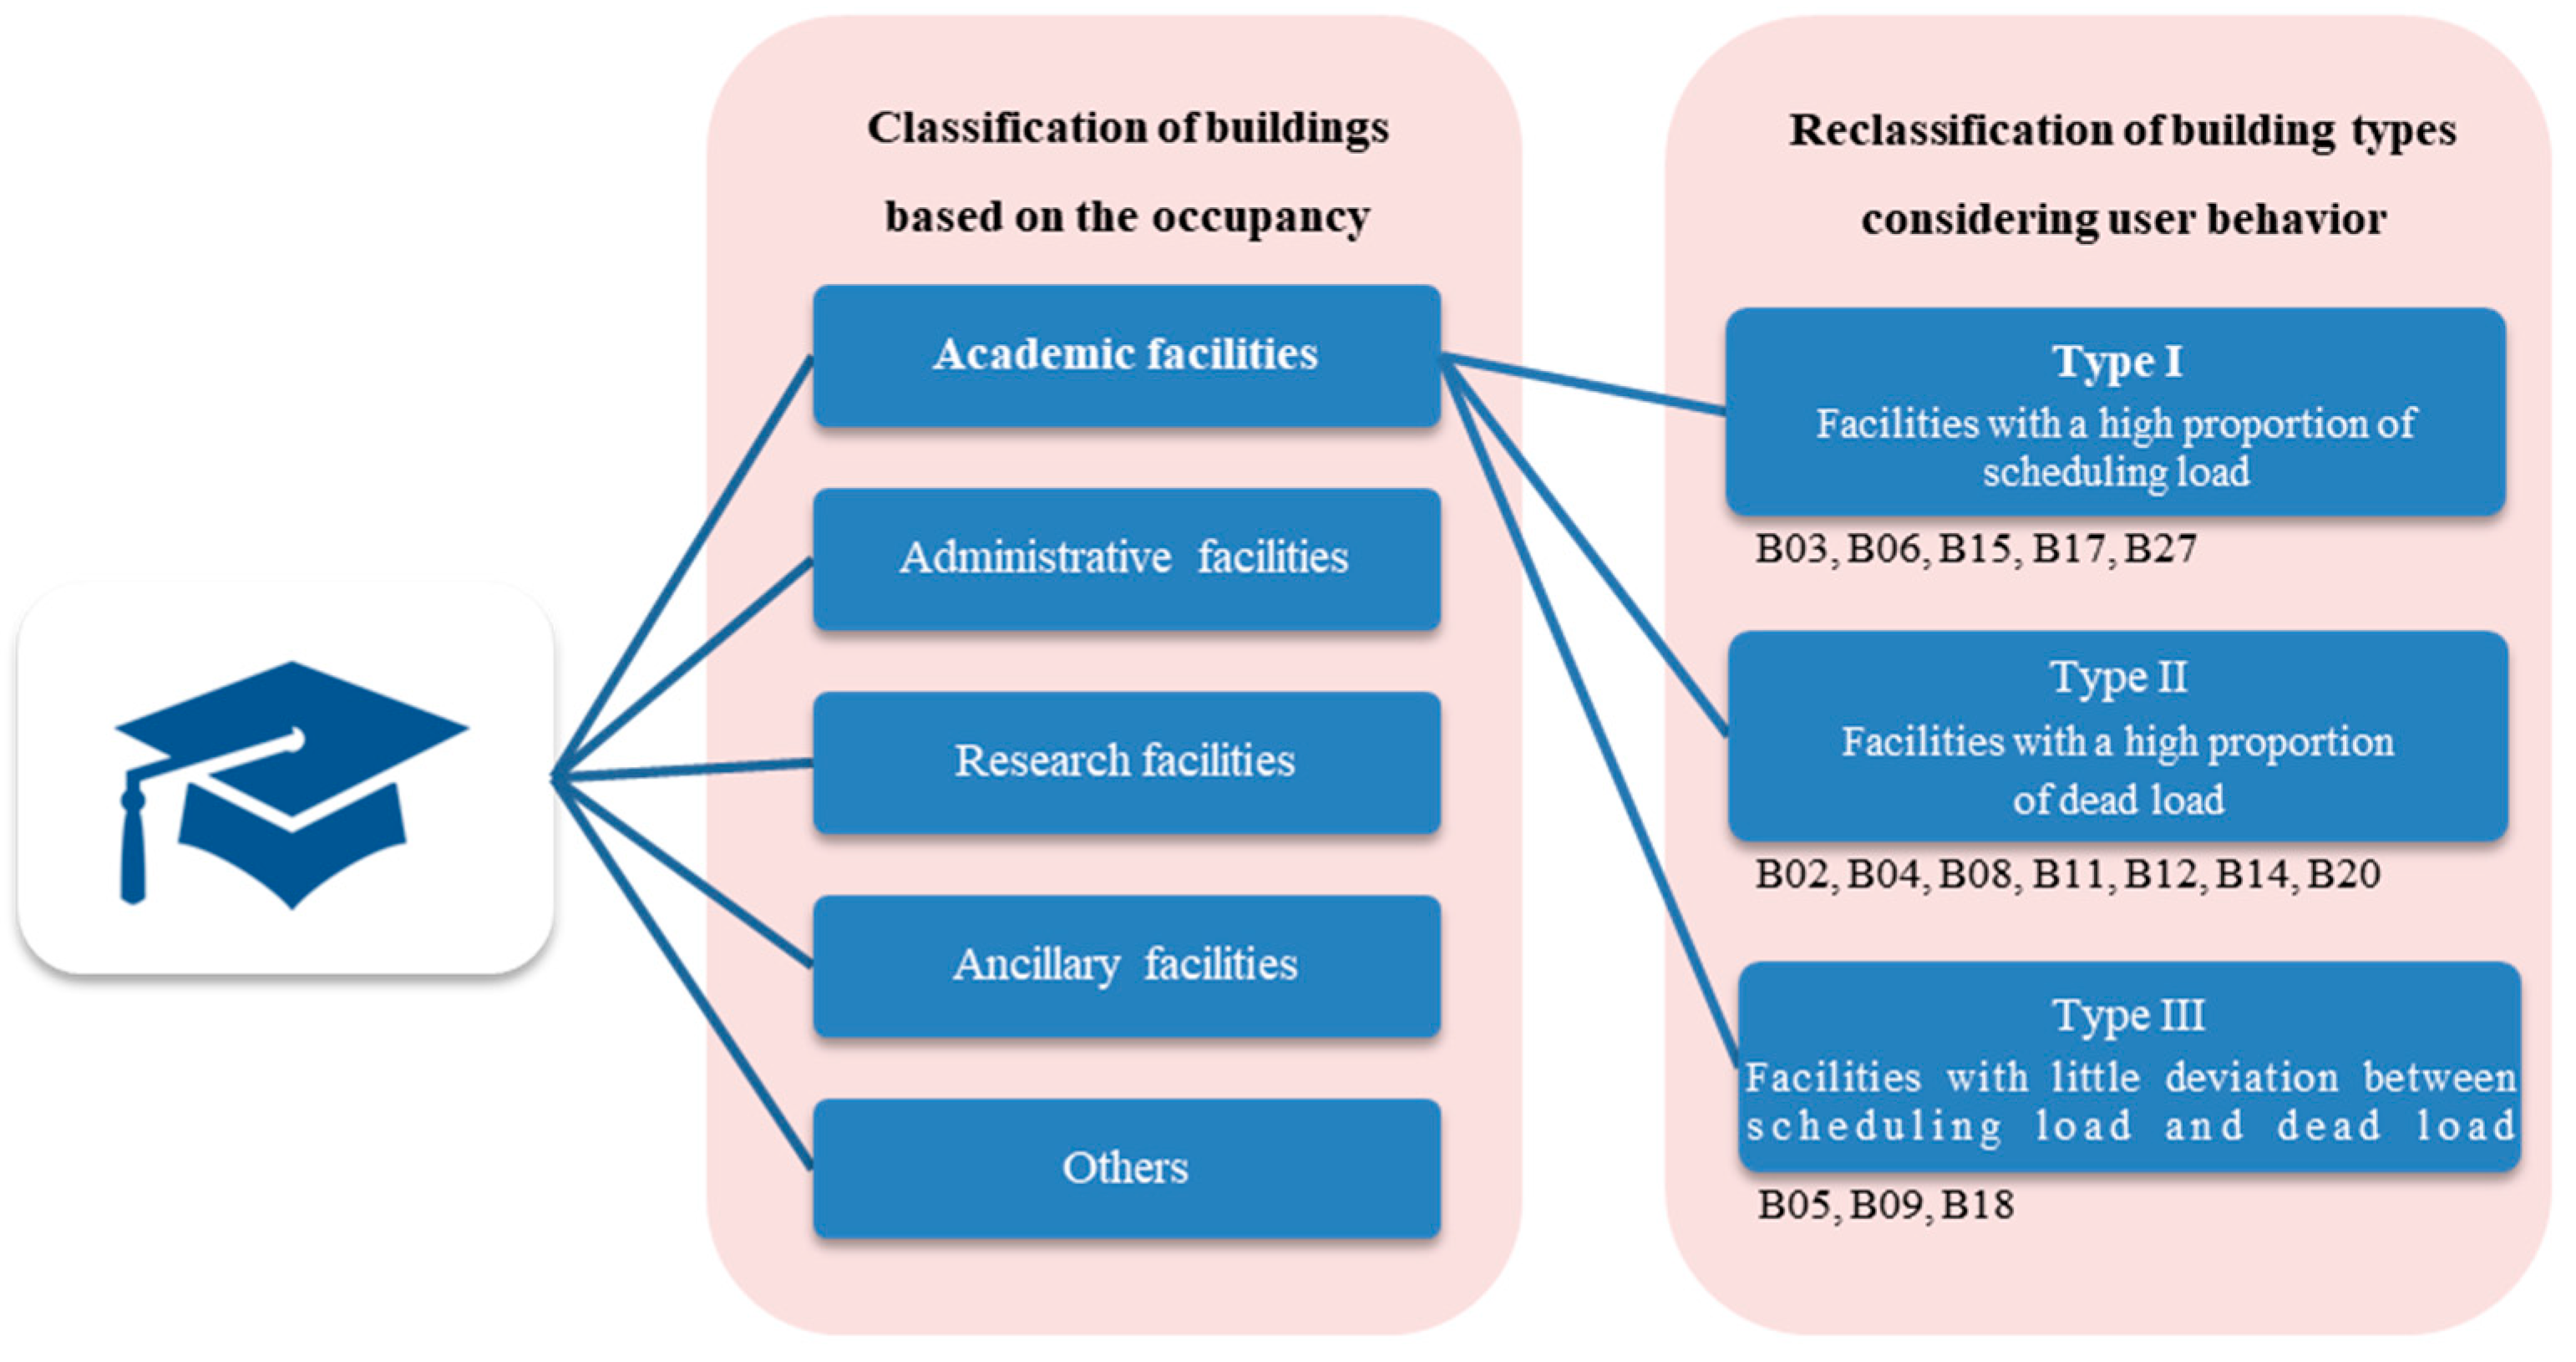
As shown in
Figure 3, buildings with a high proportion of scheduling load and dead load were classified as Types 1 and 2, and buildings where the two loads’ deviations did not exceed 5 (3.81~4.89) were classified as Type 3. A dead load is a space where specific users are occupied. Although the pattern of use for a dead load does not change significantly, energy reduction is possible through improvements in user behavior and device performance. Live loads refer to buildings used by an unspecified number of people where energy reduction is feasible through the use of a control system, such as a sensor, that considers users’ movements. Given that the scheduling load exhibits high variability, it is challenging to suggest energy reduction strategies; thus, existing studies attempt to address this issue [
26]. Nevertheless, by comparing heating and cooling energy use by type, Type 1 buildings were expected to achieve considerable energy reduction through targeted efforts. This was because the energy use variance for this type of building was larger than for the other types of buildings. Thus, this study proposed a plan to reduce energy consumption by analyzing space usage in Type 1 buildings.
4.3. Analyzing Energy Consumption According to Usage Behavior
On weekdays, the central heating and cooling system runs for 10 h (8:00–18:00) between late October and mid-March and 13 h (7:00–20:00) between early July and late September. However, because lecture space is operated according to a schedule, usage behavior—such as the users’ space usage pattern, the number of people using the area, and the space usage schedule—influences the heating and cooling energy consumption. Therefore, the use of lecture space was analyzed in accordance with data collected from the university’s space reservation and management system and construction drawings of each building. The buildings examined were B03, B17, and B27. Two Type 1 buildings (B06, B15) were excluded from the analysis because it was not easy to obtain the necessary data, as the space was a foreign language center with control at the university level only partially implemented.
Both B17 and B27 had approximately 40% open space. B27 was composed of lecture (23.75%) and research (15.24%) spaces, as well as public space (17.69%), and B17 was a little more than half lecture space (50.57%). B03 had 62.11% open space, which was more than twice the minimum value of some other academic buildings (B14 had 24.38% open space), and most of its other spaces were lecture spaces (23.61%).
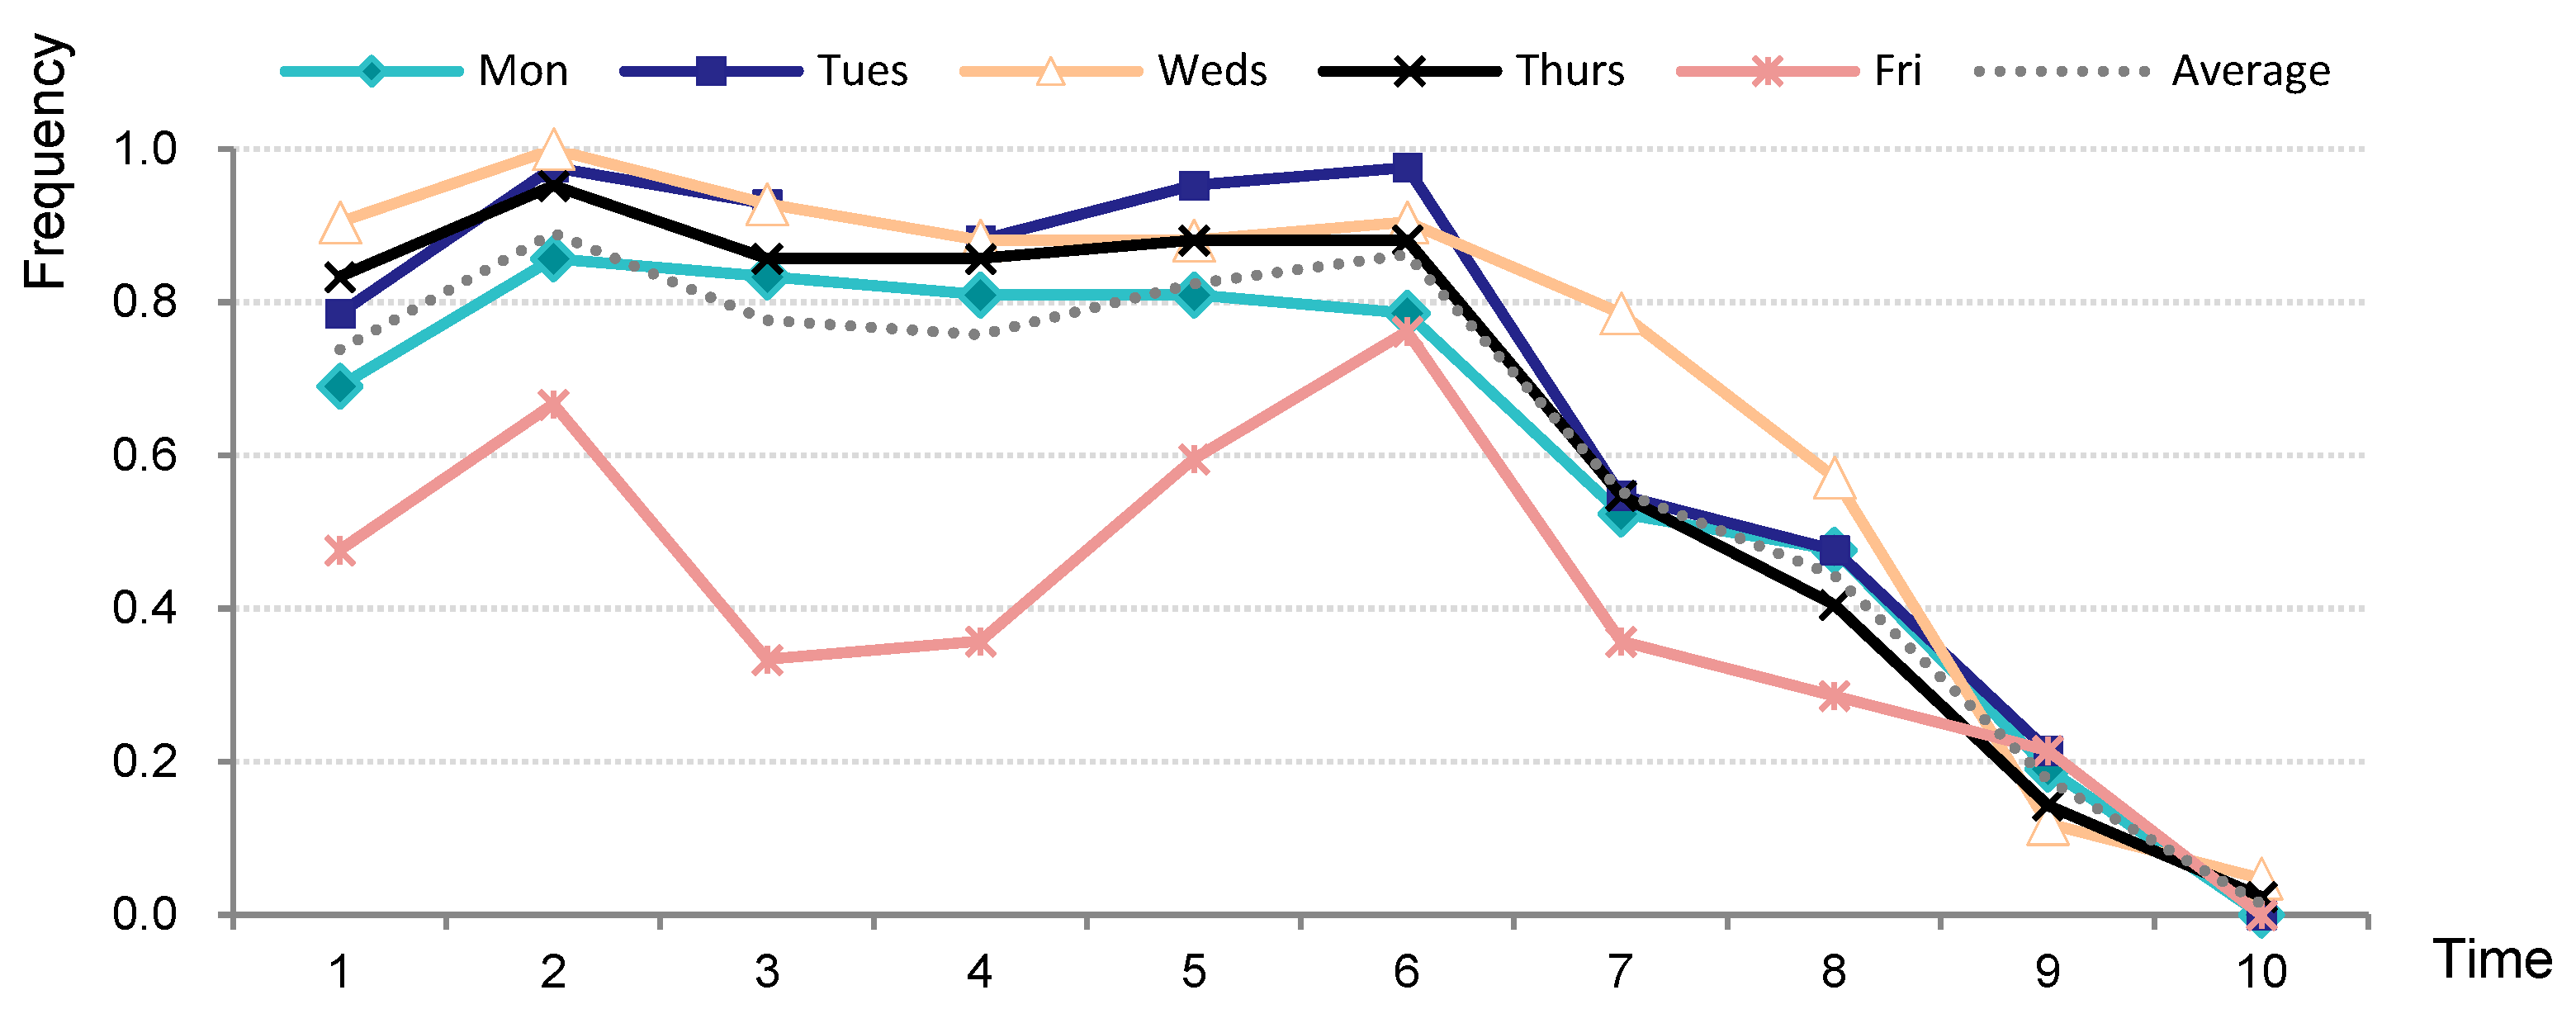
Figure 4,
Figure 5 and
Figure 6 present the frequency of space used over time across all classrooms (19 classrooms in B03, 42 classrooms in B17, and 13 classrooms in B27) in each building. The available time was 12 h per day (9:00 am to 9:00 pm). Our results revealed that the average frequency rates of space use in B03, B17, and B27 were 49.8%, 60.3%, and 51.4%, respectively. When considering the days of the week, Friday showed a relatively low frequency of space use at 28.9%, 40.5%, and 14.6%, respectively. On other days, differences in each building were observed; however, similar space use patterns were generally observed.
As shown in
Figure 4,
Figure 5 and
Figure 6, there was a clear difference between buildings in terms of space utilization over time. B17 exhibited a pattern similar to other spaces that changed according to the start and end of the day. More specifically, the frequency rate was high—with an average of 80.8% in Classes 1 (9:00~10:15) to 6 (16:30~17:45)—but decreased by almost half afterward. Conversely, B03 and B27 repeatedly increased and decreased around Class 5 (15:00~16:15), then showed constant use until Class 7 (18:00~18:50) and Class 8 (19:00~19:50). After Class 7, both B03 and B27 evenly maintained approximately 30%, unlike B17, where space use was close to zero. In addition, some lecture spaces in B03 and B27 were used flexibly outside the standard semester schedule or when lectures were held on Saturdays. Considering the use of space that needs to be registered on the system, these lecture spaces could be used more efficiently in terms of energy. Analyzing the frequency of space use of 0.3 or less, while B17 was 9.71%, B03 and B27 were 47.99% and 35.03%, respectively, showing a large percentage of spaces being used at low frequencies. Some lecture spaces were used for purposes other than initially planned. This meant that there were spaces with additional occupancy in the zone, indicating that the set point control implemented by the university wastes energy.
The occupancy rate, which shows the relationship between the area and the number of people using it, was calculated for the lecture spaces in the three buildings. Approximately 7000 classes were offered at Korea University, of which 30% were small-scale classes with fewer than 20 students. More than 70% of classes had up to 50 students, and large-scale courses, with 101–200 students and more students, accounted for approximately 3% and 0.5%, respectively. Approximately 97% of the occupancy rate for B03, B17, and B27 consisted of courses with fewer than 100 students; however, the ratio of classrooms was 53% in B03, 93% in B17, and 19% in B27. In B03, 71% of classroom use was at less than half capacity, resulting in energy waste. We calculated the occupancy rate of the lecture space based on the 65 students per 100 m
2 suggested in ASHRAE Standard 62.1 [
27].
Table 3 presents an example of the occupancy rate.
Frequency referred to the number of times the space is utilized, while the occupancy rate indicated the space’s capacity and the duration of its use. Therefore, the utilization rate, which was calculated by multiplying the frequency rate by the occupancy rate, could be used to determine the effect of human-centered factors on energy consumption. The utilization rate for each building was calculated (see
Table 4). B17 showed a similar space usage pattern throughout the days of the week, except for Friday. Unlike B17, which showed a constant utilization rate, B03 and B27 had differing space utilization rates by the hour. B03 and B27 presented irregular patterns of repeating increases and decreases in utilization rate over time and relatively low space usage. On Fridays, B03 and B27 had less than 5% utilization, a marked difference from B17 (approximately 20% on average). Compared to the other two buildings, B27 had a better envelope performance (based on completion date) by 43–46% and the heating and cooling of three basement floors was operated by geothermal heat. B27’s heating and cooling energy consumption was the highest at 30.84 kgoe/m
2, with that of B17 and B03 being 21.47 kgoe/m
2 and 22.70 kgoe/m
2, respectively, which meant there was no significant difference in the heating and cooling energy consumption of B17 and B03. However, considering that the heating and cooling system for B03 generated waste heat, it was confirmed that usage behavior, such as space composition and arrangement, frequency of space use, and occupancy, influenced the energy use for heating and cooling.
5. Simulating Energy Savings by Space Usage: Spatial Rearrangement and Time Adjustment
The ECO2 software, which assesses building energy-efficiency rating certification in Korea, was implemented for B27, which was considered inefficiently used, to calculate the amount of energy reduction according to efficient space use. B27 was divided into 102 zones, and information and usage conditions for each zone were presented, as well as values for factors such as air conditioning treatment; heating equipment; heating supply system; heating distribution system; air conditioning equipment; cooling distribution system; renewable energy; combined heat; and power and heat transmittance rate. Given that ECO2 had a fixed use profile for the representative space, we changed and applied the space usage and facility operation time; minimum outside air volume; lighting time; human fever; and the number of days of space use per month according to the actual usage schedule to check the change in energy consumption arising from the improvement in space use behavior.
First, simulations were conducted to examine the energy reduction effect when the classroom space was rearranged considering the number of students. To this end, when a scenario was applied in which only 13 classrooms were used out of eleven classrooms of over 200 m
2 in size that could accommodate more than 130 students, and five classrooms of 130 m
2 in size that could accommodate 90 students, the average space occupancy rate improved by 26.19% and space usage time increased by 26.19%. Because there was continuity in space usage, the start and end times of cooling and heating operations were adjusted, resulting in a 21.30% decrease in operation time. In relation to energy savings, when it was relocated to an appropriately sized classroom, considering the number of students and zoning, 4.0% of energy consumption and 4.7% of GHG emissions were reduced (
Figure 7).
Second, energy consumption was simulated when class times were adjusted to include Fridays, when there were low utilization rates. B27 had a small proportion of classes, but the two study rooms could be fully utilized when the class times were adjusted and the lecture space was rearranged. Compared to the previous case, the classroom occupancy was improved by 41.7%, and the heating and cooling operation time was reduced by 43.5% when the class times were adjusted. In relation to energy savings, when space was rearranged by adjusting class times, 5.3% of energy consumption and 6.2% of GHG emissions were reduced (
Figure 8).
Two major scenarios were simulated using the ECO2 program for the B27 building to calculate the energy savings arising from the efficient use of space, because this building was considered to use space inefficiently. In both simulations, heating energy showed a difference of less than 1%, but cooling energy use decreased by 15.9% when space was rearranged and 18.6% when the space usage time was changed. These results demonstrate that there are limits to increasing space occupancy, because the B27 building currently consists of large classrooms compared to the number of students, but if the university building is planned to ensure classrooms are appropriately sized and class times are adjusted optimally, the energy-saving effect can be improved.
6. Discussion
This study analyzed energy consumption characteristics related to building use and operation at Korea University, aiming to identify strategies for reducing heating and cooling energy usage in universities. It derived the following issues:
First, the causes of the high energy consumption in university buildings were analyzed, focusing on energy performance by season, day, and time. Although the use of university facilities significantly decreased during vacation periods, which coincided with peak power usage in winter and summer, a substantial amount of energy was still consumed. As shown in the simulation results, the energy consumed by the building was significant, and energy consumption decreased by 4–5% with the efficient use of classroom space, but only by approximately 7% when the classrooms were not in use. Universities have differences in peak power by day of the week, and a substantial amount of energy is consumed even in late afternoons during the summer season. This suggests that it is necessary to maximize the use of space during the vacation period or evening hours. This could be by using only part of the building or by designating a building for use during vacation or evening hours. In either case, this would involve dividing part of the building into zones according to the heating and cooling system. Such a plan would make it necessary to prioritize shared spaces and induce participation by delivering the appropriate information to all campus members. The proportion of Friday classes should be increased so that classrooms can be used at the same time as other spaces to induce cost reduction through reducing energy consumption.
Second, the classification of building types reflective of space usage behavior could facilitate the preparation of an energy reduction plan suitable for the characteristics of each university building. The central or local government’s green building design standards and certification programs have evaluated facilities in relation to the physical characteristics of the building. Energy-related studies employ classifications based on total floor area, building type, and construction date to differentiate performance across various buildings. However, because university buildings have multiple functions and different space use patterns, even when they are intended for the same purpose, it is not appropriate to classify them using these criteria. This implies that considering the usage characteristics of the campus, it is necessary to identify a space zone, classify the building type, and establish an appropriate energy-saving plan accordingly. In this study, the facilities where lectures occurred were targeted, and spaces were classified according to the factors that affected the main activities and system operations.
Third, using a simulation program, ways to reduce heating and cooling energy consumption were explored through efficient space use to propose optimal building operations. When designing a building, it is desirable to arrange rooms with the same purpose to be concentrated in one place and to ensure that mechanical facilities are zoned for each room with the same function. However, in the case of classrooms, there are various usage patterns and differences in frequency and occupancy. For example, some classrooms were used flexibly or only on specific days, such as Saturdays. Accordingly, heating and cooling system operations at the zone level, or heat gains and losses, occurred depending on indoor environmental conditions, which could lead to the wasteful use of heating and cooling energy. To address this wastage, an appropriately sized classroom should be planned first. For example, in the case of Korea University, the classrooms should be medium and small rather than large. Given that the ratio of small- to medium-sized rooms needed for each building varies, it is necessary to analyze the current numbers of classes and students and to consider future needs.
7. Conclusions
This study explored ways to implement a low-carbon campus by conducting a case study to propose directions for energy-efficient operation. The university buildings exhibited differences in function and usage patterns, and there were no significant differences in the factors affecting energy consumption, except for the increase in total floor area, among building characteristics. Accordingly, three stages were executed in this explorative study focusing on space usage to reduce the university buildings’ cooling and heating load: (1) Analysis of energy usage on campus; (2) classification of academic facilities based on space usage behavior; and (3) analysis of heating and cooling energy consumption based on classroom usage patterns.
It is challenging to generalize the results of this study, as it examined only a few buildings of a specific university as a case study. However, it is crucial to investigate how to implement low-carbon environments in university buildings to reduce energy consumption and ensure sustainable living. This study is significant because it provides vital evidence of the importance of space usage in energy savings in university buildings. The research results can guide the development of optimal approaches for energy savings in university buildings, tailored to each university and building, by ensuring effective space planning and utilization on campuses. To expand the study results and increase the generalizability of our findings, follow-up studies will be conducted by increasing the number of case samples and researching other academic buildings, such as support facilities, research facilities, and affiliated facilities.


