
Solar Heat Gain Simulations for Energy-Efficient Guest Allocation in a Large Hotel Tower in Madrid

 , and
, and 
Abstract
1. Introduction
Literature Review
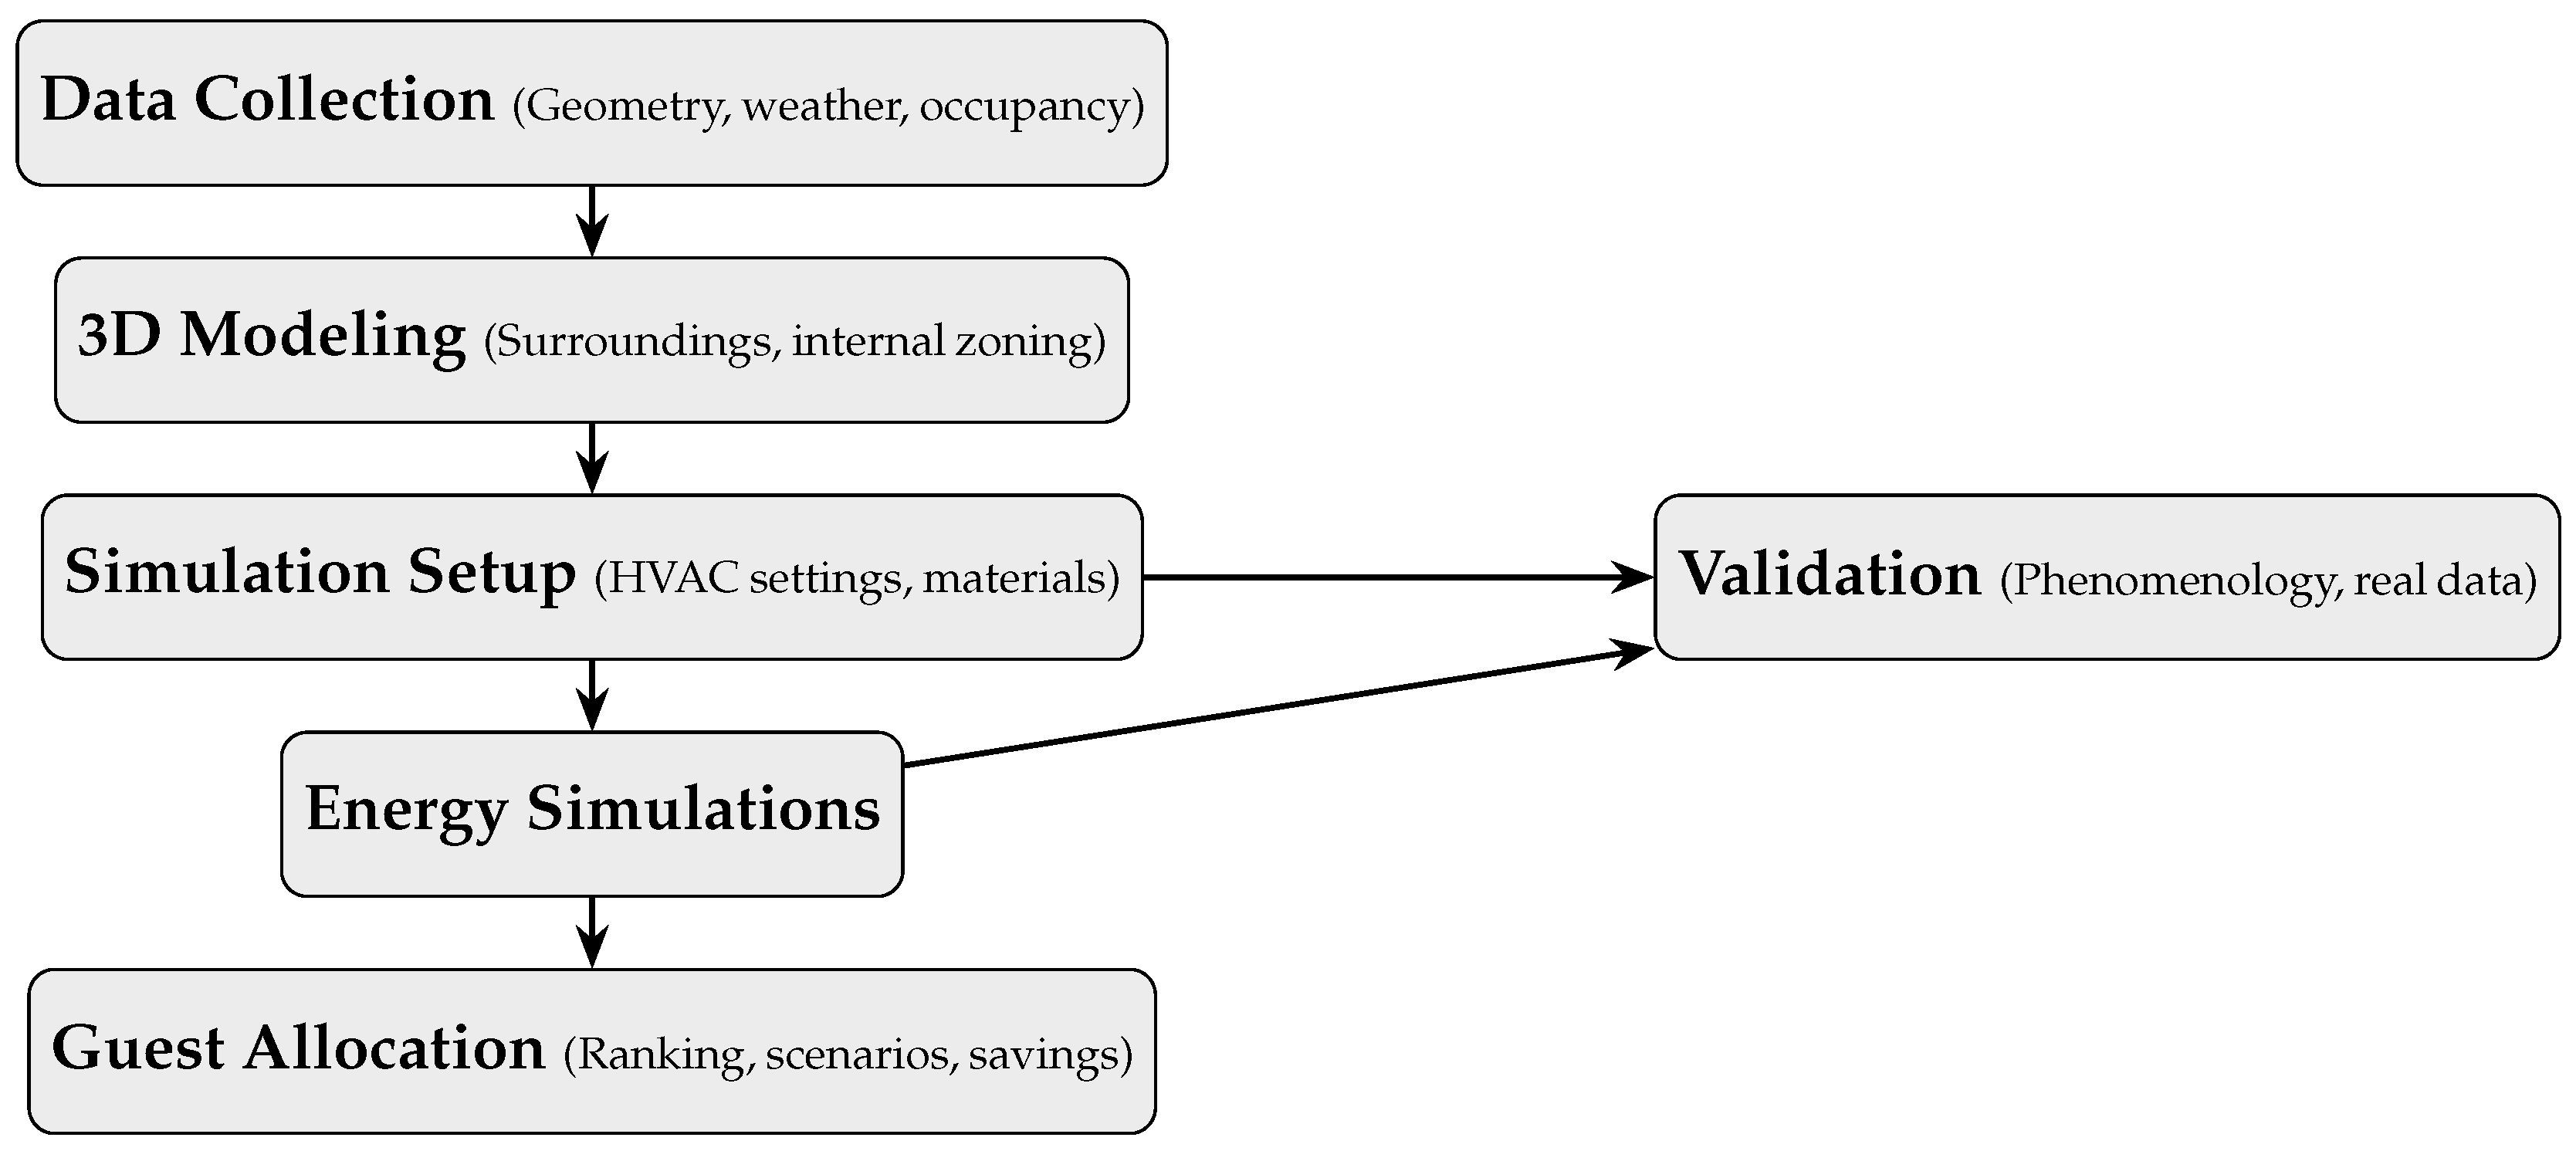
2. Methods
2.1. Case Study
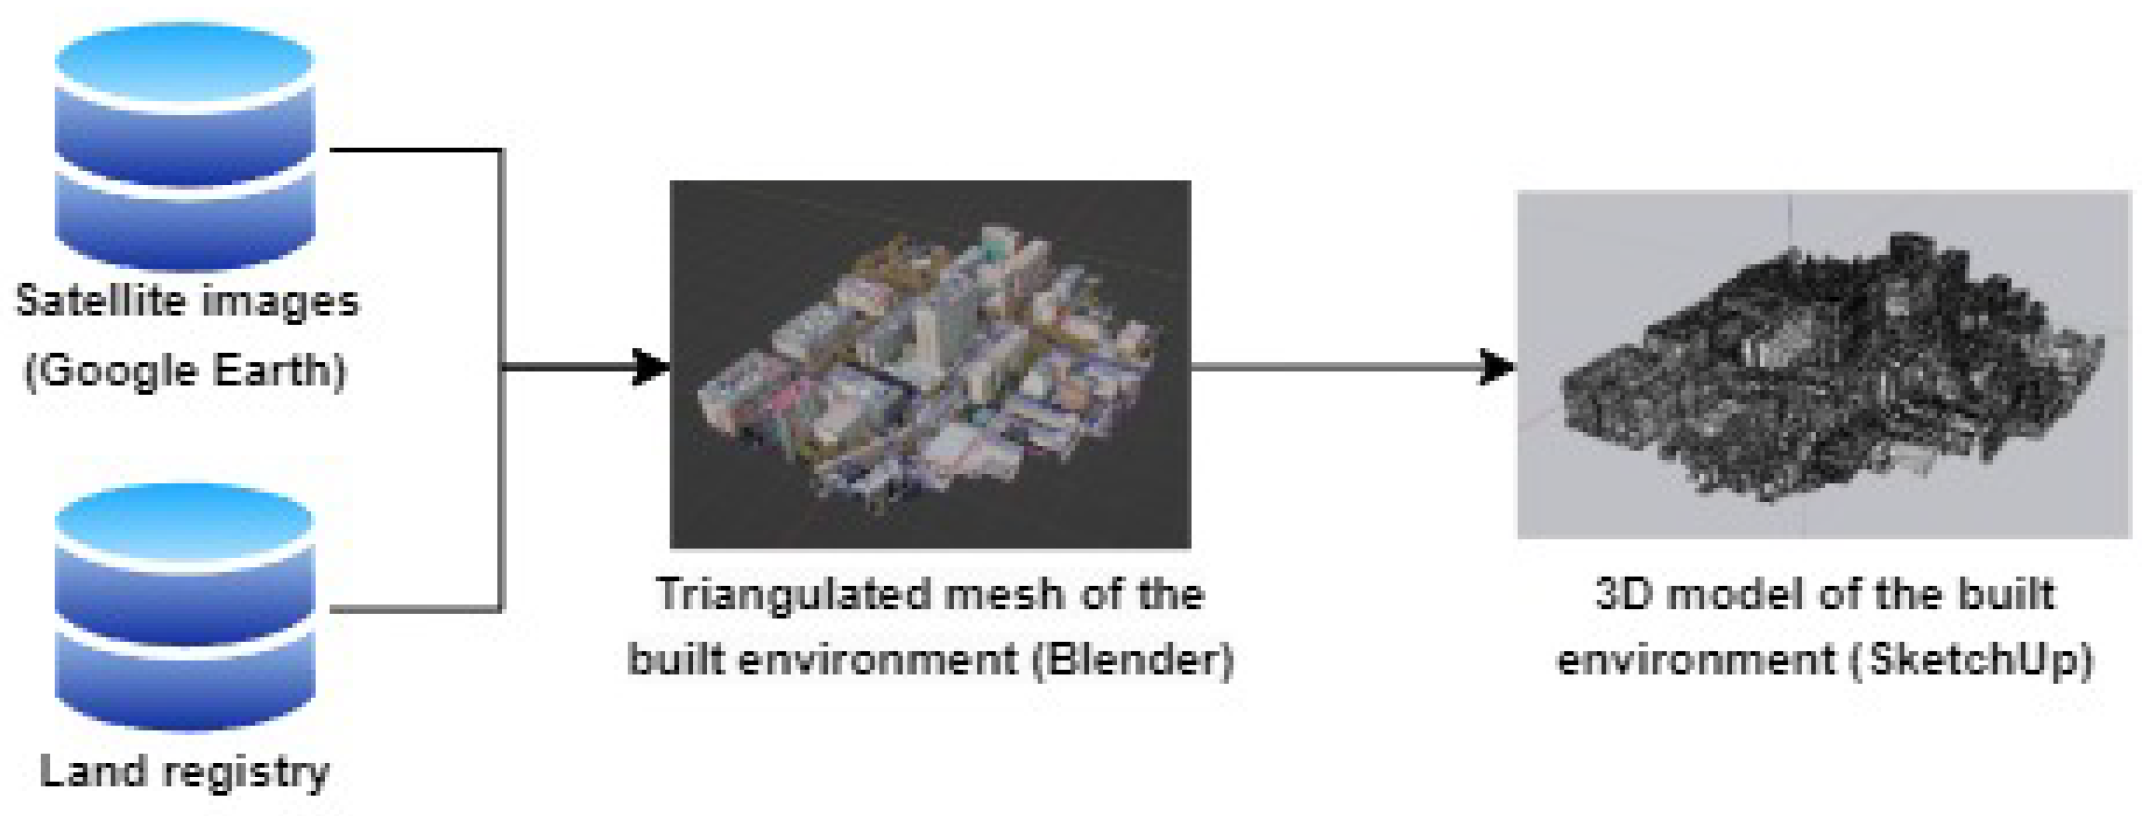
2.2. 3D Modeling
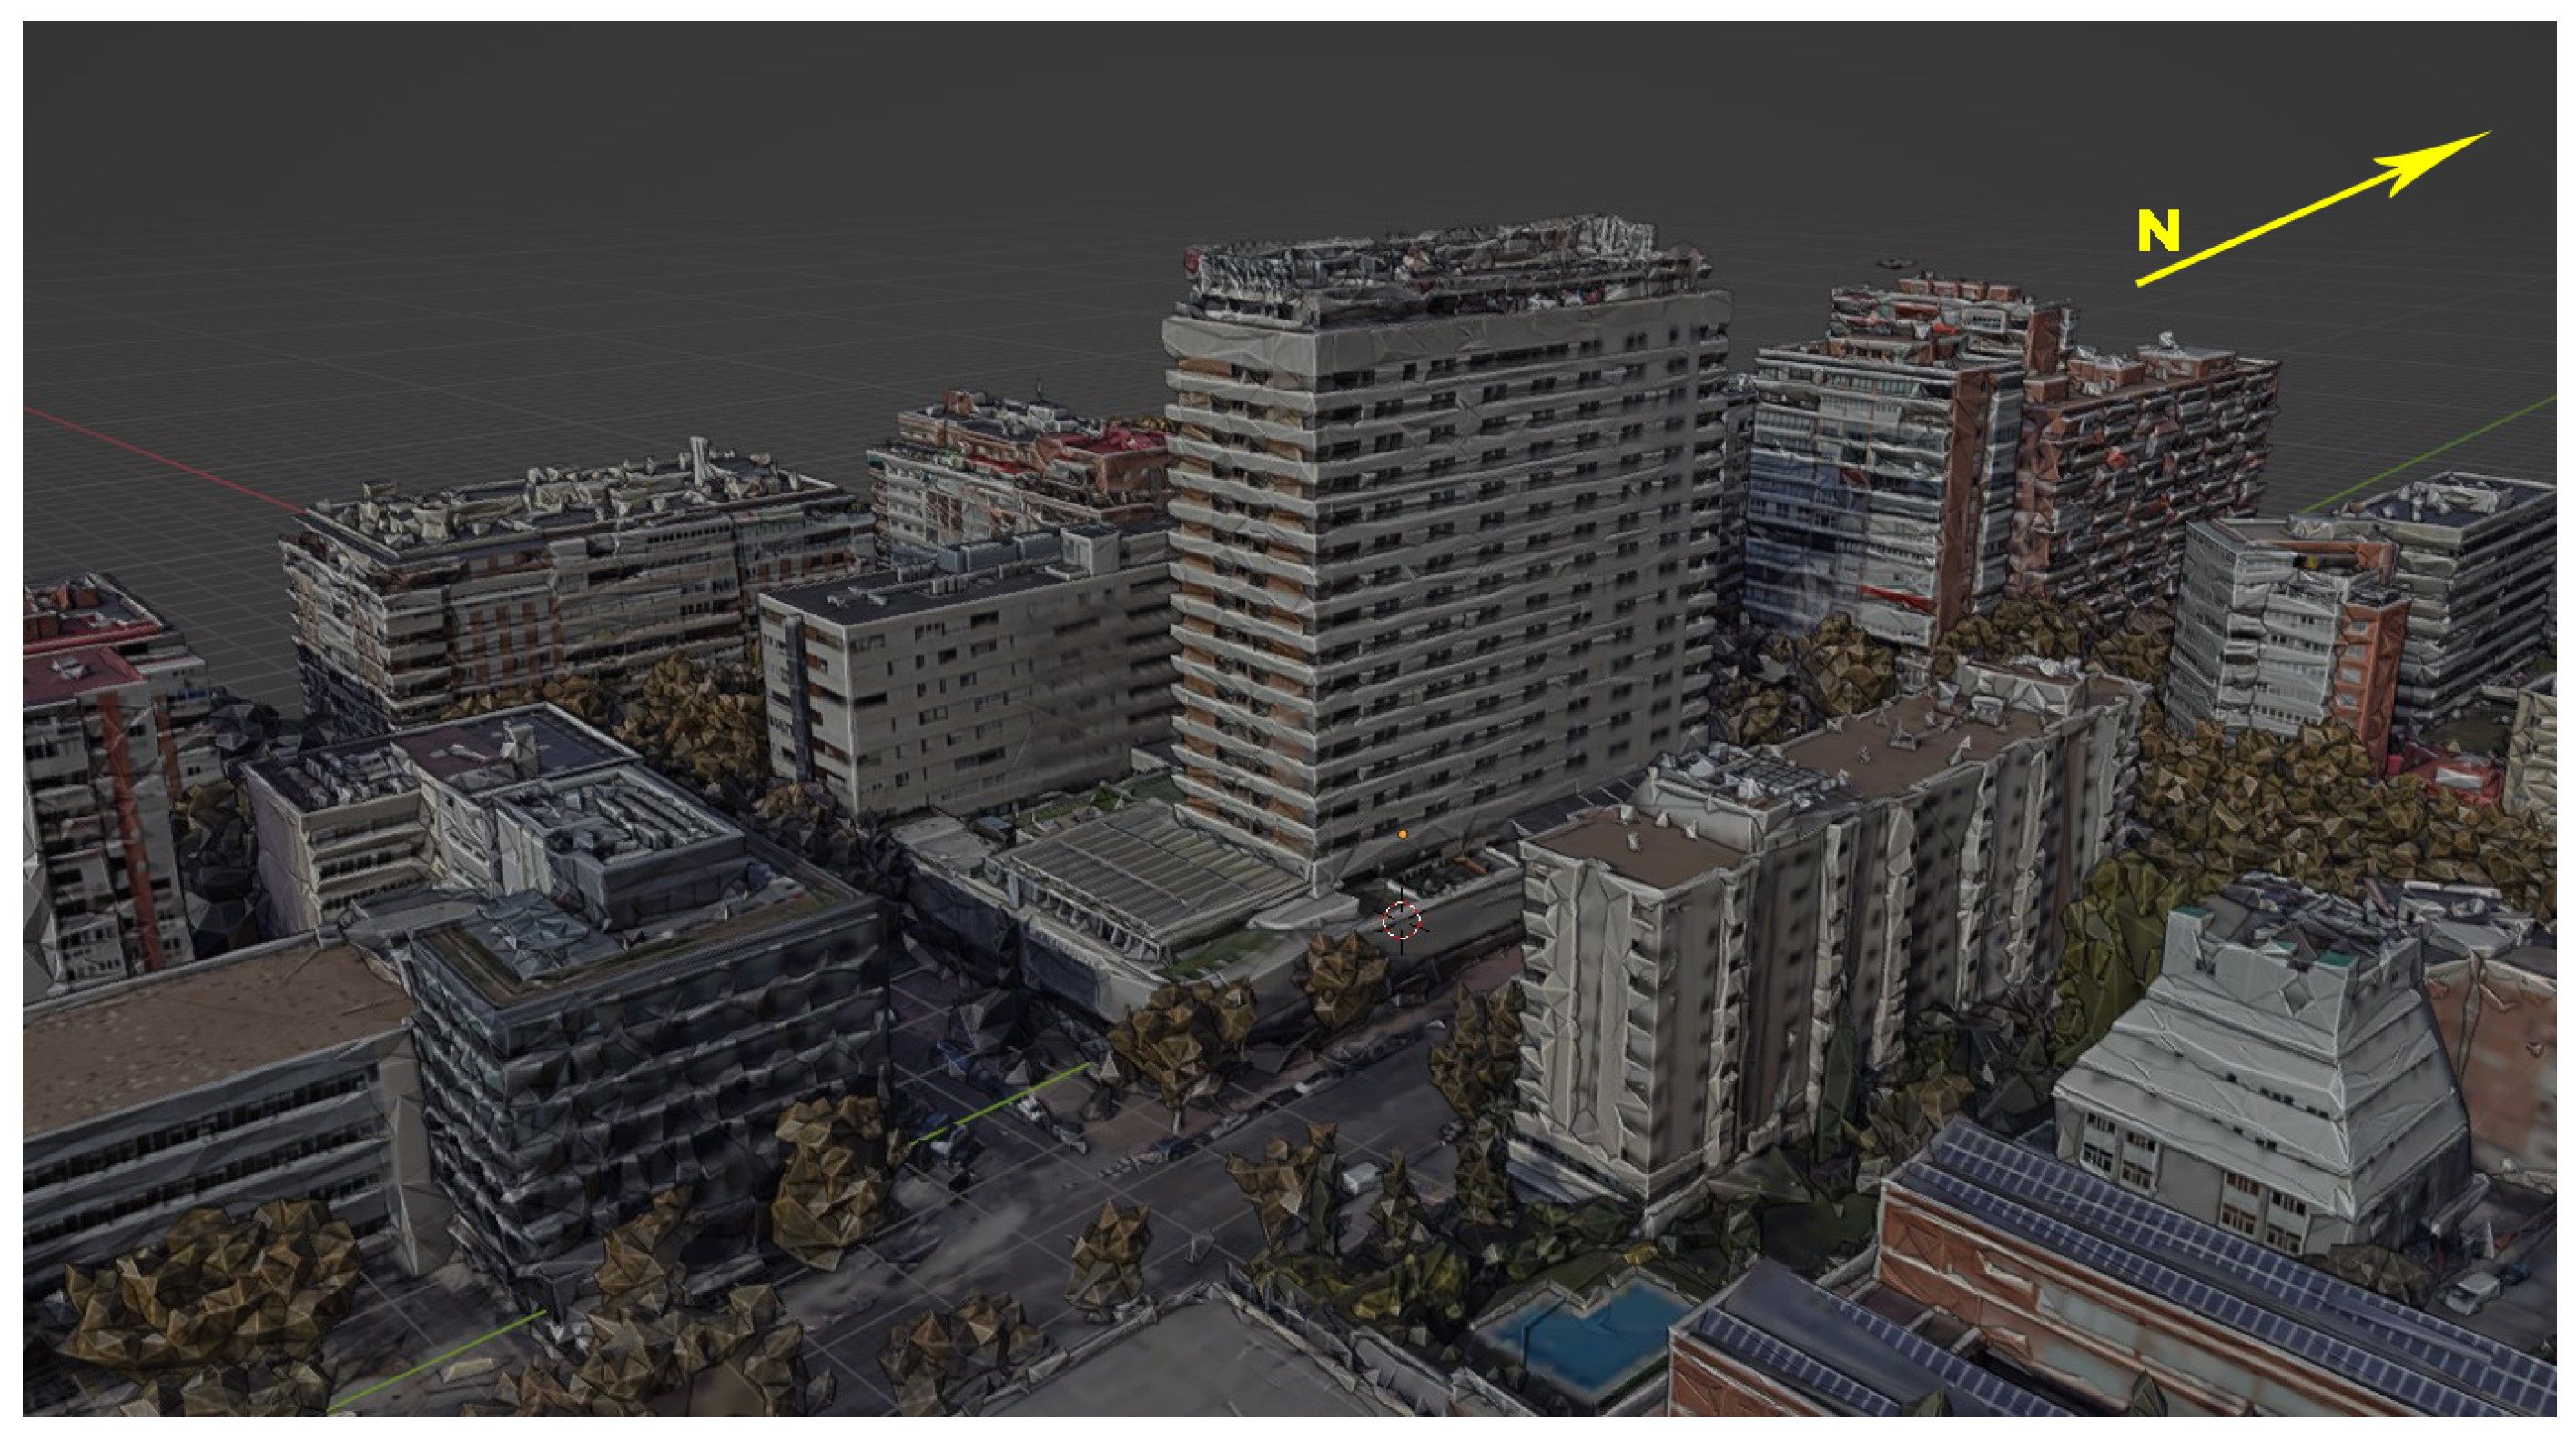
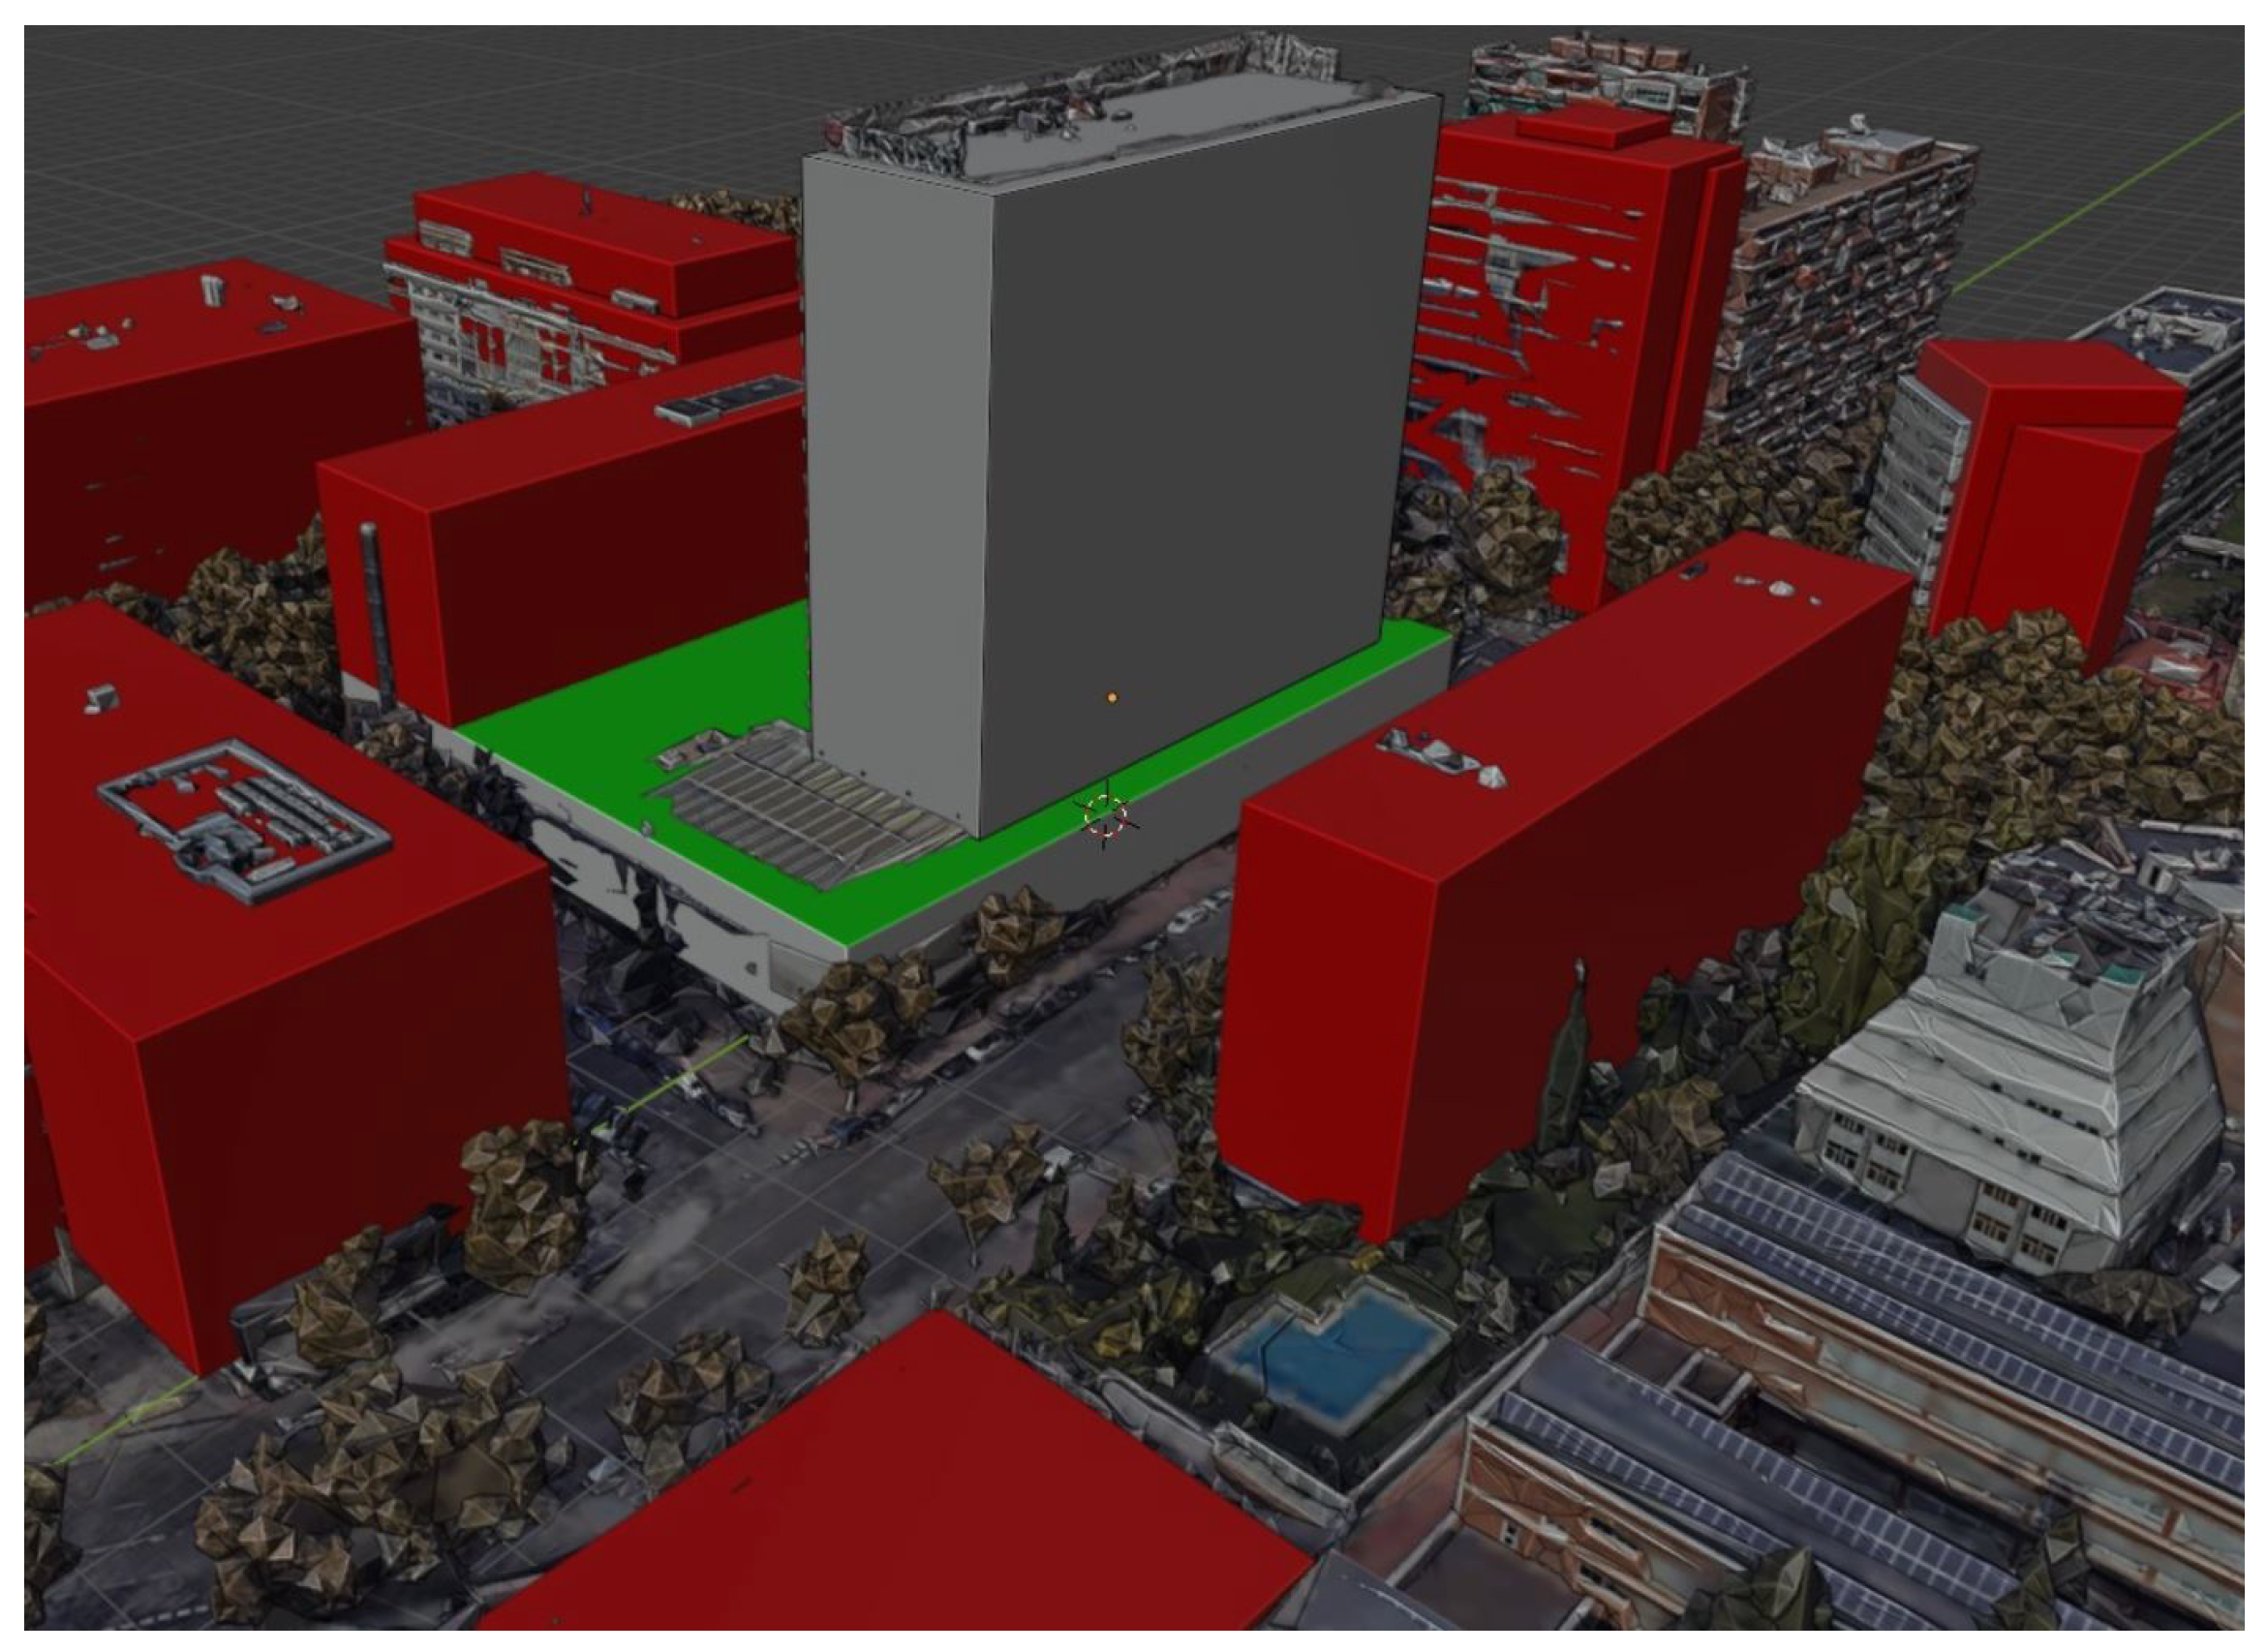
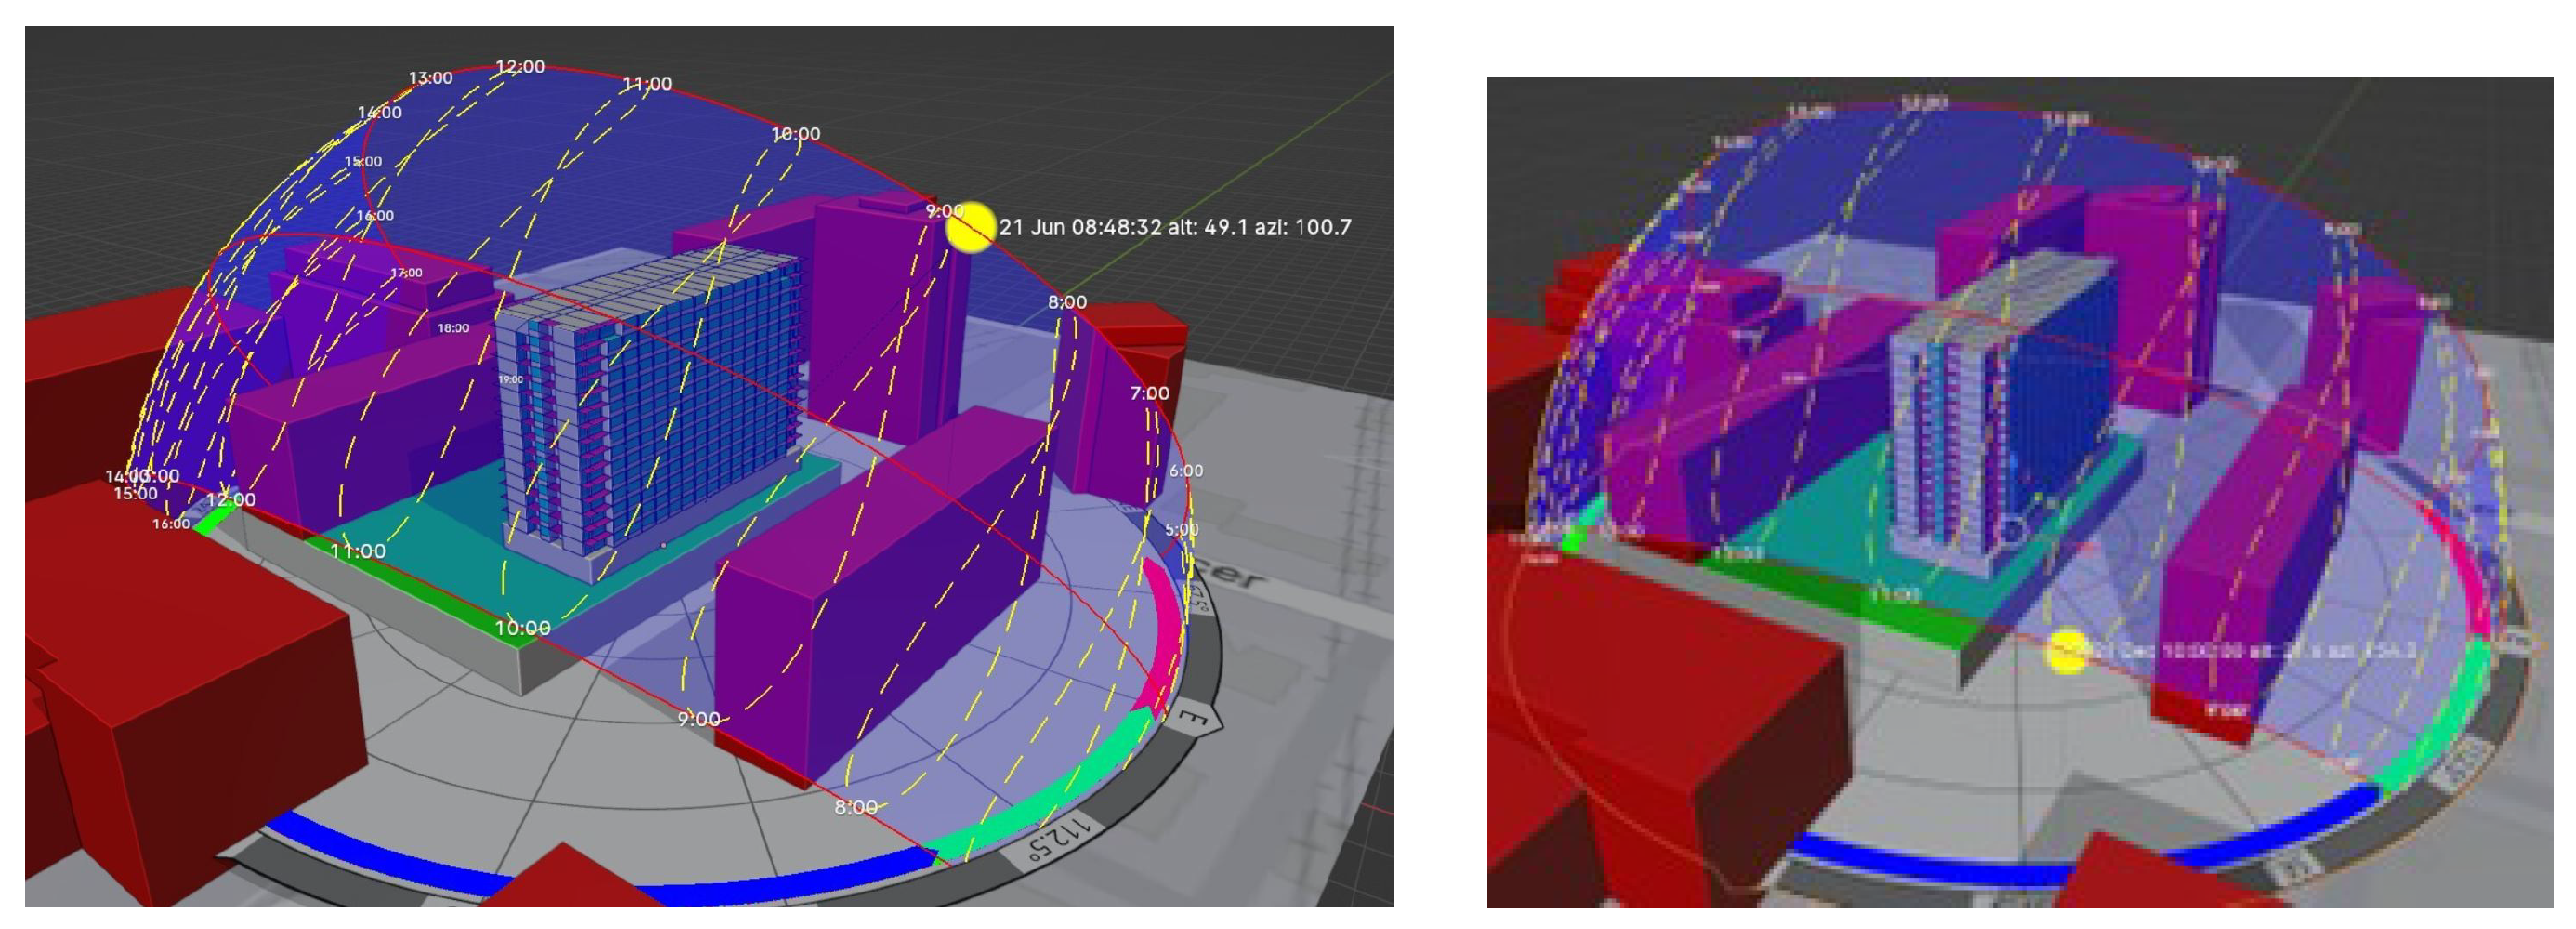
2.2.1. Modeling of the Surrounding Built Environment
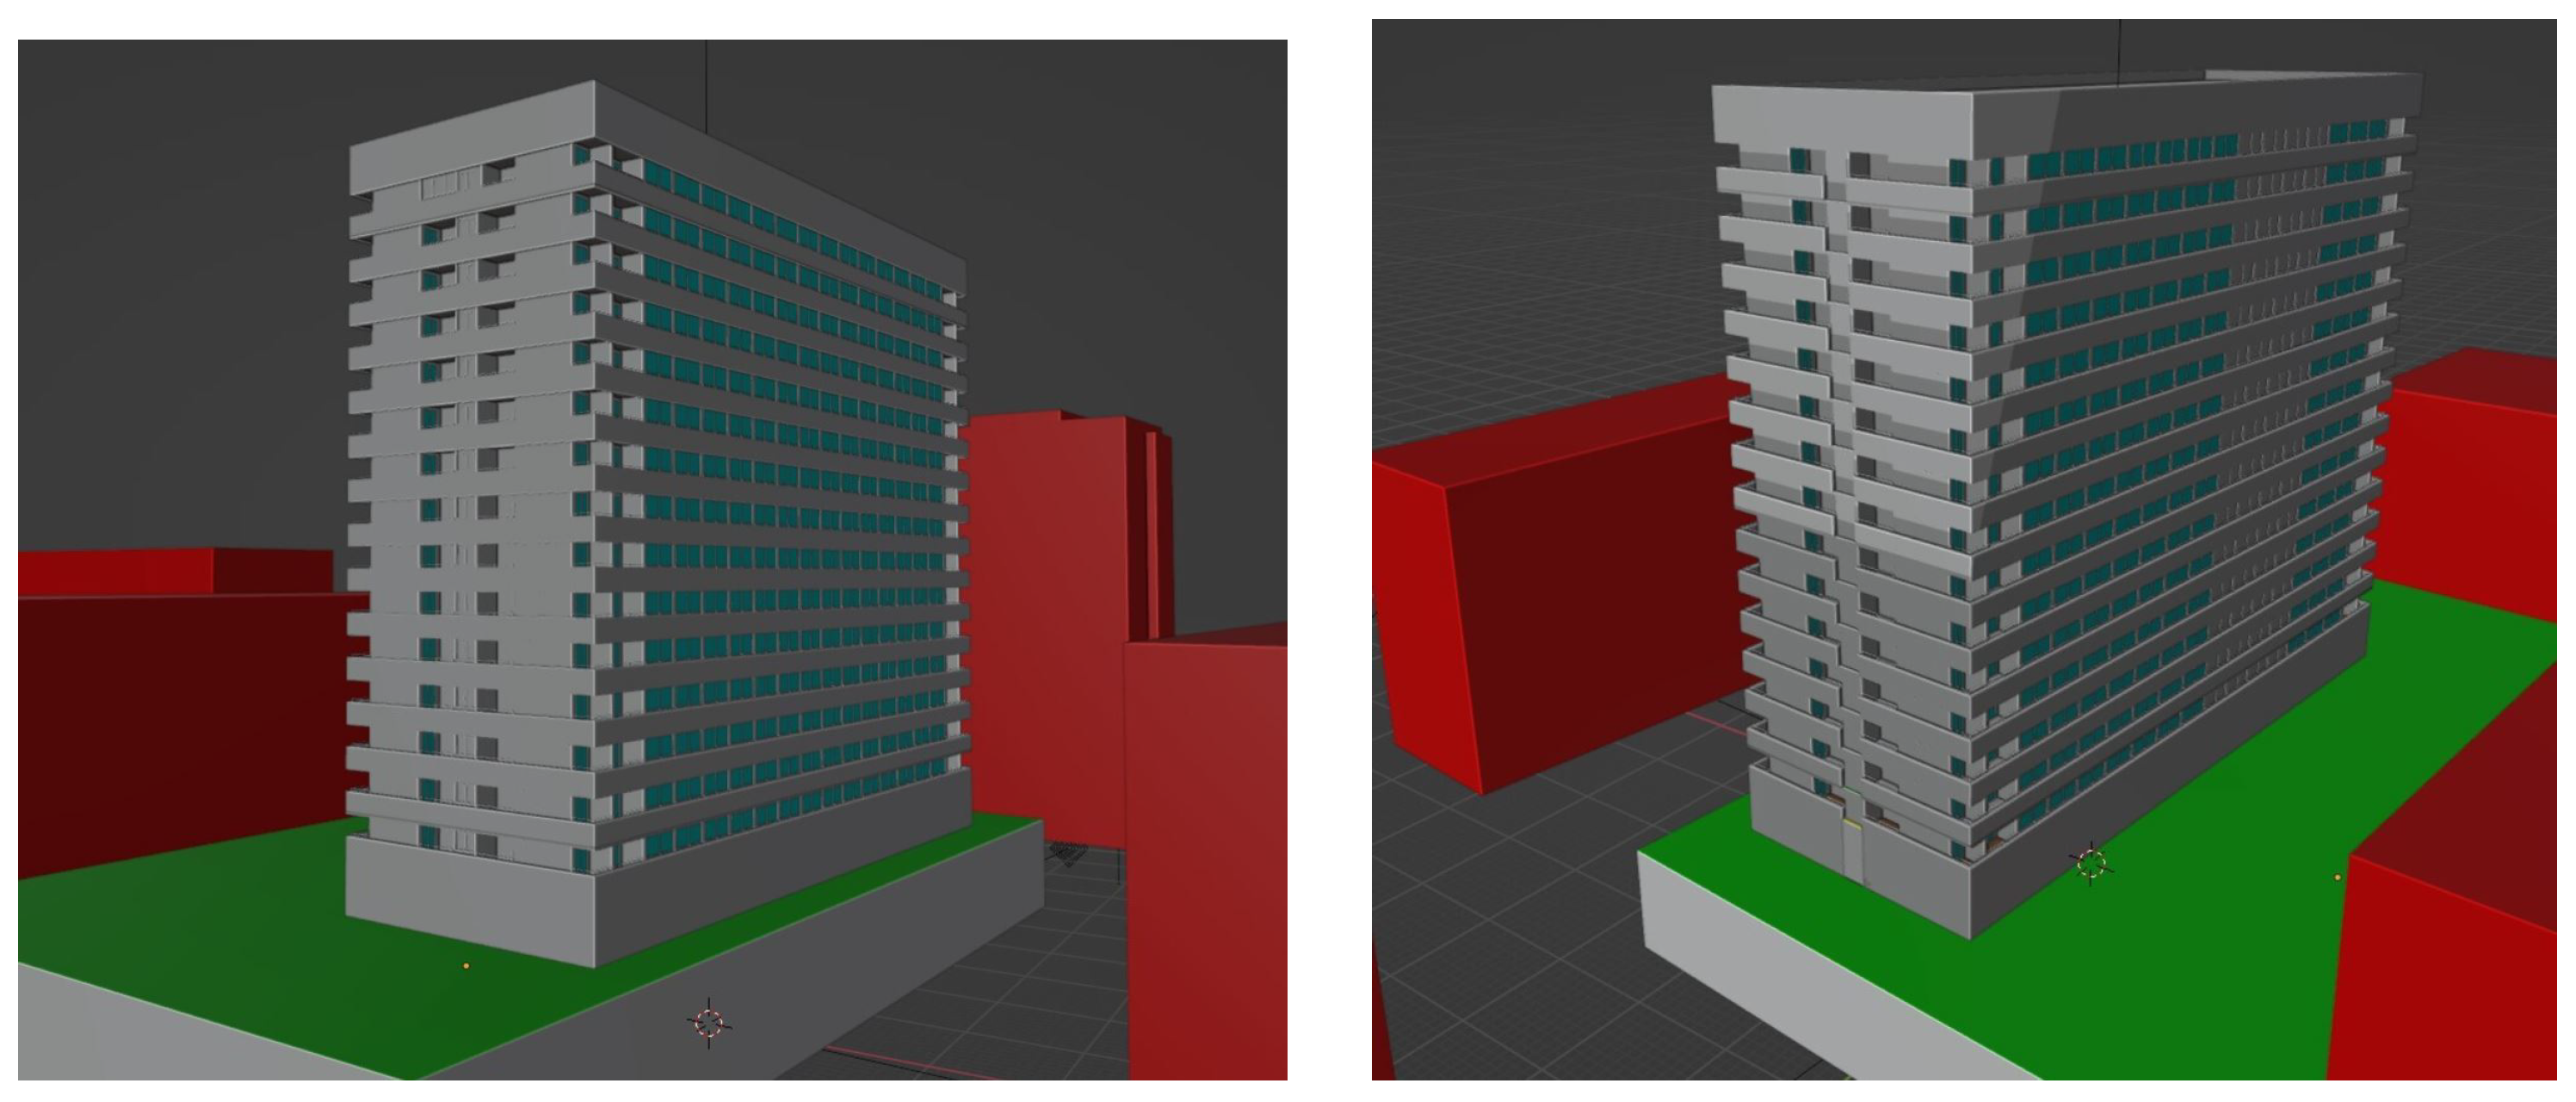
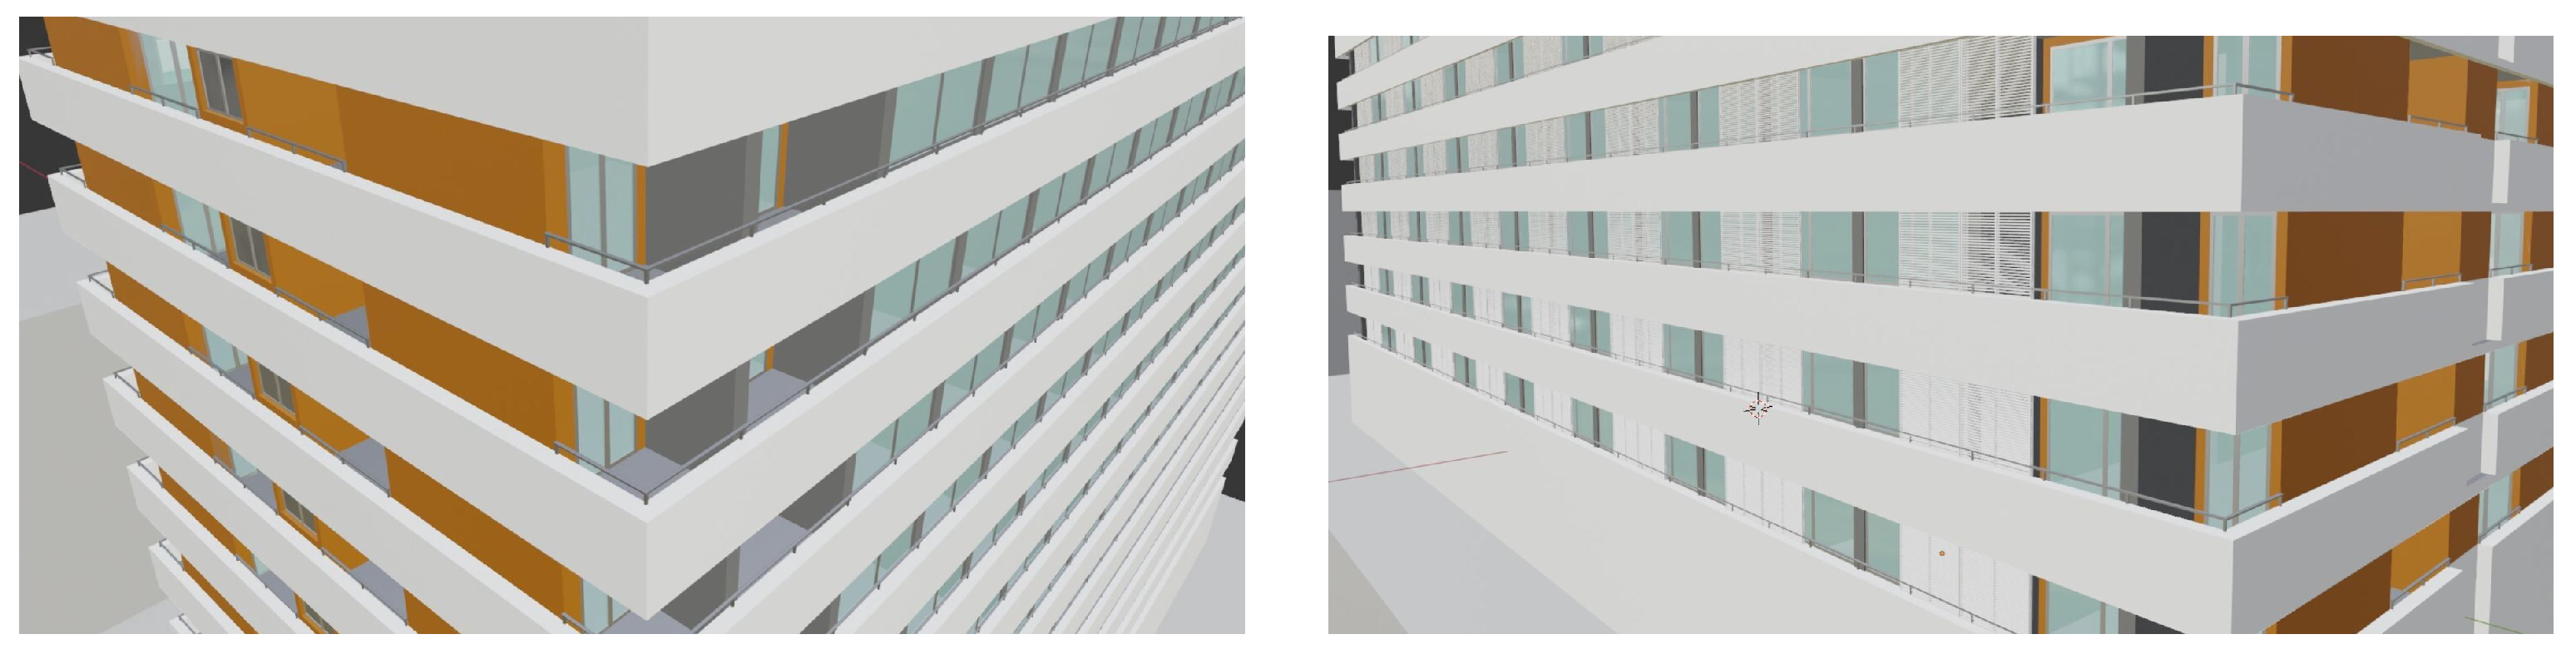
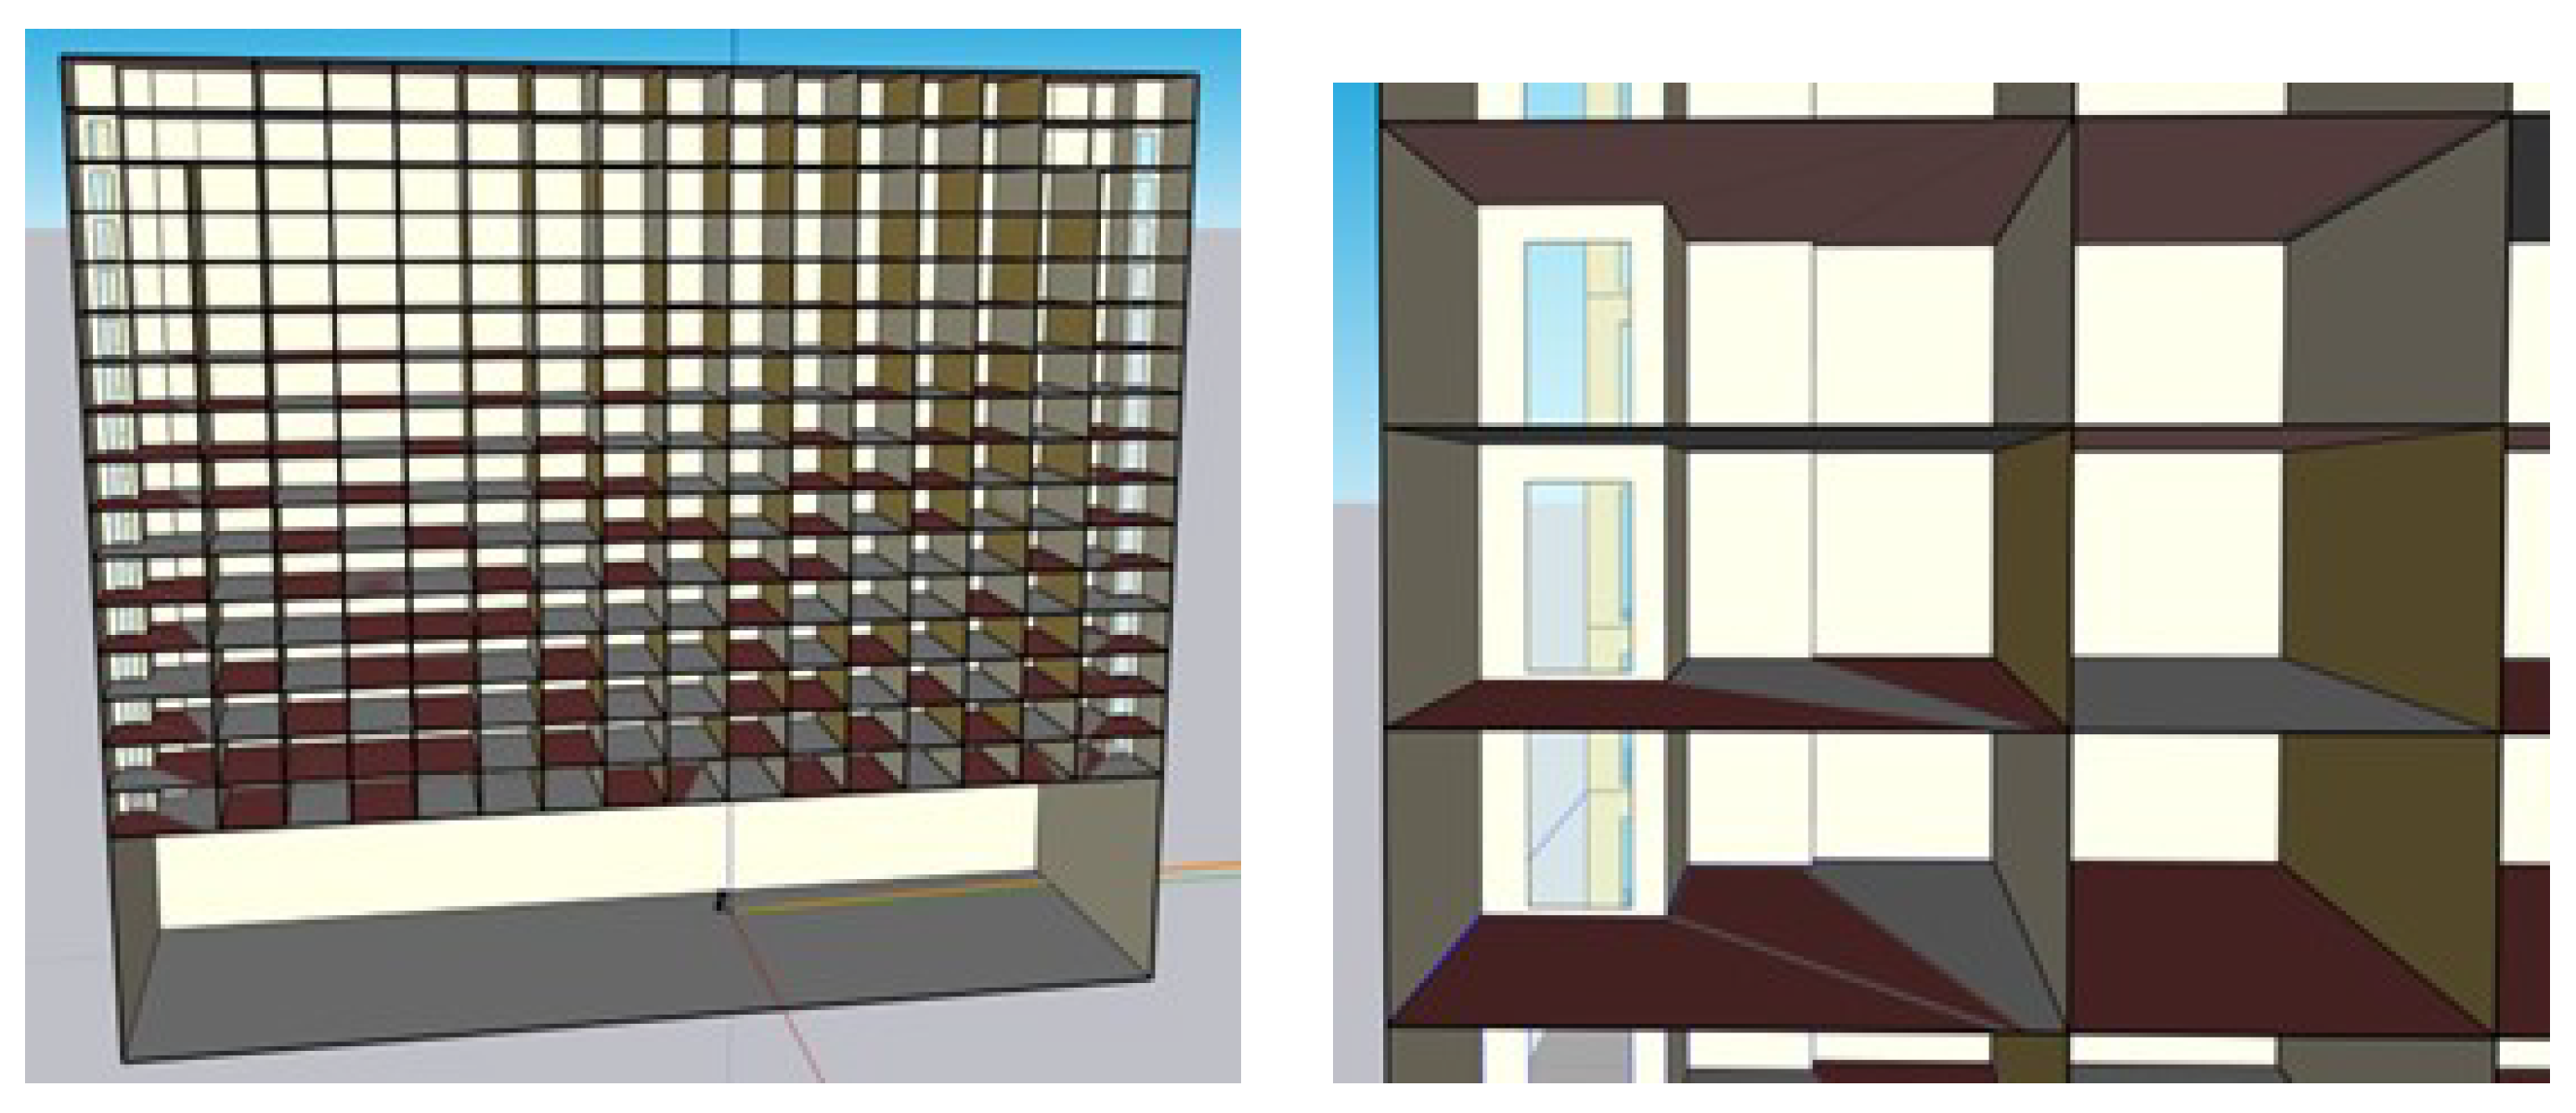
2.2.2. Detailed 3D Modeling of the Hotel Tower
2.3. Building Thermal Behavior Modeling
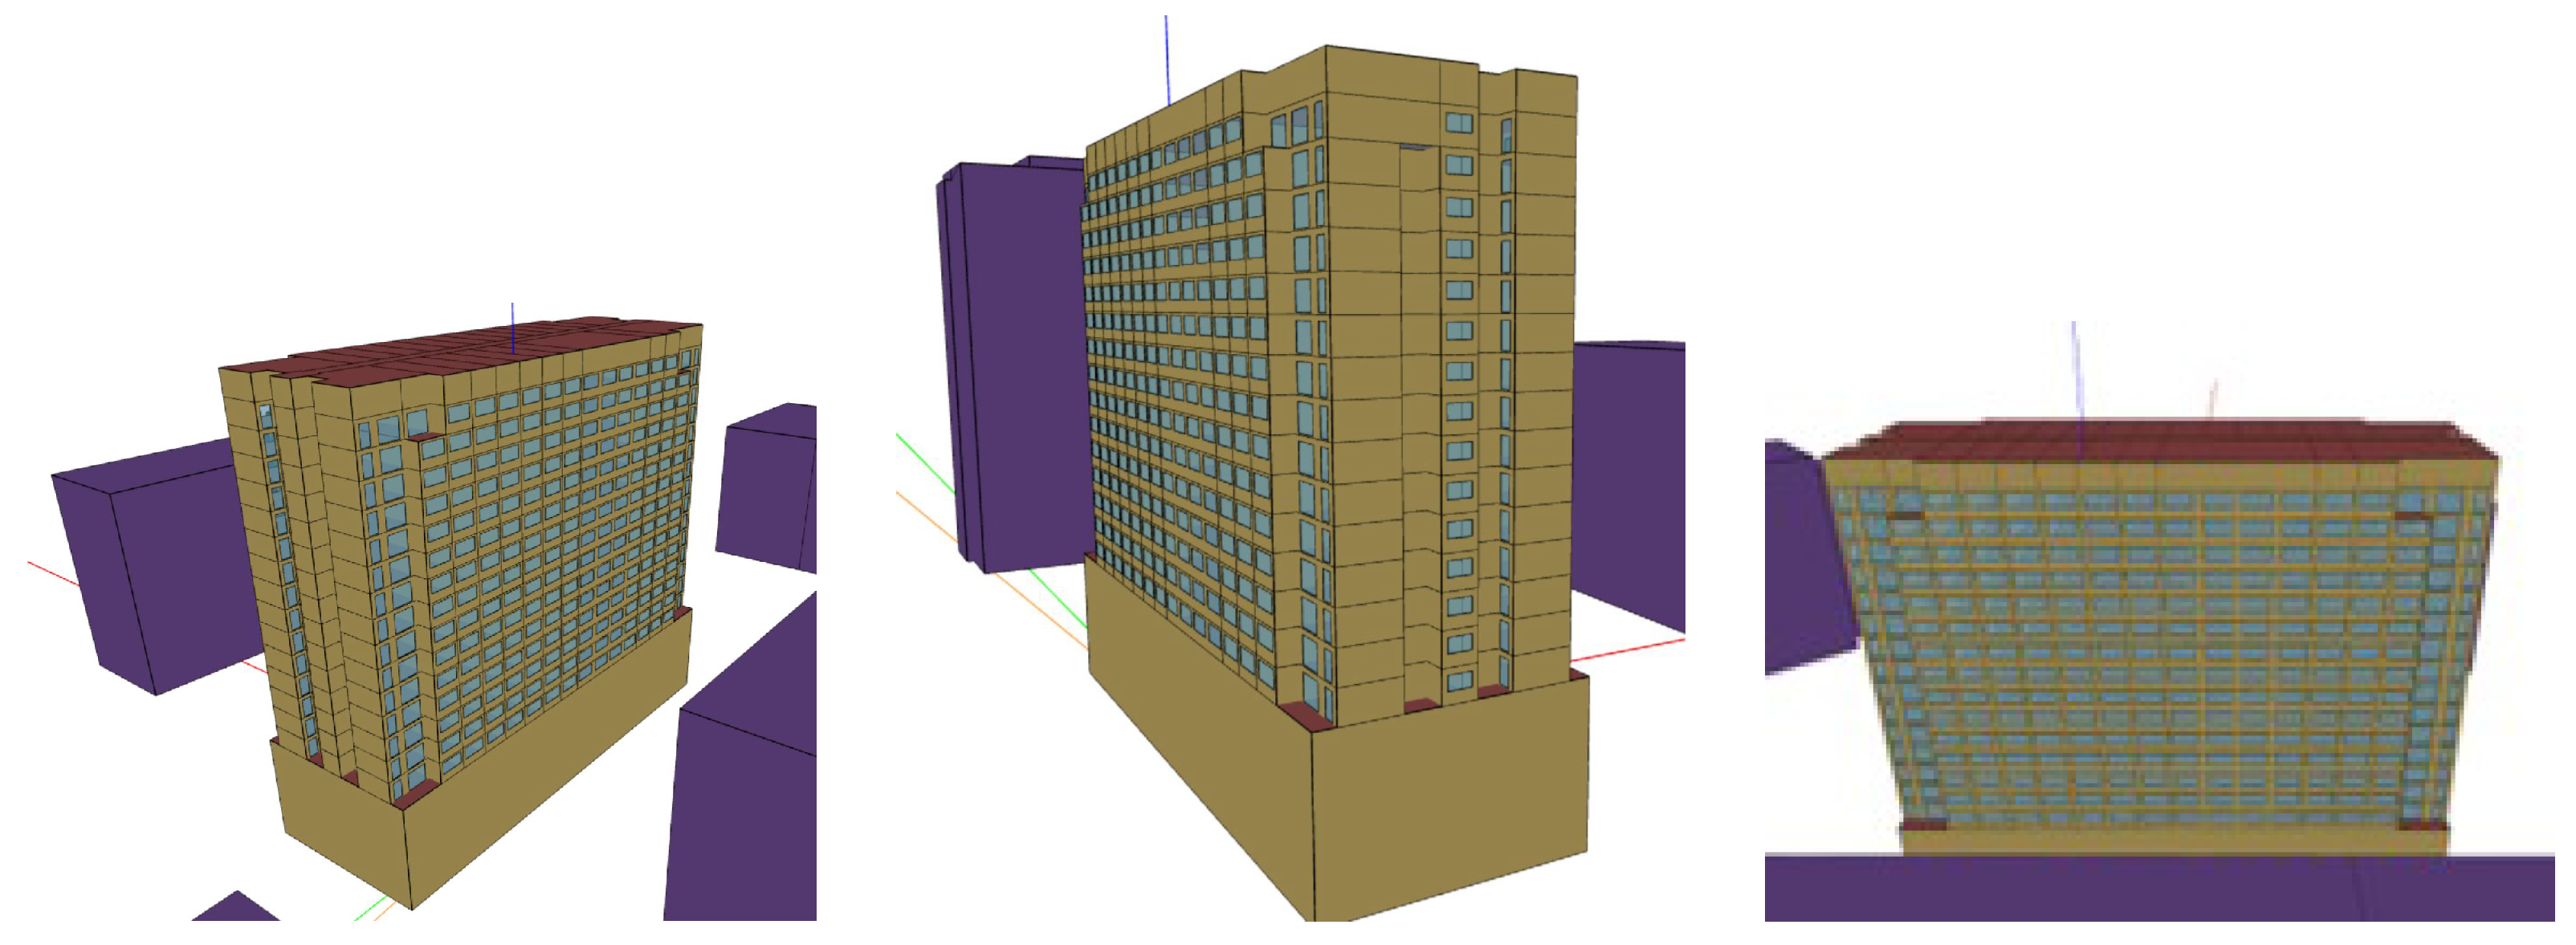
2.3.1. Simulation Environment
2.3.2. Materials
2.3.3. Thermal Control Modeling
2.3.4. HVAC Modeling
2.3.5. Weather Modeling
2.3.6. Additional Available Data
2.3.7. Occupancy-Dependent HVAC Energy Consumption Calculation
2.4. Simulation Results Validation
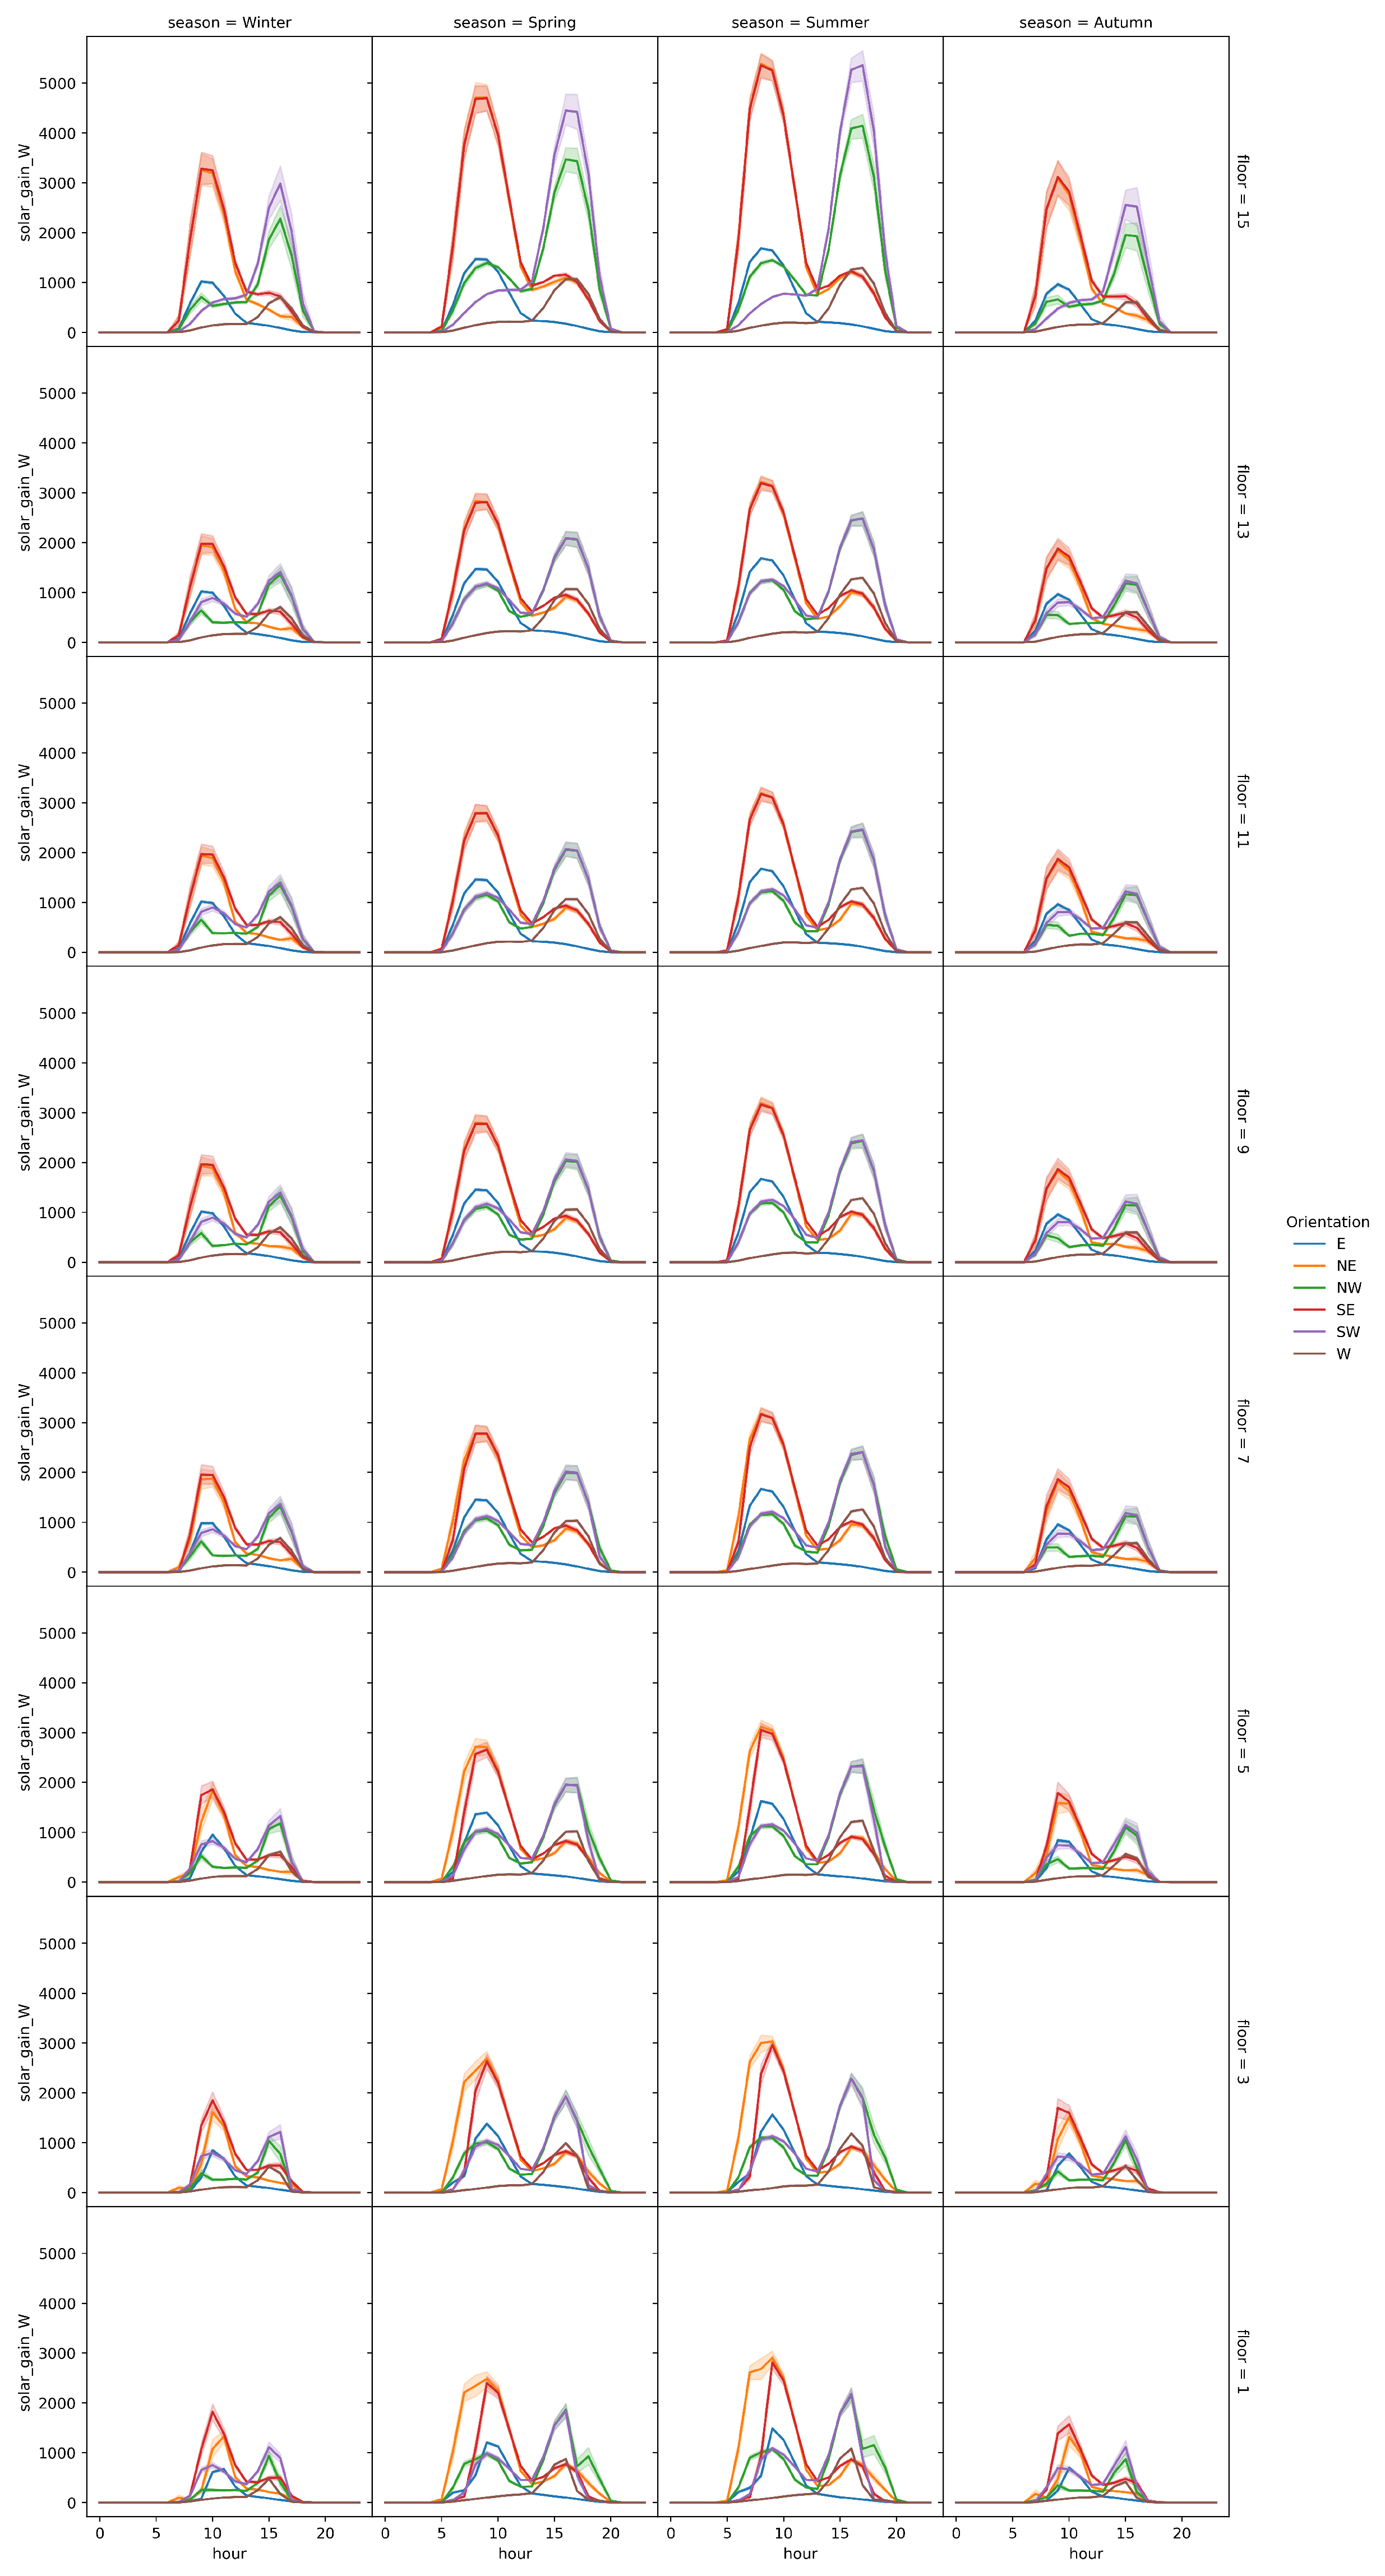
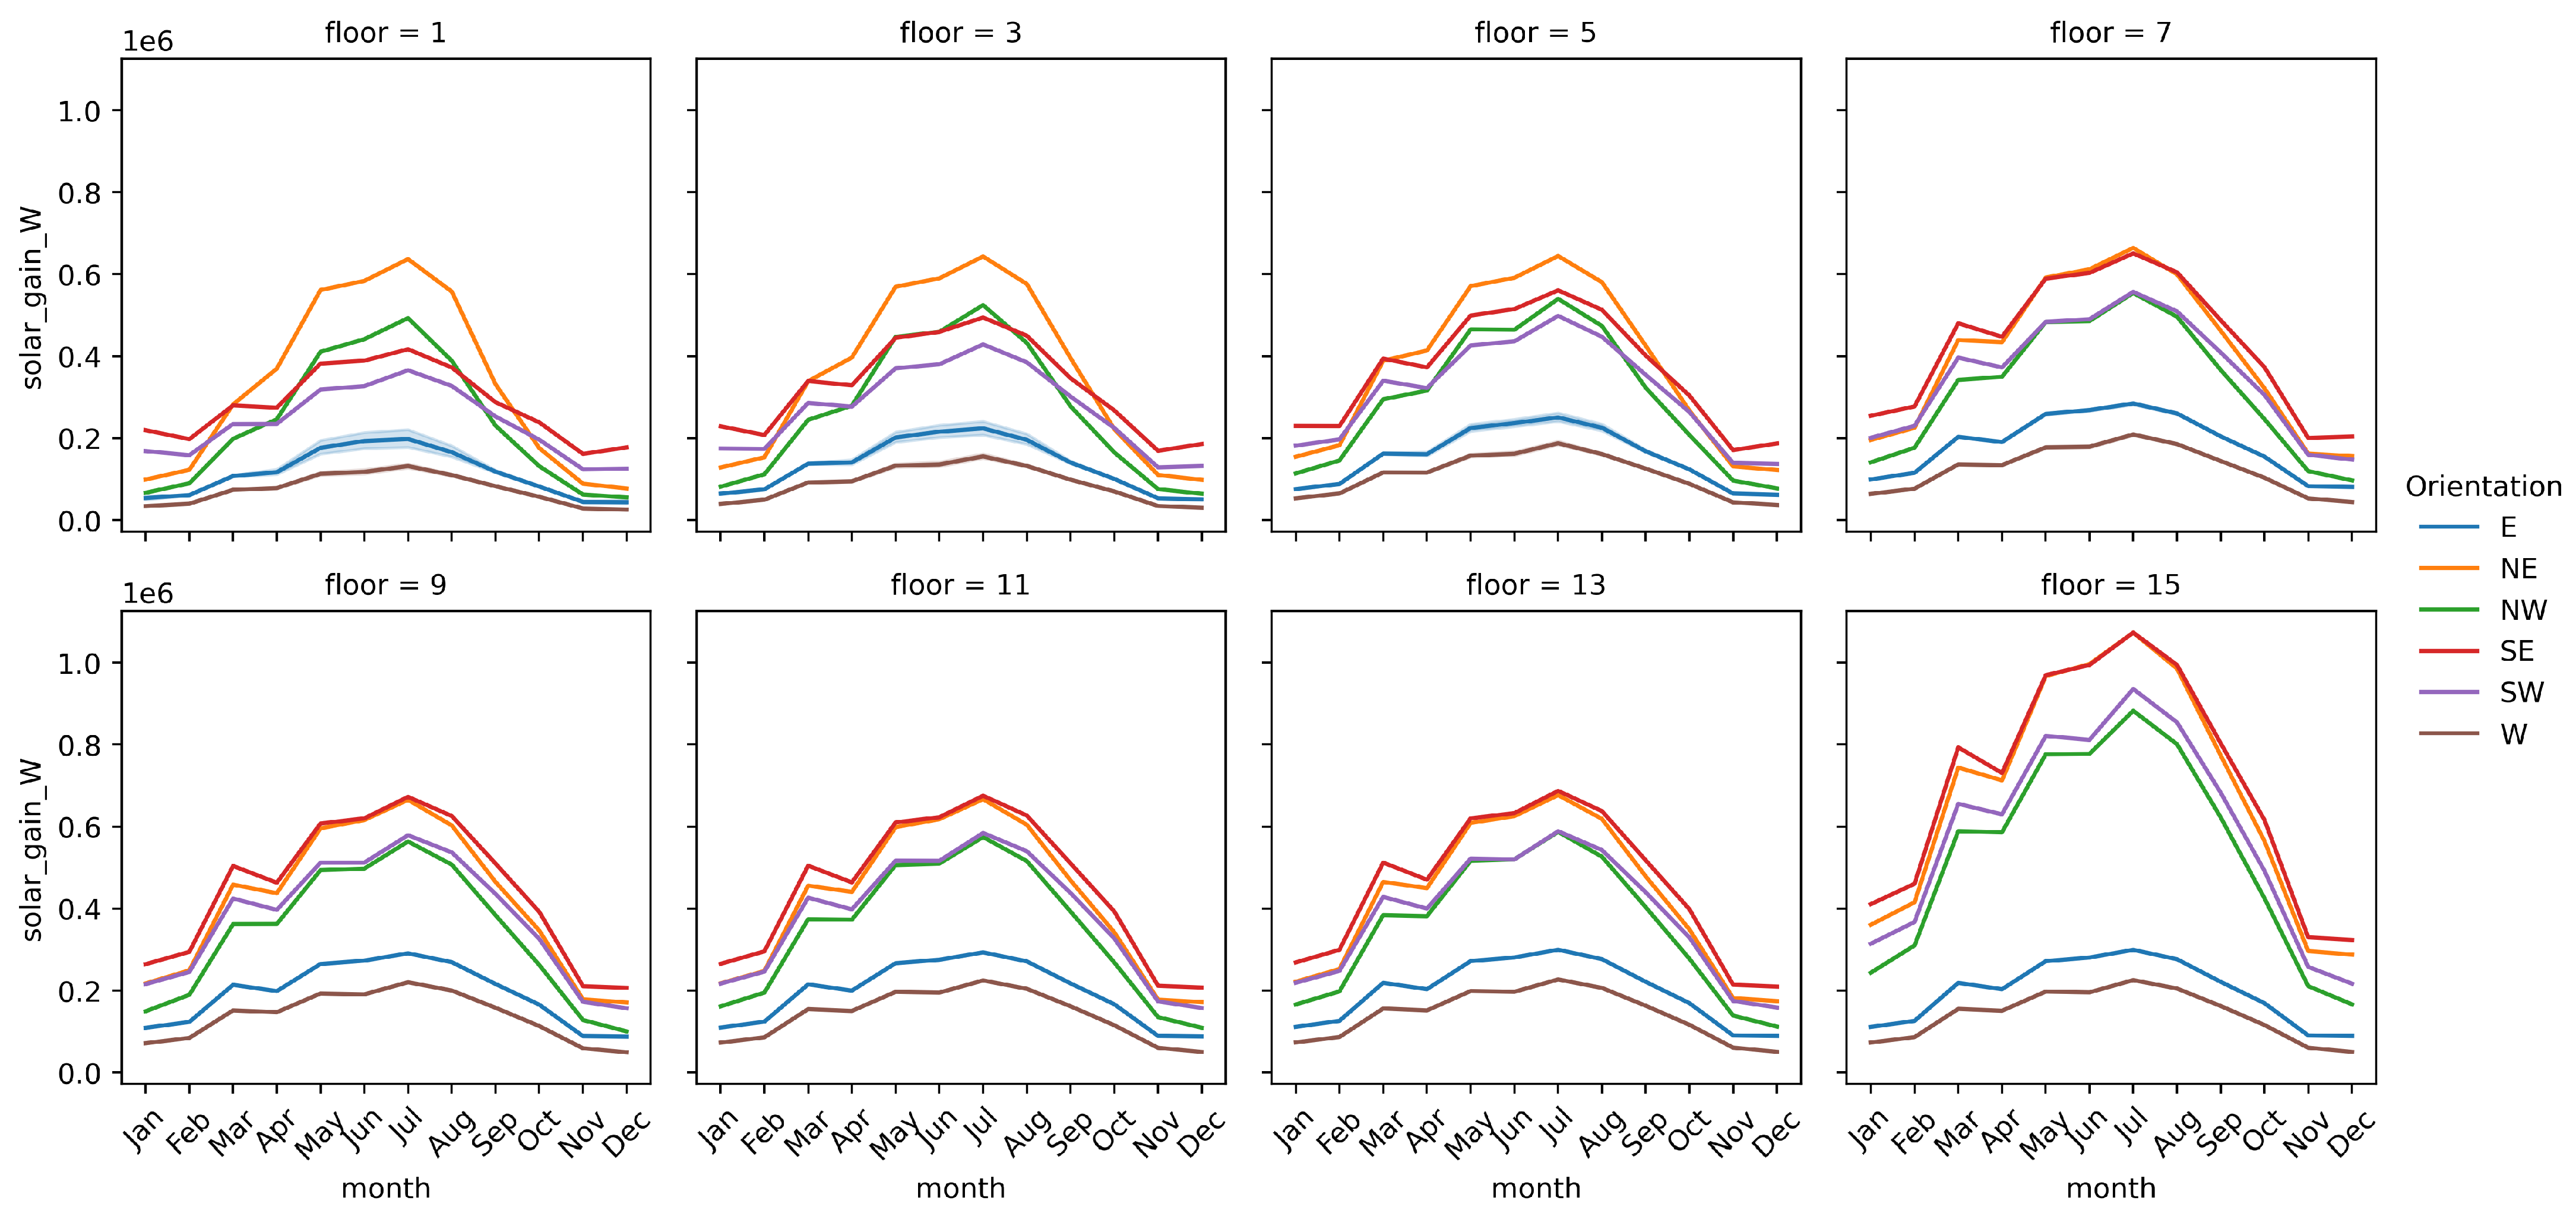
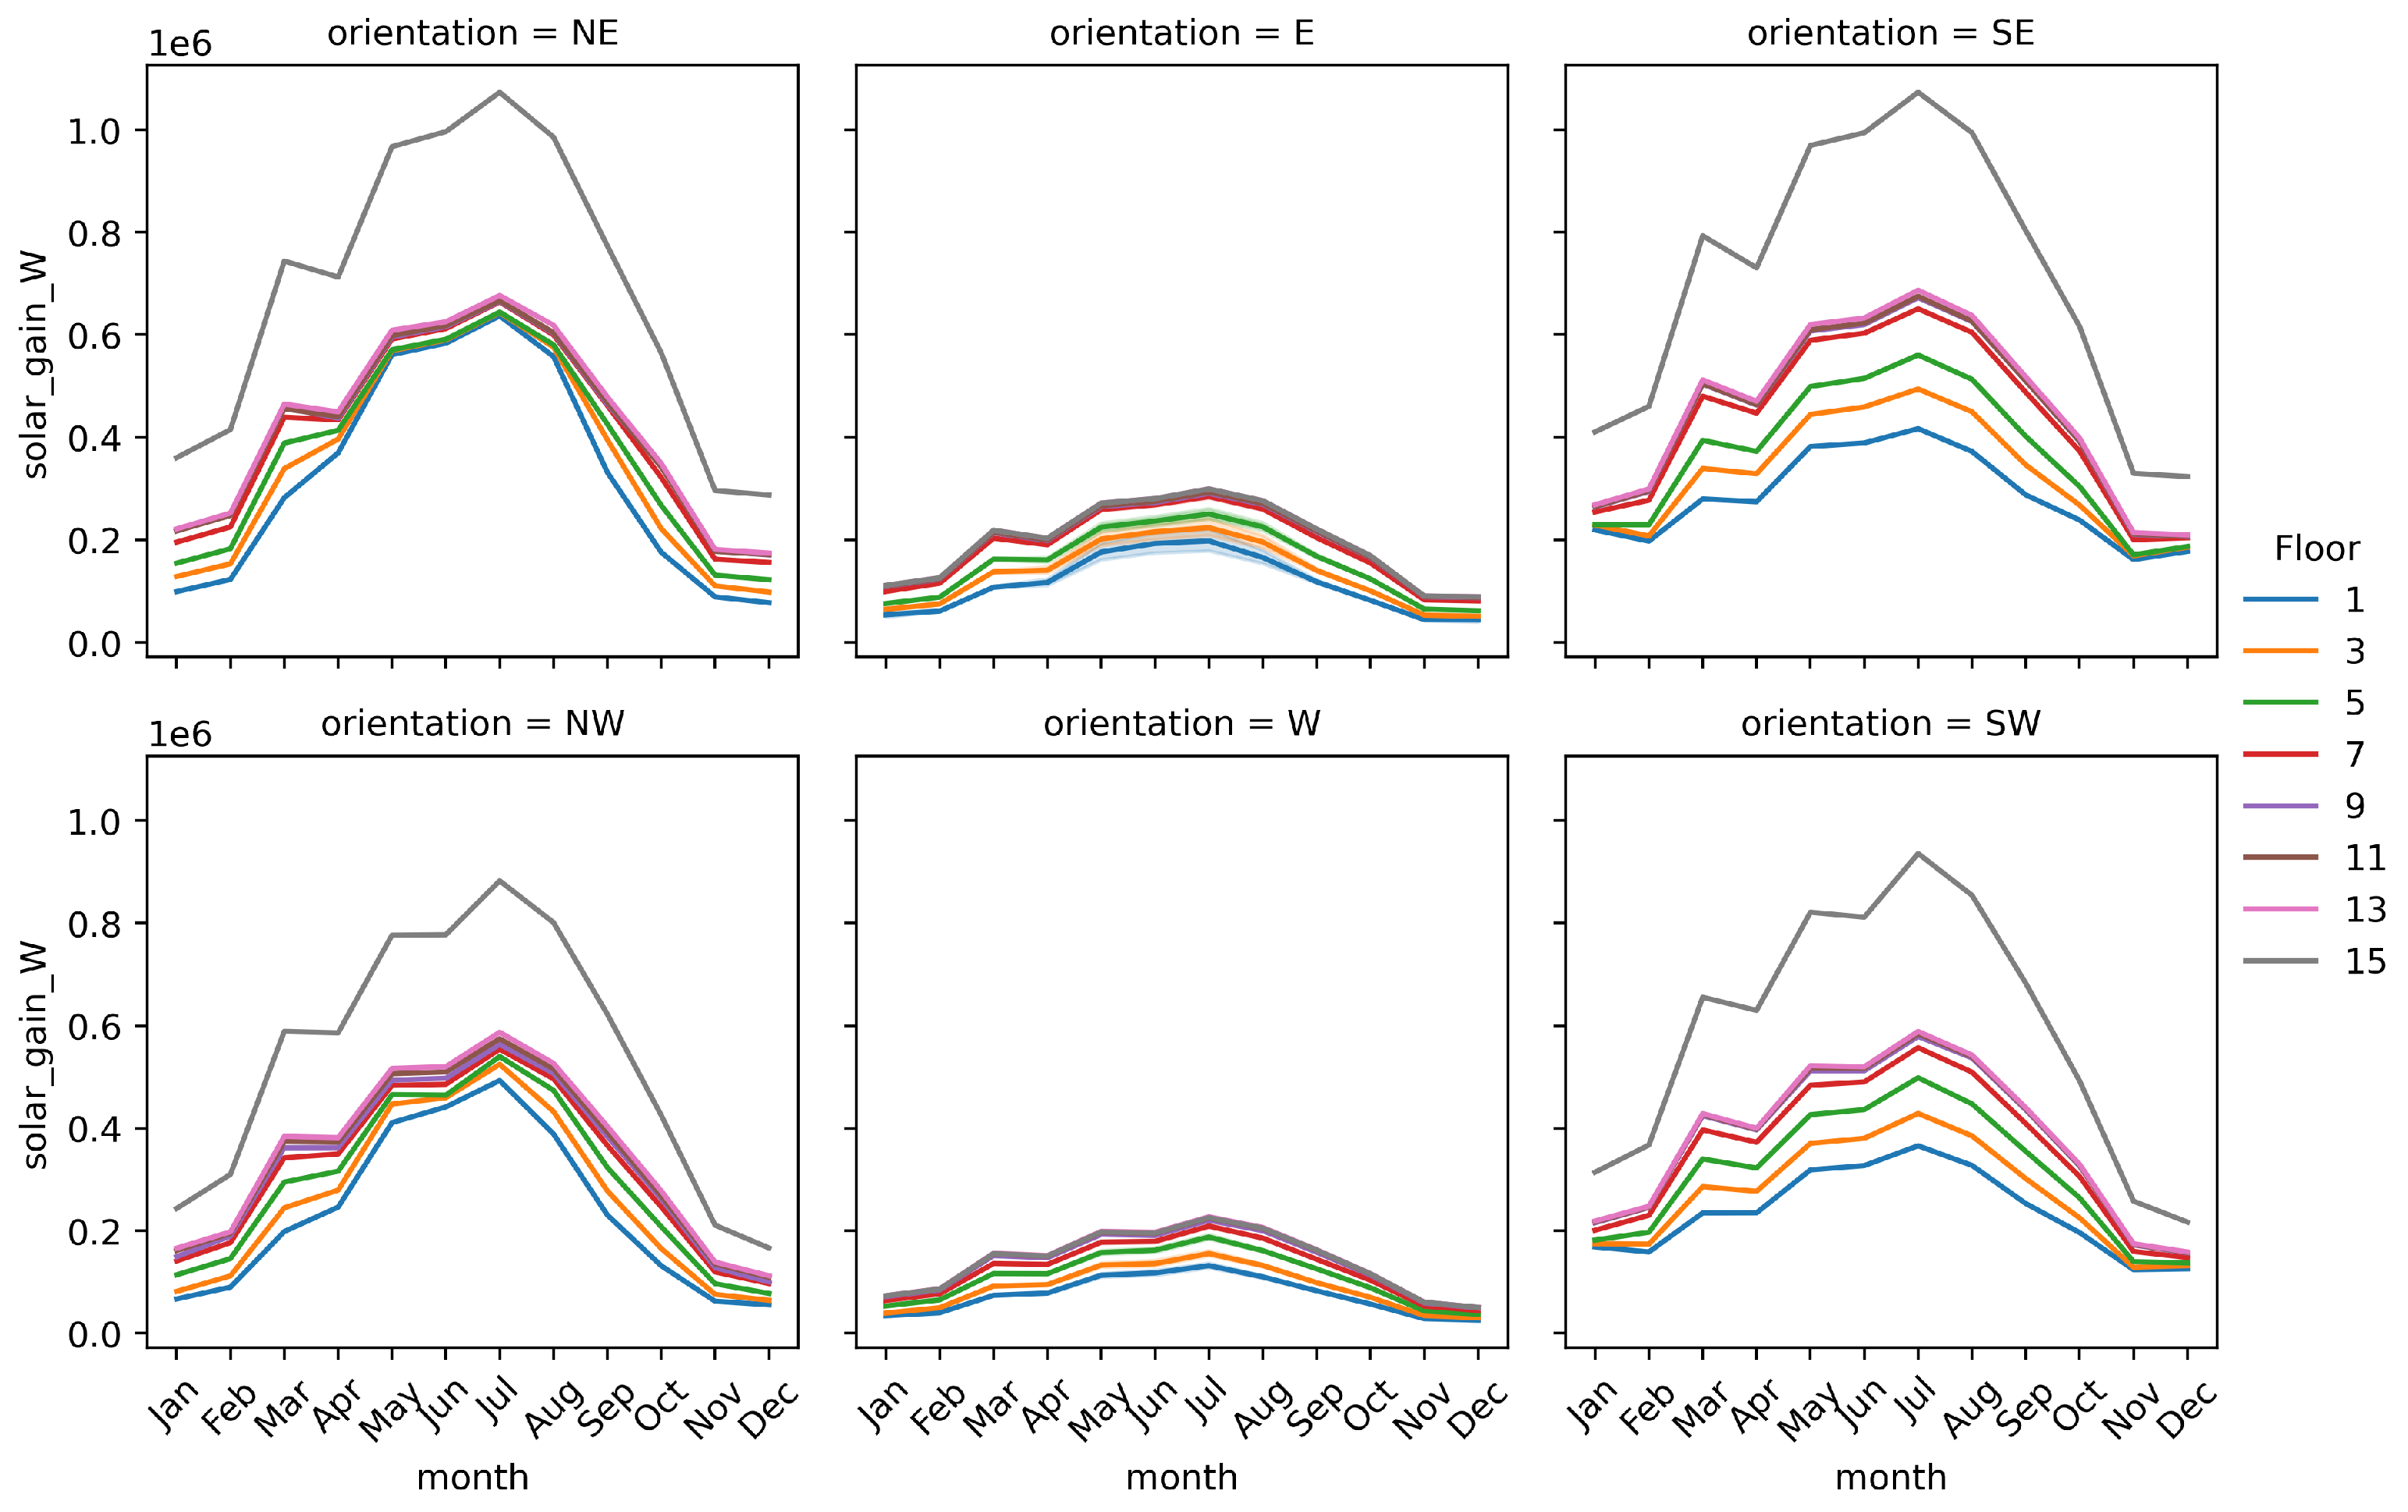
2.4.1. Solar Heat Gain
2.4.2. External and Internal Air Convection
2.4.3. HVAC Consumption
2.4.4. Simulated vs. Real HVAC Consumption
2.5. Optimal Guest Allocation
3. Results
3.1. Validation
3.1.1. Solar Radiation
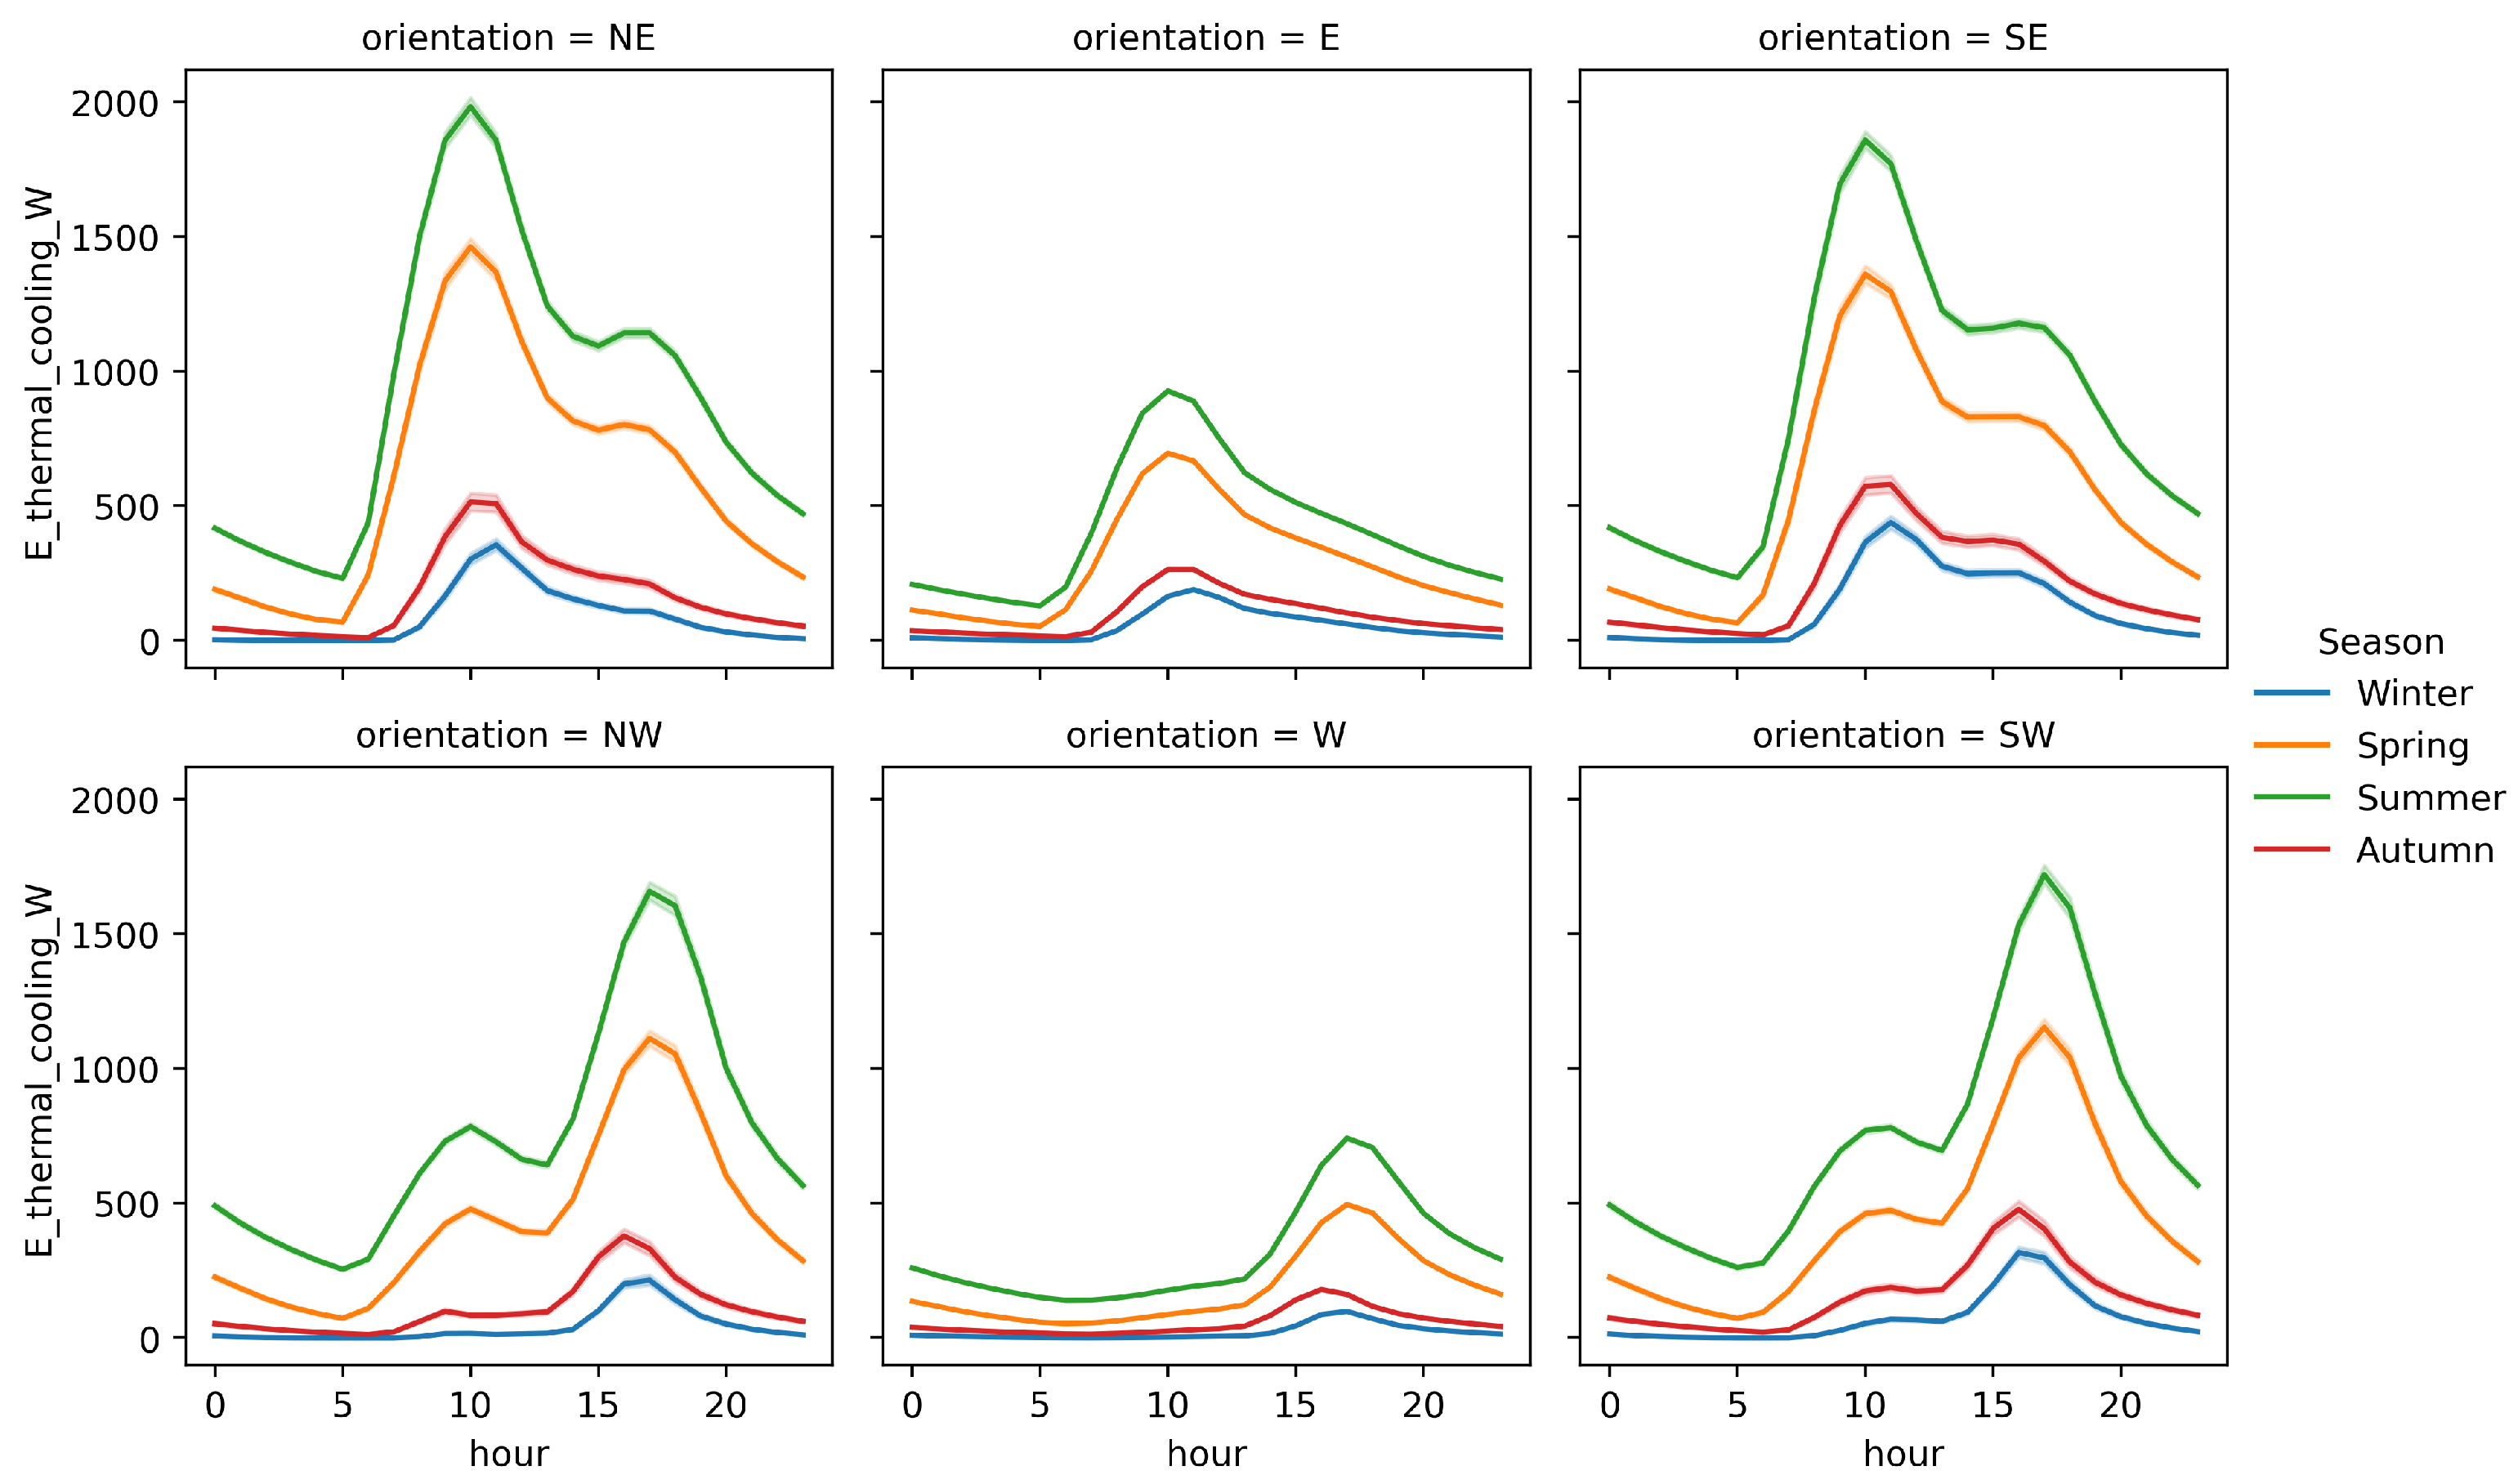
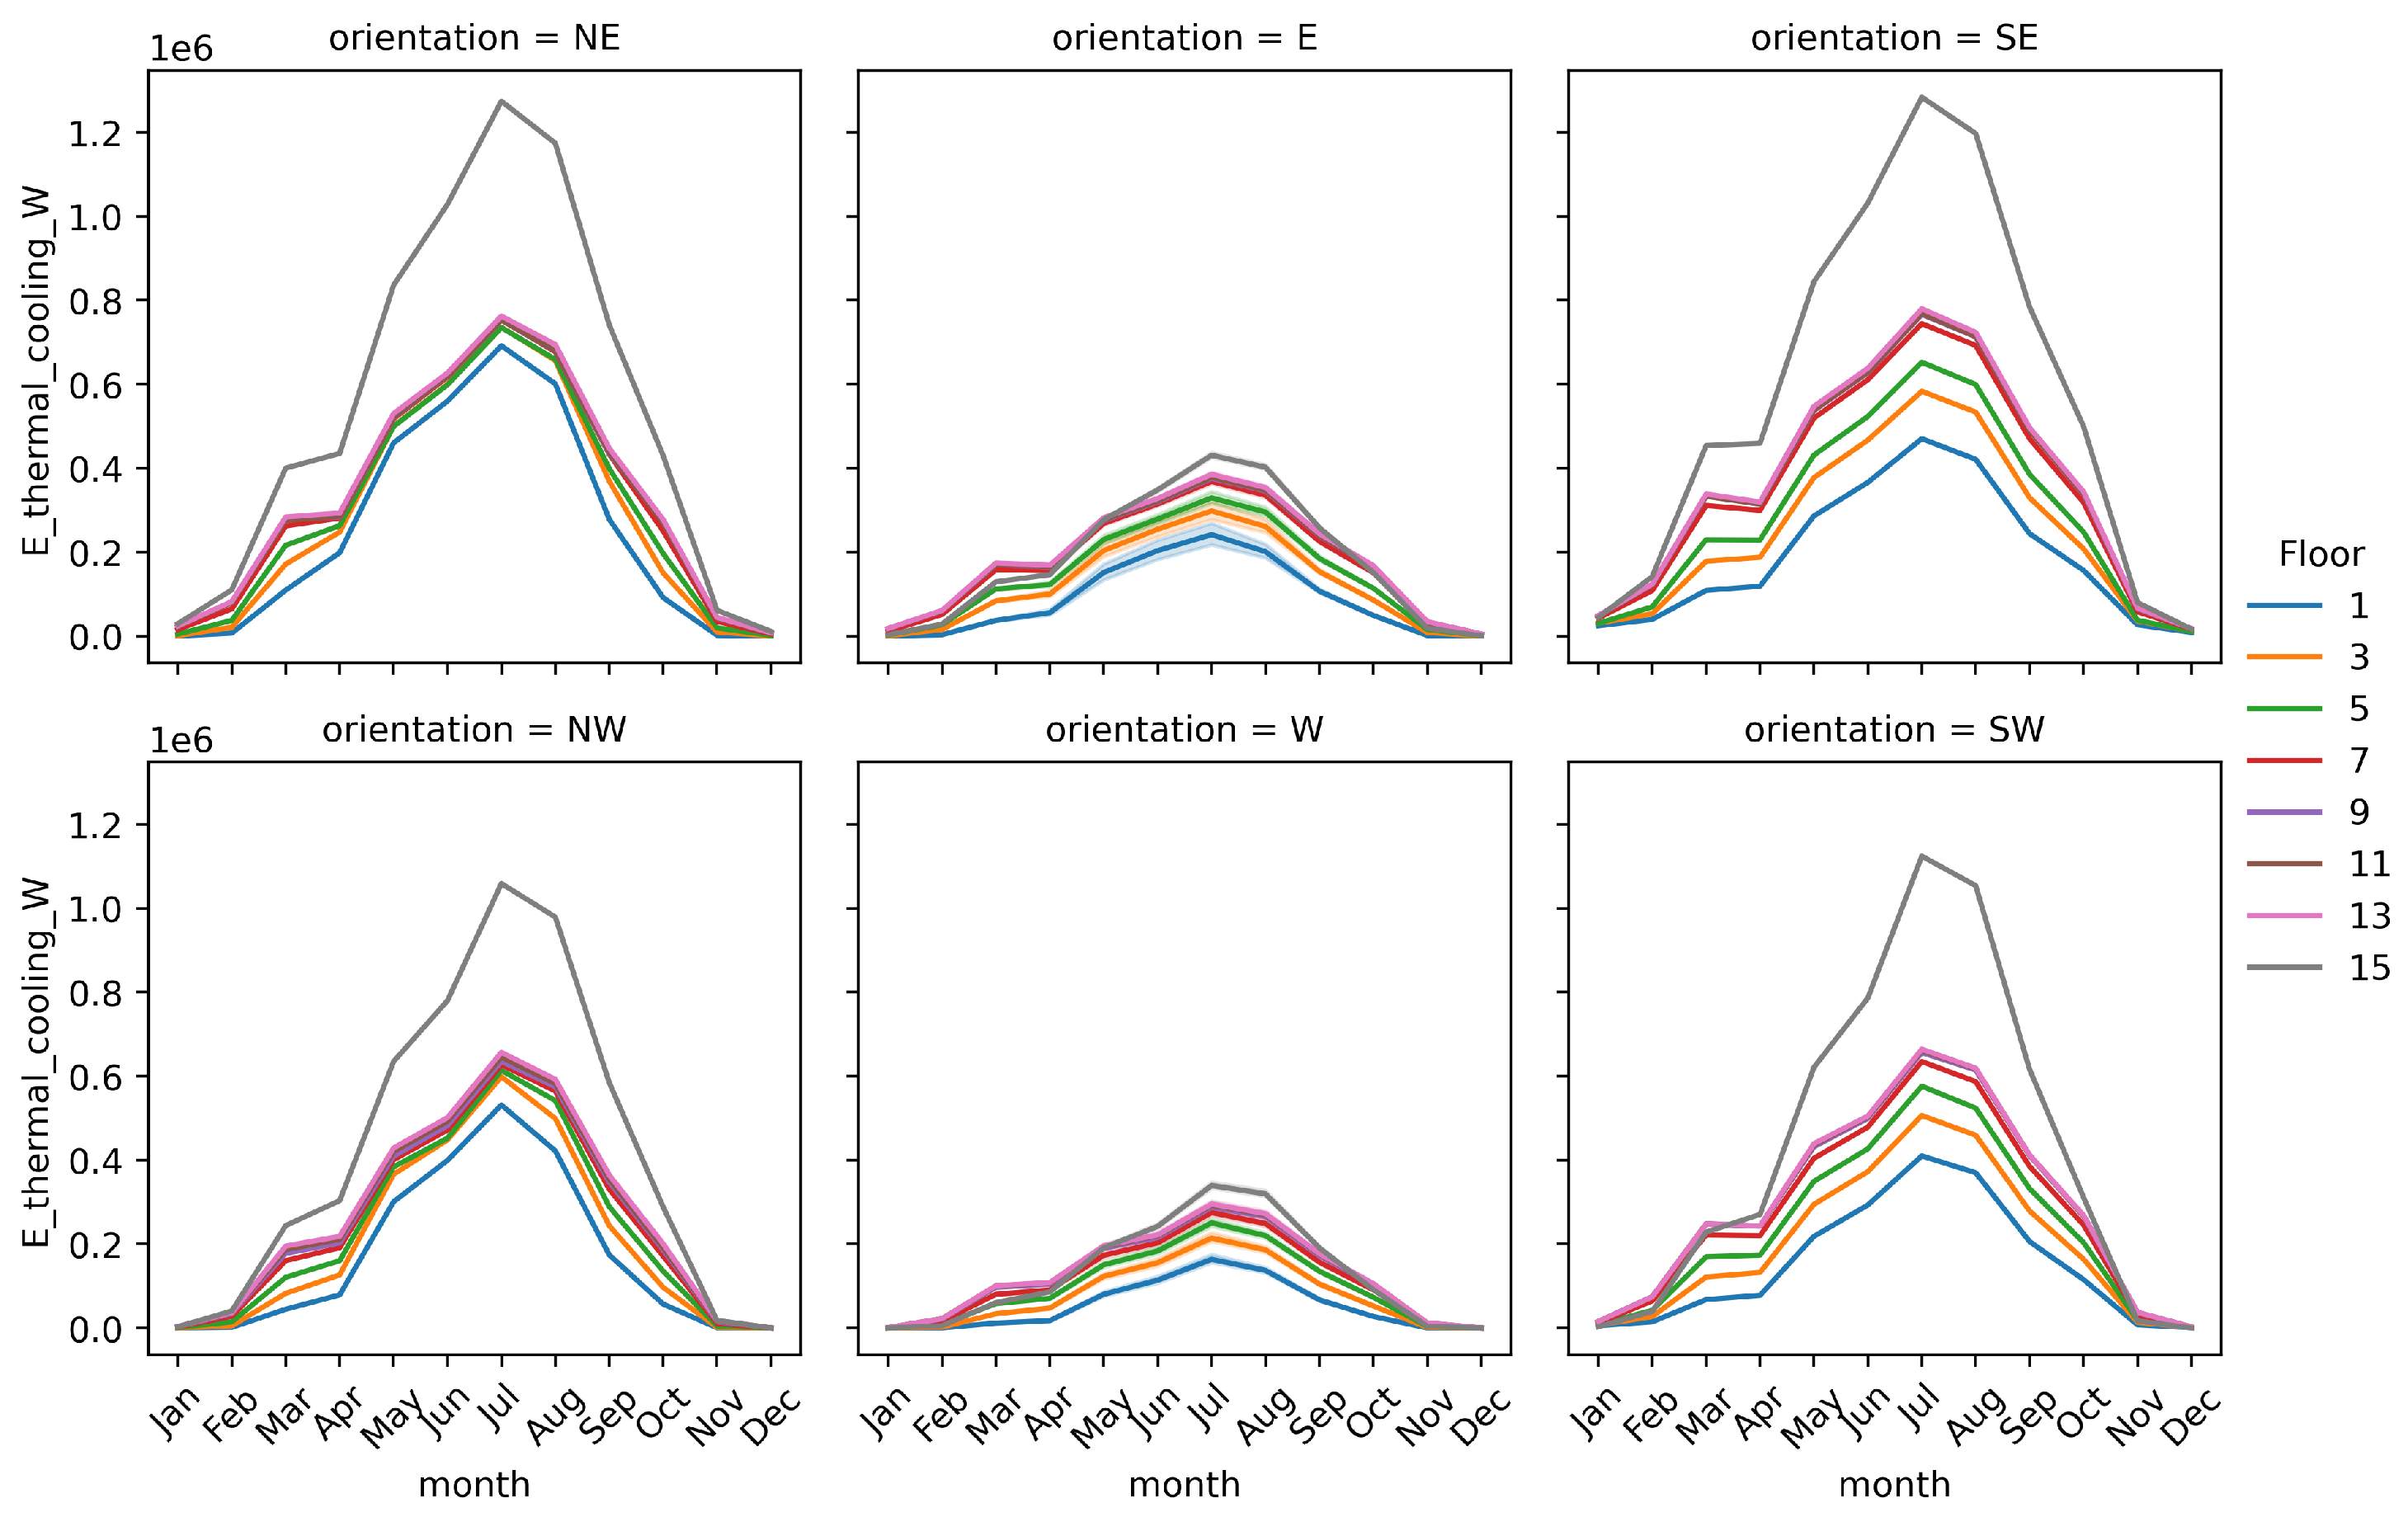
3.1.2. Cooling Energy Demand
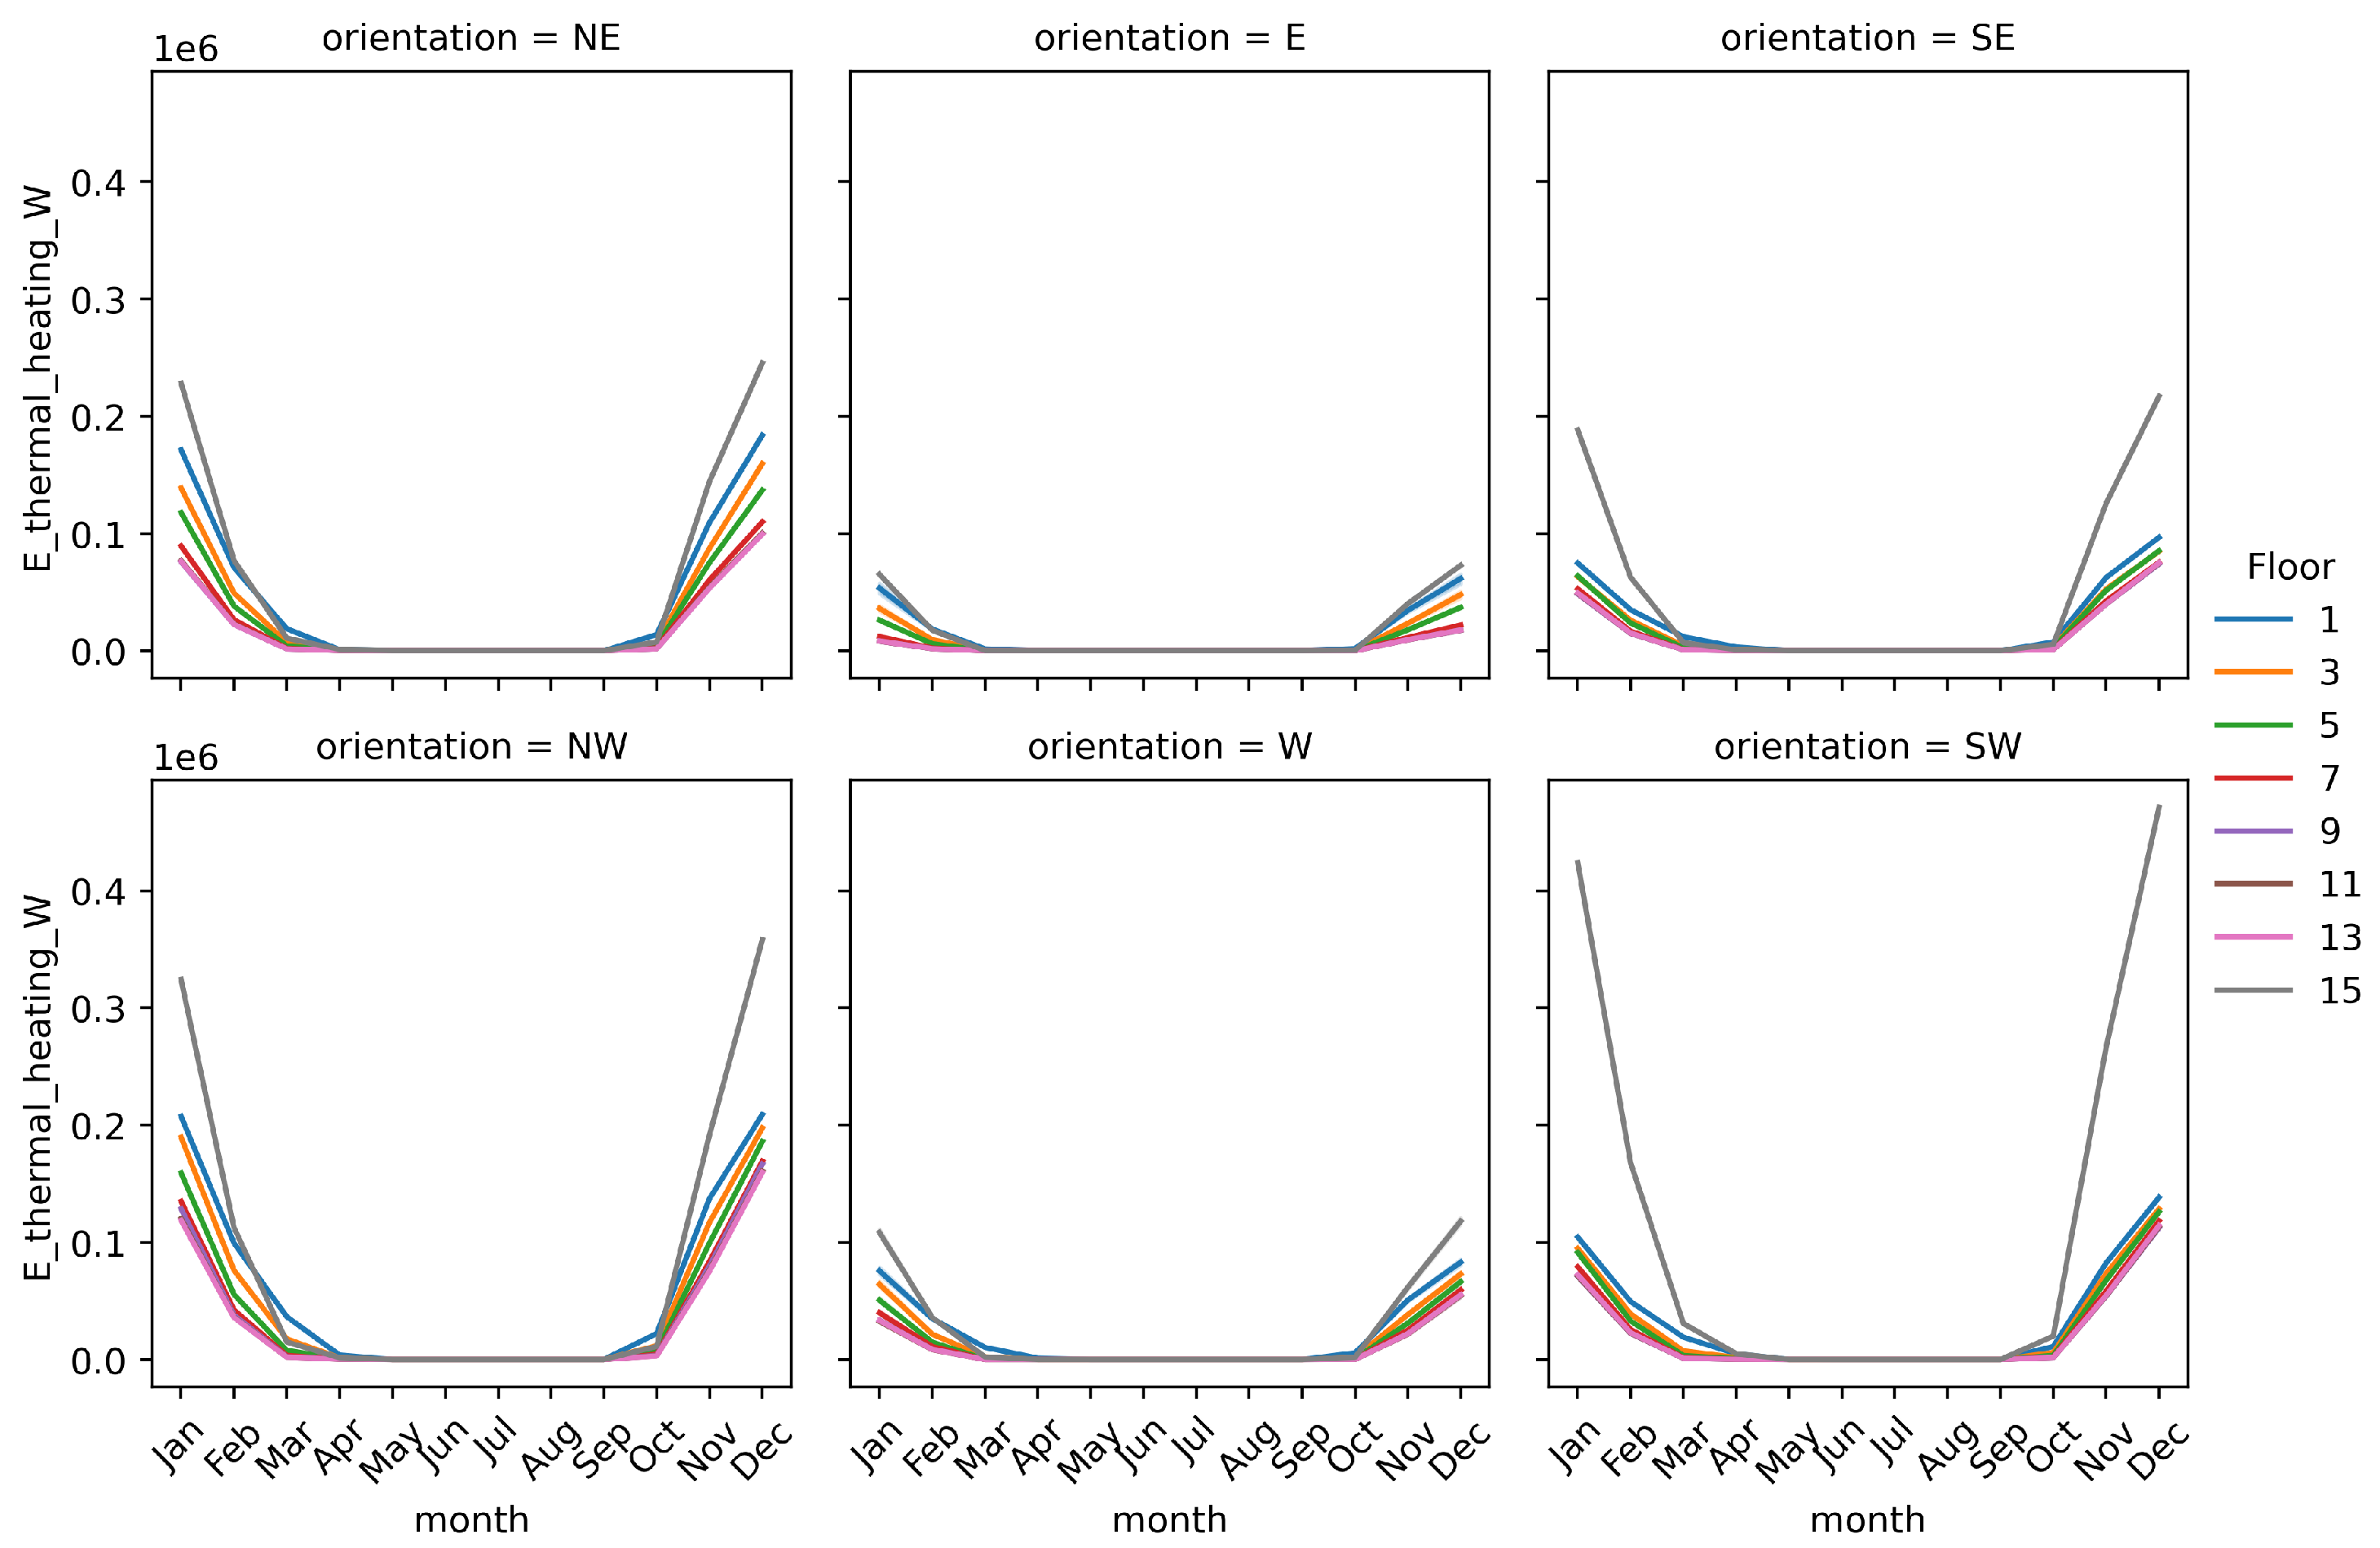
3.1.3. Heating Energy Demand
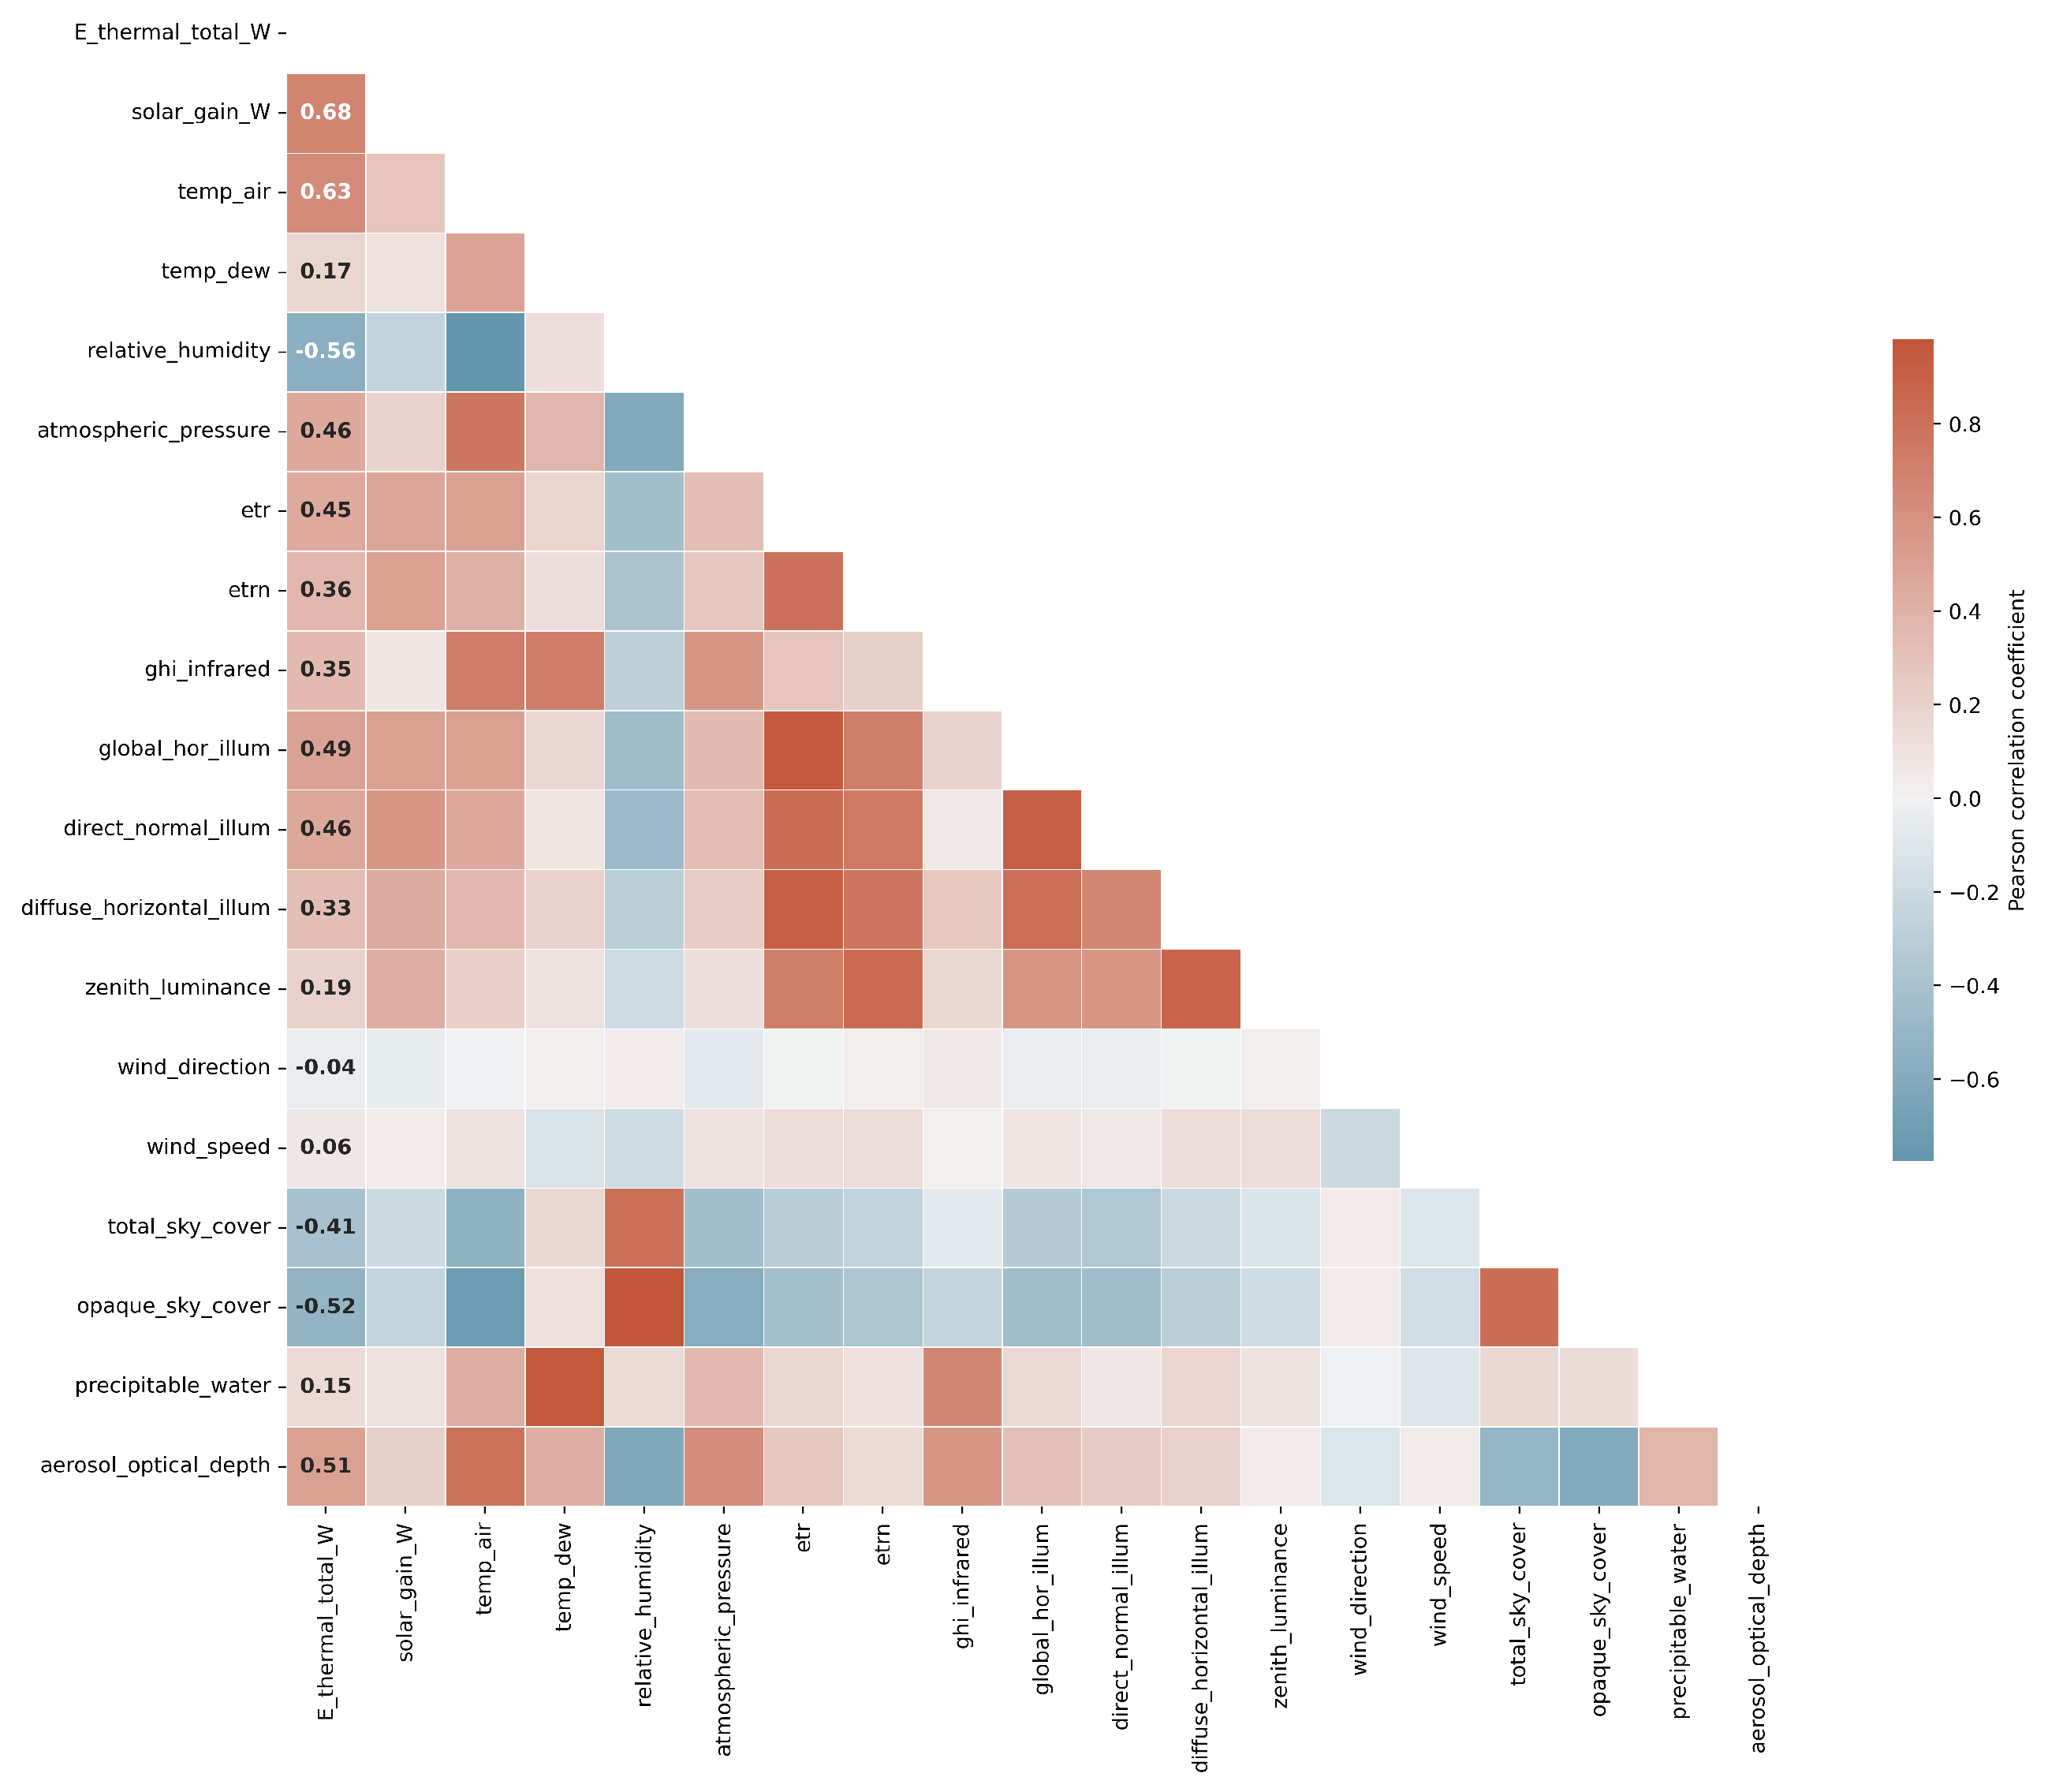
3.1.4. Influence of Weather Conditions
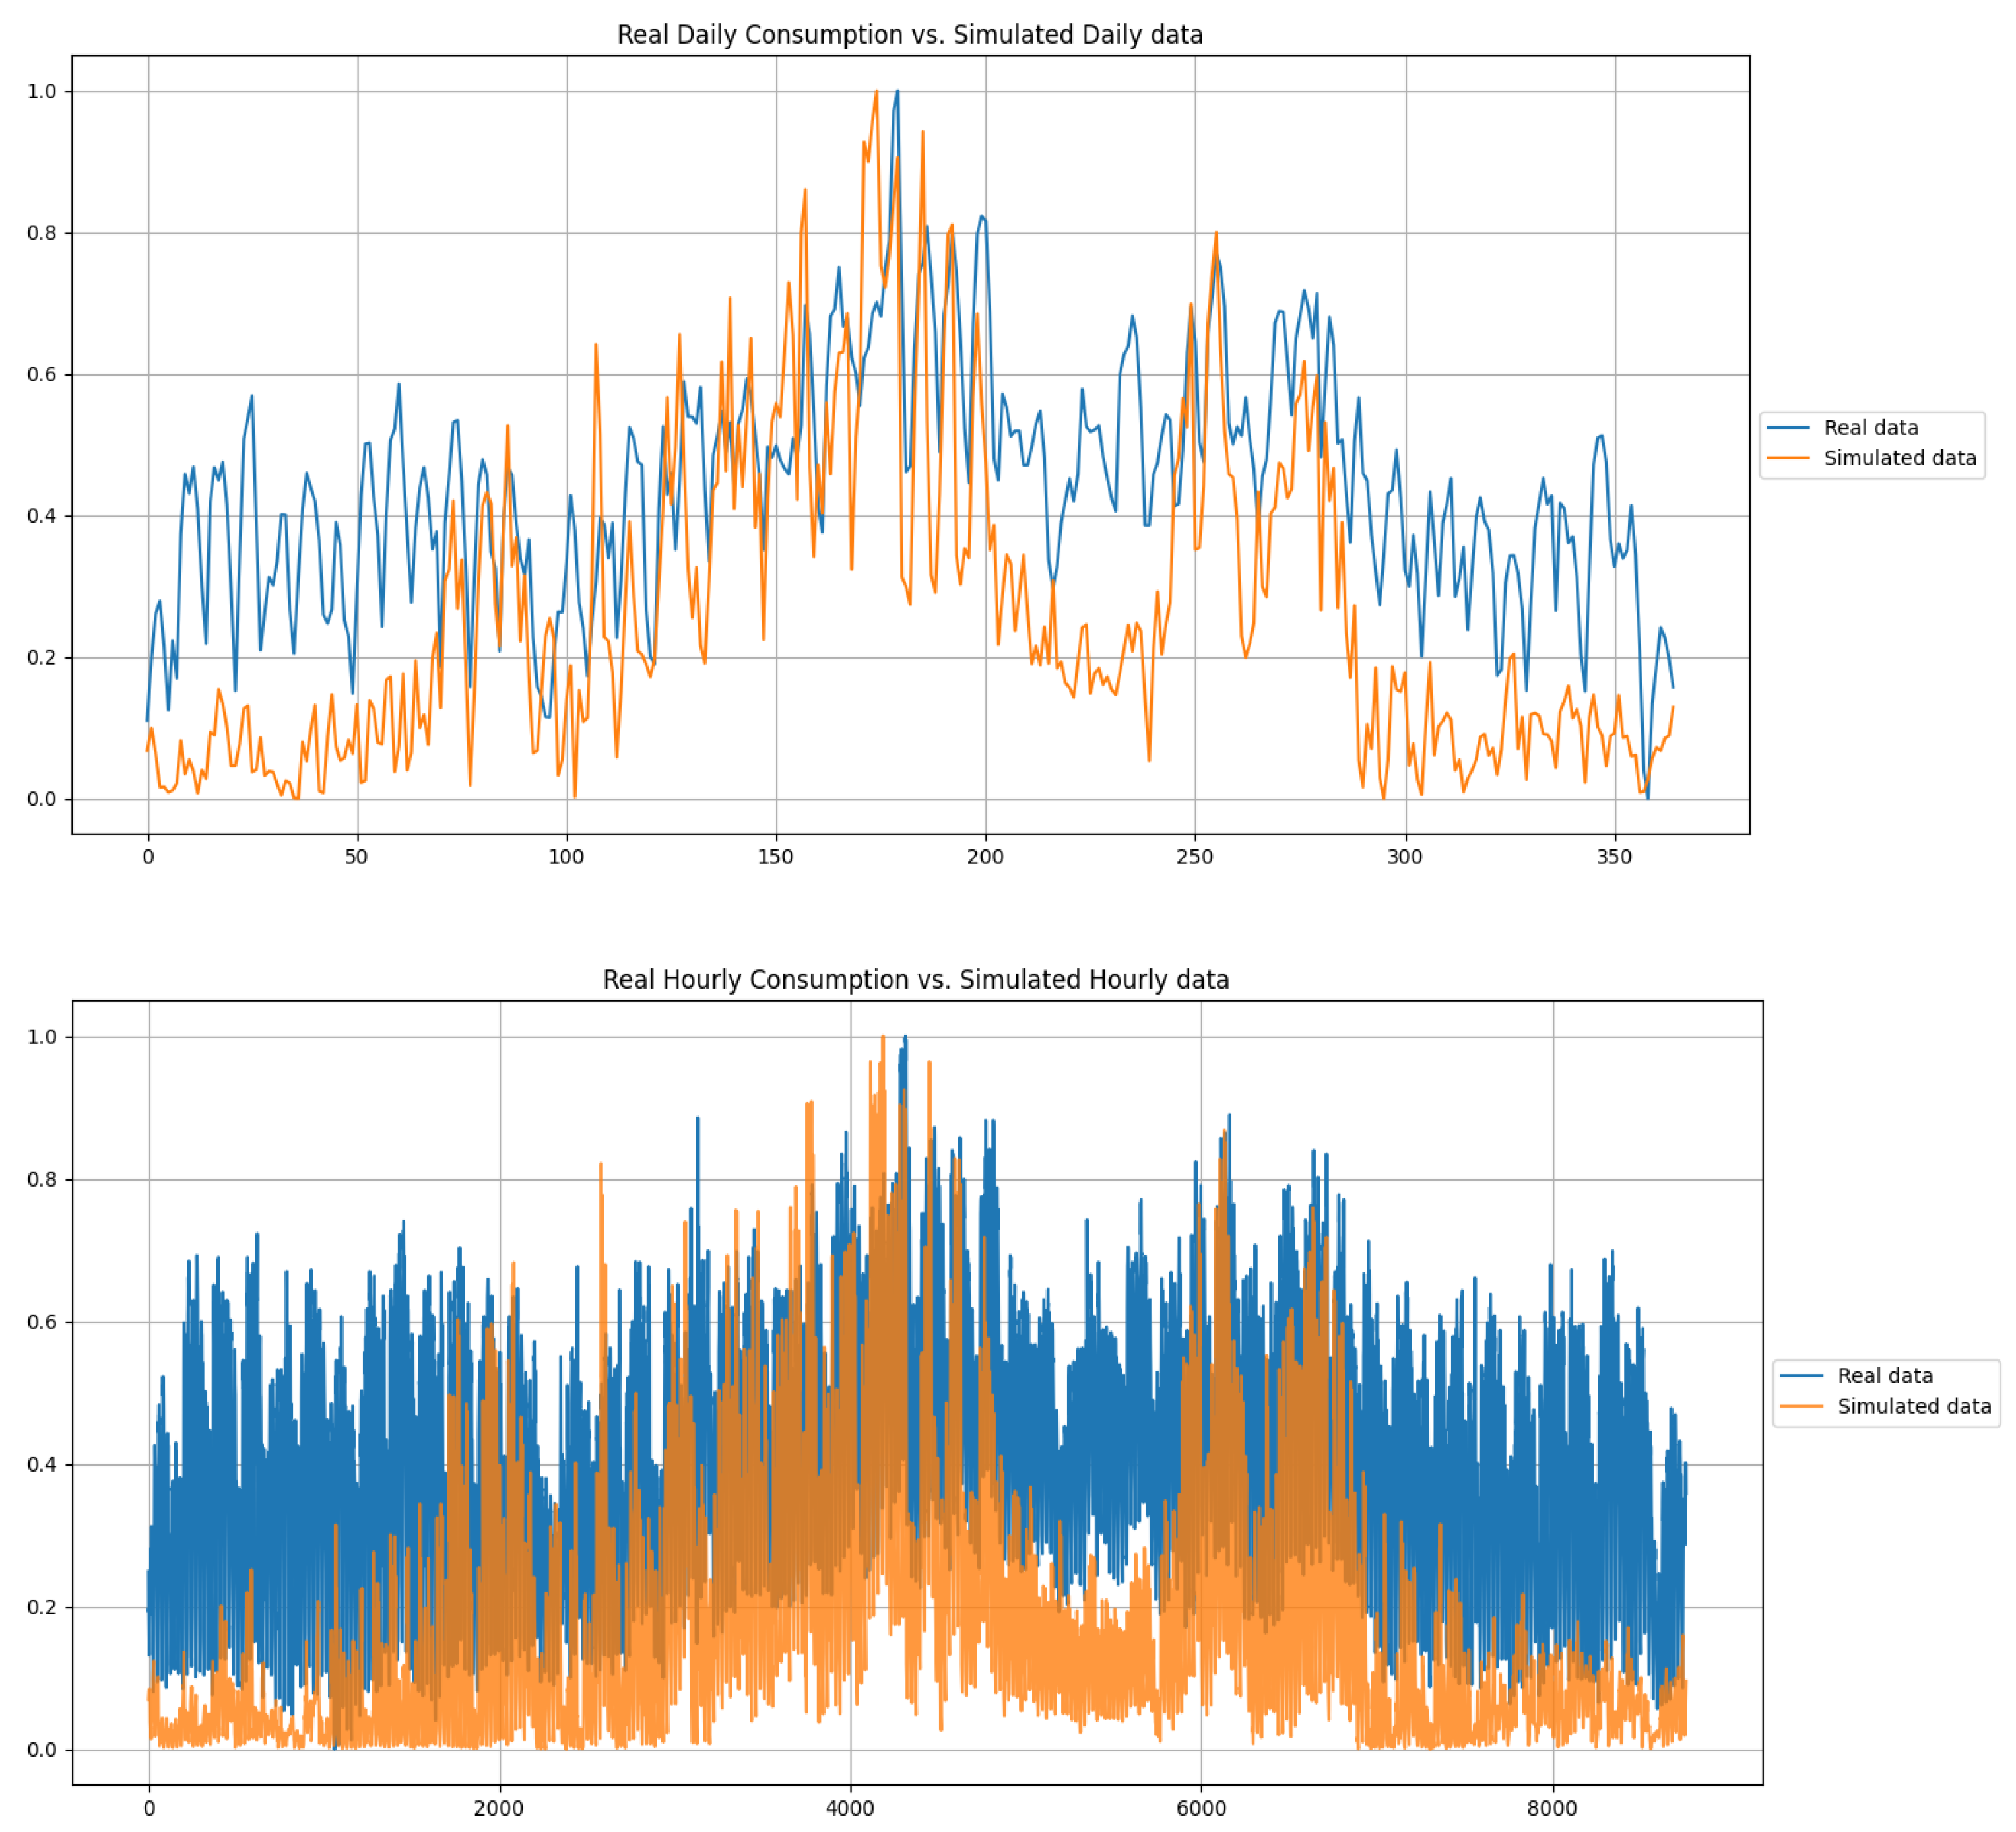
3.1.5. Simulated vs. Actual Energy Consumption
3.1.6. Summary of Validation Results
3.2. Analysis of Consumption Patterns and Energy-Saving Potentials
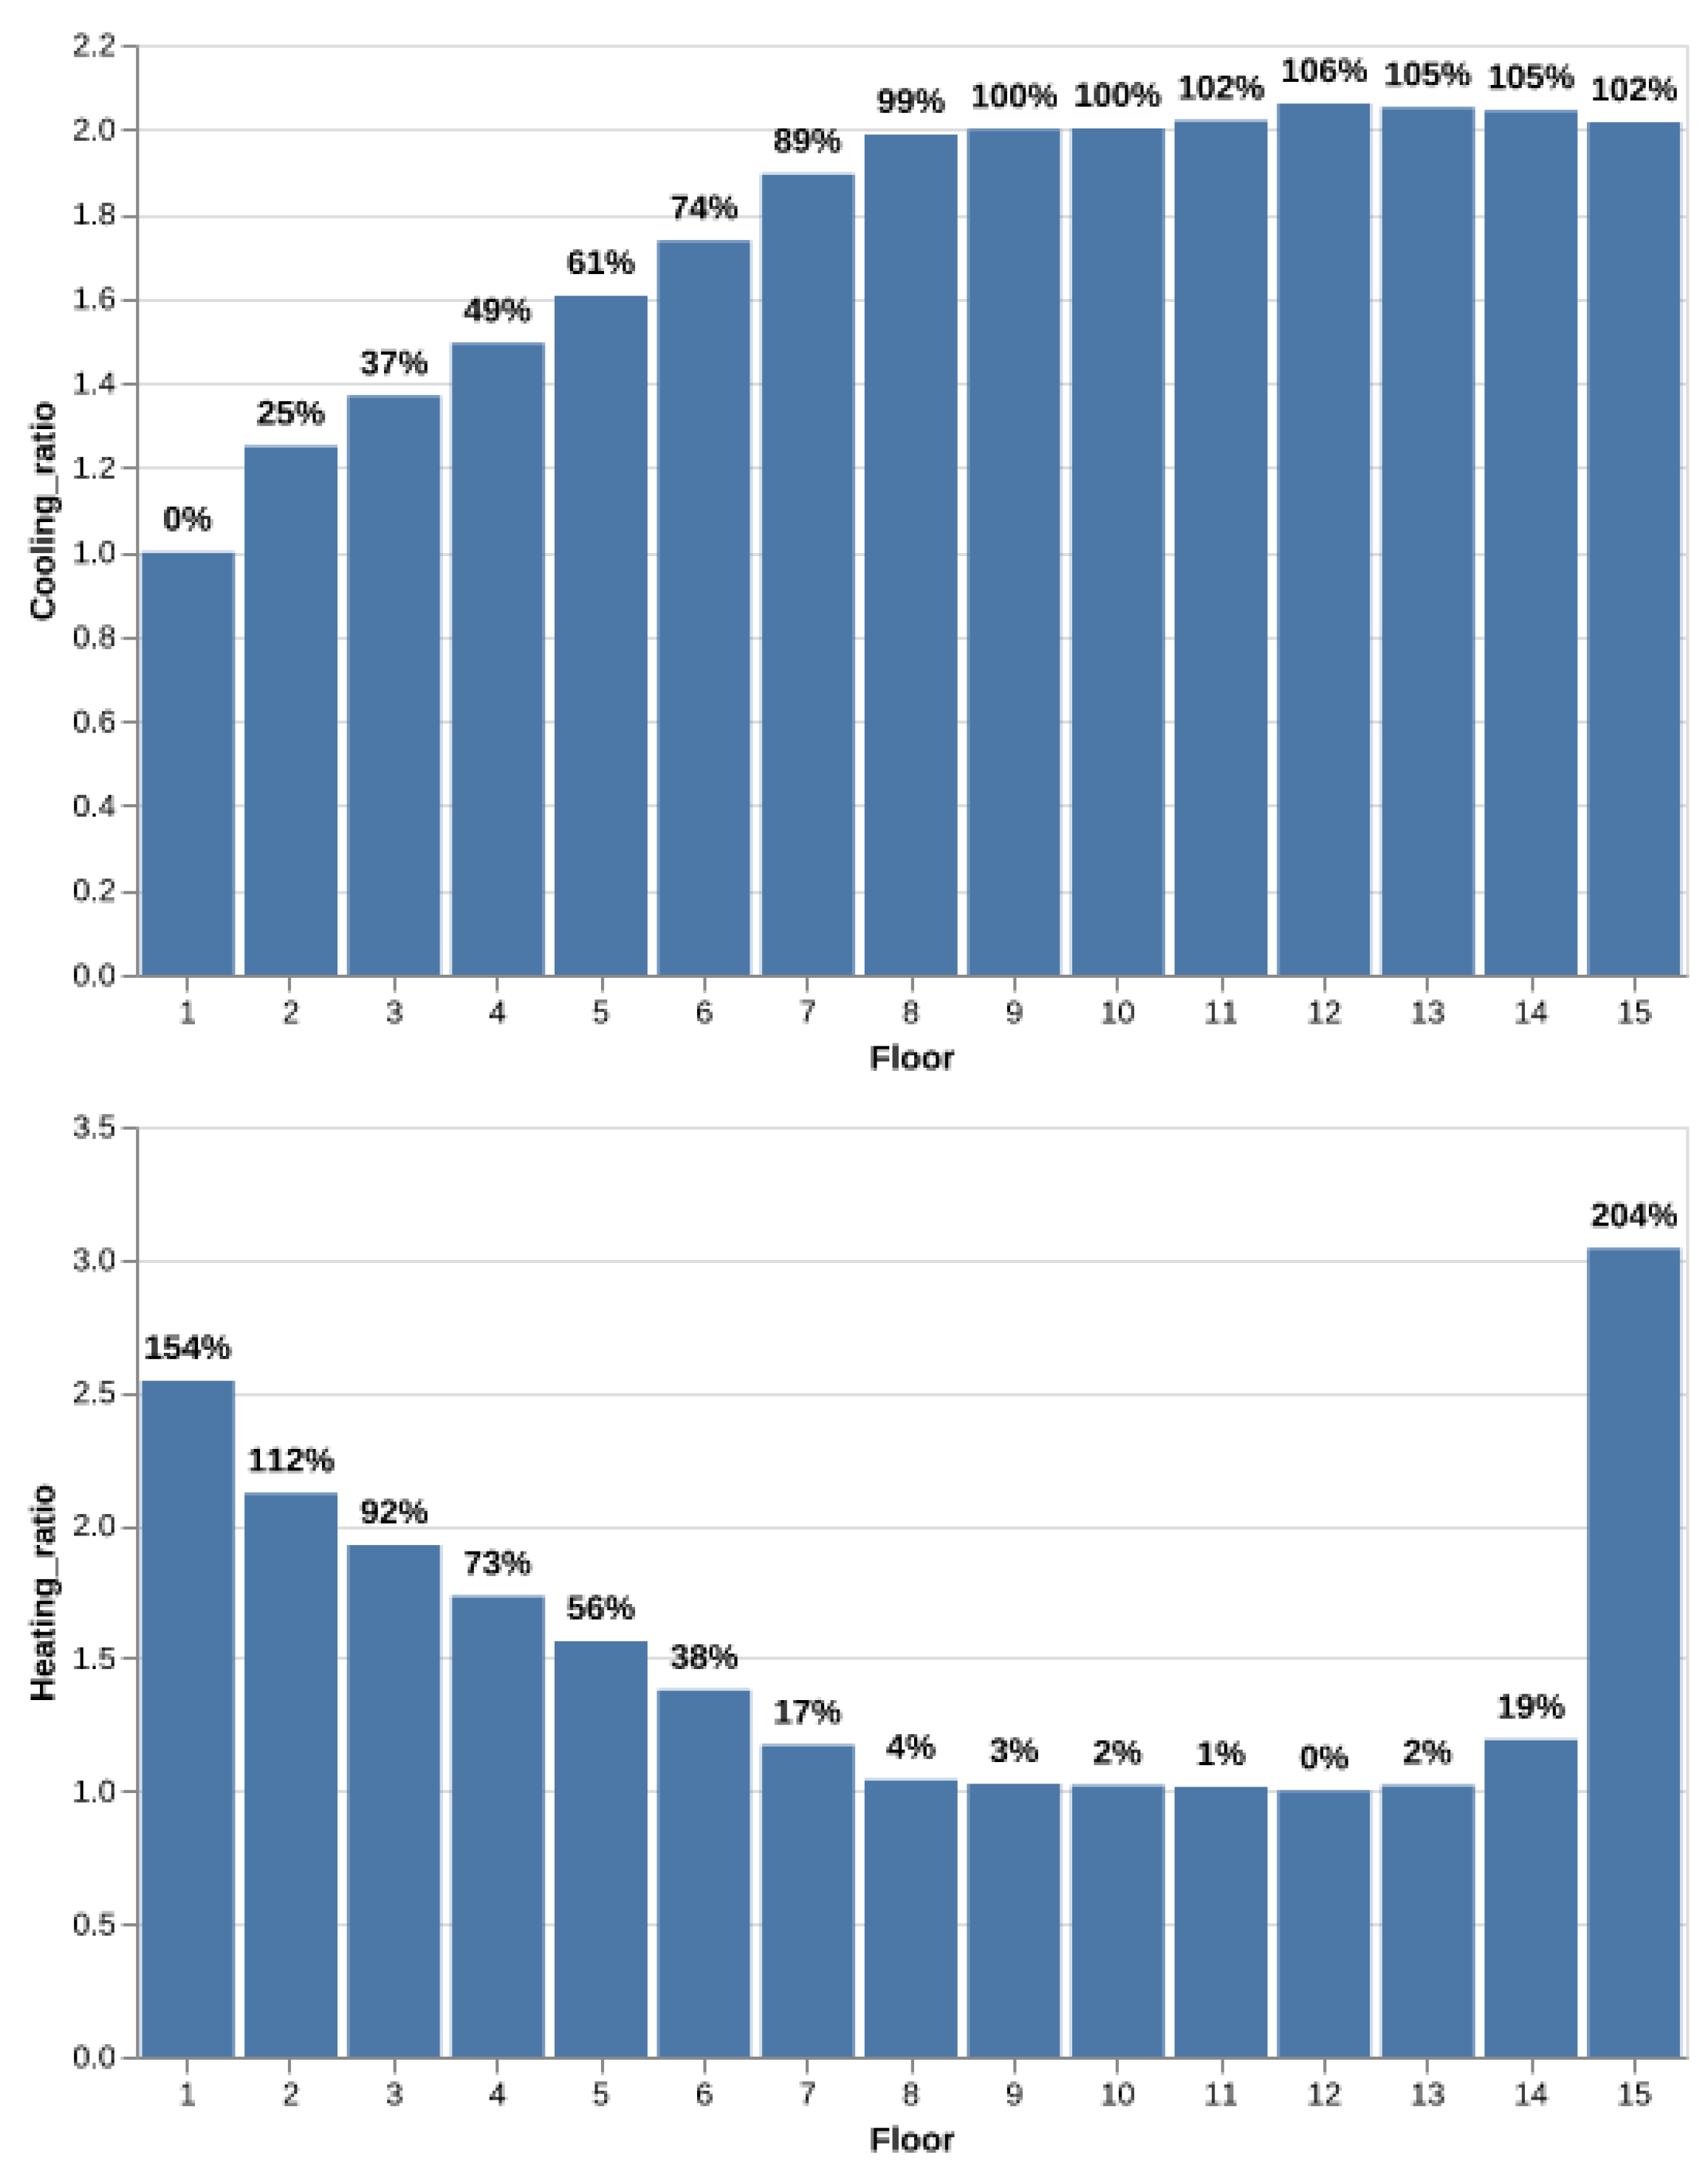
3.2.1. Thermal Energy Demand Related to Floor Height
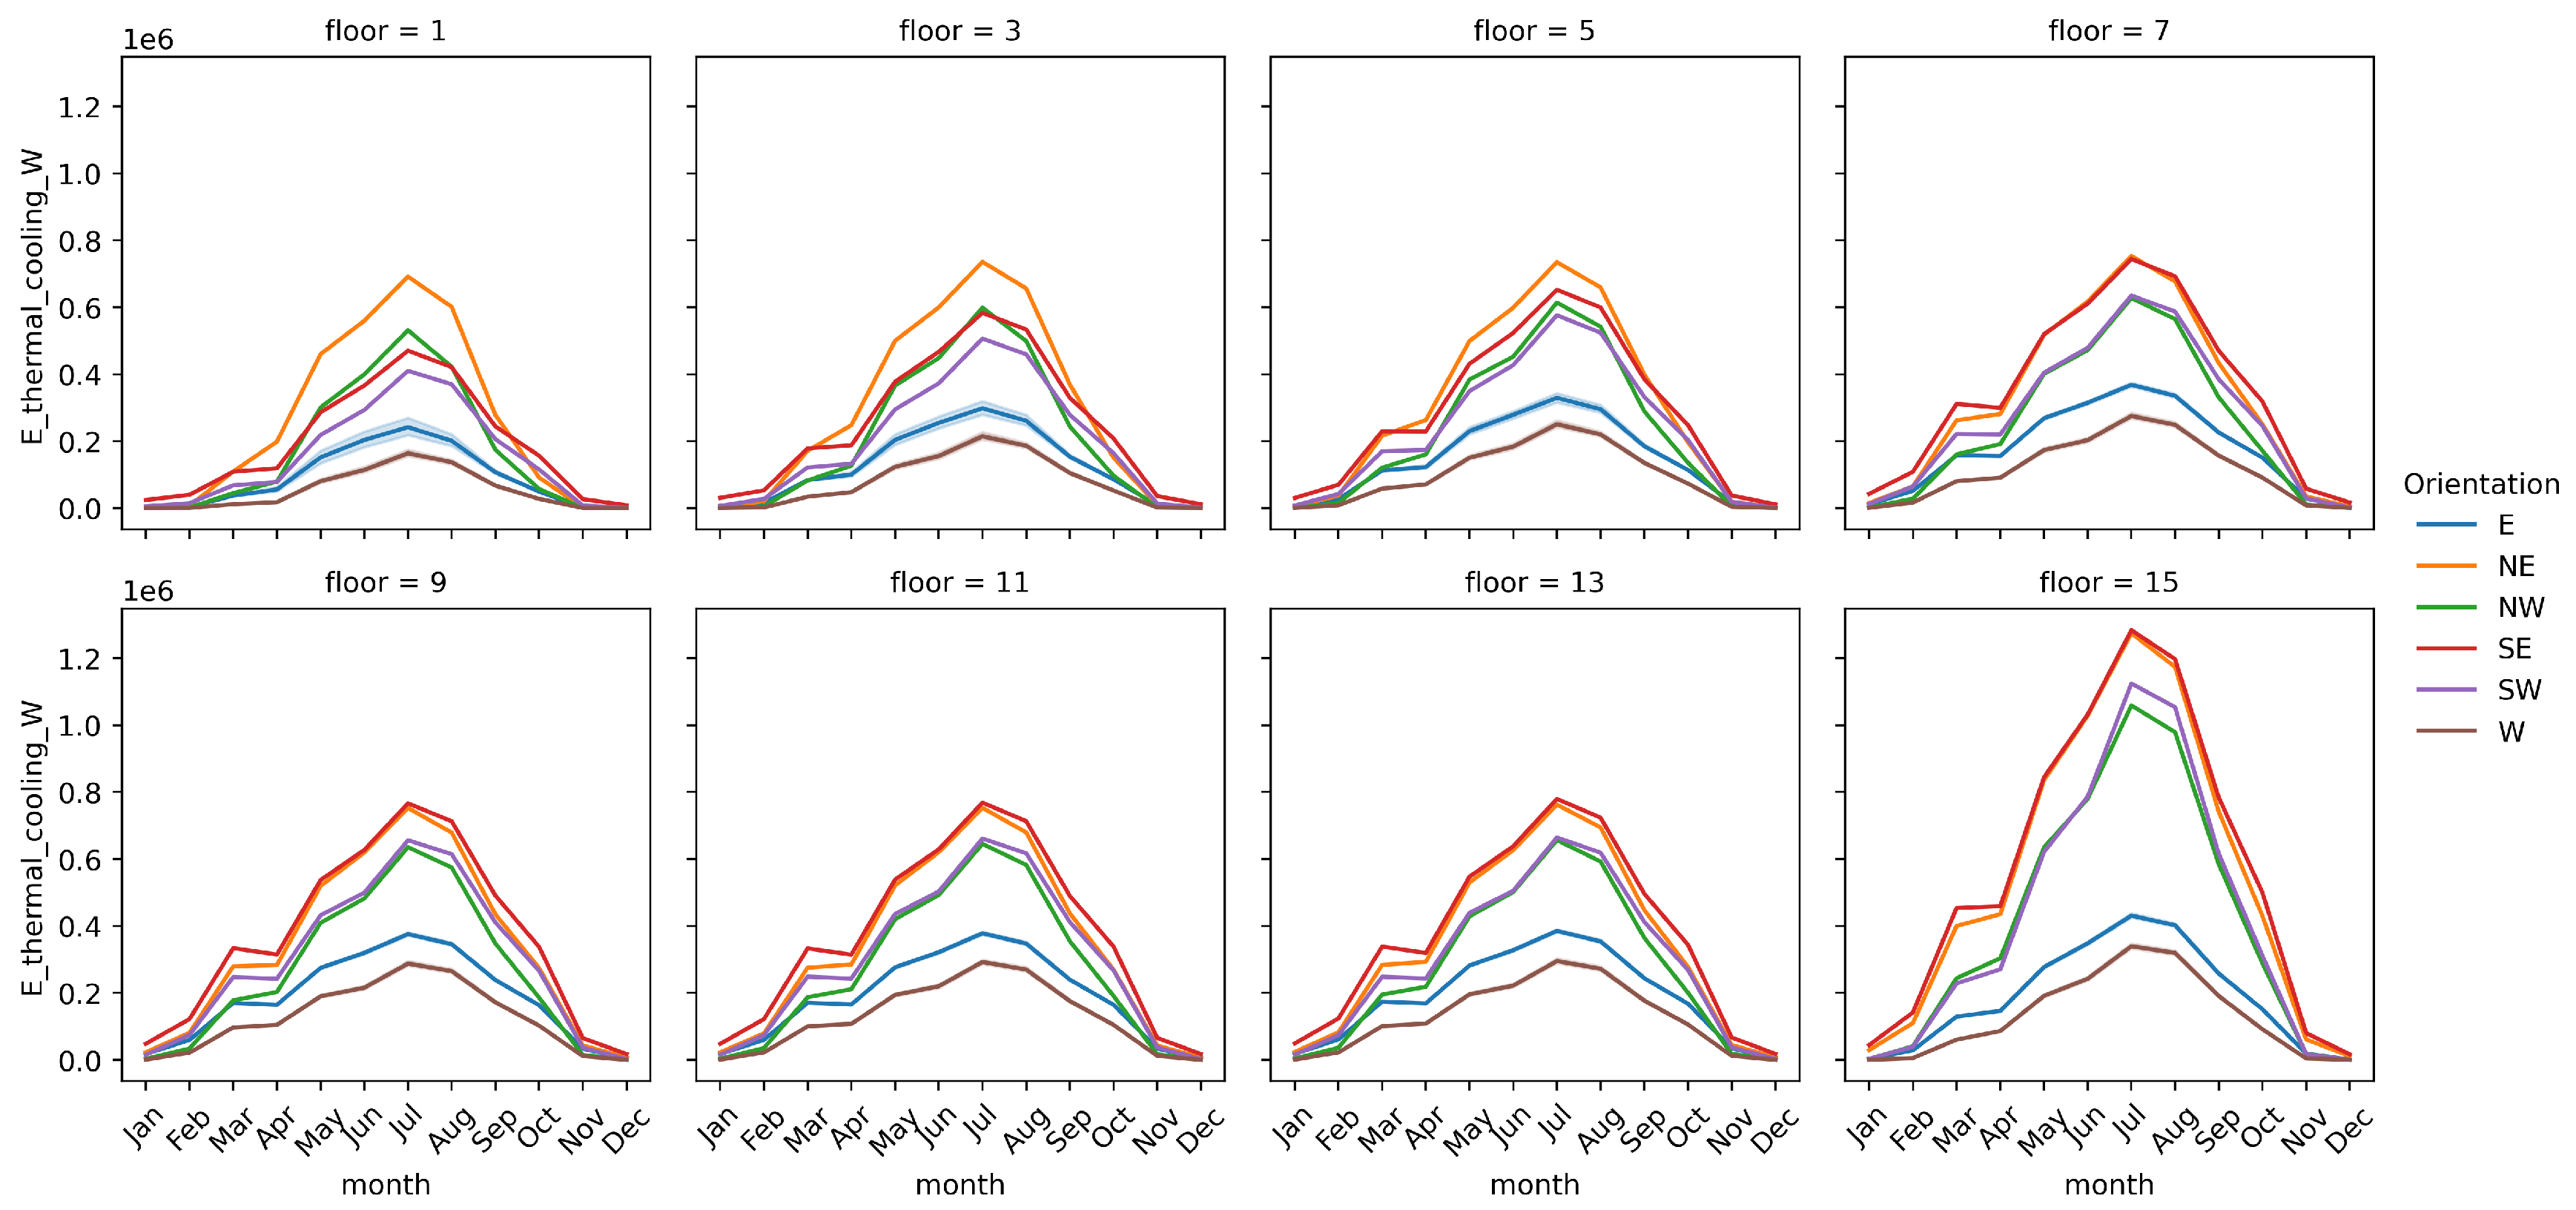
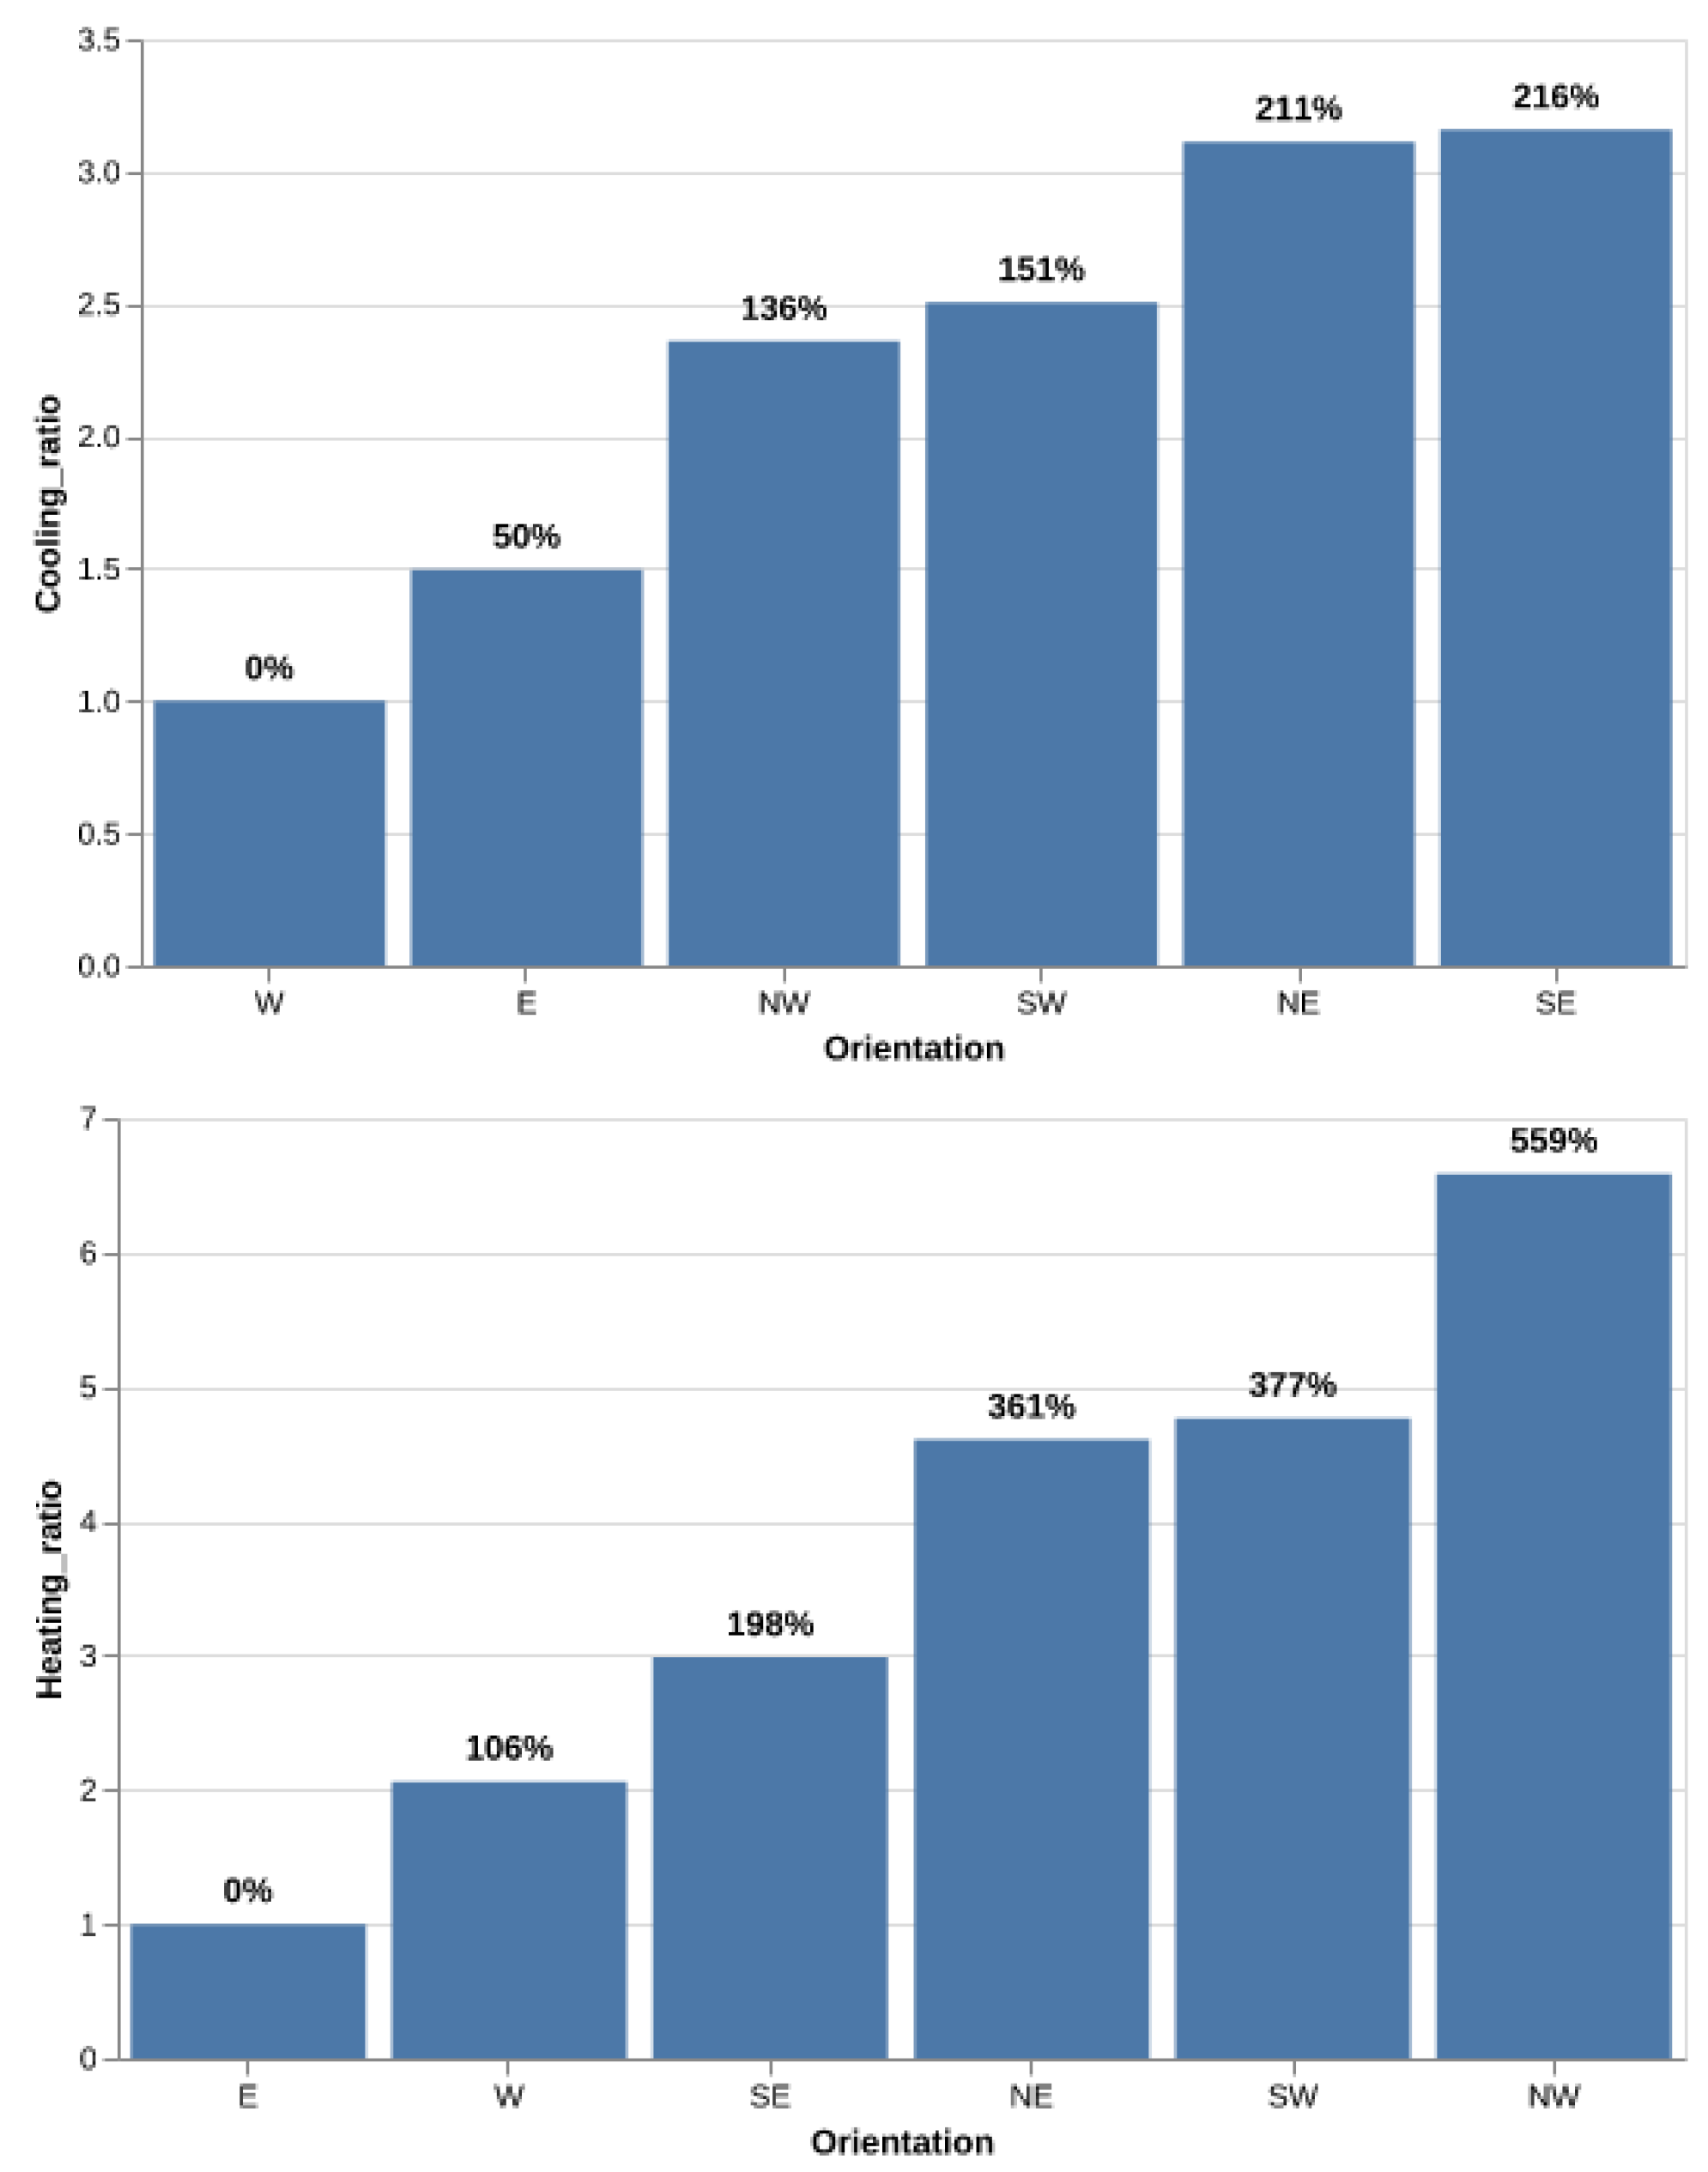
3.2.2. Thermal Energy Demand Related to Orientation
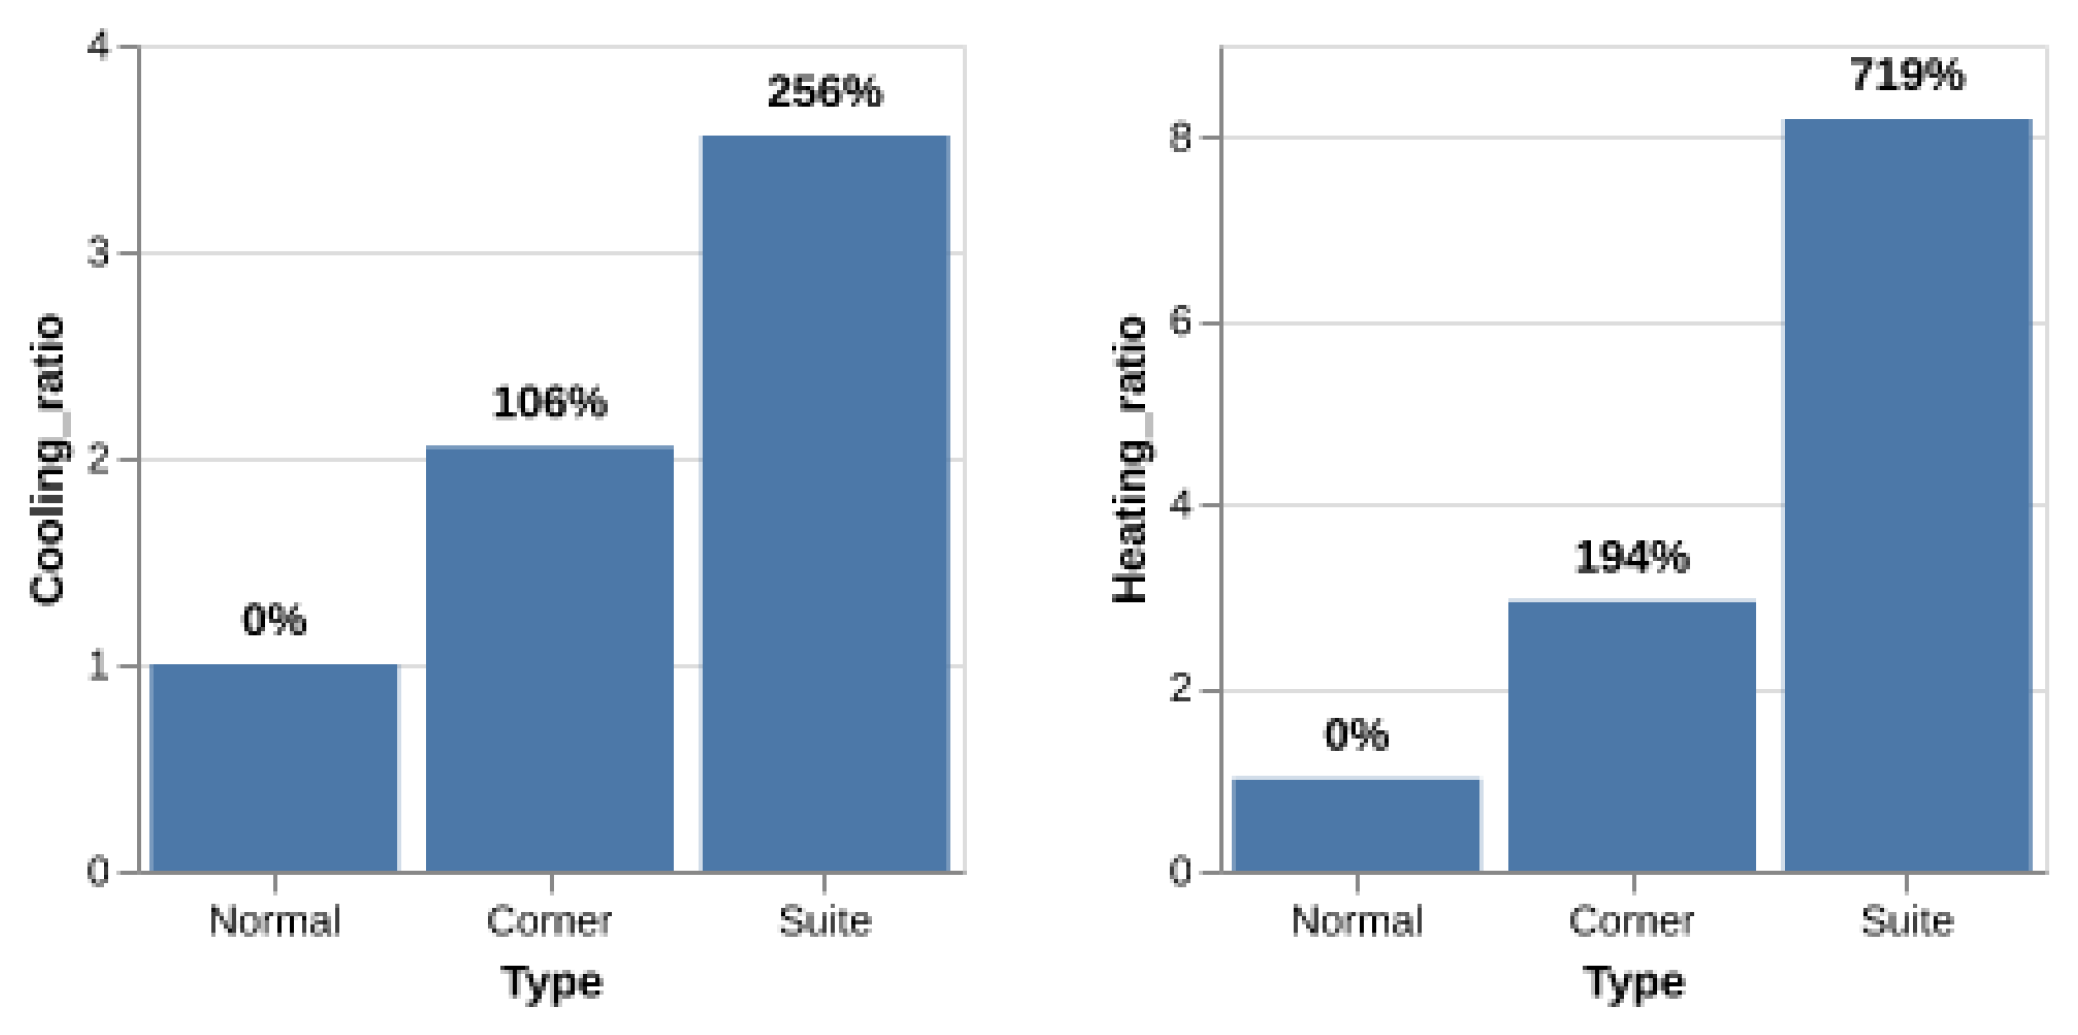
3.2.3. Thermal Energy Demand Related to Room Type
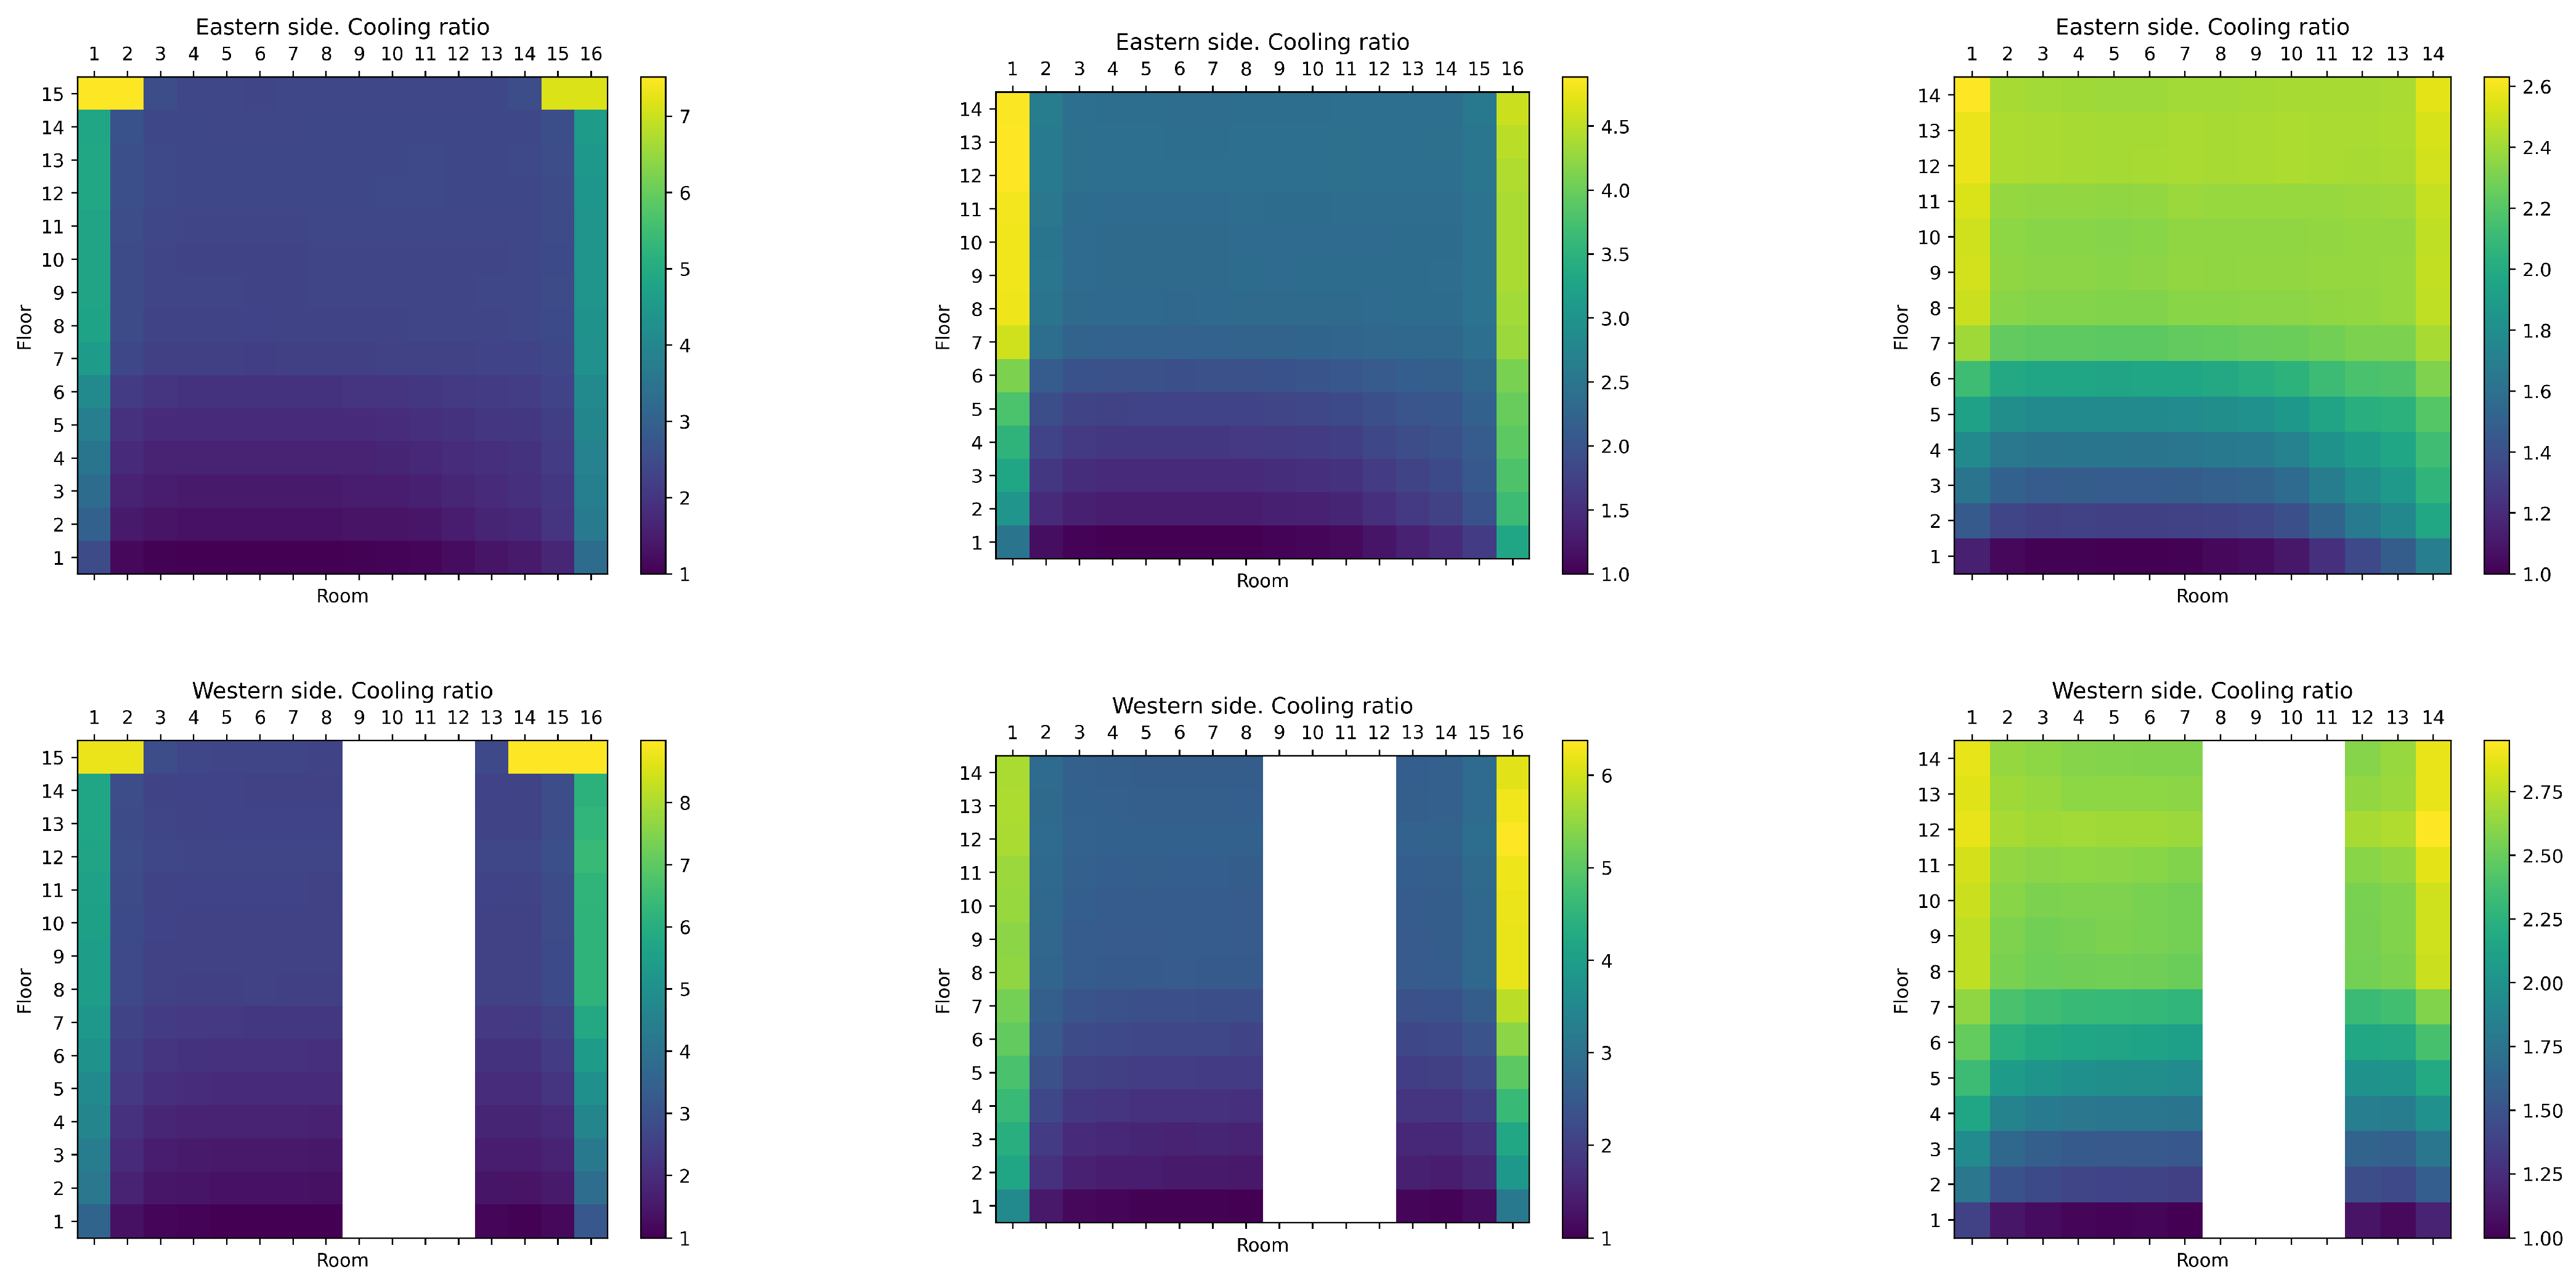
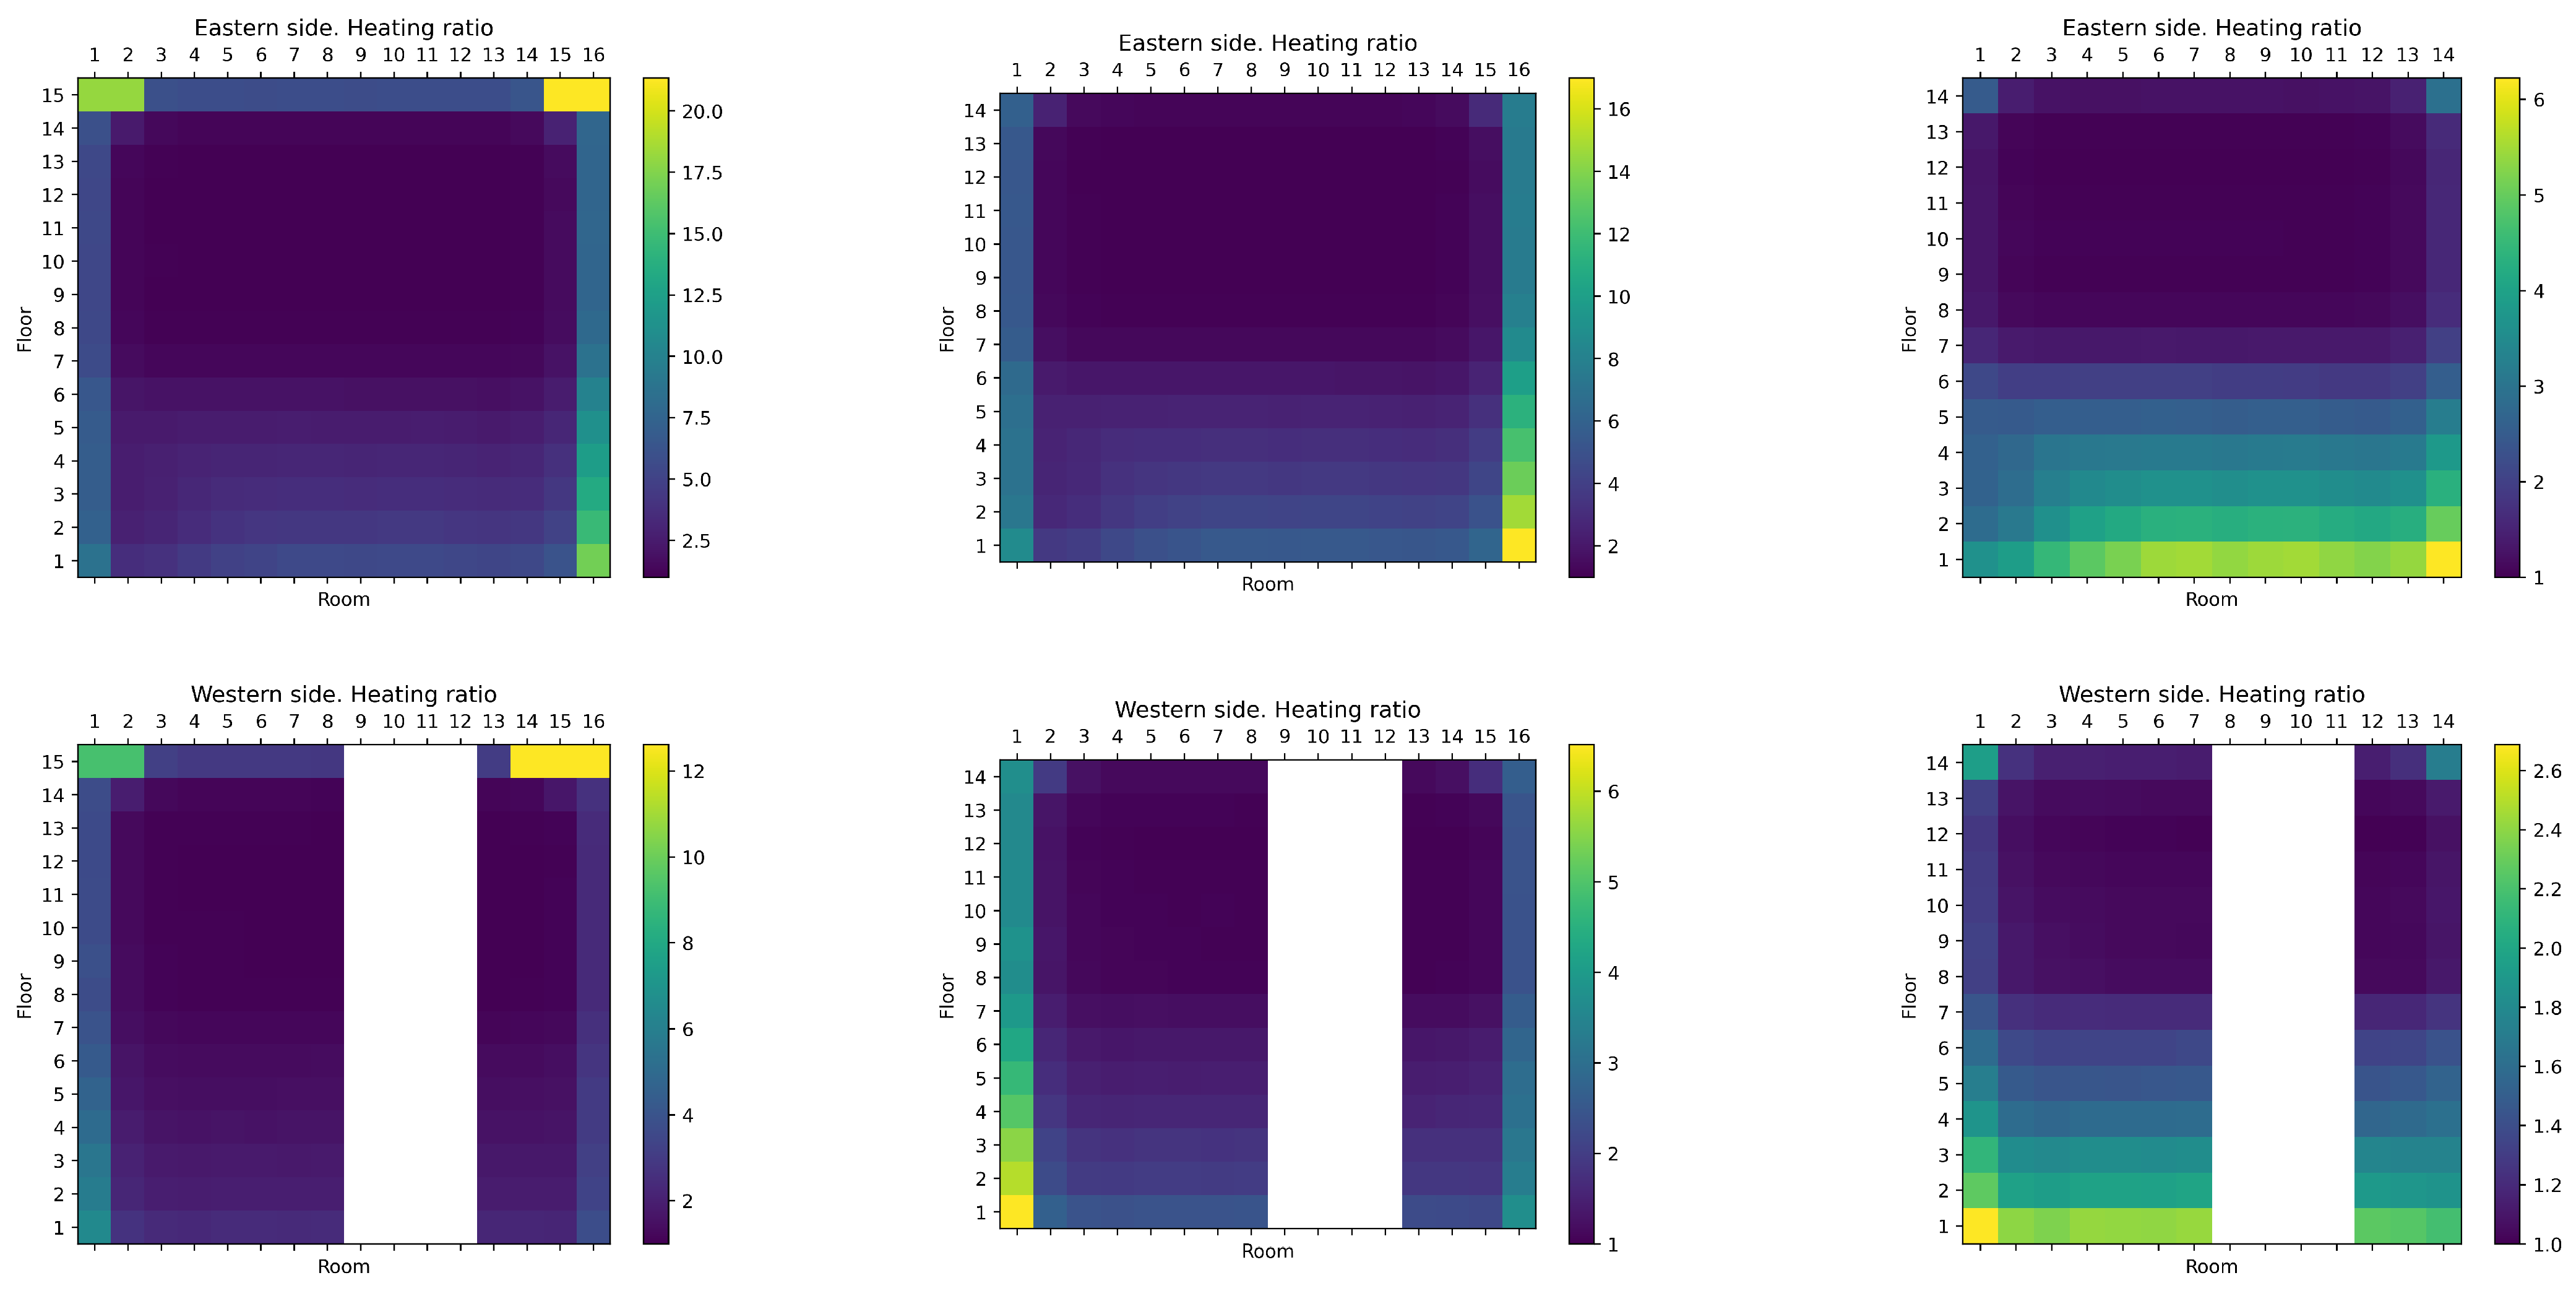
3.2.4. Heat Maps Showing Relative Energy Consumption for Individual Rooms
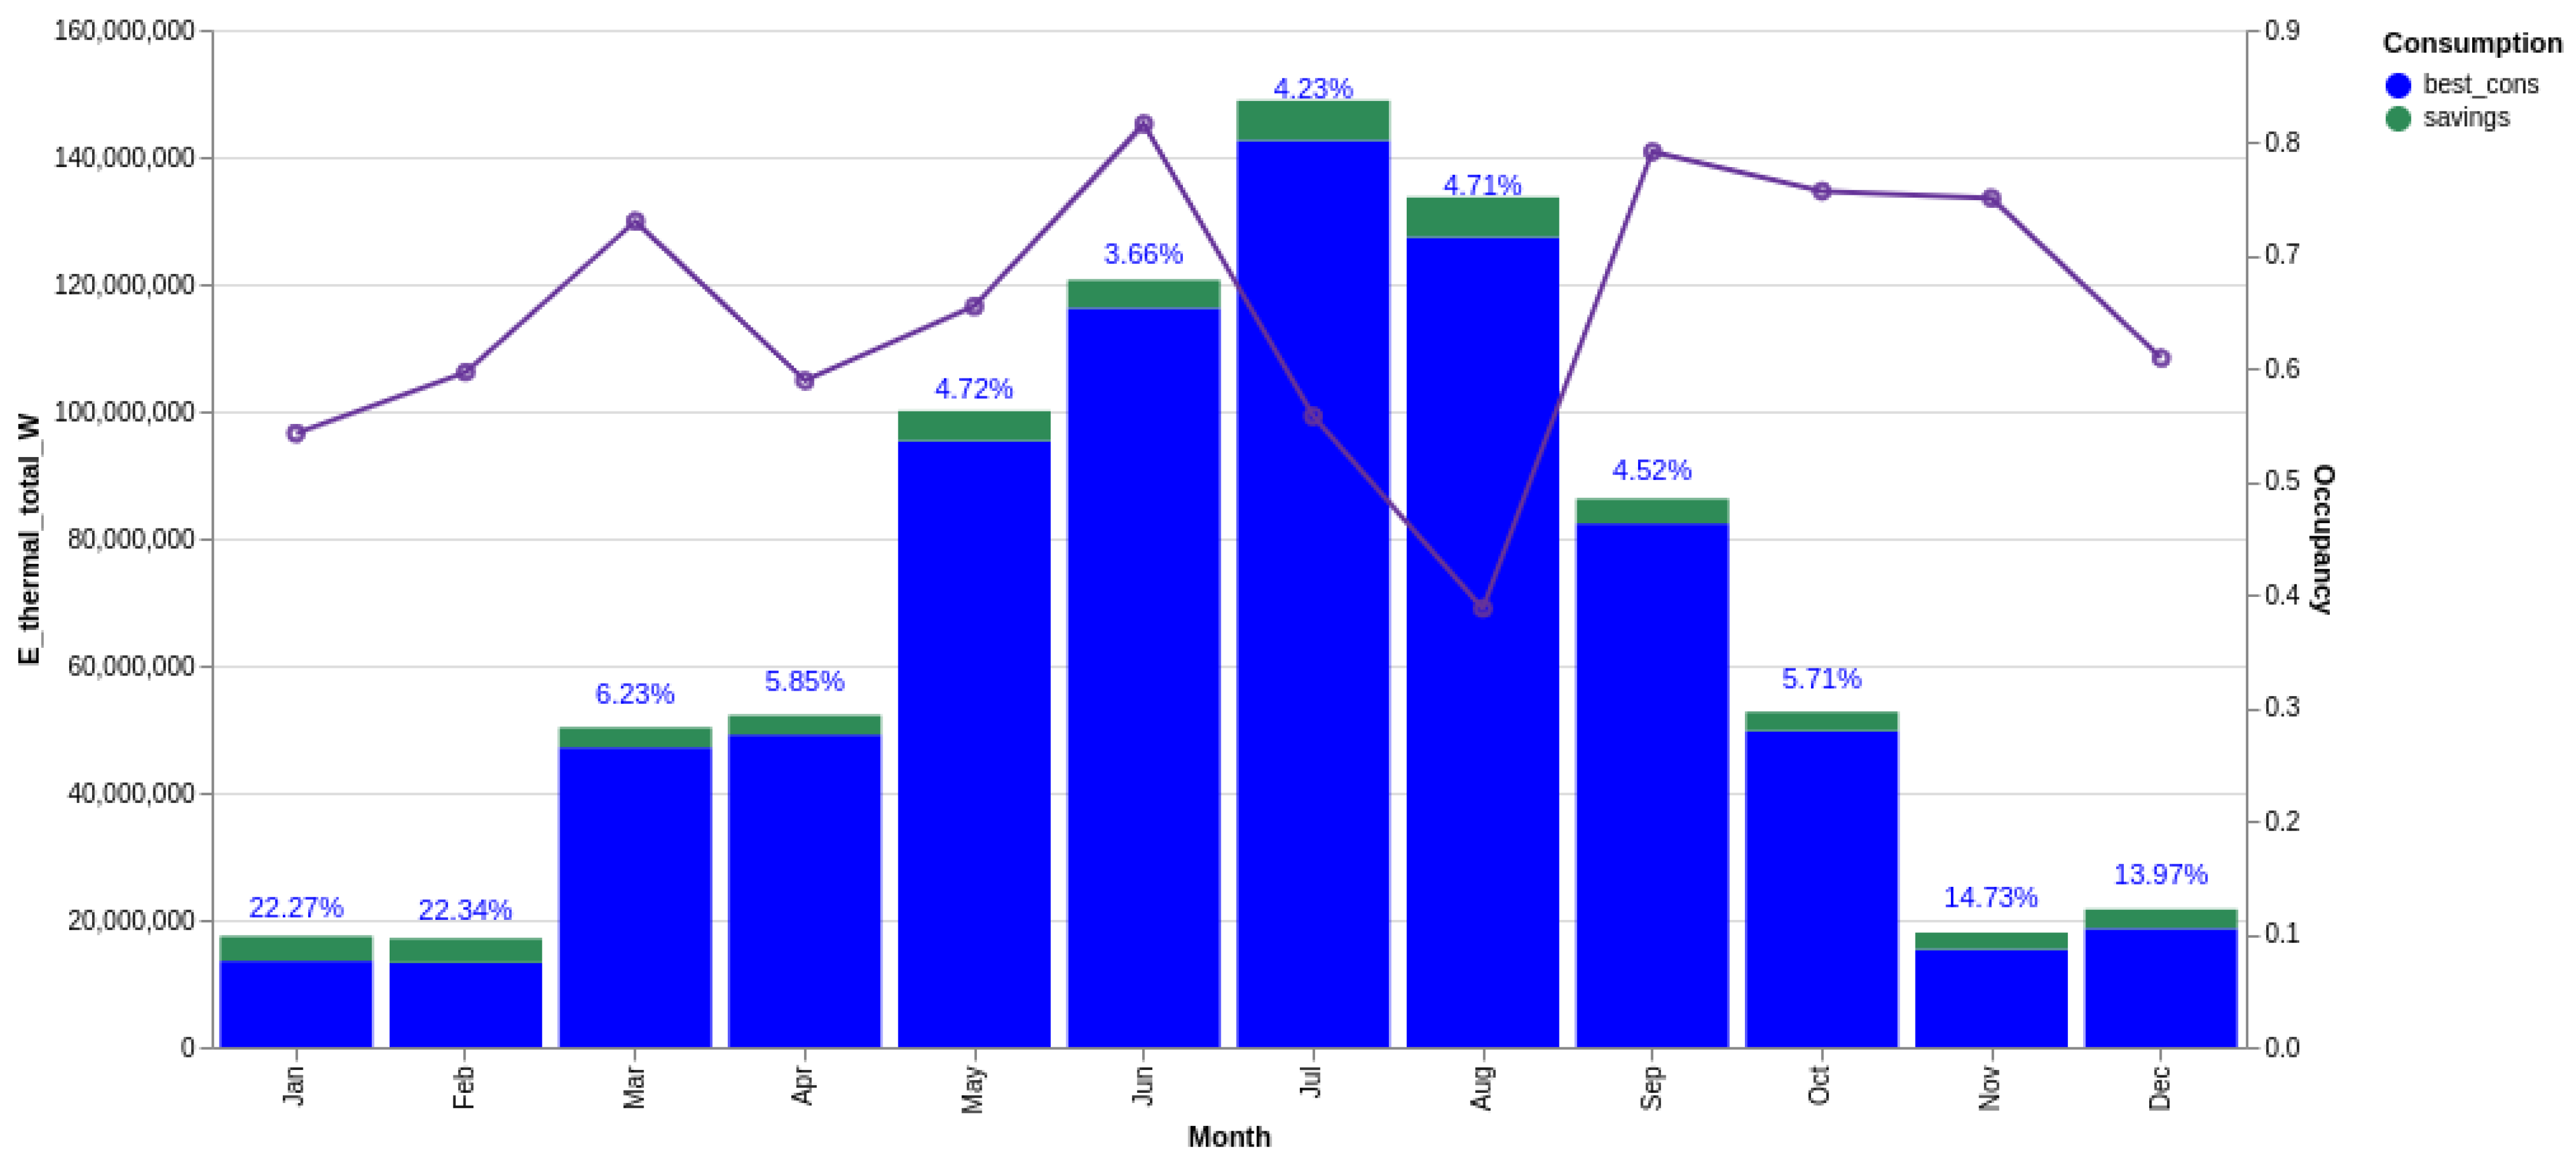
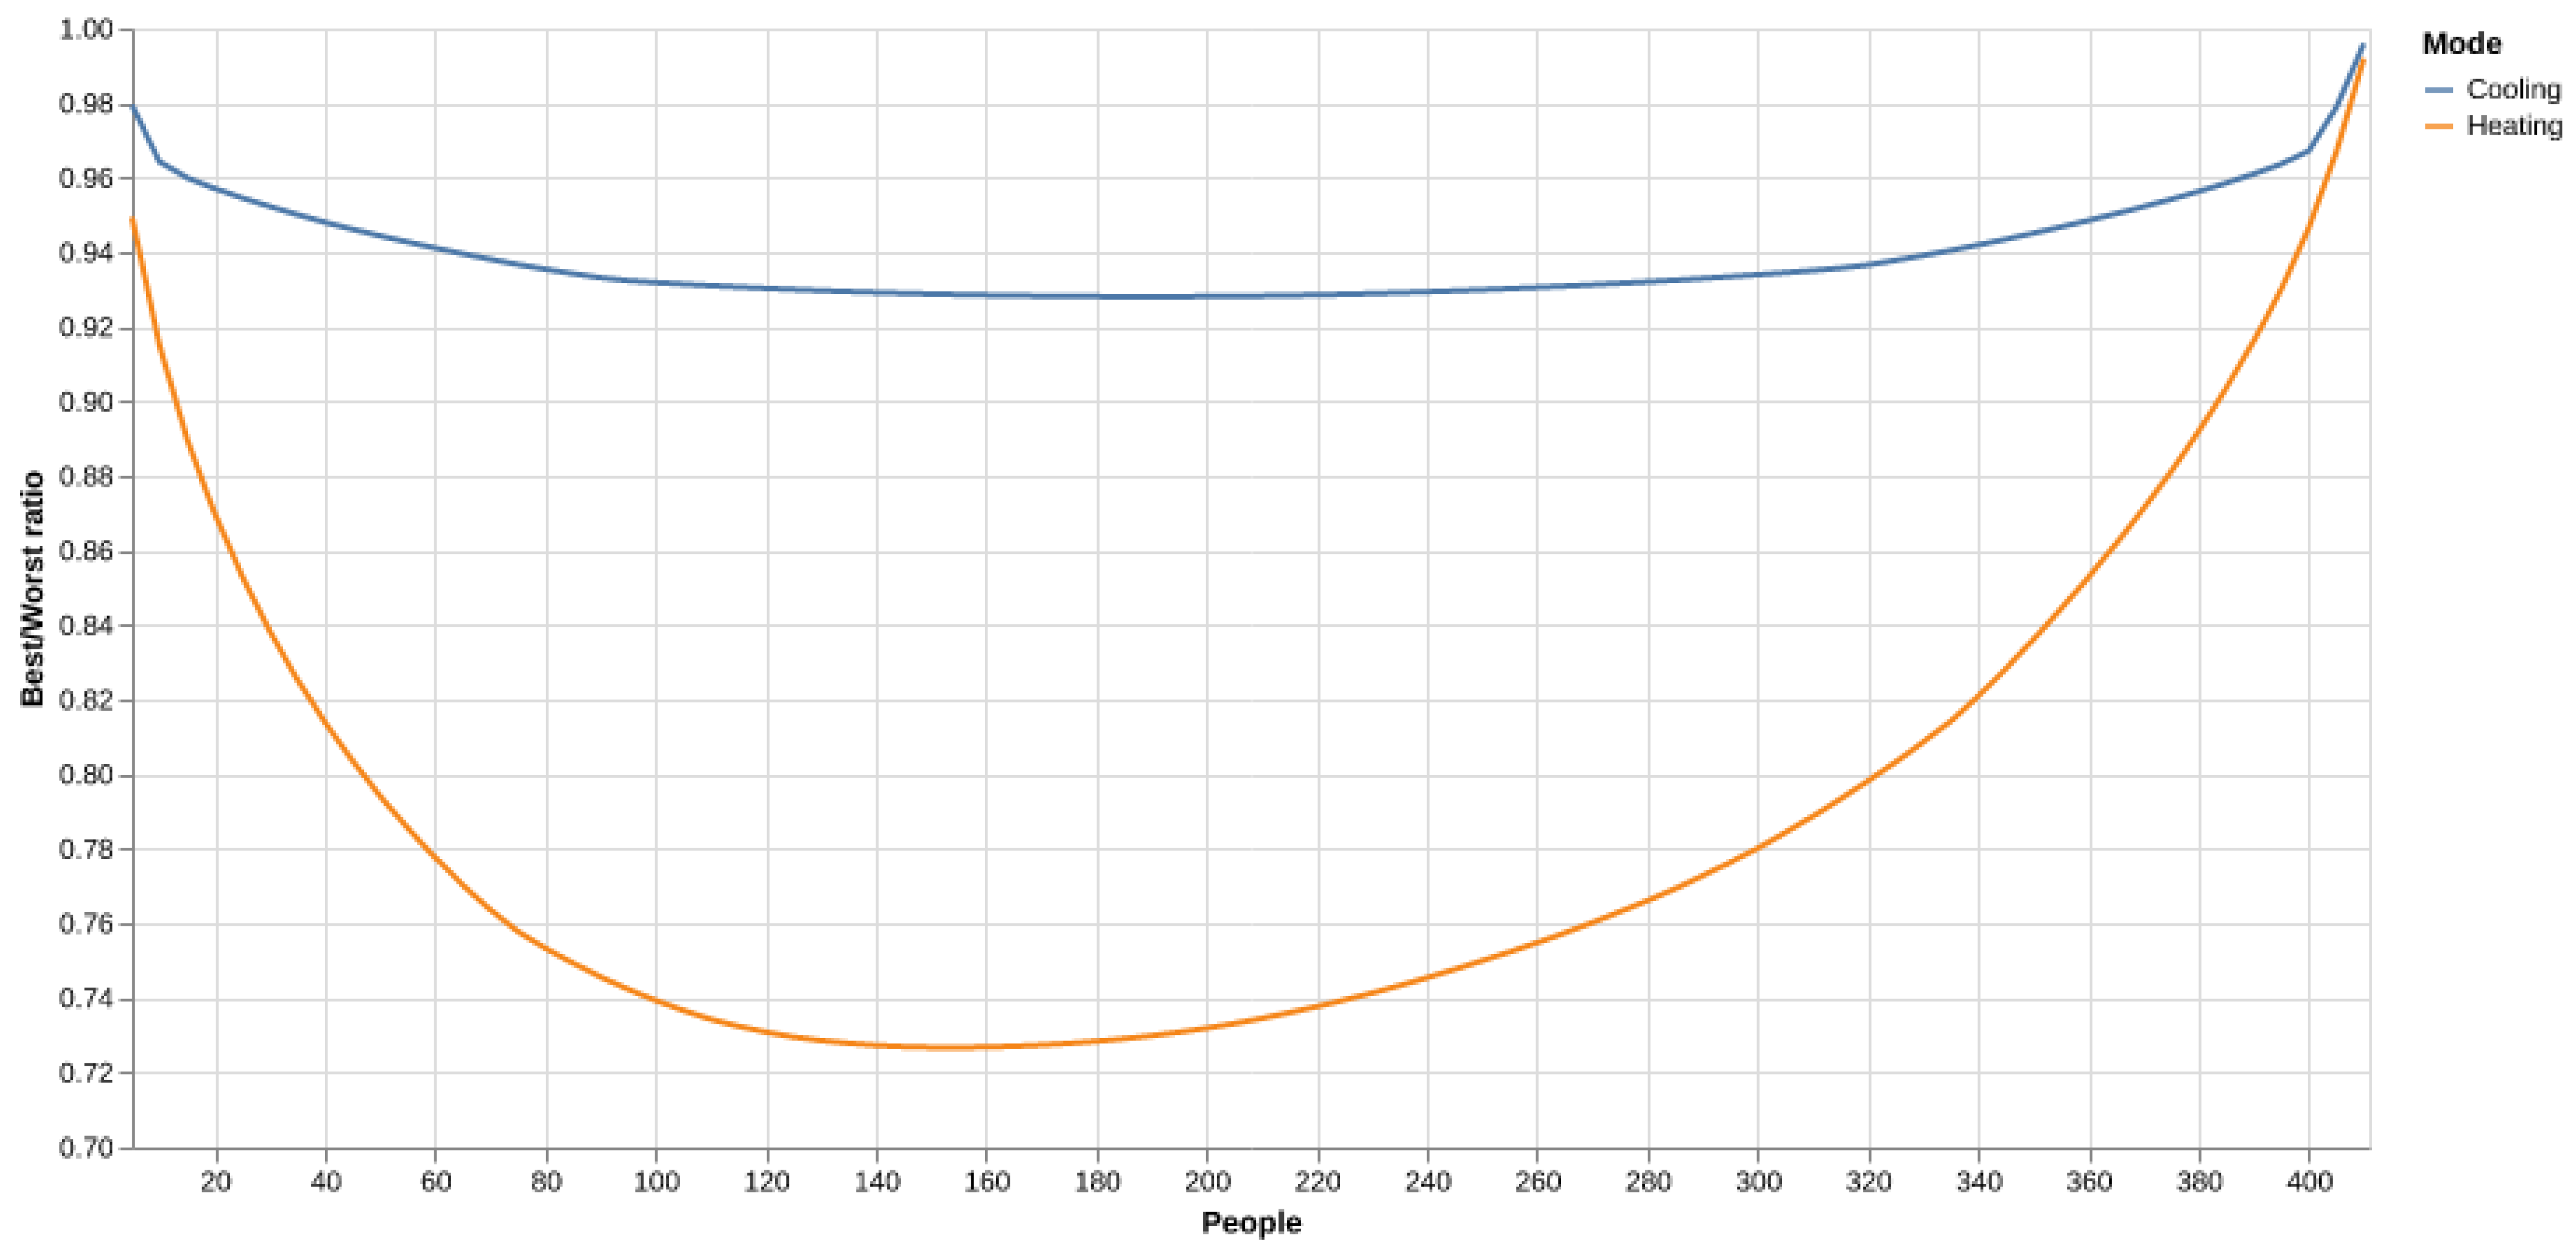
3.2.5. Energy-Saving Potential Estimation
3.2.6. Summary of Consumption Analysis and Saving Potentials
4. Discussion
5. Conclusions
Author Contributions
Funding
Data Availability Statement
Acknowledgments
Conflicts of Interest
Appendix A
References
- Zhou, T. Percentage-based thermal zoning approach for enhanced stock-level building energy performance modelling. Energy Build. 2025, 329, 115231. [Google Scholar] [CrossRef]
- Borowski, T. Hotel Adapted to the Requirements of an nZEB Building—Thermal Energy Performance and Assessment of Energy Retrofit Plan. Energies 2022, 15, 6332. [Google Scholar] [CrossRef]
- Nguyen, T. Developing an energy benchmarking system for hotel buildings using simulation. J. Green Build. 2019, 14, 1–22. [Google Scholar] [CrossRef]
- Permana, T. Energy Consumption Analysis Using Weighted Energy Index and Energy Modeling for a Hotel Building. Buildings 2023, 13, 1022. [Google Scholar] [CrossRef]
- Giuzio, T. HVAC operational efficiency using EnergyPlus. Energy Rep. 2022, 8, 3069–3081. [Google Scholar]
- Cunha, T. Benchmarking for realistic nZEB hotel buildings. J. Build. Eng. 2020, 30, 101298. [Google Scholar] [CrossRef]
- Sha, T. Development of a key-variable-based parallel HVAC energy predictive model. Build. Simul. 2022, 15, 1193–1208. [Google Scholar] [CrossRef]
- Tharushi Imalka, S.; Yang, R.J.; Zhao, Y. Machine learning driven building integrated photovoltaic (BIPV) envelope design optimization. Energy Build. 2024, 324, 114882. [Google Scholar] [CrossRef]
- Boccalatte, A.; Fossa, M.; Ménézo, C. Best arrangement of BIPV surfaces for future NZEB districts while considering urban heat island effects and the reduction of reflected radiation from solar façades. Renew. Energy 2020, 160, 686–697. [Google Scholar] [CrossRef]
- Shen, T. Green Design Studio: A Modular-Based Approach for High-Performance Building Design. Doctoral Dissertation, Syracuse University, Syracuse, NY, USA, 2023. [Google Scholar]
- Zhou, T. Multi-parameter building simulation for hotel optimization. Energy Procedia 2023, 158, 4041–4046. [Google Scholar]
- Sezer, N.; Yoonus, H.; Zhan, D.; Wang, L.L.; Hassan, I.G.; Rahman, M.A. Urban microclimate and building energy models: A review of the latest progress in coupling strategies. Renew. Sustain. Energy Rev. 2023, 184, 113577. [Google Scholar] [CrossRef]
- Zhang, J.; Yuan, C.; Yang, J.; Zhao, L. Research on Energy Consumption Prediction Models for High-Rise Hotels in Guangzhou, Based on Different Machine Learning Algorithms. Buildings 2024, 14, 356. [Google Scholar] [CrossRef]
- Gao, G.; Li, J.; Wen, Y. Surrogate modeling for long-term and high-resolution prediction of building energy demand. Energy Built Environ. 2022, 3, 175–184. [Google Scholar] [CrossRef]
- Landa del Barrio, I.; Fernández-Vigil Iglesias, M.; Peppas, A.; Bruse, J.L.; Echeverría Trueba, J.B.; Fernández Bandera, C. Ensemble surrogate modeling of a real-time HVAC set-point optimization framework for PV self-consumption maximization. Energy Build. 2025, 336, 115478. [Google Scholar] [CrossRef]
- da Costa Paulo, B.; Aginako, N.; Ugartemendia, J.; Landa del Barrio, I.; Quartulli, M.; Camblong, H. Surrogate model of a HVAC system for PV self-consumption maximisation. Energy Convers. Manag. X 2023, 19, 100396. [Google Scholar] [CrossRef]
- Romero Rodríguez, L.; Duminil, E.; Sánchez Ramos, J.; Eicker, U. Assessment of the photovoltaic potential at urban level based on 3D city models: A case study and new methodological approach. Sol. Energy 2017, 146, 264–275. [Google Scholar] [CrossRef]
- Aftab, M.; Chen, C.; Chau, C.K.; Rahwan, T. Automatic HVAC Control with Real-time Occupancy Recognition and Simulation-guided Model Predictive Control in Low-cost Embedded System. arXiv 2017, arXiv:1708.05208. [Google Scholar] [CrossRef]
- Gao, G.; Li, J.; Wen, Y. Energy-Efficient Thermal Comfort Control in Smart Buildings via Deep Reinforcement Learning. arXiv 2019, arXiv:1901.04693. [Google Scholar]
- Merabet, G.H.; Essaaidi, M.; Ben Haddou, M.; Qolomany, B.; Qadir, J.; Anan, M.; Al-Fuqaha, A.; Abid, M.R.; Benhaddou, D. Intelligent Building Control Systems for Thermal Comfort and Energy-Efficiency: A Systematic Review of Artificial Intelligence-Assisted Techniques. arXiv 2021, arXiv:2104.02214. [Google Scholar]
- Kim, J. LSTM-based Space Occupancy Prediction towards Efficient Building Energy Management. arXiv 2020, arXiv:2012.08114. [Google Scholar]
- Hoque, K.A.; Cauchi, N.; Abate, A. Analyzing Occupancy-Driven Thermal Dynamics in Smart Buildings. arXiv 2019, arXiv:1903.06123. [Google Scholar]
- Gao, G.; Li, J.; Wen, Y. Long-term analysis of cooling demand and heat recovery in hotel buildings using EnergyPlus. Energy Build. 2024, 287, 112983. [Google Scholar] [CrossRef]
- Dobbs, J.R.; Hencey, B.M. Model Predictive HVAC Control with Online Occupancy Model. arXiv 2014, arXiv:1403.4662. [Google Scholar] [CrossRef]
- Yu, T. Long-term analysis of cooling demand and heat recovery in hotel HVAC systems. Energy Build. 2024, 321, 114657. [Google Scholar]
- Luo, T. Energy consumption patterns in hotel HVAC systems. Renew. Energy 2021, 172, 1001–1012. [Google Scholar]
- Ji, T. Sensitivity analysis of HVAC control variables. Energy Build. 2022, 263, 111990. [Google Scholar]
- Alhuwayil, W.; Mujeebu, M.A.; Algarny, A. Impact of External Shading Strategy on Energy Performance of Multi-Story Hotel Building in Hot-humid Climate. Energy 2018, 169, 1166–1174. [Google Scholar] [CrossRef]
- U.S. Department of Energy. EnergyPlus Engineering Reference: The Reference to EnergyPlus Calculations; U.S. Department of Energy: Washington, DC, USA, 2023; Chapter: Ideal Loads Air System. [Google Scholar]
- Hall, I.J.; Prairie, R.R.; Anderson, H.E.; Boes, E.C. Generation of Typical Meteorological Years for 26 SOLMET Stations; Technical Report SAND78-1601; Sandia National Laboratories: Albuquerque, NM, USA, 1978. [Google Scholar]
- ASHRAE. Air-Source Heat Pump Systems in Commercial Applications. ASHRAE J. 2023, 65, 35–40. [Google Scholar]
- Chen, T. Guest comfort vs energy savings in hotel zoning. J. Build. Perform. 2022, 13, 87–96. [Google Scholar]

| Room Type | Surface [m2] | Volume [m3] | Window Surface Area [m2] |
|---|---|---|---|
| Standard | 39 | 107 | 4.5 |
| Corner | 44 | 119 | 11 |
| Suite1 | 74 | 204 | 17 |
| Suite2 | 74 | 204 | 17 |
| Suite3 | 77 | 210 | 19 |
| Suite4 | 122 | 335 | 17 |
| Type | Boundary | Pre-Set | Materials | Conductivity [W/m·K] |
|---|---|---|---|---|
| Roof | External | Insulated roof | Roof tiles 20 mm, | 0.84 |
| glass fiber quilt 100 mm, | 0.04 | |||
| plywood 25 mm | 0.15 | |||
| Wall | Zone | Party Wall 1 | Plaster board 20 mm, | 0.7264 |
| standard brick 100 mm, | 0.8 | |||
| plaster board 20 mm | 0.7264 | |||
| Floor | External | Ground Floor 1 | Common earth 200 mm, | 1.28 |
| gravel 200 mm, | 1.28 | |||
| heavy mix concrete 100 mm, | 1.4 | |||
| horizontal air 20 mm, | ||||
| chipboard 25 mm | 0.15 | |||
| Window | External | DG—low-E—Krypton | Clear 3mm Soft LoE, | |
| Krypton 14 mm, | ||||
| clear 3 mm | ||||
| Roof | Zone | Ceiling 1 | Chipboard 25 mm, | 0.15 |
| EPS 100 mm, | 0.035 | |||
| plaster board 20 mm | 0.7264 | |||
| Wall | External | External wall 1 | Standard brick 100 mm, | 0.8 |
| Thermawall TW50 200 mm, | 0.022 | |||
| inner concrete block 100 mm | 0.51 | |||
| Floor | Zone | Internal floor 1 | Plaster board 20 mm, | 0.7264 |
| EPS 100 mm, | 0.035 | |||
| chipboard 25 mm | 0.15 |
| Variable | Category | Observations |
|---|---|---|
| Solar Gain | Seasonality and Height |
|
| Orientation |
| |
| Monthly Distribution |
| |
| Cooling Energy Demand | Seasonality |
|
| Orientation |
| |
| Height Influence |
| |
| Heating Energy Demand | Seasonality |
|
| Orientation |
| |
| Height Influence |
| |
| Meteorological Conditions | Correlations |
|
| Actual vs. Simulated Consumption | Trend Comparison and Magnitude |
|
| Aspect | Condition/Grouping | Key Observations |
|---|---|---|
| Floor Height | Cooling Demand |
|
| Heating Demand |
| |
| Room Orientation | Cooling Demand |
|
| Heating Demand |
| |
| Room Type | Cooling Demand |
|
| Heating Demand |
| |
| Room-Level Variation | Individual Rooms |
|
| Saving Potential (Simulated) | Ideal Allocation (Constant Annual Occupancy) |
|
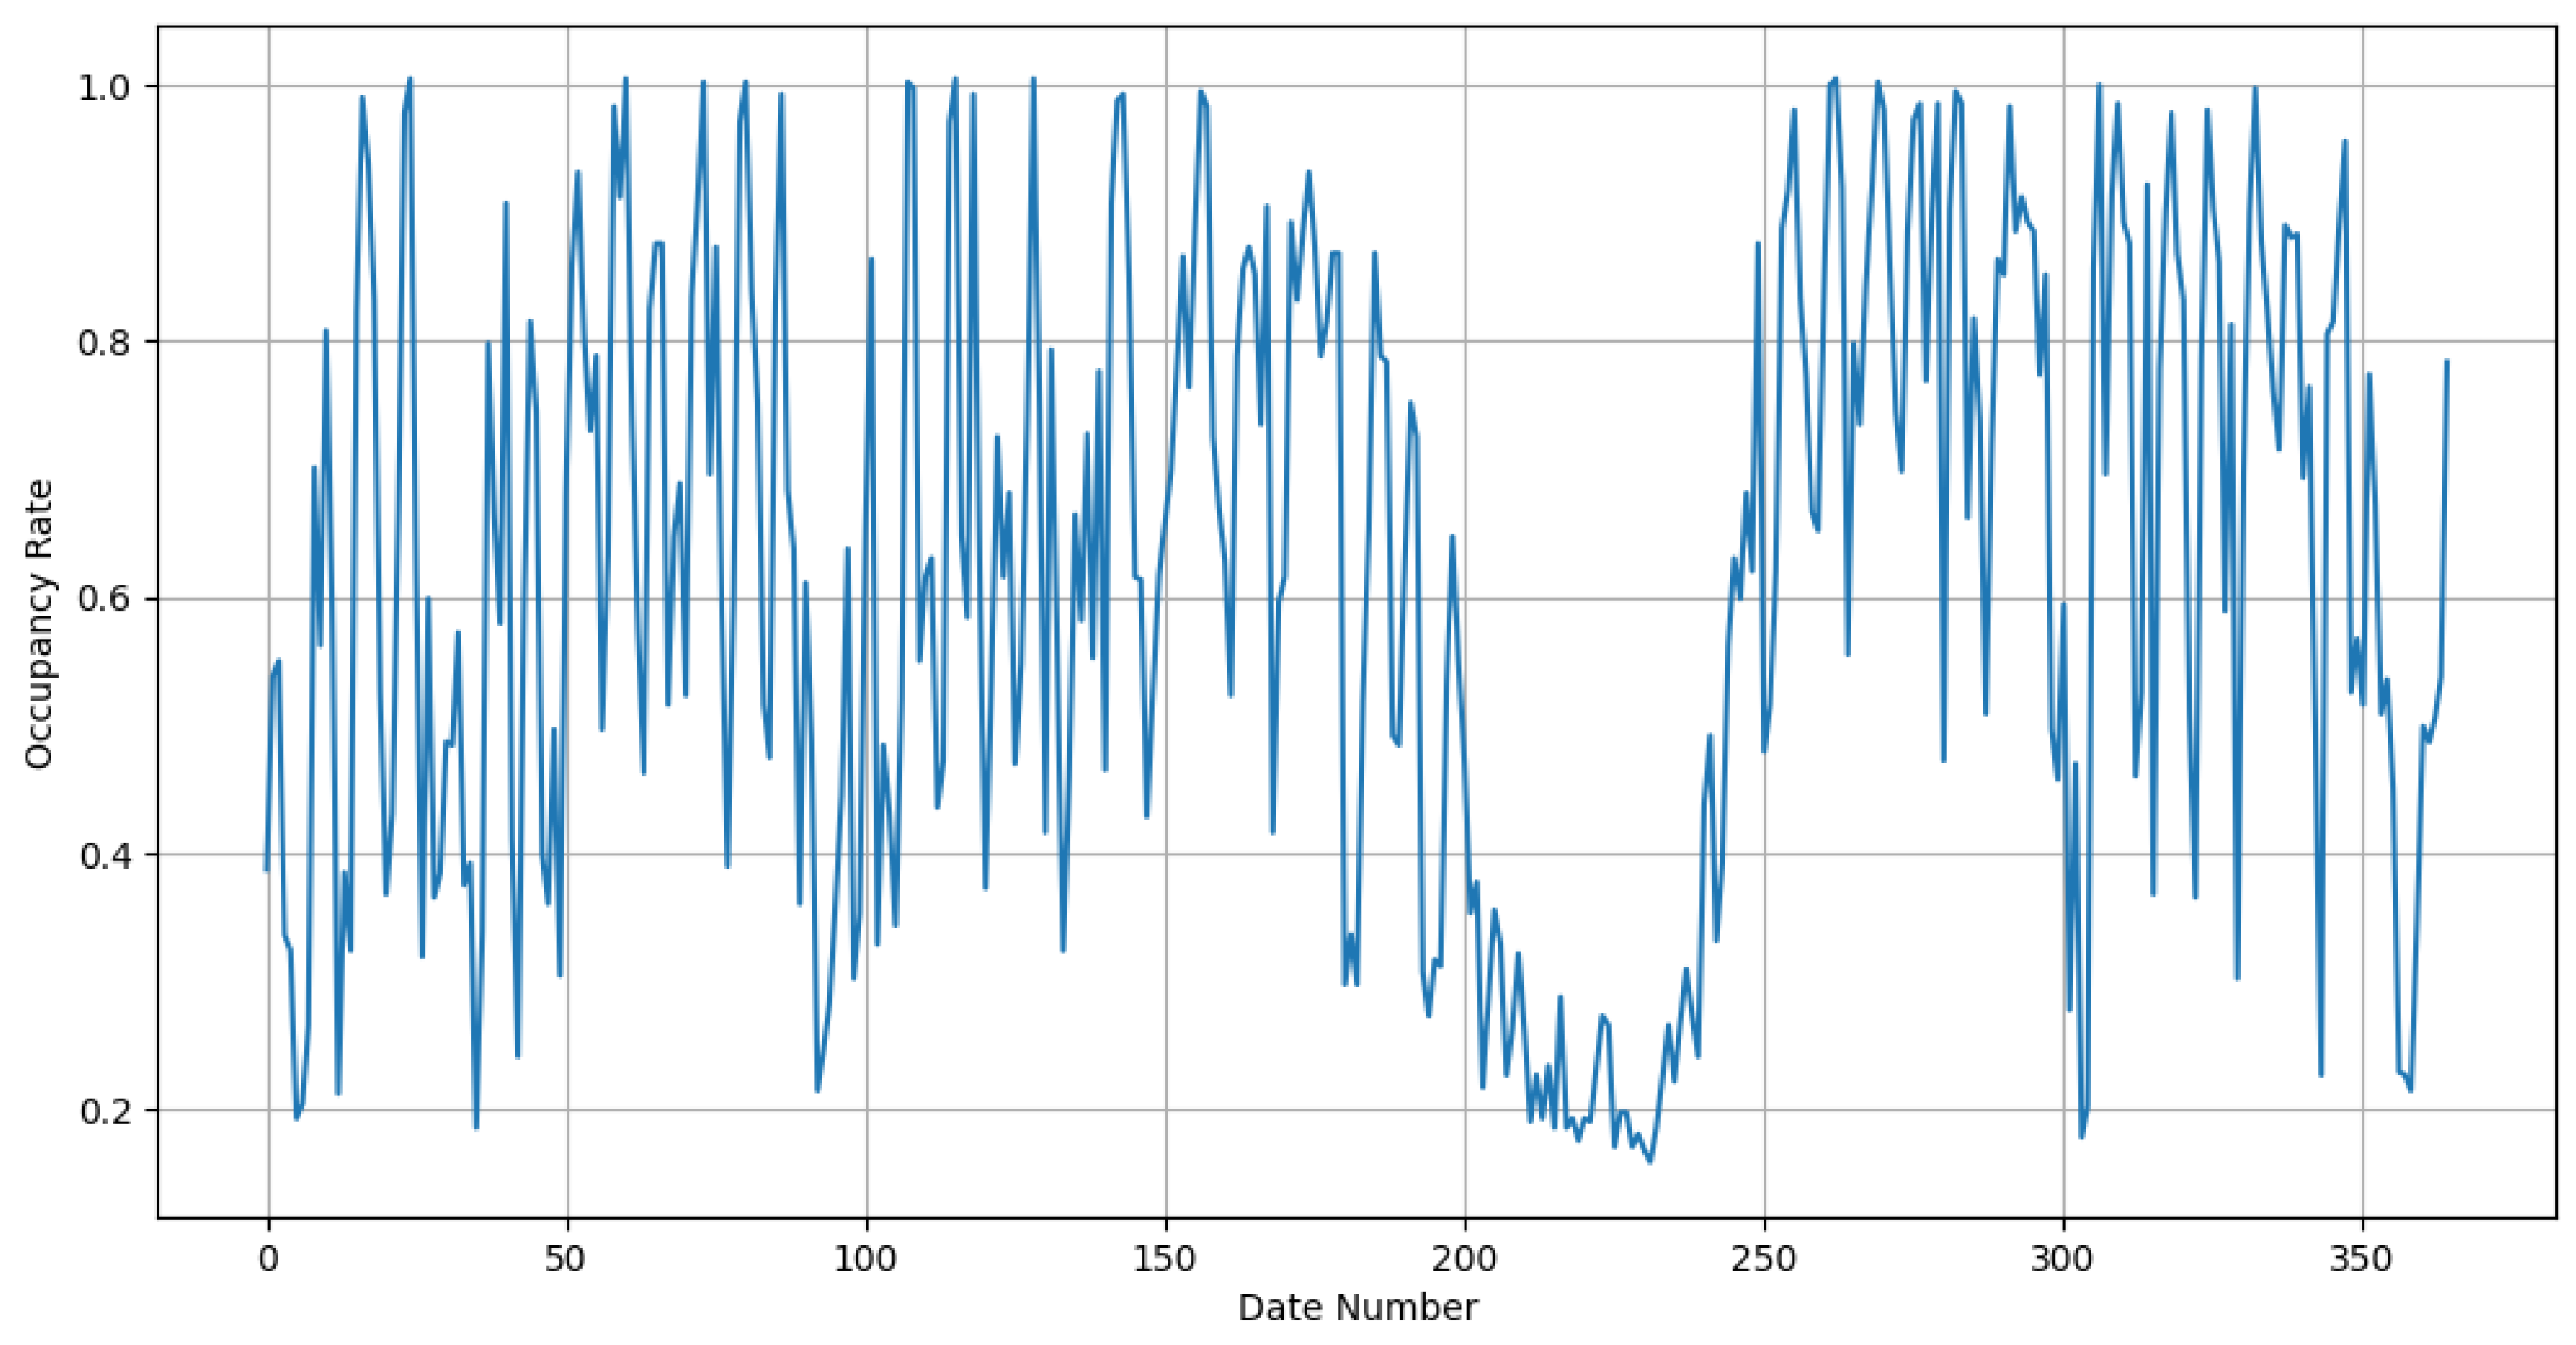
| Actual 2023 Occupancy |
|
Disclaimer/Publisher’s Note: The statements, opinions and data contained in all publications are solely those of the individual author(s) and contributor(s) and not of MDPI and/or the editor(s). MDPI and/or the editor(s) disclaim responsibility for any injury to people or property resulting from any ideas, methods, instructions or products referred to in the content. |
© 2025 by the authors. Licensee MDPI, Basel, Switzerland. This article is an open access article distributed under the terms and conditions of the Creative Commons Attribution (CC BY) license (https://creativecommons.org/licenses/by/4.0/).
Share and Cite
Landa del Barrio, I.; Flores Iglesias, M.; Odriozola González, J.; Fabregat, V.; Bruse, J.L. Solar Heat Gain Simulations for Energy-Efficient Guest Allocation in a Large Hotel Tower in Madrid. Buildings 2025, 15, 1960. https://doi.org/10.3390/buildings15111960
Landa del Barrio I, Flores Iglesias M, Odriozola González J, Fabregat V, Bruse JL. Solar Heat Gain Simulations for Energy-Efficient Guest Allocation in a Large Hotel Tower in Madrid. Buildings. 2025; 15(11):1960. https://doi.org/10.3390/buildings15111960
Chicago/Turabian StyleLanda del Barrio, Iker, Markel Flores Iglesias, Juan Odriozola González, Víctor Fabregat, and Jan L. Bruse. 2025. "Solar Heat Gain Simulations for Energy-Efficient Guest Allocation in a Large Hotel Tower in Madrid" Buildings 15, no. 11: 1960. https://doi.org/10.3390/buildings15111960
APA StyleLanda del Barrio, I., Flores Iglesias, M., Odriozola González, J., Fabregat, V., & Bruse, J. L. (2025). Solar Heat Gain Simulations for Energy-Efficient Guest Allocation in a Large Hotel Tower in Madrid. Buildings, 15(11), 1960. https://doi.org/10.3390/buildings15111960