Article

Dynamic Response and Computational Modeling of Truss-Reinforced Phosphogypsum-Concrete Composite Slabs Subjected to Impact Loading: A Parametric Finite Element Analysis

1
School of Civil Engineering, Jilin Jianzhu University, Changchun 130118, China
2
State Grid Baicheng Power Supply Company, Baicheng 137000, China
*
Author to whom correspondence should be addressed.
Buildings 2025, 15(11), 1948; https://doi.org/10.3390/buildings15111948
Submission received: 22 April 2025 / Revised: 13 May 2025 / Accepted: 21 May 2025 / Published: 4 June 2025
(This article belongs to the Section Building Structures)

Abstract

As a by-product of phosphate fertilizer production, phosphogypsum (PG) poses pressing environmental challenges that demand urgent resolution. To address the research gap in dynamic impact behavior of PG-modified concrete (PGC), this study developed truss-reinforced PGC slabs (PG volumetric fractions: 0% and 2%) and evaluated their impact resistance through drop-weight tests from a 3.75 m height. A systematic parametric investigation was conducted to quantify the effects of slab thickness (100–120 mm), steel plate reinforcement at the tension zone, PG content, and impact cycles. Experimental results revealed that increasing slab thickness to 120 mm reduced mid-span displacement by 13%, while incorporating steel plate reinforcement provided an additional 5.3% reduction. Notably, PG addition effectively suppressed crack propagation, transitioning failure modes from radial fracture patterns to localized mid-span damage. Finite element modeling ABAQUS (2022) validated experimental observations, demonstrating strong agreement. While optimized PG dosage (2%) exhibited limited influence on impact resistance, it enhanced PG utilization efficiency by 18%. Combined with increased slab thickness (displacement reduction: 13%), this study establishes a design framework balancing environmental sustainability and structural reliability for impact-resistant PGC applications. Within the framework of truss-reinforced concrete slabs with constant PG dosage, this study established a numerical model for geometric parameter modulation of impactors. Through systematic adjustment of the drop hammer’s contact width (a) and vertical geometric height (h), a dimensionless control parameter—aspect ratio c = h/a (0.2 ≤ c ≤ 1.8)—was proposed. Nonlinear dynamic analysis revealed that the peak impact load demonstrates an inverse proportional functional decay relationship with increasing c, yielding an empirical predictive model. These parametrized regularities provide theoretical foundations for contact interface optimization in impact-resistant structural design.

1. Introduction

Phosphogypsum (PG) is a by-product of the phosphoric acid wet production process. Every ton of phosphoric acid production will produce about 5 tons of PG; in recent years, China, the United States, Russia, Africa, and the Middle East have vigorously developed the phosphoric acid industry, which led to a significant increase in PG emissions. In China, the cumulative annual emission of PG has exceeded 20 million tons, with a storage capacity of more than 500 million tons, increasing yearly. These phosphogypsum stockpiles can pollute soil and groundwater sources, but the current utilization of PG is very low and the comprehensive utilization rate of PG is only 15% [1,2,3,4]. Some studies have shown that PG can be added to concrete to make building materials [5,6], which not only effectively solves the problem of PG disposal but also reduces the amount of cement used in concrete to protect the environment and reduce pollution. Yongrui Wang et al. [7] made phosphorus gypsum base polymer (PBP) by mixing β-phosphogypsum hemipelagic (β-HPG), slag, fly ash (FA), and alkali activator. The results of the gypsum base polymer (PBG) cement showed that the cement’s 28-day unconfined compressive strength (UCS) could be increased to more than 60 MPa under reasonable proportioning. Some articles added different phosphogypsum admixtures to the cement to evaluate the setting time, flow and compressive strength of the prepared concrete samples; the results showed that PG admixtures of 5–10% were optimal [8,9]. Sihan Chen et al. [10] prepared PG concrete specimens by replacing some of the silicate types of cement with PG and used the Separate Hopkinson Pressure Bar (SHPB) system to perform dynamic compression of specimens where different PG Dynamic compression tests were carried out on specimens with different PG dosages using a split Hopkinson compression bar (SHPB) system. With the increase in phosphogypsum (PG) dosage, the dynamic compressive strength and dynamic modulus of elasticity of phosphogypsum concrete specimens roughly showed a tendency to increase and then decrease. The dosage of phosphogypsum should be reasonably controlled. Chao Yin, Li Zhou et al. [11] conducted axial compression tests on four cold-formed thin-walled steel (CFS)–phosphogypsum (PG) composite wall specimens, elucidating the synergistic interaction mechanisms within the composite system. Experimental results demonstrated that the steel skeleton predominantly sustained axial stresses during the elastic phase (ε < 1.5%), while the PG filler contributed substantially to over 75% of ultimate load enhancement via confinement mechanisms in the plastic phase (ε ≥ 2.0%), establishing a phased synergistic load-bearing mechanism.
It should also be noted that PG concrete as a civil or military building structure material will be subjected to dynamic loads such as impacts, explosions, and earthquakes, such as the explosion of the Fukushima nuclear power plant in Japan, the accident of the control tower of the Kansas airport in the United States, and manufactured disasters of terrorist attacks and wars, etc. [12,13]. In an industrial plant, the cranes above the floors drop the goods when transporting them, and also the floor slabs can have varying degrees of impact force and damage [14]; in the construction of buildings, if the suspended objects once penetrate the floor slab, it will also cause serious injuries to the people under the floor slab. Reducing the impact of suspended objects on the floor slab not only ensures public safety but also reduces the construction cost due to a shorter construction period [15]. Hamid Sadraie et al. [16] carried out an impact test on 15 reinforced concrete slabs to discuss the strength of the concrete. Feng Peng et al. [17] conducted impact tests on different concrete slabs with different length-to-thickness ratios, and the results showed that as the slab thickness of concrete increased, the collision time was prolonged, the impact force increased, and the impact load-carrying capacity was significantly increased. Masuhiro Beppu et al. [18] conducted impact tests on reinforced concrete slabs with different thicknesses, and the results showed that the impact capacity of reinforced concrete slabs with different thicknesses was significantly increased. Slabs with different thicknesses of reinforced concrete slabs, the results showed that the maximum impact force was also affected by the stiffness of the punch. K. Senthil et al. [19] investigated the effect of different thicknesses of slabs with the same reinforcement ratio on the impact resistance of reinforced concrete slabs under impact loading; the results showed that the punching shear resistance of the slabs increased with the increase in the thickness of the concrete slabs, the mid-point displacement of the slabs decreased, and at the same time, the reinforcement strain decreased with the increase in the thickness of the concrete slabs. Chong Chen et al. [20,21] used a green building material, geopolymer concrete (GPC), to replace traditional concrete and investigated the effects of slab thickness and reinforcement rate on the impact response of GPC slabs; it was concluded that increasing the slab thickness can enhance the ability of the concrete to resist the shear load and thus effectively reduce the punching damage of the slab. The slabs with a thicker embryo have a greater shear and bending resistance, which will produce a greater thickness. The thicker slab with greater shear and flexural capacity will produce a larger impact force and less deflection and damage. As the reinforcement rate increases, the peak value of the first peak of the impact force is similar, and the peak value of the second peak increases.
Current research on impact resistance primarily focuses on conventional reinforced concrete slabs, while limited studies exist on truss-reinforced phosphogypsum composite (PGC) slabs under impact loading. To systematically investigate the impact resistance of truss-reinforced PGC slabs, five specimens were fabricated with controlled variables: number of impact cycles, steel plate reinforcement at the base, slab thickness, and phosphogypsum (PG) content. Drop-weight impact tests were conducted to quantify the dynamic response characteristics under progressive impact events. Abaqus/Explicit was employed to conduct nonlinear dynamic analyses evaluating the influence of width-to-height ratio variations on the impact resistance mechanisms of reinforced concrete slabs subjected to controlled drop-weight impacts.

2. Test Overview

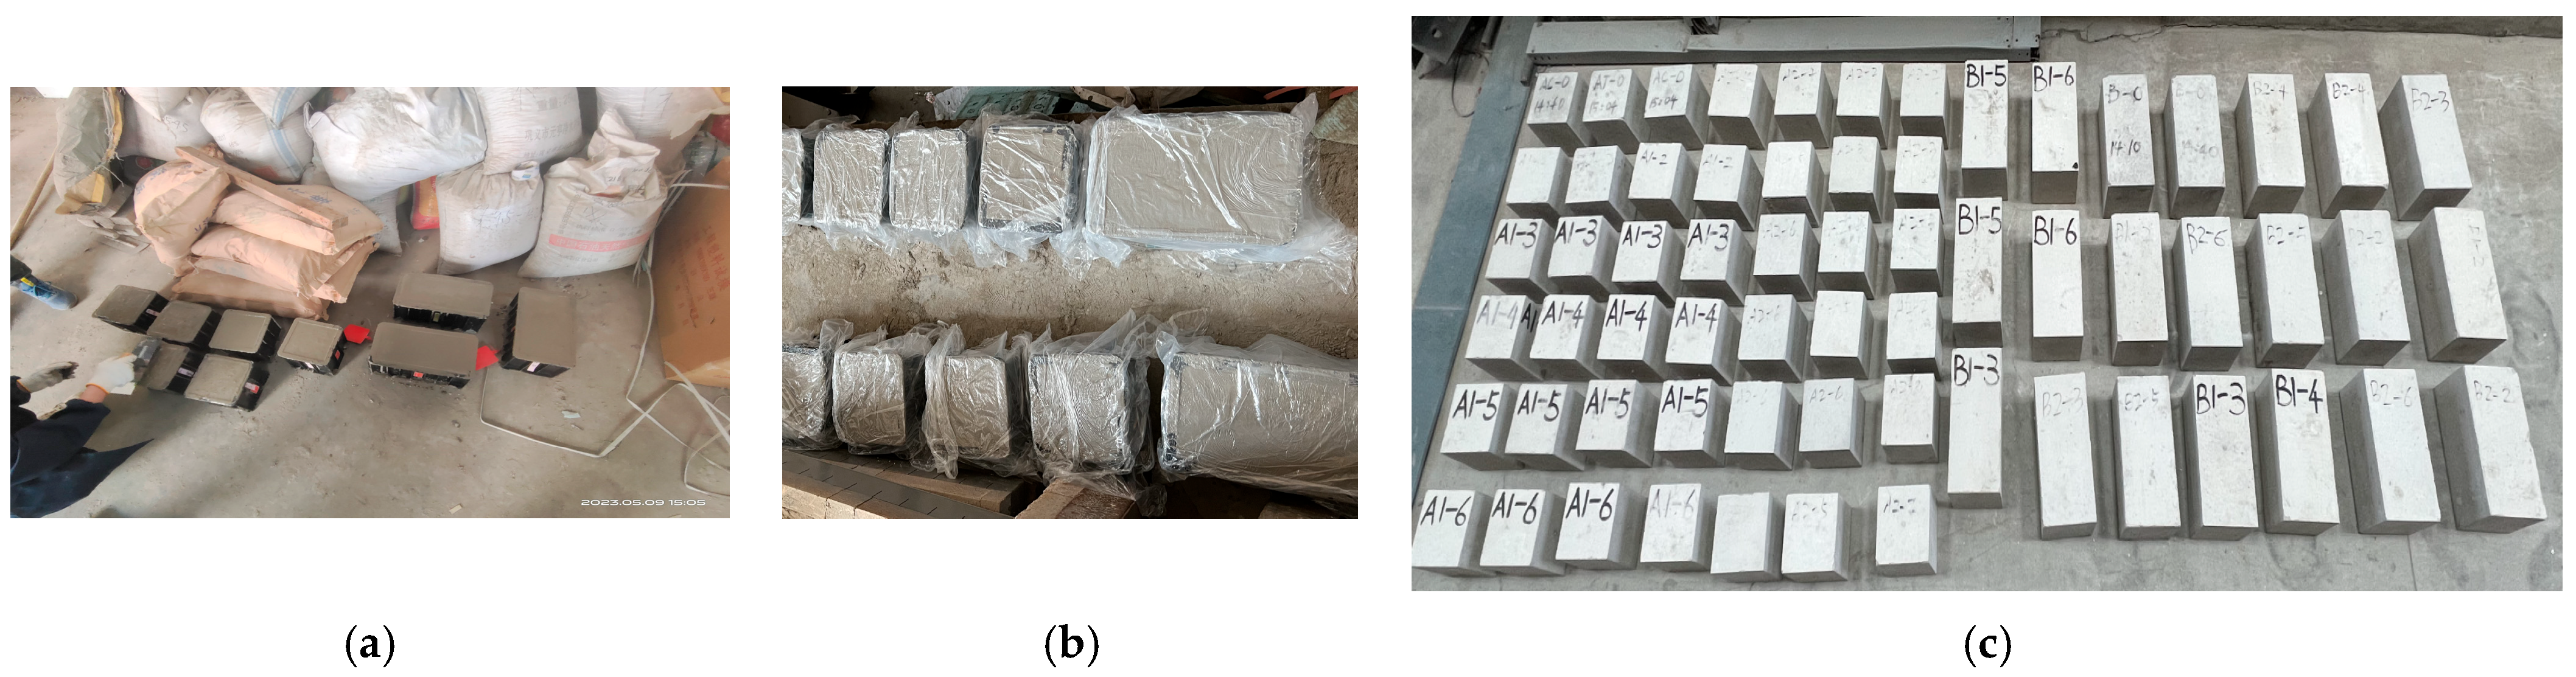
2.1. Material Properties

In accordance with GB/T 5081-2019 [22] (Standard for Test Methods of Mechanical Properties of Ordinary Concrete), GB 50010 [23] (Code for Mix Proportion Design of Ordinary Concrete), and GB/T 50743 [24] (Technical Code for Application of Waste Concrete)—which recommends 2–5% PG incorporation in cementitious materials—this study formulated cube specimens (150 mm3) and prismatic specimens (150 × 150 × 300 mm) with PG dosages of 0% and 2% by mass. The concrete mix design was developed in accordance with GB 50010 and JGJ 55 [25] specifications, incorporating 5–25 mm Class II continuously graded crushed stone (GB/T 14685 [26]) and Zone II medium sand with fineness modulus 2.3–3.0 (GB/T 14684 [27]). A polycarboxylate-based high-range water reducer (HRWR) meeting GB 8076 [28] requirements was added at 1.2% of cementitious material mass, demonstrating ≥ 25% water reduction efficiency. Key design parameters included a water-to-binder ratio of 0.52, 41% sand-to-aggregate ratio by mass, and 180 mm slump. The optimized bimodal aggregate gradation (coarse/fine) combined with HRWR dosage achieved synergistic enhancement of mechanical properties and workability through particle packing density maximization and interparticle friction reduction. The strategic integration of optimized bimodal aggregate gradation with HRWR superplasticizer achieved concurrent enhancement of compressive strength development and rheological performance through improved particle packing geometry and reduced interparticle friction. Compressive strength evaluations under cubic and axial loading conditions were conducted, accompanied by elastic modulus determination to characterize the mechanical performance of PG-modified concrete. The material characterization process is illustrated in Figure 1, with Table 1 detailing the concrete mix proportions indicators, and Table 2 detailing the concrete test configuration for test.
Molds were systematically numbered and coated with form-release agent prior to concrete mixing. The concrete batch, proportioned according to Table 2, was homogenized using a single-horizontal-shaft forced-action mixer complying. Owing to the retarding characteristics of phosphogypsum (initial setting time > 6 h per GB/T 1346 [29]), formwork retention was maintained for 48 h under controlled conditions (20 ± 2 °C, RH ≥ 95%). Specimens were subsequently demolded and cured in standard chambers (20 ± 1 °C, RH > 98%) until 28-day maturity, with final geometry compliance verified in Figure 2. The reference group without PG addition demonstrated compressive characteristics of 42.2 MPa (cube strength), 33.1 MPa (axial strength), and 33.8 GPa (elastic modulus). Specimens containing 2% PG by mass showed reductions in mechanical properties: 4.3% decrease in cube strength (40.4 MPa), 4.8% in axial strength (31.5 MPa), and 3.3% in elastic modulus (32.7 GPa) compared to the control group. The experimental results revealed 4.3%, 4.8%, and 1.2% reductions in cubic compressive strength, axial compressive strength, and elastic modulus, respectively, when the PG admixture ratio increased from 0% to 2% (mass fraction). This mechanical degradation pattern indicates that PG incorporation induces systematic reductions in all three key mechanical parameters compared to the control concrete. At 2% PG dosage, the cubic compressive strength reached 40.4 MPa (C40 grade), showing closest compatibility with conventional concrete. This optimal performance stems from PG’s pozzolanic reaction with cement phases (C4AF and C3A), generating ettringite crystals that partially refine pore structure through microstructural reinforcement and void-filling effects. Beyond the optimal dosage threshold, unreacted PG particles accumulate, inducing pronounced strength deterioration in PG-modified concrete due to compromised hydration kinetics and interfacial transition zone integrity [30].

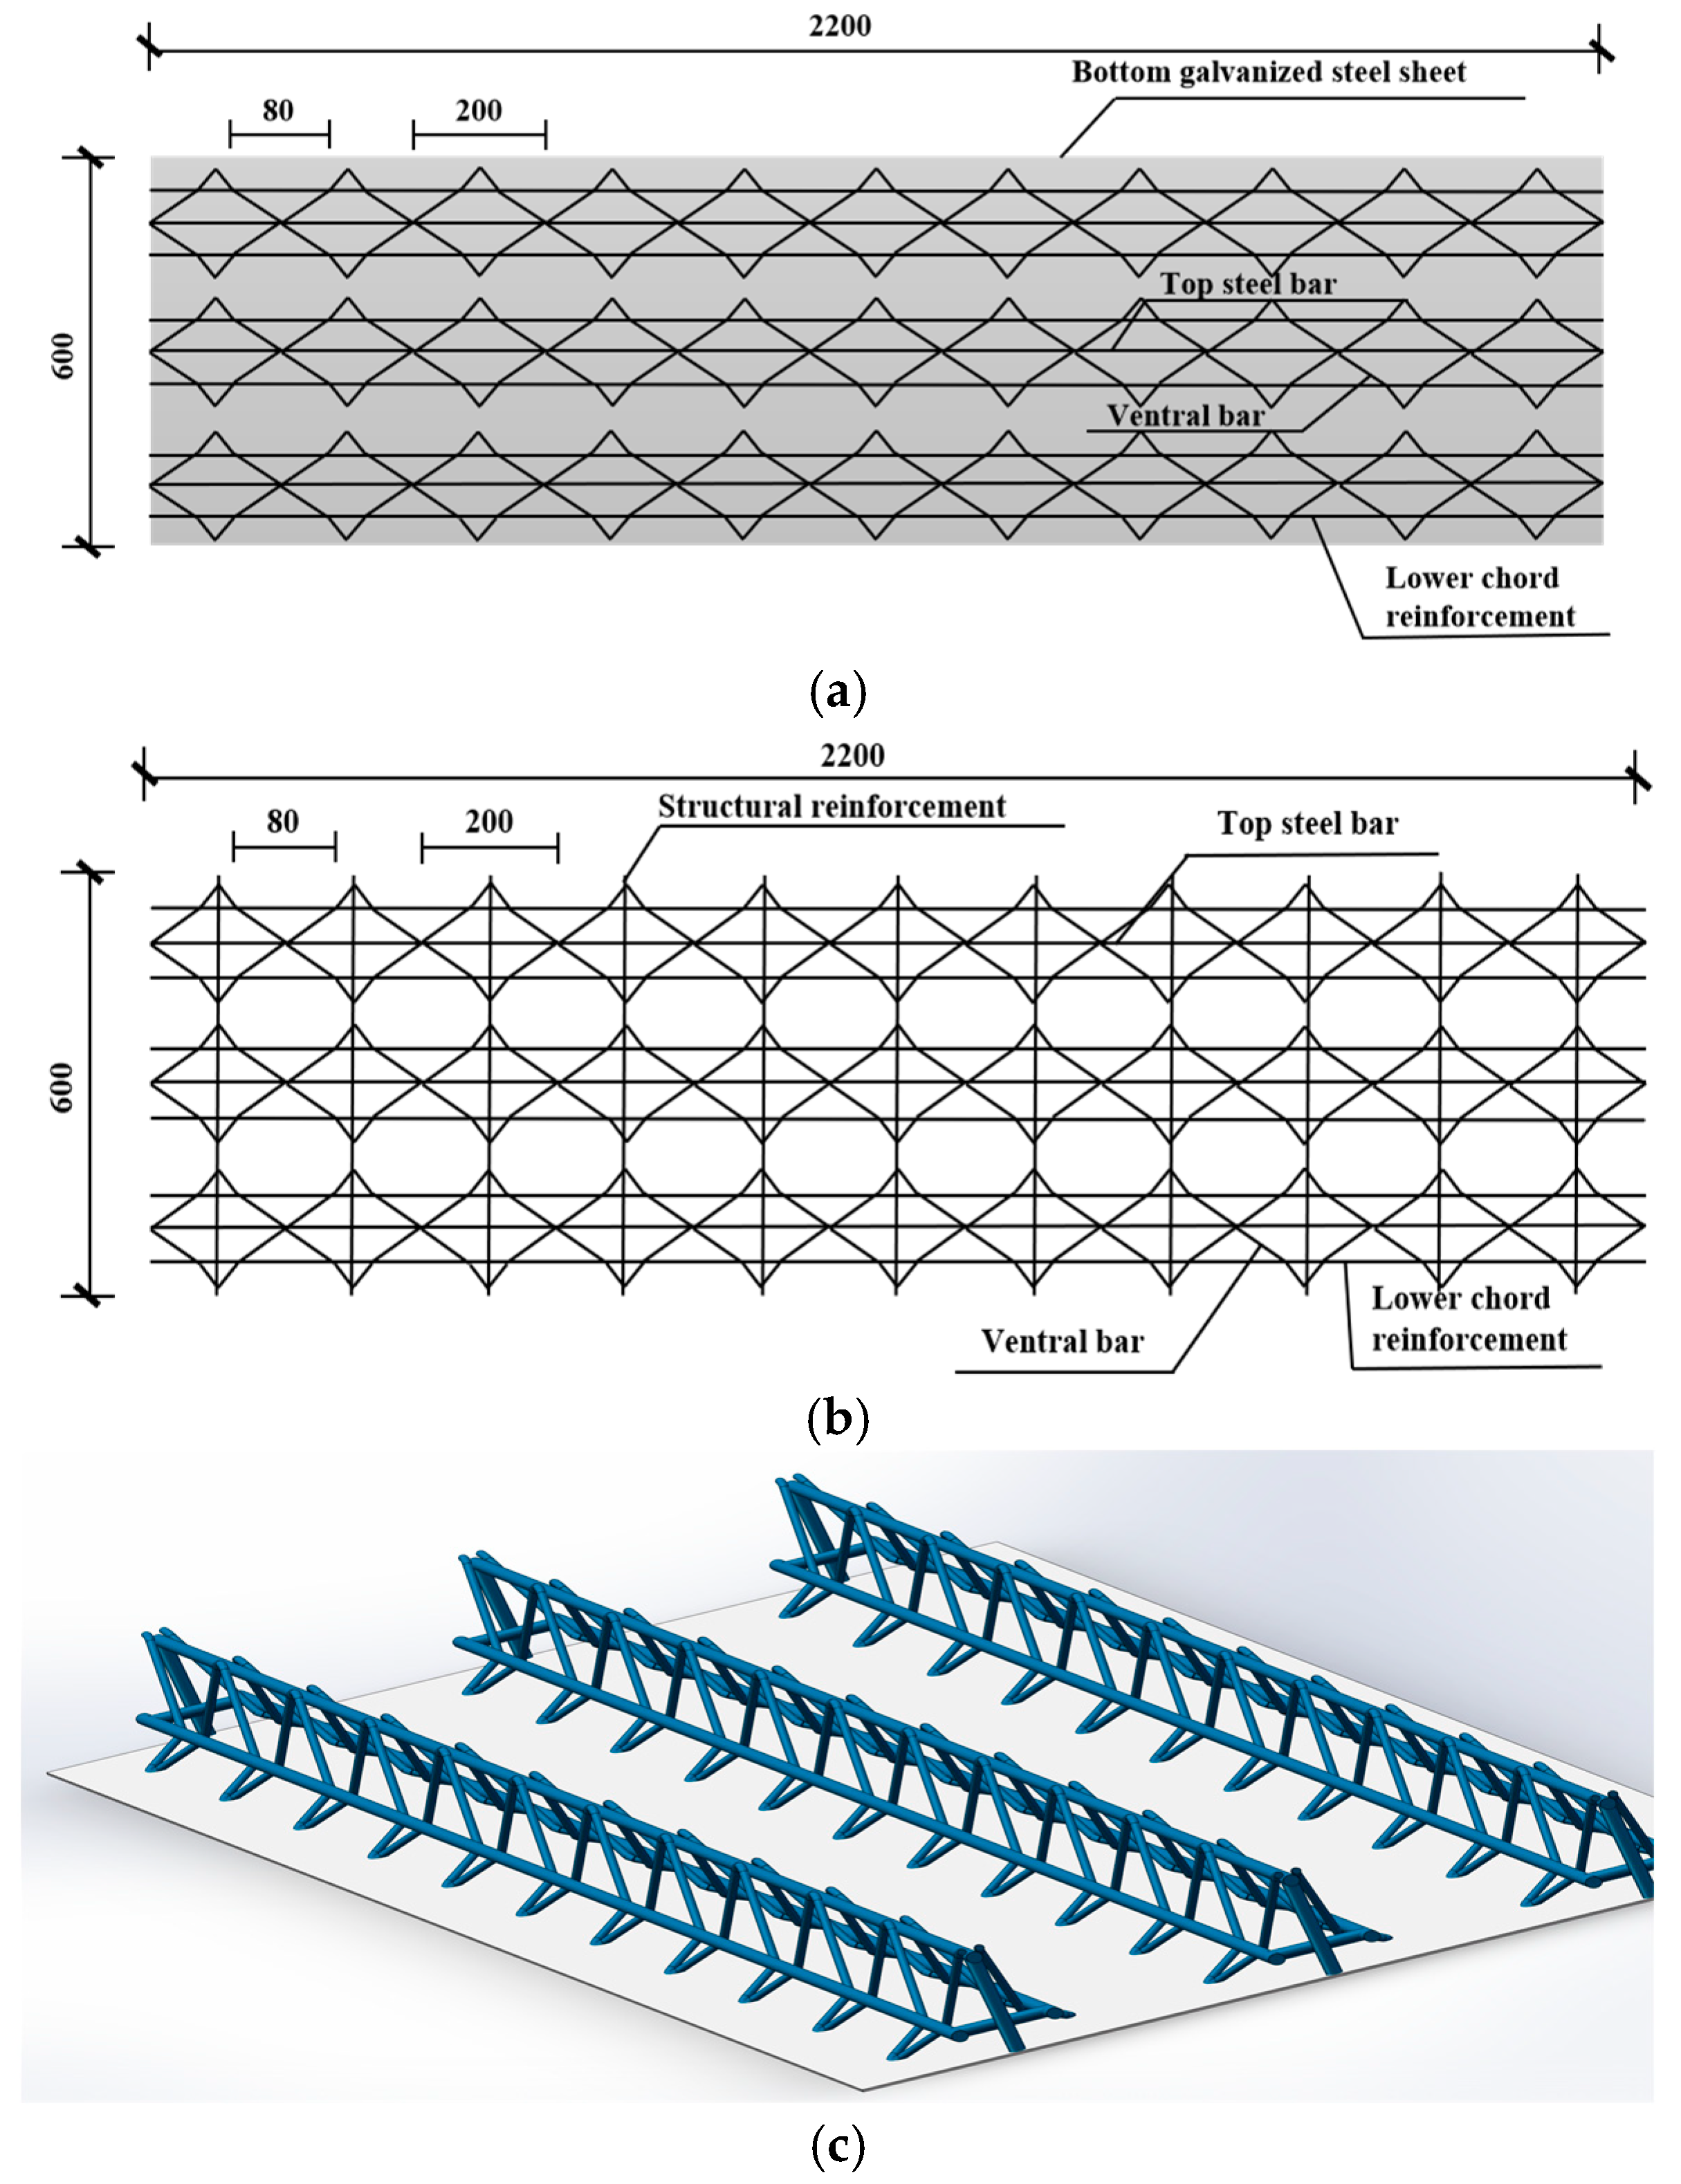
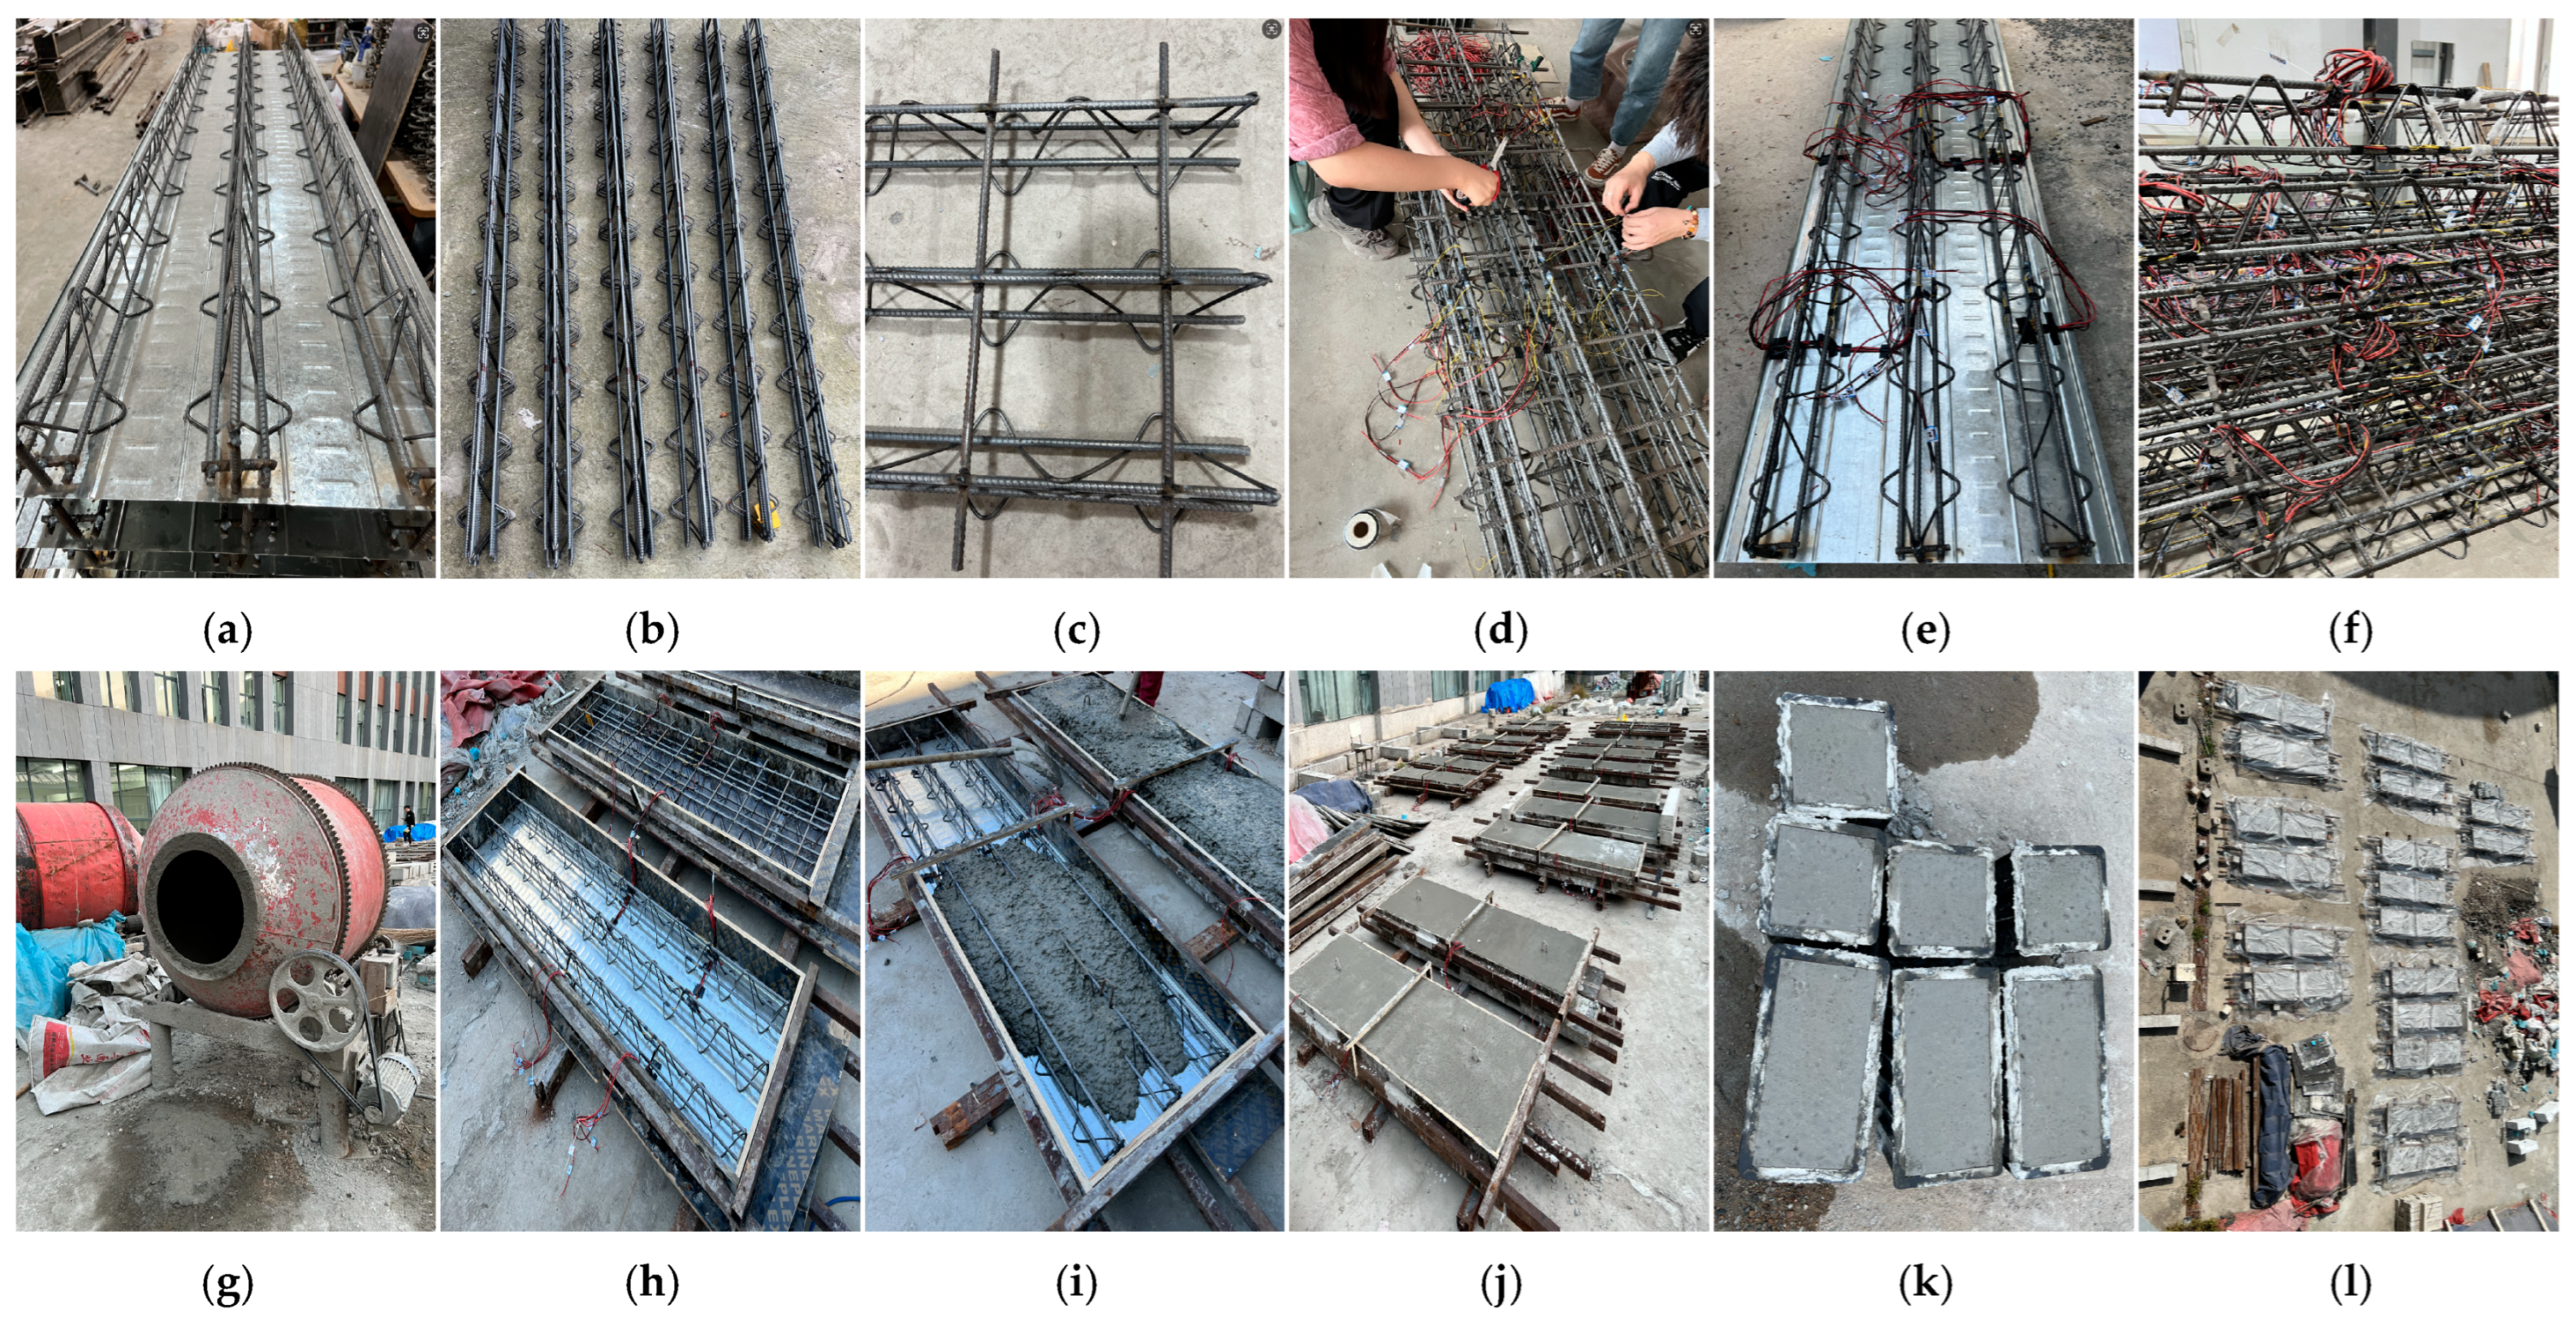
2.2. Test Piece Design and Fabrication

Five specimens were fabricated with PG dosages of 2% (n = 4) and 0% (n = 1), establishing an experimental matrix with parametric variables: impact cycles, bottom steel plate reinforcement status, slab thickness, and PG content. The concrete cover thickness was maintained at 15 mm throughout all specimens. Grade Q235 galvanized steel plates (5 mm thickness) were connected via resistance spot welding to truss reinforcements. All steel reinforcements were fabricated using Grade HRB400 ribbed bars. Prior to casting, structural reinforcement welding and lifting hook fabrication were performed on bottom plate-free reinforcement trusses. Post-welding procedures included strain gauge installation (comprising sensor bonding, extension wire connection, and identification labeling) on reinforcement members. The concrete was proportioned according to Mix Design Table 1 and mixed using drum-type concrete mixer. During placement, internal vibrators ensured proper compaction, followed by surface finishing using troweling techniques after initial setting. Post-final-set curing commenced with polyethylene membrane coverage for moisture retention, followed by 28-day wet curing regime with daily water spraying under controlled environmental conditions. Companion specimens were cast and cured under identical conditions for subsequent determination of cubic compressive strength and axial compressive strength per GB/T 5081-2019 [22] standards. The manufacturing protocol encompassed critical phases: (a) fabrication of reinforcement trusses with differential configurations (baseplate equipped vs. baseplate free as illustrated in Figure 3a,b), (b) formwork system design and construction, (c) concrete placement methodology, and (d) curing process control. As shown in Figure 3 and Figure 4, the PGC slabs’ dimensional configuration and reinforcement layout were precisely controlled, with detailed design parameters documented in Table 3.

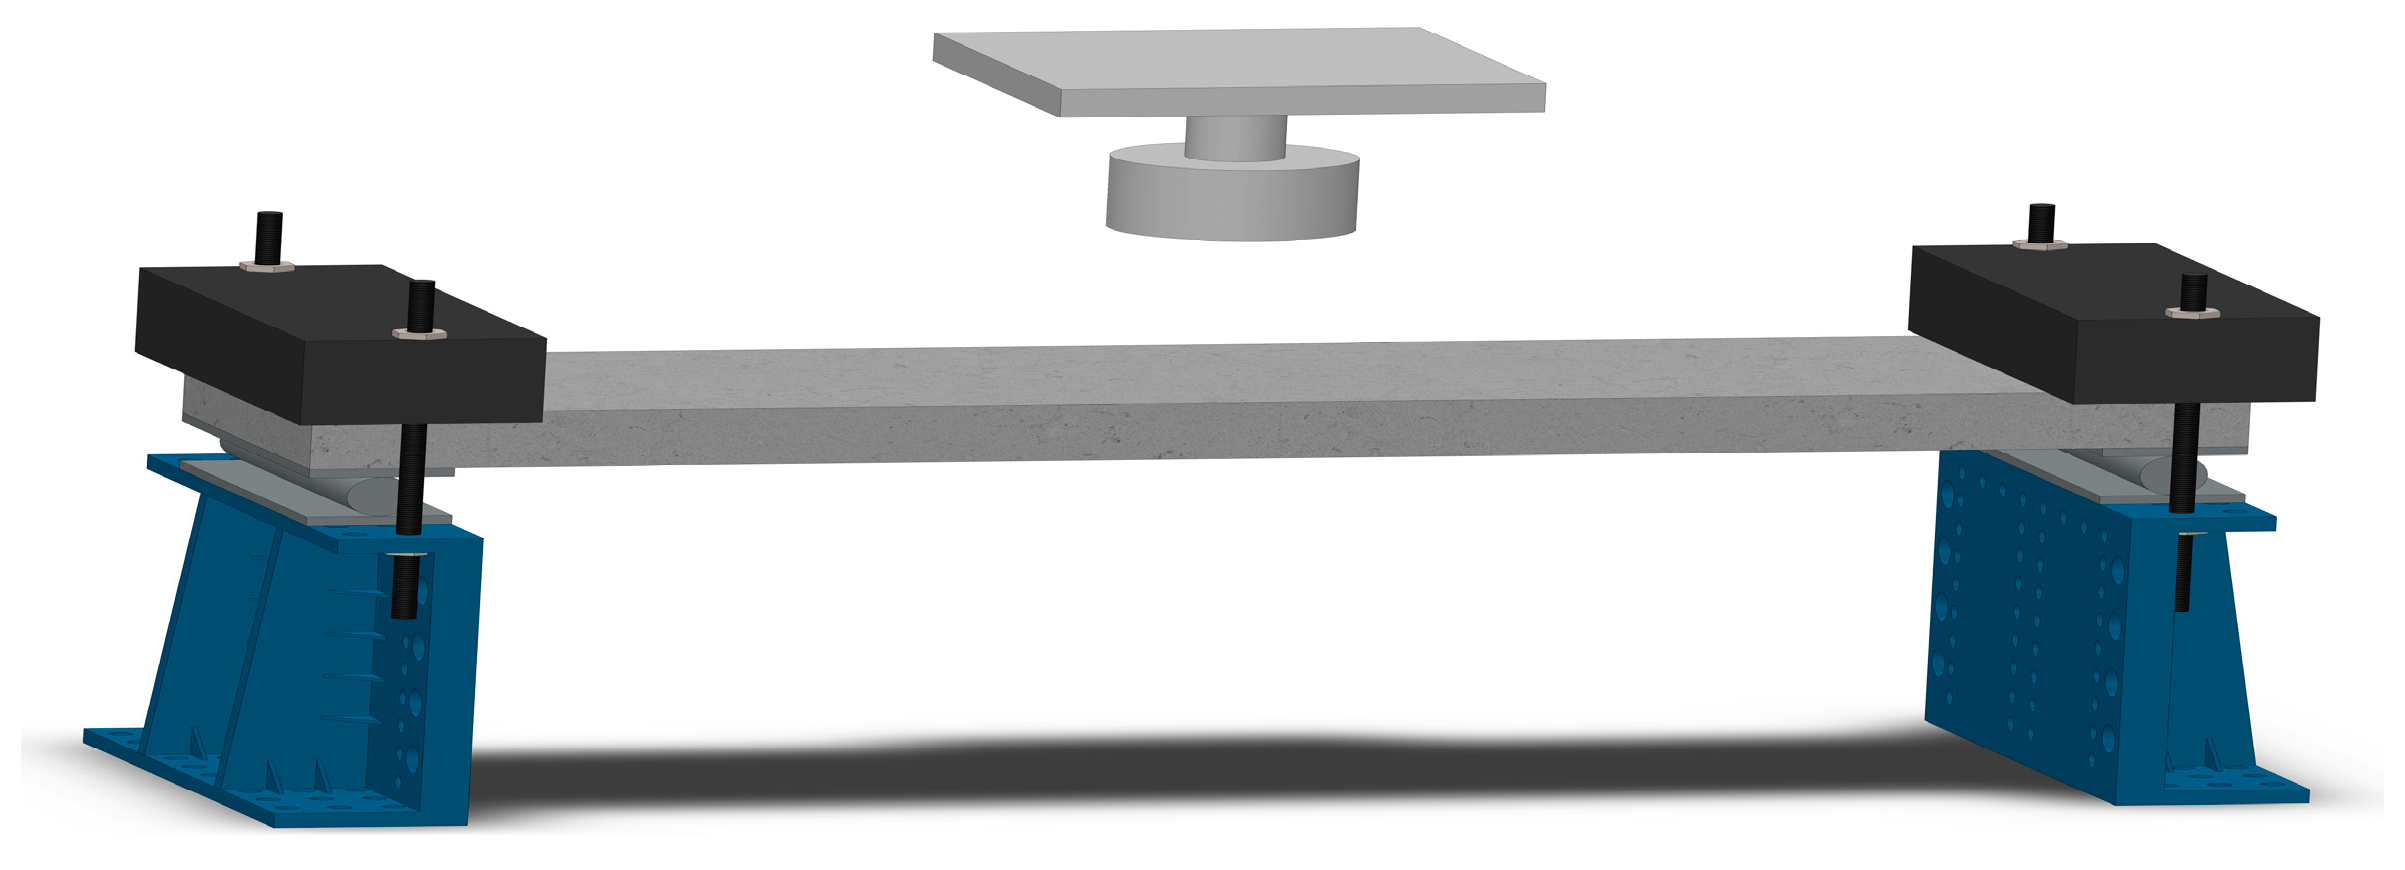
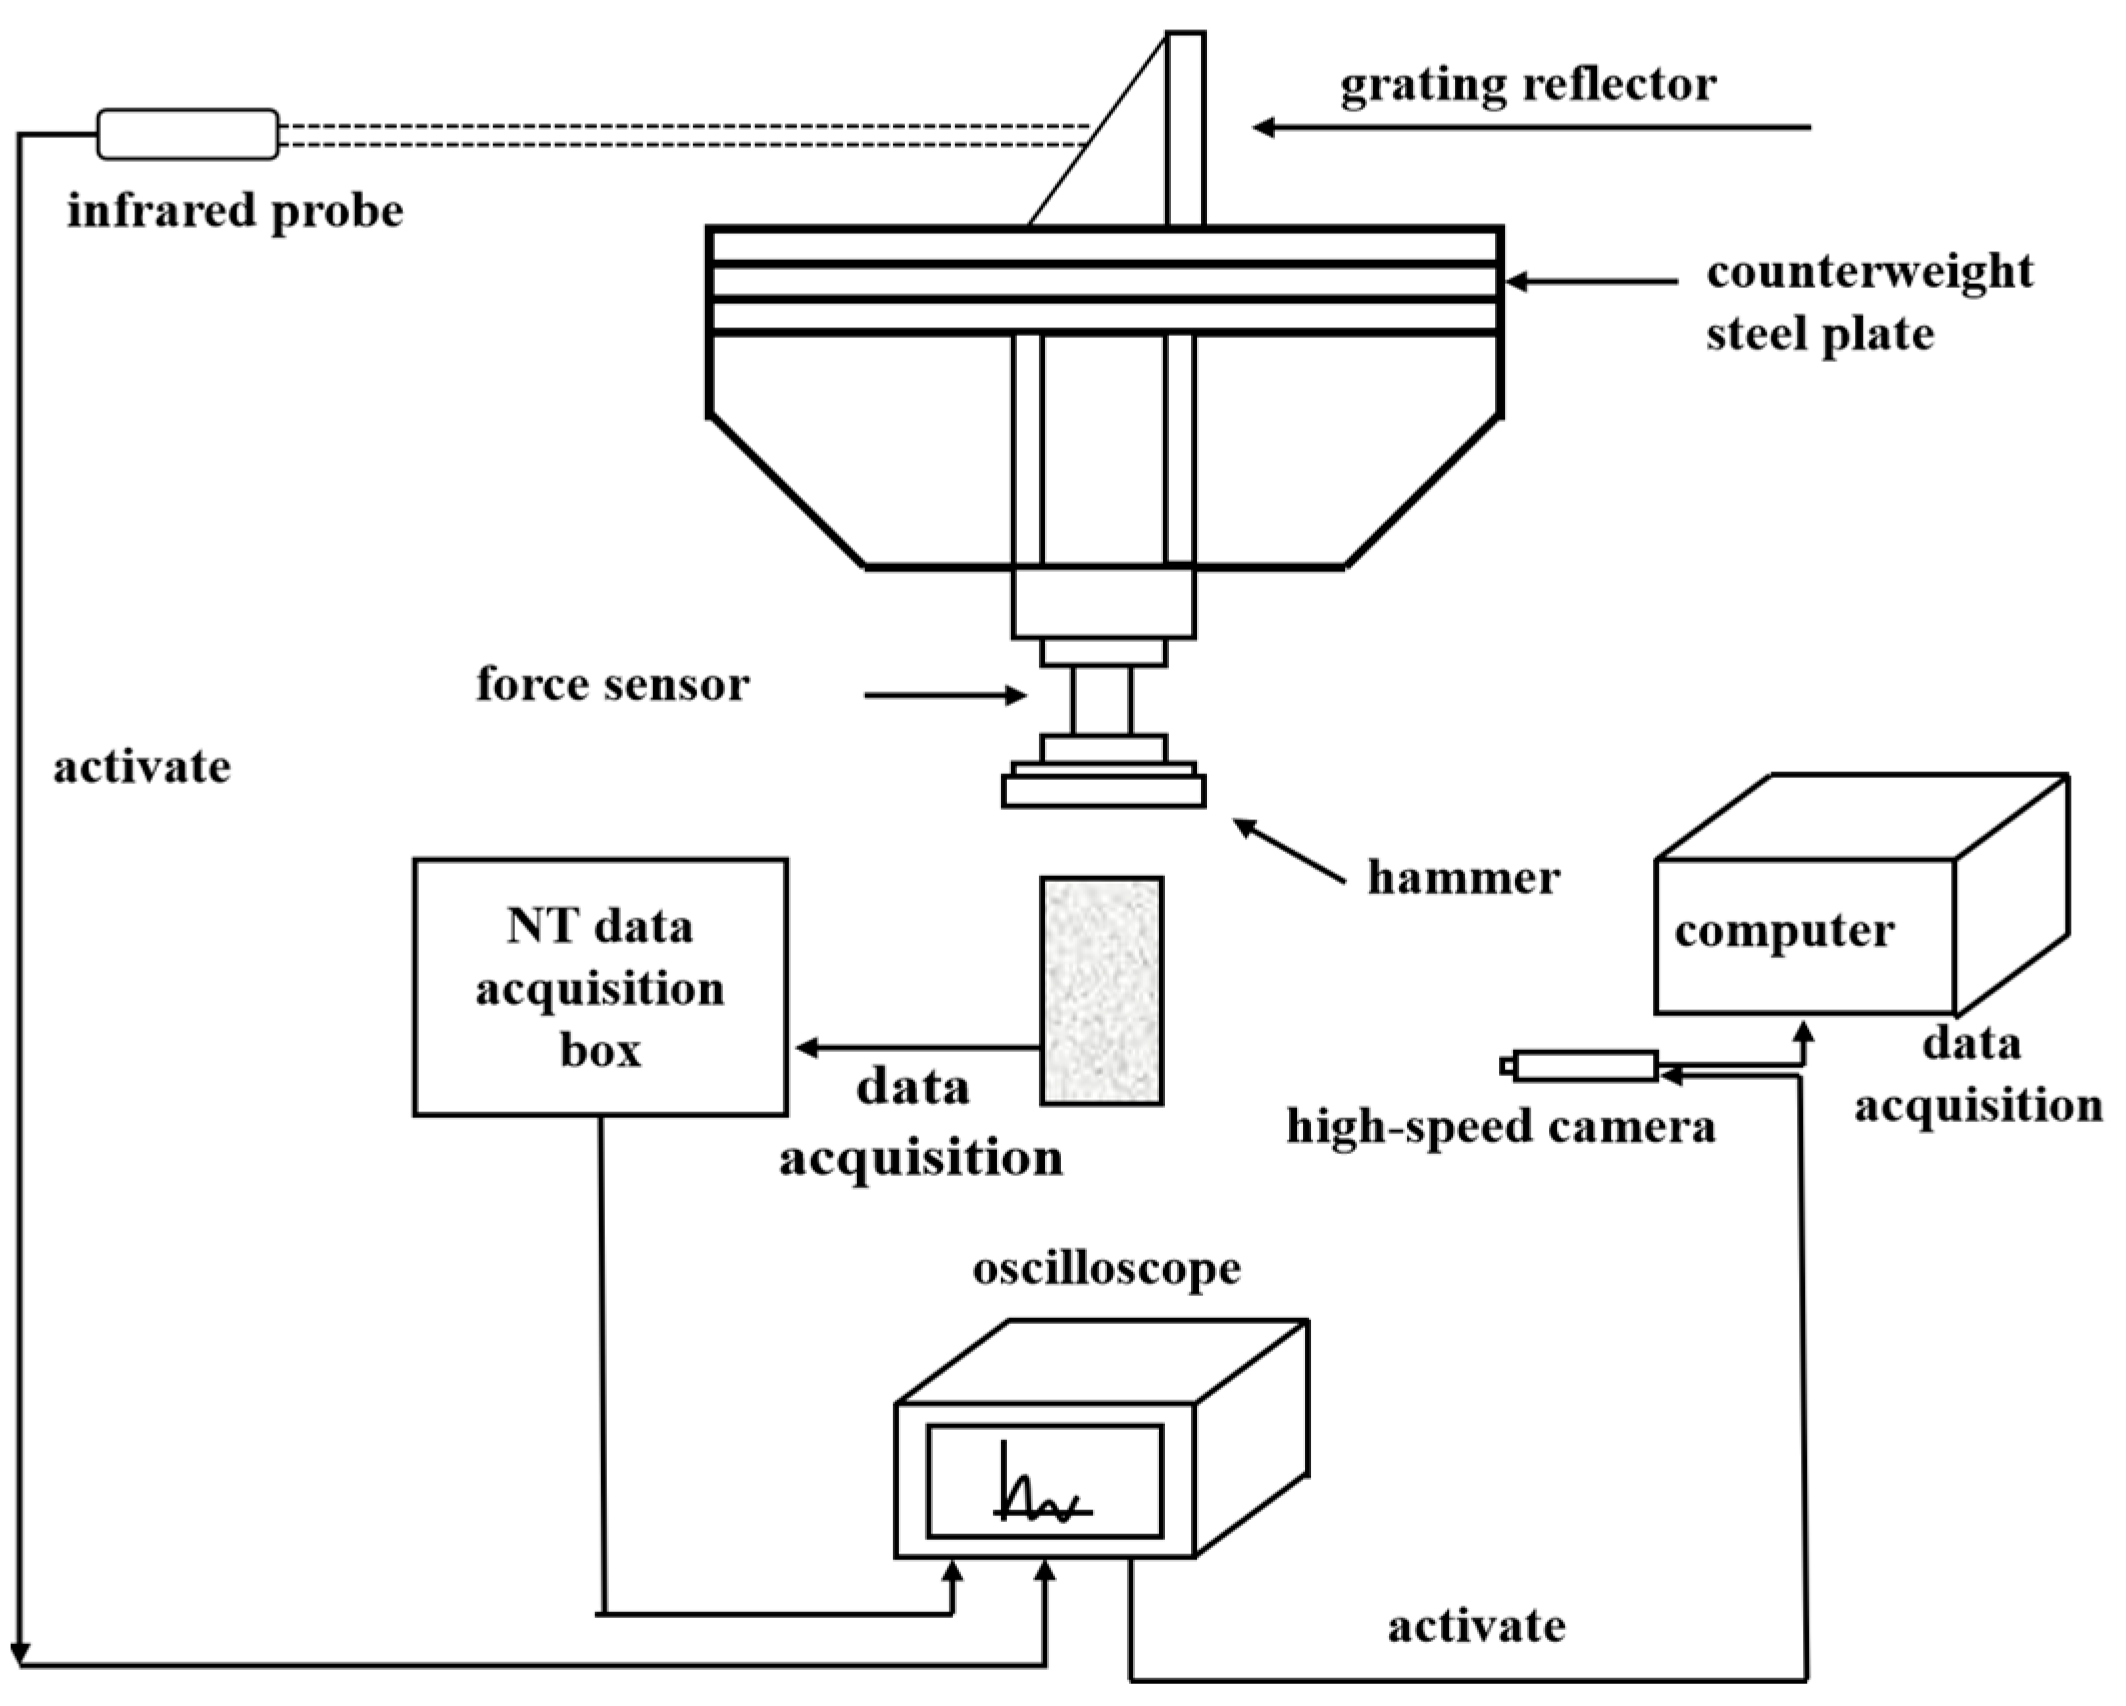
2.3. Loading Program Design

Specimen fixation strictly complied with GB 50010-2010 [23] rovisions, utilizing a servo-hydraulic clamping system to achieve rigid constraint on the MTS 810 test frame. Impact energy calibration followed the equation E = mgh, where m = 239 kg (certified mass), g = 9.81 m/s2, and hranged 0.5–3.0 m. An electromagnetic release mechanism enabled precise height adjustment of the standard drop hammer, with free-fall trajectory maintained within ±2° verticality tolerance. The crack propagation pattern, dynamic impact force (PCB piezoelectric sensor), and mid-span displacement (LVDT linear displacement transducer, accuracy ±0.01 mm) were recorded. Impact testing was conducted using a servo-controlled drop-weight apparatus featuring a guided free-fall mechanism, mass-adjustable striker, and counterweight system. The testing protocol comprised three key phases: (1) specimen fixation through sliding hinge bearings and reaction frame constraints at both supports, (2) controlled elevation of the striker assembly to predetermined heights, and (3) gravity-driven impact centric to the specimen’s geometric centroid. The impact energy parameters are tabulated in Table 4, while Figure 5 schematically illustrates the integrated test setup with instrumentation configuration.

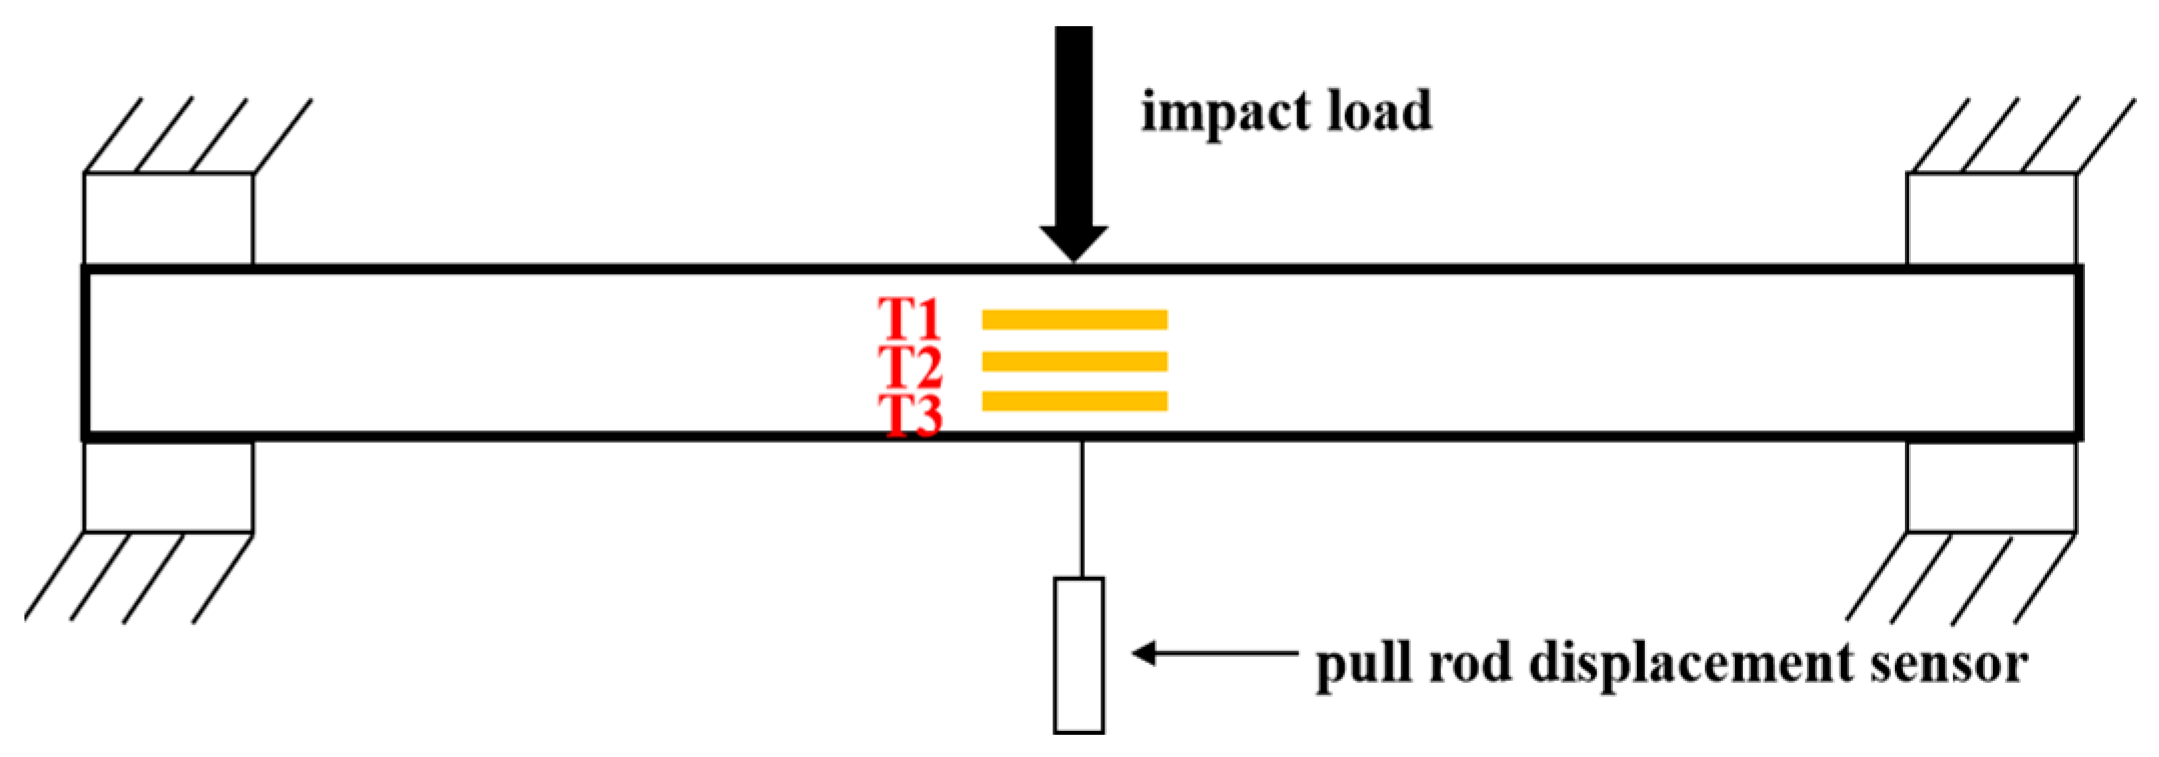
2.4. Design of the Experimental Observation Program

The experimental setup employed an NI SignalExpress 2014 data acquisition system (1 MHz sampling rate) capable of synchronous acquisition for triaxial measurements including voltage, strain, and acceleration signals. A laser retroreflective triggering mechanism with vertically adjustable infrared probes ensured measurement precision through optical alignment validation prior to data acquisition. Four full-bridge strain gauge rosettes mounted on the striker tip captured impact forces, with amplified signals through conditioning amplifiers being simultaneously recorded via digital oscilloscopy. Strain gauges affixed to lateral surfaces monitored concrete strain distribution, while linear variable differential transformers (LVDTs) positioned at mid-span quantified displacement responses. Figure 6 provides schematic representation of the integrated data acquisition architecture, with Figure 7 detailing the instrumentation layout for strain and displacement monitoring points.

3. Test Results and Analysis

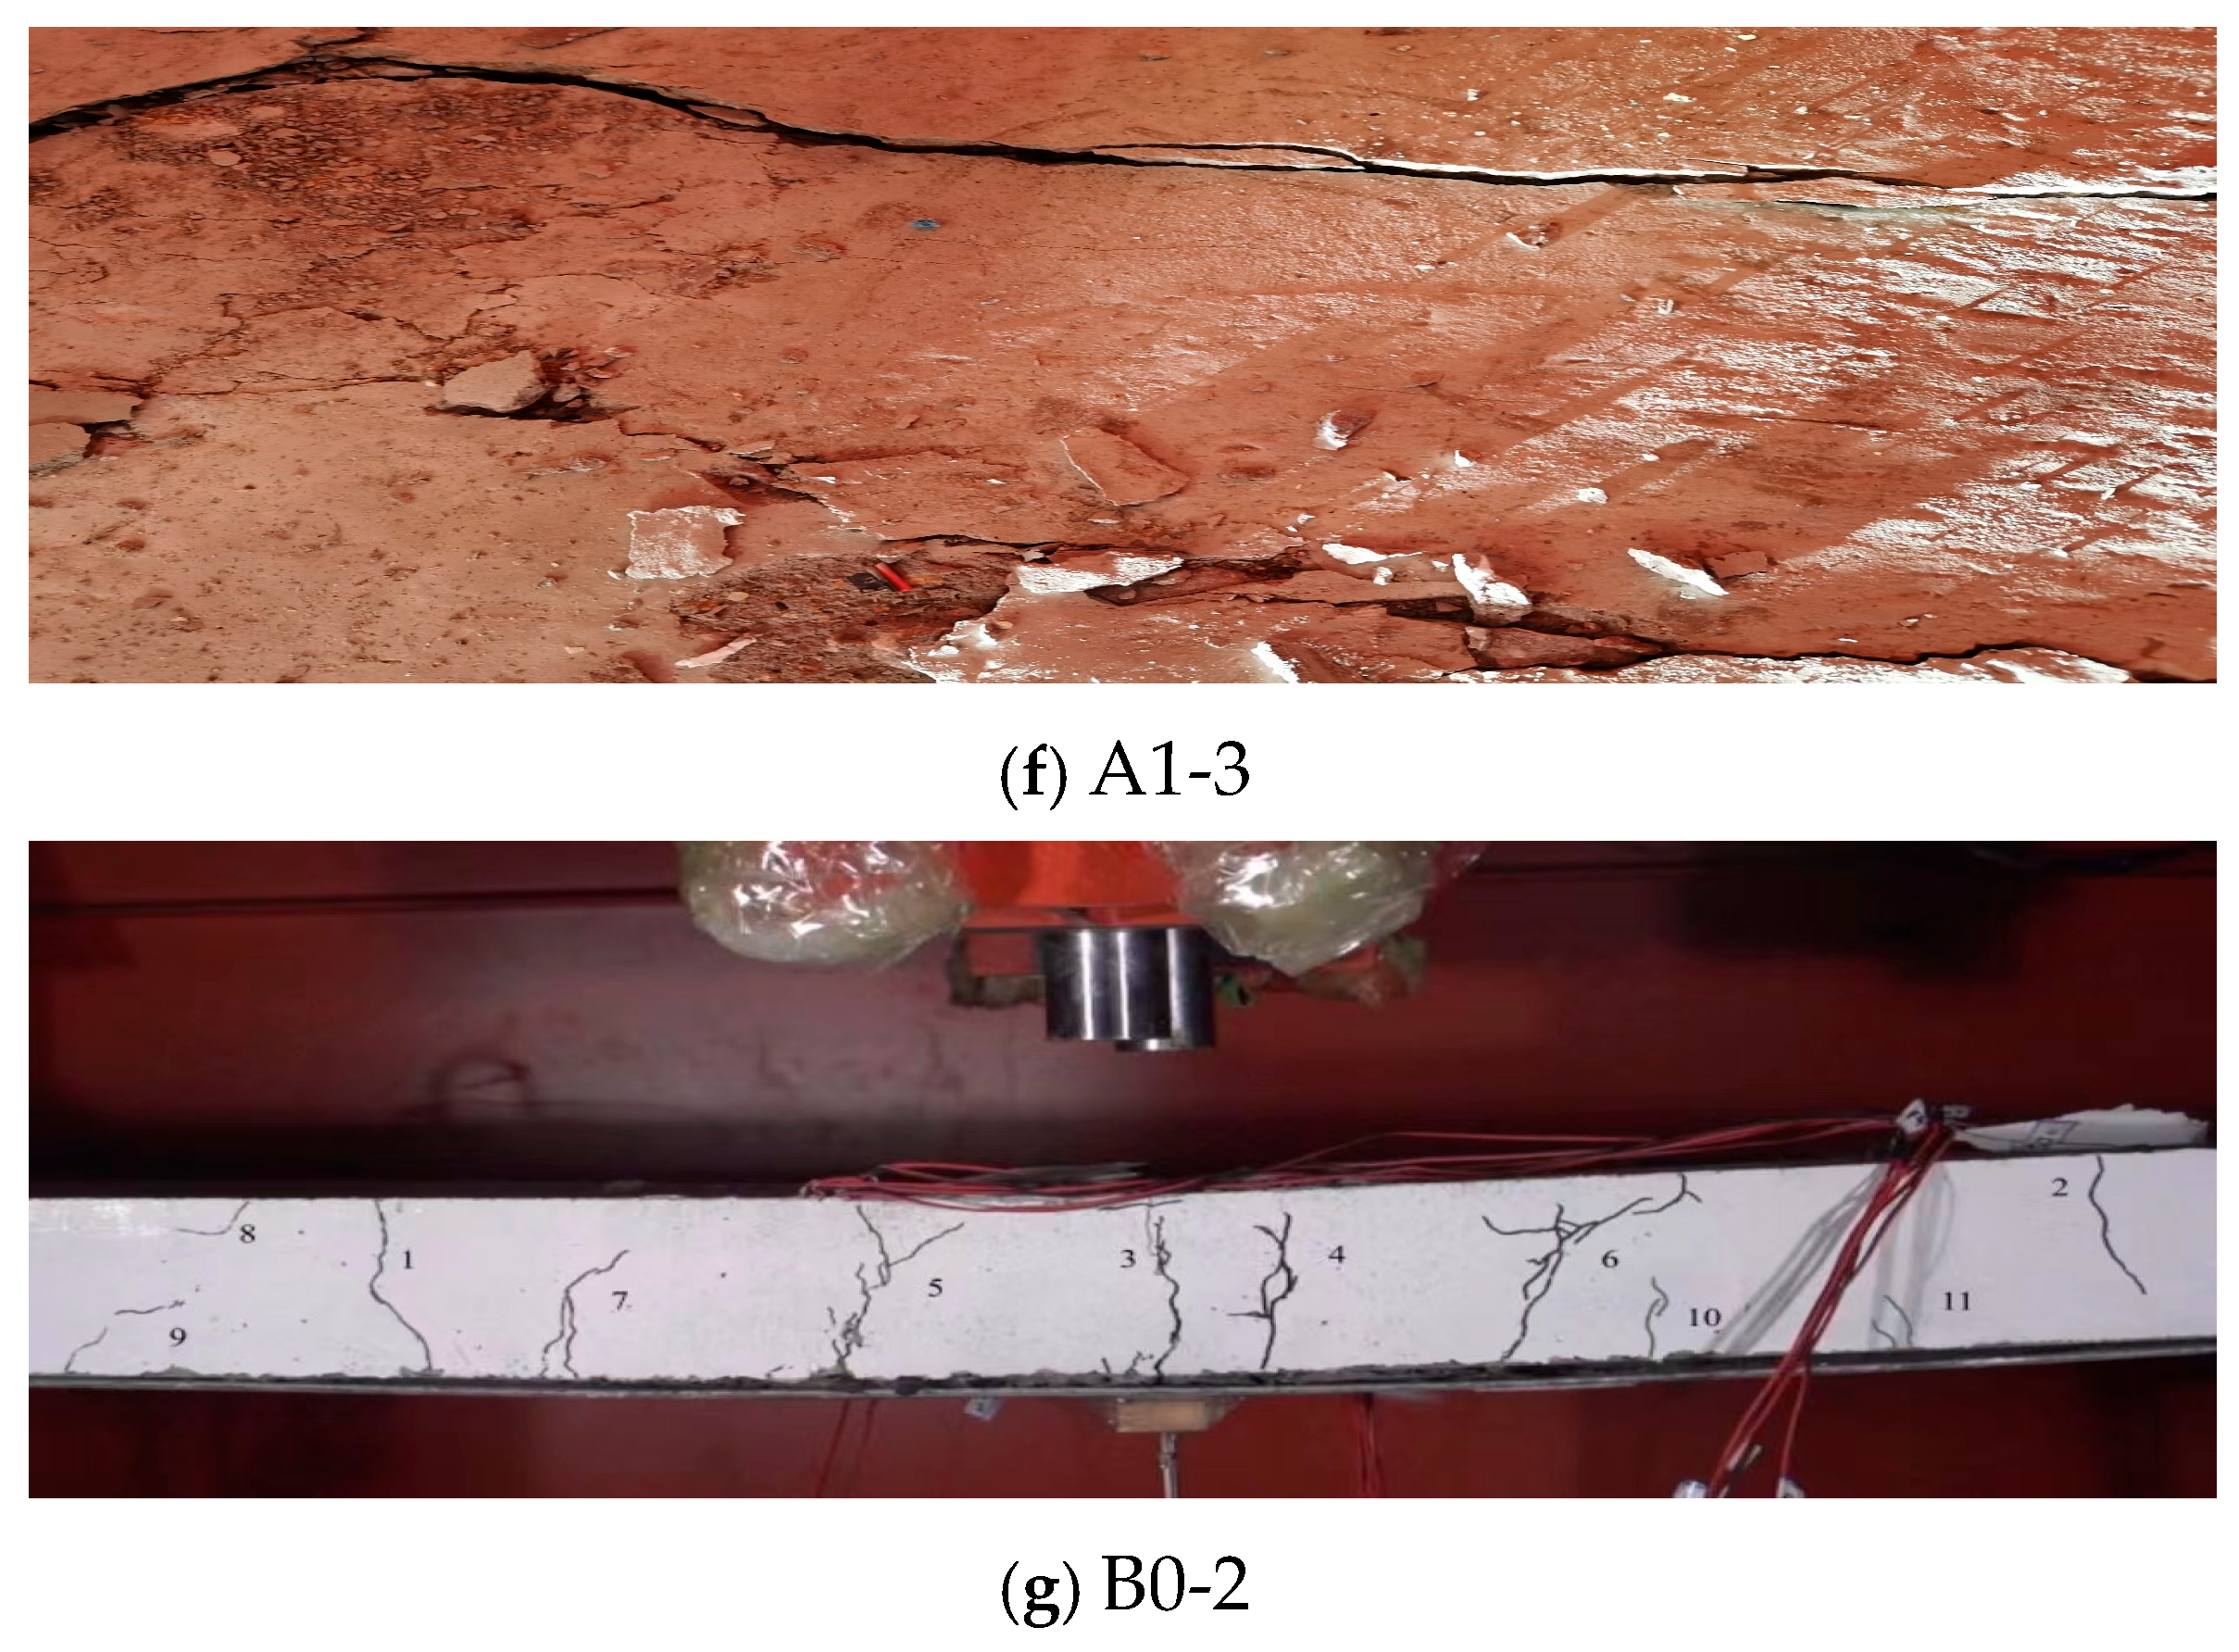
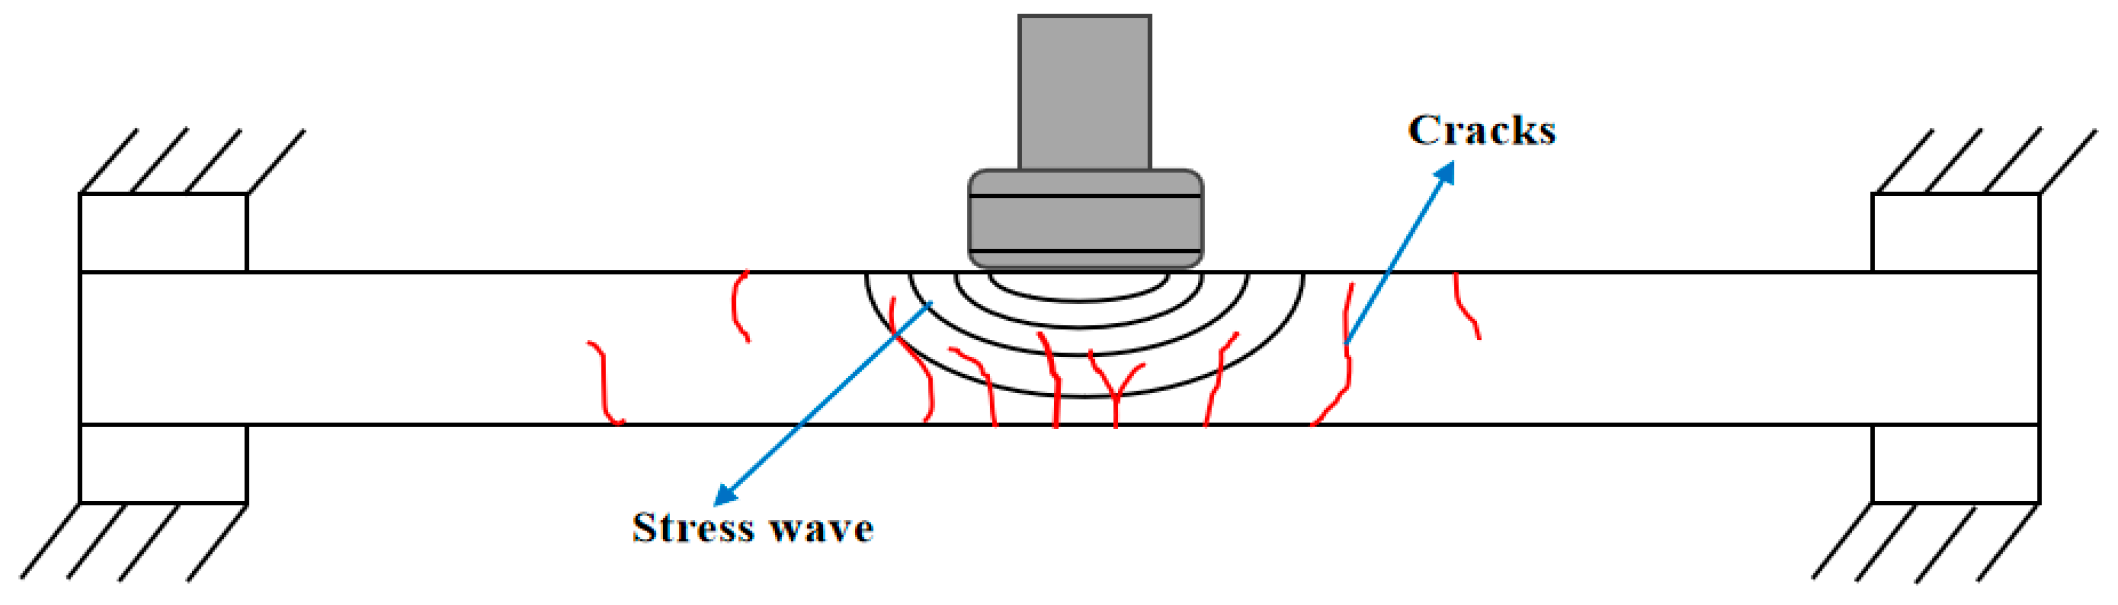
3.1. Failure Pattern of PGC Unidirectional Floor of Steel Truss

Figure 8 and Figure 9 delineate the progressive damage evolution across five specimens, where numerical suffixes (1, 2, 3) correspond to sequential impact cycles. The specimens exhibited combined shear-flexural failure modes with predominant bending damage, a phenomenon attributed to stress wave propagation and reflection through the thickness dimension. As illustrated in Figure 8, the stress wave dispersion patterns adopted quasi-spherical or wedged configurations during energy transmission.
All specimens manifested radial and longitudinal cracking patterns on upper concrete surfaces, consistent with failure modes reported in prior studies [31]. This fracture configuration primarily originates from transverse splitting stresses developing perpendicular to the principal tensile strain direction. The concrete slab exhibits a typical flexural failure mode under vertical impact loading. During the initial phase, radial primary cracks develop from the impact point towards the support boundaries, with their distribution pattern aligning with the principal characteristics of yield line theory. As cumulative impact effects intensify, crack initiation demonstrates pronounced localized characteristics, concentrated in geometric discontinuity regions. Ultimately, a multi-tiered annular through-crack system centered at the impact point forms, resulting in complete loss of structural load-bearing capacity.
During the first impact cycle on specimen A1-1, two flexural cracks (F2, F4) and two shear cracks (S2, S4) initiated at mid-span within 5 ms. Subsequent microcrack propagation (C5–C9) occurred between 5 and 11 ms, accompanied by transverse penetration and widening of primary cracks (C1–C4) through the slab cross-section. The second impact induced shear crack formation (S10, S11) at 3 ms, followed by compressive zone propagation and width expansion of mid-span cracks (C1–C4) from 3 to 10 ms. Concurrent concrete crushing developed at the impact zone on the slab’s upper surface. The third impact cycle precipitated peak mid-span displacement with three concurrent damage mechanisms: (a) progressive widening of lateral cracks, (b) nucleation of secondary microcracks, and (c) concrete spalling at the impact zone accompanied by interfacial delamination between the concrete slab and steel baseplate.
Comparative analysis of specimens A1-2, A1-3, A2-2, and B0-2 revealed distinct failure patterns. Specimen A1-2 exhibited minimal cracking with localized flexural fractures along impact zone flanks and minor concrete spalling at the upper surface. The absence of steel plate reinforcement in specimen A1-3 resulted in reduced flexural rigidity, manifesting severe compressive failure and matrix disintegration at the impact surface. Specimen A2-2 demonstrated the most pronounced damage progression, characterized by extensive crack networks and bilateral spalling patterns. The planar fracture surfaces exhibited typical brittle failure morphology of cementitious composites. Specimen B0-2 displayed mid-span concentrated cracking with through-thickness propagation from tensile to compressive zones, accompanied by ancillary flexural cracks near support regions. Specimen A1-2 exhibited superior damage resistance relative to counterparts, as quantified by 62% lower crack density and 45% reduced spalling area. This enhanced performance is attributed to three synergistic mechanisms: (a) increased slab thickness improving global stiffness (EI increased 38%), (b) steel plate reinforcement at the base constraining crack propagation (stress intensity factor reduced 27%), and (c) composite action enhancing energy dissipation capacity (hysteretic loops expanded 22%). Mechanistically, PG’s pozzolanic reactivity via ettringite crystallization enhanced interparticle bonding through (i) increased van der Waals forces, (ii) optimized pore structure, and (iii) improved frictional interlock.

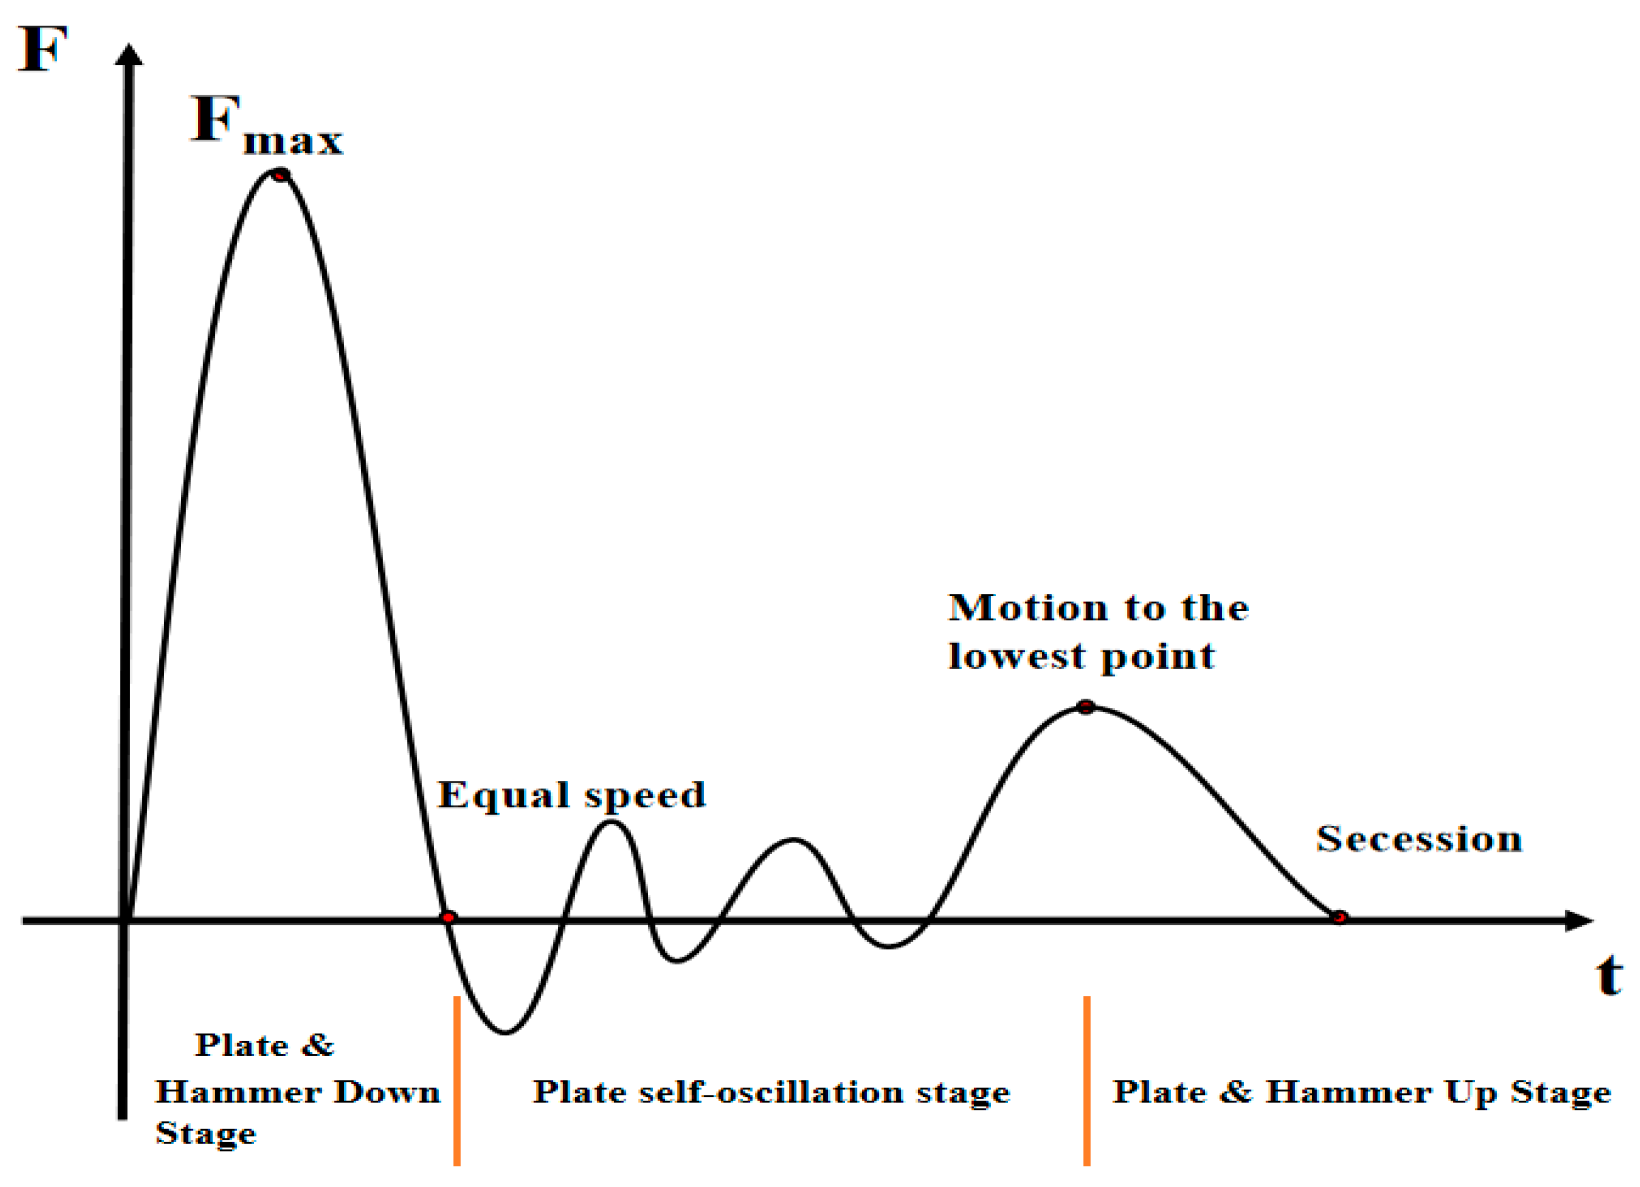
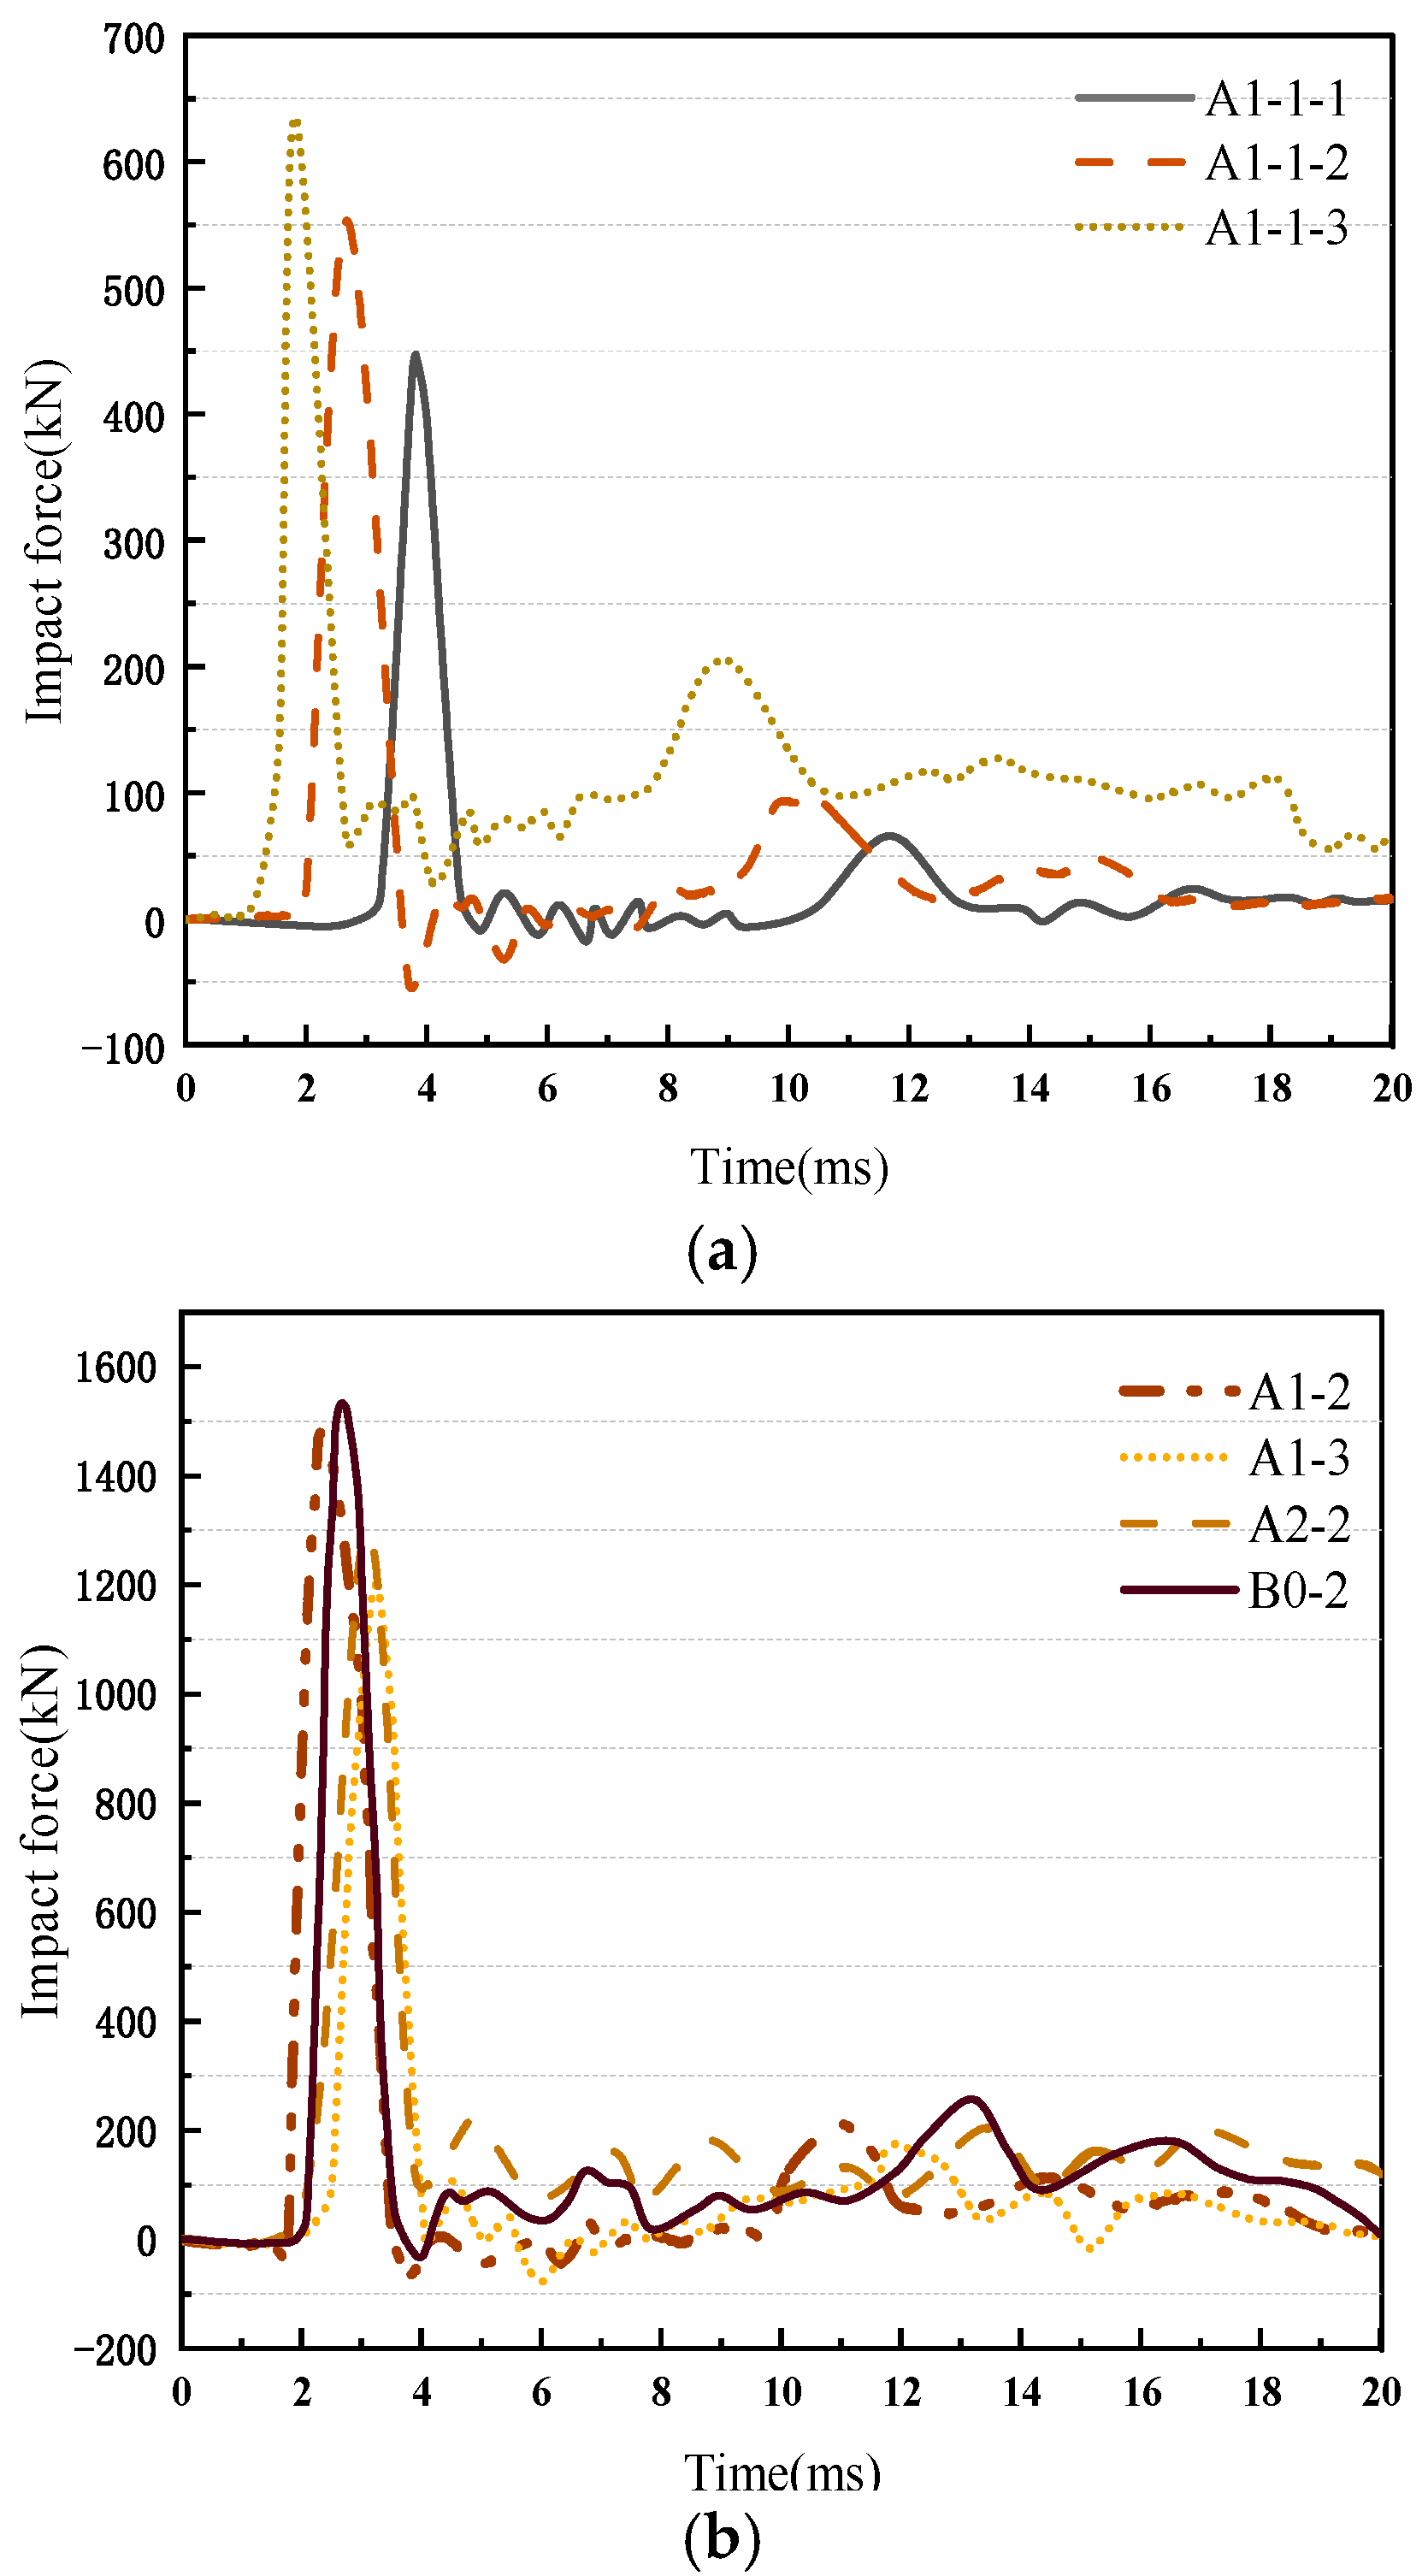
3.2. Impact Force Time Course Curve

As delineated in Figure 10, the impact force time-history response of PGC slabs exhibits three distinct phases: (1) initial compressive interaction phase, (2) free vibration regime, and (3) tensile rebound phase with structural separation.
Upon initial contact between slab and hammer, instantaneous force escalation to peak magnitude occurred, accompanied by accelerated downward deformation. This co-movement phase terminated upon velocity synchronization (Δv = 0 m/s) with consequent contact force nullification. Brittle slabs demonstrated shortened co-movement duration (4 ms in this study, 10 ms in Refs. [32,33,34,35]), indicating enhanced impact energy transmission efficiency. Subsequent force decay to baseline initiated the free vibration phase, characterized by damped oscillation around null-load equilibrium. This regime exhibited stationary acceleration profile and periodic force fluctuation (±ΔF) induced by structural resonance. The rebound phase commenced with velocity magnitude reduction, culminating in maximum downward displacement at zero relative velocity. Secondary force peaking preceded interfacial separation through elastic restitution, concluding the impact sequence. Extended energy absorption duration in this phase correlated with improved energy transfer capacity. Slabs with lower dissipation coefficients demonstrated prolonged absorption processes, achieving superior energy redistribution efficiency.
The peak impact force (Fpeak) exhibits direct proportionality to the contact zone’s effective stiffness (Keff), where enhanced specimen rigidity elevates local stress concentrations and consequently amplifies Fpeak magnitudes. As demonstrated in Figure 11, the time-history profiles of impact forces reveal specimen-specific Fpeak magnitudes occurring at 4.2 ± 0.3 ms post-impact, with waveform characteristics correlating strongly with stiffness parameters.
Table 5 summarizes characteristic impact force parameters for five specimens. It was observed that under identical impact velocity and PG dosage conditions, specimens with varying length-to-thickness ratios exhibited significant variations in impact resistance. Specifically, specimens B0-2 and A1-2 demonstrated peak impact forces of 1534 kN and 1476 kN, respectively, with A1-2 showing a 3.9% reduction compared to B0-2. Furthermore, the 174 kN differential between A1-2 (1476 kN) and A1-3 (1302 kN), and the 281 kN disparity between A2-2 (1195 kN) and A1-2 (1476 kN)—where the latter exceeded the former by 23.5%—were particularly noteworthy. The comparative analysis conclusively demonstrated that slab thickness augmentation exerts a more pronounced influence on peak impact force mitigation in steel-truss-reinforced phosphogypsum concrete (PGC) slabs than other geometric parameters.

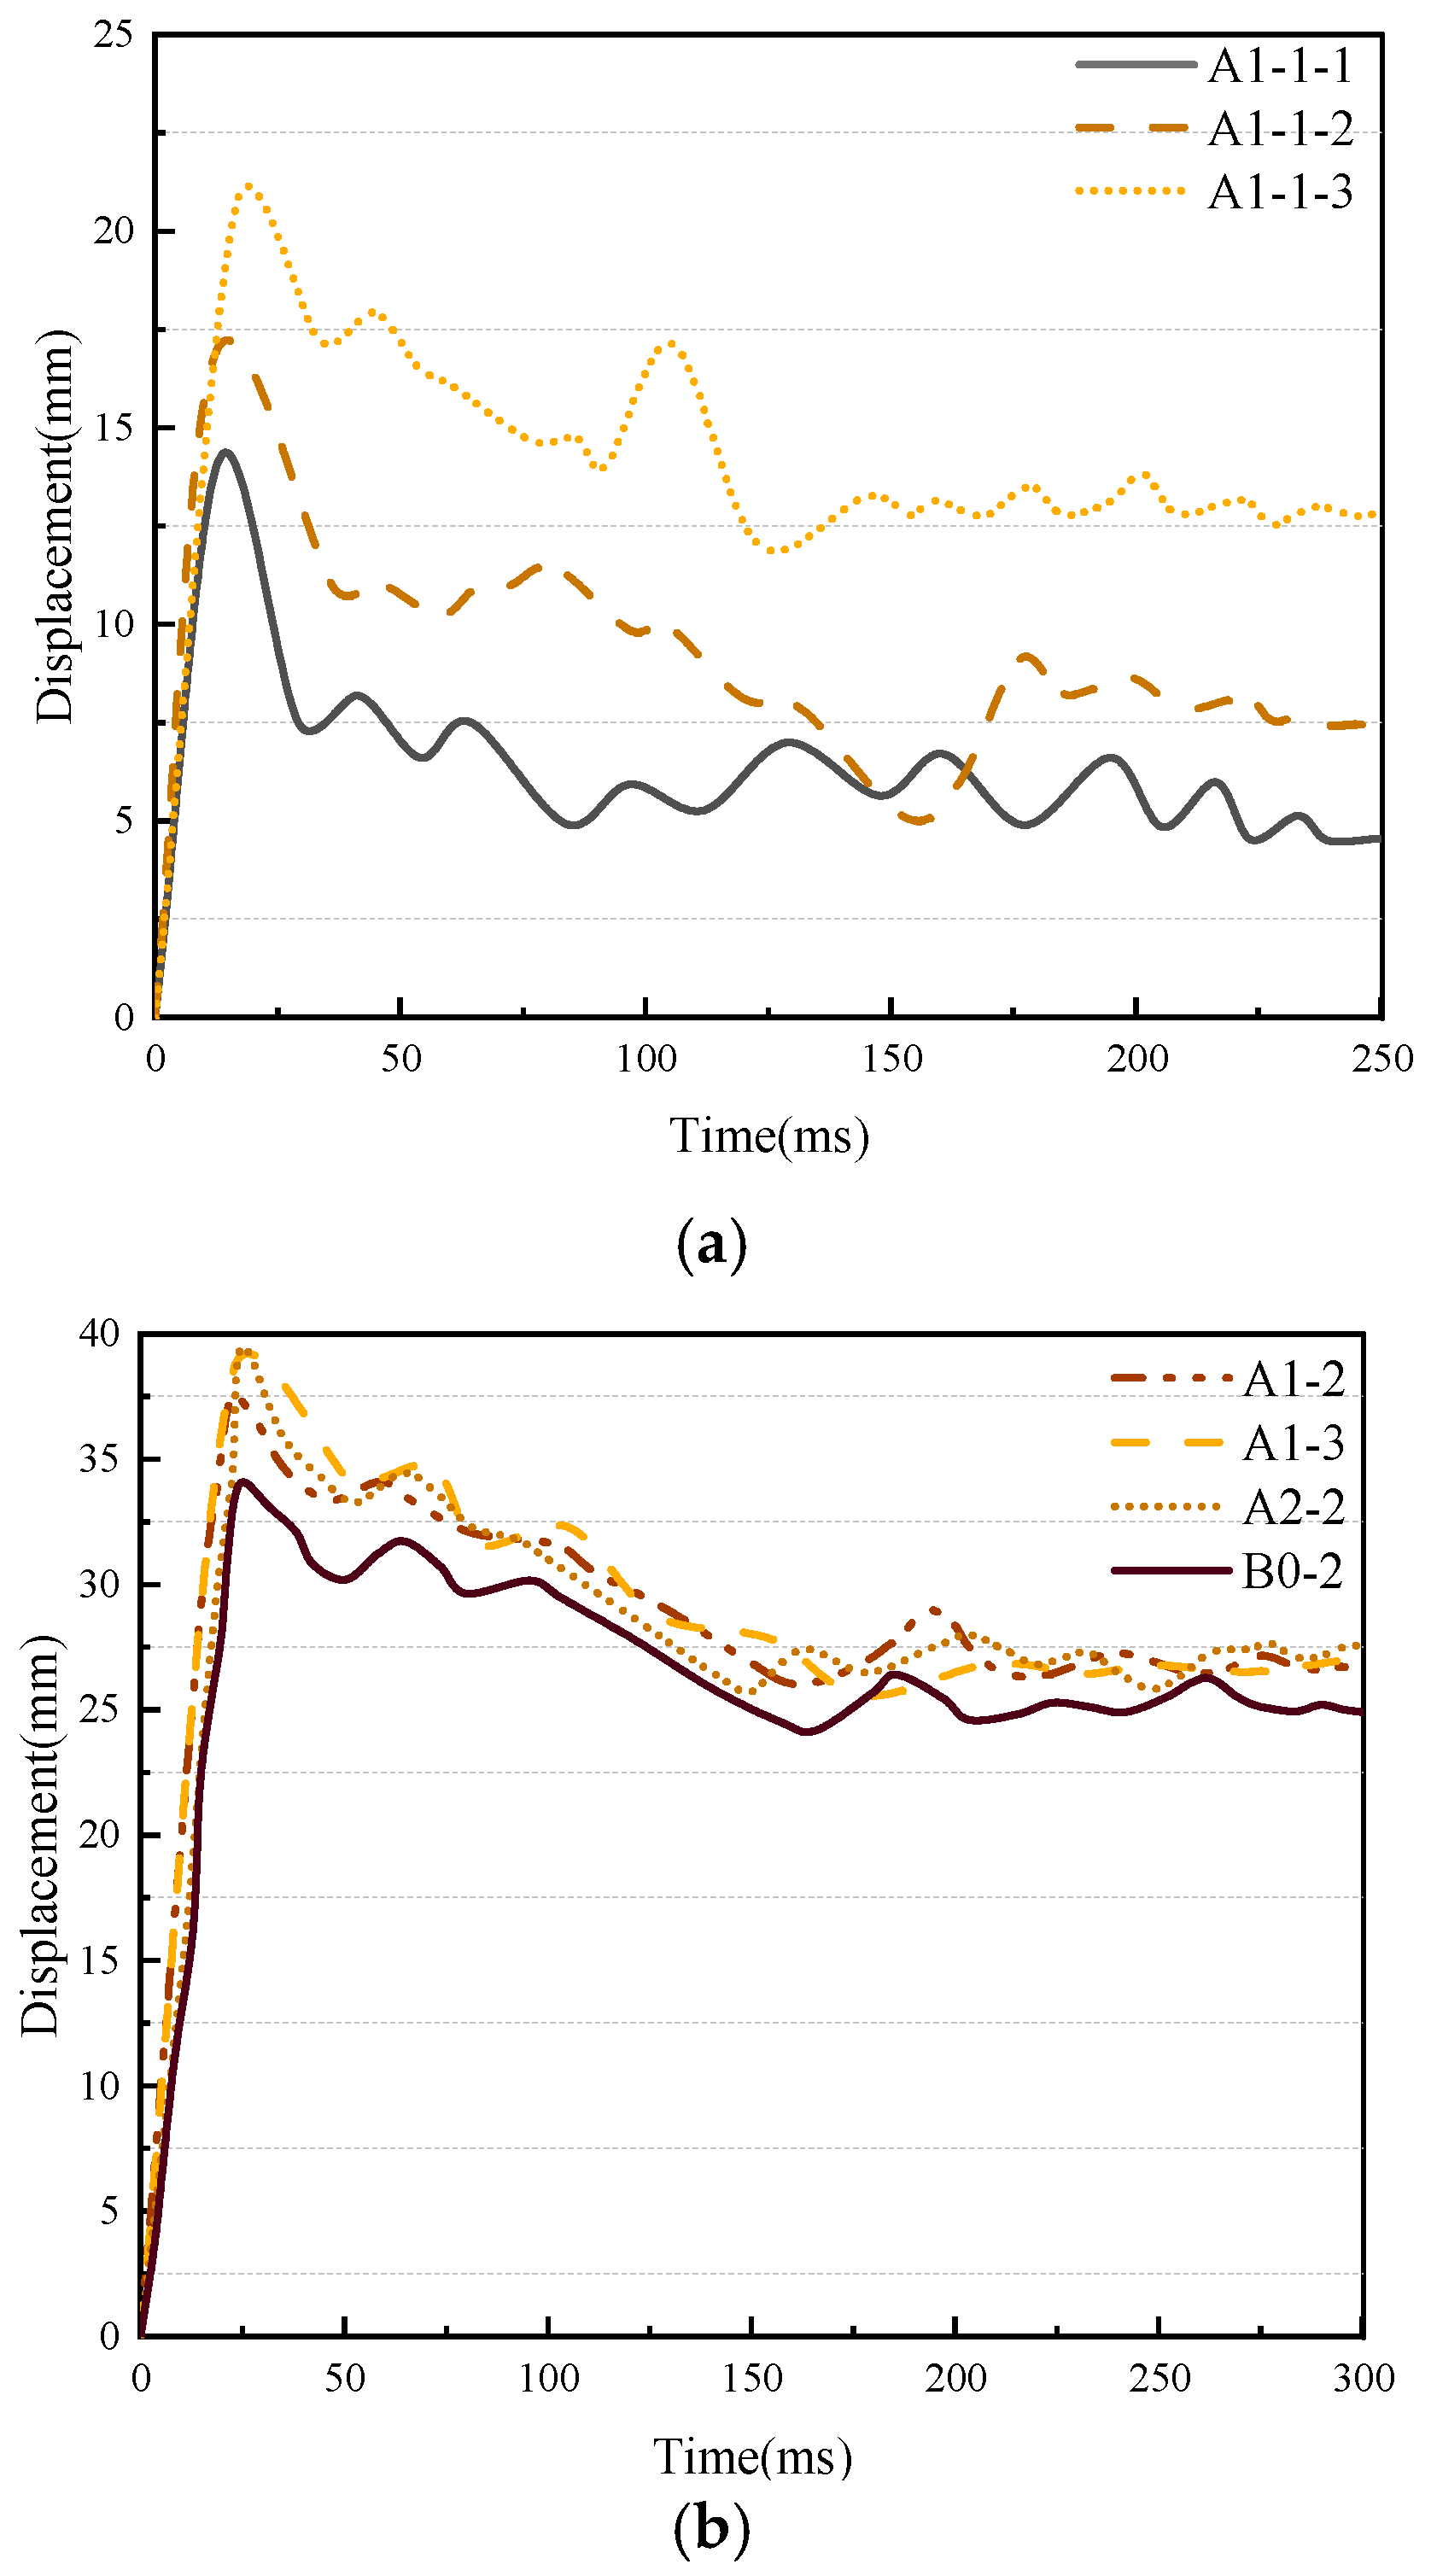
3.3. Displacement Time History Curve

The mid-span displacement time-history curves, along with maximum mid-span displacements and residual deformations of all steel-truss-reinforced phosphogypsum concrete (PGC) slabs are illustrated in Figure 12 and Figure 13, respectively, while the compressive stress–strain curves of concrete are depicted in Figure 14.

3.4. Analysis of Floor Residual Energy Absorption Capacity

Figure 12 demonstrates congruent displacement evolution patterns across five steel-truss-reinforced phosphogypsum concrete (PGC) slabs. Upon initial contact between the drop hammer and slab surface, flexural deformation was immediately initiated, with mid-span displacement rapidly escalating to peak magnitude. Notably, displacement peaks exhibited 12–15 ms temporal lag compared to impact force maxima, attributable to persistent displacement growth during post-impact inertial phase. Subsequent elastic restoration toward equilibrium position reduced displacement amplitudes until hammer–slab separation occurred, marked by the first waveform crest. Cyclic vibration for stress wave dissipation generated decaying sinusoidal oscillations, ultimately stabilizing at residual deformation levels.

4. Numerical Simulation

4.1. Basic Assumptions of Numerical Simulation

The drop hammer is modeled without mass ablation considerations. Impact dynamics are restricted to vertical displacement with rotational degrees of freedom explicitly constrained. Gravitational force constitutes the sole external load acting on the impactor, with aerodynamic drag effects excluded from the governing equations.

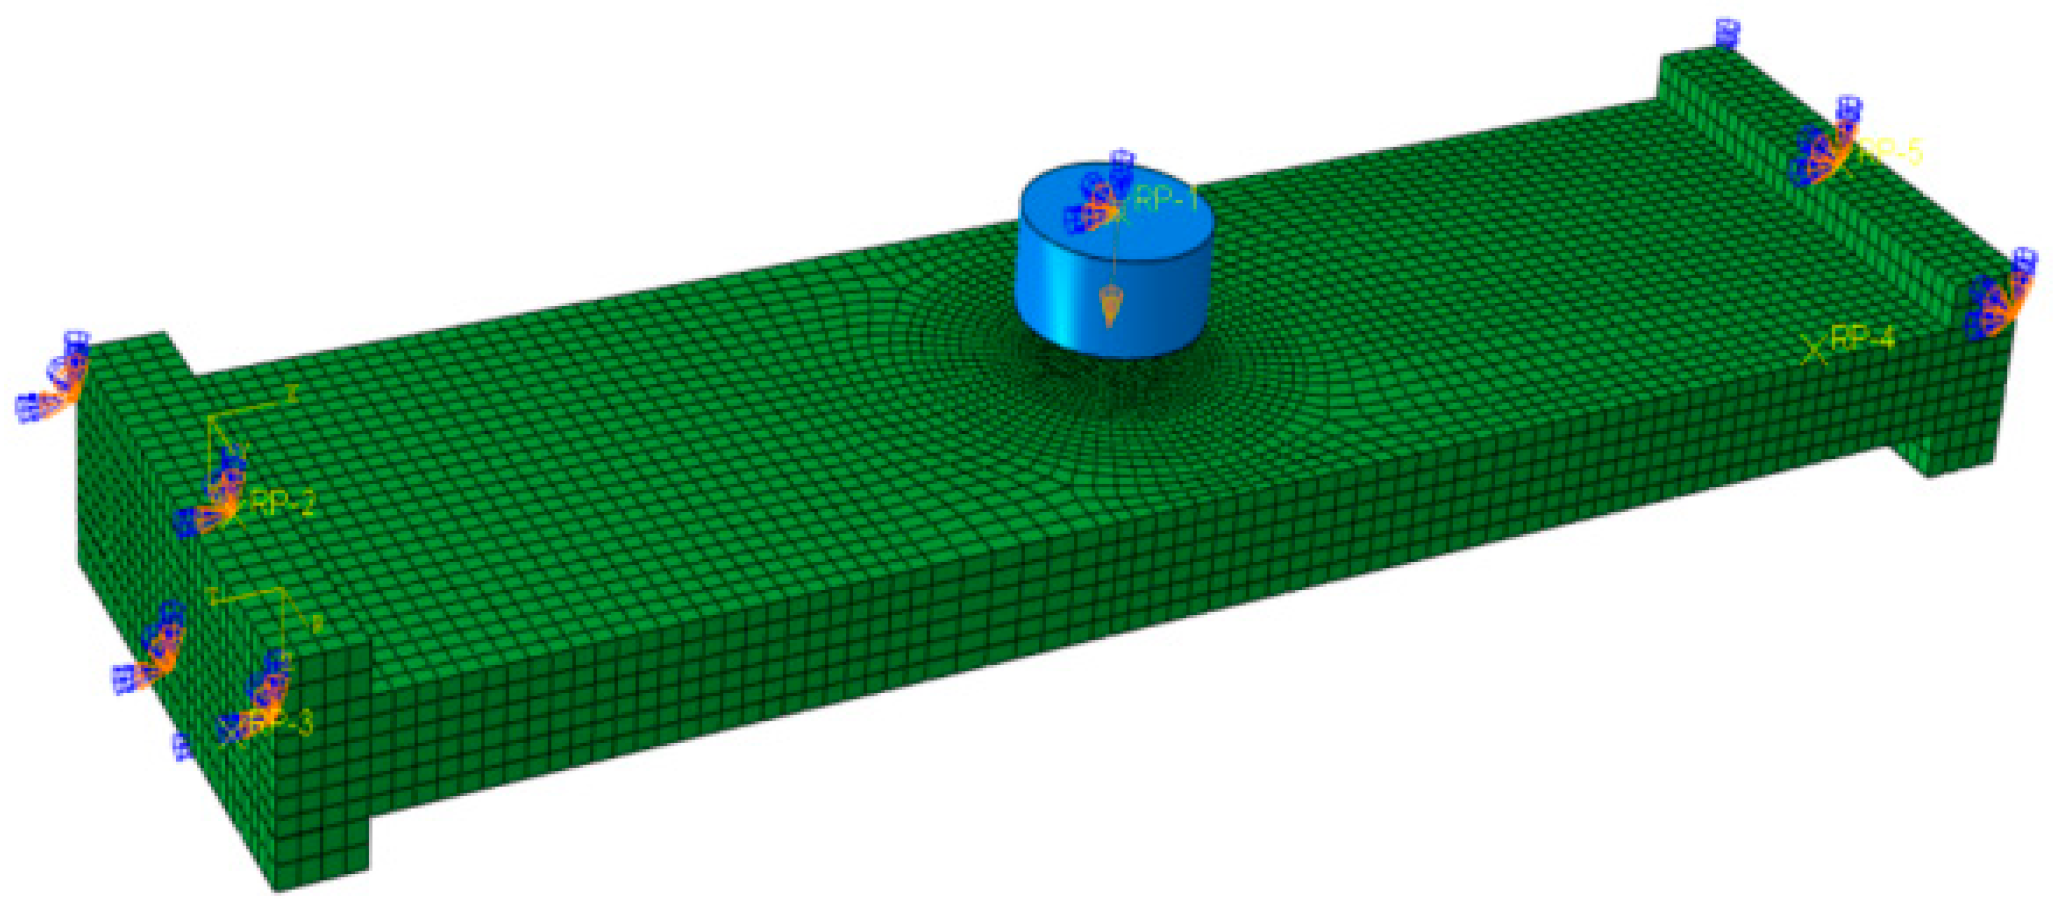
4.2. Establishment of Finite Element Model

The material properties for concrete, rebar, hammer head, and steel plate were established utilizing the linear elastic material model within ABAQUS. The top and bottom chord reinforcements and web reinforcements were modeled as two-node linear 3D truss elements (T3D2), while the concrete was represented by three-dimensional eight-node reduced integration elements (C3D8R), considered as a rigid body due to the absence of deformation in the falling hammer during the impact event. Given the complexity of the mechanical response to impact loading and the brevity of the actual impact duration, it is presupposed that the reinforcement and concrete are perfectly bonded, implying no relative slippage occurs between them. The specific material parameters are detailed in Table 6.
The impact energy for each test specimen is derived from the gravitational potential energy of the freely falling drop hammer, a cylinder measuring 220 mm in diameter. Under the assumption of no erosion at the interface between the drop hammer and the slab, the contact is modeled as “surface-to-surface”, employing a “hard contact” for normal interactions and a friction coefficient of 0.3 for tangential interactions. To replicate the test’s impact energy, the model specifies the initial velocity and mass of the hammer: positioned 1 mm above the slab’s center, with its velocity and mass configured accordingly. The drop hammer is restricted to vertical movement, with zero degrees of freedom in other directions; the modeled truss-reinforced PGC slab is treated as simply supported at both ends, with displacements in the X, Y, and Z directions constrained. The specific model configurations are depicted in Figure 15.

4.3. Comparison of Results

Figure 16 presents a comparison between the simulated cracking damage stress maps and the actual test damage patterns for the truss-reinforced PGC slab A1-2. As depicted in Figure 16, the simulated and experimental damage patterns closely align, characterized by concentrated cracks near the impact area, fewer cracks near the supports, mid-span cracking of both the concrete and steel plate with steel plate yielding, radial and longitudinal penetration cracks on the slab’s top surface extending from the loading point to the edge and longitudinal cracks. Radial and longitudinal penetration cracks formed on the slab’s top surface, spanning from the loading point to the edge. The comparison between the experimental results and the finite element simulation results is shown in Table 7.
The numerical and experimental curves depicting the impact response and mid-span displacement of the three slabs are presented in Figure 17 and Figure 18. The contact force between the hammer head and the concrete surface, as derived from numerical simulation, correlates well with the time history of the impact force from the test results depicted in Figure 16. The numerical simulation yields values that closely approximate the test results (A1-2: test impact force: 1476 kN, simulated impact force: 1549 kN; test maximum displacement: 36 mm, and simulated maximum displacement: 40 mm), with the error maintained within 10%. Collectively, the numerical simulation accurately predicted the time course of the impact force and the mid-span displacement of the slab.

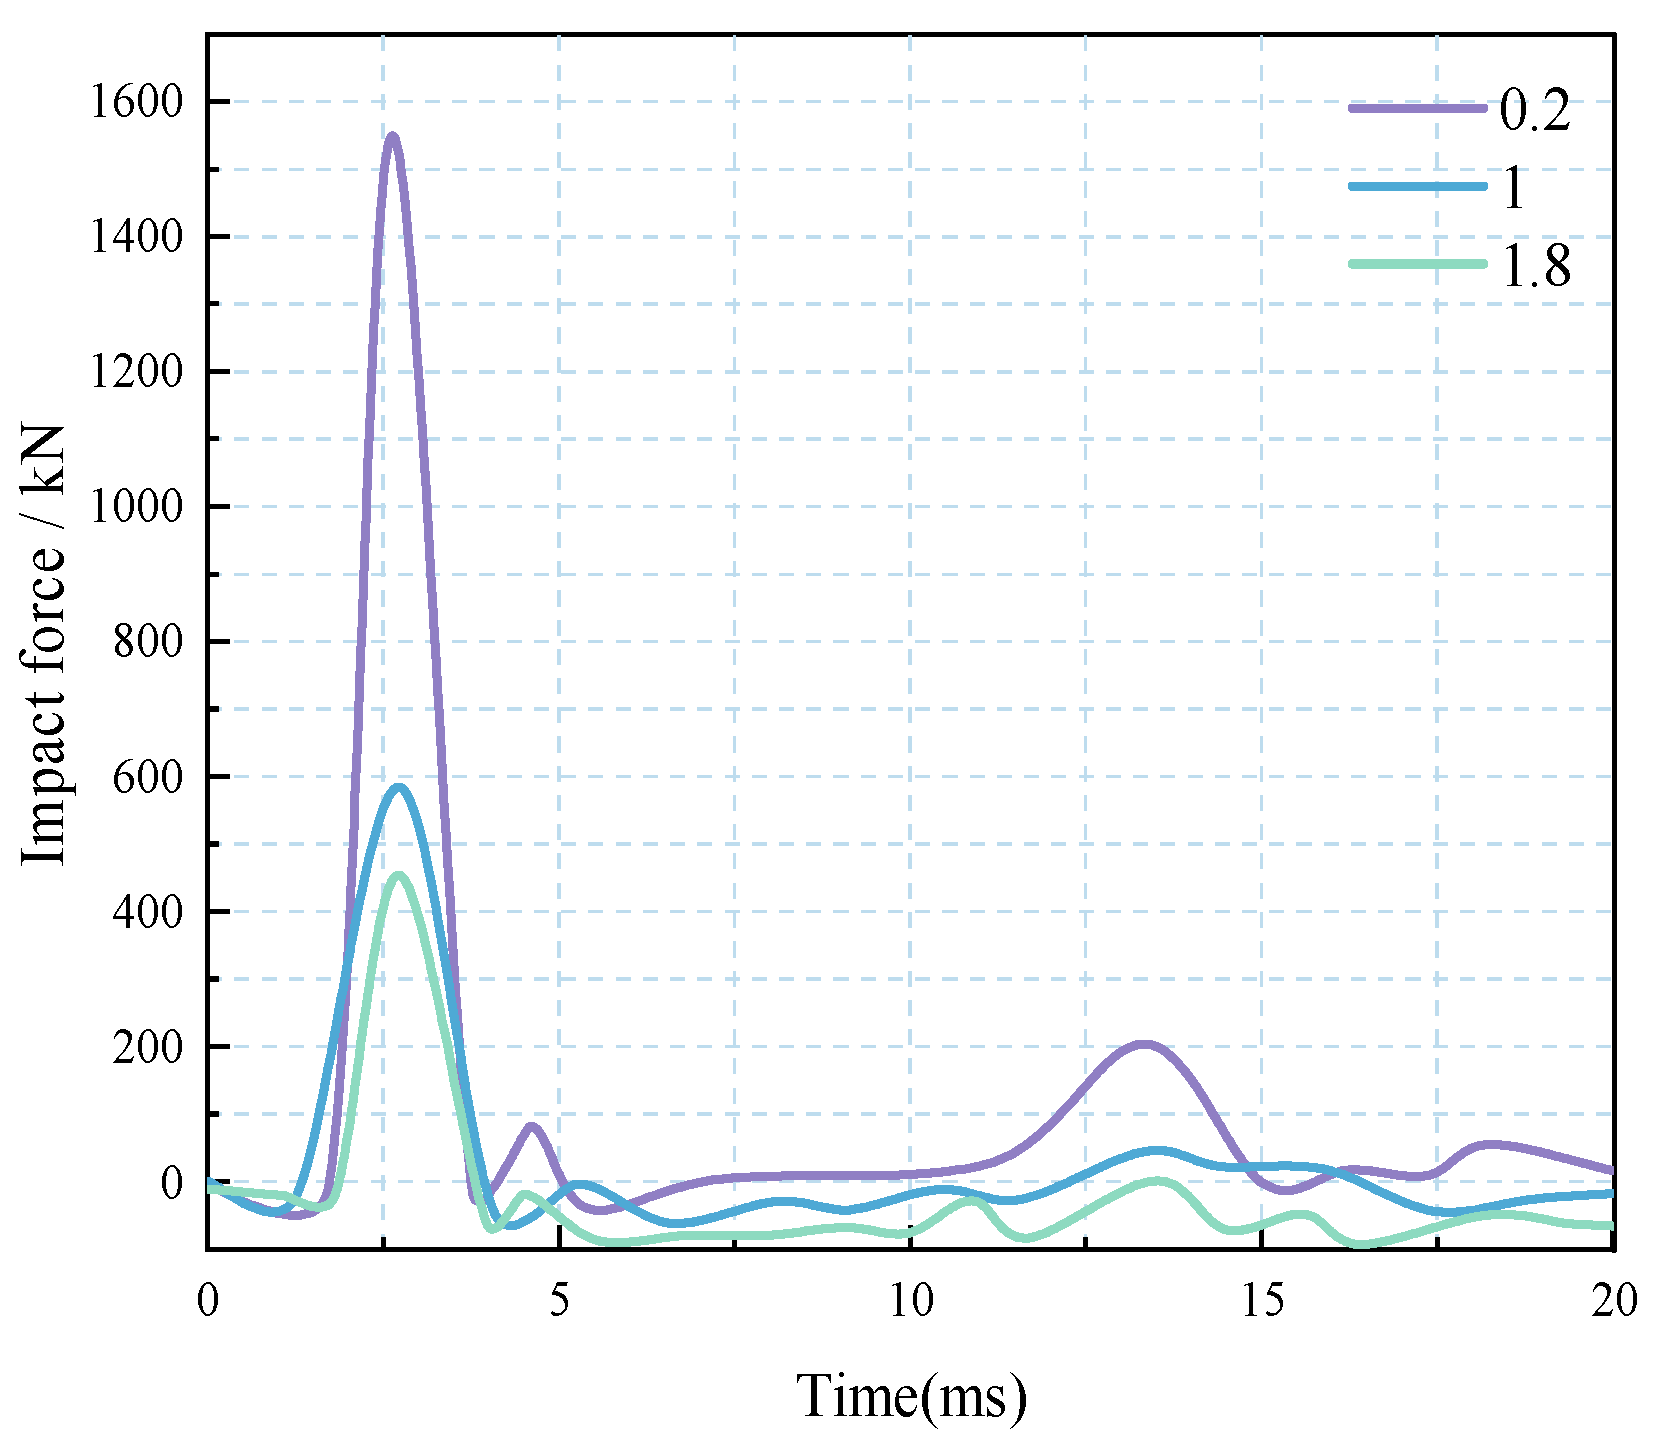
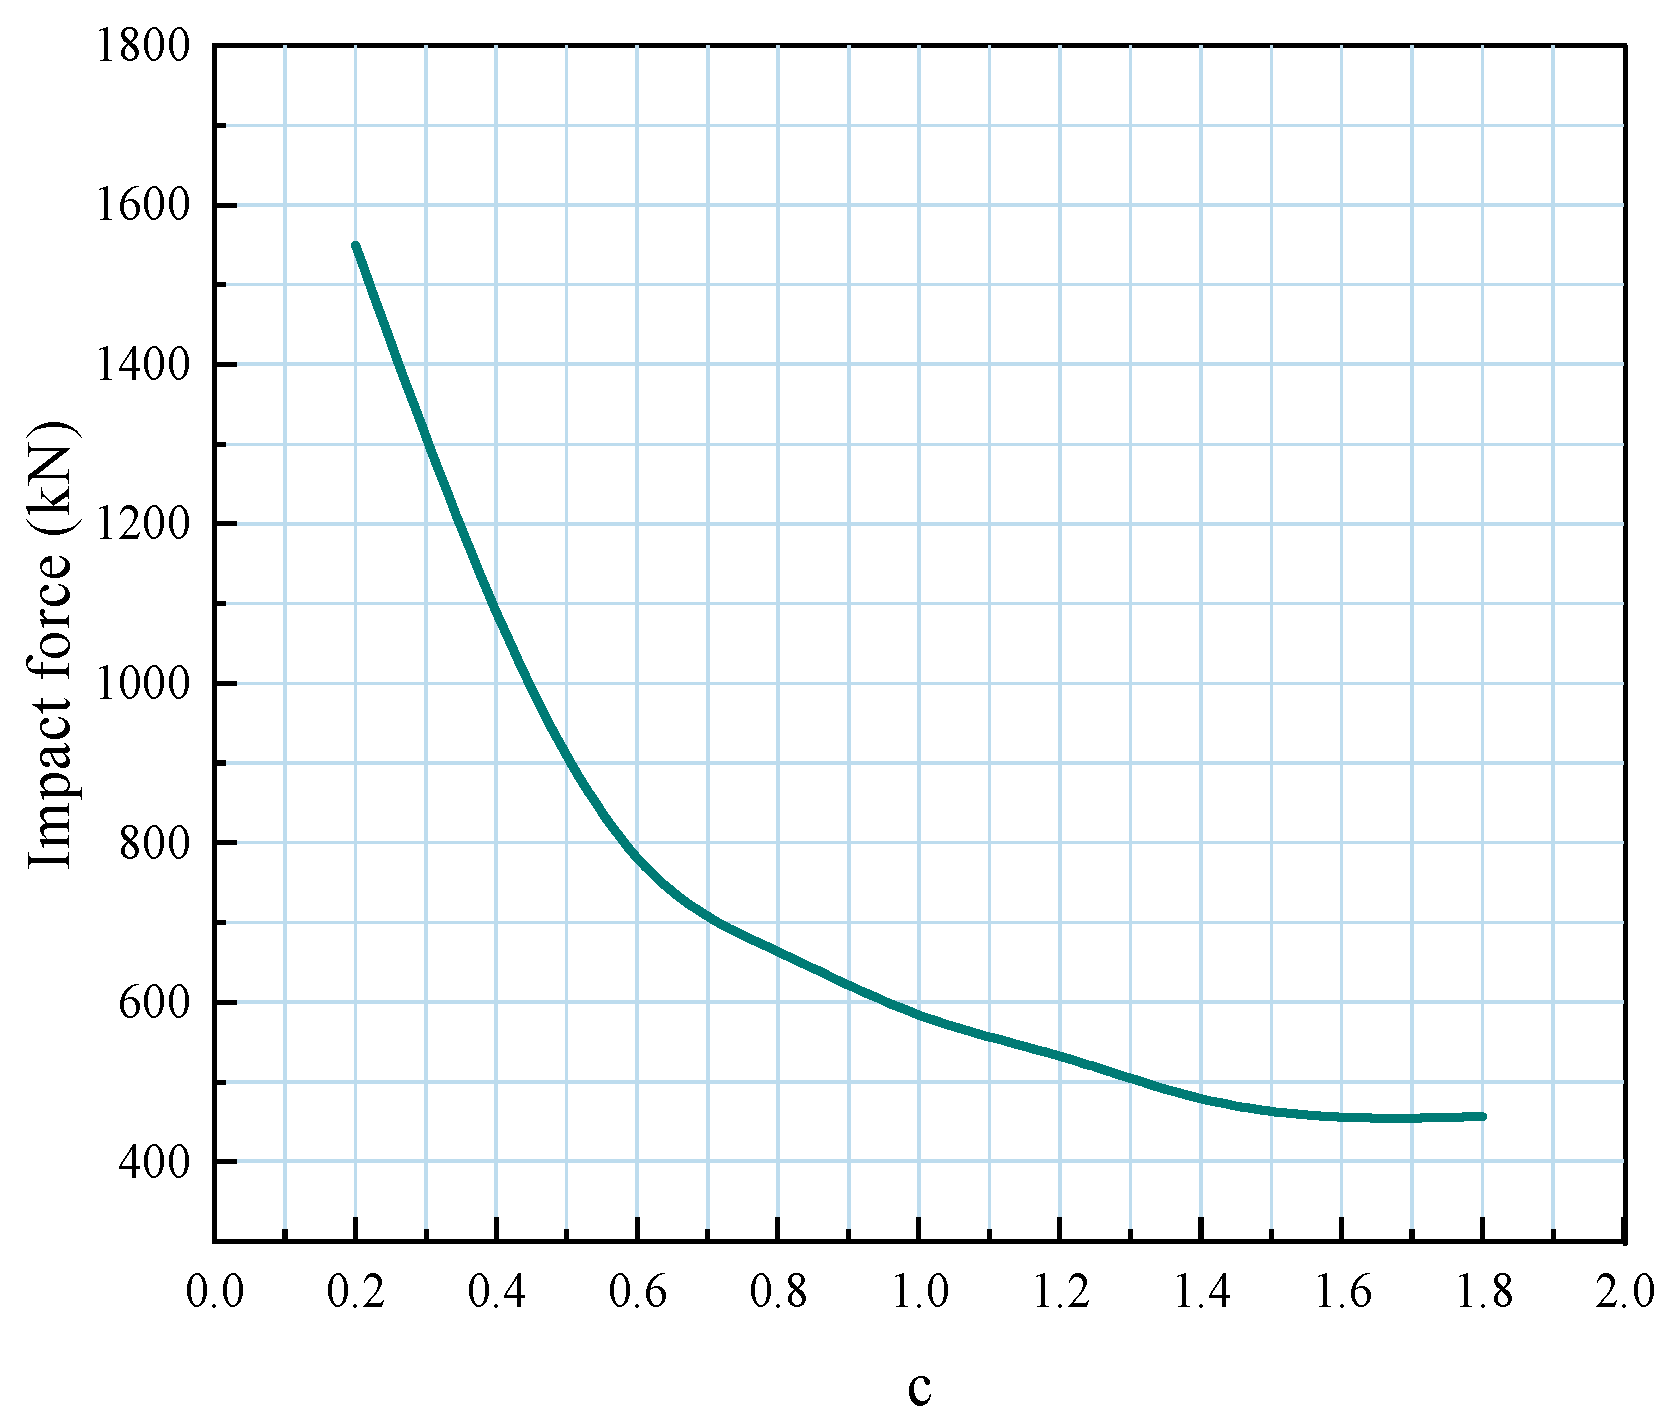
4.4. The Impact of Aspect Ratio on Impact Force

To isolate the geometric effects of impactor configuration on contact force dynamics, a parametric study was conducted maintaining constant mass through density modulation while systematically varying contact geometry parameters (interface area and vertical dimension). A dimensionless aspect ratio (c = h/a) defined in Equation (1) was introduced to decouple the coupled effects of contact width (a) and geometric height (h) on impact dynamics. Three discrete impactor diameters (50, 100, 200 units) were employed in the parametric finite element analysis to establish aspect ratio correlations.
c = h/a
Finite element models with aspect ratios of 0.2, 1.0, and 1.8 are illustrated in Figure 19.
Parametric analysis of three impactors with aspect ratios of 0.2, 1.0, and 1.8 was performed, with the time-history profiles of impact forces corresponding to each geometric configuration being depicted in Figure 20.
Figure 21 demonstrates an inverse correlation between aspect ratio and peak impact force magnitude, with reduced geometric slenderness corresponding to increased force fluctuation amplitudes during impact duration. Consequently, a systematic parametric investigation encompassing nine discrete aspect ratios (0.2 ≤ c ≤ 1.8, Δc = 0.2) was implemented, with corresponding impactor configurations being quantitatively characterized in Table 8.

5. Conclusions

(1)
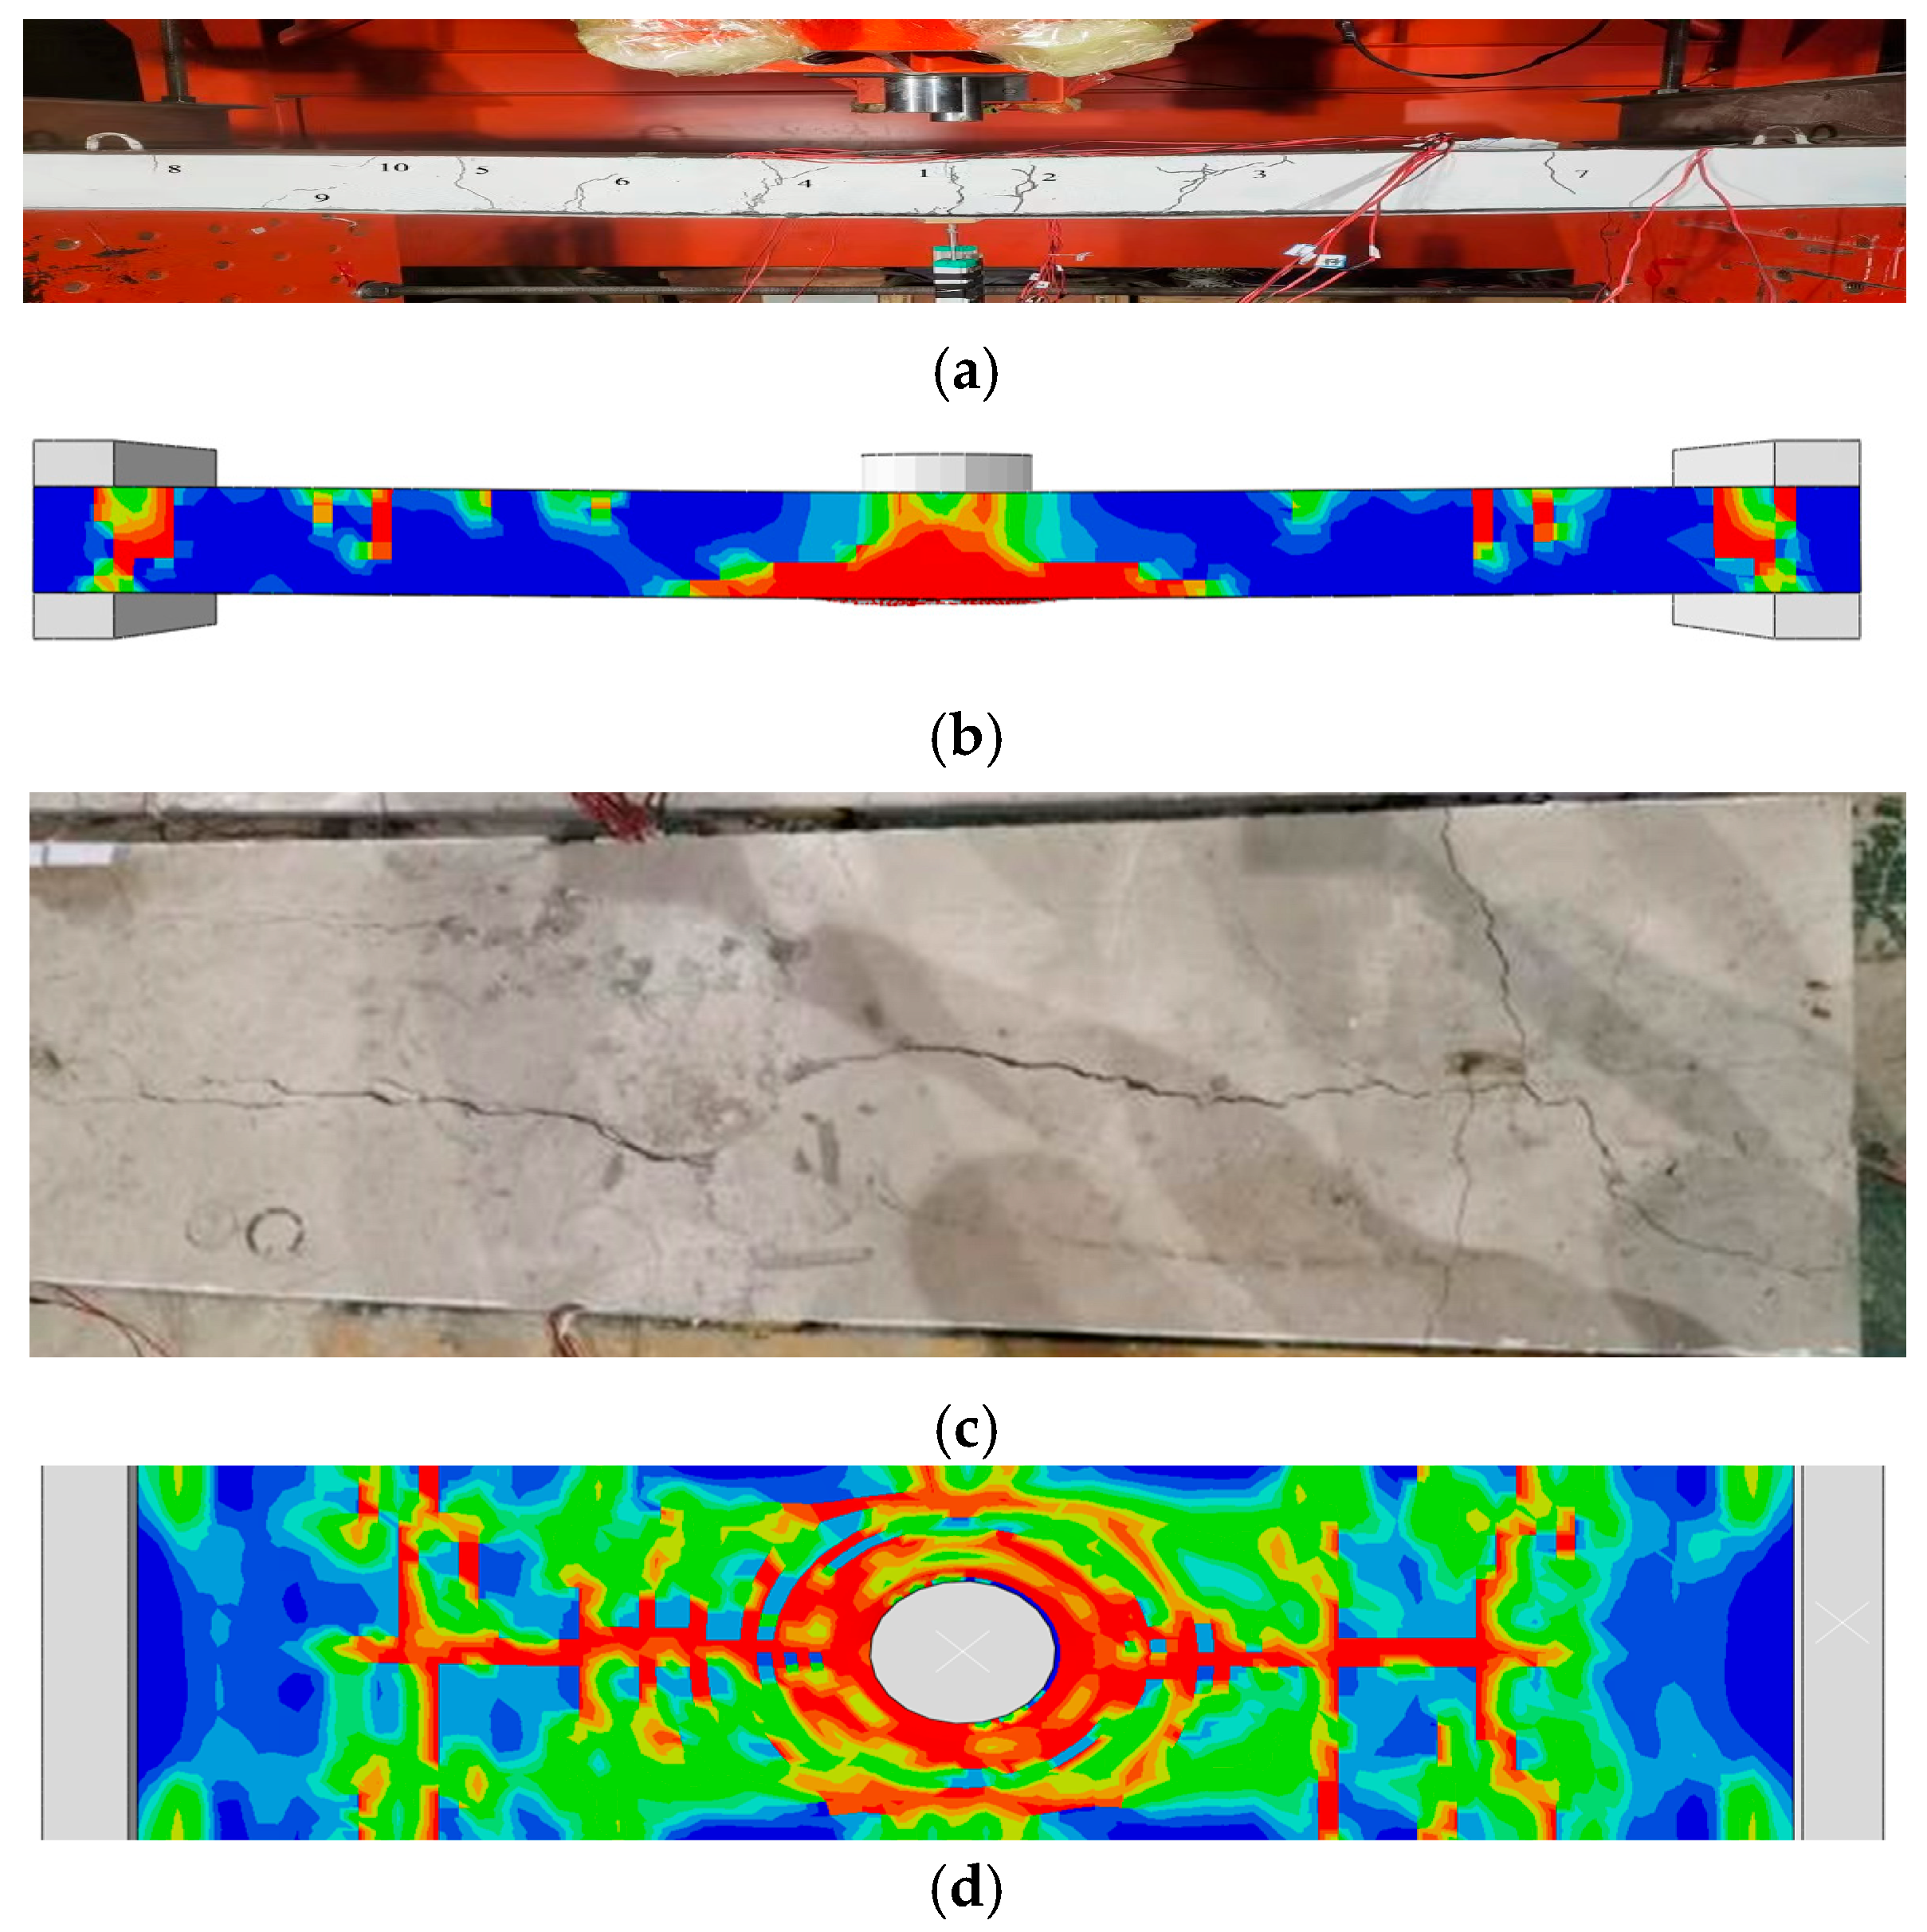
Under low-velocity impact, steel-truss-reinforced PGC slabs predominantly exhibited flexural failure mechanisms. Continuous longitudinal cracks propagating from the impact epicenter to slab peripheries were observed in the tensile zone, demonstrating characteristic through-thickness fracture patterns. For equivalent PG dosage, 120 mm-thick specimens demonstrated localized concrete spalling at the impact zone while maintaining structural integrity. This cohesive fracture morphology with controlled crack propagation (width < 0.3 mm) achieved complete energy dissipation, validating that increased slab thickness and steel plate integration effectively constrain crack initiation (35% reduction) and width development (42% decrease), thereby enhancing crack resistance and minimizing impact-induced damage.
(2)
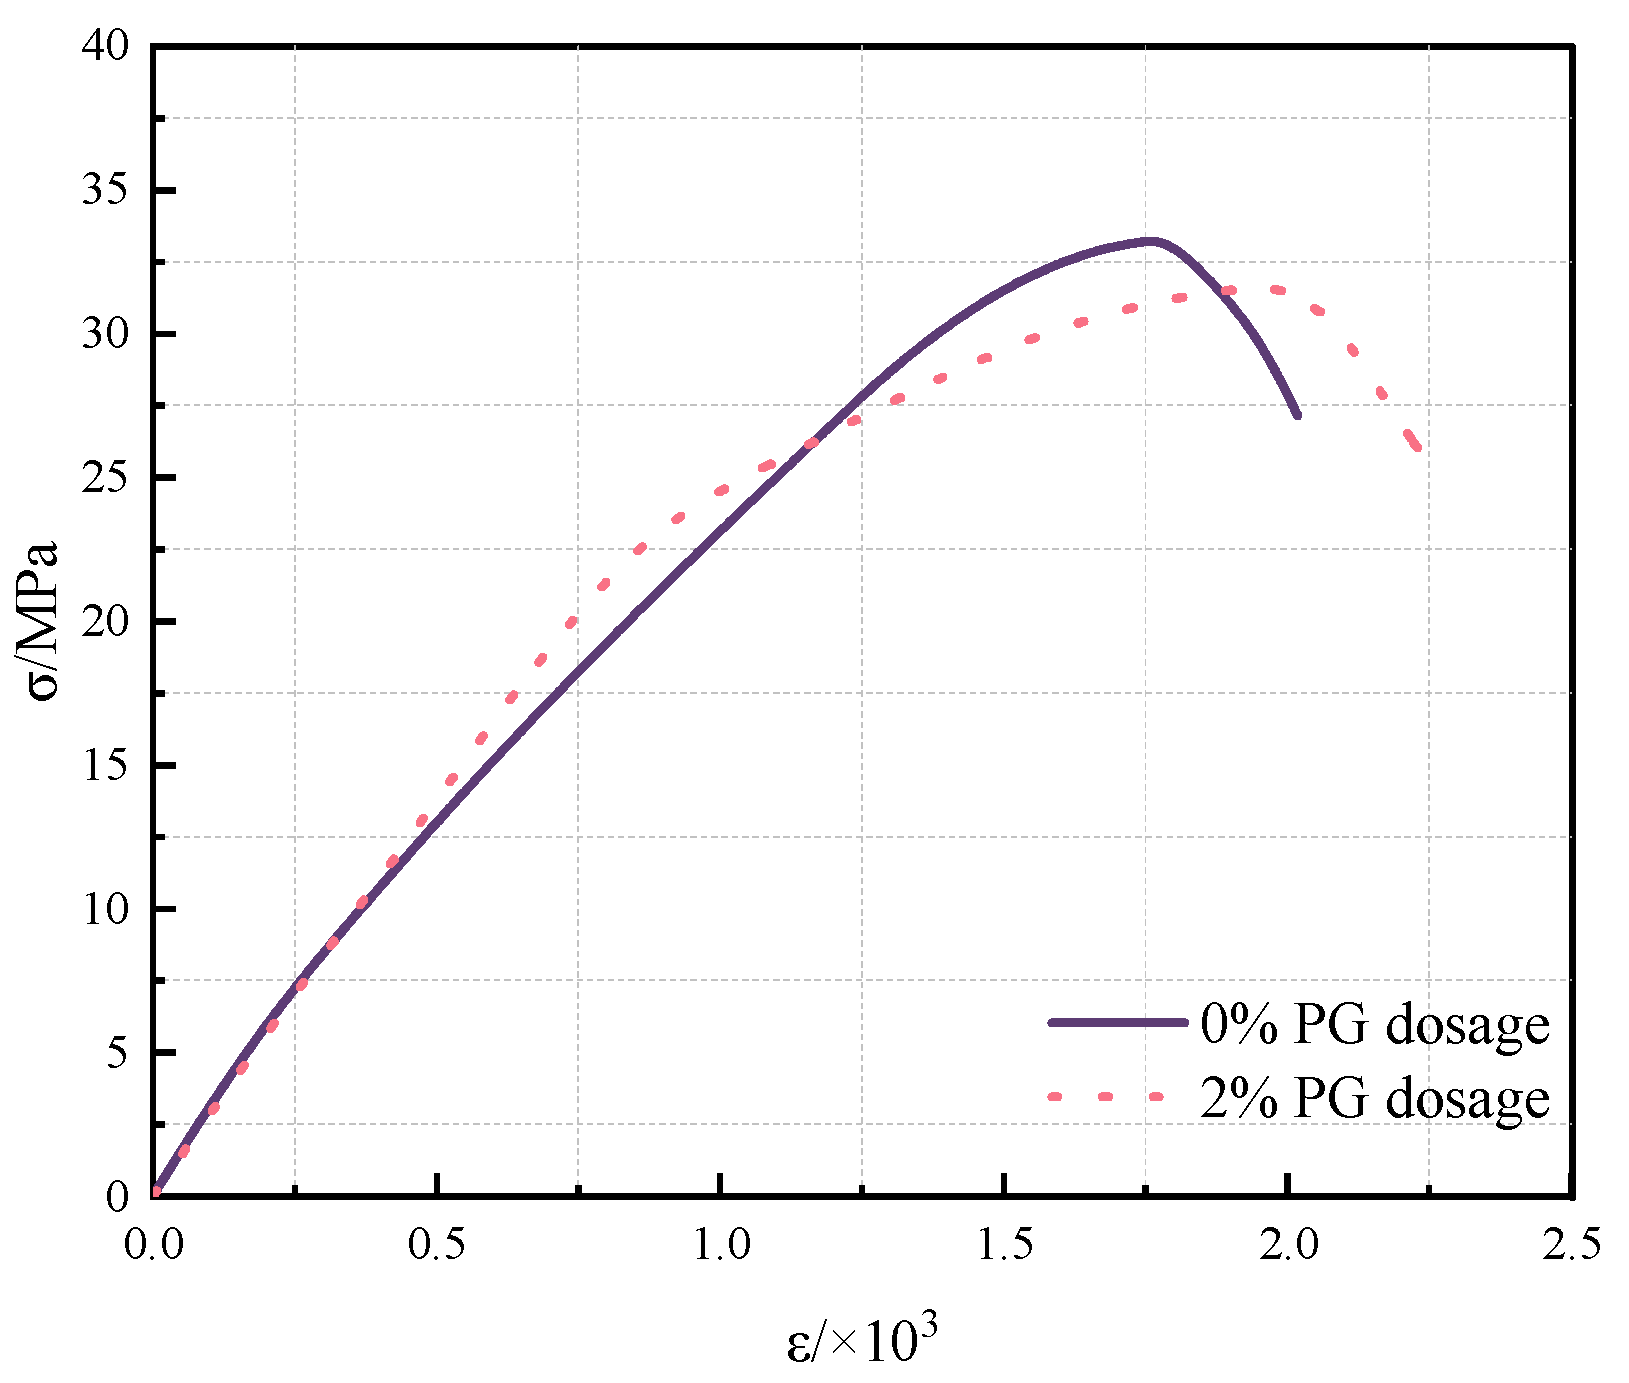
Progressive PG dosage escalation (0–2%) under constant impact height revealed congruent mid-span displacement time-history profiles. Notably, both maximum and residual mid-span displacements exhibited 2 mm increments. PG-modified concrete demonstrated enhanced free-water viscous effects, augmenting structural compactness, energy dissipation capacity, and ductility. This modification preserved deformation resistance parity with conventional concrete, while concurrently reducing environmental contamination potential from PG utilization.
(3)
Under identical total impact energy conditions, the mid-span displacement of the slab subjected to a single impact load is reduced, and the ejection of concrete debris from the slab’s top surface is minimal. This suggests that multiple impacts pose a greater risk compared to a single impact of equivalent total energy.
(4)
Variations in PG content (0–2%) exhibited statistical invariance in both secondary impact force peaks and temporal characteristics under identical impact energy conditions, demonstrating statistically insignificant influence (p > 0.05) within the studied parameter space.
(5)
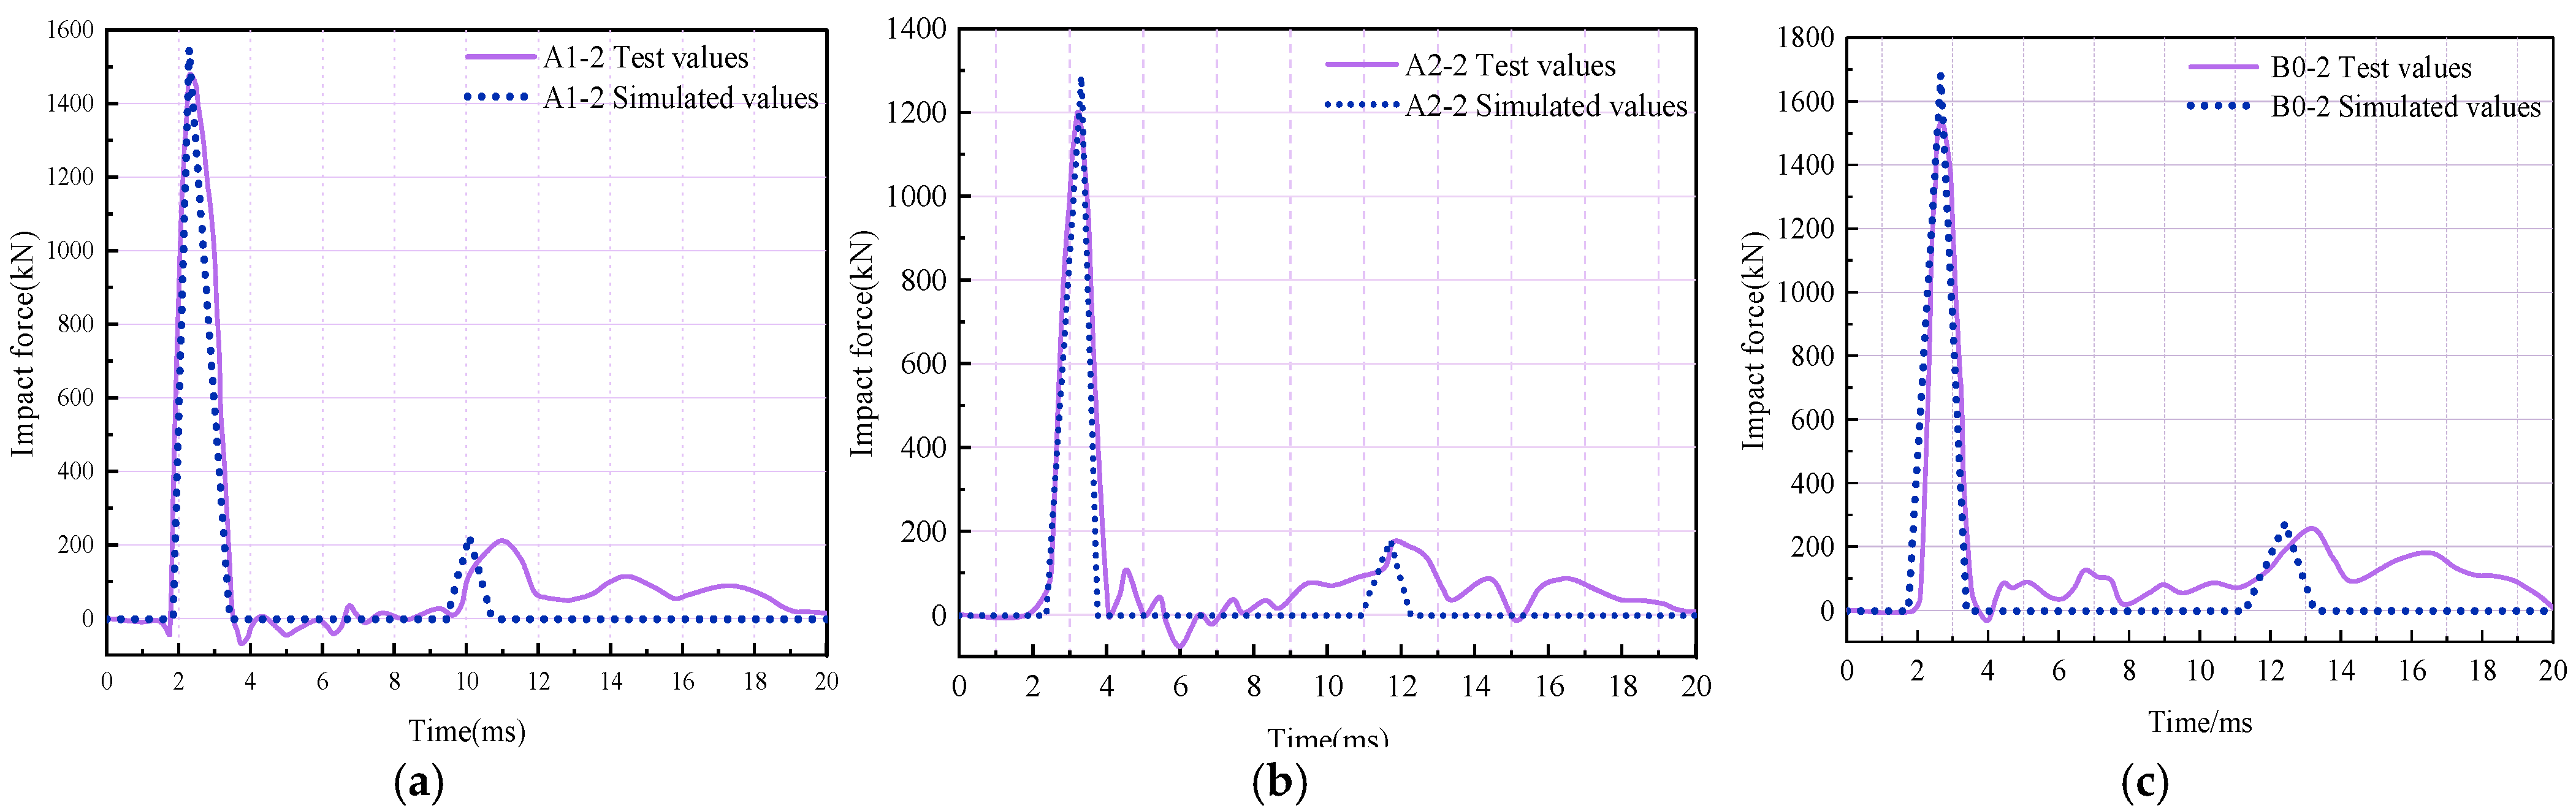
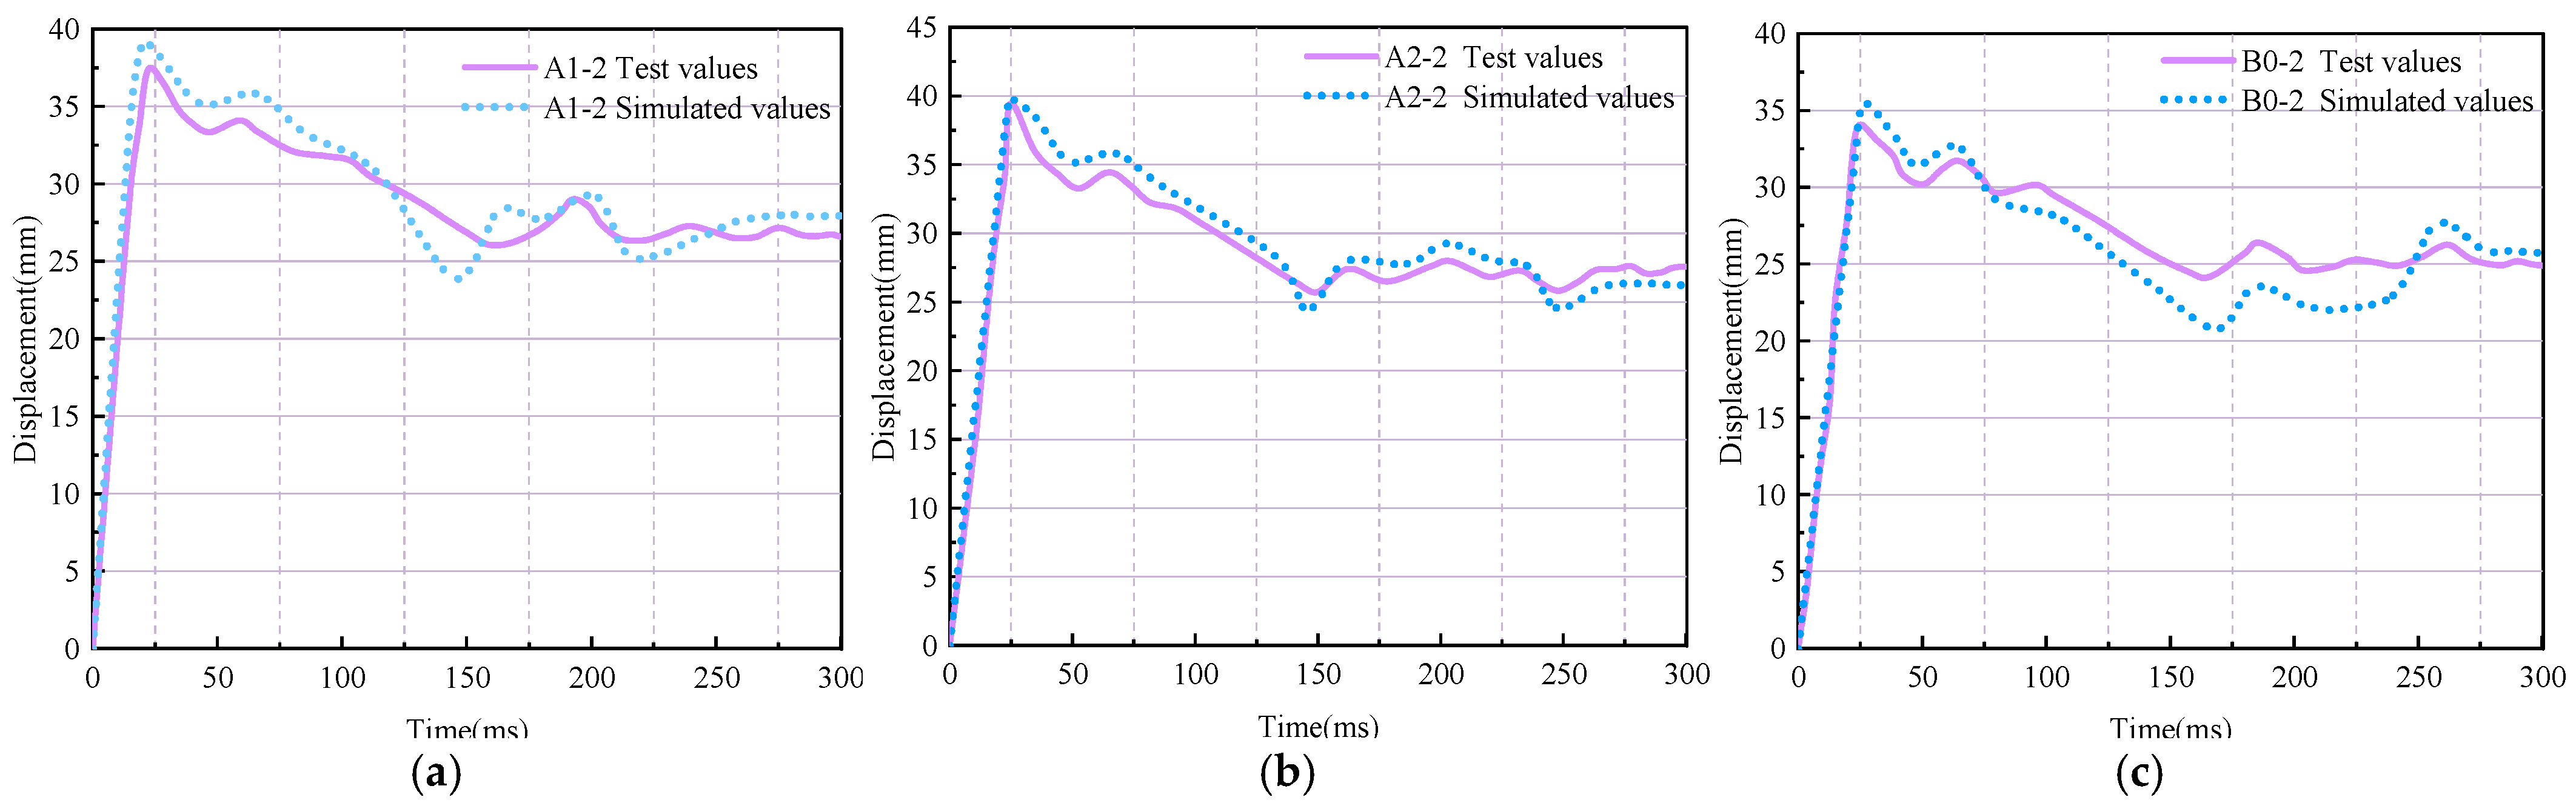
The ABAQUS finite element analysis (FEA) platform was employed to simulate impact scenarios, yielding time-history responses of impact forces and displacements that exhibited strong correlation (R2 ≥ 0.92) with experimental data, with discrepancies confined within 10%. This validation confirms the model’s predictive capability in capturing critical impact mechanics parameters.
(6)
Experimental results demonstrate that the incorporation of 2% PG composite admixture enables efficient utilization of industrial solid waste (8.5 tons per 100 m3 of concrete) while maintaining compliance with mechanical performance criteria (compressive strength and durability). This formulation provides a feasible solution for environmentally sound disposal of industrial by-products. Through synergistic optimization of the waste-cementitious matrix system, the design achieves balanced functional performance and ecological benefits, aligning with the sustainable development objectives of green concrete technology.
(7)
Numerical analysis of drop hammer geometry effects on rockfall impact loading reveals three critical parametric relationships: (1) impact load magnitude demonstrates inverse proportionality to contact width; (2) impactor thickness exhibits negative correlation with peak contact force; (3) decreasing width-to-height ratio induces accelerated growth in impact intensity, following an inverse proportional function with progressive rate enhancement. These findings provide quantitative references for post-impact structural monitoring system optimization and targeted reinforcement strategy formulation, thereby improving operational precision in disaster-affected infrastructure maintenance.

Author Contributions

Conceptualization, L.S. and L.Z.; methodology, L.S.; software, Y.H.; validation, L.S., Y.H., and L.Z.; formal analysis, L.S.; investigation, L.Z.; resources, L.S.; data curation, Y.H and L.Z; writing—original draft preparation, Y.H.; writing—review and editing, L.S.; visualization, L.S.; supervision, L.S.; project administration, L.S.; funding acquisition, L.S. All authors have read and agreed to the published version of the manuscript.

Funding

Supported by Jilin Science and Technology Development Program (20220203072SF).

Data Availability Statement

The original contributions presented in this study are included in the article. Further inquiries can be directed to the corresponding author.

Conflicts of Interest

Author Lijie Zhang was employed by the company State Grid Baicheng Power Supply Company. The remaining authors declare that the research was conducted in the absence of any commercial or financial relationships that could be construed as a potential conflict of interest.

References

  1. Tayibi, H.; Choura, M.; López, F.A.; Alguacil, F.J.; López-Delgado, A. Environmental impact and management of phosphogypsum. J. Environ. Manag. 2009, 90, 2377–2386. [Google Scholar] [CrossRef] [PubMed]
  2. Jalali, J.; Gaudin, P.; Capiaux, H.; Ammar, E.; Lebeau, T. Fate and transport of metal trace elements from phosphogypsum piles in Tunisia and their impact on soil bacteria and wild plants. Ecotoxicol. Environ. Saf. 2019, 174, 12–25. [Google Scholar] [CrossRef] [PubMed]
  3. Yang, J.; Liu, W.; Zhang, L.; Xiao, B. Preparation Of Load-bearing Building Materials From Autoclaved Phosphogypsum. Constr. Build. Mater. 2009, 23, 687–693. [Google Scholar] [CrossRef]
  4. Zhang, D.; Luo, H.; Zheng, L.; Wang, K.; Li, H.; Wang, Y.; Feng, H. Utilization of waste phosphogypsum to prepare hydroxyapatite nanoparticles and its application towards removal of fluoride from aqueous solution. J. Hazard. Mater. 2012, 241–242, 418–426. [Google Scholar] [CrossRef]
  5. Murali, G.; Azab, M. Recent research in utilization of phosphogypsum as building materials: Review. J. Mater. Res. Technol. 2023, 25, 960–987. [Google Scholar] [CrossRef]
  6. Liu, D.-S.; Wang, C.-Q.; Mei, X.-D.; Zhang, C. An effective treatment method for phosphogypsum. Environ. Sci. Pollut. Res. 2019, 26, 30533–30539. [Google Scholar] [CrossRef]
  7. Wang, Y.; Huo, H.; Chen, B.; Cui, Q. Development and optimization of phosphogypsum-based geopolymer cement. Constr. Build. Mater. 2023, 369, 130577. [Google Scholar] [CrossRef]
  8. Islam, G.S.; Chowdhury, F.H.; Raihan, M.T.; Amit, S.K.S.; Islam, M.R. Effect of phosphogypsum on the properties of Portland cement. Procedia Eng. 2017, 171, 744–751. [Google Scholar] [CrossRef]
  9. Muthukumar, P.; Shewale, M.; Asalkar, S.; Shinde, N.; Korke, P.; Anitha, M.; Gobinath, R.; Anuradha, R. Experimental study on light weight panel using phosphogypsum. Mater. Today Proc. 2022, 49, 1852–1856. [Google Scholar] [CrossRef]
  10. Chen, S.; Kong, D.; Wang, L.; Cheng, X.; Fu, R.; Lv, F. Experimental Investigation on Dynamic Compressive Properties of Phosphogypsum-Based Concretes. J. Mater. Civ. Eng. 2023, 35, 04023477. [Google Scholar] [CrossRef]
  11. Yin, C.; Zhou, L.; Zou, Q.; Xu, Y. Effect of filling phosphogypsum on the axial compression behavior of cold-formed thin-walled steel walls. Buildings 2022, 12, 1325. [Google Scholar] [CrossRef]
  12. Rehman, S.; Iqbal, S.; Ali, A. Combined influence of glass powder and granular steel slag on fresh and mechanical properties of self-compacting concrete. Constr. Build. Mater. 2018, 178, 153–160. [Google Scholar] [CrossRef]
  13. Kezmane, A.; Chiaia, B.; Kumpyak, O.; Maksimov, V.; Placidi, L. 3D modelling of reinforced concrete slab with yielding supports subject to impact load. Eur. J. Environ. Civ. Eng. 2017, 21, 988–1025. [Google Scholar] [CrossRef]
  14. Asakura, T.; Mizunuma, H.; Kasai, Y.; Tanaka, M.; Hiramitsu, A. Prediction of low-frequency floor impact vibration of CLT structures using a single-layer FE model. J. Build. Eng. 2024, 98, 111336. [Google Scholar] [CrossRef]
  15. Yasunori, M.; Natsuki, I. Behavior of thin reinforced concrete slabs and effect of reinforcement bars subjected low-velocity impact. Structures 2022, 38, 832–847. [Google Scholar] [CrossRef]
  16. Sadraie, H.; Khaloo, A.; Soltani, H. Dynamic performance of concrete slabs reinforced with steel and GFRP bars under impact loading. Eng. Struct. 2019, 191, 62–81. [Google Scholar] [CrossRef]
  17. Peng, F.; Gu, S.; Li, T.; Kong, C.; Huang, Y.; Li, J. Experimental and Theoretical Study of Rockfall Impacts on Concrete Slab under Low-velocity Impact. KSCE J. Civ. Eng. 2022, 26, 4653–4663. [Google Scholar] [CrossRef]
  18. Beppu, M.; Kataoka, S.; Mori, K.; Ichino, H. Local damage characteristics of reinforced concrete slabs subjected to hard/deformable projectile impact. Adv. Struct. Eng. 2022, 7, 1505–1518. [Google Scholar] [CrossRef]
  19. Senthil, K.; Sharma, R. Evaluation of Compressive and Tensile Stress–Strain Parameters of Concrete Damage Plasticity Model for Concrete Slabs Under Impact load. J. Vib. Eng. Technol. 2023, 11, 2733–2754. [Google Scholar] [CrossRef]
  20. Chen, C.; Zhang, X.; Hao, H. Investigation on the impact resistance of reinforced geopolymer concrete slab. J. Clean. Prod. 2023, 406, 137144. [Google Scholar] [CrossRef]
  21. Zhang, J.; Yan, Y.; Hu, Z. Preparation and characterization of foamed concrete with Ti-extracted residues and red gypsum. Constr. Build. Mater. 2018, 171, 109–119. [Google Scholar] [CrossRef]
  22. GB/T 5081-2019; Test Methods for Building Slabs Under Impact Loading. China Standards Press: Beijing, China, 2019.
  23. GB 50010-2010; Code for Design of Concrete Structures. Architecture & Building Press: Beijing, China, 2010.
  24. GB/T 50743-2012; Technical Code for Recycling of Construction and Demolition Waste. China Architecture & Building Press: Beijing, China, 2012.
  25. JGJ 55-2011; Specification for Mix Proportion Design of Ordinary Concrete. China Architecture & Building Press: Beijing, China, 2011.
  26. GB/T 14685-2022; Pebble and Crushed Stone for Construction. China Standards Press: Beijing, China, 2022.
  27. GB/T 14684-2022; Sand for Construction. China Standards Press: Beijing, China, 2022.
  28. GB 8076-2008; Concrete Admixtures. China Standards Press: Beijing, China, 2008.
  29. GB/T 1346-2011; Test Methods for Water Requirement of Normal Consistency, Setting Time and Soundness of Cement. China Standards Press: Beijing, China, 2011.
  30. Wei, H.; Wen, Z.; Ba, L.; Gao, Q. Study on strength test and hydration mechanism of phosphogypsum based cemented backfill. In IOP Conference Series: Earth and Environmental Science; IOP Publishing: Bristol, UK, 2021; Volume 768, p. 012100. [Google Scholar] [CrossRef]
  31. Zhang, J.-L.; Liu, B.-D.; Liu, R. Behavior of sinusoidal-corrugated-steel-plate–concrete composite slabs: Experimental investigation and theoretical model development. J. Constr. Steel Res. 2021, 187, 106958. [Google Scholar] [CrossRef]
  32. Lian, M.; Luo, Z.; Su, M.; Zhang, H.; Shen, H. Composite floor slab effect on seismic performance of steel-framed-tube structures with shear links. Soil Dyn. Earthq. Eng. 2024, 183, 108800. [Google Scholar] [CrossRef]
  33. Huang, Z.; Zhao, X.; Guo, Y.; Liu, X. Residual Flexural Performance of Double-Layer Steel–RLHDC Composite Panels after Impact. Buildings 2023, 13, 2916. [Google Scholar] [CrossRef]
  34. Chernysh, Y.; Plyatsuk, L. Environmentally friendly concept of phosphogypsum recycling on the basis of the biotechnological approach. In International Business, Trade and Institutional Sustainability; Springer: Cham, Switzerland, 2020; pp. 167–182. [Google Scholar]
  35. Chen, Y.; May, I.M. Reinforced concrete members under drop-weight impacts. Proc. Inst. Civ. Eng.-Struct. Build. 2009, 162, 45–56. [Google Scholar] [CrossRef]
Figure 1. (a) Cubic compressive strength test of ordinary; (b) PGC Cube Compressive Strength Test; (c) PGC axial compressive strength test; (d) Modulus of elasticity test.
Buildings 15 01948 g001
Figure 2. (a) After tamping is completed, the surface should be smoothed out; (b) covering plastic film; (c) maintenance completed.
Buildings 15 01948 g002
Figure 3. Schematic diagram of floor reinforcement (a) Dimensions of steel floor (b) non-steel floor, reinforcement layout (c) Floor Reinforcement Stereoscopic Diagram.
Buildings 15 01948 g003
Figure 4. Test piece production process. (a) Steel plate steel reinforcement trusses; (b) rebar trusses; (c) welded structural reinforcement; (d) reinforcement truss strain gauge pasting (e) reinforcement truss strain gauge pasting; (f) the strain gauge is pasted (g) drum mixer; (h) molds; (i) concrete pouring and vibrating; (j) smoothing after the concrete is poured; (k) partial homotrophic test blocks; (l) concrete curing.
Buildings 15 01948 g004
Figure 5. Drop-weight test loading and fixing device.
Buildings 15 01948 g005
Figure 6. Data acquisition system.
Buildings 15 01948 g006
Figure 7. Layout of measuring points of concrete external surface and tie rod displacement sensor.
Buildings 15 01948 g007
Figure 8. (f) A1-3 slab top damage; (g) B0-2 slab top damage.
Buildings 15 01948 g008aBuildings 15 01948 g008b
Figure 9. Stress wave diffusion pattern.
Buildings 15 01948 g009
Figure 10. Characteristics of plate-hammer motion.
Buildings 15 01948 g010
Figure 11. Impact time history curve of each specimen: (a) repeated impact specimens; (b) single impact specimen.
Buildings 15 01948 g011
Figure 12. Time course curve of mid-span displacement of each specimen: (a) repeated impact specimens; (b) single impact specimen.
Buildings 15 01948 g012
Figure 13. Maximum displacement and residual displacement in the span of each specimen.
Buildings 15 01948 g013
Figure 14. Compressive stress–strain curves of concrete.
Buildings 15 01948 g014
Figure 15. Diagram of load boundary conditions.
Buildings 15 01948 g015
Figure 16. Comparison of A1-2 slab damage patterns: (a) impact lateral test damage; (b) impact lateral simulated damage; (c) top-of-plate test damage; (d) simulated damage to the top.
Buildings 15 01948 g016
Figure 17. Comparison of simulated and test impact forces. (a) A1-2 (b) A2-2 (c) B0-2.
Buildings 15 01948 g017
Figure 18. Comparison between simulated and tested mid-span displacement. (a) A1-2 (b) A2-2 (c) B0-2.
Buildings 15 01948 g018
Figure 19. 3 types of aspect ratio finite element model diagrams.
Buildings 15 01948 g019
Figure 20. Curve diagram of the relationship between impact and time at different aspect ratios.
Buildings 15 01948 g020
Figure 21. Graph of the relationship between impact of falling hammer and aspect ratio.
Buildings 15 01948 g021
Table 1. Concrete mix design/(kg/m3).
PG DosageDissociationClinkerCoal AshMineral PowderPGCrushed or Broken RockAluminaWater Reducing AgentWater
0%C35235.3933.6367.250.01114.43774.744.04157.03
2%C35230.6833.6367.254.711114.43774.744.04157.03
Table 2. Table of concrete test configuration for test.
GroupTest Block SizePG Blending RatioProduction Quantity
AC150 mm × 150 mm × 150 mm0%6
A1150 mm × 150 mm × 150 mm2%6
B0150 mm × 150 mm × 300 mm0%4
B1150 mm × 150 mm × 300 mm2%4
Table 3. Floor design parameters.
Specimen NumberGrade of ConcretePlate Size L*b*h (mm)Bottom Plate or NotPG ContentLoading Mode
A1-1C402200 × 600 × 120yes2%Repeatedlly
A1-2C402200 × 600 × 120yes2%Single
A1-3C402200 × 600 × 120no2%Single
A2-2C402200 × 600 × 100yes2%Single
B0-2C402200 × 600 × 120yes0%Single
Table 4. Loading program.
Specimen NumberPG DosageWeight of a Hammer/kgImpact Height/mImpact Energy/J
A1-12%23912323
1.252903
1.53484
A1-22%2393.758198
A1-32%2393.758198
A2-22%2393.758198
B0-20%2393.758198
Table 5. Characteristic values of impact force.
Specimen NumberImpact Maximum (kN)Second Peak of Impact (kN)Ratio of Second Peak to Maximum Impact Force
A1-1-14476515%
A1-1-25539918%
A1-1-363620632%
A1-2147621715%
A1-3130220515%
A2-2119516514%
B0-2153425717%
Table 6. Material model parameters.
ParametersPlain ConcretePG ConcreteSteel Reinforcing BarPlateHammer Head
Poisson’s ratio0.190.190.30.30.3
Densities (kg/m3)25002500785078507850
Modulus of elasticity (GPa)32.732.6210210210
yield strength (MPa)425.08
(8 mm)
427.15
(10 mm)
4001000
Table 7. Comparison between test results and finite element simulation results.
Specimen Number F t , m a x / k N F n , m a x / k N η F / % t , m a x / m m n , m a x / m m η / %
A1-2145015486.837408.1
A2-2119512887.839402.6
B0-2153316437.234378.8
Annotation: F t , m a x : maximum impact force of the test; F n , m a x : maximum impact for numerical simulation; η F : maximum impact difference; t , m a x : maximum mid-span displacements; n , m a x : maximum mid-span displacement for numerical simulation; and η : relative difference between the maximum mid-span displacement, η F = F n , m a x F t , m a x / F t , m a x , η = n , m a x t , m a x ) / t , m a x .
Table 8. Comparison of impact forces at different aspect ratios.
Serial NumbercImpact Force/kN
10.21549.4
20.41089.7
30.6781.1
40.8663.5
51584.1
61.2532.1
71.4479.2
81.6455.7
91.8453.7
Disclaimer/Publisher’s Note: The statements, opinions and data contained in all publications are solely those of the individual author(s) and contributor(s) and not of MDPI and/or the editor(s). MDPI and/or the editor(s) disclaim responsibility for any injury to people or property resulting from any ideas, methods, instructions or products referred to in the content.

