1. Introduction
The Architecture, Engineering, and Construction (AEC) industry is a critical pillar of the global economy, yet it has long struggled with fragmentation, heavy resource consumption, and relatively low productivity [
1]. With the rise of the digital economy, emerging technologies, such as cloud computing, Building Information Modeling (BIM), artificial intelligence, the Internet of Things, and blockchain, are increasingly viewed as potential catalysts for a major shift in construction [
2]. Around the world, governments have launched strategic initiatives to accelerate digital transformation in the industry. For instance, the UK’s “Digital Charter”, Japan’s “Society 5.0”, and Singapore’s “Smart Nation” programs all reflect a common policy direction of leveraging digital technologies for industrial upgrades. In China, the 14th Five-Year Plan for the Development of the Digital Economy explicitly calls for integrating industrial digitalization with construction services, injecting ongoing innovative momentum into the sector [
3].
However, advancing digital transformation is not merely about deploying new technologies; it also entails organizational cooperation and governance mechanisms. Construction projects typically involve multiple stakeholders, including owners, designers, contractors, suppliers, and, more recently, digital service providers, who must integrate their information and resources effectively throughout the project lifecycle [
4]. Historically, poor cooperation has been a major impediment in construction, often cited as a key factor in project failures. While information and data-sharing platforms do enhance collaborative feasibility, they also magnify problems like information asymmetry and misaligned incentives. In the absence of effective oversight, any actor controlling “private information” or critical resources can prevent others from validating performance, thereby creating moral hazard [
5]. Existing research indicates that moral hazard is particularly common in the construction sector under conditions of asymmetric information, often accompanied by adverse selection and opportunistic behavior [
6]. It follows that, without robust governance mechanisms, digital initiatives can fall prey to the same pitfalls of unverified claims and free-rider behaviors.
Such issues of moral hazard and information asymmetry become even more pronounced in the context of digital transformation. For example, a contractor may hesitate to invest in new tools, worrying that service providers could overstate technical capabilities or shirk responsibilities; conversely, service providers might be reluctant to commit resources if they suspect the contractor cannot fulfill their cooperative promises. If incentive mechanisms are poorly designed, parties may try to “free ride”, ultimately blocking genuine digital cooperation. It follows that individual actions alone cannot propel industrial upgrading; only by overcoming the traditional multi-stakeholder game dilemma—building robust cooperation protocols and data-sharing platforms—can construction digitalization be truly achieved [
7].
In response to these cooperation challenges, academic research has increasingly explored multi-party governance and incentive strategies. For example, certain studies have applied game theory or evolutionary game models to investigate how government subsidies can spur firms’ digital adoption, showing that the effect is nonlinear and only exceeds a given threshold if strong incentives are present [
8]. Other scholars have integrated service providers into their game frameworks, finding that a provider’s cost structure and incentive design can significantly affect equilibrium outcomes [
1]. Moreover, directing performance evaluations or subsidies specifically toward service providers can help small and medium-sized contractors embrace digital transformation more quickly [
9]. Overall, however, systematic analyses of three-party interactions among government, contractor, and service providers, especially regarding incentive misalignment and moral hazard, remain limited. Most existing models focus on either government–enterprise or enterprise–enterprise dyads, lacking an integrated view of three-party dynamic games [
2].
This raises the following key questions: How can service providers be effectively incorporated into the digital cooperation framework to play a proactive role? What level and type of government intervention is required to achieve maximum cooperation benefits within limited investment? How can a stable, sustainable incentive mechanism be designed so that all stakeholders invest in digital transformation for the long term?
To address these issues, this study centers on the strategic interactions among government, construction enterprises, and digital service providers, with the aim of building a framework that merges theoretical depth and practical relevance. Under conditions of bounded rationality, asymmetric information, and misaligned incentives, we employ an evolutionary game model to clarify the critical mechanisms that underpin the formation and stability of multi-party cooperation.
Unlike previous work that focuses on “owner–contractor” or “government–contractor” relationships, this study is among the first to explicitly treat digital service providers as strategic actors in the construction digitalization game [
6]. Through modeling, we illuminate the pivotal role of service providers in the decision-making chain and their profound impact on overall digital transformation performance.
- 2.
Identifying the “threshold effect” of government intervention.
Our evolutionary analysis demonstrates that government incentives, such as subsidies or tax reductions, have a marked nonlinear effect. Only when policy intensity surpasses a certain “sensitive threshold” do contractors and service providers display significantly higher motivation, leading to a positive feedback loop [
8]. This provides a quantitative basis for policy design, indicating that “moderate intervention” can be more effective than either overly aggressive or overly passive approaches.
- 3.
Proposing a stable multi-party cooperation mechanism.
By exploring equilibrium states within the evolutionary framework, we develop a cooperation mechanism capable of resisting information asymmetry and moral hazard [
2]. This mechanism specifies clear boundaries for cooperation and aligns incentives among contractors, service providers, and governments in digital projects, thus averting failures caused by misaligned interests or partial compliance.
In summary, this research presents a unified analytical approach at the intersection of “digital transformation–multi-party governance–evolutionary incentives”, filling gaps in understanding three-party dynamic games and incentive challenges [
1,
4]. Beyond offering theoretical insights into behavioral obstacles in construction innovation, our findings provide concrete recommendations for government agencies and industry managers seeking to design more targeted incentive policies and governance strategies. In doing so, we aim to promote high-quality development of the construction industry in the digital era. Guided by a “problem–mechanism–method–contribution” progression, we focus on real-world difficulties, delve into underlying behavioral drivers, and propose solutions centered on sustainable cooperation, laying a foundation for further integration of digital construction management theory and practice.
2. Research Background and Current Status
2.1. Challenges of Digital Cooperation in the Construction Industry
The construction sector’s digital transformation has become a key driver of the latest technological revolution and industrial restructuring. Yet, in comparison to other fields, the digital level of construction remains noticeably behind. According to a McKinsey report, the construction industry stands only slightly above agriculture in terms of IT investment and digital maturity, effectively operating at an “Industry 1.0” stage [
10]. This lag largely stems from two factors: Project scale and multiple stakeholders. Construction projects are often vast, involving owners, contractors, designers, suppliers, supervisors, and newly emerging digital service providers. Such a multi-party environment can fragment information flows; combined with differing objectives and interests, it significantly complicates cooperation [
11]. Secondly, industry characteristics and workflow obstacles. Construction products are non-standardized, project cycles are lengthy, and processes are prone to frequent changes or unpredictable site conditions. Consequently, attempts at digital cooperation face disruptions, while “information silos” persist in traditional systems, preventing the effective integration of large volumes of data [
12].
Against this backdrop, the question of how to achieve efficient information exchange and workflow integration in large-scale, multi-stakeholder environments has become a core challenge in construction digitalization. For example, BIM is receiving heightened attention from practitioners and academics alike, providing a digital 3D collaborative platform with the theoretical potential to reduce information discontinuities and enhance the visualization and controllability of design and construction. However, the successful application of BIM goes beyond merely introducing new tools; it requires adherence to cooperation protocols and data standards by all participants [
13]. In a “platform-based” governance model, this implies establishing clear rules for benefit distribution and organizational structures to combat potential information asymmetry and opportunistic behavior [
14,
15]. Without strong external coordination or contractual mechanisms, firms frequently adopt a conservative posture, limiting information sharing and digital investment, and thus preventing any significant gains from cooperation.
2.2. The Evolving Role of Service Providers in the Digital Game
As the construction industry’s digital ecosystem develops, service providers, such as BIM software vendors, platform operators, and IT consulting companies, have risen to prominence in the value chain. Traditionally, technology suppliers in construction projects were often perceived as auxiliary, providing generic software or consulting. Under a “digital construction” paradigm, however, these service providers frequently assume the roles of platform builders and system integrators, with a direct influence on project cooperation levels [
16]. For instance, a major platform vendor might opt for a closed, proprietary format to reinforce its market advantage, contrary to the sector’s broader calls for open, interoperable standards.
Moreover, service providers can steer clients’ technology adoption decisions by various strategies, including pricing, feature updates, or product upgrade cycles. High initial costs or opaque upgrade paths may dampen contractors’ willingness to embrace digital solutions [
17]. From a principal–agent perspective, service providers engaged by owners or contractors also face information asymmetry; for example, they may inflate their capabilities or reduce actual inputs to maximize profit [
18]. When governments entrust digital transformation objectives to large platform operators with a near-monopoly, the risk of “agency failure” similarly arises [
19]. Hence, in analyzing construction’s digital cooperation games, service providers should no longer be viewed as neutral tool suppliers but instead as strategic actors with independent goals and choices.
2.3. Government Intervention and Institutional Evolution
In promoting construction digitalization, governments act as providers and designers of public goods and overarching institutions [
20]. Digital construction standards, data platforms, and so forth often display shared or publicly beneficial characteristics; no single private firm can shoulder the large-scale reforms’ costs and risks alone. Hence, government engagement via policy frameworks, standardization, and industrial coordination is crucial for addressing information asymmetry and externalities [
21]. At the same time, however, a principal–agent dynamic exists between governments and enterprises: whenever public agencies rely on contractors and service providers to implement BIM, IoT, or other digital schemes, the government may lack complete oversight, leading to moral hazards. Firms might claim they are deploying new technologies yet fail to do so effectively [
19]. Accordingly, governments must design a rational blend of incentives and penalties to guide both enterprises and service providers toward desired collaborative behaviors. In practice, government-led institutional change often proceeds incrementally [
22], introducing pilot projects, technical standards, funding supports, etc., to gradually add new institutional layers to the conventional system.
Global experience confirms that government involvement is pivotal to the success or failure of digital reform in construction. For example, the UK established a BIM Level 2 roadmap in 2011 and mandated BIM for all central public projects by 2016; Singapore, Norway, and other countries similarly employed official standards and subsidies to accelerate BIM adoption. These examples show that clear digital standards, paired with financial and managerial support, can synchronize project participants toward cooperation relatively quickly. Conversely, certain cases, like Korea, illustrate that merely relying on top-down mandates without sufficient capacity-building and technical assistance can lead to “token” policies or negligible outcomes [
23,
24]. Where ongoing government support is absent, digital implementation often remains patchy or even chaotic.
Although both government authorities and industry stakeholders widely recognize the importance of driving digital transformation, theoretical and empirical research still presents gaps: First, insufficient focus on service provider incentives. Much research centers on government incentives directed at enterprises, overlooking the fact that digital service providers are also critical targets for stimulus. Their profit motives and technology pathways can powerfully influence overall digital performance. Without exploring their behavior patterns more deeply, one cannot adequately interpret potential platform monopolies or closed standards and their effect on overall cooperation. Second, there is a lack of a three-party interaction framework. Most game-theoretic analyses focus on a government–enterprise or an owner–contractor dyad, leaving the dynamics among government, enterprises, and service providers largely unexplored. This hinders an understanding of how moral hazard and misaligned incentives propagate in more complex multi-actor settings. Finally, limited quantitative analysis of path dependence and dynamic policy impacts. There remains a shortage of dynamic evaluation methods examining how “reward–penalty” policies affect digitalization over time, especially the distinct roles subsidies and penalties may play at various evolutionary stages.
To tackle these issues, the present research proposes an evolutionary game-based analytical framework incorporating government, contractor, and service providers within a single model, which includes explicit reward–penalty mechanisms. By constructing a payoff model and the related replicator dynamics under incomplete information, we aim to uncover how strategic choices evolve and how equilibrium forms in multi-stakeholder contexts. This model provides the theoretical foundation for subsequent simulation and case analysis, eventually guiding the design of improved governance and incentive systems for effective construction digitalization.
2.4. Comparative Overview of Evolutionary Game Research
To highlight how our model advances the state of the art, we compare several key studies on evolutionary game theory in construction digitalization. Most existing research focuses on two-party interactions (e.g., government–contractor or contractor–contractor) and sometimes overlooks the service-provider dimension as well as partial-cooperation strategies.
Table 1 contrasts representative works in terms of scope, key features, and major findings, while indicating how our three-party model addresses remaining gaps.
In summary, while these prior studies make important contributions, particularly regarding two-party incentive alignment or occupant-focused retrofitting [
25,
26,
27,
28,
29,
30,
31], they often omit the strategic dimension of specialized service providers or treat them as passive subcontractors. Many also assume a binary all-or-nothing adoption, neglecting partial cooperation and multi-level synergy among different participants. Furthermore, the government’s role is frequently simplified to a single subsidy variable, overlooking dynamic penalty or regulatory oversight effects.
Our three-party evolutionary game framework addresses these gaps by the following:
Modeling governments, contractors, and service providers as independent decision-makers with distinct cost–benefit structures and potential moral hazard.
Introducing partial-cooperation payoffs that capture “intermediate” or “selective” digital solutions.
Incorporating synergy thresholds and subsidies–penalties interplay that can tip the system between a low-level equilibrium and full-scale adoption.
Treating information asymmetry explicitly through incomplete information assumptions enables us to study moral hazard across all three actors.
This integrated, three-party perspective lets us reveal evolutionary pathways and synergy effects not evident in two-actor or purely binary adoption models. As a result, the model can better explain under what policy conditions service providers and contractors choose to invest, and how government incentives influence the entire digital construction ecosystem.
3. Model Design
To analyze how government, contractor, and technology service providers evolve their strategies for digital cooperation in construction projects, this section develops an evolutionary game model under incomplete information, incorporating moral hazard and the possibility of “partial cooperation”. We first define the main assumptions and parameters, then present the payoff matrix for the three-party game, laying the groundwork for subsequent analyses of evolutionary stability.
3.1. Model Assumptions
Assumption 1: This study focuses on a three-party system with evolutionary game characteristics, involving governments, contractors, and service providers. All participants exhibit bounded rationality and iteratively adjust strategies based on achieved payoffs and experiences. Because the government cannot directly observe the true effort levels of contractors and service providers, information asymmetry is inevitable; only by incurring regulatory costs and conducting inspections does the government have a certain probability of detecting noncompliant actions. Such incomplete information creates room for moral hazard to arise. In this model, interactions among government, contractor, and service providers involve more than just a typical regulator–regulated relationship; they also encompass multiple instances of information asymmetry and potential moral hazard. To illustrate each actor’s role, possible strategy choices, and the flow of information and incentives between them,
Figure 1 presents a conceptual schematic. In the figure, rectangles depict the government’s options (regulate or not regulate), the contractor’s options (full cooperation, partial cooperation, or noncooperation), and the service provider’s options (high-level support, partial support, or no support). Arrows show the bidirectional exchange of resources or information and the moral hazard caused by information asymmetry. This visualization helps the reader quickly grasp how, under digital transformation, each party faces potential hidden behaviors or unverified claims (e.g., the government’s inability to fully observe contractors’ and service providers’ actual input, or the contractor’s limited knowledge of service providers’ technical quality). Later sections employ this conceptual framework when building an evolutionary game model to quantify each party’s payoffs and risks, incorporating penalties and subsidies as incentives [
32].
Assumption 2: Government has a strategy set
. Regulate indicates that the government enforces strict oversight of digital cooperation and pays the associated regulatory costs. Not regulate implies a laissez-faire policy, with no direct inspection of contractors’ or service providers’ actions. Contractor has a strategy set
. Cooperate means the contractor fully implements digital cooperation (e.g., using BIM comprehensively and improving processes). Partially cooperate implies only limited adoption of digital strategies, thus reducing investment. Not cooperate indicates rejecting or superficially complying with digitalization demands. Service provider has a strategy set
. Cooperate signifies offering high-quality, comprehensive technical support. Partially cooperate means providing a narrower scope of services or low-effort development. Not cooperate indicates essentially no active support. Introducing a “partial cooperation” strategy allows us to capture real-world scenarios in which stakeholders lie between full cooperation and outright defection, including behaviors driven by moral hazard [
33,
34].
Assumption 3: If both contractor and service providers choose to cooperate, the maximal additional benefit is created: the government gains
BG (e.g., enhanced social/economic outcomes), the contractor gains
BC (e.g., better efficiency and quality), and service providers earn
BT (e.g., brand equity or potential future contracts). When only one party fully cooperates while the other partially cooperates, total benefits are scaled by a factor
α . If both sides only partially cooperate, that fraction drops further to
. If any party opts not to cooperate, the digital cooperation’s added value is effectively zero [
35].
Assumption 4: Without digital implementation, contractors earn a baseline profit, PC. Choosing cooperate requires the contractor to cover a digital transformation cost CC (e.g., training, process reengineering), but yields a benefit of BC, αBC, βBC, or 0, depending on the service provider’s cooperation level. Partial cooperation lowers the contractor’s actual cost to θCCC , reflecting only a limited level of effort. Noncooperation eliminates the cost but also forfeits potential gains. Under government regulation, if a contractor is caught not cooperating, it faces a penalty FC.
Assumption 5: The service provider’s baseline payoff is PT, representing typical contract revenue. Fully cooperating entails a high cost CPE for developing and offering robust solutions, offset by an additional gain BT if cooperation is successful. Partial cooperation cuts cost to θT CPE but also lowers achieved benefits to αBT or βBT. Not cooperating bears no cost and yields no extra benefit. In a regulated environment, a service provider caught not cooperating is penalized FT.
Assumption 6: Government regulation (regulate) requires the government to pay an oversight cost Cg. Although the government can penalize noncompliance (via FC, FT) or detect opportunism, the actual detection also depends on λ1 (contractor’s detection of provider’s cheating) and λ2 (provider’s detection of contractor’s cheating). If a party is discovered to be noncooperative, the corresponding penalty is imposed. No regulation (not regulate) means the government invests no oversight cost (Cg = 0) and undertakes no direct inspections, effectively allowing any opportunistic behavior to go unpunished, thereby creating additional moral hazard.
Table 2 below summarizes the primary parameters. Information asymmetry and moral hazard arise especially when there is little or no regulation. In such circumstances, both contractors and service providers may be motivated to choose
not cooperate or
partial cooperation, seeking short-term profit without any immediate punitive consequence. This erodes the overall effectiveness of digital cooperation.
These parameters build upon the baseline model in
Table 1, allowing us to explore richer scenarios such as varying intensities of government support, partial cost reimbursements, and multi-tier regulatory structures, while preserving the core framework of costs, benefits, and fines defined here.
3.2. Model Parameters and Data Sources
Given these assumptions, we can derive the expected payoffs for the government, contractor, and service provider under different strategy combinations.
Table 3 below presents the payoff matrix, demonstrating how each actor’s decision (cooperate vs. not cooperate) affects their overall payoffs under varying strategy combinations.
Although assumptions 2–4 acknowledge a “partial cooperation” option for contractors and service providers, our replicator analysis ultimately uses a binary (cooperate/not cooperate) model. We do this for two reasons:
Analytical Focus: A 3 × 3 × 2 payoff matrix becomes substantially more complex, making closed-form solutions and stability proofs difficult to manage within this study.
Transitional Nature of Partial States: Empirical observations often reveal that “partial cooperation” is more of a short-lived transition than a stable end state in digital adoption. Either incentives eventually drive stakeholders toward full cooperation, or cost–benefit mismatches push them back to noncooperation.
A brief internal test using a 3 × 3 × 2 matrix confirmed that partial-cooperation equilibria tend to be unstable or transient, ultimately reverting to “cooperate” or “not cooperate”. Hence, focusing on binary strategies does not materially distort final stability findings. Future work could further explore multi-level strategies, but in this paper, the binary approach adequately captures the critical dynamics and stable outcomes of digital collaboration in construction.
4. Model Analysis
Building on the three-party evolutionary game framework proposed in the preceding section, encompassing governments, contractors, and service providers, this section explores how each actor’s strategy evolves in the context of construction digitalization and examines the properties of potential equilibria. We begin by clarifying key parameters that capture the costs, benefits, and incentives each actor faces, thereby ensuring our evolutionary model aligns with real-world conditions.
First, we estimate the contractor’s digital adoption cost (
CC) based on local pilot studies and industry surveys. In many reported BIM or digital tool deployments, adopting advanced technologies entails 0.3–1.0% of the total construction budget, covering licenses, training, and process upgrades [
36,
37]. To avoid extremes, we set
CC at around 0.5% of the budget in our baseline scenario, representing a moderate case. Next, we specify a 10% subsidy (
λ1 = 0.10) for contractors under the government’s “Active Promotion” policy, reflecting municipal documents that typically offer 5–15% rebates. By selecting 10%, our baseline scenario implies a realistic yet not overly generous level of government support.
From the service provider’s perspective, the model distinguishes between offering a “basic” digital service and an “advanced system solution.” Consistent with prior R&D studies, developing a fully integrated platform often costs several times more than minimal functionality. We therefore set the ratio of system cost () to basic cost () at approximately 3.5:1. Additionally, the government may partially subsidize this system development at a rate of μ = 0.20, mirroring policy trials in which local authorities co-fund innovative platforms to lower market-entry barriers.
Regarding government gains, we adopt a simplified approach. Let BG denote the social or economic benefit achieved if both the contractors and service providers fully cooperate, such as efficiency improvements and resource savings. In our baseline design, we index BG at roughly a 6% productivity gain, aligning with typical sector estimates. We also incorporate parameters for higher-level rewards and penalties—BG2 and PG—since local officials may receive incentives or face sanctions based on project performance. Varying these parameters later allows us to see how institutional pressures influence the government’s willingness to regulate.
In the following subsections, we formulate payoff functions for binary strategy choices (cooperate vs. not cooperate) and derive the replicator dynamics. These steps enable us to investigate equilibrium outcomes and policy implications. It should be noted that some of the parameters introduced here, such as
λ1,
μ,
BG2, and (
/
), extend the foundational model outlined in
Section 3. While we retain the core variables for government cost (
Cg), contractor profit (
PC,
BC,
CC), and service provider payoff (
PT,
BT,
CT), these additional terms capture more nuanced real-world mechanisms (e.g., differentiated subsidies, advanced-service R&D expenses, or higher-level government feedback). Through this expanded parameter set, we aim to examine a broader range of scenarios and derive more comprehensive insights into sustaining digital cooperation among governments, contractors, and service providers.
4.1. Model Assumptions and Payoff Functions
In this section, we formalize the three-party evolutionary game by detailing (1) each player’s strategy set and underlying assumptions, (2) the payoff functions for different strategic choices, and (3) how these payoffs are used to construct the expected utilities in the evolutionary model. The three players—governments G, contractors C, and service providers T—each face a binary decision: cooperate or not cooperate. Although many advanced technologies (e.g., BIM and IoT) could be considered, our framework abstracts them into a generic “digital solution,” capturing the idea that cooperation requires investment or effort, whereas noncooperation avoids immediate costs but may forgo long-term benefits. To facilitate analysis, we adopt a simplified binary strategy framework in this section. Each group—governments, contractors, and service providers—chooses either “cooperate” (actively invest in digitalization) or “not cooperate” (abstain or only nominally engage). The key assumptions are as follows:
4.1.1. Strategy Sets and Basic Assumptions
All players are assumed to be boundedly rational, updating their strategies based on observed payoffs rather than instantly optimizing in a fully rational sense. Over repeated interactions or continuous time, they gradually adopt the strategy offering a higher expected return.
- 2.
Binary Strategies.
Government (z): Regulate (cooperate): Enforces digital construction standards, provides subsidies/penalties, and incurs an oversight cost. Not Regulate (not cooperate): Remains passive, avoiding enforcement costs but also losing potential social benefits.
Contractor (x): Cooperate (adopt digital): Invests in digital solutions, paying technology/training costs but potentially gaining productivity or financial rewards. Not Cooperate (traditional): Uses conventional methods, saving on digital costs yet missing out on efficiency gains or incentives.
Service Providers (y): Cooperate (offer advanced system): Allocates resources to develop and deliver comprehensive digital services, expecting higher returns if the contractor adopts. Not Cooperate (basic or no service): Avoids R&D expense, thus reducing risk but limiting the value it can capture from digital solutions.
- 3.
Payoff Components.
Each player’s total payoff depends on a combination of direct costs (e.g., capital expenditure, R&D), subsidies or tax incentives (e.g., λ1I1, λ2I2), opportunity gains (e.g., synergy from cooperative adoption), and penalties if certain conditions are breached. In the following subsections, we denote each player’s payoff from cooperating vs. not cooperating with explicit expressions.
4.1.2. Contractor’s Payoff
Let the contractor’s two strategic options be to cooperate with digitalization or not to cooperate. The following are denoted:
U11: Contractor’s expected payoff when it chooses to cooperate.
U12: Contractor’s expected payoff when it chooses not to cooperate.
U1: Contractor’s average payoff in the population, mixing both strategies.
To capture different outcomes depending on the service provider and government behavior, we incorporate probabilities
y (the fraction of providers cooperating) and
z (the fraction of governments regulating). The contractor’s cooperate payoff
U11 is shown in Equation (1):
where
PC represents the contractor’s baseline revenue,
BC is the additional digital-related gain,
CC is the digital adoption cost,
BC,syn is an optional synergy benefit, and
λ1I1 indicates possible subsidies from the government.
When the contractor opts not to cooperate, its expected payoff
U12 changes accordingly (Equation (2)):
Here,
Fc,
λ2I2,
K2 represent potential penalties, financing costs, or opportunity offsets relevant to not adopting. The average payoff
U1 (Equation (3)) is a weighted sum of
U11 and
U12, where
is the fraction of contractors choosing to cooperate:
4.1.3. Service Provider’s Payoff
Similarly, let the service provider’s strategy be “cooperate” (offer a high-level digital solution) vs. “not cooperate” (basic or no service). The following are denoted:
U21: Payoff if a provider chooses to cooperate.
U22: Payoff if it chooses not to cooperate.
U2: Average payoff among providers.
When a large fraction
x of contractors adopt digital and a fraction
z of governments regulate, cooperating service providers may gain both the direct revenue from advanced services and potential government subsidies. Equation (4) gives
U21:
where
PT is the provider’s baseline payoff,
BT is the extra gain from delivering advanced solutions,
CT is the cost to fully cooperate, and
λ2I2 denotes government subsidies for providers. If the provider does not cooperate, Equation (5) yields
U22:
Here,
FT represents a possible penalty for noncooperation (e.g., failing certain platform standards),
λ1I1 or
λ2I2 might appear depending on how incentives or financing cross-impact the provider’s payoff, and
K1 could be an opportunity gain or offset. The average payoff for service providers is as follows:
4.1.4. Government’s Payoff
Lastly, the government’s strategies are “regulate” vs. “not regulate.” The following are denoted:
U31: Government’s payoff if it regulates.
U32: Government’s payoff if it does not regulate.
U3: Average payoff among government entities.
When regulating, the government incurs an oversight cost
Cg but may achieve social benefits or synergy from successful digital adoption. Equation (7) shows
U31:
where
BG represents the global or social gain if all parties fully cooperate,
FC and
FT are fines imposed on the contractor or provider, respectively, and
Cg is the government’s regulation cost. If the government does not regulate (Equation (8)):
assuming that without regulation, the government neither incurs cost nor reaps additional benefit. The government’s average payoff is as follows:
4.1.5. Summary and Link to the Evolutionary Model
By defining
U11,
U12, …,
U31, and
U32, and the average payoffs
U1,
U2, and
U3 as above, we fully specify each actor’s cost–benefit structure under different strategy combinations. These payoffs then feed into the replicator dynamics (detailed in
Section 4.2), where
If cooperating yields a higher payoff than the population average, the proportion of cooperators in that population increases over time, and vice versa.
Setting identifies all potential equilibria (including pure strategies like and any mixed-strategy interior points).
In subsequent sections, we derive these equilibria, examine which parameter conditions (e.g., cost thresholds, subsidy levels) favor cooperation vs. defection, and analyze stability via the Jacobian matrix or small-perturbation arguments. This approach clarifies the evolutionary pathways that lead to full digital collaboration, partial engagement, or stagnation.
4.2. Evolutionary Game Model and Replicator Dynamics
Building on the expected payoffs derived in
Section 4.1—specifically, the contractor’s {
U11,
U12,
U1}, service provider’s {
U21,
U22,
U2}, and government’s {
U31,
U32,
U3}—we now formalize the evolutionary game among the three parties (government, contractor, and service providers). Each party is represented by a population of decision-makers, and within each population, the fraction choosing “cooperate” (versus “not cooperate”) evolves over time according to the replicator dynamics.
4.2.1. Strategy Fractions and Notation
Denote by: the fraction (or probability) of contractors who choose to cooperate (i.e., adopt a digital solution). the fraction of service providers who choose to cooperate (i.e., offer advanced or high-level digital services). the fraction of government entities (or government decision instances) that choose to regulate (i.e., actively promote and oversee digital implementation).
The complementary fractions (1 − x), (1 − y), and (1 − z) represent those who choose “not cooperate”, “basic service”, or “not regulate”, respectively. Over time, if a given strategy yields higher-than-average payoff for its population, that strategy’s share increases; conversely, it decreases if it underperforms the average.
4.2.2. Replicator Equations
In evolutionary game theory, replicator dynamics provide a canonical way to describe how strategies spread or diminish in a population based on payoff feedback. For each population (government, contractor, service provider), we define the following:
Since
U11 is the contractor’s payoff when cooperating, and
U12 is the payoff when not cooperating, the average payoff for contractors in the population is
U1. The replicator dynamic states that the fraction of contractors choosing to cooperate evolves as follows:
When , the strategy “cooperate” is performing better than the population average, so x grows.
When , “cooperate” underperforms, so x declines.
When , there is no net change in x.
Equivalently, some formulations use . In practice, both forms capture the essence of strategy imitation or adoption based on relative payoffs.
- 2.
Service Provider Replicator
Let
U21 be the service provider’s payoff for cooperation, and
U22 be for noncooperation. With
, the replicator equation for the service provider’s cooperating fraction
y is as follows:
If advanced digital services (U21) yield a higher return than the average payoff U2, the proportion y of cooperating providers increases.
- 3.
Government Replicator
For the government population, let
U31 be the payoff when regulating, and
U32 when not regulating. The average payoff is
. The replicator dynamic for
z, the fraction of regulators, is as follows:
Active regulation spreads if
; otherwise, the fraction
z declines. Because
, the state of the system at any time
t can be represented as
. An evolutionary equilibrium (or stationary state) occurs where
That is,
in a more compact notation. Solving these conditions determines the candidate equilibria. The subsequent stability analysis (
Section 4.3) will tell us which of these equilibria are evolutionarily stable strategies (ESS) or which are unstable or saddle points.
4.2.3. Intuitive Interpretation
If “cooperate” yields a higher payoff than the average for a given actor type (contractor, provider, or government), that actor type shifts toward cooperation over repeated interactions.
If “not cooperate” is more profitable, the population share of noncooperators grows.
Positive feedback can arise when a critical mass of cooperating players reinforce each other’s payoffs, leading to a self-reinforcing loop toward high-cooperation (e.g., ).
Insufficient incentives or excessive costs can trap the system in low-level cooperation (), unless external policy pushes it beyond a threshold.
4.2.4. Potential Equilibria
By setting , up to nine possible equilibria can emerge:
Eight corner (pure) strategy profiles: .
One mixed-strategy equilibrium is
, if it exists, where each actor is indifferent between cooperating and not cooperating. In
Section 4.3, we will explore the stability of each equilibrium by examining local perturbations. Typically, corner solutions like
or
can represent stable states of universal defection or universal cooperation, respectively, depending on the payoff parameters. Partial corners (e.g.,
) may also be stable if, for instance, the contractor does not find cooperation viable, but the government and providers do. The interior mixed equilibrium
often serves as a saddle or threshold; small deviations may drive the system toward one of the corner equilibria, reflecting a “critical mass” effect in digital adoption.
4.3. Equilibrium Analysis and Stability
Having established the replicator dynamics, we now examine the equilibrium points of the evolutionary game among government (G), contractor (C), and service providers (T) and evaluate which equilibria can be stable or unstable under small perturbations. Following standard procedures in evolutionary game theory, we use a two-step approach: (1) solve to find candidate equilibria; and (2) apply a Jacobian-based local stability analysis (or equivalent criteria) to determine whether each equilibrium qualifies as evolutionarily stable.
4.3.1. Candidate Equilibria
Recall from
Section 4.2 that each population’s strategy fraction—
x for contractors,
y for service providers, and
z for government—lies in [0, 1]. Solving the replicator equations
can yield up to nine candidate equilibria:
Eight pure (corner) strategy profiles:
Each combination describes a scenario in which each actor either fully cooperates or fully defects.
- 2.
One possible mixed (interior) equilibrium in . This arises if there exists an interior solution simultaneously satisfying . In other words, each player is indifferent between cooperating and not cooperating. In many evolutionary games, such interior solutions turn out to be unstable or saddle points, but they nonetheless serve as thresholds or tipping points.
Depending on the specific payoff structure (i.e., parameter values in Uij), some or all of these equilibria may appear or merge. For instance, if certain cost–benefit conditions make it impossible for (1,1,1) to balance the replicator equations, then that pure strategy is not an equilibrium.
4.3.2. Local Stability and ESS Criteria
To determine if an equilibrium is evolutionarily stable, we typically need two steps:
Define the system of replicator functions:
We compute the Jacobian J of partial derivatives:
The equilibrium is locally stable (or asymptotically stable) if all eigenvalues of J at that point have negative real parts. If at least one eigenvalue is positive, the equilibrium is unstable or a saddle point.
- 2.
Evolutionarily Stable Strategy (ESS)
In many evolutionary game contexts, local asymptotic stability under the replicator dynamics implies ESS. Formally, an ESS must resist invasion by any small mutant strategy. For simplicity, we focus on local stability as the practical condition for deciding if an equilibrium is robust under small perturbations. Typically, pure-strategy equilibria with negative eigenvalues are ESS candidates; mixed equilibria often fail the ESS criterion unless they meet stricter second-order conditions.
Hence, after enumerating the eight corner points and any interior solution, we check each one’s Jacobian. This can be performed symbolically if the payoff terms Uij are not overly complex, or numerically if we fix parameter values.
4.3.3. Stability Conditions for Corner Equilibria
Consider the corner equilibrium (0,0,0), where no one cooperates. Intuitively, this is stable if no single player has an incentive to deviate to “cooperate” unilaterally. For example, if the contractor’s marginal payoff from adopting digital alone is negative, the provider’s advanced R&D cost is too high, and the government’s net benefit from regulating is less than the oversight cost, then (0,0,0) persists. Symbolically, we might require the following:
If those inequalities hold, each actor sees no benefit in unilaterally cooperating, thus (0,0,0) can be stable. Similar logic applies to (1,1,1); if each actor’s payoff is higher with universal cooperation than with any single defection, (1,1,1) may be stable. Other corners (e.g., (1,0,0), (0,1,1)) reflect partial cooperation scenarios and have analogous conditions.
Table 4 illustrates how one can systematically list each corner’s payoff differences to see if it satisfies local stability constraints.
4.3.4. Mixed Equilibria
An interior (mixed) equilibrium
simultaneously satisfies
This implies each actor is indifferent between cooperating and not, given the current proportions in the other two populations. While mathematically plausible, such points often represent threshold or tipping conditions. Small perturbations typically push the system away from a corner equilibrium. Indeed, in many tri-partite evolutionary games, interior solutions show saddle stability: stable along one manifold but unstable along another. Unless there are strong symmetrical cost/benefit structures or payoff additivity, the interior equilibrium seldom remains an attractor.
Nevertheless, it is worth computing if it exists, to understand the critical mass or synergy threshold. For instance, if , it could imply that once about half the contractors and a majority of service providers commit, the government becomes indifferent and might tip the system into full cooperation if slightly more synergy arises. Hence, the interior solution guides policy design in hitting minimal adoption thresholds that flip the system to a stable cooperation regime.
To make the instability of an interior equilibrium more concrete, consider a simplified numerical example where government regulation cost and contractor/service-provider cost–benefit parameters are tuned to produce a single interior solution . Suppose, for instance, we solve the equilibrium conditions and find an interior strategy mix such that . Numerically simulating the replicator dynamics from initial states near (0.4,0.5,0.6) shows that any minor deviation in one dimension (e.g., a small drop in xxx below 0.4, or in y below 0.5) triggers feedback effects in the other two dimensions, eventually pulling the entire system’s trajectory toward one of the pure-strategy corners, often all-cooperate (1,1,1), all-defect (0,0,0), or a partial-cooperation combination.
4.3.5. Scenario Analysis and Policy Insights
By examining the stability of each equilibrium, we can derive scenario-based interpretations: (1) Low-Level Trap: If (0,0,0) is locally stable under certain parameters (e.g., high cost, low subsidy), the industry remains stuck in minimal digital adoption unless policy changes. (2) Partial Cooperation: If (1,0,0) or (0,1,1) (and so on) are stable, digitalization is adopted by some subset (e.g., the contractor invests but no advanced providers appear, or the provider invests but the government abstains, etc.). The system never reaches a fully integrated environment. (3) Full Cooperation: If (1,1,1) is stable, a “win–win–win” synergy emerges, enabling the entire sector to benefit from digital solutions. Achieving this typically requires each actor’s net payoff from cooperating to exceed that from defecting, pointing to thresholds in cost (Cc, Cp) or required subsidies (α, μ). (4) Mixed Equilibrium: May not be stable in the strict sense, but can shape the critical conditions for cooperation synergy. Policymakers might aim to surpass the adoption ratio x∗, or reduce cost below a certain boundary, to push the system toward universal cooperation.
In this section, we performed the following: Enumerated the potential equilibria (eight pure corners + one interior). Outlined local stability analysis via the Jacobian or direct inequality checks to determine whether each corner is stable, unstable, or a saddle. Discussed the possible presence of a mixed-strategy equilibrium, which typically serves as a tipping point. Provided scenario interpretations that link each stable equilibrium to the underlying cost–benefit parameters, offering insights into how government incentives, contractor demands, and service provider capabilities jointly influence the eventual outcome of digital construction cooperation. In
Section 5, we will complement this theoretical analysis with numerical simulations and sensitivity tests, revealing how varying subsidy rates, cost structures, or synergy parameters can shift the system among these equilibria. Such findings can aid policymakers and industry stakeholders in designing strategies to overcome low-level traps and move the industry toward robust, widespread digital adoption.
5. Evolutionary Game Simulations and Results
To validate the three-party evolutionary game model proposed in the previous sections and to derive practical policy insights, this section presents numerical simulations based on a real-world digital construction pilot project—a regional hospital in Nanjing, China. By simulating how government, contractor, and service providers adapt their strategies over time, we illustrate how varying factors (e.g., subsidies, penalties, financing) may influence cooperation and drive equilibrium outcomes.
5.1. Case Introduction and Parameter Setup
This pilot initiative focuses on constructing a regional hospital over roughly 24 months, extensively integrating BIM and related digital solutions across design, procurement, and construction. Such end-to-end digital collaboration renders the project highly representative of government–contractor–service provider interactions in the construction industry. Local policy documents (e.g., Nanjing BIM Demonstration Project Management Measures [
38]) specify subsidies of 8 RMB/m
2 for the planning/design stage and 4 RMB/m
2 for the construction stage. With a planned floor area of 24,000 m
2, the total government subsidy amounts to CNY 288,000. Should the project fail to meet digital construction standards, the government may cancel these subsidies or impose further penalties on the contractor.
According to official performance reports from the Nanjing Planning and Natural Resources Bureau [
39], oversight costs (inspection, auditing, staff overhead, etc.) for this pilot are estimated at CNY 1.10 million. Without active regulation, the social benefit of such digital initiatives is around CNY 0.94 million. With robust regulation, synergy, and improved resource allocation, social benefits can be elevated to CNY 3.71 million. Under Nanjing’s Government Support Policies for Tech Enterprises [
40], providers offering advanced digital services may receive CNY 50,000 if they willingly undertake the service and CNY 180,000 if they successfully complete it. Noncooperation or cheating can trigger a government penalty of CNY 100,000. Reviewing the project’s technical consulting contracts and broader policy frameworks helped us estimate the R&D costs, potential profits, and fines relevant to the service provider’s strategy decisions.
- 2.
Key Parameter Values
Based on this Nanjing hospital pilot and referencing earlier sections’ payoff structures,
Table 5 collates the principal parameters for government (
Cg,
Rgn,
Rgr,
Sc,
Pc, …), contractor (
Rc,
Rce,
Cc,
Cce, …), and service providers (
Rp,
Rpe,
Cp,
Cpe, …).
These parameter values are grounded in multiple real-world data sources. Specifically, the contractor’s baseline revenue and cost (Rc, Cc) draw on the Nanjing hospital’s bid documents and official cost estimates. Extra digital payoff (Rce) and extra cost (Cce) were inferred from internal feasibility reports and interviews with on-site management, indicating that adopting BIM and related tools could add approximately 2–3% to initial investment but potentially save 5–7% of labor time. The service provider’s revenue (Rp) and extra profit (Rpe) reflect the contractual amounts in the hospital’s technical consulting agreements, while their additional cost (Cpe)—mainly tied to software licenses and R&D—comes from official bids and vendor quotes. Probability values (λ1 and λ2) are estimates, based on local pilot assessments of how effectively parties can detect opportunistic behavior when oversight is moderate to high. Lastly, government cost and benefits (Cg, Rgn, Rgr) rely on published oversight budgets, penalty rules, and policy-based analyses of potential societal gains from full digital adoption. By collecting this information from official files (e.g., “Nanjing BIM Demonstration Project Management Measures”), consulting records, and local policy documents, we aimed to ensure that each parameter reflects realistic project-specific data rather than arbitrary assumptions.
These parameter values are grounded in multiple real-world data sources. Specifically, the contractor’s baseline revenue and cost (
Rc,
Cc) were derived from publicly available tender announcements and feasibility assessments issued by the local Development and Reform Commission (DRC) [
41]. For instance, the bidding documents for the “Nanjing Hospital Jiangbei Digital Facility Management Platform” (Announcement No. NJ-DFMP-2022, published in April 2022) [
41] detail the maximum bid price ranges, core design and construction scopes, and indicative budgets for BIM-related services. In addition, DRC-approved feasibility study reports (e.g., “Ning Fa Gai Tou Zi Zi [2023] No. 19”) [
42] provide official estimates of total capital investments, labor costs, and engineering expenses, ensuring consistency with recognized government data on major public works.
Extra digital payoff (
Rce) and extra cost (
Cce) were then triangulated through further internal feasibility reports and structured interviews with on-site project managers, indicating that introducing BIM and related digital tools can add approximately 2–3% to initial investment but potentially save 5–7% of labor time. This aligns with the fee benchmarks in “Guiding Opinions on BIM Service Charges for Public Construction [
43]” issued by the local Urban–Rural Construction Department, which typically suggest a 2–4% increment in project expenditures for advanced BIM-based services.
The service provider’s revenue (
Rp) and extra profit (
Rpe) reflect the financial provisions set forth in the hospital’s executed BIM consulting agreement (Contract No. NJ-JBHC-BIM-2022-05, dated July 2022) [
44], which outlines milestone-based payments for platform design, implementation, and subsequent training. Their additional cost (
Cpe), primarily tied to specialized software licenses, cloud services, and R&D, was extracted from contract addenda specifying line-item charges for BIM model integration, real-time data analytics modules, and interoperability testing.
Probability values (
λ1 and
λ2) are best estimates from pilot analyses of opportunistic behavior detection conducted by the hospital’s internal oversight team and a municipal inspection office, both of which have monitored compliance during the early phases of digital adoption. These analyses are documented in the “Nanjing Municipal Regulation on Digital Construction Supervision [2021]” [
45], which details standard inspection practices and detection success rates for digital projects. Lastly, government cost and benefits (
Cg,
Rgn,
Rgr) derive from published oversight budgets and penalty schedules within “Nanjing Municipal Budget Circular [2022] No. 14”, [
46] as well as from cost–benefit analyses performed by policy researchers at the Construction Industry Modernization Office.
By collecting this information from official procurement archives, feasibility approval documents, public bid advertisements, and the hospital’s service contracts, we sought to ensure that all parameters reflect realistic project-level data rather than arbitrary assumptions. This approach enhances the validity of our evolutionary game analysis by grounding each cost, payoff, and probability parameter in verifiable sources used in actual digital construction practice.
With these parameter assignments, we anchor the evolutionary model in a realistic scenario. The next sections simulate how government, contractor, and service providers adapt strategies over time, first under a baseline set of assumptions, and then across multiple sensitivity analyses. This process demonstrates how changes in financing support, incentives, or detection probabilities may shift equilibrium outcomes and, ultimately, guide best practices for digital construction policy design.
Although our primary numerical illustration uses data from the Nanjing hospital project, we acknowledge that cost structures and incentive levels can differ markedly across regions and project types.
Table 6 provides an indicative range of key parameters (e.g., baseline contractor cost
Cc, government subsidy
Sc, and advanced service cost
Cpe) under three distinct scenarios: (1) a large-scale public hospital in a high-income country, (2) a privately funded residential complex in a middle-income region, and (3) a PPP infrastructure project such as a railway line. In high-income settings, labor costs and software licenses may significantly exceed our Nanjing benchmarks, potentially doubling or tripling {
Cc,
Cpe}. Conversely, government incentives can be much smaller if public policy does not prioritize digitalization.
Nonetheless, these numerical shifts do not alter our core replicator equations or their conceptual logic; cooperation among government, contractors, and service providers emerges only when each actor’s perceived net payoff outperforms the default strategy. Higher absolute costs primarily raise the threshold for cooperation, whereas more generous incentives can offset these costs. Thus, by plugging in scenario-specific data, local decision-makers could determine how quickly their system might evolve toward stable digital collaboration or remain stuck in partial adoption.
5.2. Parameter Analysis
Based on the evolutionary game model established in
Section 4, we now conduct a series of sensitivity analyses to examine how key parameters, such as contractor detection probability (
λ1), service provider profit (
Ppe), and government subsidies or penalties, influence the dynamic evolution of the system. Specifically, we identify three categories of parameters:
We explore how shifts in these parameters—holding other variables constant—affect the replicator dynamics of (x, y, z), corresponding to the contractor, service provider, and government strategy proportions, respectively.
To ensure clarity and uniformity in all simulation figures, we have normalized the horizontal axis (time) to a dimensionless scale spanning 0.00–2.00. This interval should not be interpreted as literal calendar time, but rather as “replicator cycles” within which strategic proportions evolve. Such a concise 0–2 timescale is commonly used in evolutionary game theory to highlight the crucial early-phase shifts toward (or away from) equilibrium. By adopting dimensionless time, we can more directly compare multiple parameter scenarios, focus on the onset of cooperation dynamics, and avoid arbitrary extensions of the simulation axis.
Notably, all cost- and payoff-related parameters in our simulations appear as decimal or dimensionless values (e.g., 0.95, 1.05, 0.259, and 1.86) rather than absolute monetary units. This stems from two considerations: (1) scaled representation of real-world data: parameters derived from contractor interviews or local feasibility reports are normalized around a baseline value of 1.00; and (2) sensitivity testing: slight deviations (±5%) capture how modest shifts in cost or synergy can tip the equilibrium outcomes. By mapping local currency costs into these normalized forms, we preserve relative proportions (e.g., synergy benefits vs. penalty costs) while avoiding overly large numeric ranges. Hence, decimals like 0.95 or 1.86 reflect ‘95% of a standard synergy cost’ or ‘1.86 times the R&D baseline’, allowing us to demonstrate the sensitivity of replicator trajectories to real yet scaled parameter variations.
5.2.1. Contractor Factors
Figure 2 illustrates how changes in the contractor’s probability of detecting “opportunistic” behavior (
λ1) by the service provider affect the evolutionary trajectories. When
λ1 is relatively small, the contractor quickly adopts a cooperation strategy, while the service provider’s willingness to cooperate and the government’s supervision enthusiasm both rise only gradually, resulting in slower overall convergence. As
λ1 increases, the changes in contractor and government decisions remain less pronounced, but the service provider’s cooperation willingness increases substantially.
In practical terms, λ1 is determined by the contractor’s auditing or supervision capability (e.g., employing specialized BIM oversight tools) and by the moral hazard context. If the contractor fails to discover the provider’s noncompliance, it continues investing out of contractual trust. However, once opportunism is identified, the resulting penalties and technical requirements motivate the contractor to persist in a genuine digital solution, knowing it can punish the provider if cheating is discovered. At the same time, the government’s choice to regulate is also influenced by the presence (or absence) of opportunistic activities, so its supervision willingness gradually climbs. Interestingly, no matter how large λ1 becomes, the contractor and government curves show only mild variation, whereas the service provider’s cooperation ratio steadily increases, underscoring the unique leverage detection capabilities exerted on the weaker or more “hesitant” players in the ecosystem.
- 2.
Contractor Penalty I1 and Compensation I2
Figure 3a,b compares the system’s behavior under varying penalty
I1 vs. compensation
I2 from the contractor to the service provider. As shown in
Figure 2, increasing
I1 initially accelerates the contractor’s cooperation ratio but eventually levels off, though it always remains higher than in the low-penalty baseline. From a business perspective, any penalty the contractor imposes on the service provider can be viewed as a portion of the contractor’s potential revenue or cost offset, meaning that as long as such a punishment mechanism exists, the contractor is strongly incentivized to choose genuine cooperation. Meanwhile, the service provider’s willingness to cooperate also rises with
I1, but the government’s enthusiasm for regulation remains relatively low and is not directly affected by changes in
I1. On one hand, an appropriate penalty level effectively curbs opportunistic behavior among service providers; on the other, because contractor–provider relations do not substantially alter government payoffs, the government’s supervision dynamic does not shift.
Figure 3b indicates that compensation
I2 yields a somewhat similar curve to that of penalty
I1, but the service provider’s cooperation willingness remains at a lower plateau overall. In other words, punitive measures appear more impactful on the service provider’s compliance than do positive incentives. This implies that while compensation does promote cooperation, it may not deter opportunism as forcefully as a well-calibrated penalty. Thus, in practice, the service provider is more sensitive to penalty
I1 than to compensation
I2.
5.2.2. Service Provider Factors
Figure 4 illustrates how changes in the service provider’s probability of detecting opportunism (
λ2) affect the dynamic behavior of the three-party system. When
λ2 remains relatively low, none of the actors’ decisions shift significantly from the baseline, indicating that the provider’s limited oversight capacity has a minimal effect on the overall equilibrium. However, as
λ2 gradually increases, the contractor is motivated to adopt a full digital cooperation strategy more rapidly, aiming to avoid opportunistic exposure or confrontation.
Interestingly, the service provider’s own cooperation willingness ends up exceeding that of the government, despite possibly slower initial changes, suggesting that once the provider has the means to detect a contractor’s noncompliance, it becomes more proactive in sustaining collaboration to protect its interests. In practice, this reflects how a sufficiently capable service provider can influence the contractor to “play fair” and the government to perceive fewer risks in regulating. Conversely, when λ2 is too low, the provider’s concerns are often overlooked, and the contractor may engage in “superficial compliance” without fear of being meaningfully challenged.
- 2.
Extra Profit Ppe
Figure 5 compares system trajectories under different levels of extra profit (
Ppe) available to the service provider for delivering advanced digital solutions. Somewhat unexpectedly, the evolution curves resemble those in the
λ2 scenario, meaning higher
Ppe leads to greater service-provider willingness to engage in complex digital tasks, and, in turn, the contractor also commits more fully, hoping to reap synergy benefits.
The root cause lies in the provider’s downstream position in digital construction: it typically contributes specialized knowledge (e.g., real-time monitoring, integrated platforms), yet historically wields weaker negotiation power. Consequently, if the provider’s additional profit margin is insufficient, it remains in a low leverage position, overshadowed by the contractor’s demands or the government’s top-down directives. Only once Ppe surpasses a certain threshold do the provider’s contributions become more pivotal, thus affecting not just its own strategy but also the contractor’s trust and the government’s regulatory stance. If Ppe remains too low, the provider’s incentives to maintain robust cooperation weaken, risking partial or tokenistic digital adoption.
In summary, service-provider detection probability (λ2) and extra profit (Ppe) both operate as powerful levers for ensuring sustained multi-stakeholder cooperation. However, they require a certain minimum level to exert decisive influence on the contractor’s and government’s decisions; otherwise, the provider’s voice stays marginal, reinforcing an environment of asymmetric project authority.
5.2.3. Government Factors
Figure 6 illustrates how varying government subsidy (
Sc) for the contractor can reshape strategic behavior within the evolutionary game. If
Sc is too low, the contractor faces high up-front costs with minimal offsetting benefits, potentially remaining indifferent or even defaulting to noncooperation to avoid digital overhead. Conversely, overly generous subsidies run the risk of moral hazard or resource misallocation, wherein the contractor superficially invests in digital tools just to secure the funds, without genuinely implementing the technology. Hence, a moderate subsidy regime, enough to cover uncertain digital transformation costs yet not so large as to invite free-riding, typically leads to the most effective cooperation equilibrium.
Meanwhile, adjusting the penalty (Pc) that the government imposes on a contractor for failing to meet digital standards can further accelerate cooperation or deter opportunism. However, if the project’s cost–benefit ratio already favors cooperation, raising Pc beyond a moderate level may yield diminishing returns, since the contractor is already inclined to comply. In practice, calibrating both Sc and Pc prevents a “no-adoption” scenario and channels the contractor into robust digital methods.
- 2.
Higher-Level Penalty (Pc)
Figure 7 examines how a higher-level authority may impose an additional penalty (
PC) on local government if it fails to promote digital adoption effectively. When
PC = 0, local administrators lack external pressure, often hesitating to enforce strict regulations or to make advanced oversight investments. As
PC rises to moderate or high levels, local government strongly favors “active regulation” right from the start, quickly converging on a near-certain regulatory stance. Still, relying solely on top-down penalties can result in superficial or short-term compliance if the higher-level mandate is not paired with adequate resources, technical guidance, or realistic implementation timelines.
Overall, neither subsidies nor penalties should be set too high or too low. In the context of digital construction adoption, a well-targeted Sc ensures that contractors see sufficient incentives to cover uncertain upfront costs, without subsidizing complacency or inviting moral hazard. A moderate Pc (and, at the higher tier, PC) raises the cost of noncompliance, reducing opportunism and pushing contractors (and local governments) toward tangible cooperation. Conversely, excessive penalties may spur token compliance or disrupt established processes, while insufficient penalties may allow free riding. Hence, a balanced approach linking realistic subsidies to cost-effective thresholds and calibrated penalties to meaningful accountability best nudges all stakeholders toward a stable, high-level digital collaboration environment.
Although
Section 5 presents our key results through simulated trajectories, further strengthening the model’s reliability demands empirical cross-validation. Future work could, for instance, collect industry data on BIM (or broader digital) adoption rates, local government subsidy levels, and actual penalty enforcement outcomes. Even partial data, such as a small-scale survey of contractors or historical records of how often noncompliant projects were fined, would enable preliminary checks of the model’s predictive accuracy. Moreover, identifying any divergence between simulated evolution and real adoption patterns would point to possible refinements, such as adjusting cost assumptions or incorporating additional market frictions.
By integrating targeted empirical evidence, we can more confidently verify whether the system-level trajectories observed in our simulations align with real adoption behaviors, thus reinforcing the model’s value in guiding policy and strategy.
6. Discussion
Building on the evolutionary game model and numerical simulations for a Nanjing-based digital construction pilot project, this study systematically explores how government, contractors, and service providers co-evolve their strategies in digital cooperation within the construction industry. Overall, contractors’ decisions about adopting digital approaches are primarily influenced by the net benefits (e.g., improved efficiency, reduced rework, and lower communication overhead) versus the investment costs (software, training, and organizational changes). When digital tools significantly reduce operational inefficiencies, contractors more readily embrace them; otherwise, they tend to remain cautious. Additionally, firms’ risk preferences are critical. Risk-averse managers emphasize near-term cost control, whereas risk-taking managers are more inclined to adopt disruptive innovations. Consequently, to enhance contractors’ enthusiasm for digital transformation, lowering technical barriers, offering targeted training, and establishing pilot demonstrations can provide safer pathways for organizations to achieve potential productivity gains.
From the service providers’ standpoint, strategic behavior depends on market demand and cost structure. If contractor demand is strong and willingness to pay is reliable, providers can invest more in R&D and service quality, benefiting from economies of scale; otherwise, weak demand or high costs may lead them to scale back or exit. Moreover, if providers’ fees become excessively high, contractors’ profitability declines, jeopardizing cooperation stability. In response, service providers may adopt flexible pricing models (e.g., subscription billing and usage-based charges) and offer local technical support to reduce contractors’ up-front burden and facilitate solution customization, an effective route to expanding digital collaboration. Additionally, as noted in
Section 5.2.2, a provider’s detection probability (
λ2) or extra profit (
Ppe) can play a decisive role. When the provider can detect contractor opportunism more easily, or when the provider’s potential reward for advanced services is high, the service provider becomes more proactive and committed, encouraging mutual trust and deterring half-hearted engagement.
The government plays a pivotal role in shaping digital cooperation by designing institutions and incentives. On one hand, public agencies can mitigate firms’ uncertainty about up-front technology investments through subsidies, tax breaks, or financing support. On the other hand, they can set industry standards, impose penalties for noncompliance, and strengthen oversight to raise the cost of deviating from desired practices. When the government remains passive, digitization may stall in a “chicken-and-egg” deadlock, with contractors and service providers each waiting for clearer signals. Conversely, proactive government intervention, backed by robust enforcement, breaks this market failure, steering multiple stakeholders toward mutually beneficial cooperation. International cases (e.g., Singapore, Finland, UK) confirm how mandatory BIM standards, dedicated budgets, or public pilot projects can swiftly boost adoption; in contrast, the US example highlights how demonstration projects combined with organic market forces can likewise be effective. In domestic contexts, a balanced incentive-penalty approach, subsidies, tender scoring advantages, or performance appraisals to reward compliance, alongside audits and punishments to deter noncompliance, often proves most sustainable. Governments can also standardize data protocols, protect intellectual property, and ensure data security to assuage contractors’ fears about unauthorized usage.
From a three-party interaction perspective, underfunded incentives may lock the system into a low-level equilibrium, whereas once policies or market conditions cross a threshold, high-level cooperation emerges. Fair benefit-sharing and robust trust-building are vital to maintaining cooperation; if contractors fear data misuse or providers fail to earn adequate returns, adverse selection and moral hazard can materialize. To counter “free-riding” or “subsidy abuse”, third-party evaluations should quantify digital-cooperation value and distribute gains based on each participant’s contribution. Additionally, building trust in digital construction requires institutional and technical mechanisms that safeguard data-sharing (e.g., drawings, progress plans, and cost data), thus generating substantial knowledge spillovers. Because digital adoption typically unfolds incrementally rather than overnight, periodic feedback meetings, pilot updates, or dynamic subsidy adjustments can help maintain stable cooperation under evolving conditions. These measures are particularly important when providers’ extra payoff (e.g., a government subsidy for advanced services) is significant, ensuring that increased rewards for the service provider translate into genuine digital implementation rather than opportunistic behavior.
Figure 8 displays the contractor’s eventual probability of adopting digital solutions under varying levels of government subsidy
Sc and penalty
Pc. Lighter-colored or higher-valued contours indicate a greater fraction of contractors ultimately cooperating, whereas darker or lower-valued regions reflect scenarios in which cooperation stagnates. As illustrated, a moderate combination of subsidies and penalties often produces a “threshold effect”, beyond which the system can escape a low-level equilibrium and transition toward stable, widespread digital collaboration.
Considering these findings, future research might conduct broader data collection from more diverse projects and stakeholders to validate the external applicability of this evolutionary game approach. It would also be worthwhile to analyze how shifting government subsidies or regulatory models respond to economic shocks (e.g., market volatility, policy changes). Meanwhile, cross-national comparisons could identify which cooperation and BIM-promotion schemes best fit China’s institutional environment, particularly for “Belt and Road” infrastructure projects seeking advanced digital solutions. Overall, government guidance is indispensable, but the proactive engagement of both contractors and providers remains equally crucial. A unified framework—integrating incentives, standards, IP protection, and trust-building—can ultimately drive high-quality and sustainable digital transformation in the construction sector.
Our current analysis focuses on a single Nanjing hospital project, which, while illustrative, may not capture all contexts of digital adoption. Two approaches could substantially broaden the robustness of our results:
Monte Carlo Parameter Sweeps: By systematically varying uncertain parameters, such as government subsidies, contractor detection probabilities, or service provider cost margins, and re-running the evolutionary dynamics, we can observe how frequently the system converges to each equilibrium under realistic perturbations. Demonstrating that the model’s main outcomes remain stable across a wide parameter range would increase confidence in its policy implications.
Contrasting Case Studies: Future work could apply our model to distinct project types, such as a privately financed residential development or a public–private partnership (PPP) transport project, where ownership, profit mechanisms, and regulatory pressures differ markedly from a public hospital build. Observing similar cooperative or noncooperative tendencies under those differing conditions would reinforce the general validity of our evolutionary framework.
These efforts would offer more generalizable policy prescriptions and ensure that our conclusions about digital collaboration equilibria are not overly specific to a single local pilot.
Beyond exploring additional project types and parameter variations, we recognize the importance of empirical validation to substantiate the behavioral assumptions (e.g., bounded rationality and cost/risk perceptions) that underpin our evolutionary game model. Future research can employ systematic interviews, surveys, or focus groups involving contractors, service providers, and government officials directly involved in digital construction initiatives. Such methods would help gauge how decision-makers in practice balance near-term costs, regulatory pressures, and anticipated benefits, and how these perspectives shift according to their roles or project types. Collecting robust stakeholder input not only bolsters the credibility of our theoretical framework but also uncovers context-specific factors that might refine or redirect policy prescriptions. Ultimately, these empirical insights would strengthen confidence in the model’s predictive power and its applicability to diverse settings, ensuring the evolutionary strategies identified in our study align with real-world motivations and constraints.
7. Conclusions and Policy Recommendations
This study addresses issues arising among government, contractors, and service providers, focusing on how information asymmetry and profit-seeking can lead to moral hazard, cooperation (in)stability, and the effectiveness of government incentives. We first developed a three-party evolutionary game model, capturing government–contractor–provider interactions under various incentive and regulatory scenarios, and then proposed strategies to mitigate moral hazard and enhance synergy. In this model, the government shapes decisions via subsidies and penalties, while contractors and providers iteratively adjust their cooperative or deviant strategies according to perceived payoffs and risks. Through mathematical derivation and simulation, we examined equilibrium paths, stability conditions, and the key factors that determine stable outcomes.
Dynamic Adaptation and Path Dependence: When government supervision is absent, contractors and service providers often drift toward short-term opportunism, locking into a low-level equilibrium. Conversely, active government involvement, backed by well-structured incentives, nudges both parties toward collaboration, forming an evolutionarily stable strategy (ESS).
Multiple Equilibria and Parameter Thresholds: Different parameter configurations, ranging from subsidy magnitudes and penalty intensities to payoff increments, can produce drastically different outcomes. Insufficient incentives or low penalties often yield low-level cooperation, whereas stronger intervention or favorable market settings can lead to a high-efficiency equilibrium.
Information Asymmetry as the Core of Moral Hazard: Poorly designed incentives can amplify opportunistic behaviors. If the immediate benefits of “cheating” exceed the expected penalty cost, mismatched strategies proliferate, undermining overall cooperation.
Significant Government Role via Incentives and Regulation: Combining rewards (subsidies) with sanctions (penalties) is more effective than using either instrument alone. Moreover, moderate government supervision substantially shortens the time to reach stable cooperation.
- 2.
Policy Suggestions
For Government: Maintain a balanced mix of positive incentives and negative sanctions, elevating the cost of deviance while growing collective returns. Tie incentives to performance metrics (“more work yields more rewards”) and perform random inspections to detect violations with minimal oversight costs. Develop open information and credit-evaluation systems, regularly disclosing project compliance data so that market reputation can also enforce cooperation.
It is worth noting that these measures can be adapted differently at local (municipal) and national levels. Municipal governments, being closer to the specific constraints of specific projects, may emphasize direct subsidies, frequent on-site checks, and rapid feedback loops (e.g., workforce training programs). Central authorities, in contrast, can establish broader funding channels and data standardization policies to ensure consistent practices and compatibility across regions. By combining targeted local interventions with overarching national regulations and standards, policymakers can more effectively align policy measures with local realities and nationwide strategic objectives.
For Contractors and Service Providers: Form a long-term, incentive-aligned partnership by embedding flexible, performance-based compensation and penalty clauses, ensuring “cooperation pays off, noncooperation gains nothing”. Enhance internal communication and data-sharing, building a high-transparency environment that fosters trust. Contractors should promptly honor rewards for providers and devote necessary resources to digital transformation; providers, in turn, must continually upgrade their technical solutions to remain competitive while sharing risk and returns.
This research has several limitations. First, the model parameters and case study reflect one regional context; other local governance or market environments may demand different assumptions or a broader dataset. Second, we used simplified assumptions (e.g., two-strategy setups, symmetric information gaps, fixed risk preferences), whereas real decisions often feature multi-stage feedback and heterogeneity across actors. Third, our conclusions rely primarily on theoretical derivation and simulation; large-scale empirical validation remains for future work. Extensions might gather longitudinal project data or conduct case-based verifications to test predictive accuracy. Additionally, the approach could be adapted to other domains such as environmental governance or smart-city initiatives involving public–private partnerships, examining how evolutionary game frameworks generalize across different multi-stakeholder settings.
By modeling a three-party (government–contractor–provider) evolutionary game, this study illuminates moral hazard and information asymmetry in multi-stakeholder digital cooperation, offering strategic insights to improve government supervision, incentives, and stable enterprise cooperation. Our results underscore how thoughtful incentive mixes and governance measures can enhance public project efficiency and quality, while also pointing to next steps for scaling up and stress-testing the model in various contexts. As digitization and automation continue to reshape public administration and governance, the interplay among governmental agencies, markets, and tech providers grows more diverse and complex. Refining incentive architectures to achieve a stable “win–win–win” equilibrium thus remains a central challenge for both researchers and practitioners in the digital construction era.


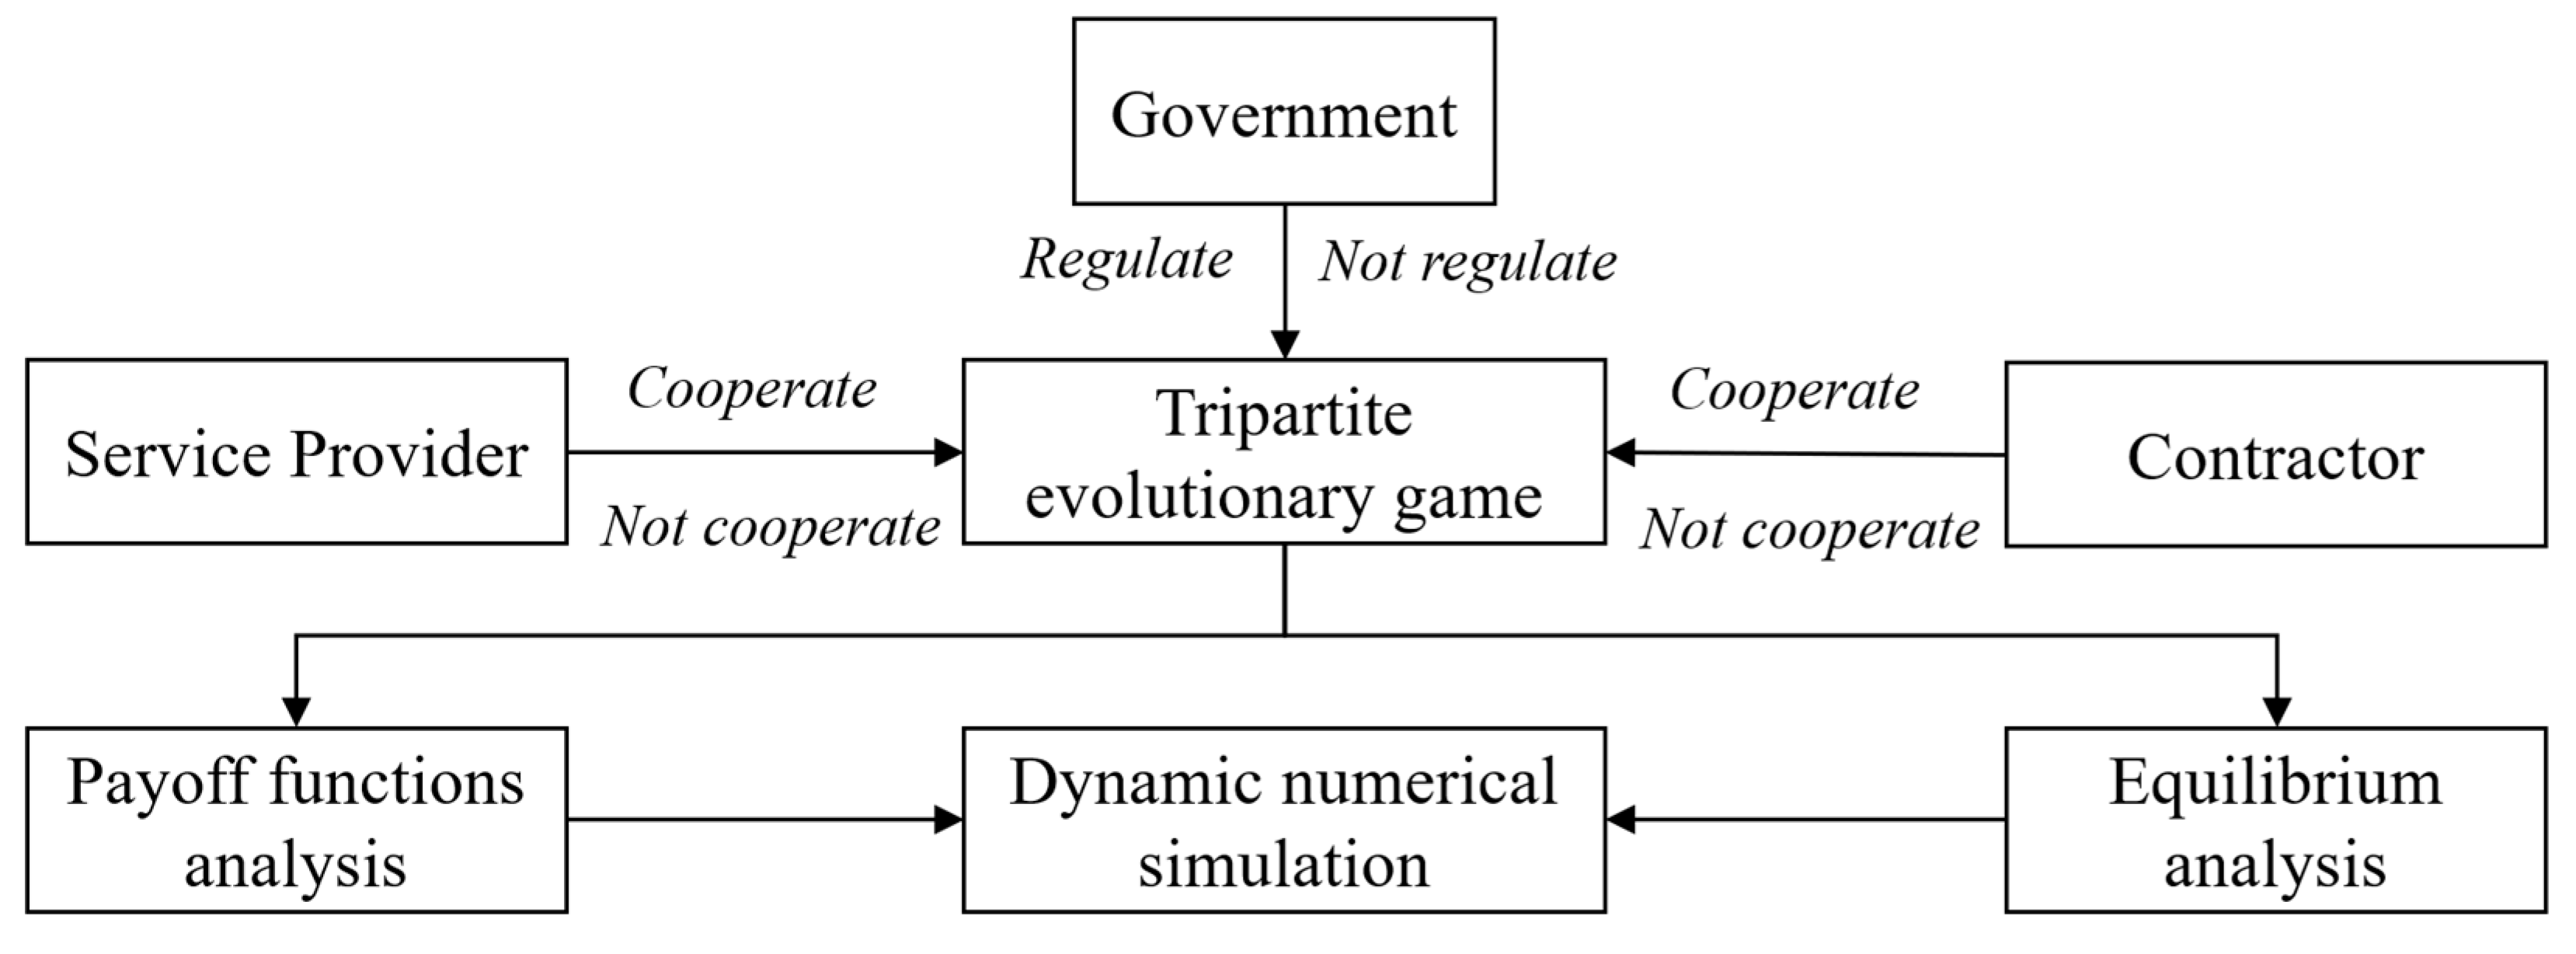
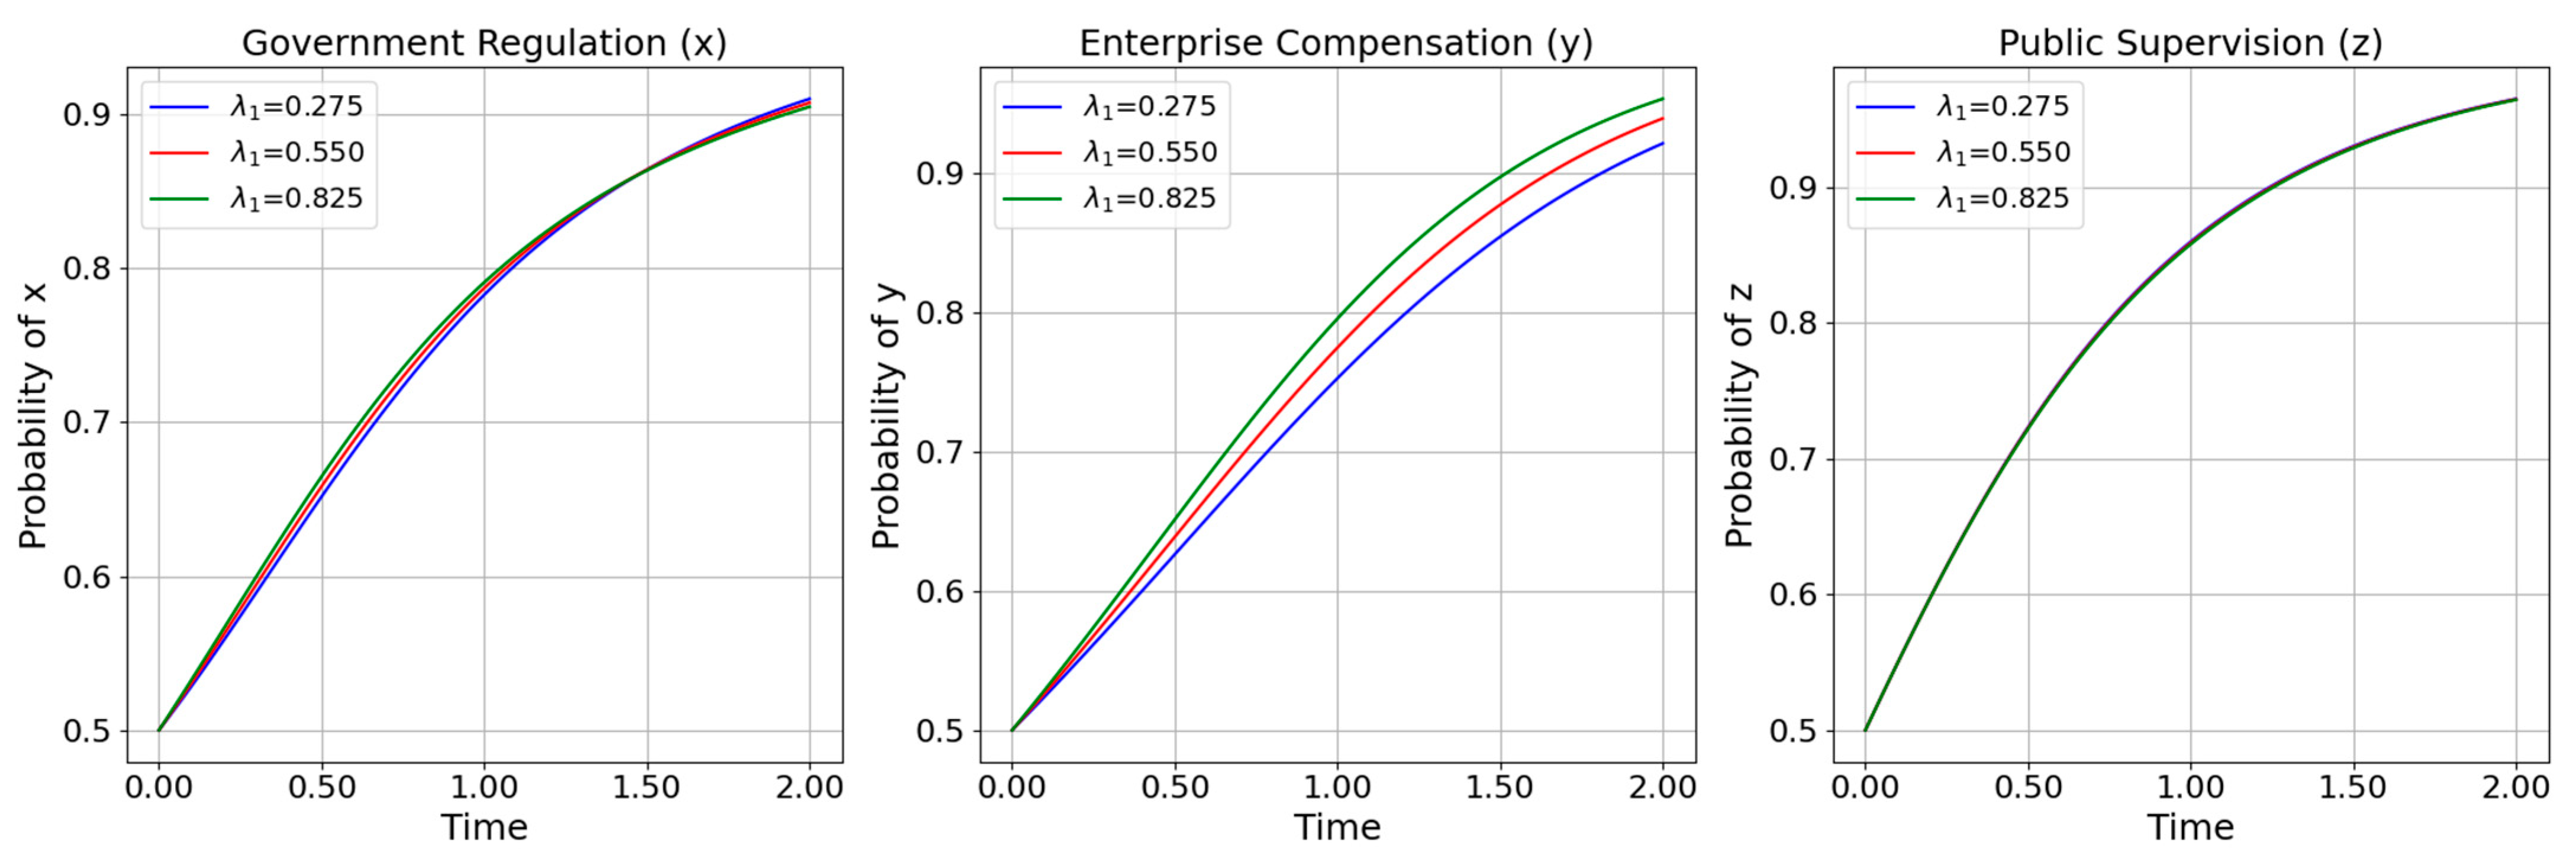

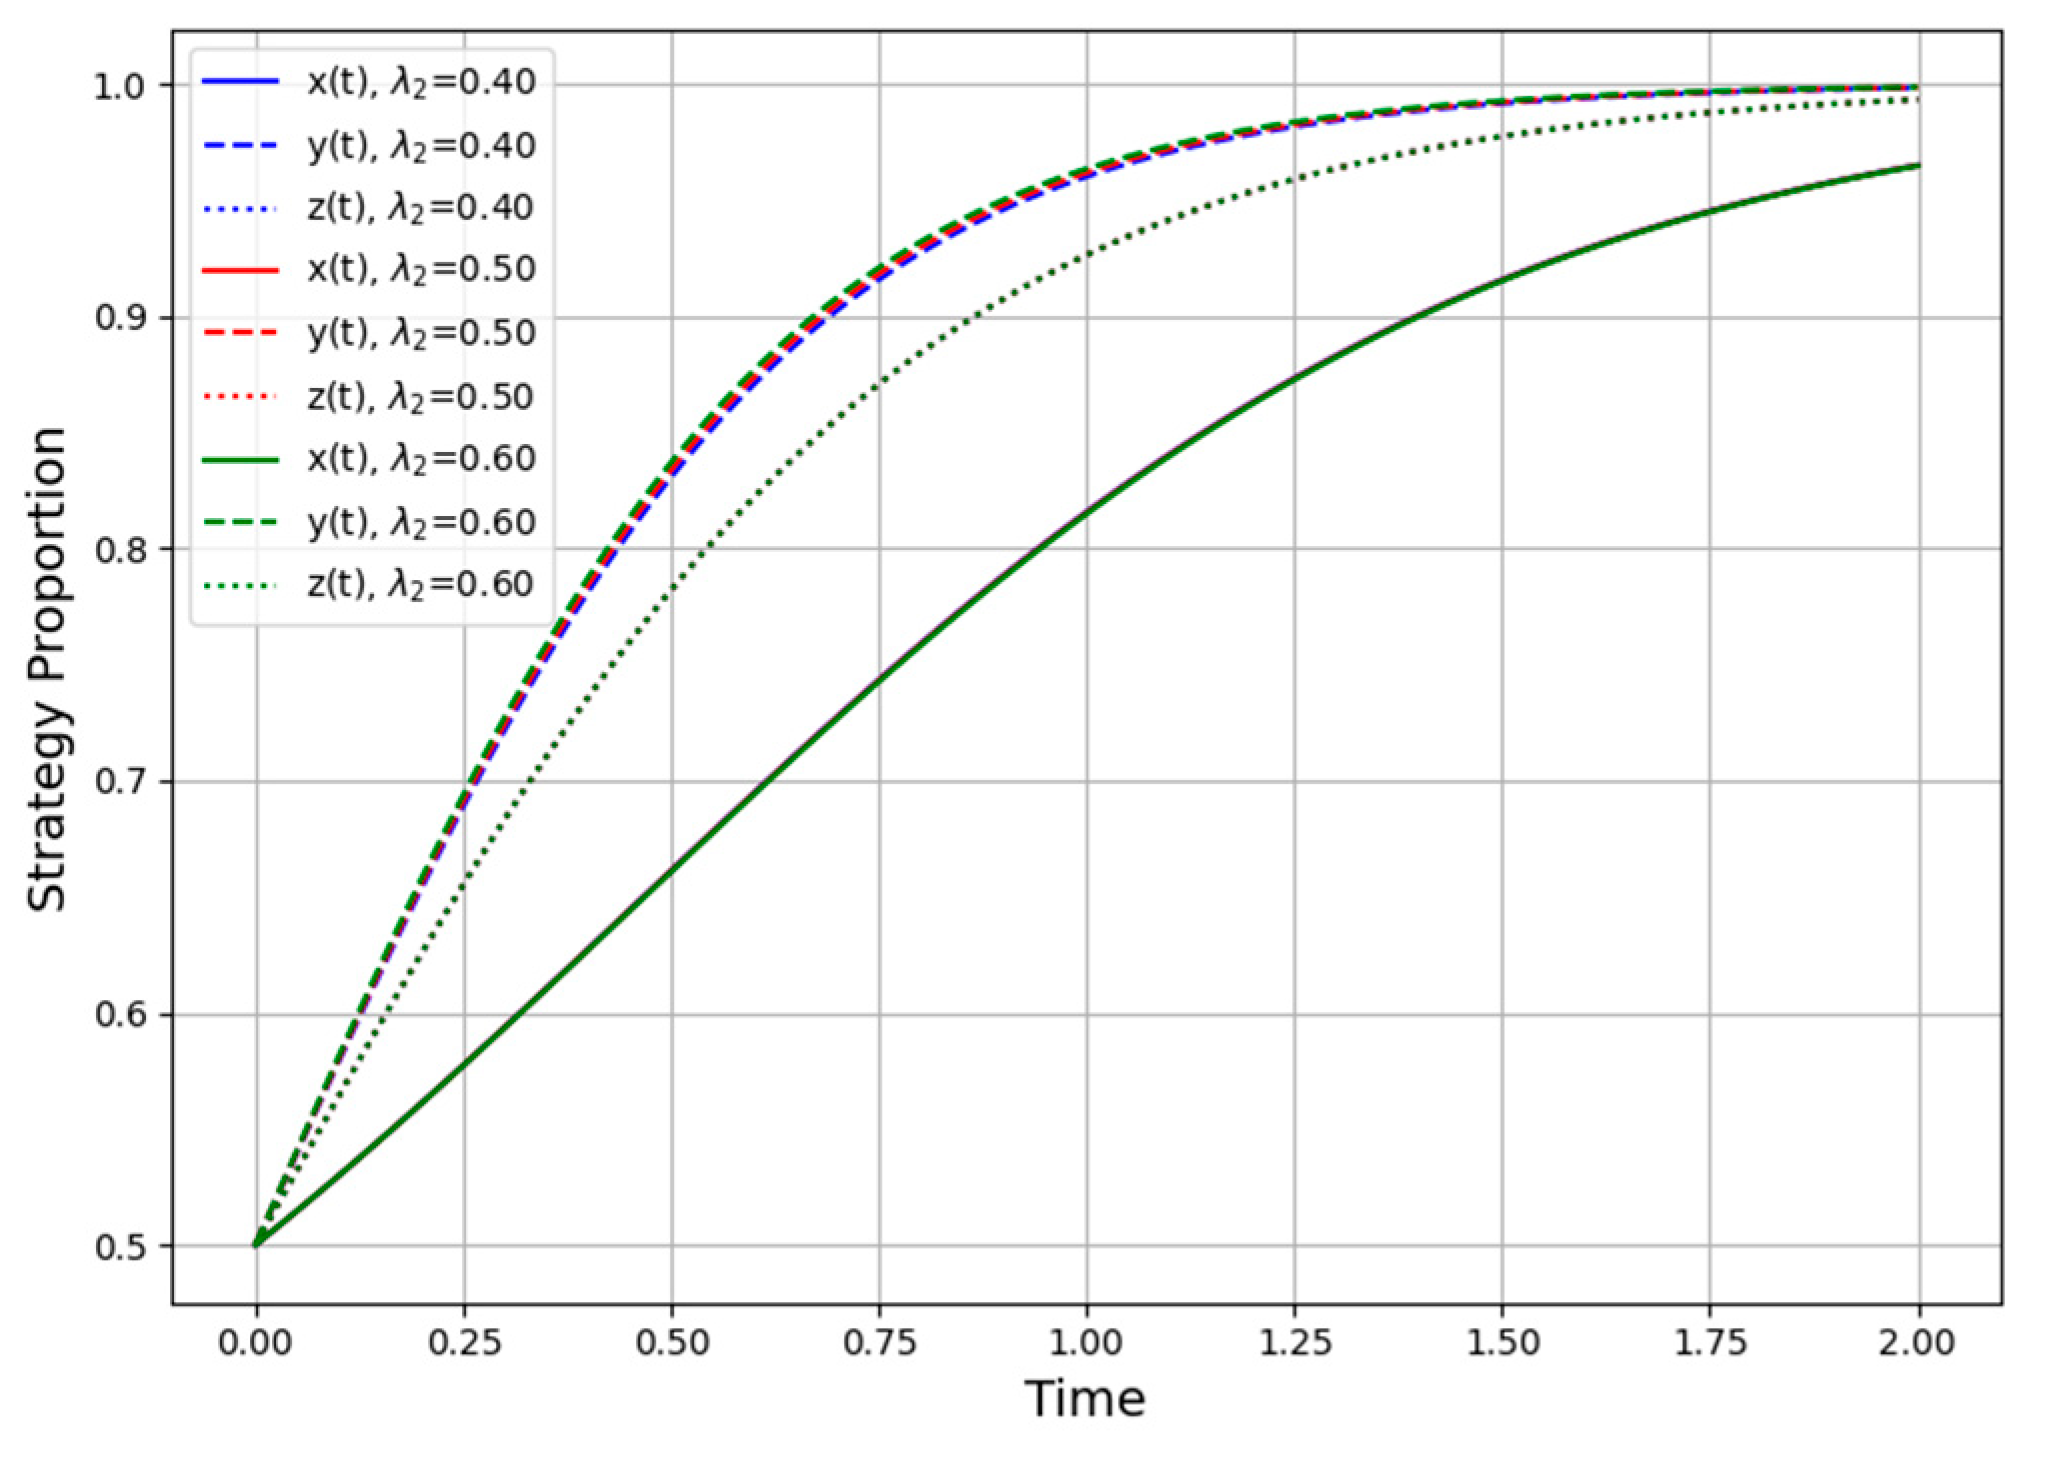
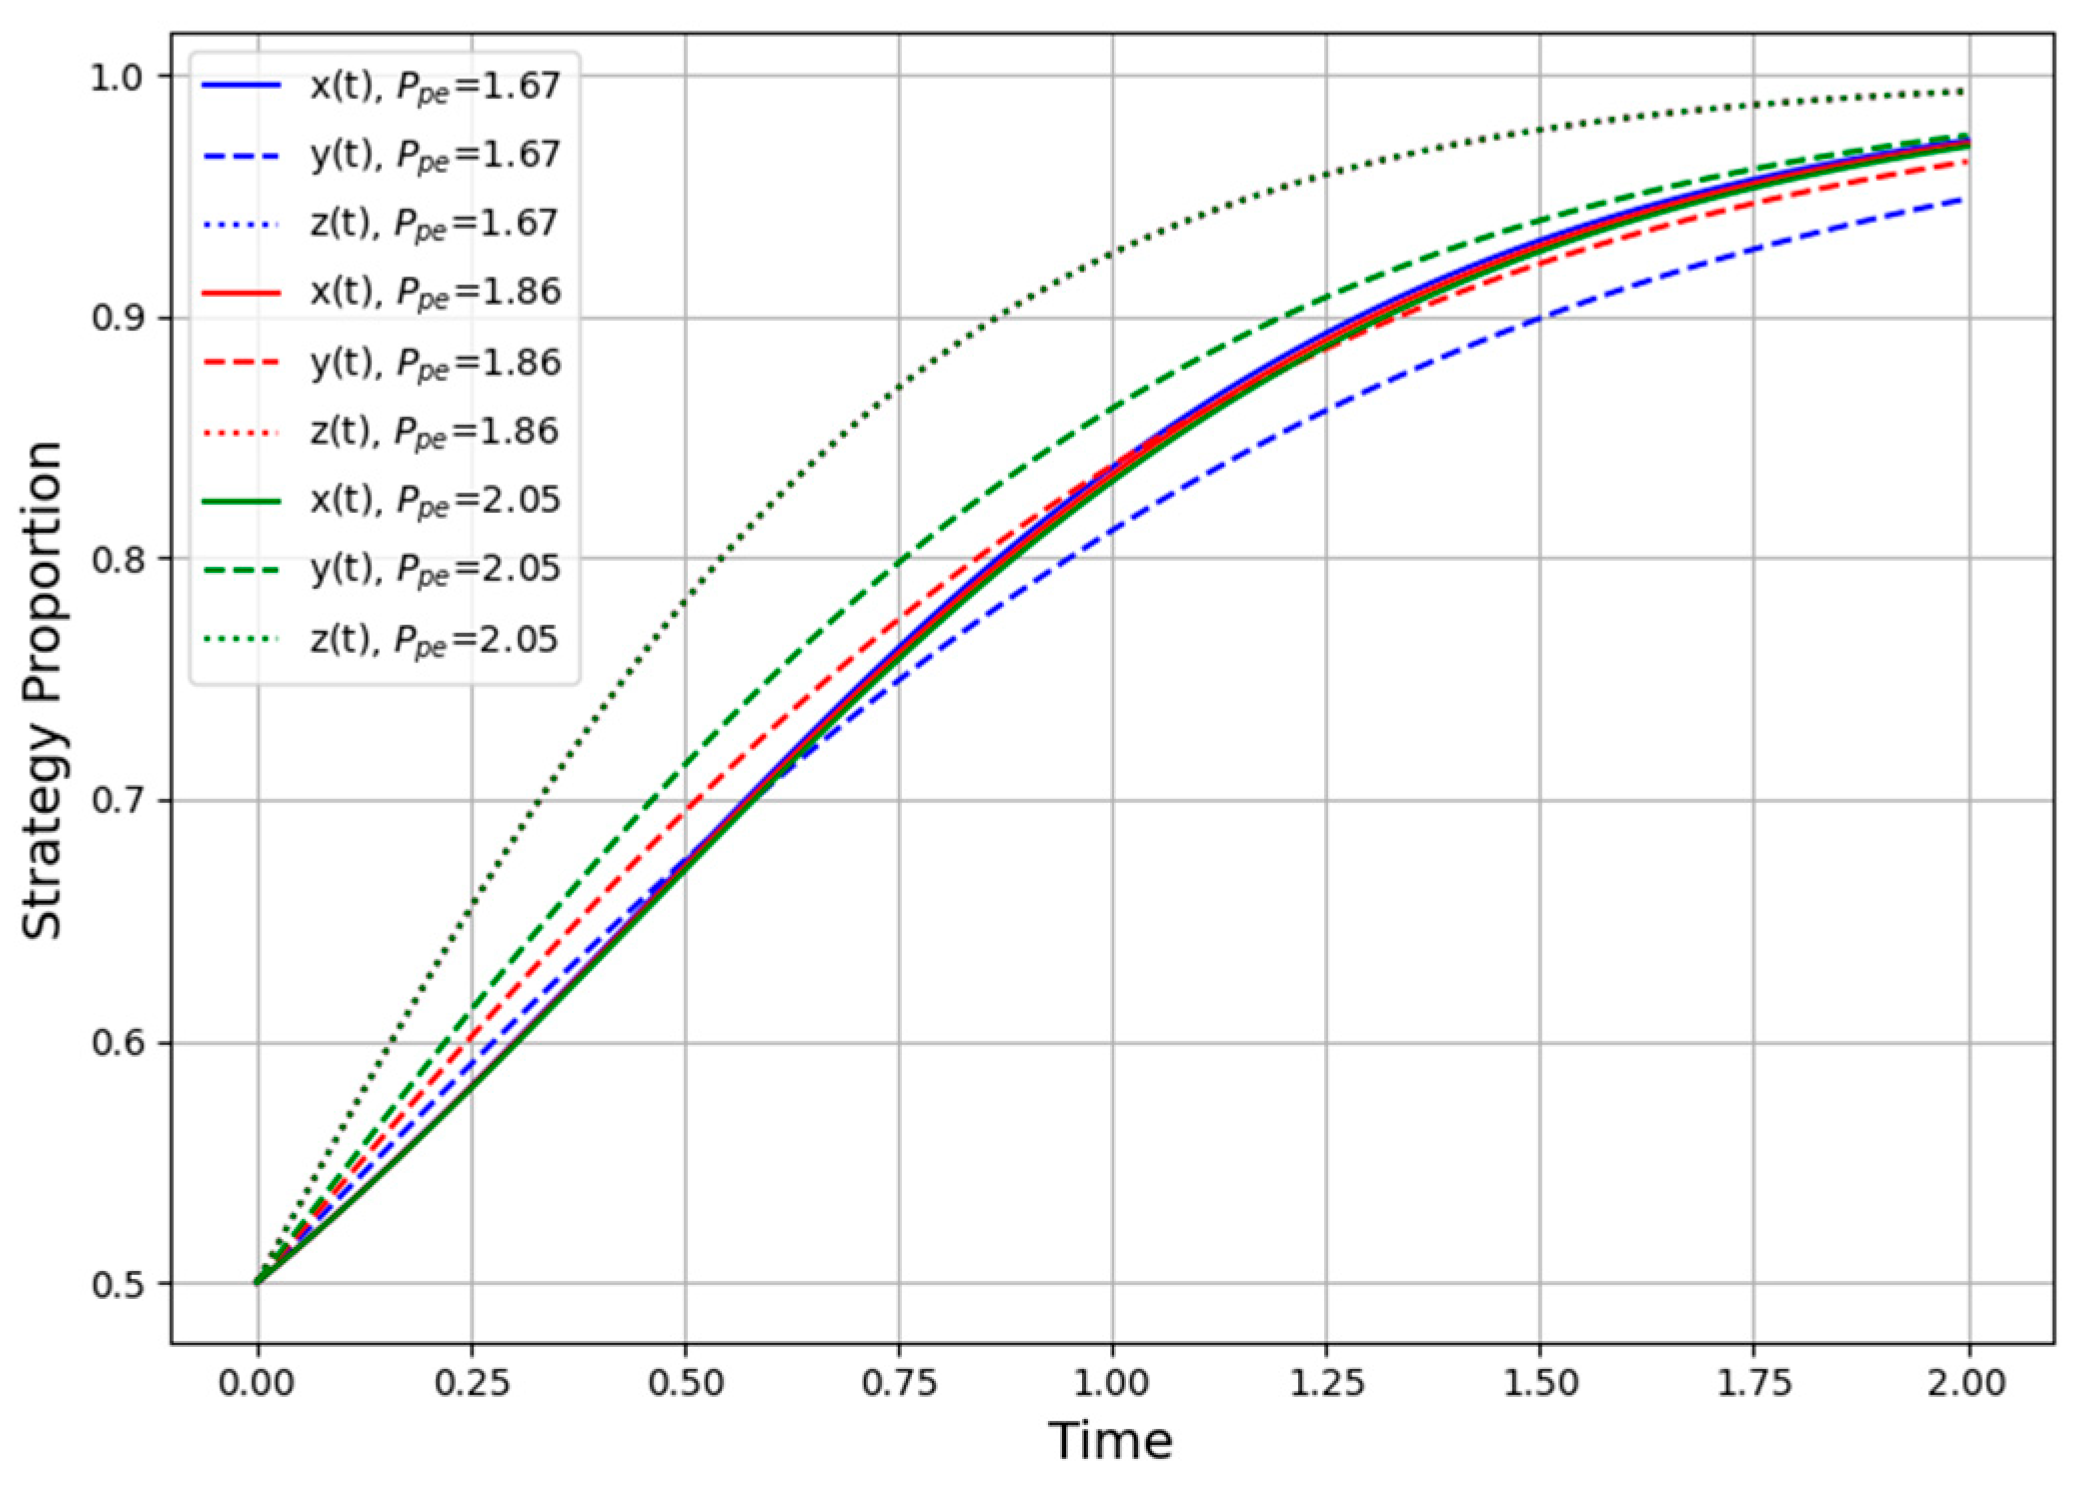
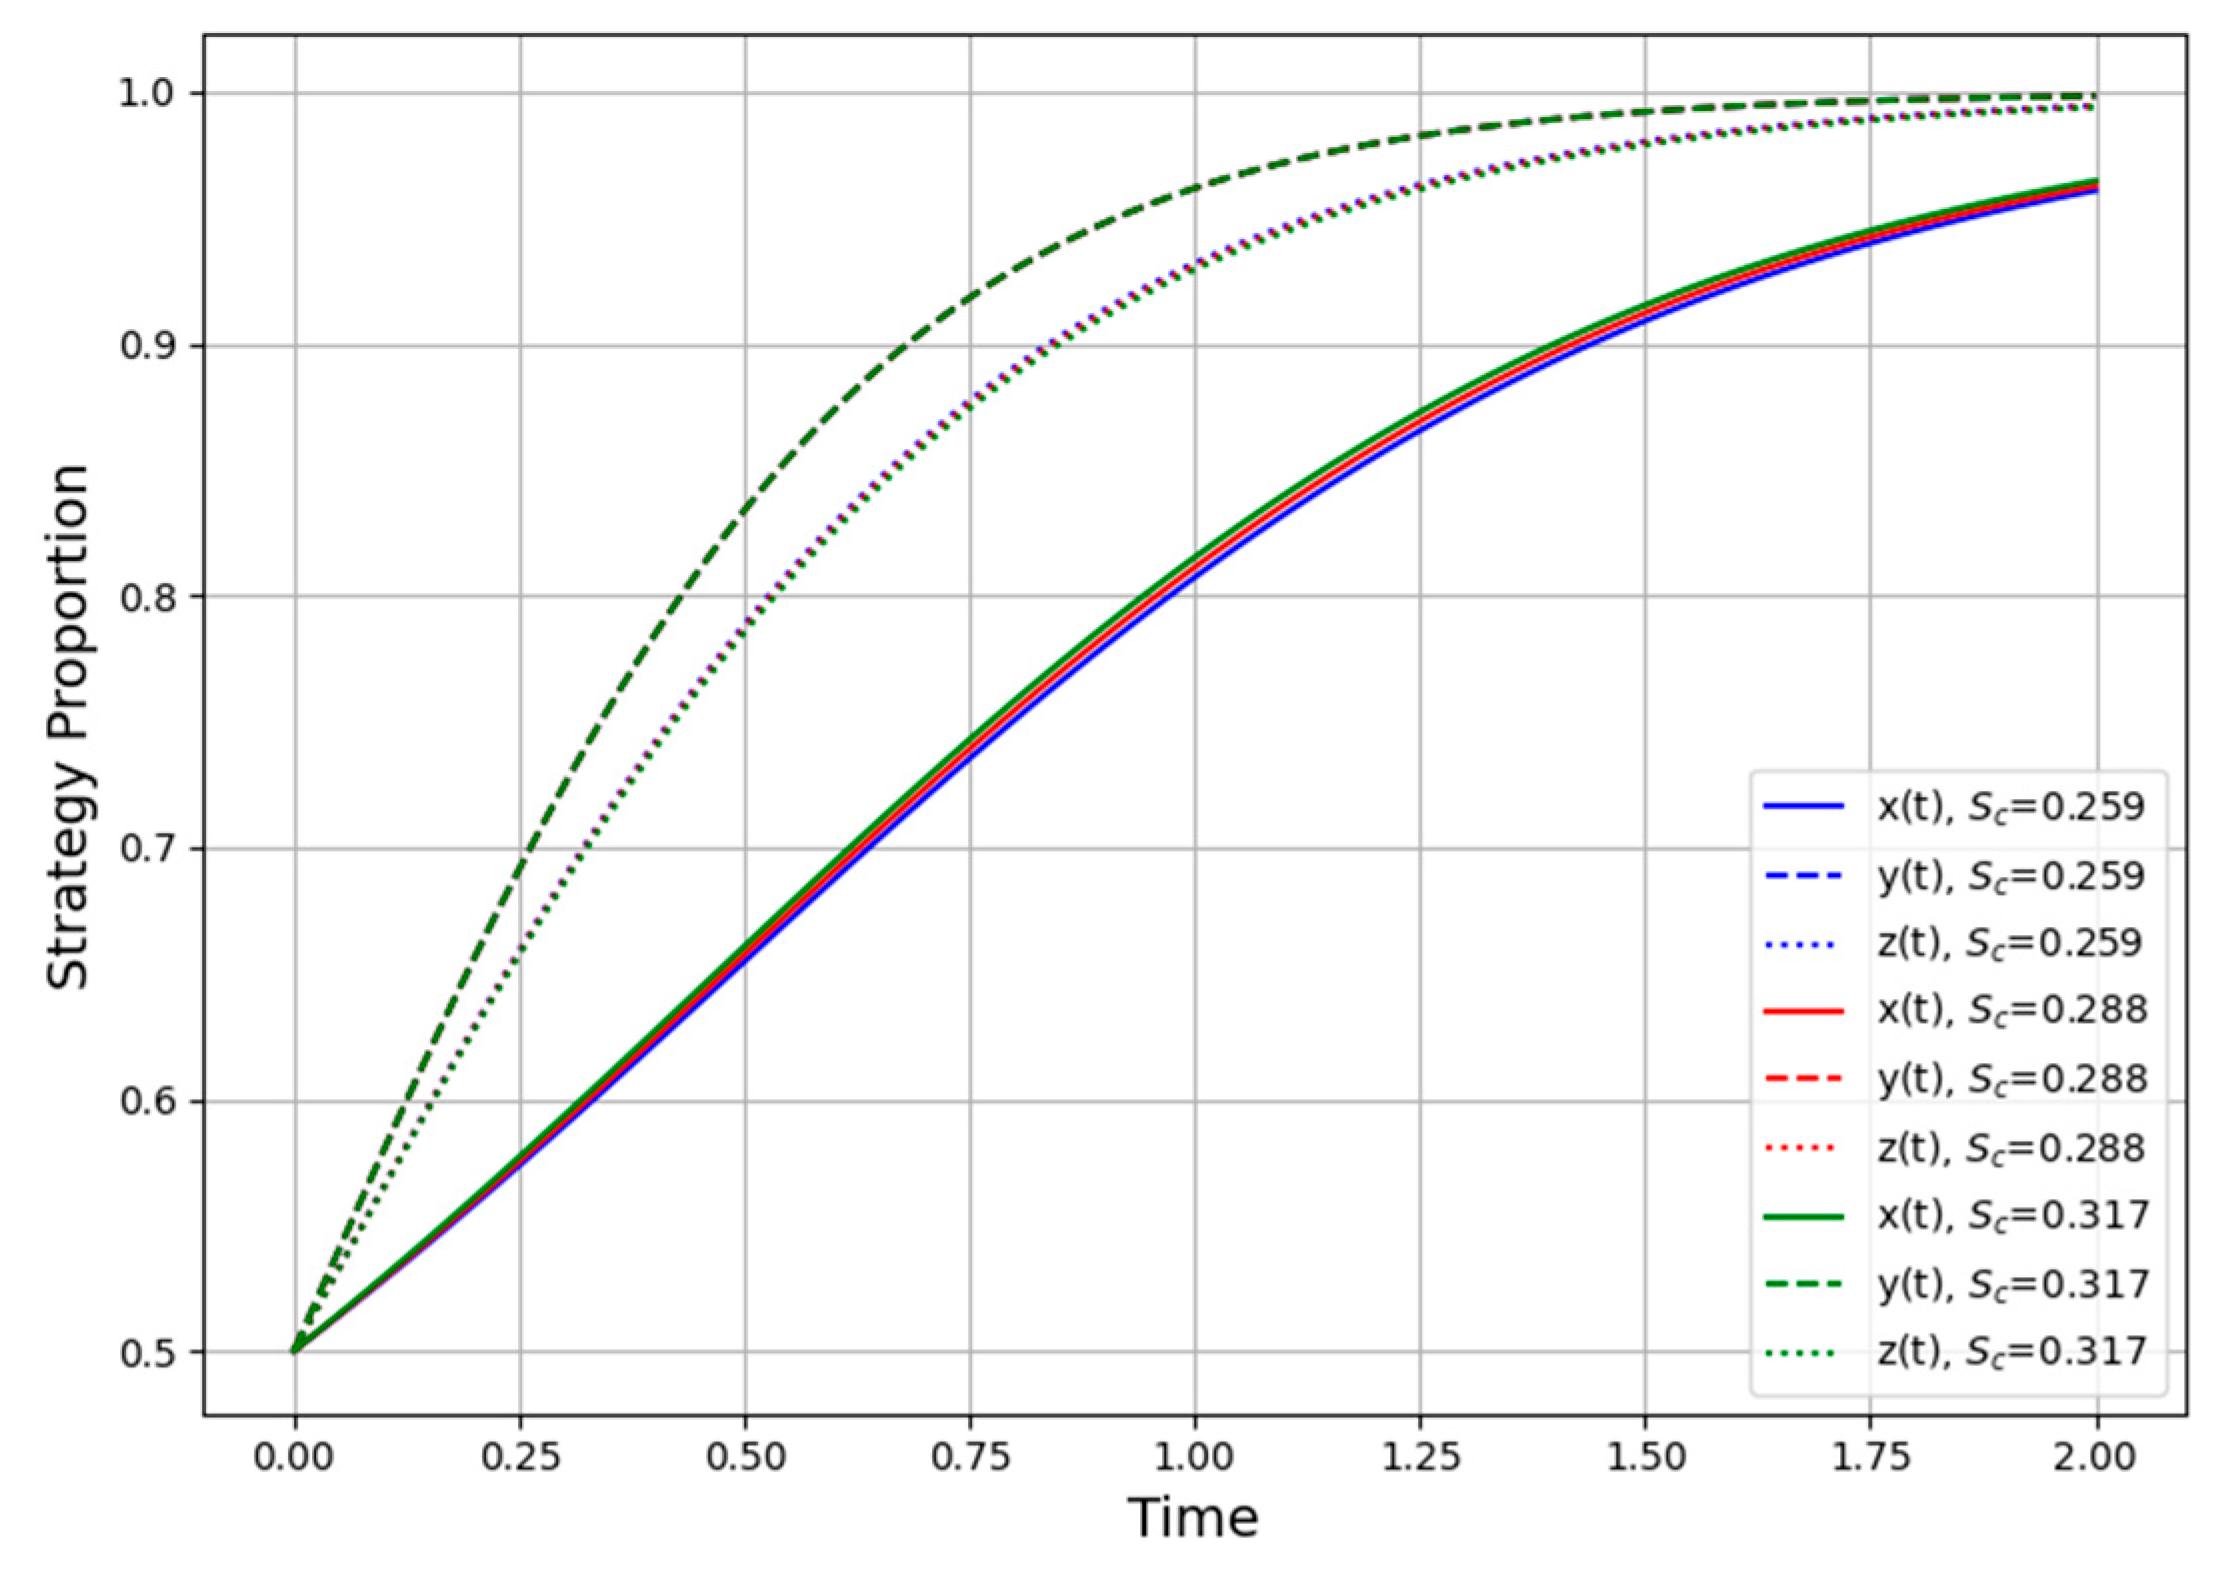
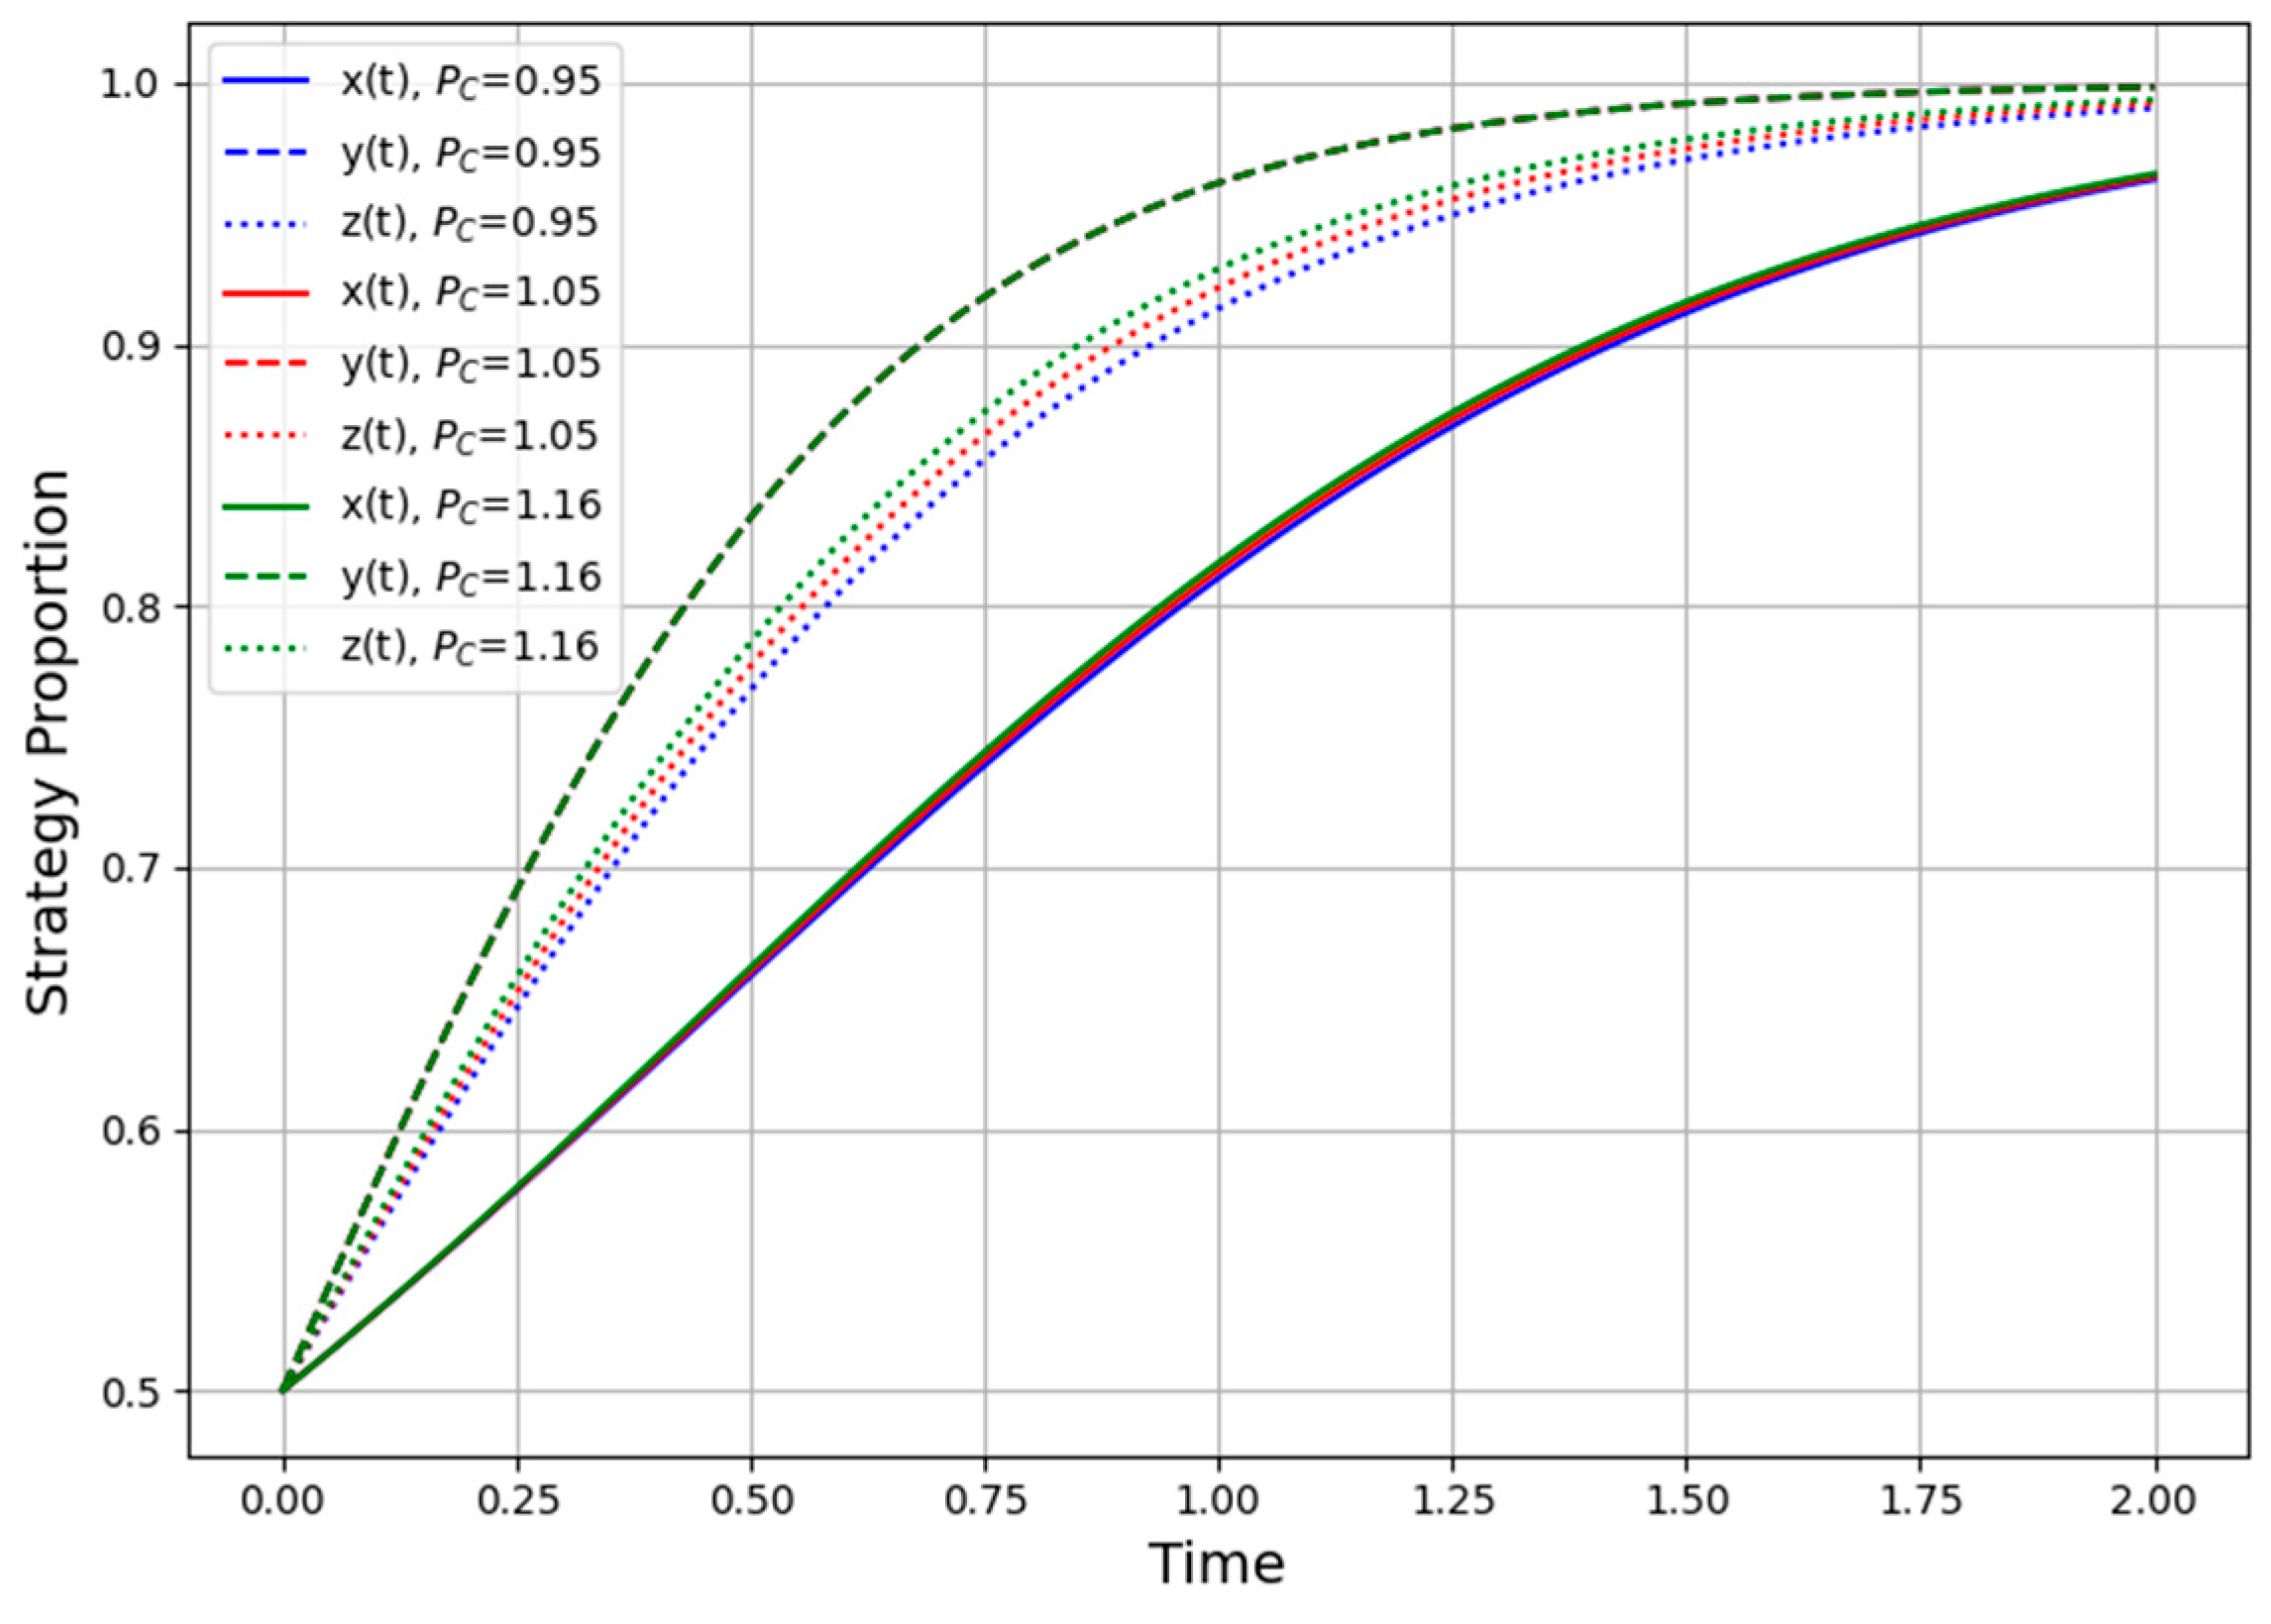
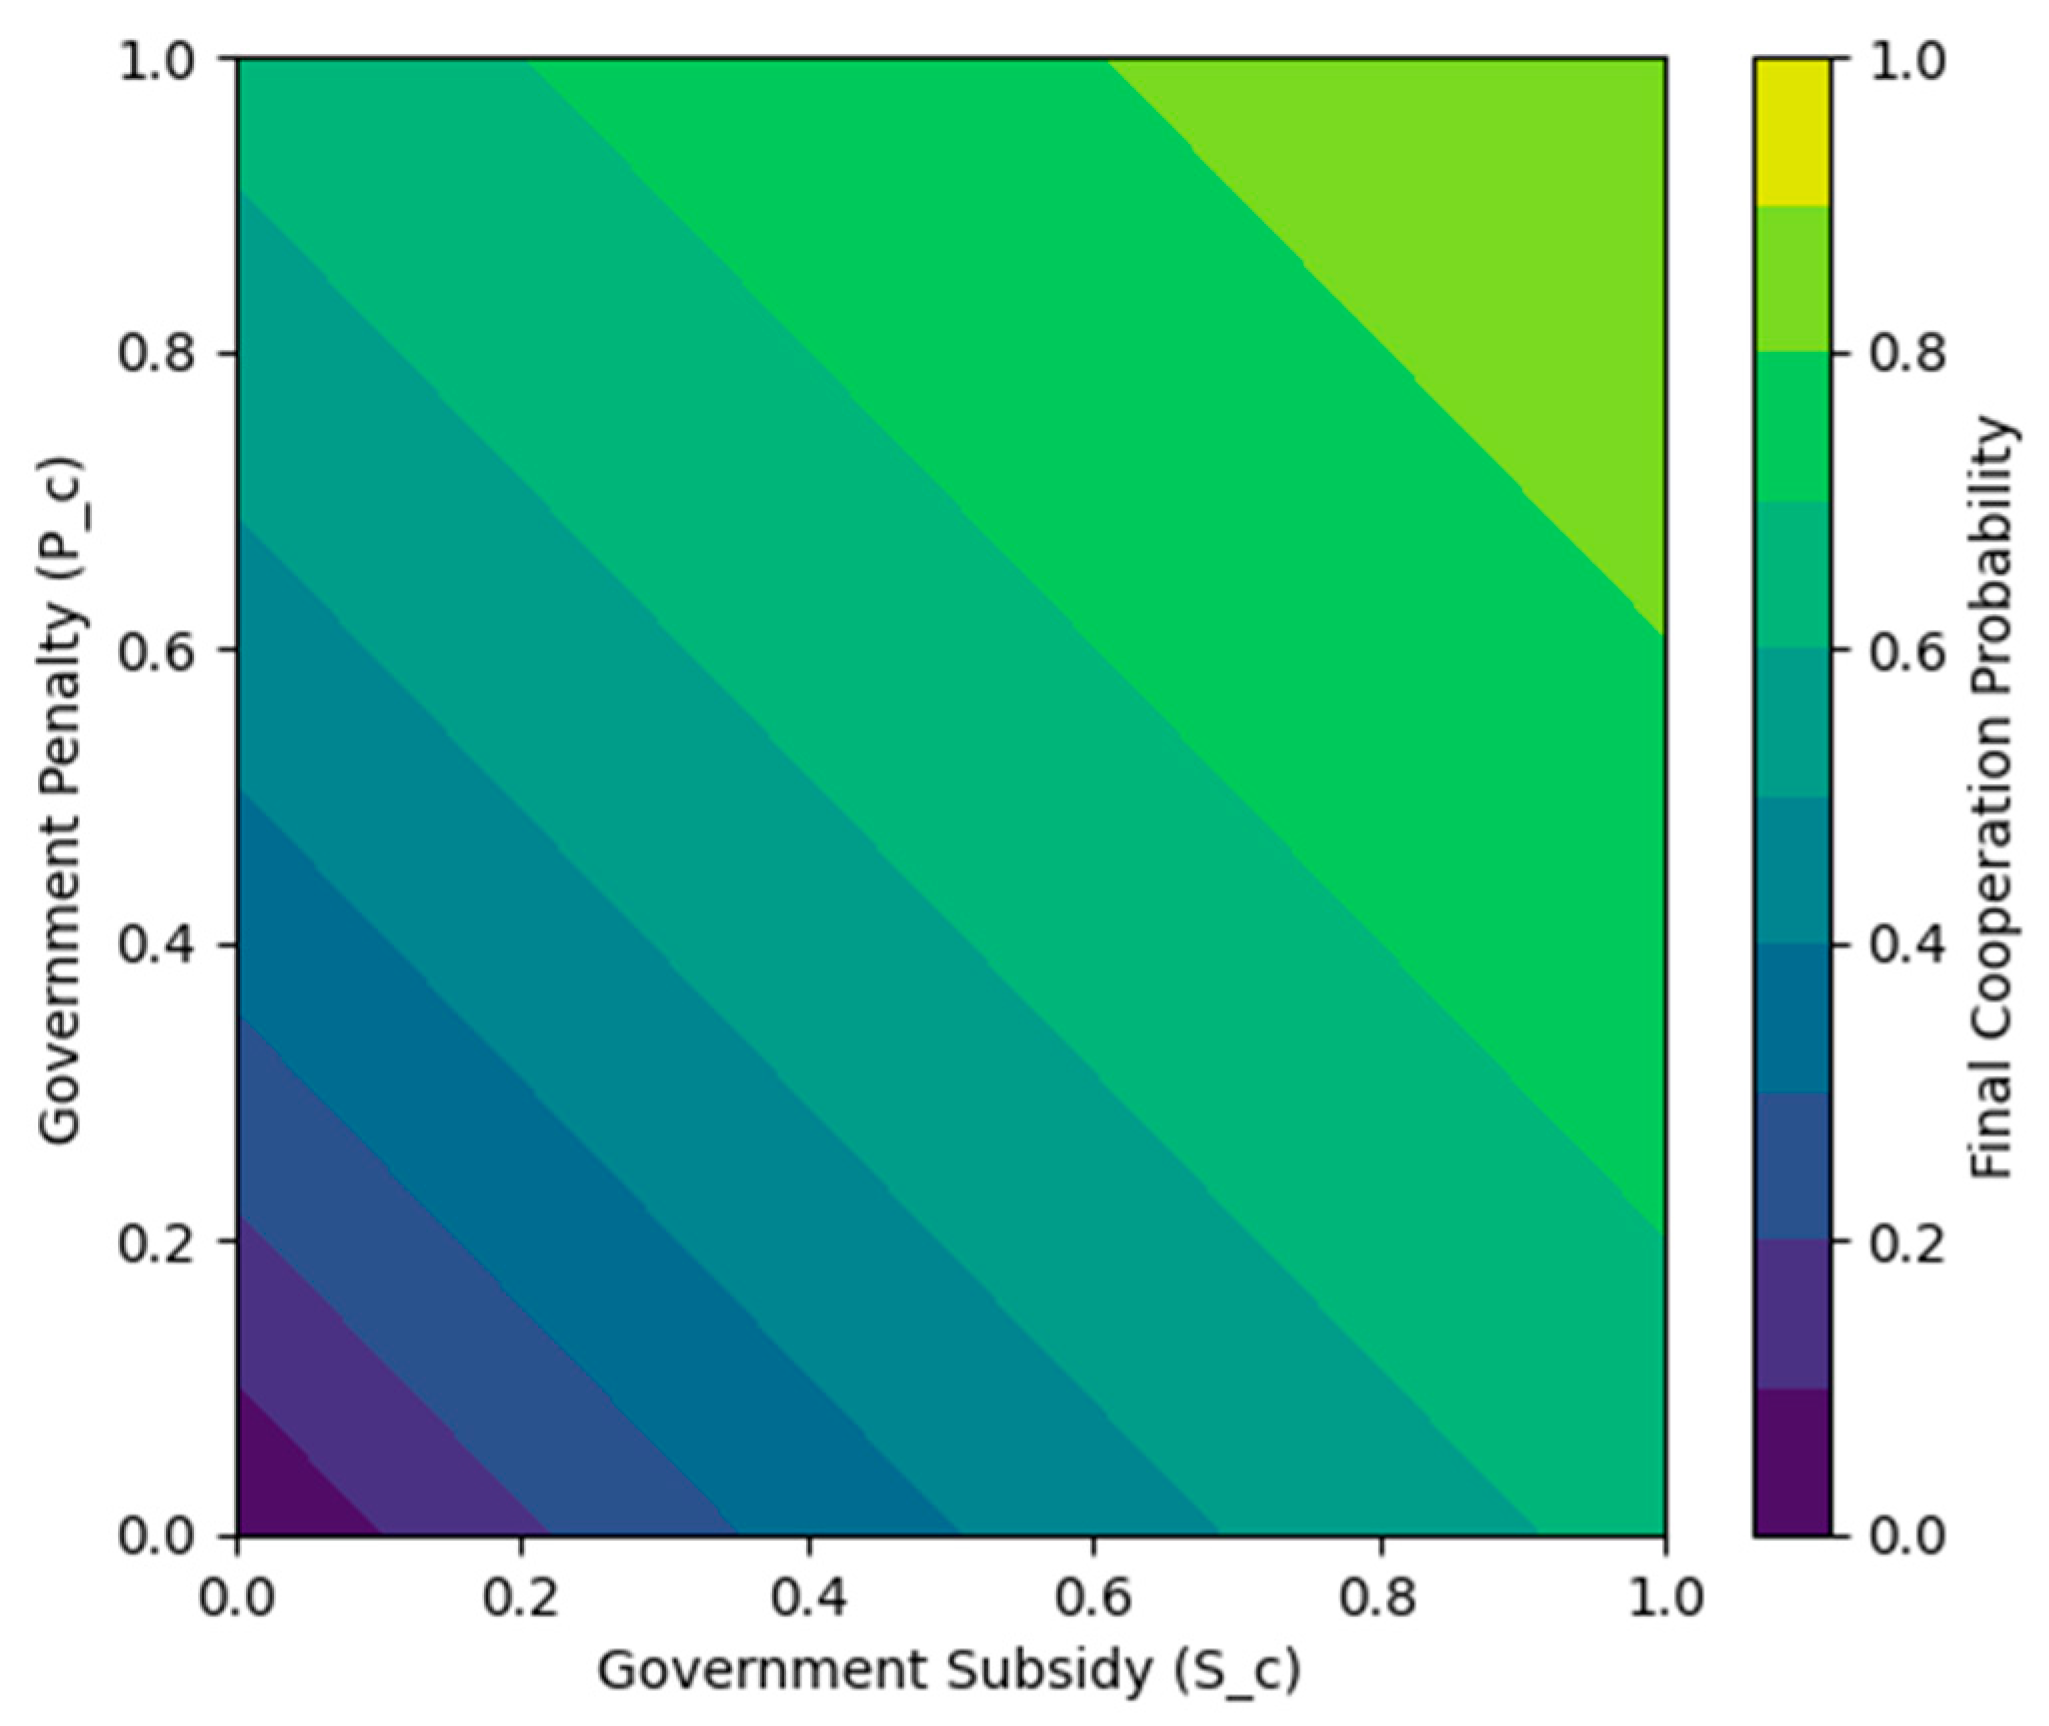
