Article

Revealing the Historical Peak Situation of CO2 Emissions from Buildings in the Great Bay Area

1
School of Mechanics and Civil Engineering, China University of Mining & Technology-Beijing, Beijing 100083, China
2
School of Management Science and Real Estate, Chongqing University, Chongqing 400044, China
3
The Center for Energy & Environmental Policy Research, Beijing Institute of Technology, Beijing 100081, China
*
Author to whom correspondence should be addressed.
These authors contributed equally to this work.
Buildings 2025, 15(11), 1927; https://doi.org/10.3390/buildings15111927
Submission received: 13 May 2025 / Revised: 29 May 2025 / Accepted: 31 May 2025 / Published: 2 June 2025

Abstract

:
Understanding the historical peak situation and the rules for CO2 emissions from buildings helps to formulate reasonable building mitigation strategies, accelerating the achievement of the Chinese government’s carbon peak goal. As developed regions, cities in the Guangdong–Hong Kong–Macao Great Bay Area (GBA) provide valuable reference cases. This study quantified the historical building CO2 emissions of GBA cities and analyzed the contribution of driving factors using the Kaya identity and logarithmic mean Divisia index. Furthermore, we assessed the historical peak situation using the MK trend test method and discussed the reasons behind the inter-city difference in the peak situation shown by the environmental Kuznets curve. The results indicate that the building-related CO2 emissions of the GBA will slowly increase to 96.90 Mt CO2 by 2020 and that P&C buildings accounted for a larger proportion of emissions. Emission factors and population made the largest positive and negative contributions, respectively, to this total. At the city level, Guangzhou, Shenzhen, and Hong Kong ranked as the top three sources of building CO2 emissions. Hong Kong peaked, Dongguan and Macao plateaued, and other cities maintained either slow or quick growth. CO2 emissions unit area, per capita building CO2 emissions, and building CO2 emissions reached a peak in that order. This study provides a valuable reference for formulating a city-level path showing building CO2 emissions peaks.

1. Introduction

As the largest pollution emitter, China is actively participating in global climate governance action, announcing the aim of achieving a carbon peak before 2030 and striving to achieve carbon neutrality by 2060. The building sector is one of the major emitters and final energy consumers in China, contributing nearly a quarter of national CO2 emissions [1,2]. With China’s new urbanization process and increases in economic conditions and residents’ incomes, the final energy demand of China’s building sector will maintain a rigid increasing trend. This offers significant challenges regarding the achievement of China’s carbon peak and carbon neutrality targets.
The Guangdong–Hong Kong–Macao Greater Bay Area (GBA) is the largest and most populous bay area worldwide. Its rapidly increased population and developed economic condition led to increased building stock and CO2 emissions from the building sector in the GBA, reaching 55 MtCO2 by 2020. As the frontier of China’s economic development, the cities in the GBA can provide valuable case studies for other cities to understand the pattern of CO2 emissions from the building sector and formulate effective building decarbonization strategies. The GBA consists of one provincial city (i.e., Guangzhou), two special administrative regions (i.e., Hong Kong and Macao), one special economic zone (i.e., Shenzhen), and seven prefectural cities (i.e., Foshan, Zhongshan, Jiangmen, Zhuhai, Zhongshan, Zhaoqing, and Huizhou), which cover nearly all Chinese city types.
Several studies have quantified the CO2 emissions of the building sector at the national, provincial, and city levels. They mainly adopted techniques based on the macro statistic method and bottom-up method [3,4,5]. Xiang et al. quantified CO2 emissions from residential buildings for 16 countries/regions [6] and CO2 emissions from commercial buildings for 56 countries/regions [7], and further assessed their decarbonization levels and efficiency. Yan et al. quantified the CO2 emissions from the end-use services of residential buildings in China and India [8]. Hou et al. proposed a splitting energy balance-sheet method and further quantified the CO2 emissions from the building sectors of 30 provinces in mainland China [9]. Li et al. established the stock turnover model for building and heating infrastructures, and quantified provincial CO2 emissions from building central heating systems by the bottom-up aggregation of heating buildings with different building energy efficiency standards (BEES) [10]. Wang et al. tried to establish figures for CO2 emissions in the building sector at the Chinese city level. They assumed that the per capita building energy consumption was the same across cities within the same province [11]. However, there was an obvious difference in the energy consumption unit area and per capita building area [12]. For example, Henan province straddles two climatic areas (i.e., the cold area and the hot summer and cold winter area). The cities in the cold climate area adopt a “full-time and full-area” central heating mode, while the cities in the hot summer and cold winter climate area adopt a “part-time and part-area” individual heating mode [12,13]. Several studies have quantified the historical CO2 emissions from building sectors in other cities and further explored the factors driving them [3,4,5,14,15]. Notably, Geng et al. tried to establish a time series for CO2 emissions from the building sector in 11 GBA cities. However, they only focused on residential buildings. The peak situation and driving factors are not clear [16]. Based on the practical demand and research gap described above, this study aims to conduct a compressive investigation into historical CO2 emissions and the peak situation of the building sector in the GBA. The following research issues will be addressed:
  • What are the historical CO2 emissions of the buildings sector in GBA cities?
  • What are the peak situations of CO2 emissions from the buildings sector in GBA cities?
  • What causes inter-city differences in peak situations?
To solve the above issues, this research first quantified the CO2 emission of the building sector in 11 GBA cities from 2010 to 2020. Next, the logarithmic mean Divisia index (LDMI) method and the Kaya identity were employed to assess the contribution of driving factors to the changes in CO2 emissions. Finally, the authors adopted the MK trend test method to assess the peak situations of 11 GBA cities and further examine the reasons behind the inter-city difference in peak situation using the environmental Kuznets curve (EKC).
This paper is structured as follows: Section 2 introduces the quantization model for determining the CO2 emissions of the building sector in GBA cities. The LDMI, the Kaya identity, the MK trend test method, and data sources are also discussed in this section. Section 3 presents the main results, including the historical CO2 emissions, driving factors, and peak situation of the building sector in GBA cities, along with the contribution of driving factors and peak situations. Section 4 discusses the reasons behind inter-city differences in peak situations. Finally, Section 5 describes the main findings and implications of this study, along with recommendations of directions for future research.

2. Materials and Methods

2.1. Calculation of Building CO2 Emissions in the GBA

Existing studies have usually employed bottom-up building energy models or macro statistic data to calculate building CO2 emissions [17,18]. The bottom-up building energy model requires a large volume of micro survey data and assumptions regarding building appliance structures and occupants’ behaviors. However, China’s official statistic system lacks a long-term observation element or surveys of building microdata. This study quantified the building CO2 emission rates in GBA cities using macro statistic data. The final energy types to be included comprised electricity, liquefied petroleum gas (LPG), natural gas, coal, and manufactured gas. Referring to the method used by Yu et al. [19] and Jiang [20], the building CO2 emissions of the city i can be calculated by Equation (1):
C i = y ( E i , y × E F y )
where E i , y represents the consumption of final energy y in the city i. E F y represents the emission factor of final energy y.
To guarantee consistency and comparability, we selected the same sectors for the statistic system in 11 cities. In the macro statistic system, the energy consumption of a residential building is contained within the residential sector. Referring to the method used by Yu et al. [19], we excluded the gasoline consumption of the residential sector since the gasoline is for private cars. For coal in residential buildings, we divided the provincial data into city-level data according to household, without including LPG and natural gas. The rest of the final energy consumption value can be directly collected from the electricity consumption sheets. For the public and commercial (P&C) buildings included in the electricity consumption sheets of 11 cities in the GBA, electricity consumption is derived from multiple sectors, including transportation, accommodation and catering, finance and real estate, and public services. We adopted the method used by Yu et al. to split the electricity consumption of P&C buildings [19]. For other final energy data in P&C buildings, we divided the provincial data into city-level data according to the areas of P&C buildings.

2.2. The Kaya Identity and LDMI Method for Driving Factor Assessment

The Kaya identity was proposed in Ref. [21] as a way to analyze the relationship between carbon emission and related driving factors. A traditional Kaya identity consists of four driving factors, including the emission factor of energy, energy intensity, per capita GDP, and population [17,22,23]. Based on the characteristics of the building sector, this study developed the Kaya identity for determining the CO2 emissions of P&C ( C P & C , Equation (2)) and residential buildings ( C R E , Equation (3)) in GBA cities. Combining the Kaya identity with EKC, this study also examined the reasons behind the inter-city differences in peak situations.
C P & C = E F P & C × E I P & C × A S P & C × P = C P & C E P & C × E P & C A P & C × A P & C P × P
C R E = E F R E × E I R E × A S R E × P = C R E E R E × E R E A R E × A R E P × P
Here, EF represents the emission factor of final energy. In this study, the EF of electricity usage in 9 cities of Guangdong provinces is consistent with EF of electricity of China Southern Grid. The EF of electricity consumption in Hong Kong and Macao contains the local electricity and inflow electricity from China’s# Southern Grid. The proportion of local and imported electricity is derived from Hong Kong and Macao energy statistics.
EI represents the final energy consumption unit area; A S represents the per capita building floor area; P represents the population; E is the final energy consumption by P&C and residential buildings; A represents the total area of P&C and residential buildings.
Furthermore, based on the Kaya identity, this study employed the LMDI method to assess the contribution of four driving factors on the CO2 emission of P&C and residential buildings (Equation (4)). The LMDI method was proposed by Ang and has the advantage of having no residual values and total decomposition [12,24,25,26].
C = E F + E I + A S + P
Here, E F , E I , A S , and P represent the contribution of four driving factors and can be calculated by Equations (5)–(8).
E F = C t C 0 ln C t l n ( C 0 ) l n ( E F t E F 0 )
E I = C t C 0 ln C t l n ( C 0 ) l n ( E I t E I 0 )
A S = C t C 0 ln C t l n ( C 0 ) l n ( A S t A S 0 )
P = C t C 0 ln C t l n ( C 0 ) l n ( P t P 0 )
In addition, to avoid the impact of the uncertainty of building CO2 emission and driving factors in a specific year on the decomposition results, we calculated the cumulative annual contribution during each 5-year period, instead of directly calculating the contribution during a 5-year period, based on the values of the start and end years.

2.3. MK Trend Test Method for Peak Situation Assessment

According to the peak carbon emissions assessment criteria established by the World Resources Institute (WRI) [27], a city is considered to have reached its carbon emissions peak if the emissions peaked more than five years ago, have since shown a relatively stable declining trend, and have decreased by more than 10% within five years after the peak. A slight rebound in emissions is permissible after the peak, provided that the peak emission level is not surpassed [28]. Furthermore, for non-peak cities, when their average annual growth rate (AAGR) exceeds the national average annual growth rate (NAAGR), they are considered to be in a phase of rapid growth. Conversely, when their AAGR falls below the NAAGR, these cities experience slower growth.
The MK Trend Test method was adopted to assess the CO2 emission peak situation of the CO2 emissions of the building sector in GBA cities. The MK test is a nonparametric, statistical, rank-based method that is widely used to detect significant upward or downward trends in time-series data [29]. This method is very popular because it accommodates missing values and is robust against outliers, and a detailed description of the MK test is available in the work of Jhajharia et al. [30]. The MK test statistic S is calculated as follows:
S = k = 1 n 1 j = k + 1 n s g n ( x j x k )
s g n x j x k = 1 , x j x k > 0 0 , x j x k = 0 1 , x j x k < 0
where n is the length of the time series, and s g n ( x j x k ) is the sign function. x j and x k denote the data values at time series points j and k (where j k ), respectively. The variance V S of the statistic S is obtained as follows:
V a r ( S ) = n n 1 2 n + 5 p = 1 q t p ( t p 1 ) ( 2 t p + 5 ) 18
where t p is the number of ties for the pth value and q is the number of tied values. For n > 10 , the standard normal variate Z S is established, as shown by Yue et al. [31].
Z S = S 1 V A R ( S ) , S > 0 0 , S = 0 S + 1 V A R ( S ) , S < 0
A positive value of Z S indicates an upward trend, while a negative Z S indicates a downward trend. At a significance level of α , the null hypothesis is rejected if Z S Z 1 α / 2 . In this study, α was set to 0.05 and 0.001. Those regions where CO2 emissions peaked within the most recent five-year period were classified as “non-declined regions” and excluded from the MK test. For regions with declining CO2 emissions over five years, those passing the MK test (p < 0.05) were categorized as “emission-declined regions”, while the remaining regions were classified as “plateau regions” [28]:

2.4. Data Sources

For 9 cities in Guangdong, the final energy consumption data were derived from provincial and city-level statistical yearbooks. Data on building floor areas were derived from the Chinese Association of Building Energy Efficiency [32]. The Chinese yearbook provided the population figures and the added value of tertiary industry. For Hong Kong, the final energy consumption data were collected from the Hong Kong Energy End-use Data Report and the Hong Kong Energy Statistics Annual Report. The socioeconomic data (i.e., GDP, population, and building floor area) were collected from the Hong Kong Annual Digest of Statistics. The statistical macro data were sourced from the Statistics and Census Service (https://www.dsec.gov.mo, assessed on 7 July 2022).

3. Results

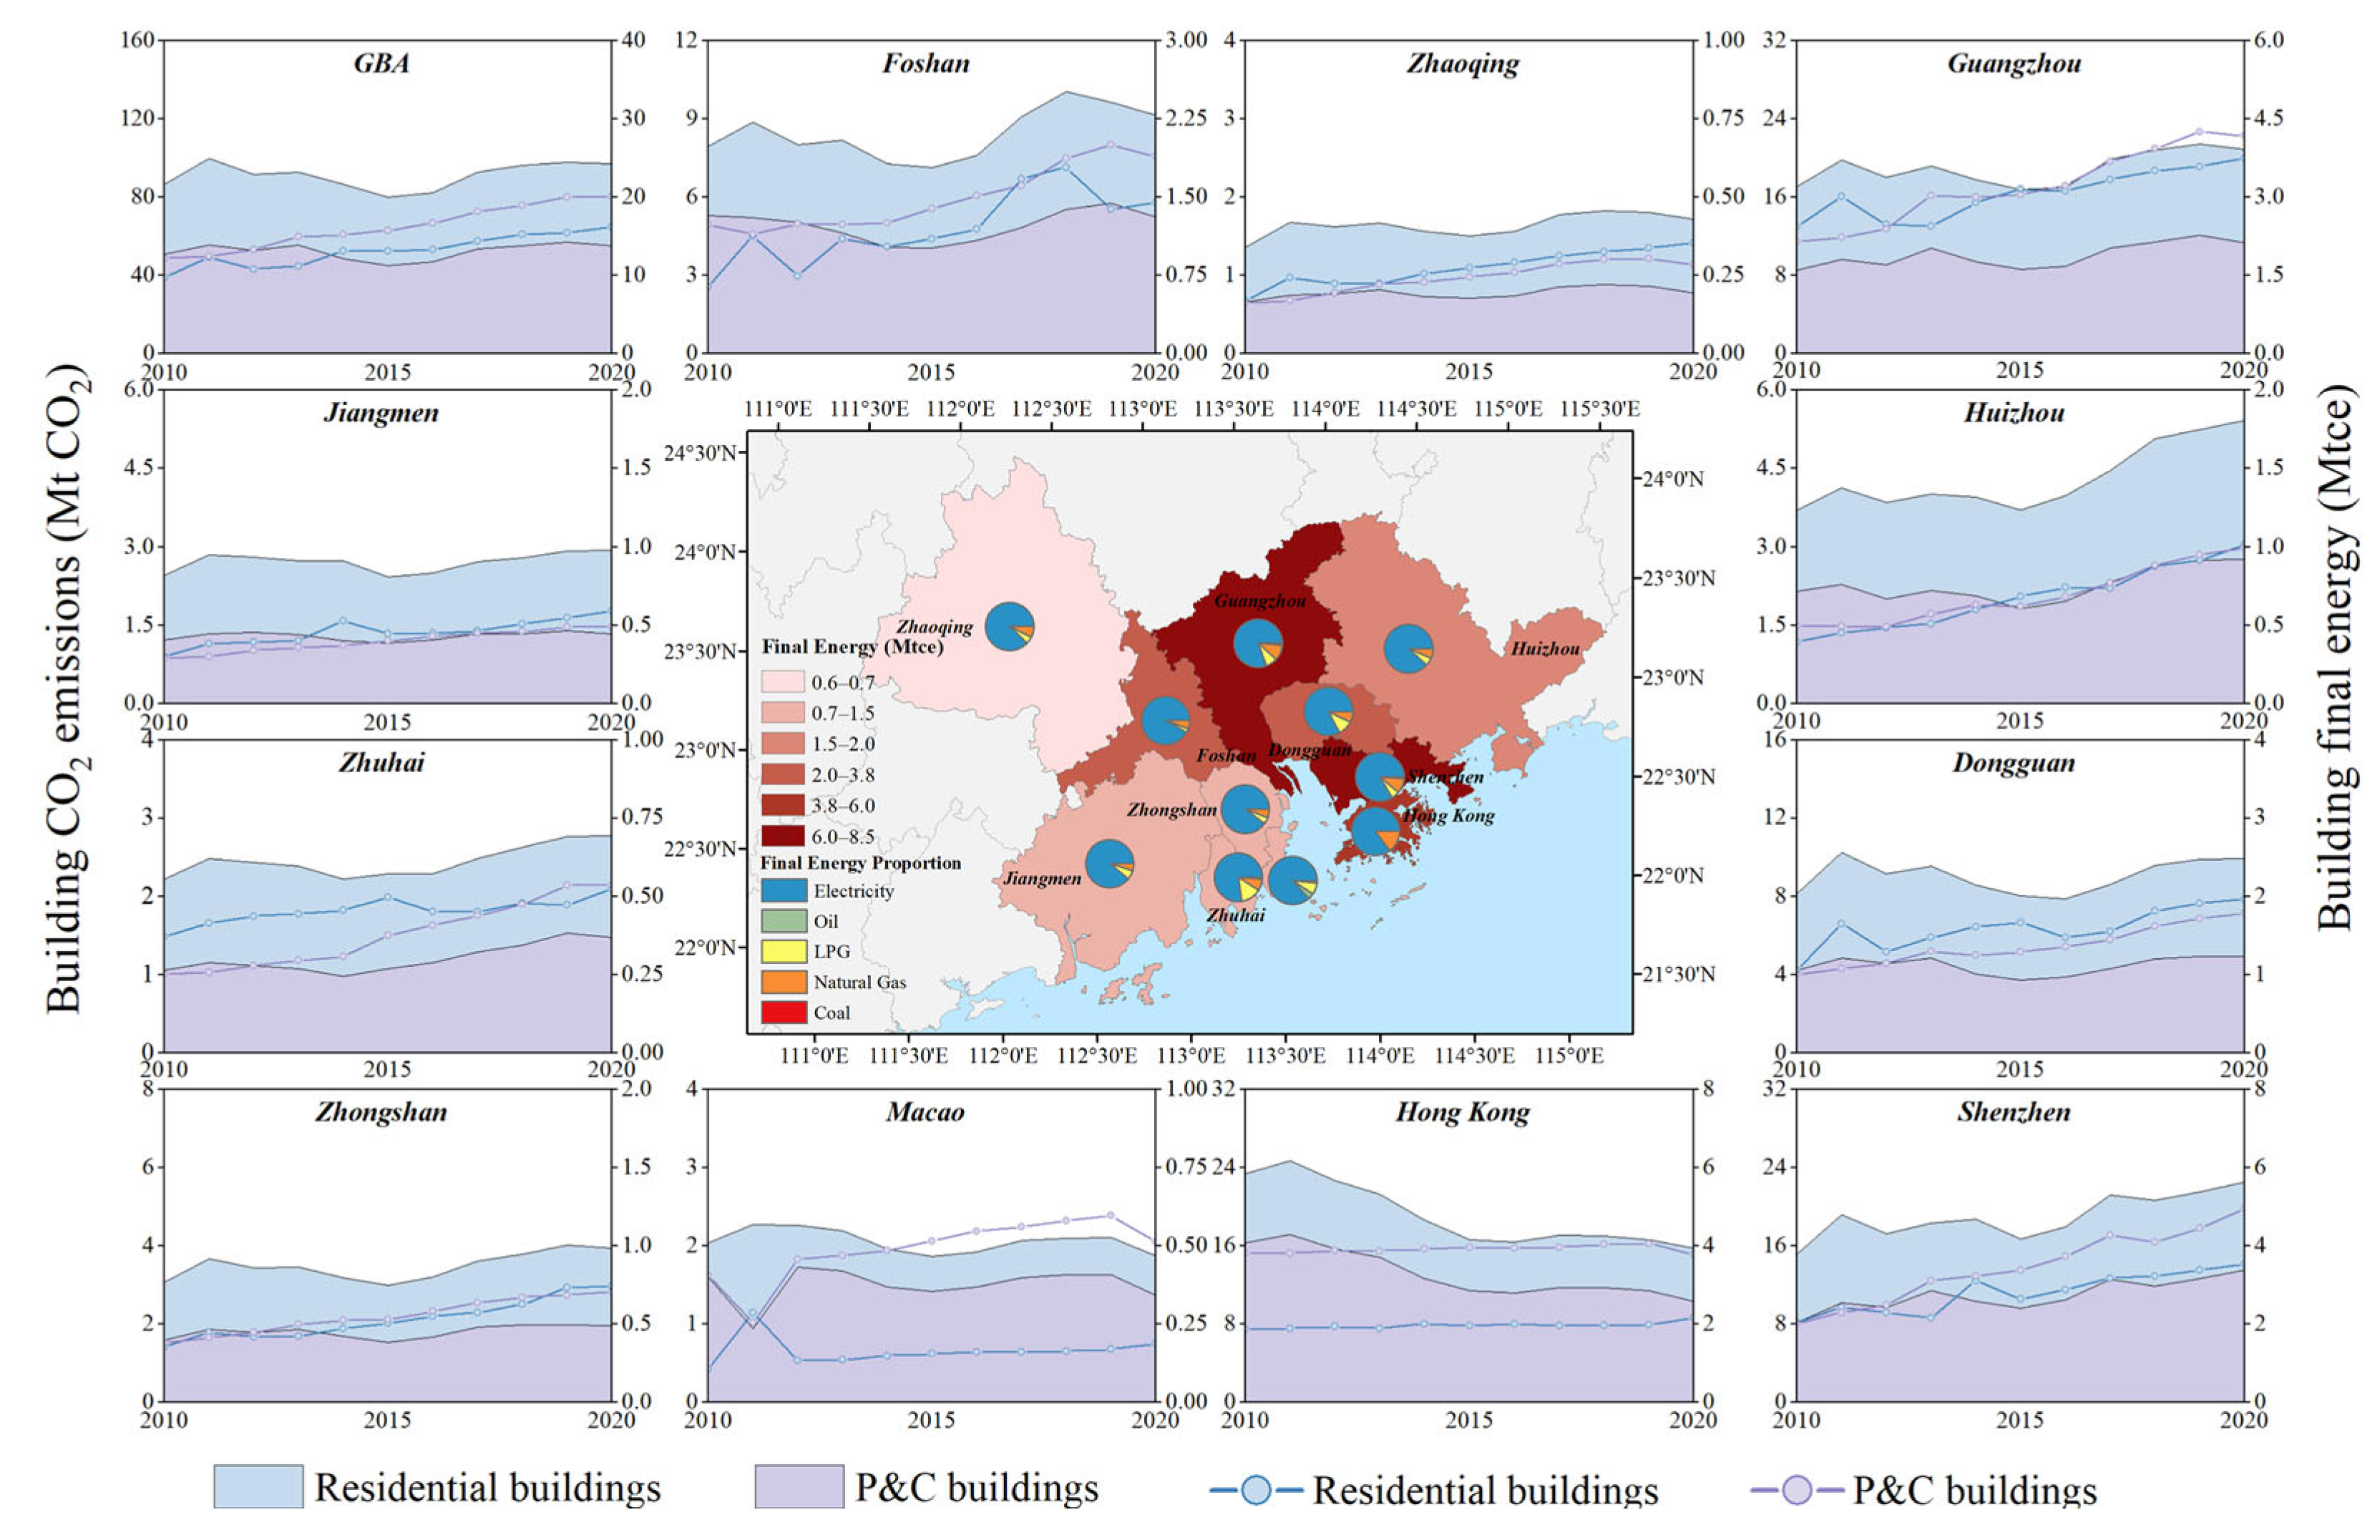
3.1. Building CO2 Emissions in GBA Cities

Figure 1 depicts the historical CO2 emissions of the building sector in GBA cities. For the GBA, however, the final energy consumption values for buildings continuously increased, reaching 36.35 Mtce. Due to the electrification and decarbonization of the power sector, the building CO2 emissions of the GBA demonstrated a U-shaped trend, which decreased from 99.83 Mt CO2 in 2011 to 80.04 Mt CO2 in 2015 and then increased to 96.90 Mt CO2 by 2020. The historical change trend for final energy consumption and the CO2 emissions for residential and P&C buildings were consistent with the GBA’s situation. The rebound seen in building CO2 emissions in 2015 may have been caused by the development of information technology, artificial intelligence, and electric vehicles. Several studies have forecasted that these innovations will be a new source of growth for global CO2 emissions [33]. The final energy consumption of residential and P&C buildings increased by 58% and 65%, respectively. The CO2 emissions for residential and P&C buildings reached 55.03 Mt CO2 and 41.86 Mt CO2 by 2020, respectively. The CO2 emissions of P&C buildings accounted for a larger proportion, maintaining at nearly 57%. This is significantly different from the national situation, in that P&C buildings contributed less than 40% of the national building CO2 emissions. This phenomenon may be due to the fact that the GBA has a more well-developed tertiary sector of industry.
At the city level, Shenzhen, Guangdong, and Hong Kong were responsible for the top three final energy consumption and CO2 emissions for buildings, collectively contributing over 60%. In contrast, due to its limited population, Zhaoqing had the smallest building-related final energy consumption and CO2 emissions, reaching 0.64 Mtce and 1.72 Mt CO2 by 2020, respectively. P&C buildings contributed more CO2 emissions in Dongguan, Guangzhou, Huizhou, Zhuhai, Foshan, Shenzhen, Hong Kong, and Macao. Especially in the case of Shenzhen, Hong Kong, and Macao, the proportion of P&C buildings was more than 60%. Conversely, residential buildings contributed more CO2 emissions in Jiangmen, Zhaoqing, and Zhoushan.
Regarding the historical change trend in final energy consumption, during the period from 2010 to 2020, the building final energy consumption rate maintained an increasing trend for all GBA cities. Huizhou had the largest growth rate, reaching 126%. Shenzhen had the second-highest growth rate (110%). In 2010, the final energy consumption of buildings in Shenzhen ranked third; Shenzhen’s final building energy consumption exceeded that of Guangzhou and Hong Kong in 2014 and 2015, respectively. For historical change trends in terms of building CO2 emissions, only Macao and Hong Kong exhibited lower building CO2 emissions in 2020 compared with 2010. The building CO2 emissions of Macao and Hong Kong were reduced by 8% and 36%, respectively. Hong Kong almost dominated the decrease in the building CO2 emissions of the GBA during the period from 2010 to 2015. Shenzhen (48%) and Huizhou (47%) showed the largest growth rates in building CO2 emissions. Notably, due to building electrification and the decarbonization of power systems (e.g., wind, solar power, and ultra-supercritical coal plants), the emission factor of building final energy decreased continuously, causing the growth rate of building CO2 emissions to be lower than that of building final energy consumption for all GBA cities.
The map in Figure 1 also represents the structure of the final energy trends for buildings. Specifically, electricity use (84%) dominated the final energy figures. The electrification rate was significantly higher than the national level [17,34], which may be caused by low heating demand and developed economic conditions. At the city level, except Zhuhai, all GBA cities had an electrification rate of over 80%. Huoshan (91%), Macao (89%), and Zhongshan (89%) exhibited the top 3 electrification rates.

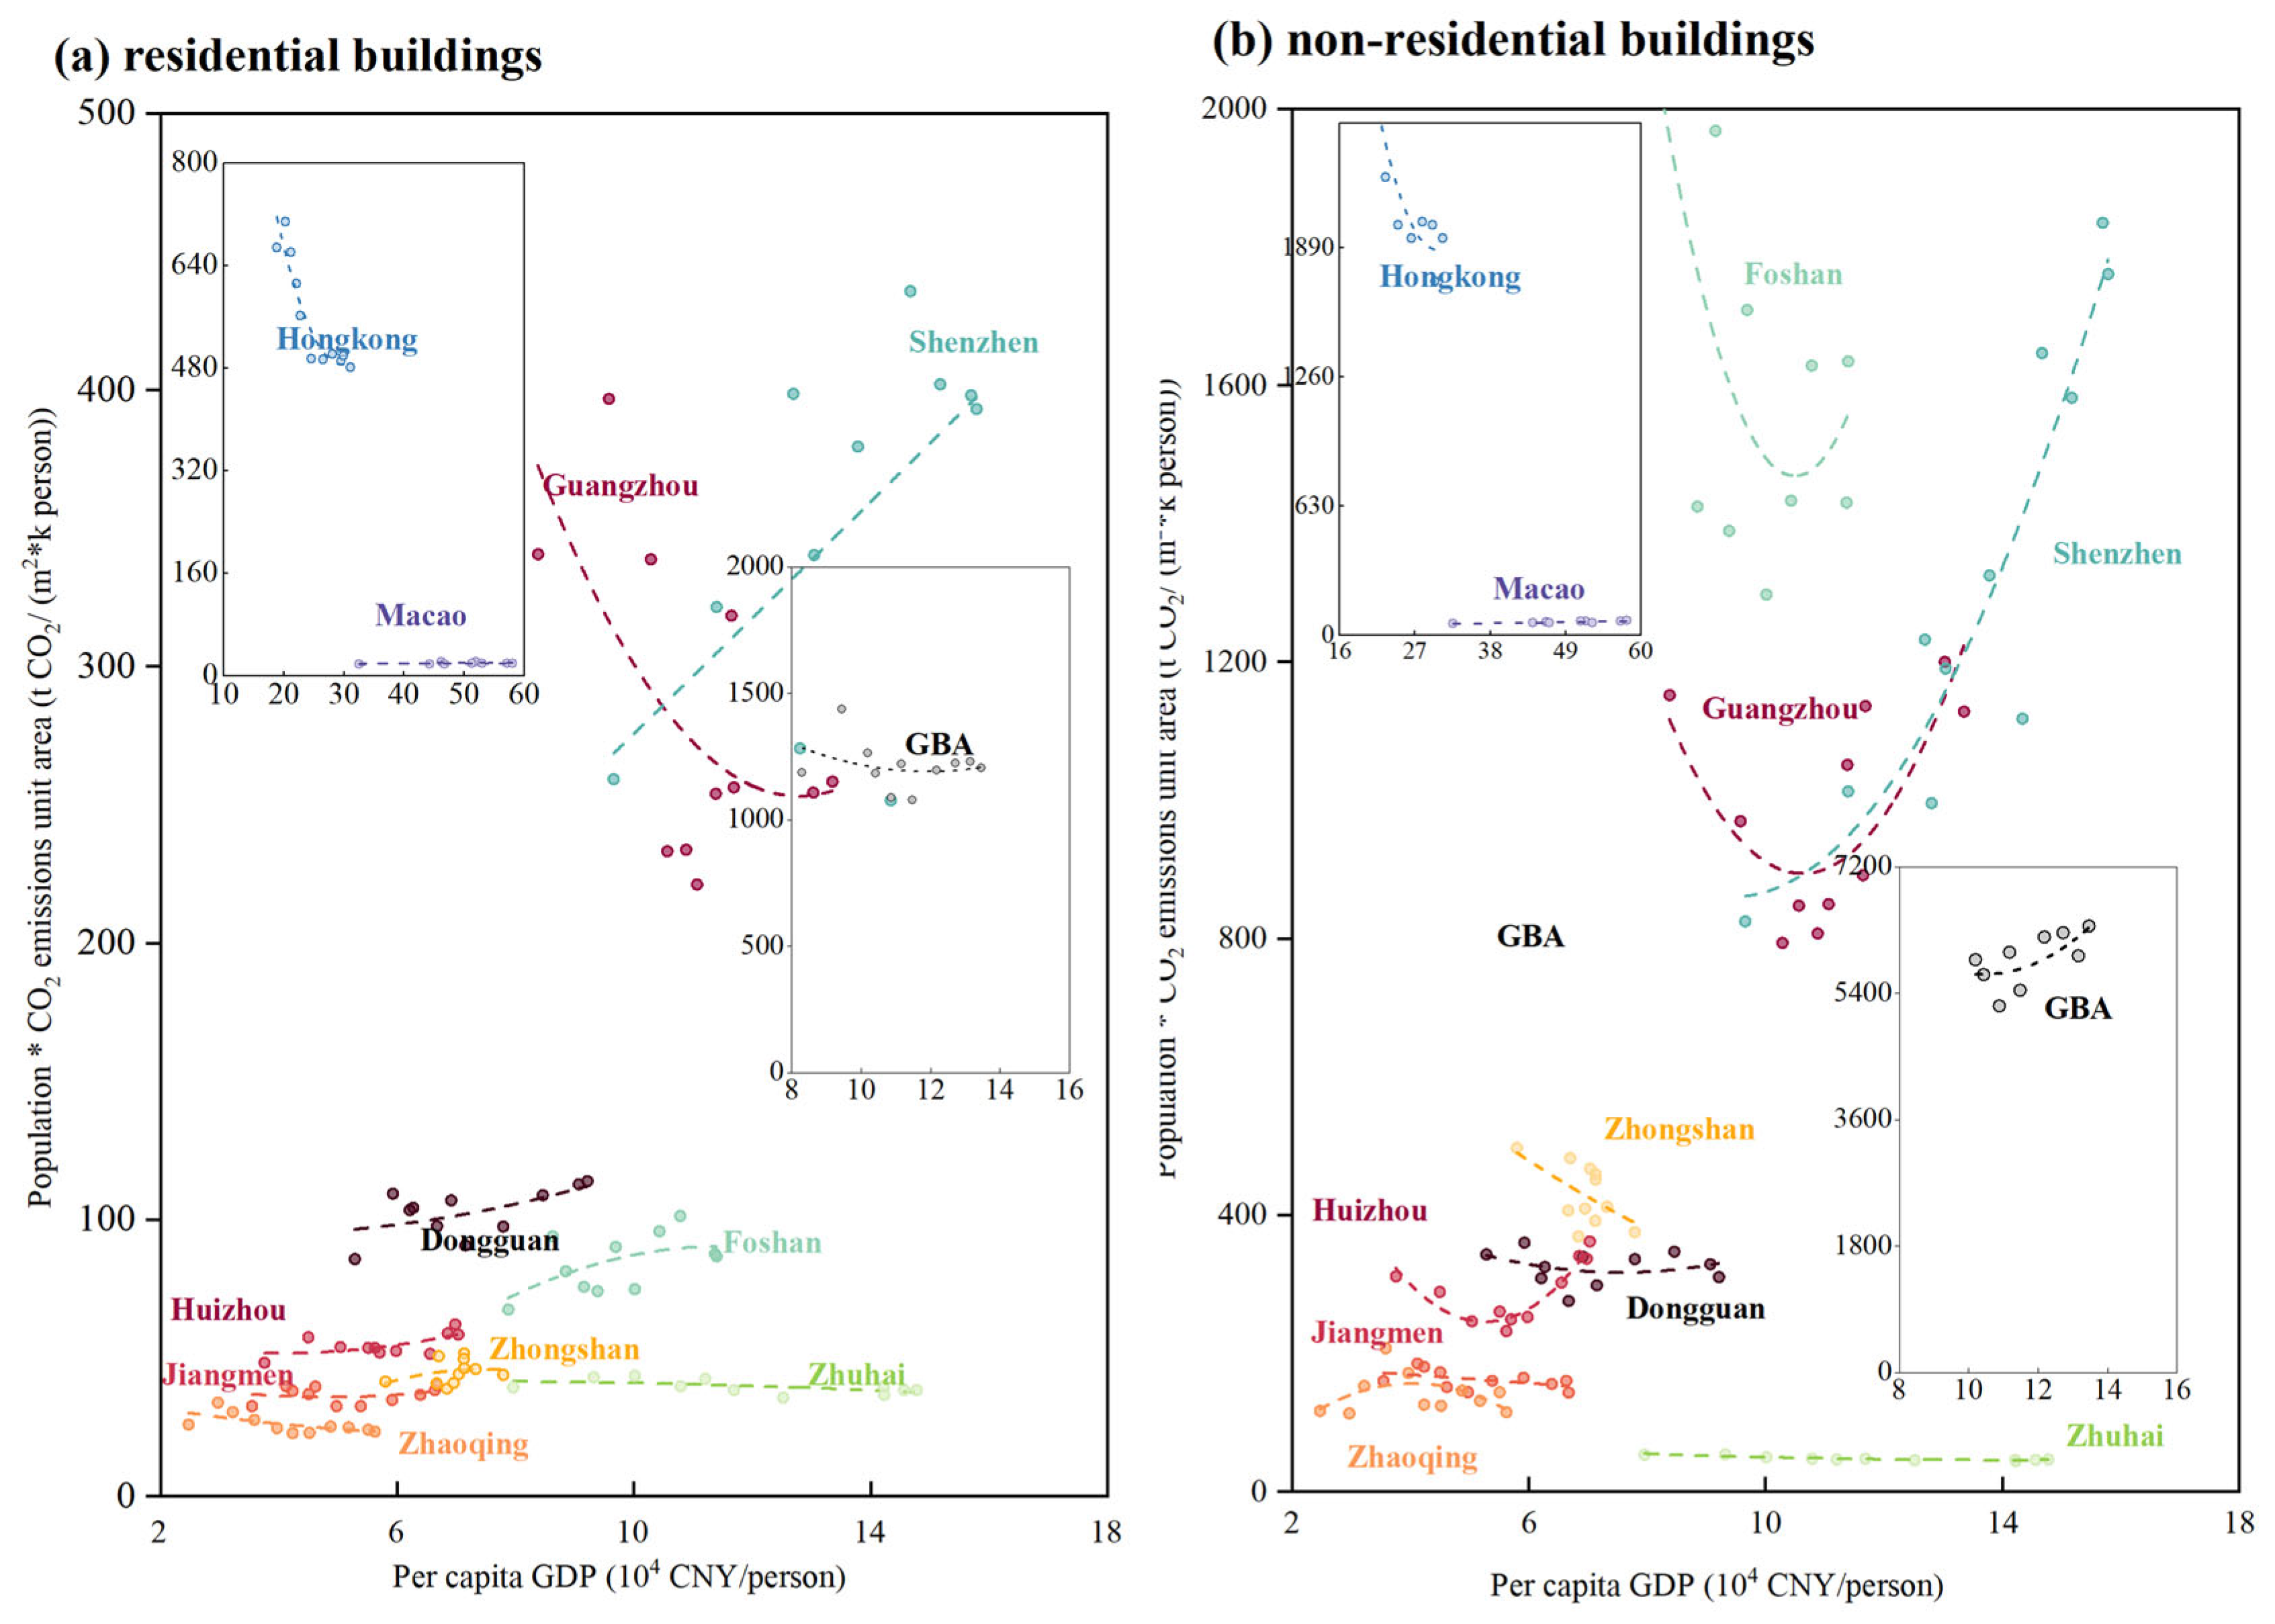
3.2. Driving Factors for Building CO2 Emissions in the GBA

Figure 2 shows the contribution of four driving factors in the Kaya identity (Equations (2) and (3)) to the changes seen in building CO2 emissions. For the GBA, EF contributed the largest mitigation, reaching 31.24 Mt CO2 and 4.29 Mt CO2 during the periods of 2010–2015 and 2016–2020, respectively. This can be attributed to two elements. The proportion of coal use decreased from 9% to 2%. Renewable power (e.g., hydro, wind, solar, and wind power) accounted for more than 62% of new capacity in the China South Grid, causing a 37% reduction in regional electricity EF. Due to a higher electrification rate, P&C buildings achieved greater decarbonization than residential buildings due to power decarbonization. In contrast, a quickly increasing population size made the largest positive contribution to building CO2 emissions in the GBA, reaching 16.12 Mt CO2 and 10.89 Mt CO2 during the periods of 2010–2015 and 2016–2020, respectively. Its developed economic conditions led to the GBA having a high birth rate and attracting a large influx of foreigners. Taking Guangdong province as an example, foreigners account for 23.5% of the permanent population. Several studies have pointed out that migration leads to significant building CO2 emissions in the provinces of southern China [35]. Thus, it is recommended that the GBA cities accelerate the implementation of building energy efficiency strategies and carefully plan future new buildings and the affiliated infrastructure, reducing the carbon lock-in effect [10,36] and embodied issues caused by the quick building stock turnover rate [37,38]. Increasing AS and EI with income growth also drove up the building CO2 emissions of the GBA, to which AS and EI contributed 5.17 and 6.87 Mt CO2, respectively.
At the city level, similarly to GBA, the decreased EF mitigated building CO2 emissions for all GBA cities, varying from 0.67 MtCO2 to 8.60 MtCO2. Due to higher electricity consumption, the accumulated mitigation contribution of EF was more than 6 MtCO2 in Hong Kong (8.60 MtCO2), Guangdong (6.62 MtCO2), and Shenzhen (6.71 MtCO2). Conversely, the increased population raised the building CO2 emissions for all GBA cities, varying from 0.67 MtCO2 to 8.60 MtCO2. Shenzhen and Guangzhou accounted for more than 60% of the positive contribution of the population due to their large influx of foreigners.
EI and AS showed different action orientations across building types and GBA cities. For EI, a positive contribution means that EI showed an increased trend. Thus, during the period from 2010 to 2020, the EI of residential buildings ( E I R E ) in most GBA cities increased. These increased E I R E rates resulted in 0.14–1.97 MtCO2 for GBA cities. E I R E values in Guangzhou reached their peak before 2015 and led to 2.96 MtCO2 of mitigation. E I R E values in Shenzhen and Zhuhai reached their peak before 2020 and led to 0.33 and 0.28 MtCO2 of mitigation. However, the EI values of P&B buildings ( E I P & C ) in Guangzhou, Dongguan, and Huizhou showed a decreased trend during the 2010–2015 period. E I P & C values rebounded during 2016–2020 with the rapid development of electricity-intensive technologies such as new information techniques, artificial intelligence, and electric vehicles. Some new policies are required to improve the load flexibility of related appliances consuming renewable energy, reducing CO2 emissions and security problems by increasing electricity demand. AS made a positive contribution in most GBA cities, varying from 0.68 to 6.03 MtCO2. AS made a negative contribution in Shenzhen and Macao. However, this phenomenon does not mean that the AS of Shenzhen is saturated. The AS of Shenzhen (29.96 m2/person) was lower than the average level in the GBA (43.32 m2/person). This decreased AS may be due to the rapid influx of foreigners. Thus, in the future, Shenzhen planners may need to construct a large number of buildings. It is recommended that Shenzhen should strengthen building energy efficiency standards and urban planning rules to limit the growth of final energy consumption.
Additionally, according to the number of GBA cities making negative contributions, the results indicate that, in order, EI, AS, and population numbers will be on a downward trend. In other words, the building CO2 emission unit area, per capita building CO2 emissions, and building CO2 emissions will reach their peaks, in that order. This order is consistent with data from the USA. Combining this order with EKC, Section 4 will further discuss the reasons for the inter-city difference in peak situation.

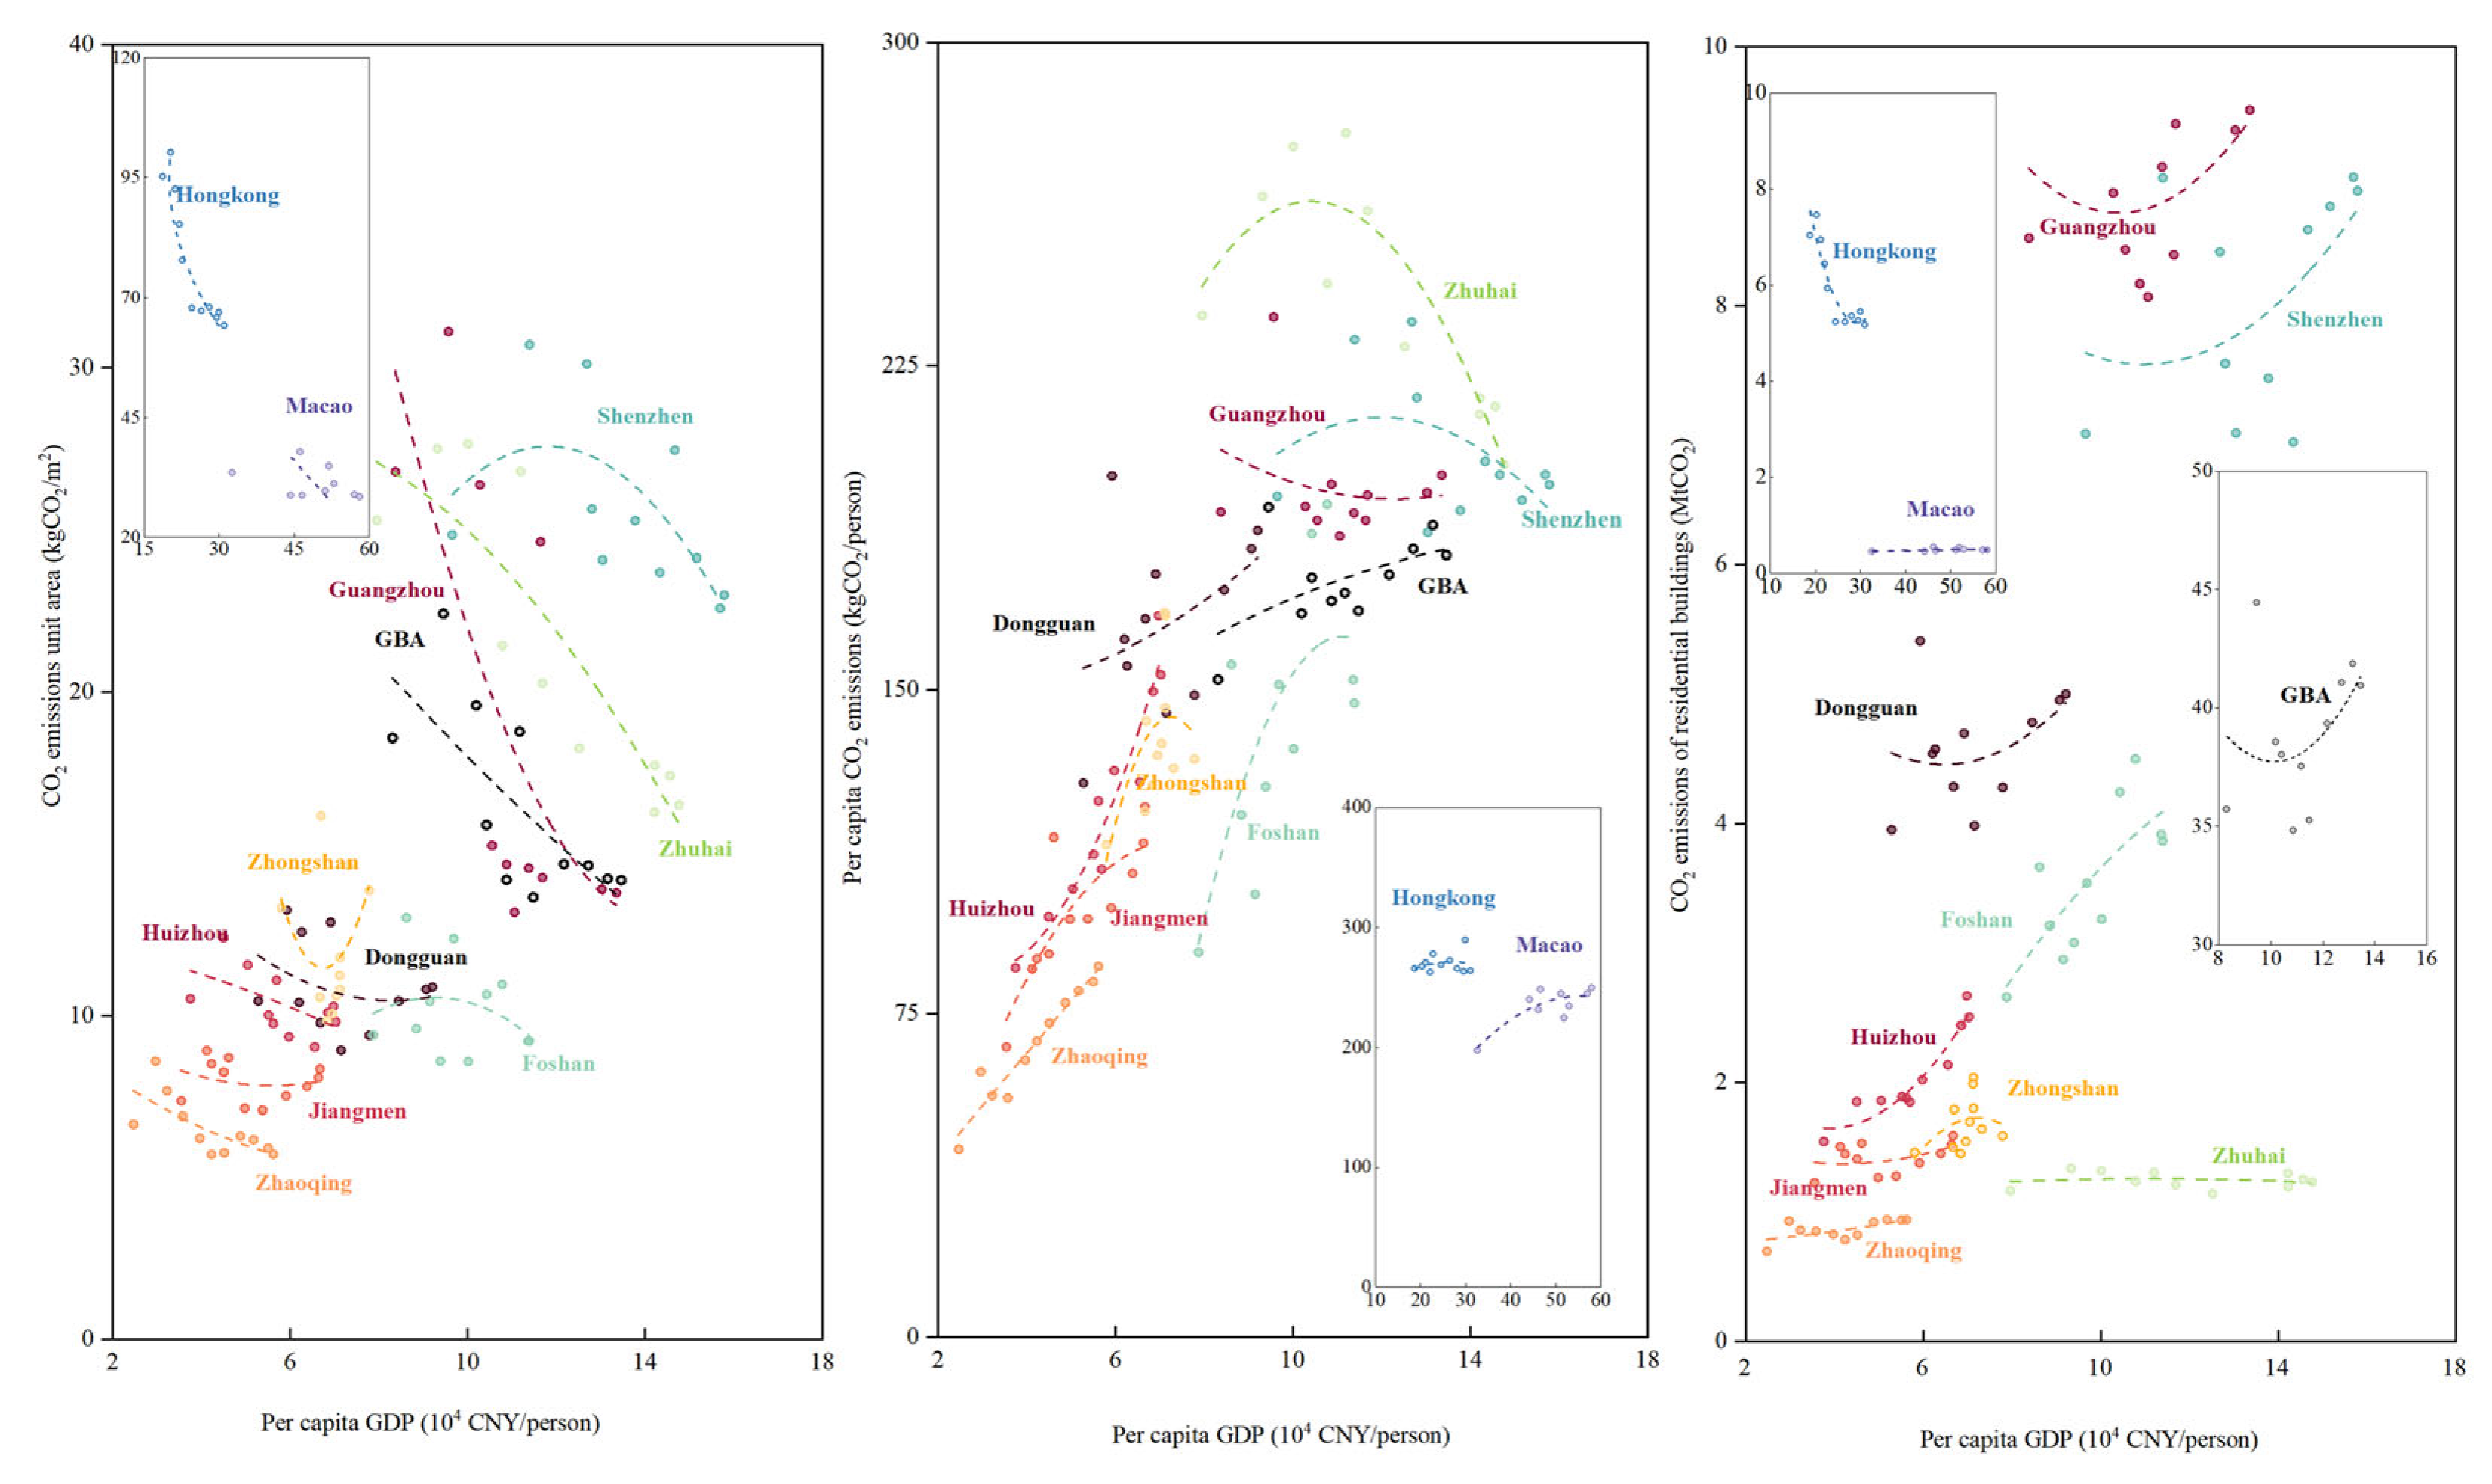
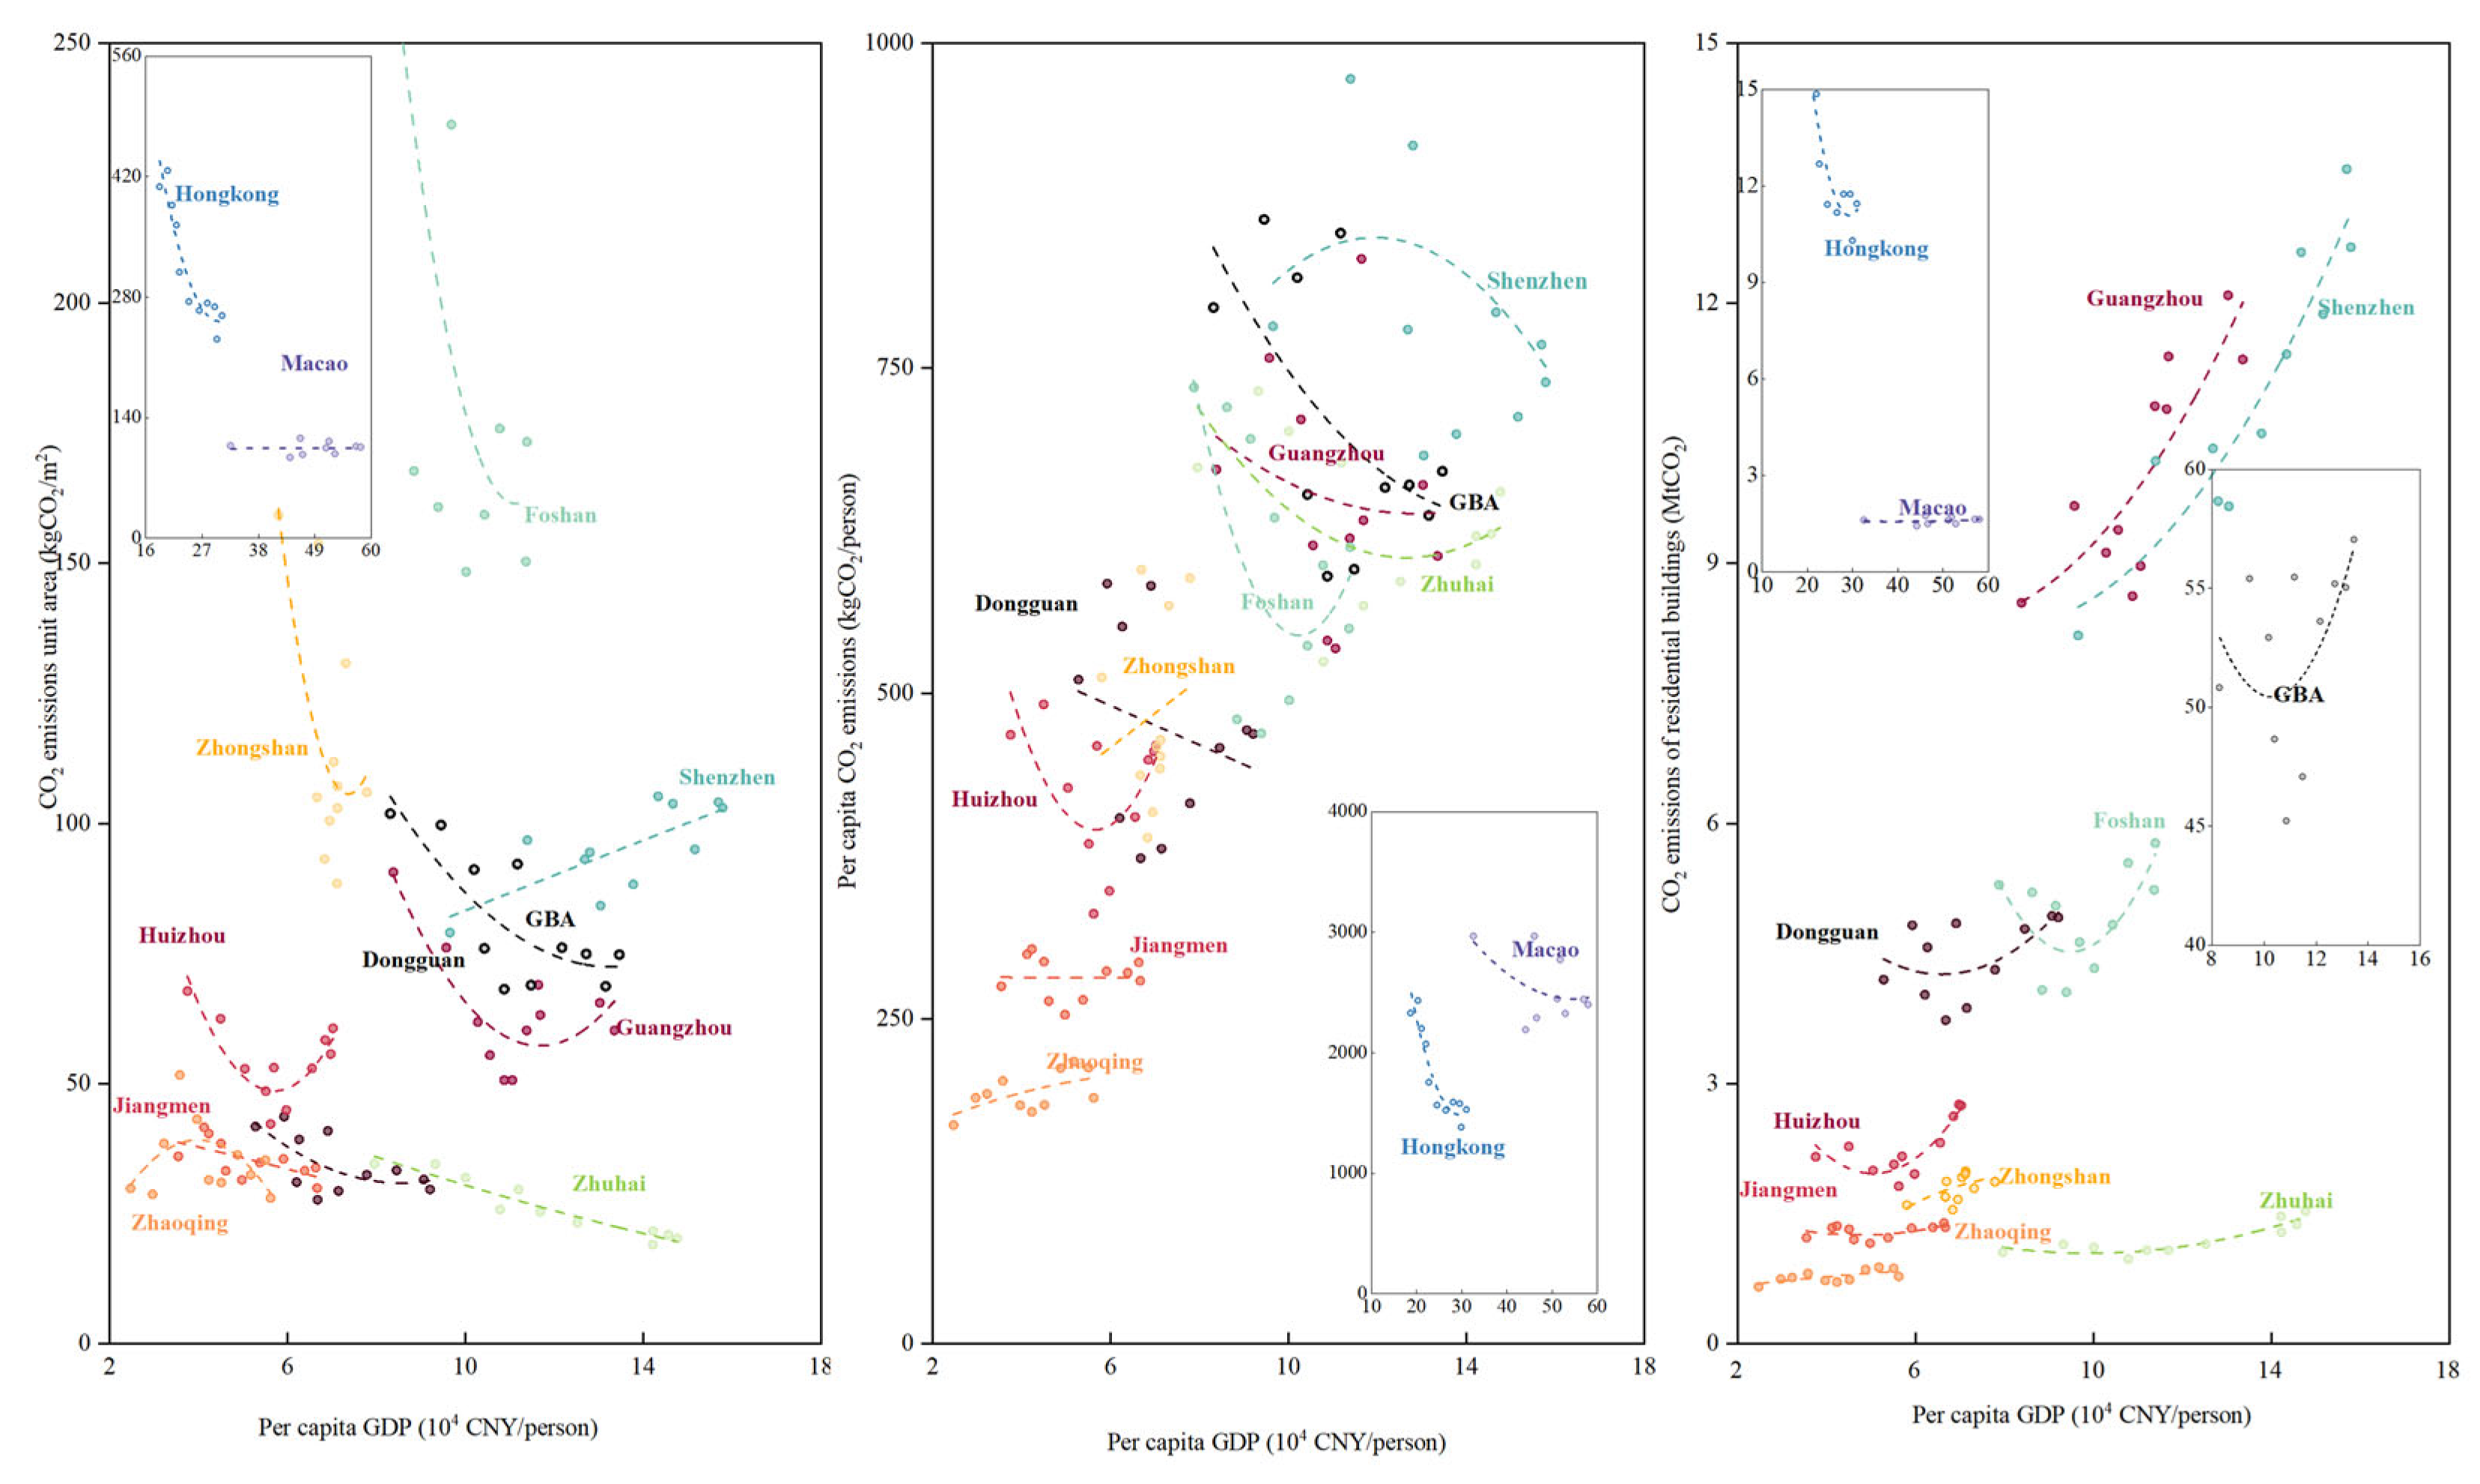
3.3. Peak Situation for Building CO2 Emissions in the GBA

Figure 3 represents the peak situation of overall, residential, and P&C buildings in GBA cities. The overall and residential building emissions of the GBA plateaued, while P&C buildings emissions maintained slow growth. At the city level, only Hong Kong emissions peaked, and its peak time was in 2011, while Macao emissions plateaued. In terms of residential buildings, Dongguan, Guangzhou, and Zhuhai emissions plateaued. Jiangmen, Zhaoqing, Zhongshan, and Shenzhen grew slowly, while Huizhou and Foshan grew quickly. For P&C buildings, only Shenzhen emissions grew quickly, while the emissions of other GBA cities in Guangdong province grew slowly.
In summary, in terms of overall building CO2 emissions, residential and P&C buildings dominated the rapid growth of emissions in Huizhou and Shenzhen, respectively. Other GBA cities have grown slowly, due to the equivalent slow growth of both residential and P&C buildings.

4. Discussion

The environmental Kuznets curve (EKC) is widely used to explore the relationship between economic development and CO2 emissions and evaluate future emission trends [39]. The EKC indicates that the relationship forms an inverted U-shaped curve [39]. In other words, CO2 emissions escalate along with economic growth. However, when income or the per capita GDP reaches a certain threshold, CO2 emissions decrease. In the building sector, economic development quickly drives the demand for building services (e.g., heating, cooling, and lighting), meaning that building CO2 emissions may be likely to increase early. With further economic development, the demand for building services is gradually satisfied. Meanwhile, building energy efficiency maintains an increasing trend due to technology scale effects, and building CO2 emissions may begin to decrease. Thus, we predicted that the relationship between building CO2 emissions and economic development would fit this EKC curve. We also employed the EKC to explore the reasons behind the inter-city difference in peak situations. Figure 4 and Figure 5 represent the EKCs of the CO2 emissions unit area (CI), per capita CO2 emissions, and CO2 emissions for residential and commercial buildings, respectively. We named the three EKC curves EKC1, EKC2, and EKC3.
Based on the Kaya identity (Equations (2) and (3)), building CO2 emissions were equal to the CO2 emissions unit area (EF×EI = CI), multiplied by AS and population. During economic development, the CO2 emissions unit area will increase with the growth of residents’ demand for building services (e.g., cooling, heating, lighting, warm water, and cooking appliances) in the early stages. However, cleaner energy and the enhanced energy efficiency of appliances will inhibit this increased trend, and CI will finally begin to drop. Meanwhile. AS and population numbers will be growing. Thus, the peak time of per capita CO2 emissions and CO2 emissions is later than that of CI. Several case studies on the country level and state/province level have confirmed that the peak time of CO2 emissions is later than that of per capita CO2 emissions [8,28]. However, due to the low birth rate and declining population numbers in some developed regions, the peak time of CO2 emissions may be later than that of per capita CO2 emissions. The contribution of driving factors in Section 3.2 confirmed that the population will continue to grow after AS saturation since the GBA is a developed region of China and has a strong demographic attraction. Thus, the building peak sequence of GBA cities follows the order: CI > per capita building CO2 emissions > building CO2 emissions. Some GBA cities confirmed this order, such as the residential buildings in Zhuhai, Foshan, Jiangmen, and Shenzhen, and P&C buildings in GBA.
Furthermore, we considered the reasons behind the inter-city difference in peak situation. In the first stage (EKC1), residential (Figure 4) and P&C buildings (Figure 5) in all GBA cities have reached a turning point, decoupling CI and economic development. The end-use service demand unit area is saturated, or even declining, due to the dilution effect of the increased AS (i.e., non-area-based services leveled out over a larger building floor area, such as the TV, refrigerator, and cooking appliances). The older and carbon/energy-intensive methods used to meet power requirements are replaced by sustainable solutions such as air conditioners with a high COP, more effective building envelopes, and renewable power in electricity systems.
In the second stage (EKC2), there are some differences in the peak situation, which are mainly caused by the different growth rates of AS. In terms of residential buildings, the GBA did not achieve a decoupling between per capita CO2 emissions and economic development. However, those cities (i.e., Hong Kong, Shenzhen, and Guangzhou) with the top three per capita CO2 emission levels have reached a turning point. The rapid increase in AS in Huizhou, Jiangmen, Zhaoqing, Zhongshan, and Dongguan dominated the growth of per capita building CO2 emissions. Conversely, the per capita P&C building CO2 emissions of the GBA reached a peak. Only Zhaoqing and Zhongshan could not decouple their per capita P&C building CO2 emissions and economic development, but their P&C building stock accounted for a low share of GBA P&C building stock and did not affect the peak situation of P&C buildings in the GBA in the second stage. Furthermore, it is recommended that the governments of cities with a high AS growth rate should formulate reasonable urban plans and a residential building red line, thereby inhibiting excessive growth and reducing the positive contribution of AS. Meanwhile, this strategy also helps to reduce building-embodied emissions from building raw materials.
In the third stage, comprising the results in Section 3.3, only Hong Kong achieved decoupling between building CO2 emissions and economic conditions and reached a peak of building CO2 emissions. To further explore whether it is the population or the AS that is causing this non-peak, we added an EKC depicting the relationship between population*CI and per capita GDP, named EKC4 (Figure A1 in Appendix A). In terms of residential buildings, the GBA did not reach a turning point in EKC2 and EKC4, indicating that, together, the growth of population and AS caused the non-peaking of the residential buildings in the GBA. Shenzhen, Jiangmen, Macao, Dongguan, and Huizhou exhibited similar conditions. Guangzhou and Zhaoqing reached the turning point in EKC4 and did not reach the turning point in EKC2, indicating that AS mainly caused a non-peak. Foshan reached the turning point in EKC2 and did not reach the turning point in EKC4, indicating that the population contribution mainly caused a non-peak. A similar assessment can be used on P&C buildings. Specifically, together, the population and AS factors led to Huizhou not reaching the peak of P&C building CO2 emissions. AS mainly caused Zhaoqing, Foshan, Dongguan, Jiangmen, Zhongshan, and Zhuhai not to reach the peak of P&C building CO2 emissions. The population factor caused Shenzhen, Guangzhou, and Macao not to reach the peak of P&C building CO2 emissions. Furthermore, for GBA cities with rapid population growth, the building stock will maintain a rapidly increasing trend that is difficult to mitigate. Thus, we suggest offsetting the emissions from population growth by a more rapid reduction in EI. The suggested strategies include improving the energy efficiency of appliances [40], guidance building utilization behaviors [36,40], the utilization of on-site renewables (e.g., PVs, ground source heat pumps, and biomass) [1], and new building energy efficiency standards [41]. Meanwhile, considering the long lifetime of buildings, new building energy efficiency standards will also help to significantly reduce the carbon lock-in effect in the future.

5. Conclusions

A scientific understanding of the historical peak situation and rules of building CO2 emissions is the basis for formulating reasonable building peak strategies. The GBA is the largest and most populous bay area worldwide and nearly covers all Chinese city types. The peak situation and rules of GBA cities can provide valuable insight for other cities. This study quantified the historical building CO2 emissions of GBA cities and further assessed the historical peak situation using the MK trend test method. The main results are as follows.
  • The building CO2 emissions of the GBA slowly increased to 96.90 Mt CO2 by 2020. P&C buildings accounted for a larger proportion, maintaining emissions at nearly 57%. Electricity dominated the building energy consumption emissions. Shenzhen, Guangzhou, and Hong Kong were responsible for the top three building CO2 emissions values, reaching 15.75, 20.86, and 22.54 Mt CO2 by 2020, respectively.
  • Emission factors made the largest mitigation contribution for building CO2 emissions in the GBA, reaching 35.53 Mt CO2. Conversely, population, and final energy consumption unit area and per capita drove building CO2 emissions in the GBA, reaching 27.02, 9.93, and 8.95 Mt CO2, respectively.
  • The overall building and residential building emissions of the GBA plateaued, while P&C building emissions maintained slow growth. At the city level, Hong Kong emissions peaked, while Dongguan and Macao emissions plateaued. Residential and P&C building emissions dominated the quick growth in Huizhou and Shenzhen, respectively. Other GBA cities have grown more slowly.
  • In GBA cities, CO2 emissions per unit area, per capita of building CO2 emissions, and building CO2 emissions reached a peak in that order.
This study offers valuable insights into and methodologies for the assessment of the peak situation of building CO2 emissions. However, several gaps in the literature need to be addressed in future research. Firstly, this study only focuses on the peak situation of the building sector in GBA cities. However, the building sector of other cities in other climate zones or economic conditions will have different characteristics, including climate conditions, building performance, and occupants’ behavior. Future studies can extend the study cases to provide more insight into different cities. In addition, the current study analyzed the potential peak situation by depicting the relationship between economic development and emission-related indicators, instead of bottom-up modeling, which hinders the formulation of detailed policies and targets for building energy efficiency. Future studies can develop building end-use technique models to evaluate the emission trend and technological economics of different building decarbonization scenarios.

Author Contributions

Conceptualization, K.Y. and X.W.; methodology, X.W. and Y.L.; software, X.W.; validation, X.W., Y.L. and K.Y.; formal analysis, Y.L.; investigation, K.Y.; resources, K.Y.; data curation, Y.L.; writing—original draft preparation, X.W. and Y.L.; writing—review and editing, Y.L.; visualization, Y.L.; supervision, K.Y.; project administration, K.Y.; funding acquisition, K.Y. All authors have read and agreed to the published version of the manuscript.

Funding

This research was funded by China Postdoctoral Science Foundation (no. 2024M754102), the Postdoctoral Fellowship Program of CPSF (no. GZB20240939), and the Beijing Natural Science Foundation (no. 9254035).

Data Availability Statement

The original contributions presented in the study are included in the article. Further inquiries can be directed to the corresponding author.

Conflicts of Interest

The authors declare no conflict of interest.

Appendix A

Figure A1. The relationship between population*CI and economic indicators.
Buildings 15 01927 g0a1

References

  1. You, K.; Ren, H.; Cai, W.; Huang, R.; Li, Y. Modeling carbon emission trend in China’s building sector to year 2060. Resour. Conserv. Recycl. 2023, 188, 106679. [Google Scholar] [CrossRef]
  2. Yan, R.; Zhou, N.; Ma, M.; Mao, C. India’s residential space cooling transition: Decarbonization ambitions since the turn of millennium. Appl. Energy 2025, 391, 125929. [Google Scholar] [CrossRef]
  3. Li, X.; Lin, C.; Lin, M.; Jim, C.Y. Drivers and spatial patterns of carbon emissions from residential buildings: An empirical analysis of Fuzhou city (China). Build. Environ. 2024, 257, 111534. [Google Scholar] [CrossRef]
  4. Scofield, J.H. Efficacy of LEED-certification in reducing energy consumption and greenhouse gas emission for large New York City office buildings. Energy Build. 2013, 67, 517–524. [Google Scholar] [CrossRef]
  5. Heisel, F.; McGranahan, J.; Ferdinando, J.; Dogan, T. High-resolution combined building stock and building energy modeling to evaluate whole-life carbon emissions and saving potentials at the building and urban scale. Resour. Conserv. Recycl. 2022, 177, 106000. [Google Scholar] [CrossRef]
  6. Xiang, X.; Zhou, N.; Ma, M.; Feng, W.; Yan, R. Global transition of operational carbon in residential buildings since the millennium. Adv. Appl. Energy 2023, 11, 100145. [Google Scholar] [CrossRef]
  7. Xiang, X.; Ma, M.; Ma, X.; Chen, L.; Cai, W.; Feng, W.; Ma, Z. Historical decarbonization of global commercial building operations in the 21st century. Appl. Energy 2022, 322, 119401. [Google Scholar] [CrossRef]
  8. Yan, R.; Chen, M.; Xiang, X.; Feng, W.; Ma, M. Heterogeneity or illusion? Track the carbon Kuznets curve of global residential building operations. Appl. Energy 2023, 347, 121441. [Google Scholar] [CrossRef]
  9. Huo, T.; Ren, H.; Zhang, X.; Cai, W.; Feng, W.; Zhou, N.; Wang, X. China’s energy consumption in the building sector: A Statistical Yearbook-Energy Balance Sheet based splitting method. J. Clean. Prod. 2018, 185, 665–679. [Google Scholar] [CrossRef]
  10. Li, Y.; You, K.; Cai, W. Lock-in effect of infrastructures metabolism in China’s residential centralized heating: View from consumption and production end. Sustain. Cities Soc. 2025, 119, 106067. [Google Scholar] [CrossRef]
  11. Wang, Y.; Guo, J.; Yue, Q.; Chen, W.-Q.; Du, T.; Wang, H. Total CO2 emissions associated with buildings in 266 Chinese cities: Characteristics and influencing factors. Resour. Conserv. Recycl. 2023, 188, 106692. [Google Scholar] [CrossRef]
  12. You, K.; Li, R.; Yu, Y.; Cai, W. Investigating CO2 emissions and disparity from China’s central heating: A perspective at the city level. Environ. Impact Assess. Rev. 2023, 103, 107270. [Google Scholar] [CrossRef]
  13. Wang, Z.; Yang, Z.; Zhang, B.; Li, H.; He, W. How does urbanization affect energy consumption for central heating: Historical analysis and future prospects. Energy Build. 2022, 255, 111631. [Google Scholar] [CrossRef]
  14. Huang, W.; Li, F.; Cui, S.-h.; Li, F.; Huang, L.; Lin, J.-y. Carbon Footprint and Carbon Emission Reduction of Urban Buildings: A Case in Xiamen City, China. Procedia Eng. 2017, 198, 1007–1017. [Google Scholar] [CrossRef]
  15. Huang, R.; Zhang, X.; Liu, K. Assessment of operational carbon emissions for residential buildings comparing different machine learning approaches: A study of 34 cities in China. Build. Environ. 2024, 250, 111176. [Google Scholar] [CrossRef]
  16. Geng, J.; Wang, J.; Huang, J.; Zhou, D.; Bai, J.; Wang, J.; Zhang, H.; Duan, H.; Zhang, W. Quantification of the carbon emission of urban residential buildings: The case of the Greater Bay Area cities in China. Environ. Impact Assess. Rev. 2022, 95, 106775. [Google Scholar] [CrossRef]
  17. Fenner, A.E.; Kibert, C.J.; Woo, J.; Morque, S.; Razkenari, M.; Hakim, H.; Lu, X. The carbon footprint of buildings: A review of methodologies and applications. Renew. Sustain. Energy Rev. 2018, 94, 1142–1152. [Google Scholar] [CrossRef]
  18. Cai, W.; Tian, P.; You, K.; Yu, Y.; Li, Y. Mitigating or Pushing? Unravelling the dual impact of lifetime on the CO2 Emissions from China’s Urban Residential Building sector. Build. Environ. 2025, 281, 113236. [Google Scholar] [CrossRef]
  19. Yu, Y.; You, K.; Cai, W.; Feng, W.; Li, R.; Liu, Q.; Chen, L.; Liu, Y. City-level building operation and end-use carbon emissions dataset from China for 2015–2020. Sci. Data 2024, 11, 138. [Google Scholar] [CrossRef]
  20. Yi, J. China Building Energy Efficiency Annual Development Research Report (2022); China Construction Industry Press: Beijing, China, 2022; pp. 22–35. [Google Scholar]
  21. Kaya, Y. Impact of carbon dioxide emission control on GNP growth: Interpretation of proposed scenarios. Intergov. Panel Clim. Change/Response Strateg. Work. Group 1989. Available online: https://archive.ipcc.ch/publications_and_data/publications_ipcc_first_assessment_1990_wg3.shtml (accessed on 12 July 2023).
  22. Breton, C.; Blanchet, P.; Amor, B.; Pomponi, F. A novel method to calculate SSP-consistent remaining carbon budgets for the building sector: A case study of Canada. Build. Environ. 2025, 269, 112474. [Google Scholar] [CrossRef]
  23. Zhang, S.; Wang, M.; Jiang, H.; Guan, D. Deep learning-based stepwise peaking roadmap of carbon emissions in Chinese provincial building sector. Build. Environ. 2025, 270, 112505. [Google Scholar] [CrossRef]
  24. Ang, B.W. LMDI decomposition approach: A guide for implementation. Energy Policy 2015, 86, 233–238. [Google Scholar] [CrossRef]
  25. Xiao, W.; Song, W.; Pei, X.; Wang, L. Drivers of Carbon Emissions in China’s Construction Industry: A Perspective from Interregional Carbon Transfer. Buildings 2025, 15, 1667. [Google Scholar] [CrossRef]
  26. You, K.; Li, Y.; Feng, W.; Cai, W.; Ma, M. A provincial analysis of centralized heating systems decarbonization in China’s residential sector: History and future. Sustain. Cities Soc. 2024, 104, 105306. [Google Scholar] [CrossRef]
  27. Levin, K.; Finnegan, J.; Rich, D.; Bhatia, P. Mitigation Goal Standard. 2014. Available online: https://www.wri.org/publication-license-type/creative-commons (accessed on 12 July 2023).
  28. Li, R.; Yu, Y.; Cai, W.; Liu, Q.; Liu, Y.; Zhou, H. Interprovincial differences in the historical peak situation of building carbon emissions in China: Causes and enlightenments. J. Environ. Manag. 2023, 332, 117347. [Google Scholar] [CrossRef]
  29. Mann, H.B. Nonparametric tests against trend. Econom. J. Econom. Soc. 1945, 13, 245–259. [Google Scholar] [CrossRef]
  30. Jhajharia, D.; Shrivastava, S.K.; Sarkar, D.; Sarkar, S. Temporal characteristics of pan evaporation trends under the humid conditions of northeast India. Agric. For. Meteorol. 2009, 149, 763–770. [Google Scholar] [CrossRef]
  31. Yue, S.; Pilon, P.; Phinney, B.; Cavadias, G. The influence of autocorrelation on the ability to detect trend in hydrological series. Hydrol. Process. 2002, 16, 1807–1829. [Google Scholar] [CrossRef]
  32. CABEE. China Building Energy and Emission Database. 2021. Available online: https://mp.weixin.qq.com/s?__biz=MzIxODcxNDEwOQ%3D%3D&mid=2247483775&idx=1&sn=9c2ca03802b22423853f73414162b968&scene=45#wechat_redirect (accessed on 12 July 2023).
  33. Zhong, W.; Liu, Y.; Dong, K.; Ni, G. Assessing the synergistic effects of artificial intelligence on pollutant and carbon emission mitigation in China. Energy Econ. 2024, 138, 107829. [Google Scholar] [CrossRef]
  34. Ou, J.; Xie, J.; Liu, X. Large disparities in spatiotemporal distributions of building carbon emissions across China. Build. Environ. 2025, 274, 112778. [Google Scholar] [CrossRef]
  35. Shi, G.; Lu, X.; Deng, Y.; Urpelainen, J.; Liu, L.-C.; Zhang, Z.; Wei, W.; Wang, H. Air Pollutant Emissions Induced by Population Migration in China. Environ. Sci. Technol. 2020, 54, 6308–6318. [Google Scholar] [CrossRef] [PubMed]
  36. You, K.; Qian, Q.K.; Cai, W.; Wang, X.; Visscher, H. Subsidy allocation for residential building energy retrofit: A perspective of families’ incomes. Sustain. Cities Soc. 2024, 104, 105317. [Google Scholar] [CrossRef]
  37. Chen, W.; Yang, S.; Zhang, X.; Jordan, N.D.; Huang, J. Embodied energy and carbon emissions of building materials in China. Build. Environ. 2022, 207, 108434. [Google Scholar] [CrossRef]
  38. Lu, H.; You, K.; Feng, W.; Zhou, N.; Fridley, D.; Price, L.; de la Rue du Can, S. Reducing China’s building material embodied emissions: Opportunities and challenges to achieve carbon neutrality in building materials. iScience 2024, 27, 109028. [Google Scholar] [CrossRef]
  39. Lin, B.; Liu, H. CO2 emissions of China’s commercial and residential buildings: Evidence and reduction policy. Build. Environ. 2015, 92, 418–431. [Google Scholar] [CrossRef]
  40. Delzendeh, E.; Wu, S.; Lee, A.; Zhou, Y. The impact of occupants’ behaviours on building energy analysis: A research review. Renew. Sustain. Energy Rev. 2017, 80, 1061–1071. [Google Scholar] [CrossRef]
  41. Yu, F.; Feng, W.; Luo, M.; You, K.; Ma, M.; Jiang, R.; Leng, J.; Sun, L. Techno-economic analysis of residential building heating strategies for cost-effective upgrades in European cities. iScience 2023, 26, 107541. [Google Scholar] [CrossRef]
Figure 1. Historical final energy consumption and CO2 emissions figures for the GBA cities.
Buildings 15 01927 g001
Figure 2. The contribution of driving factors on CO2 emissions from buildings.
Buildings 15 01927 g002
Figure 3. The peak situation of building CO2 emissions in GBA cities.
Buildings 15 01927 g003
Figure 4. The relationship between residential building emissions and economic indicators.
Buildings 15 01927 g004
Figure 5. The relationship between P&C building emissions and economic indicators.
Buildings 15 01927 g005
Disclaimer/Publisher’s Note: The statements, opinions and data contained in all publications are solely those of the individual author(s) and contributor(s) and not of MDPI and/or the editor(s). MDPI and/or the editor(s) disclaim responsibility for any injury to people or property resulting from any ideas, methods, instructions or products referred to in the content.

