4.1. Datasets
DeepCrack. The DeepCrack dataset [
32] is a publicly available dataset specifically designed for crack segmentation, comprising 537 RGB images along with manually annotated mask images. As shown in the first row of
Figure 5, each image and its corresponding mask have a resolution of 544 × 284 pixels. In this paper, we follow the original setup and divide DeepCrack into training and testing sets, containing 300 and 237 image/mask pairs, respectively.
Crack500. The public Crack500 dataset [
33] is collected using mobile phones on the main campus of Temple University, as shown in the second row of
Figure 5. Each image and its corresponding annotated mask contain pavement cracks, with a resolution of approximately 2000 × 1500 pixels. In the original dataset, the training, validation, and testing sets are divided into 250, 50, and 200 images, respectively. To balance the high resolution of the images and limited computational resources, these high-resolution images are cropped into 16 non-overlapping sub-regions, and only slices containing more than 1000 crack pixels are retained. Based on this approach, the training, validation, and testing data consist of 1896, 348, and 1124 image patches, respectively.
CFD. The CFD dataset [
34] is collected using an iPhone 5 on urban road surfaces in Beijing. As shown in the last row of
Figure 5, the challenges of the CFD dataset include complex backgrounds, uneven illumination, and interference from various obstructions, such as water stains, oil spots, and lane lines. The dataset consists of 118 images with a resolution of
, along with manually annotated masks. In our experiments, the dataset is split into training and testing sets in a 6:4 ratio, respectively.
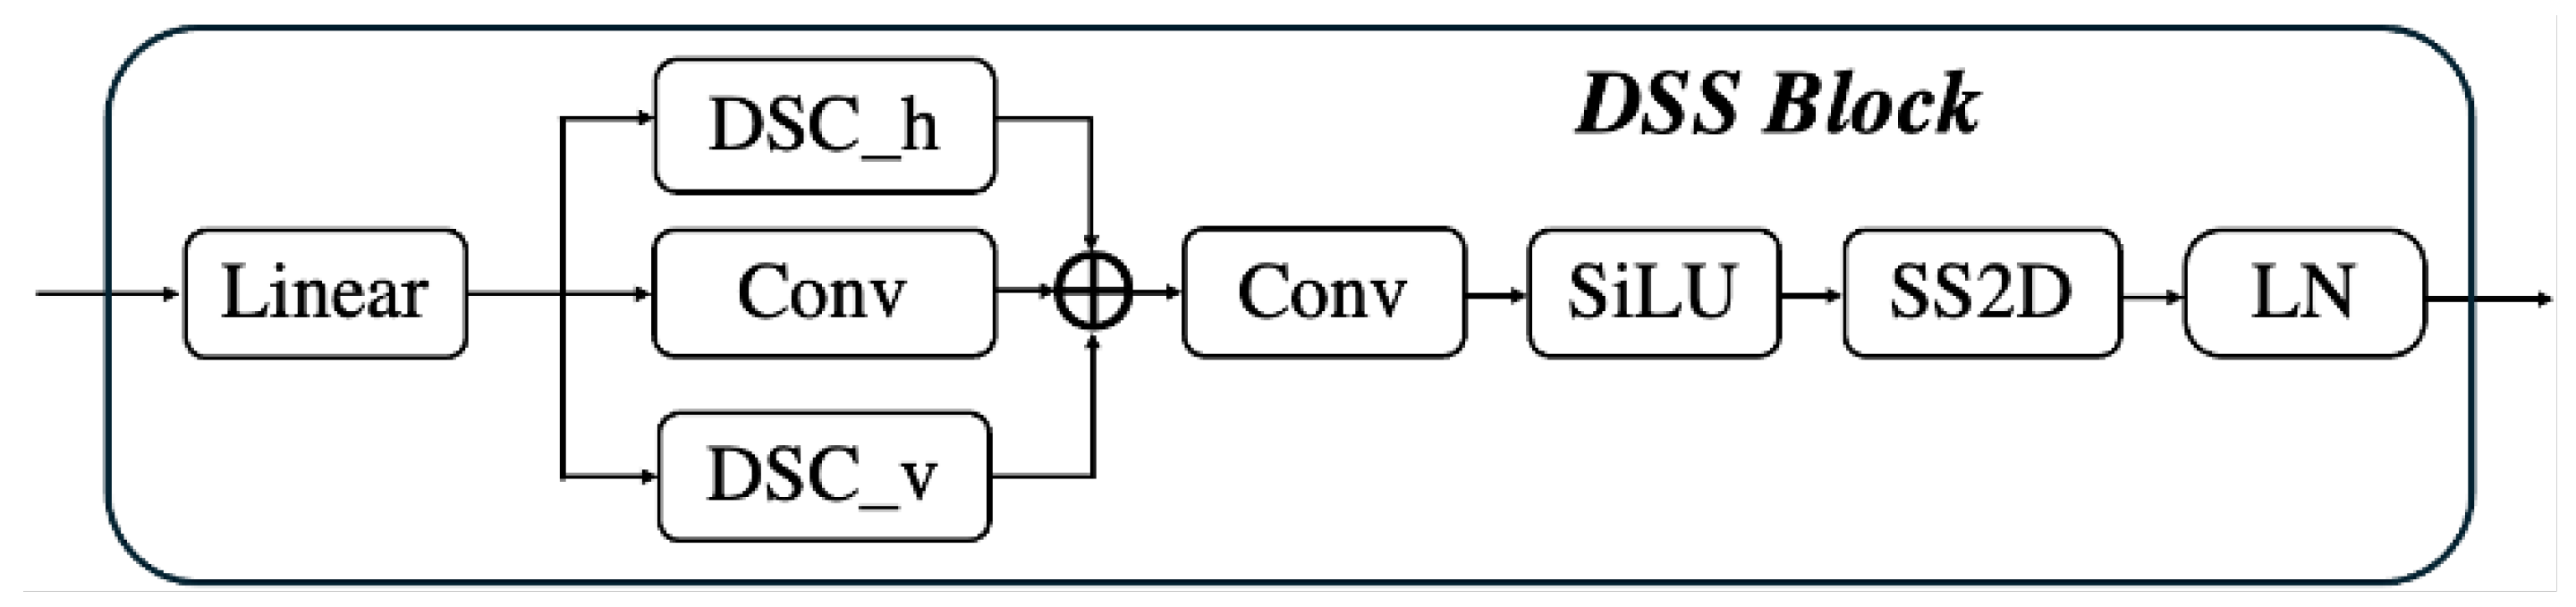
4.3. Implementation Details
All the experiments in this study were conducted on a server equipped with the Ubuntu 18.04 operating system and a GeForce RTX 3070 8GB GPU. For the software environment, we chose the PyTorch 2.0 framework and set up the necessary dependencies using Anaconda version 23.5.2. During model training, we meticulously configured the hyperparameters: the batch size was set as 4, and the initial learning rate and training iterations were 0.0001 and 80,000, respectively. The AdamW optimizer was utilized to optimize deep learning models. In addition, to effectively prevent overfitting, we employed data augmentation techniques, including random flipping, random cropping, and random deformation, as well as rotation, color jittering, and scaling operations. All the images were resized to . The hyperparameter in the loss function was set to 0.6.
4.4. Comparison Experiments
We compared the proposed method with fifteen different segmentation methods, including FCN [
19], U-Net [
28], MobileNetV1 [
10], MobileNetV2 [
11], MobileNetV3 (small version) [
9], DeepLabv3+ [
6] (Resnet-50 as backbone), Swin Transformer (tiny version) [
35], SegFormer (b0 version) [
36], CrackSegNet [
37], CrackW-Net [
38], TEED [
39], CrackFormer [
40], DECSNet [
41] (Resnet-50 as backbone), RHACrackNet [
2] and CarNet [
42] (MobileNetV3-small as backbone) on three public datasets. Note that the methods without marking the backbone network keep the same configuration as the original methods. These methods can be divided into specialized real-time crack segmentation methods and general segmentation models. Moreover, all the methods were loaded with pre-trained weights on the ImageNet-1K dataset [
43].
We quantified the performance of all methods on the DeepCrack dataset and recorded the results in
Table 1. Upon observation, we found that the proposed model achieved the highest scores across all metrics. Compared to the general-purpose Unet, our proposed method outperformed in
,
,
,
, and
scores by 5.18%, 2.53%, 9.97%, 0.47% and 2.28%, respectively. Additionally, the proposed method surpassed the CarNet model, which is specifically designed for crack segmentation, by 0.48% in
, 1.09% in
, 1.07% in
, 0.16% in
, and 0.1% in
. For an intuitive comparison, we visualized the top performance models including Unet, RHACrackNet and CarNet methods in
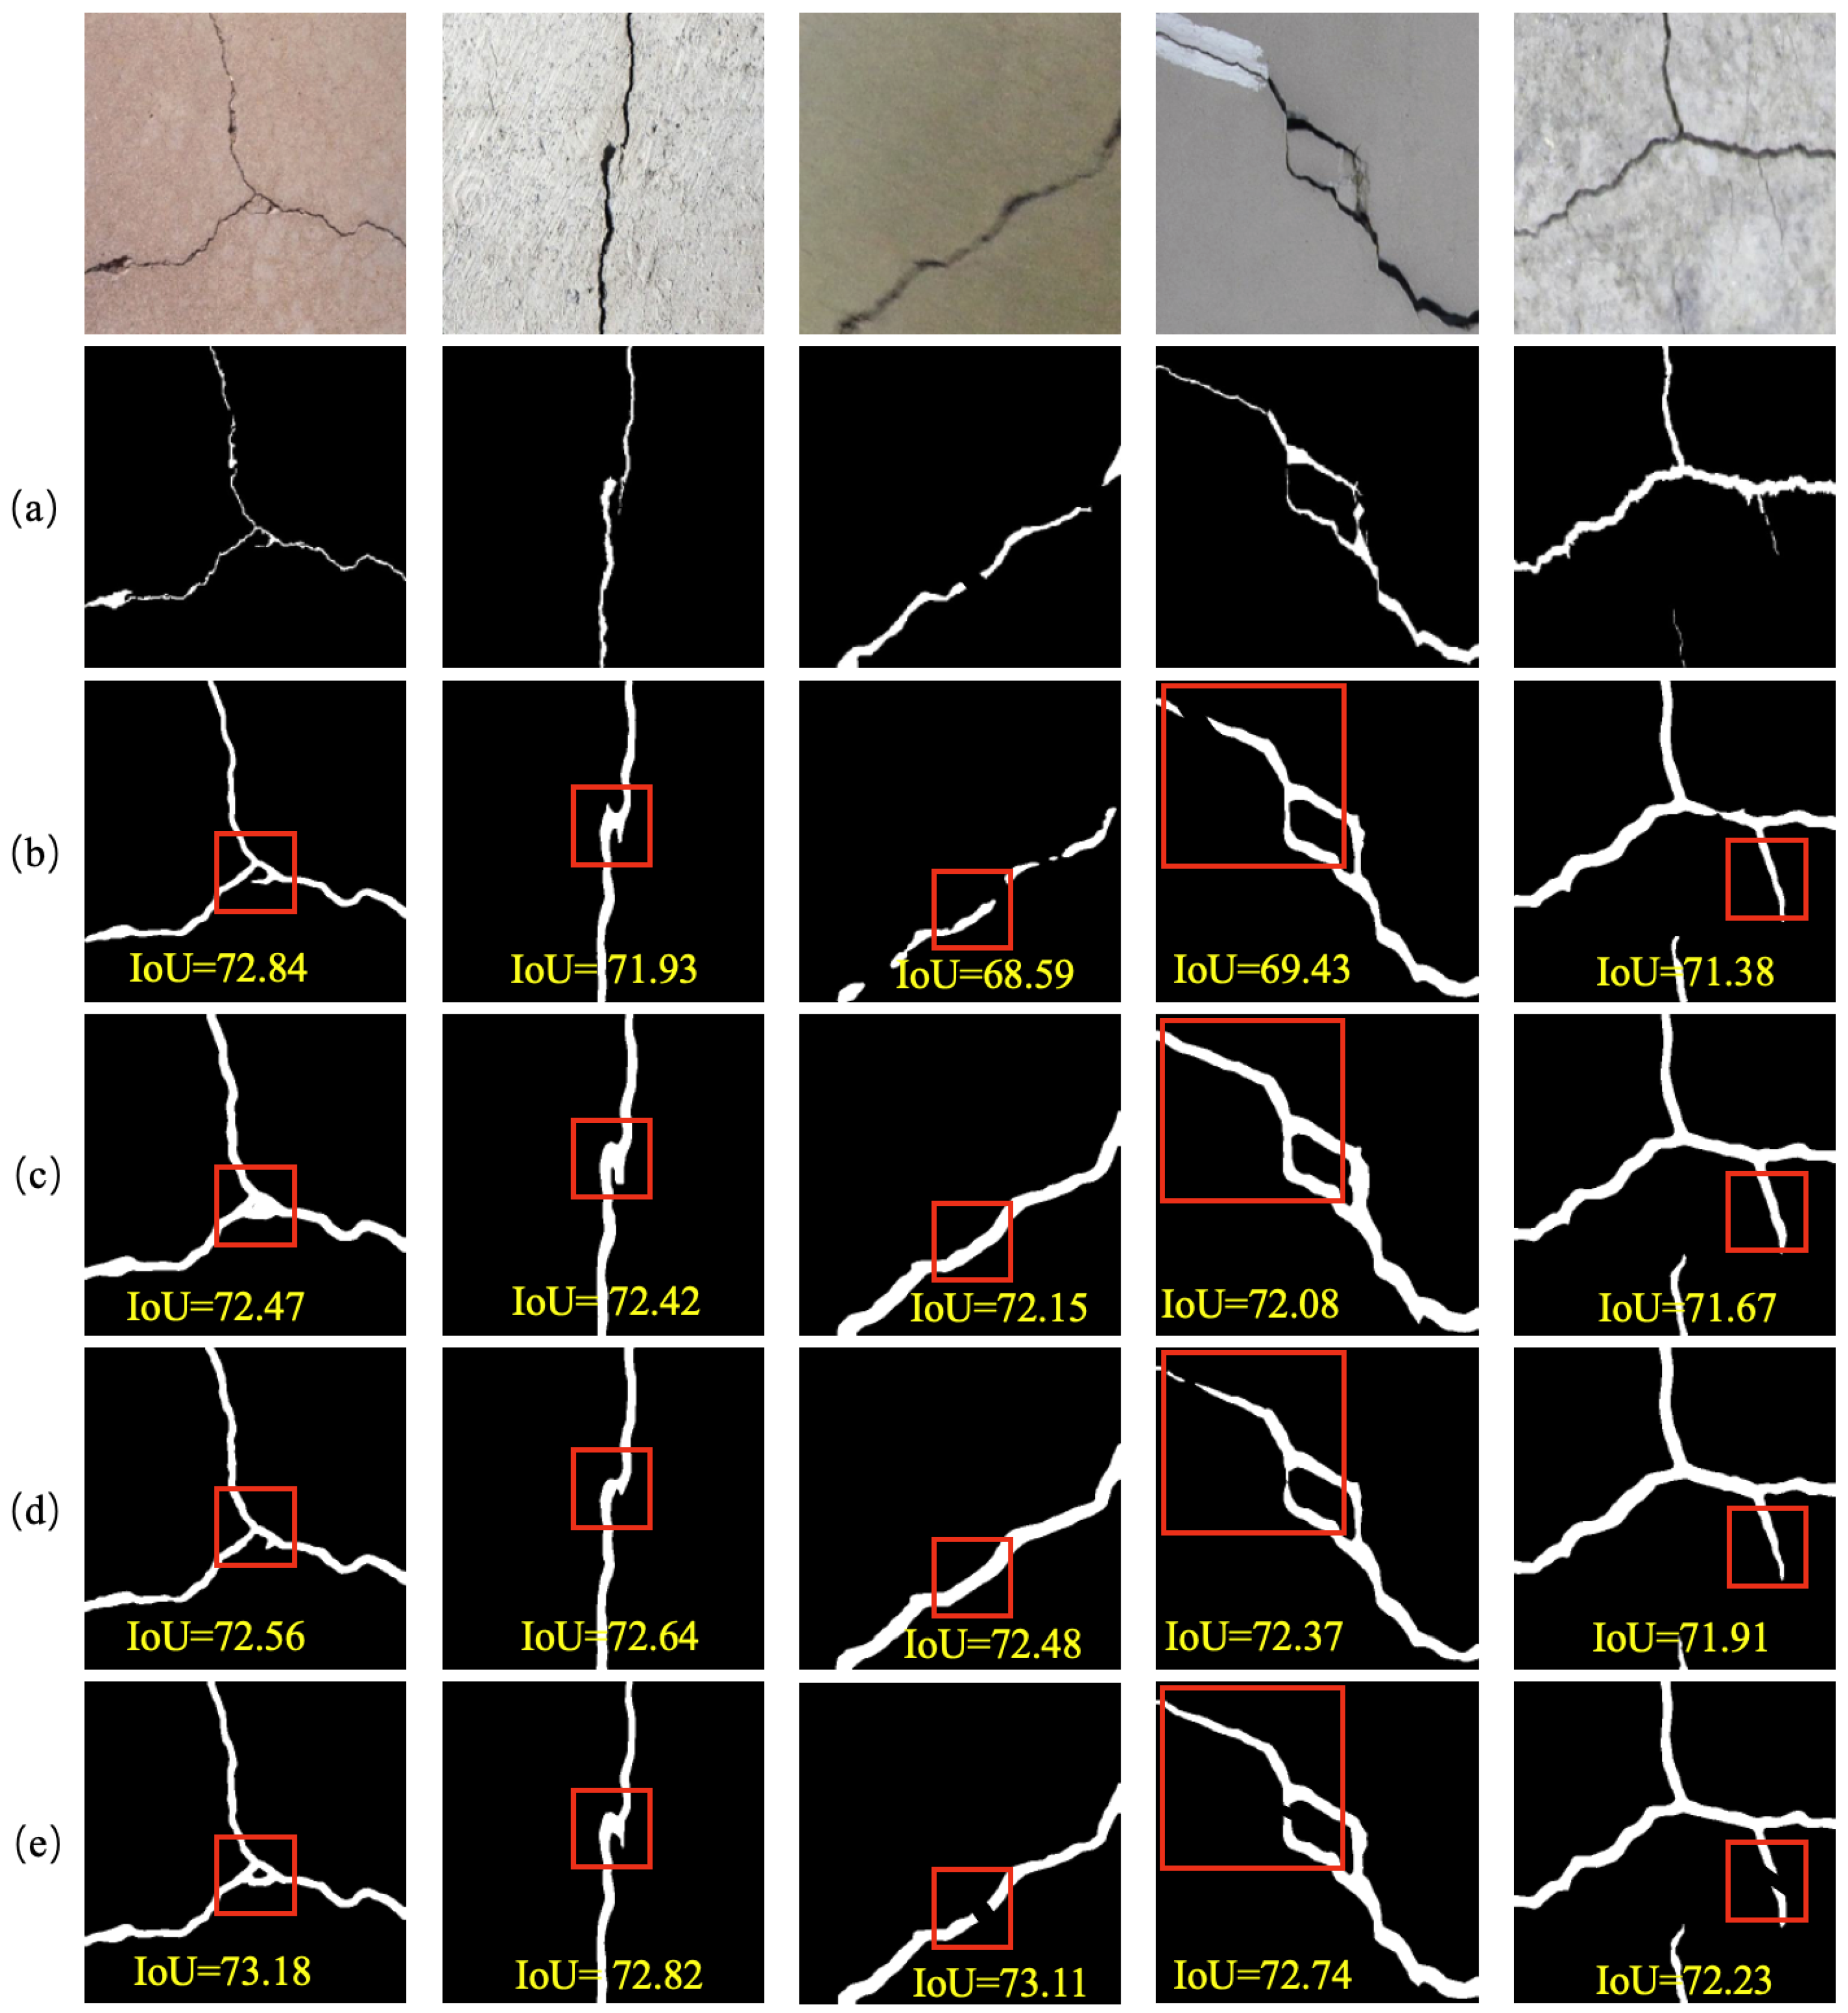
Figure 6. We observed that the segmentation results from U-Net and RHACrackNet contained more false positive pixels, while CarNet exhibited discontinuities in its segmentation of slender cracks. In contrast, the proposed method demonstrated superior accuracy in detecting cracks from the DeepCrack images, particularly in regions where cracks are discontinuous. In addition, the proposed method is not sensitive enough to cracks and artifacts in blurred image areas, making the segmentation results prone to fragmentation.
As shown in
Table 2, our proposed model consistently outperformed all others across all evaluation metrics. Specifically, it achieved improvements of 3.43%, 1.81%, 9.53%, 0.59%, and 1.81% over the Unet model in terms of
,
,
,
, and
, respectively. Furthermore, the proposed method also outperformed the CarNet model, which is specialized for crack segmentation, with gains of 0.52% in
, 0.33% in
, 0.39% in
, 0.54% in
, and 1.77% in
. To provide a clearer comparison of the segmentation performance, we visualized the results for Unet and CarNet in
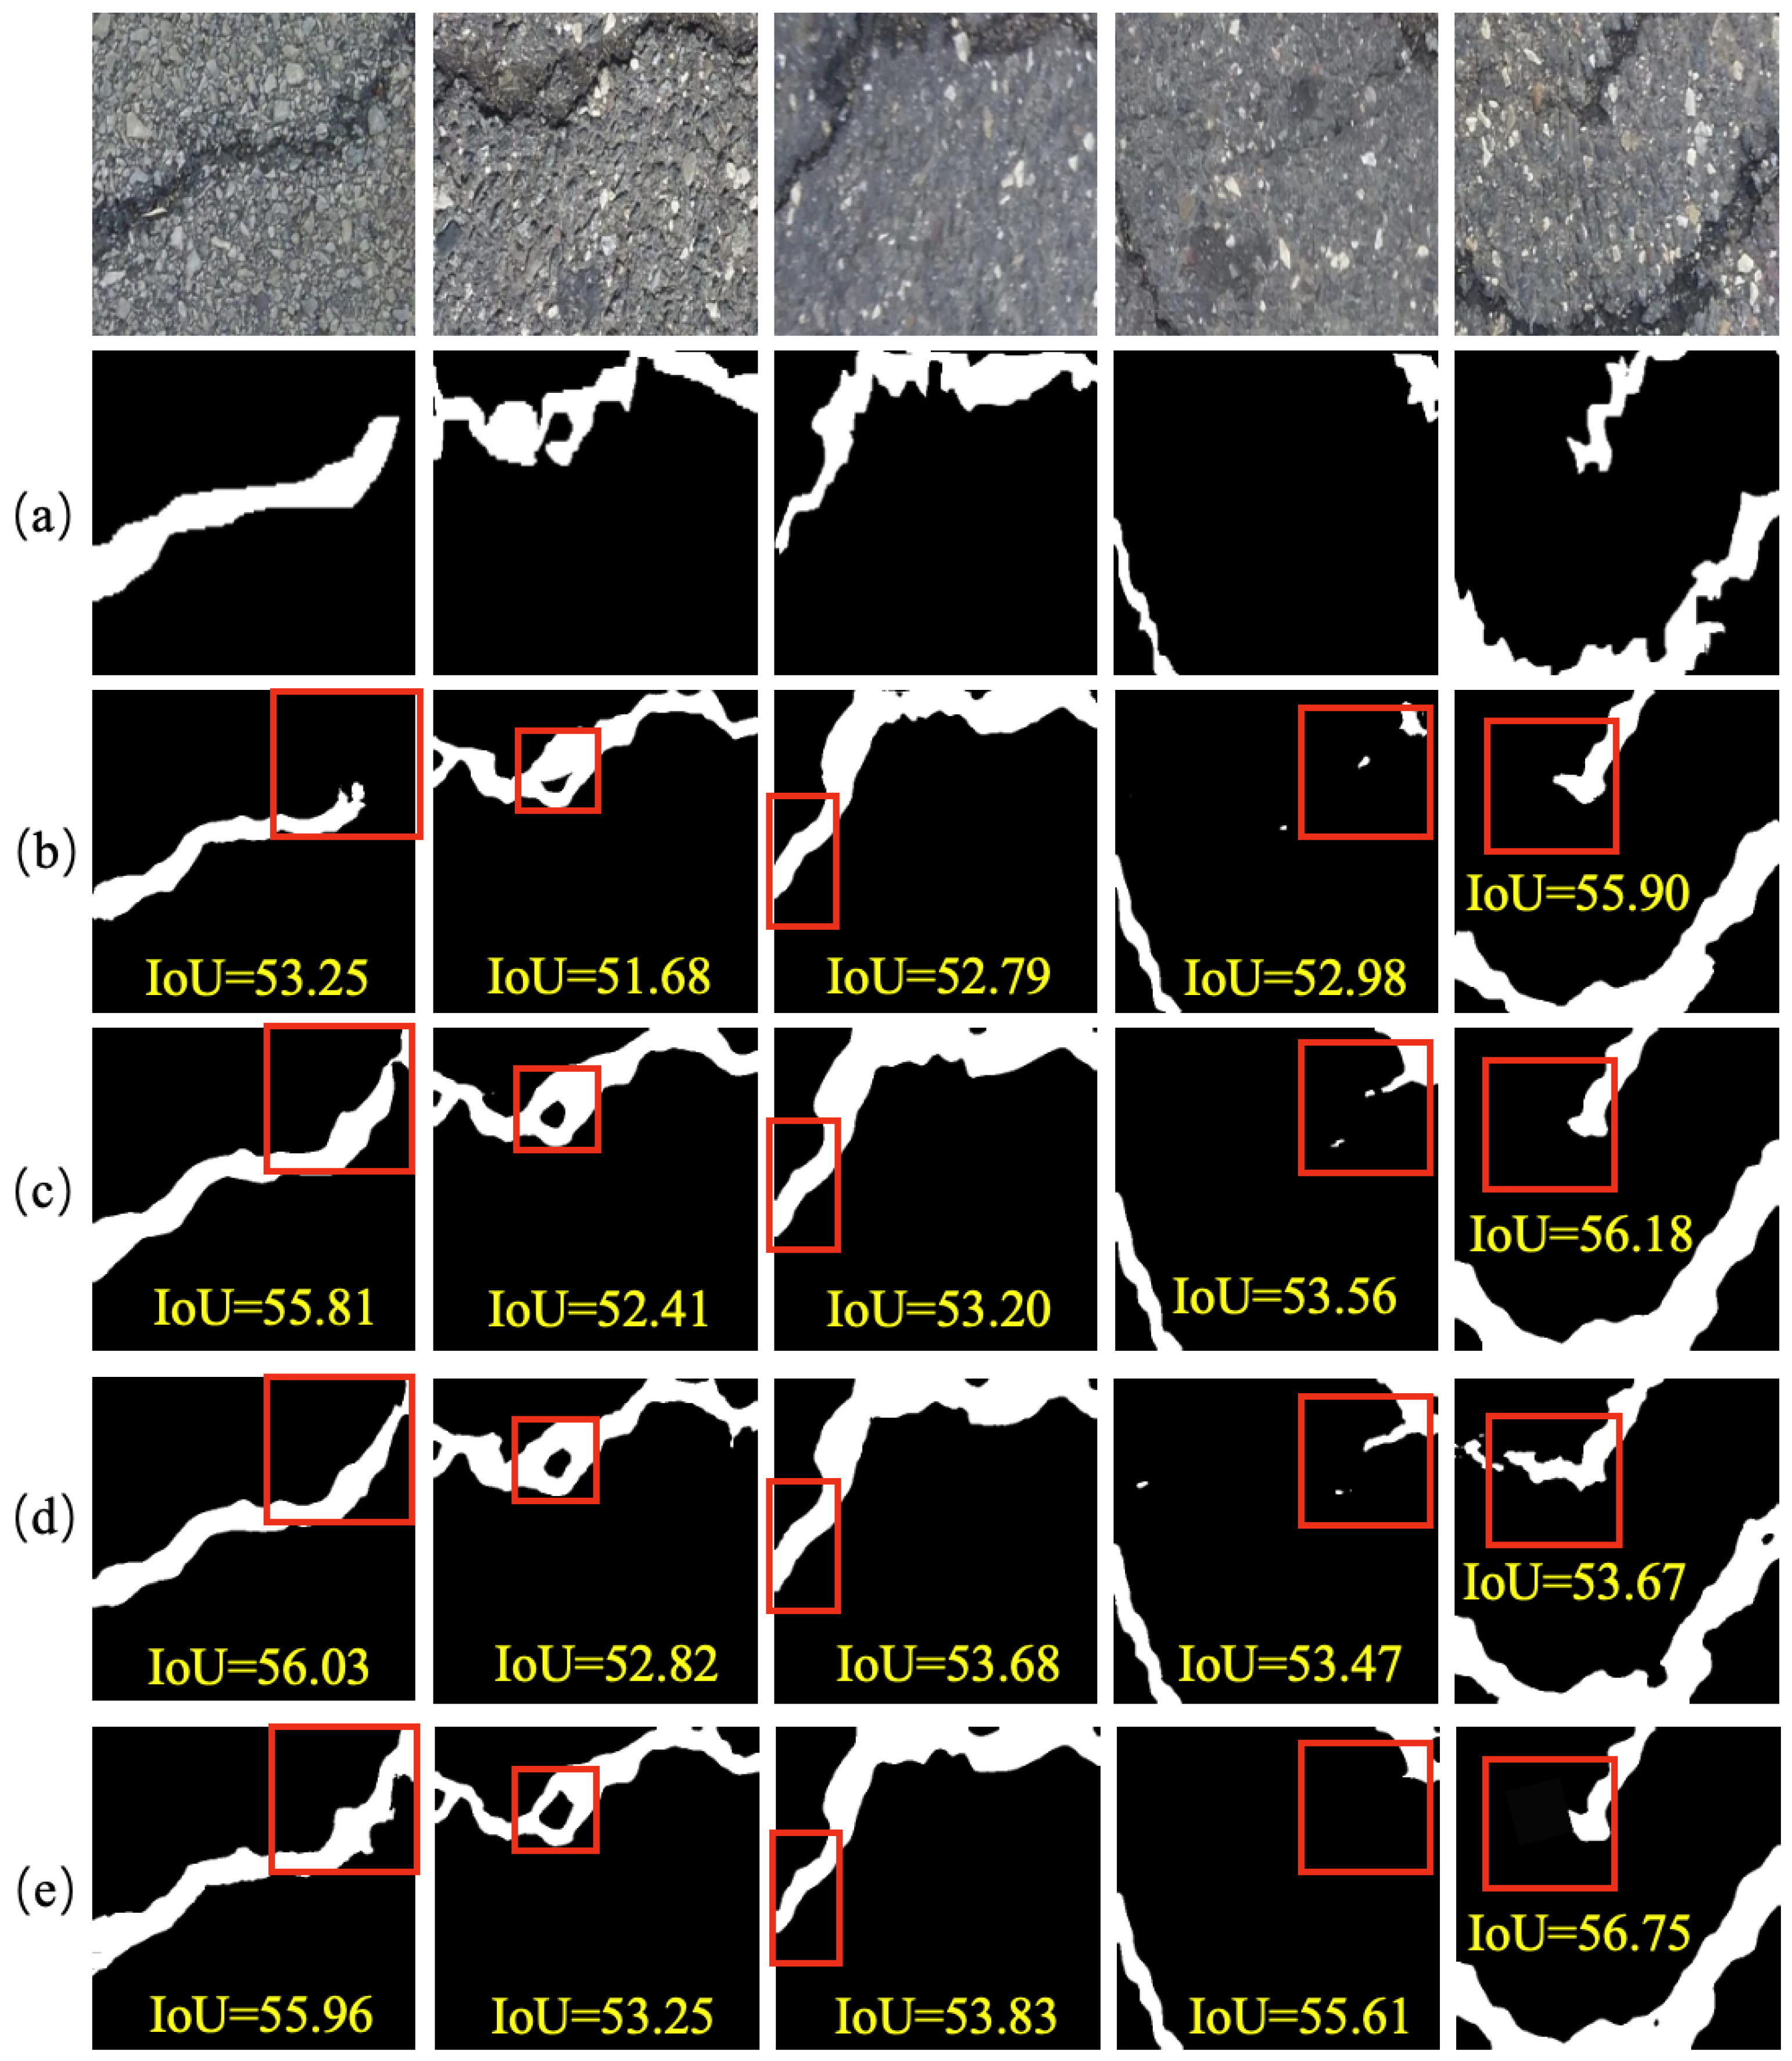
Figure 7. We observed that the proposed model demonstrated more precise segmentation performance on Crack500 images, with significantly fewer false positive pixels and fracture points. For the mesh-like structures formed by interconnected annular cracks, the proposed method demonstrates superior capability in capturing pixel-level correlations. Moreover, it successfully identifies crack textures that were overlooked in the ground truth images. However, the accuracy of the proposed method in segmenting boundary pixels of thick cracks needs further enhancement.
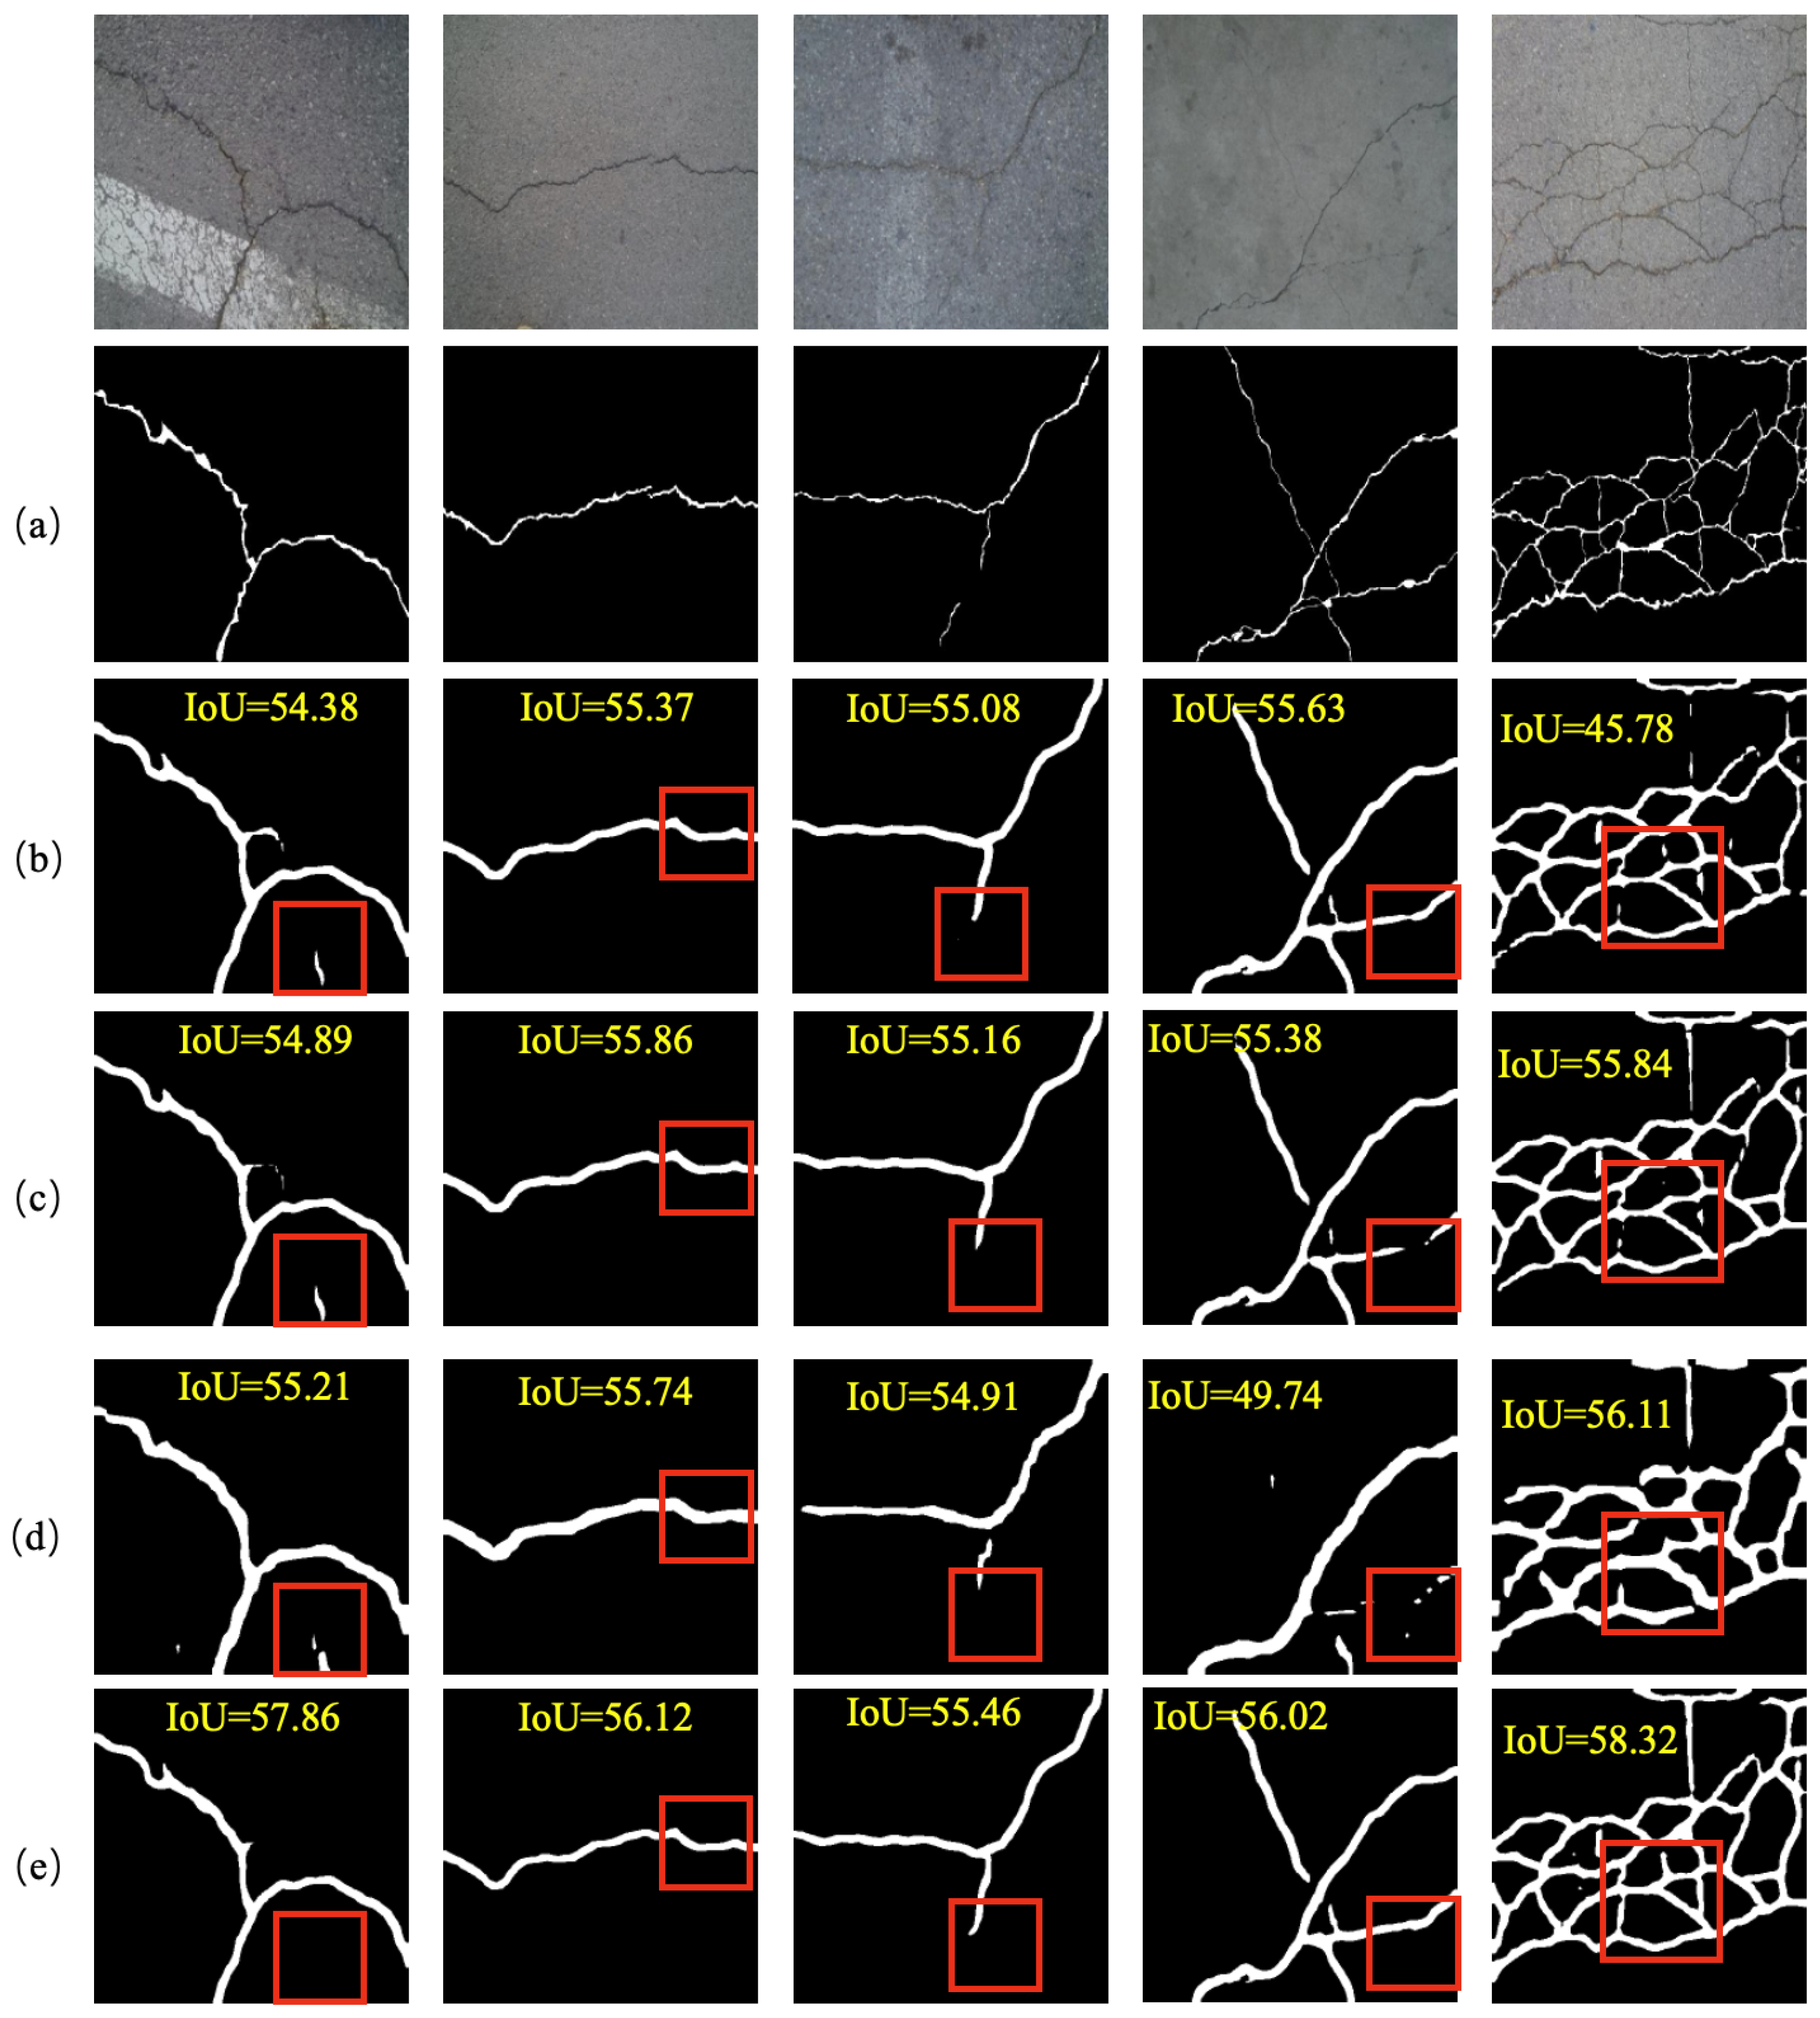
We quantified the performance of all methods on the CFD dataset, and the results are recorded in
Table 3. We found that the proposed model achieved the highest scores across all metrics. Compared to the Unet model, the proposed method outperformed it by 6.84%, 1.52%, 5.97%, 1.82%, and 1.58% in
,
,
,
, and
metrics, respectively. Moreover, the proposed model surpassed the CarNet model, which is specifically designed for crack segmentation, by 1.14% in
, 0.27% in
, 0.48% in
, 0.23% in
, and 0.33% in
. To provide a clear comparison of the segmentation performance, we visualized the Unet and CarNet methods in
Figure 8. We found that U-Net and RHACrackNet exhibited suboptimal performance in segmenting complex annular crack networks, failing to accurately capture pixel-level connectivity relationships. In contrast, the proposed model demonstrated superior accuracy and continuity in segmenting both long-span and intricately meshed crack structures. Additionally, the proposed method achieved more precise identification of crack junctions. However, the proposed method is not precise in capturing local textures of jagged cracks. This suggests that the proposed model should incorporate edge-related features, which will be our future research focus.
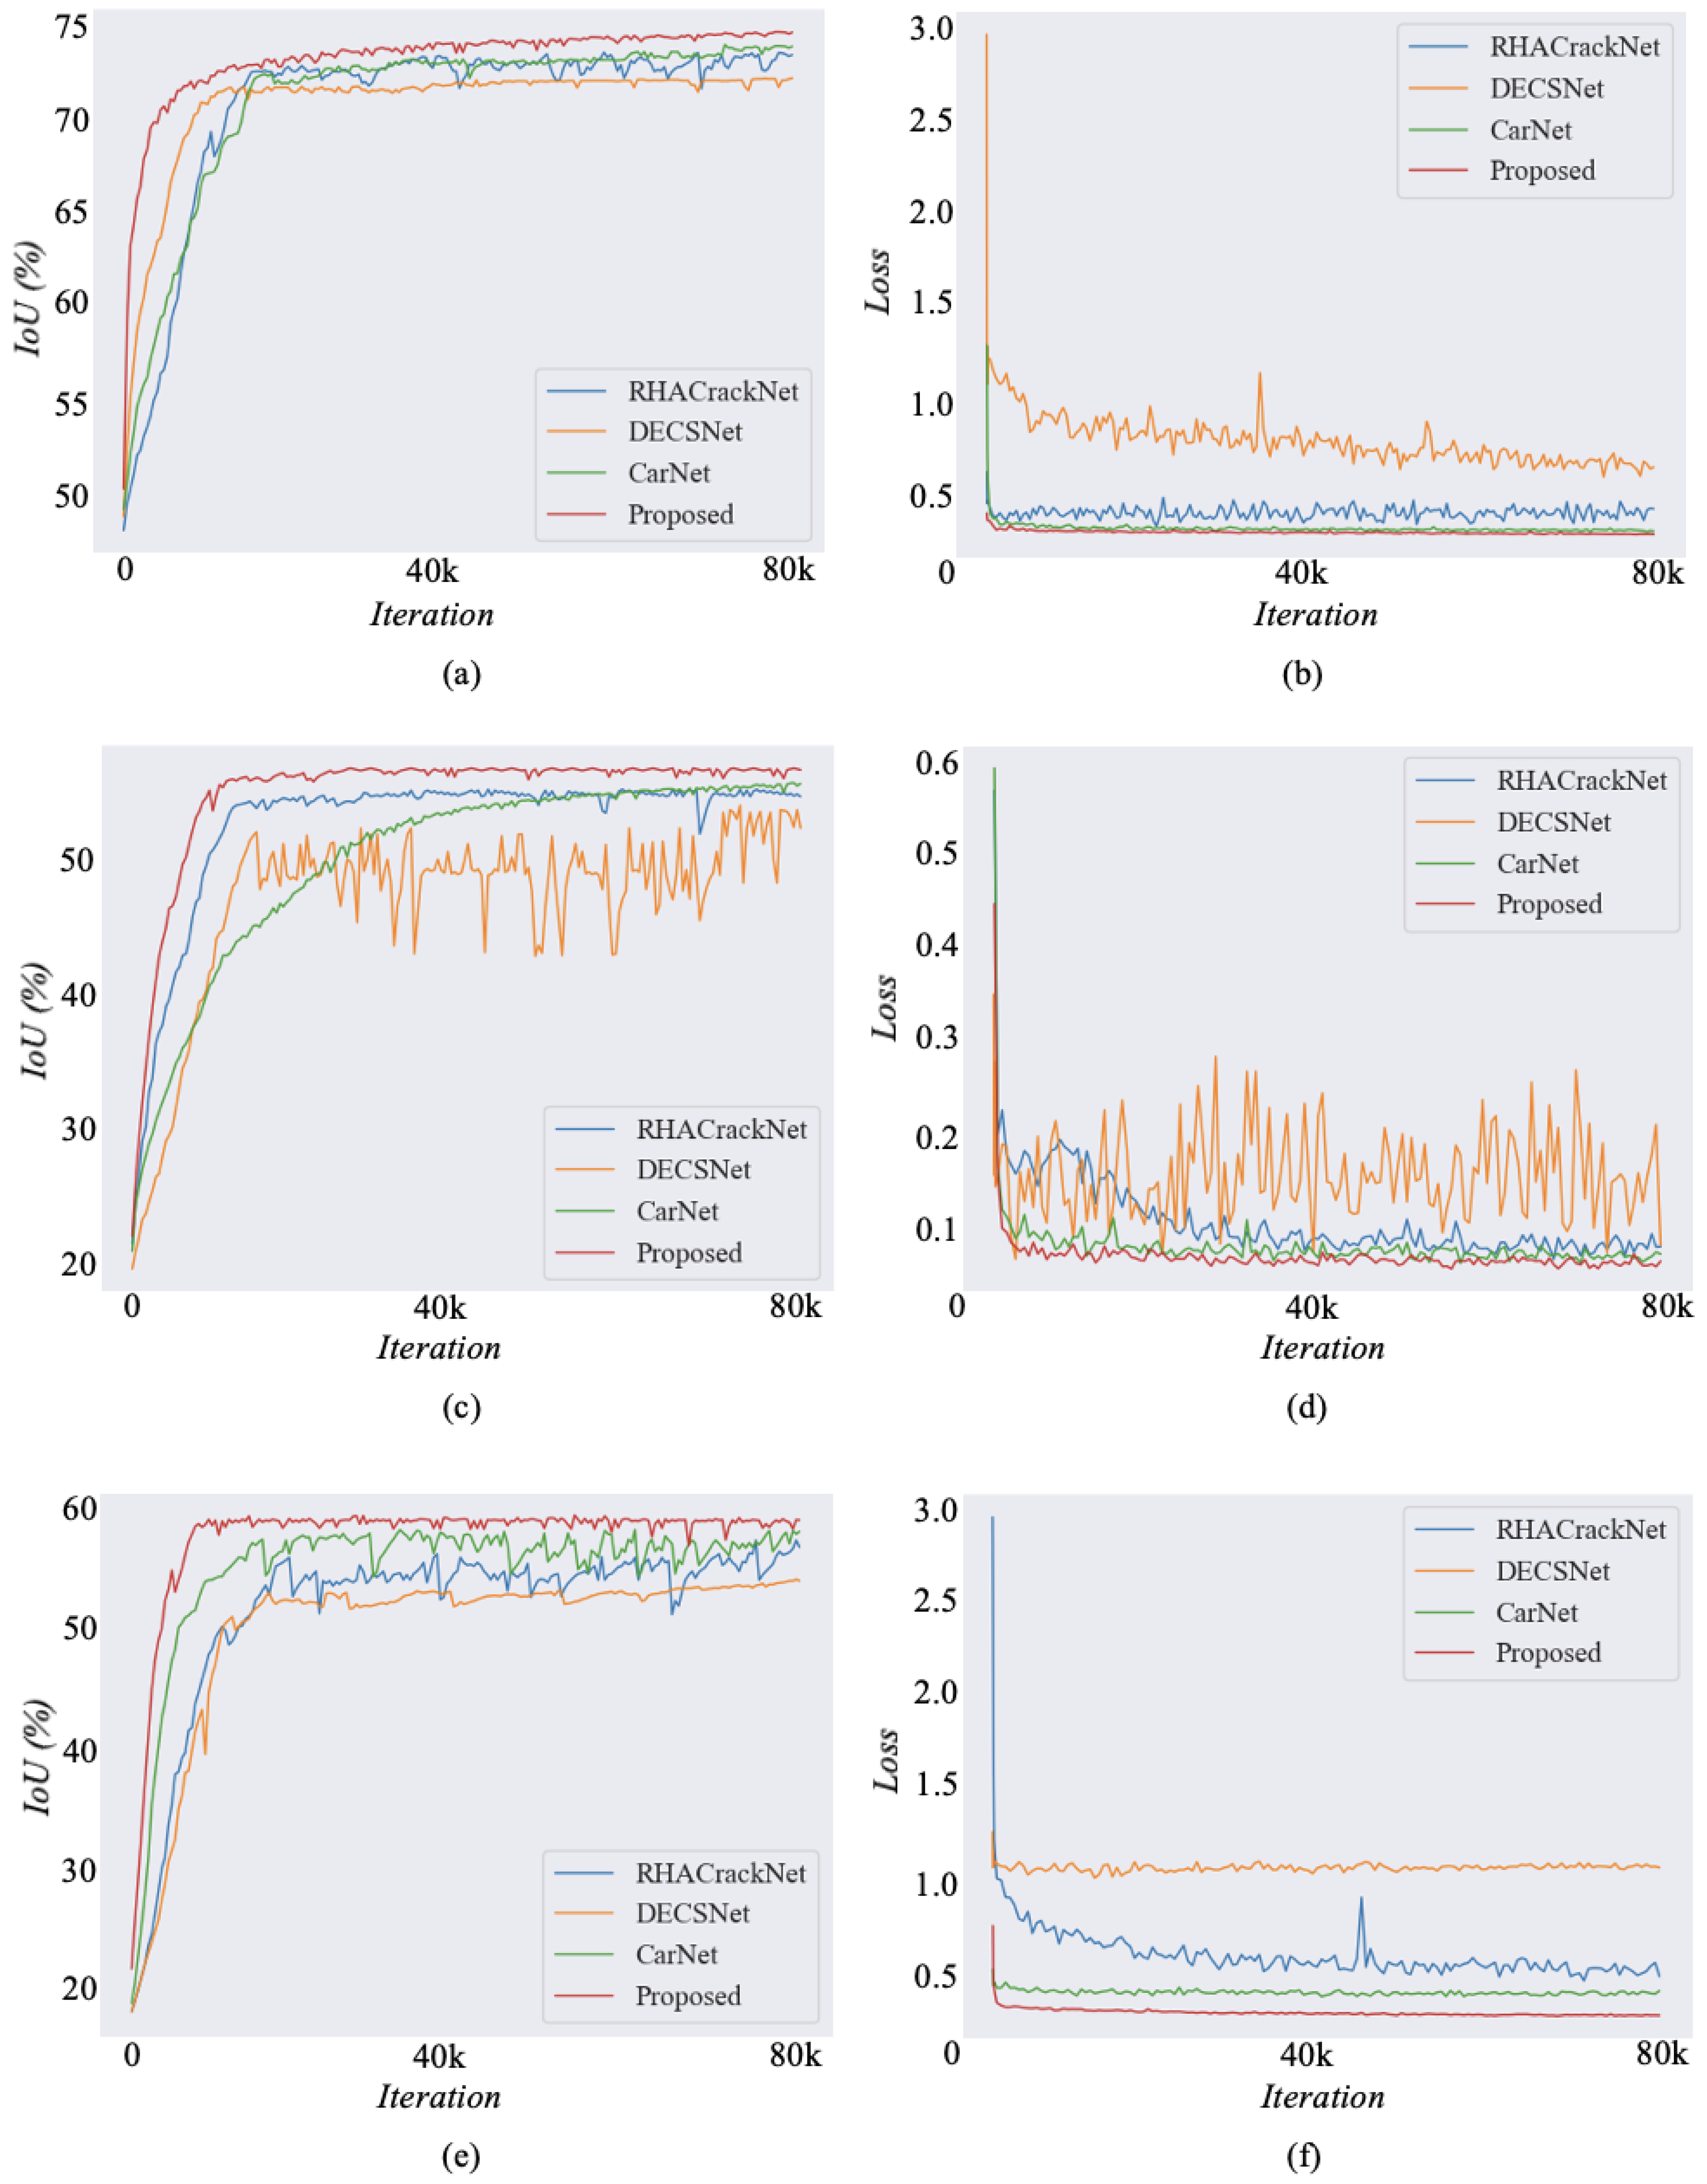
We present the training process of our proposed method and recent SOTA models on three public datasets. As shown in the first row of
Figure 9, compared to the three SOTA methods, including RHACrackNet, DECSNet and CarNet, the proposed method converges faster and achieves a lower loss on the DeepCrack dataset. On the challenging Crack500 dataset, DECSNet exhibits severe oscillations and does not converge stably. In contrast, our proposed method demonstrates stable convergence. On the CFD dataset, the IoU curve and loss curve of the proposed method also converge quickly and achieve higher accuracy, which effectively validates the superiority of the proposed method. Consequently, the proposed method demonstrates stable segmentation performance and achieves rapid convergence to optimal values across three public datasets, which also proves its superiority.
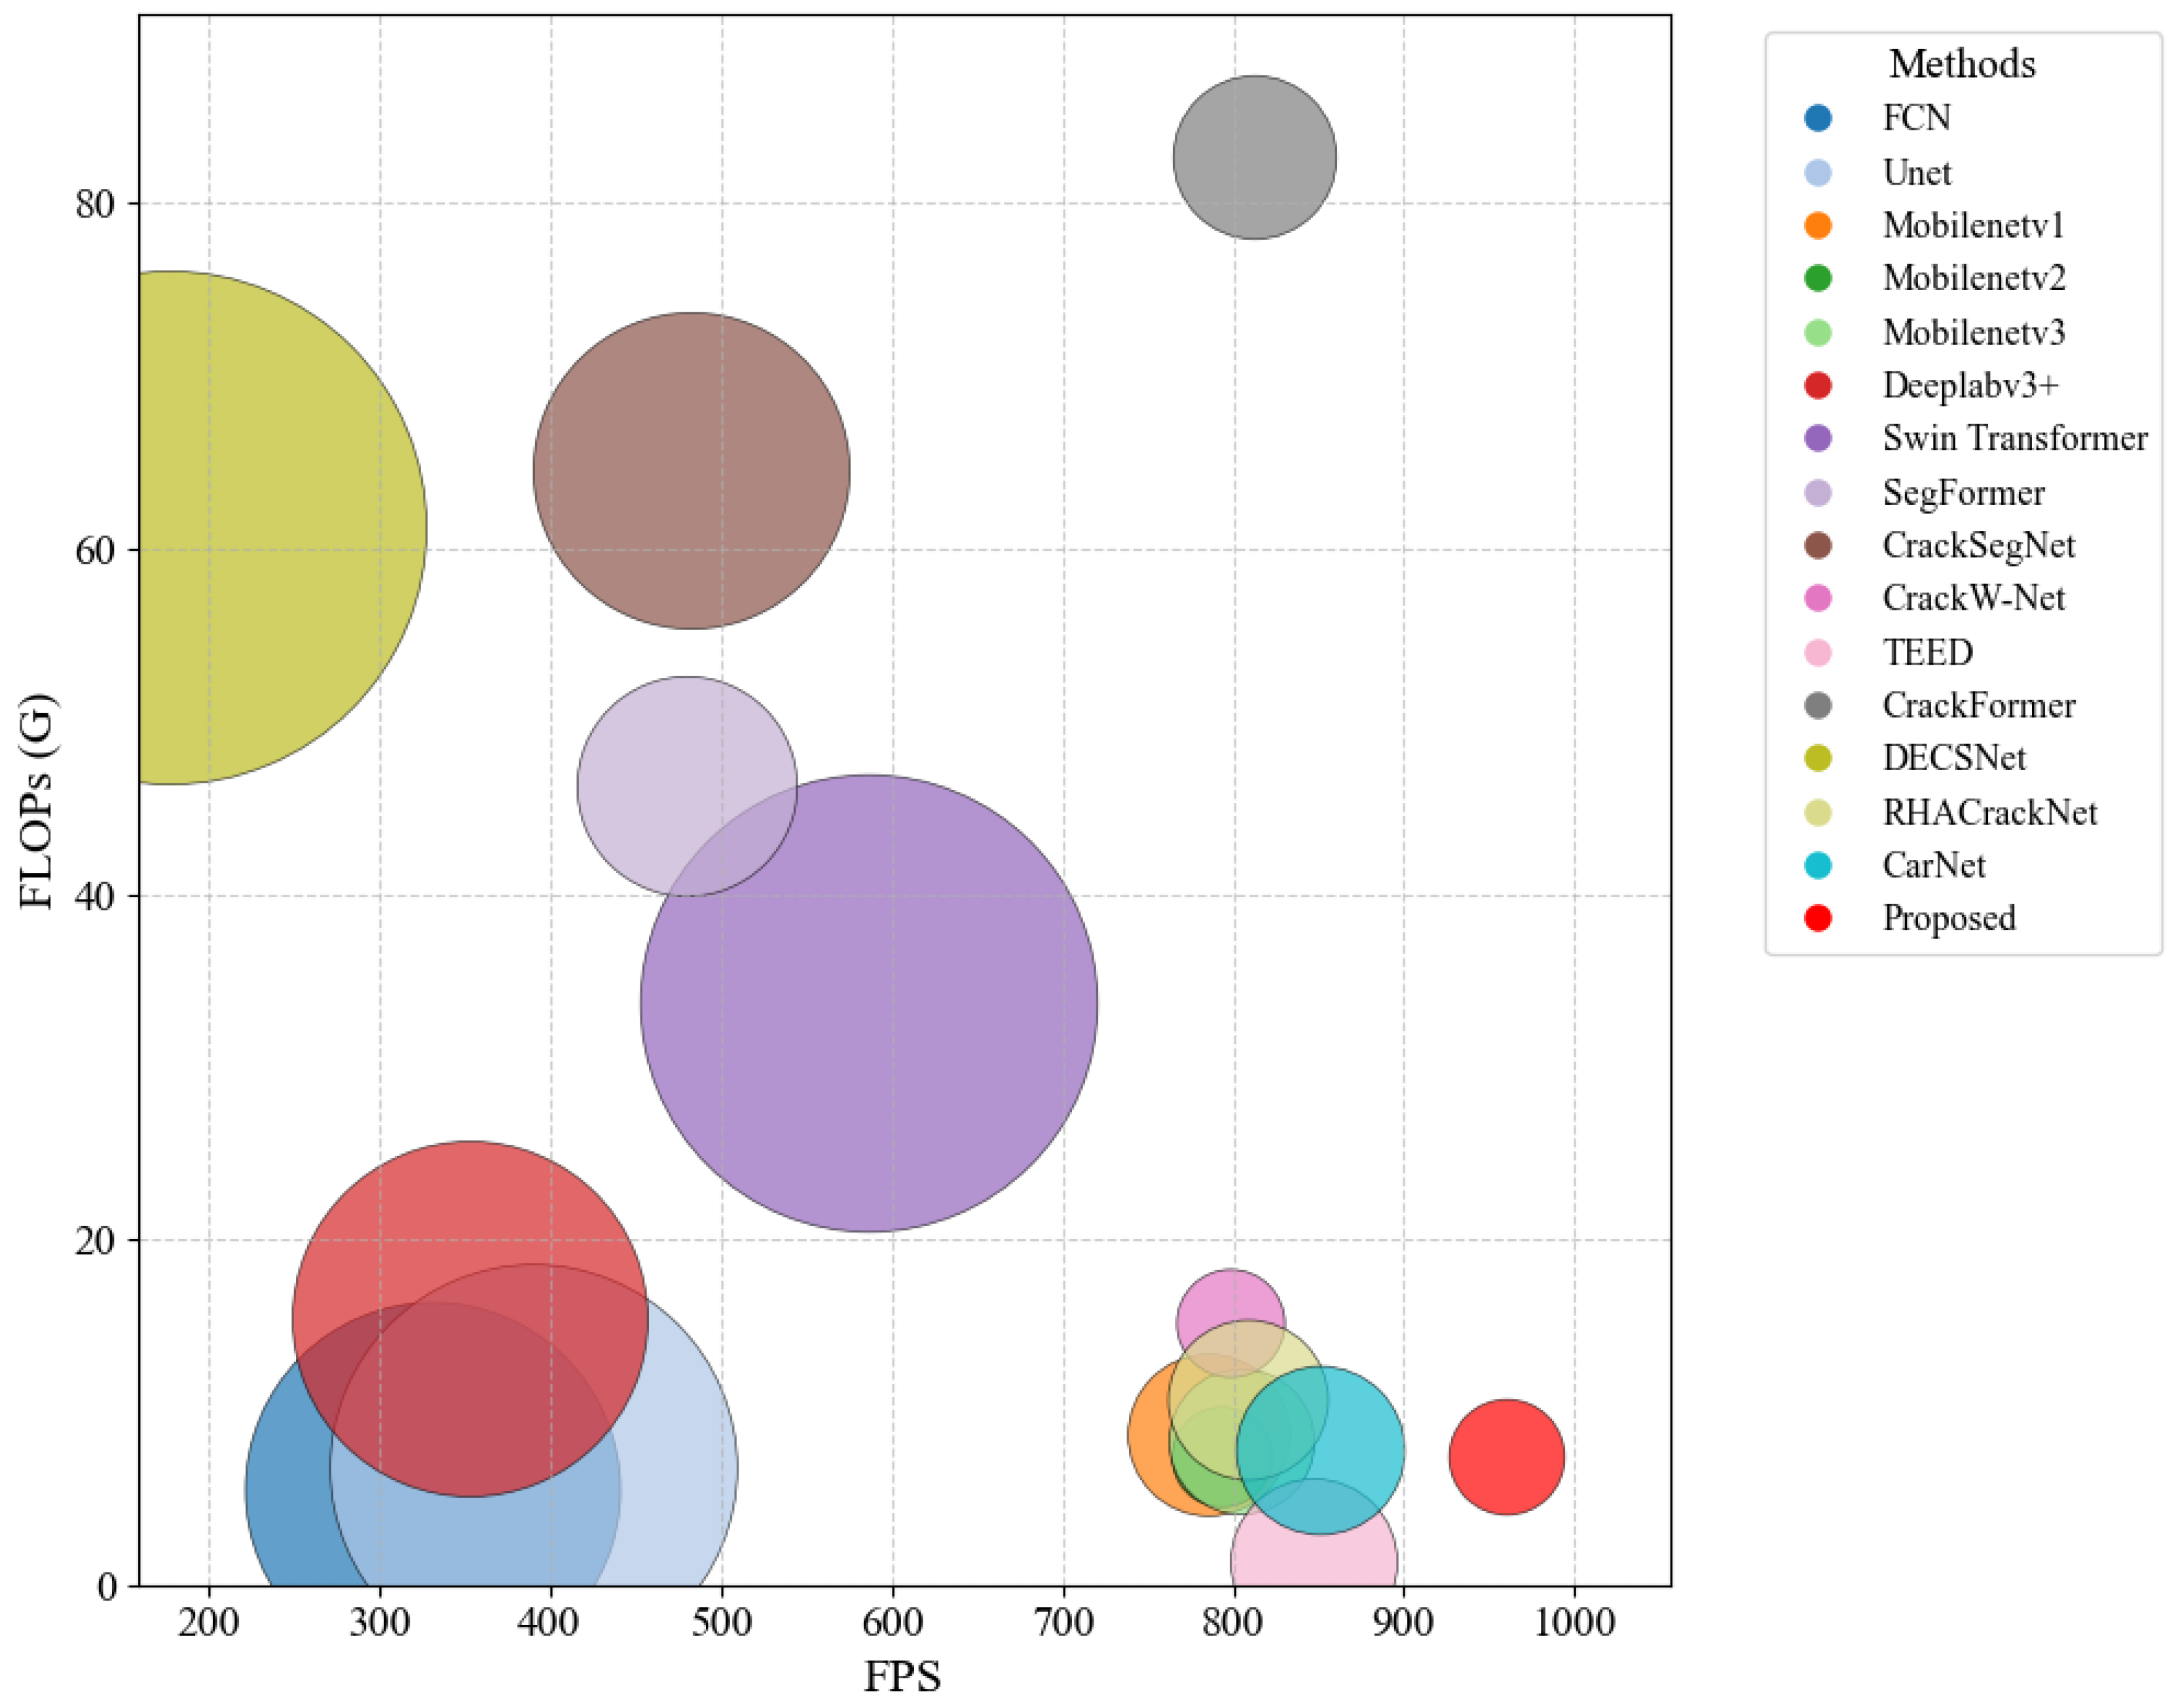
To evaluate the comprehensive performance of the model, we report the number of parameters, FLOPs and FPS values for all methods. As shown in
Table 4, compared to general-purpose methods, the proposed model has significantly fewer parameters. Additionally, compared to real-time segmentation models, our proposed method has a lower FLOP value and faster FPS. To visually assess the efficiency of all models, we have visualized their performance in terms of parameter count, FLOPs and FPS. As shown in
Figure 10, the proposed method is located in the bottom-right corner and has the smallest radius, indicating lower parameter count, fewer FLOPs, and faster FPS. Thus, our method is competitive in efficient crack segmentation tasks.
4.5. Ablation Experiments
To evaluate the contribution of each module in the proposed model, we conducted corresponding ablation experiments. As shown in
Table 5, we used MobileNetV3 (small version) as the backbone network, and by incorporating a progressive decoder, we found that the proposed method achieved an 0.48% increase in the IoU metric. Furthermore, we observed that the DSS block contributed the most to the model, boosting the IoU score by 0.75%, which also suggests that the proposed DSS block has great potential for crack segmentation. As shown in the fourth and fifth rows of
Table 5, our proposed DSS module surpasses the original SE attention module by 0.41% in IoU metric across the DeepCrack dataset, which proves the superiority of our proposed DSS module. To validate the impact of embedding the DSS block at different positions within the MobileNetV3 module, we integrated the DSS block into three distinct locations. As observed in
Table 5, embedding the DSS block in the middle position of the MobileNetV3 module yields the most significant improvement for the crack segmentation task, which proves the effectiveness of the proposed method. Finally, we conducted an ablation of the strip pooling module and found that it improved the IoU score by 0.62%. Therefore, based on the above analysis, we have demonstrated the effectiveness of each module in our method.
To investigate the impact of different input image resolutions on the proposed method, we conducted corresponding ablation experiments. As shown in
Table 6, when using input images with resolutions of
and
, the proposed method performed suboptimally. We believe this is because the images were resized too small, resulting in the loss of fine-grained features. When we increased the input image resolution to
, we found that the proposed method achieved lower scores in recall, accuracy, and clDice indicators. This suggests that increasing the input image resolution may lead to noise interference and disrupt the structural features of cracks. In contrast, the proposed method achieved SOTA performance by resizing the input images to
.
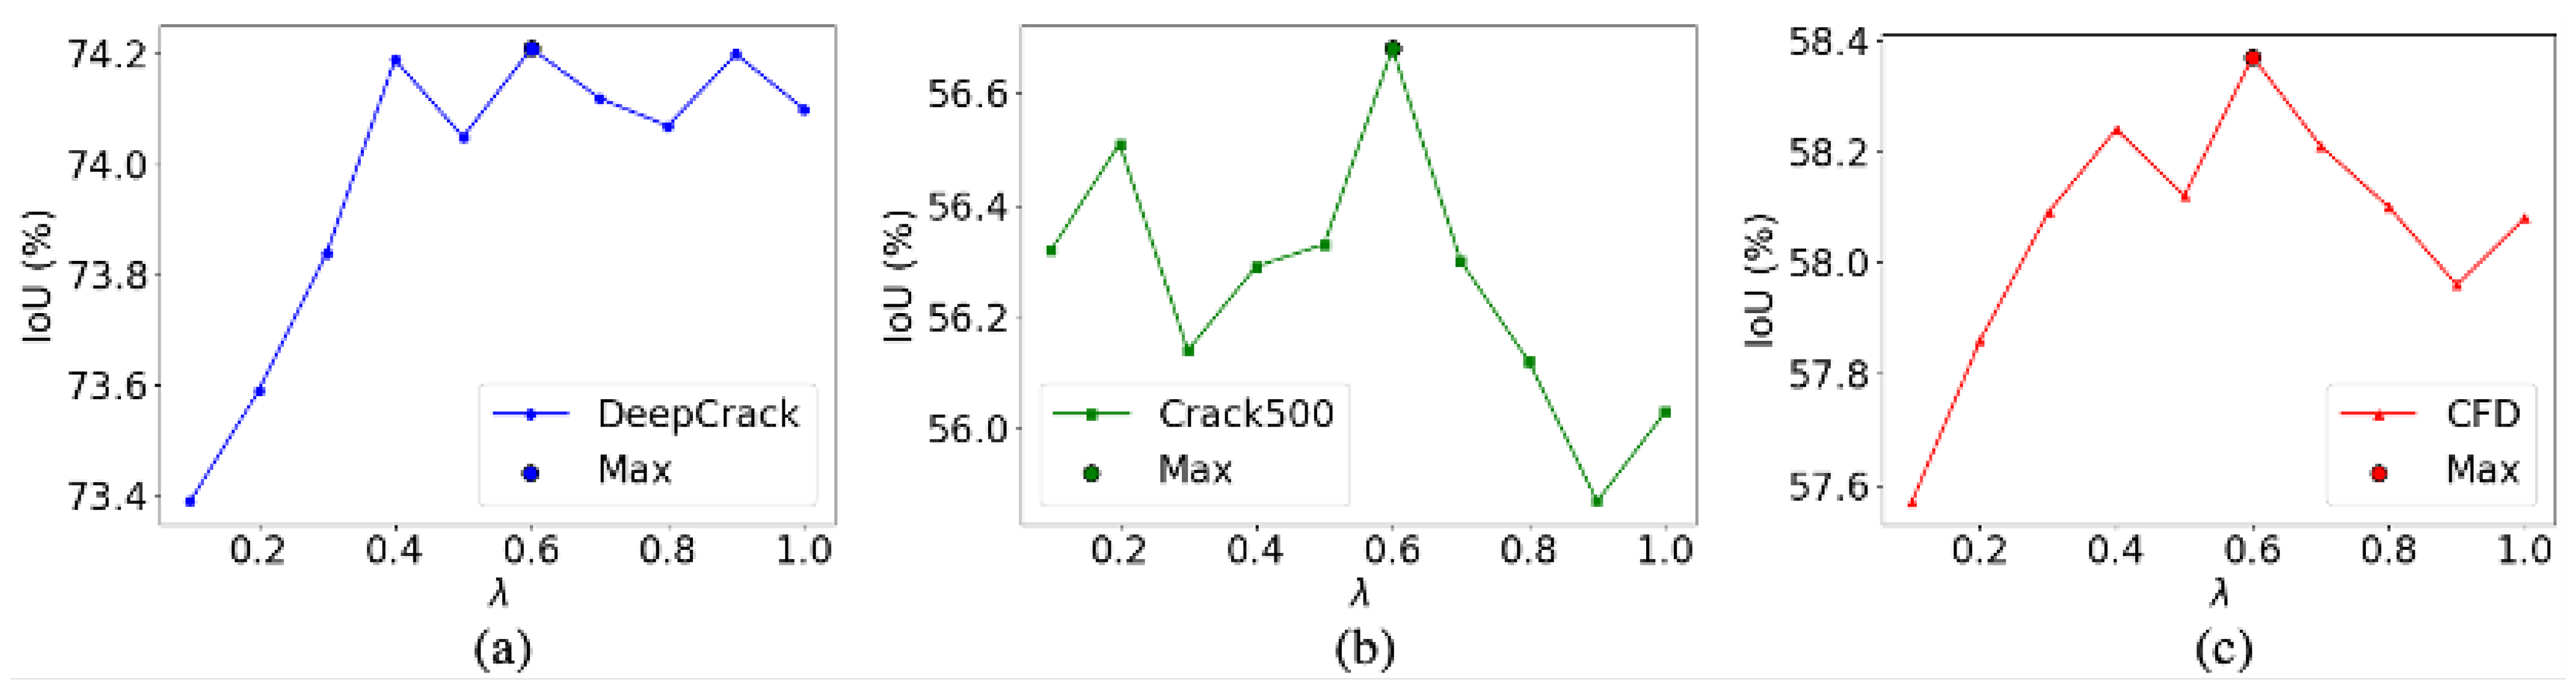
Moreover, we evaluated the hyperparameters which controlled the fusion of the cross-entropy loss and boundary loss across three public datasets, as shown in
Figure 11. We found that when
, the proposed method achieves the highest IoU scores on all three datasets. Furthermore, we also conducted corresponding ablation experiments on other hyperparameters, including the learning rate, architecture depth, and batch size. As shown in
Table 7, we find that initializing with a smaller learning rate facilitates model convergence to the optimal solution. Furthermore, deepening the encoder architecture unexpectedly degrades segmentation accuracy, suggesting that excessive model depth may impair the decoder’s capacity to recover crack semantics. Notably, batch size adjustments demonstrate a negligible impact on overall model performance.
To evaluate the impact of the offset range
in dynamic snake convolution on model performance, we conducted targeted ablation experiments. As shown in
Table 8, four distinct offset ranges were configured. We observed a moderate decline in performance across all three datasets when expanding the offset range
, which may be attributed to the mismatch between the receptive fields generated by dynamic snake convolution and the inherent crack morphology. Specifically, a larger offset range compromises the model’s ability to focus on the curvilinear and continuous nature of cracks. Furthermore, when the offset range
was constrained to [−1, 1], the model achieved state-of-the-art (SOTA) performance, validating the efficacy of our parameter configuration in aligning with the structural characteristics of cracks.
4.7. Conclusions
In this paper, we propose an efficient dynamic-state-space-enhanced network to accurately and efficiently segment concrete cracks. We embed a dynamic state space (DSS) block into the encoder to improve the global dependencies modeling capability of MobileNetV3 bottleneck modules. Specifically, we replace the SE module in the original MobileNetV3 bottleneck module with our proposed DSS block for power representation. For the decoding stage, we utilize the upsampling and depthwise separable convolution to progressively restore the spatial resolution. Moreover, to highlight the crack textures and suppress the background-related noise, we embed the strip pooling module into the skip connection between the encoder and decoder. Extensive experiments are conducted on three public datasets, and the results show the superiority of our proposed method in accuracy and efficiency.
Although our method achieves good results on crack segmentation, it still has some limitations. Firstly, it struggles to detect cracks in blurred image areas, leading to fragmented segmentation results. Secondly, the accuracy of segmenting thick crack boundaries needs improvement, as the model often misses clear edges. Thirdly, the method cannot precisely capture the fine textures of jagged cracks, which suggests that edge-related features should be strengthened in future work.


