
Study of Structural Deterioration Behavior of Mining Method Tunnels Under Steel Reinforcement Corrosion

Abstract
1. Introduction
2. Parameter Selection and Calibration
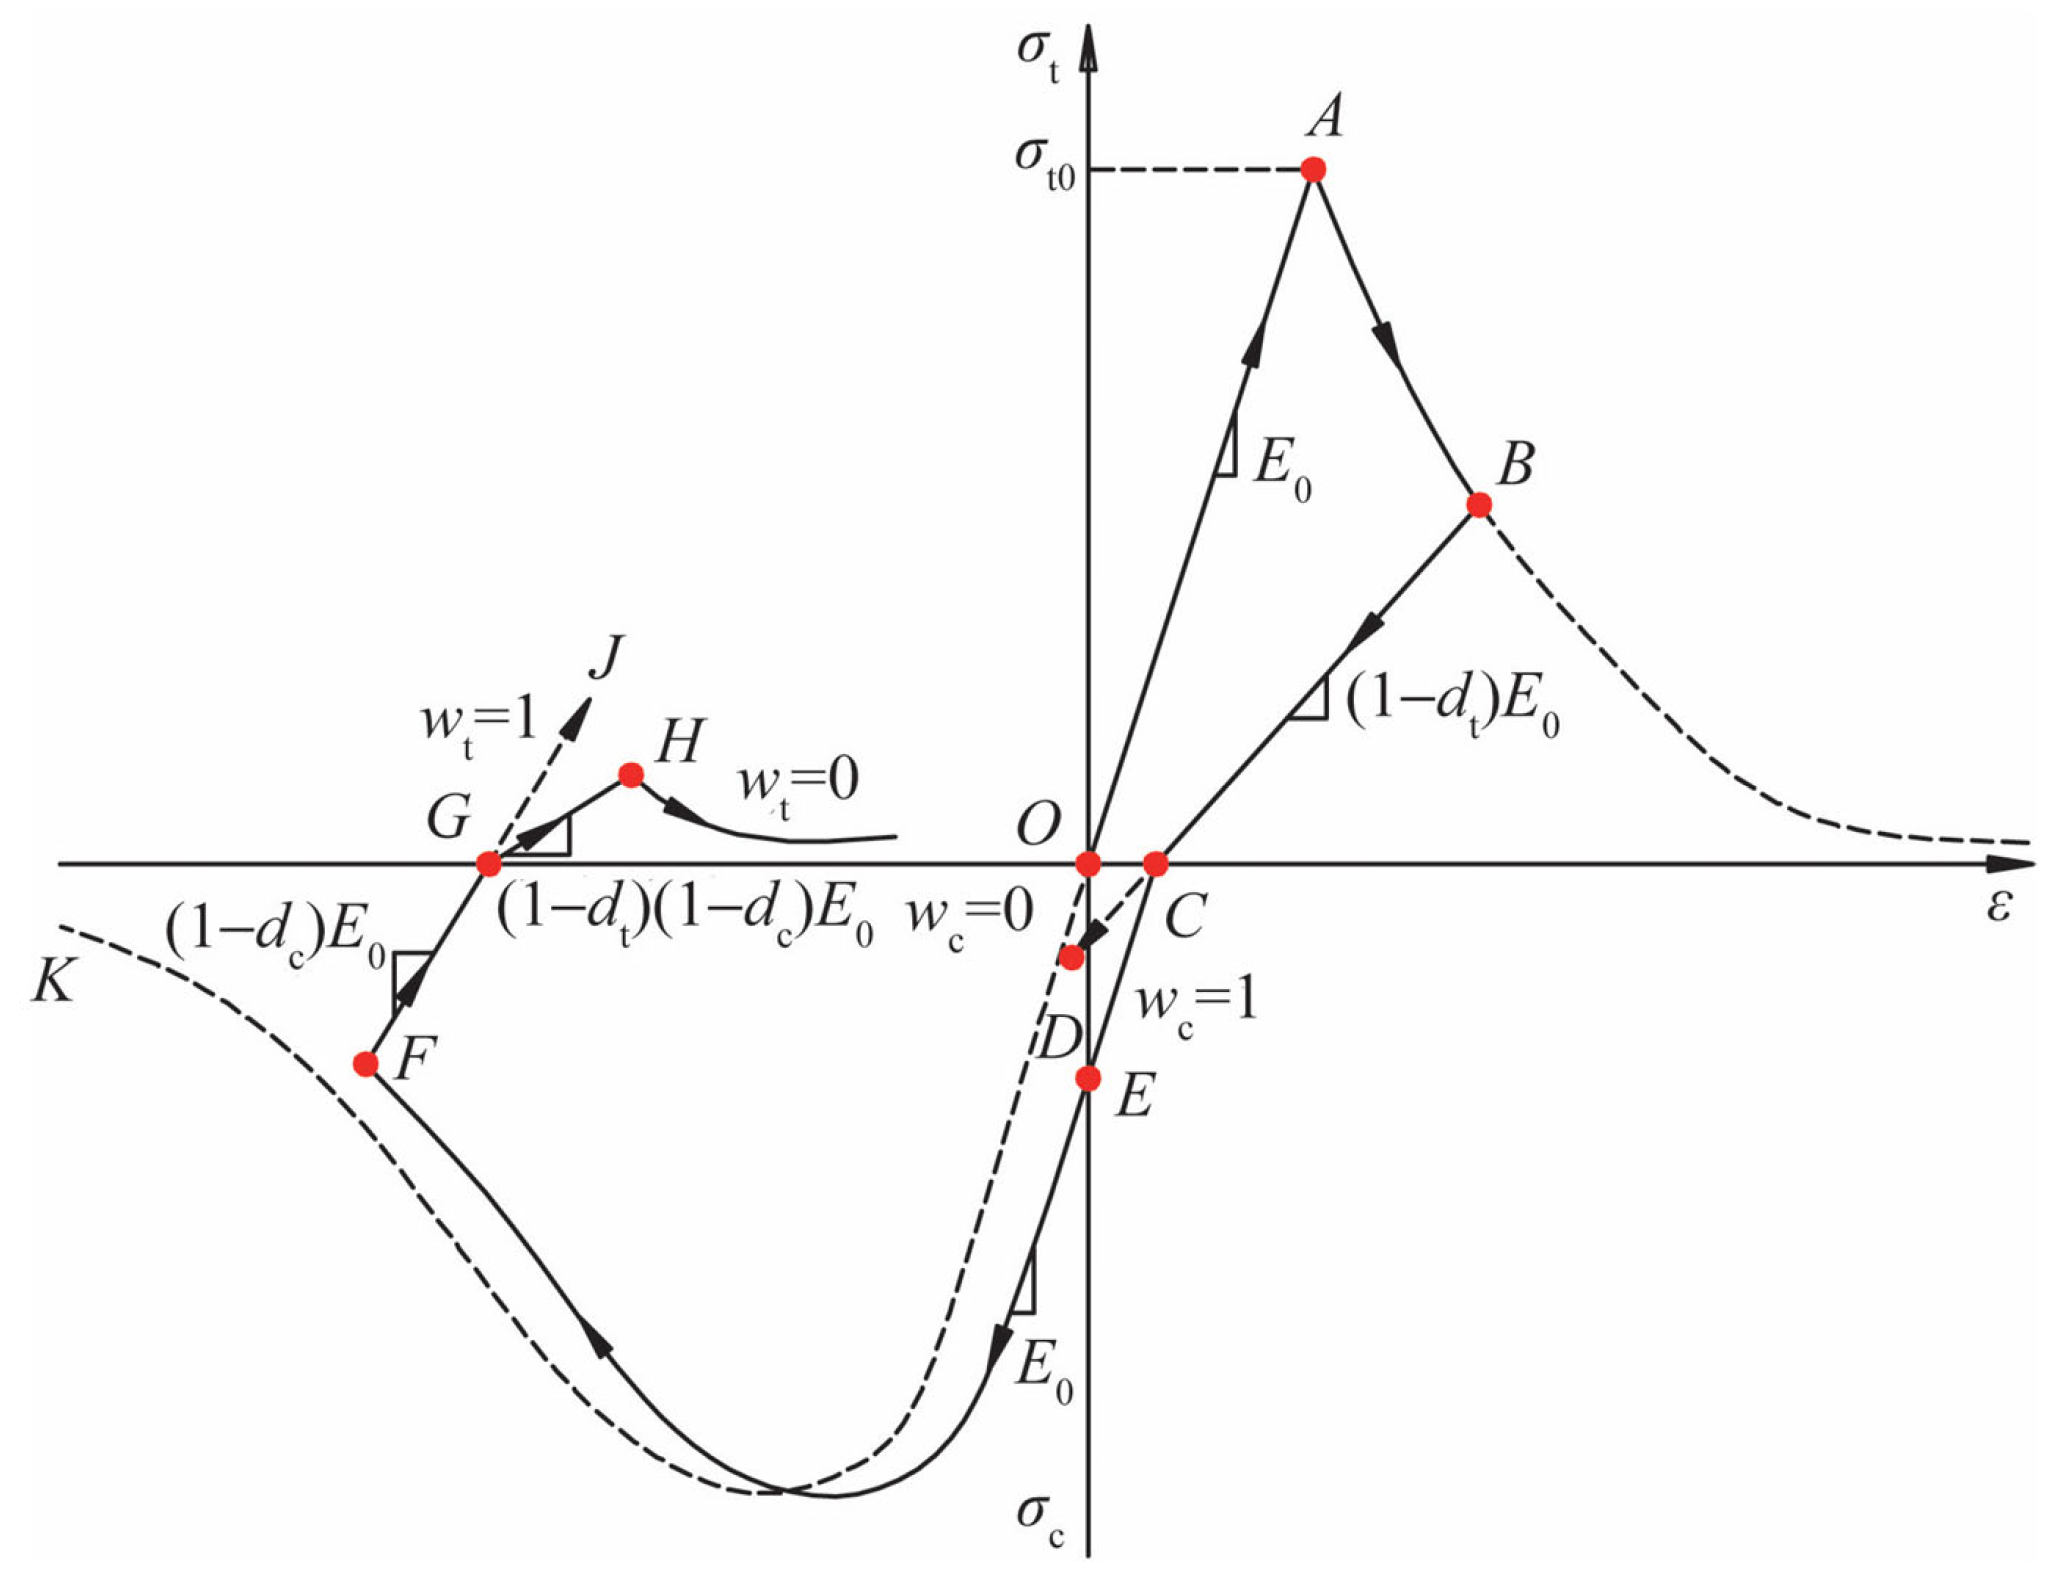
2.1. Selection of Concrete Principal Parameters
2.2. Selection of Rebar Intrinsic Parameters
2.3. Selection of Intrinsic Parameters for Bonding Properties
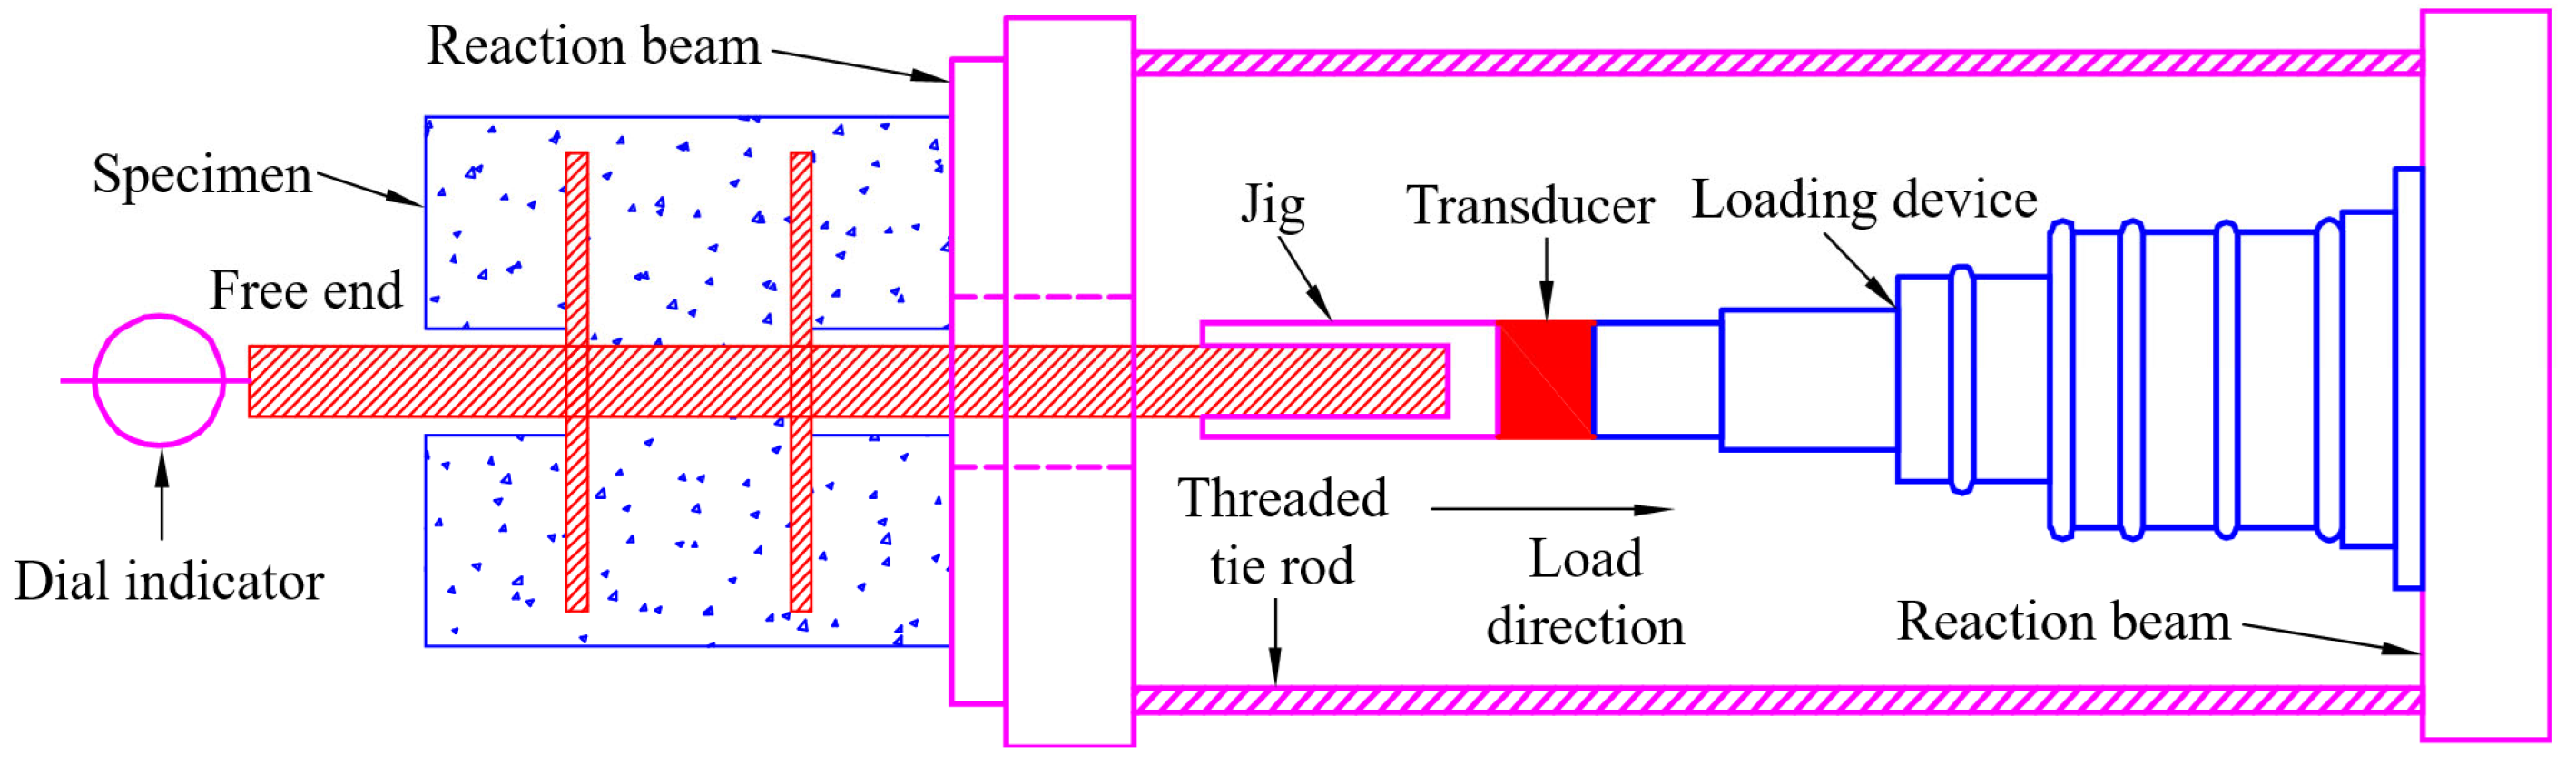
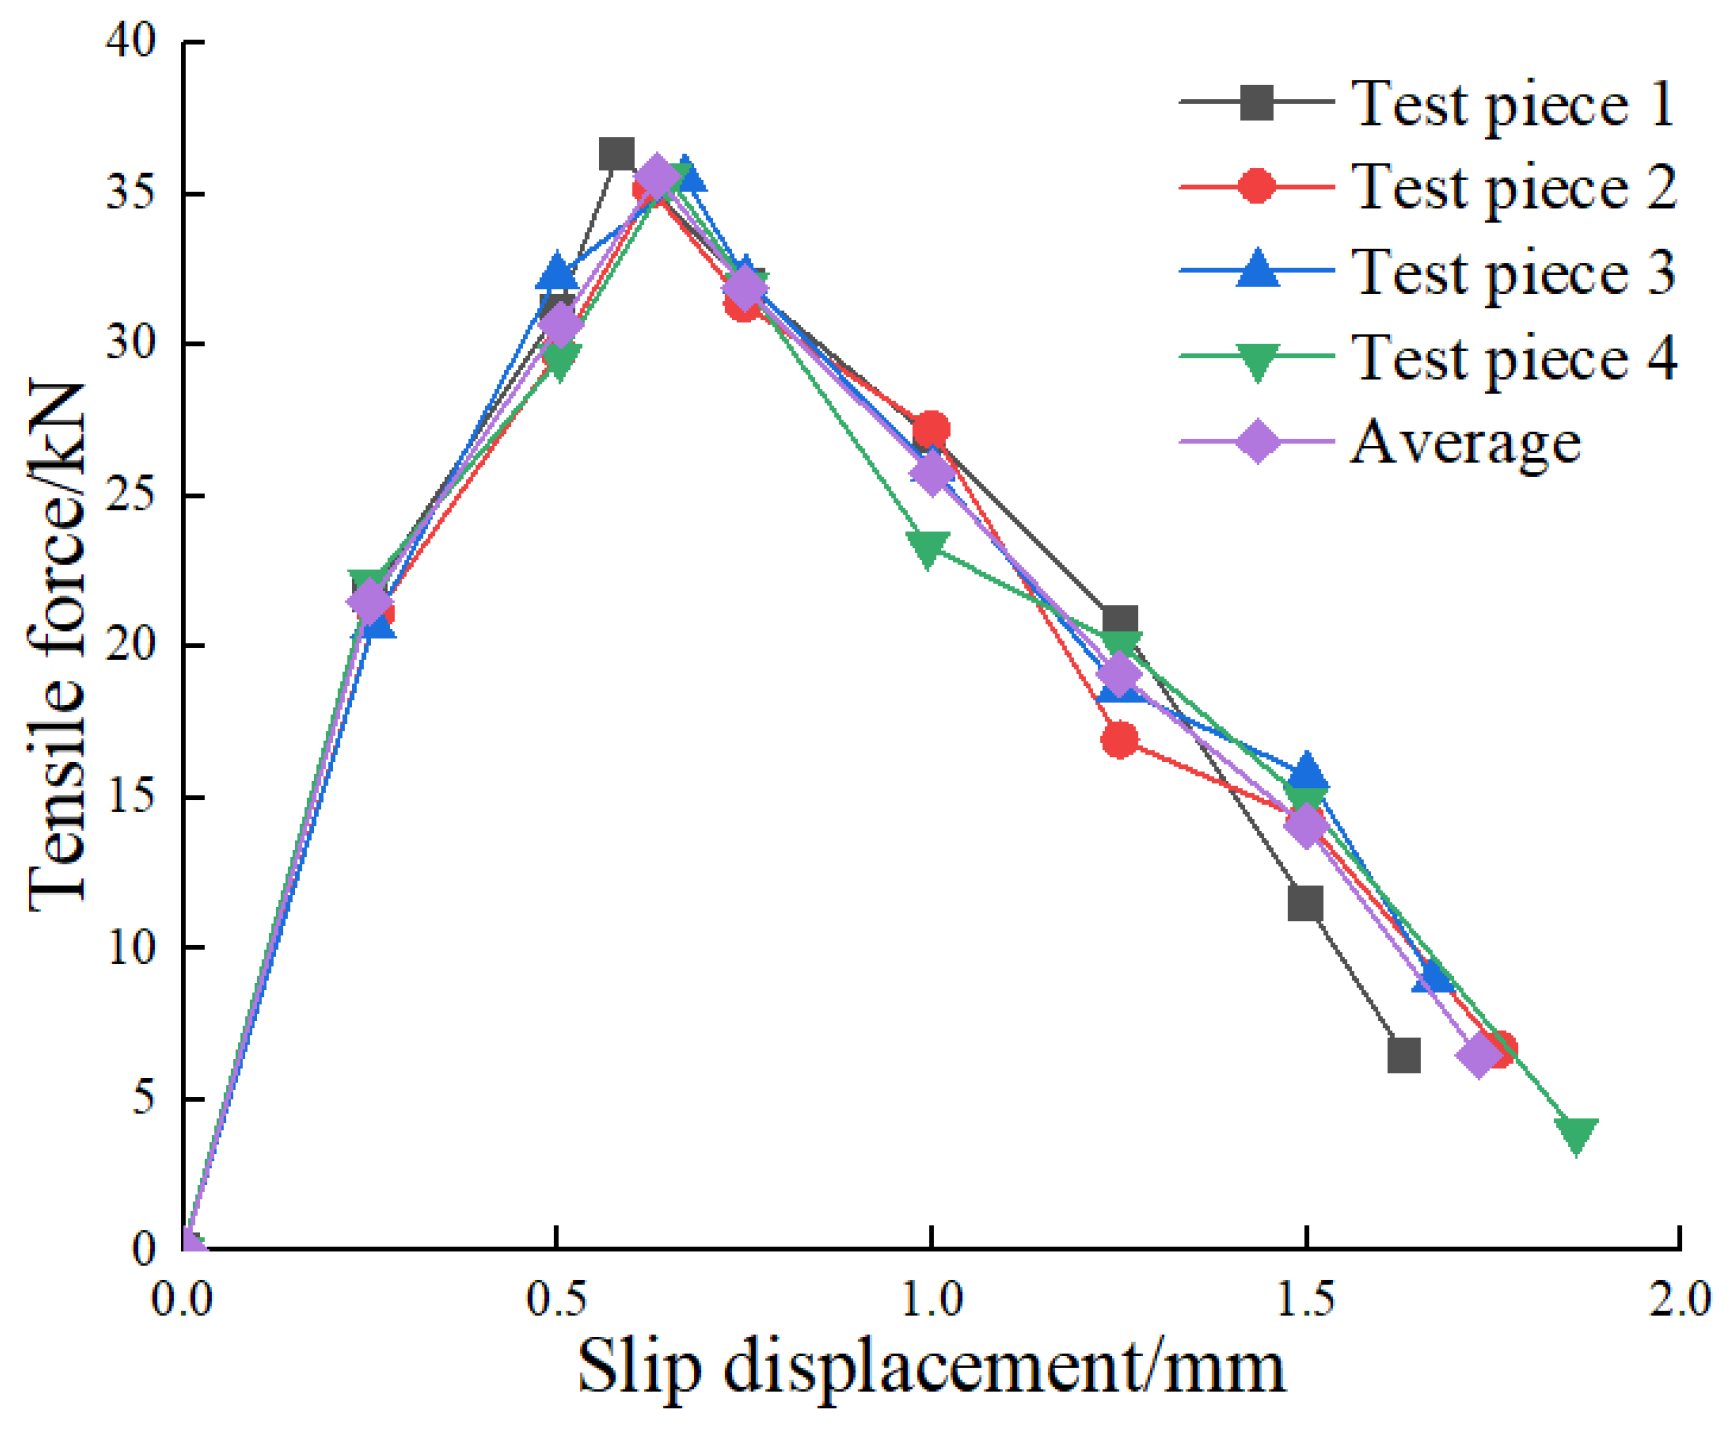
2.4. Central Pull Out Test
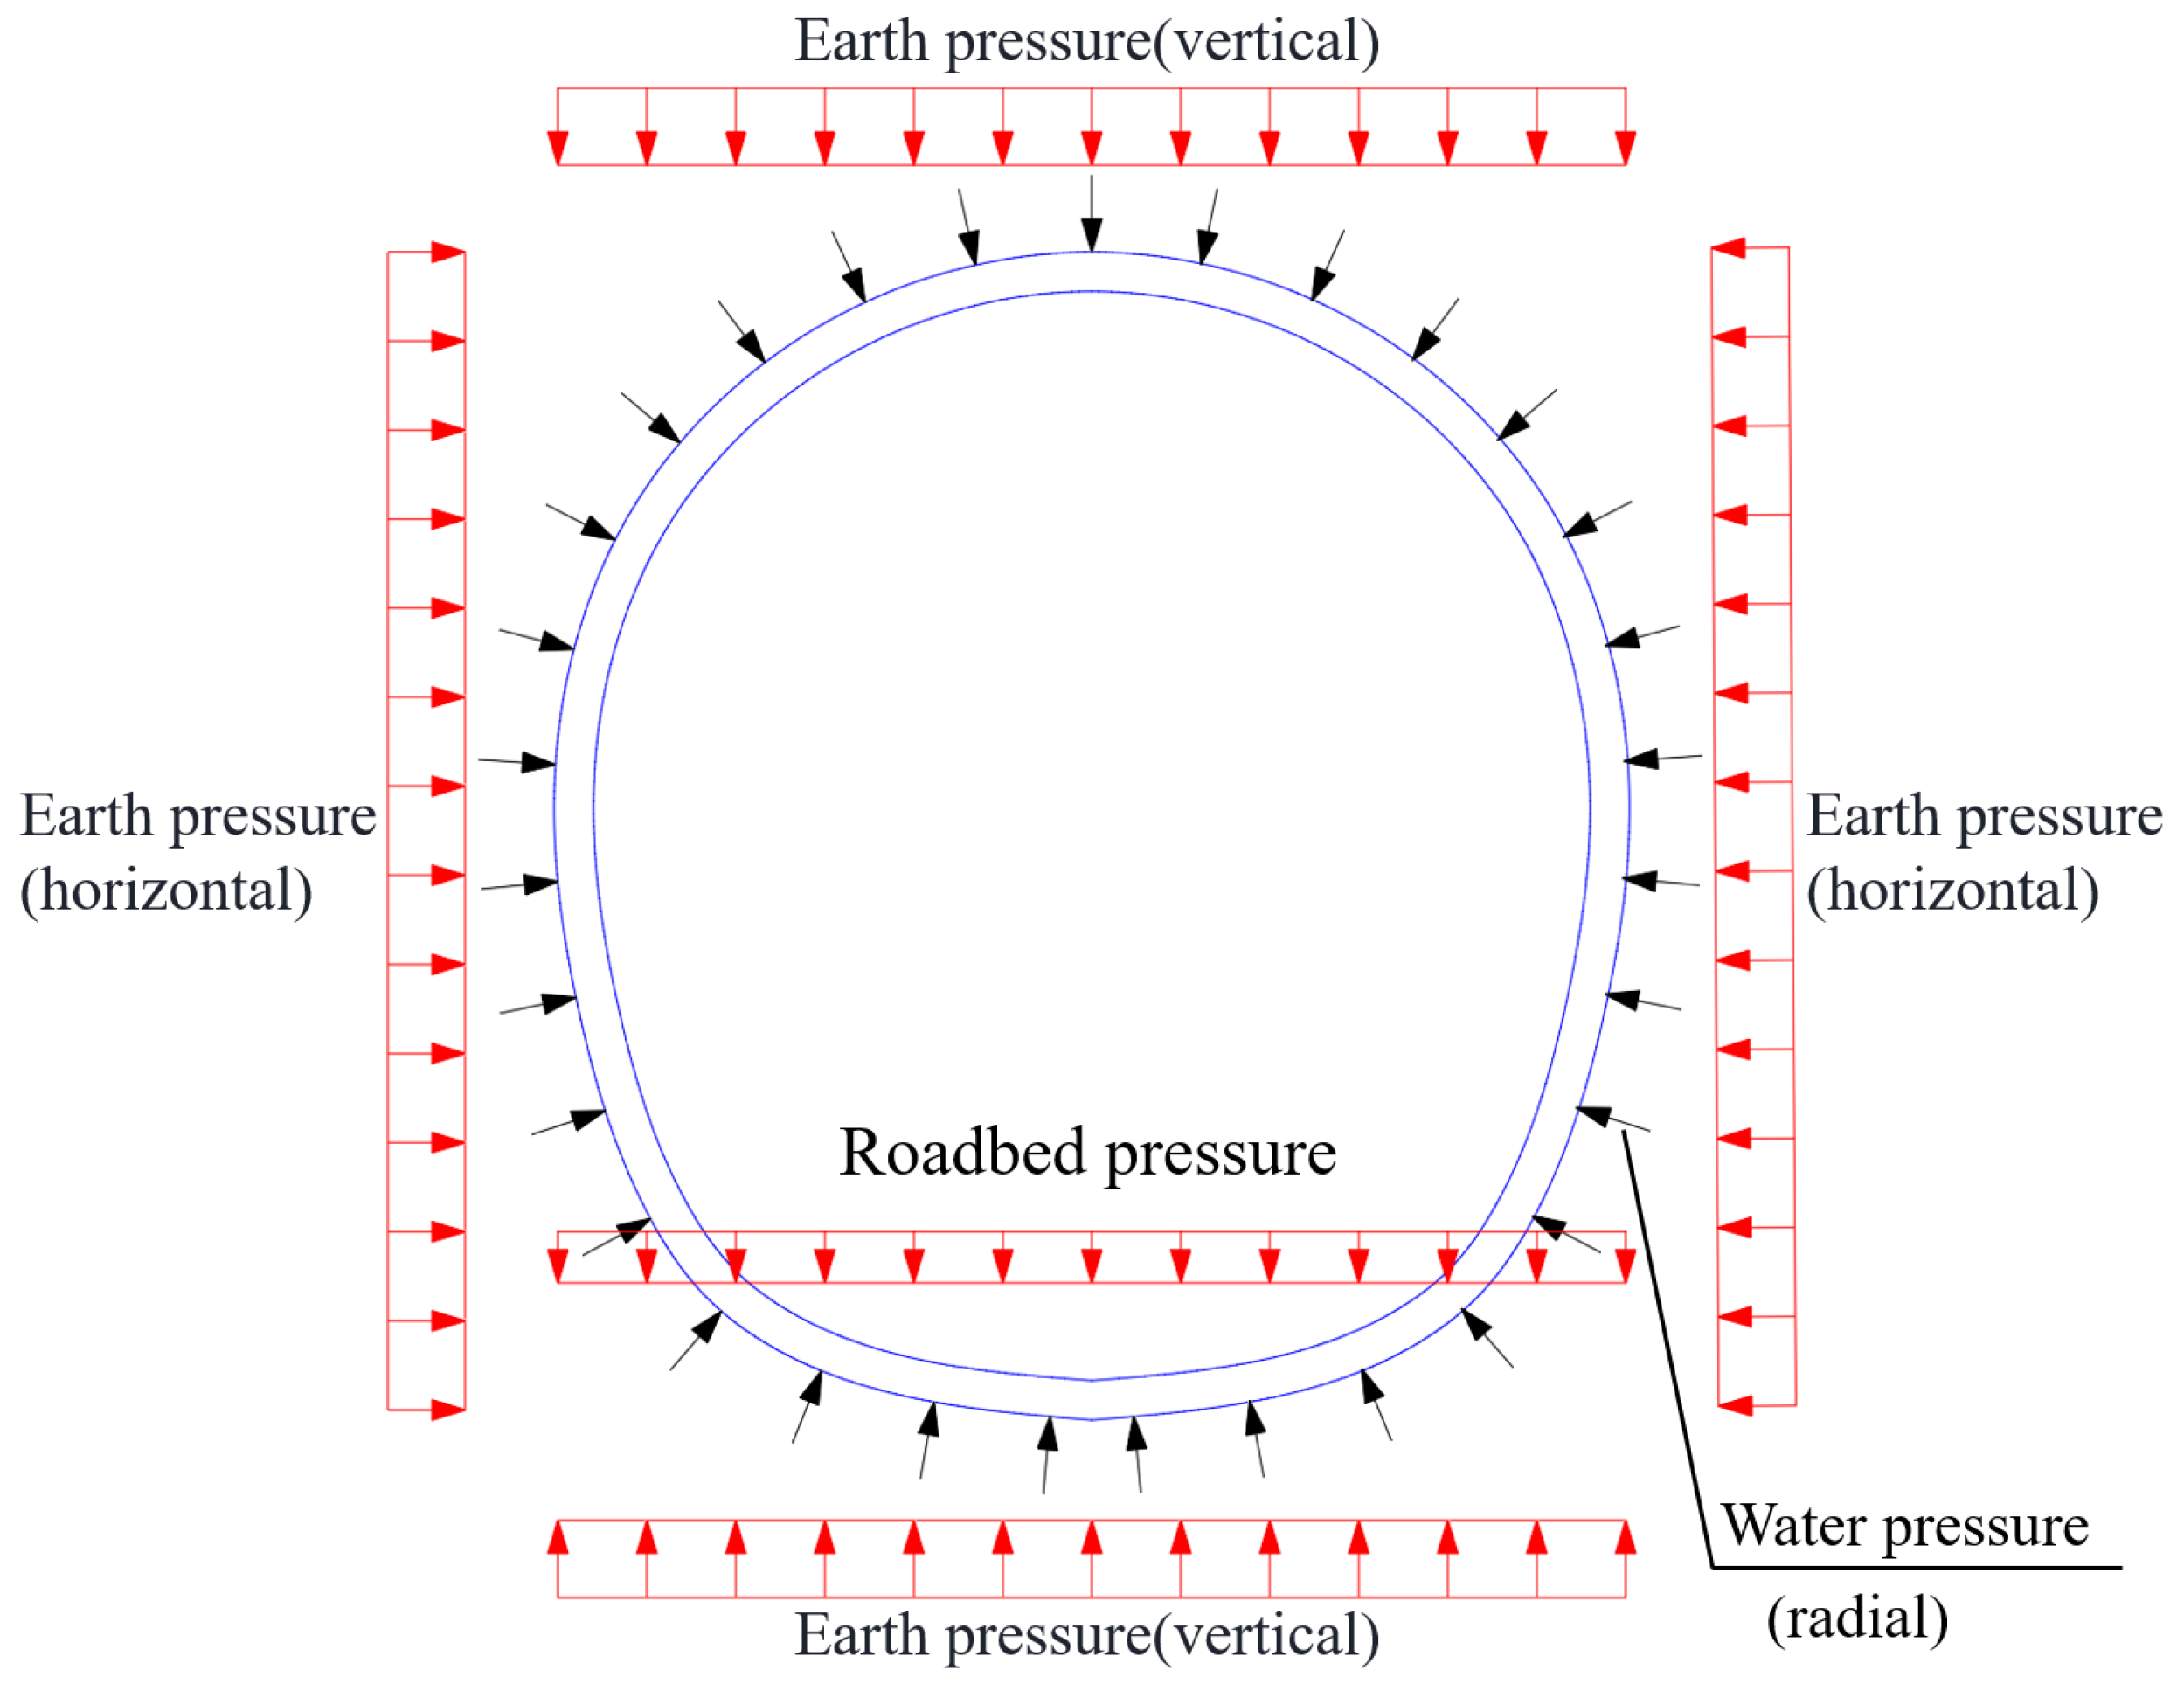
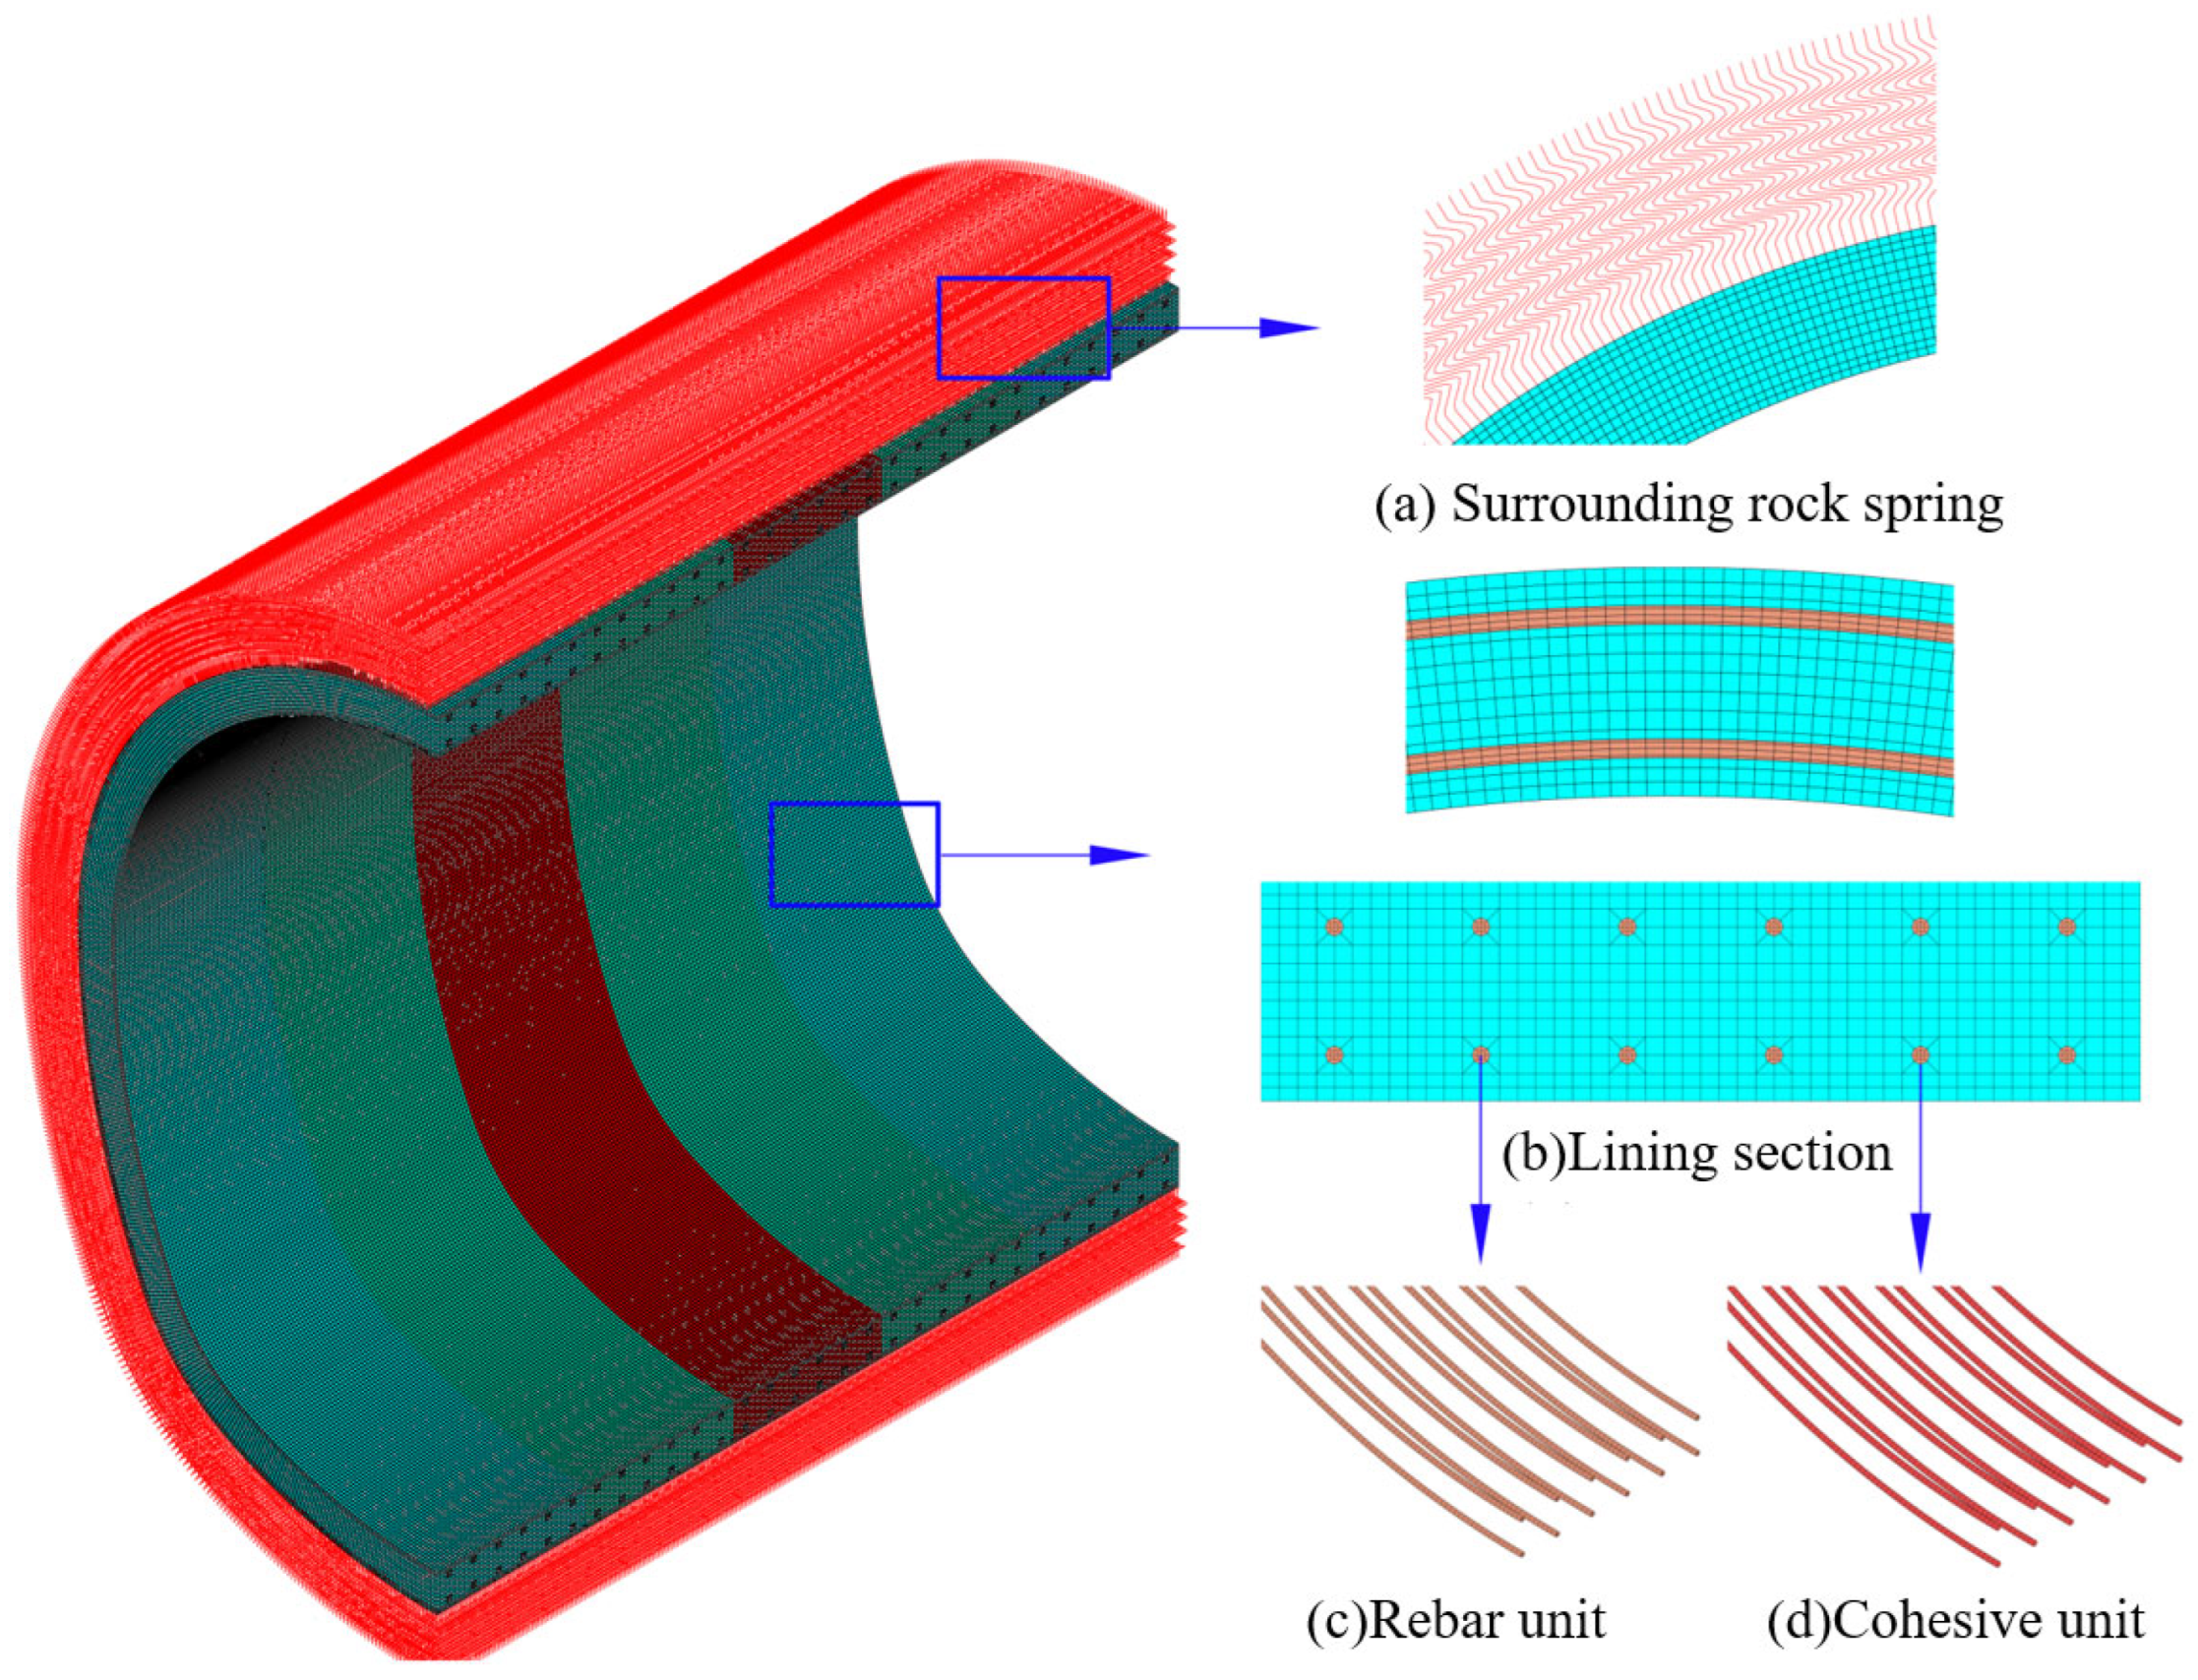
3. Tunnel Lining Performance Deterioration Analysis Model for Mining Method
4. Analysis
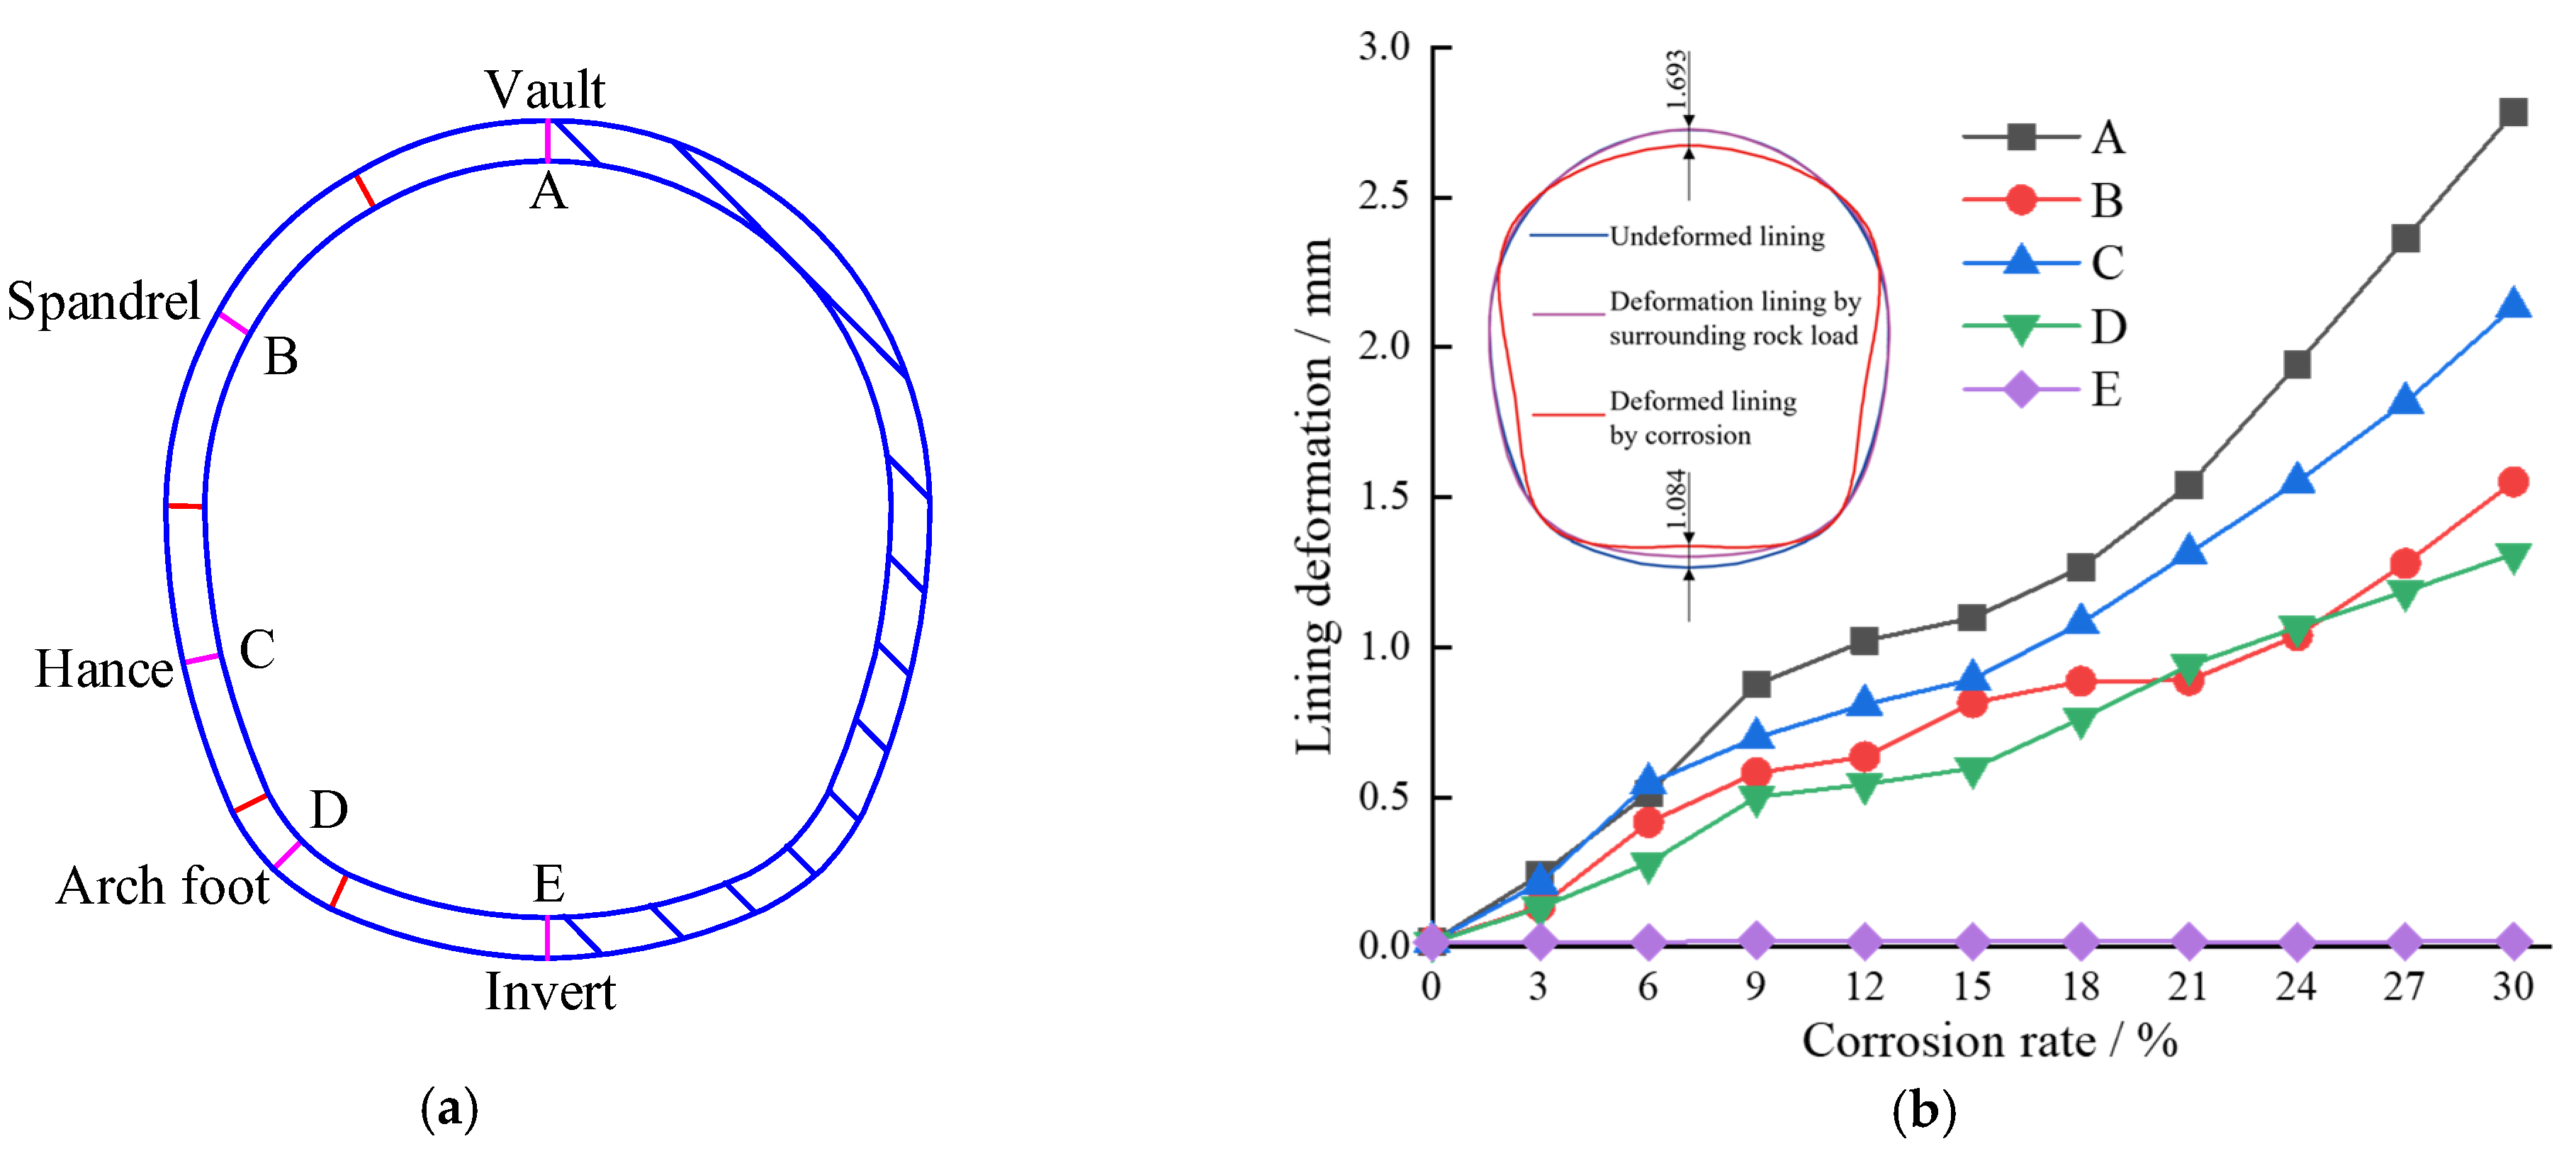
4.1. Deformation Analysis of Tunnel Lining Structures
4.2. Analysis of Internal Force Redistribution in Tunnel Lining Structures
4.3. Analysis of the Structural Damage Evolution of the Mining Method Tunnel
4.4. Analysis of Crack Width Evolution in the Mining Method Tunnel Lining Structure
5. Conclusions
- The tunnel lining structure exhibits a trend of deformation, with the vault descending, the invert rising, and the left and right hance shifting outward due to the combined effects of the surrounding soil and water pressure and steel reinforcement corrosion expansion. Corrosion reduces the stiffness of the lining structure, further exacerbating its deformation. For example, at high water pressures, when the corrosion rate is 0%, the vault displacement is 4.305 mm, while when the corrosion rate is 30%, the displacement increases to 7.136 mm, representing an increase of 65.7%.
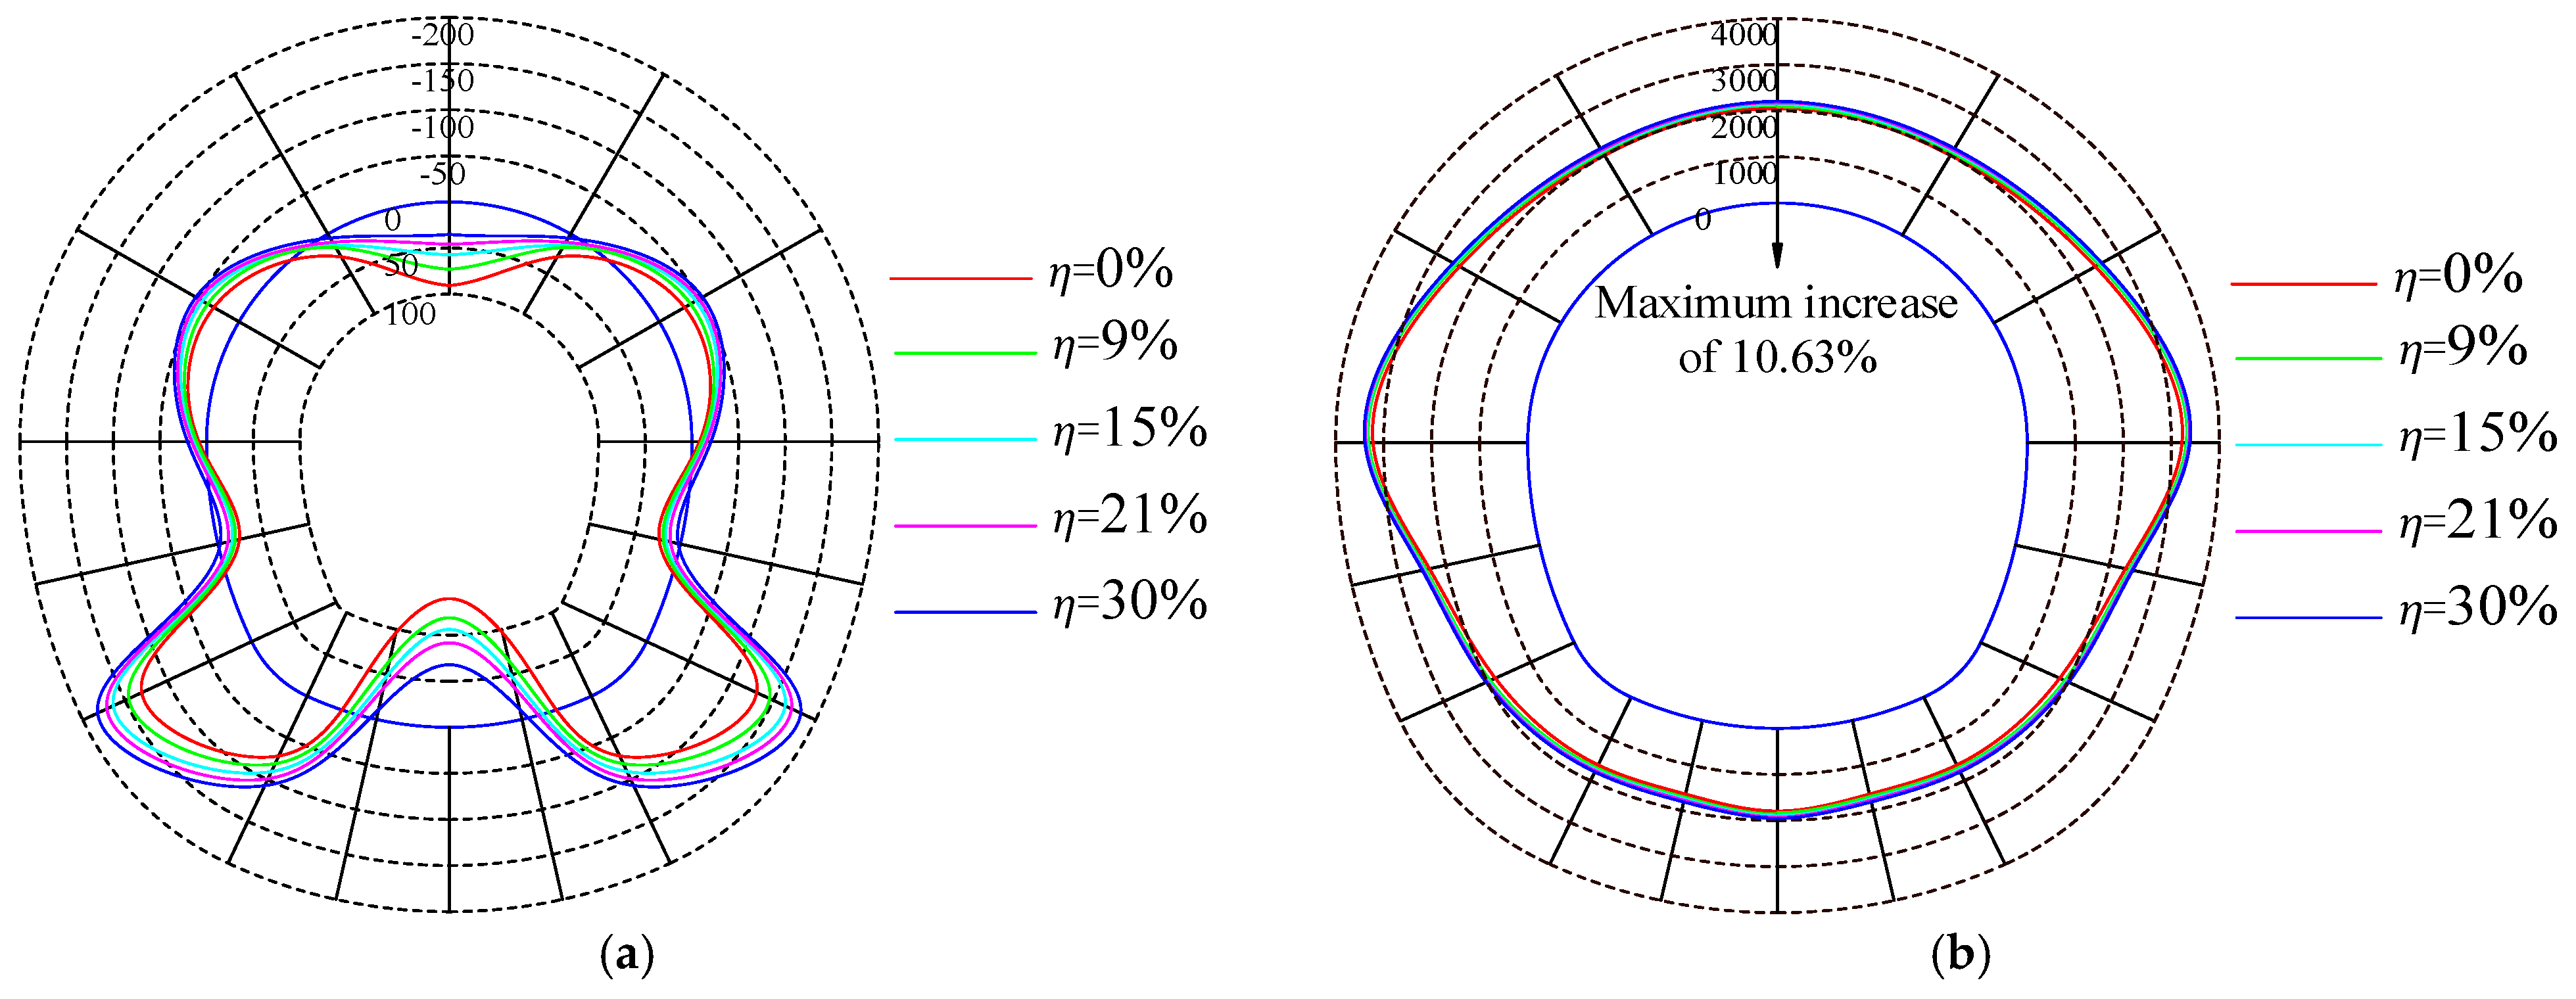
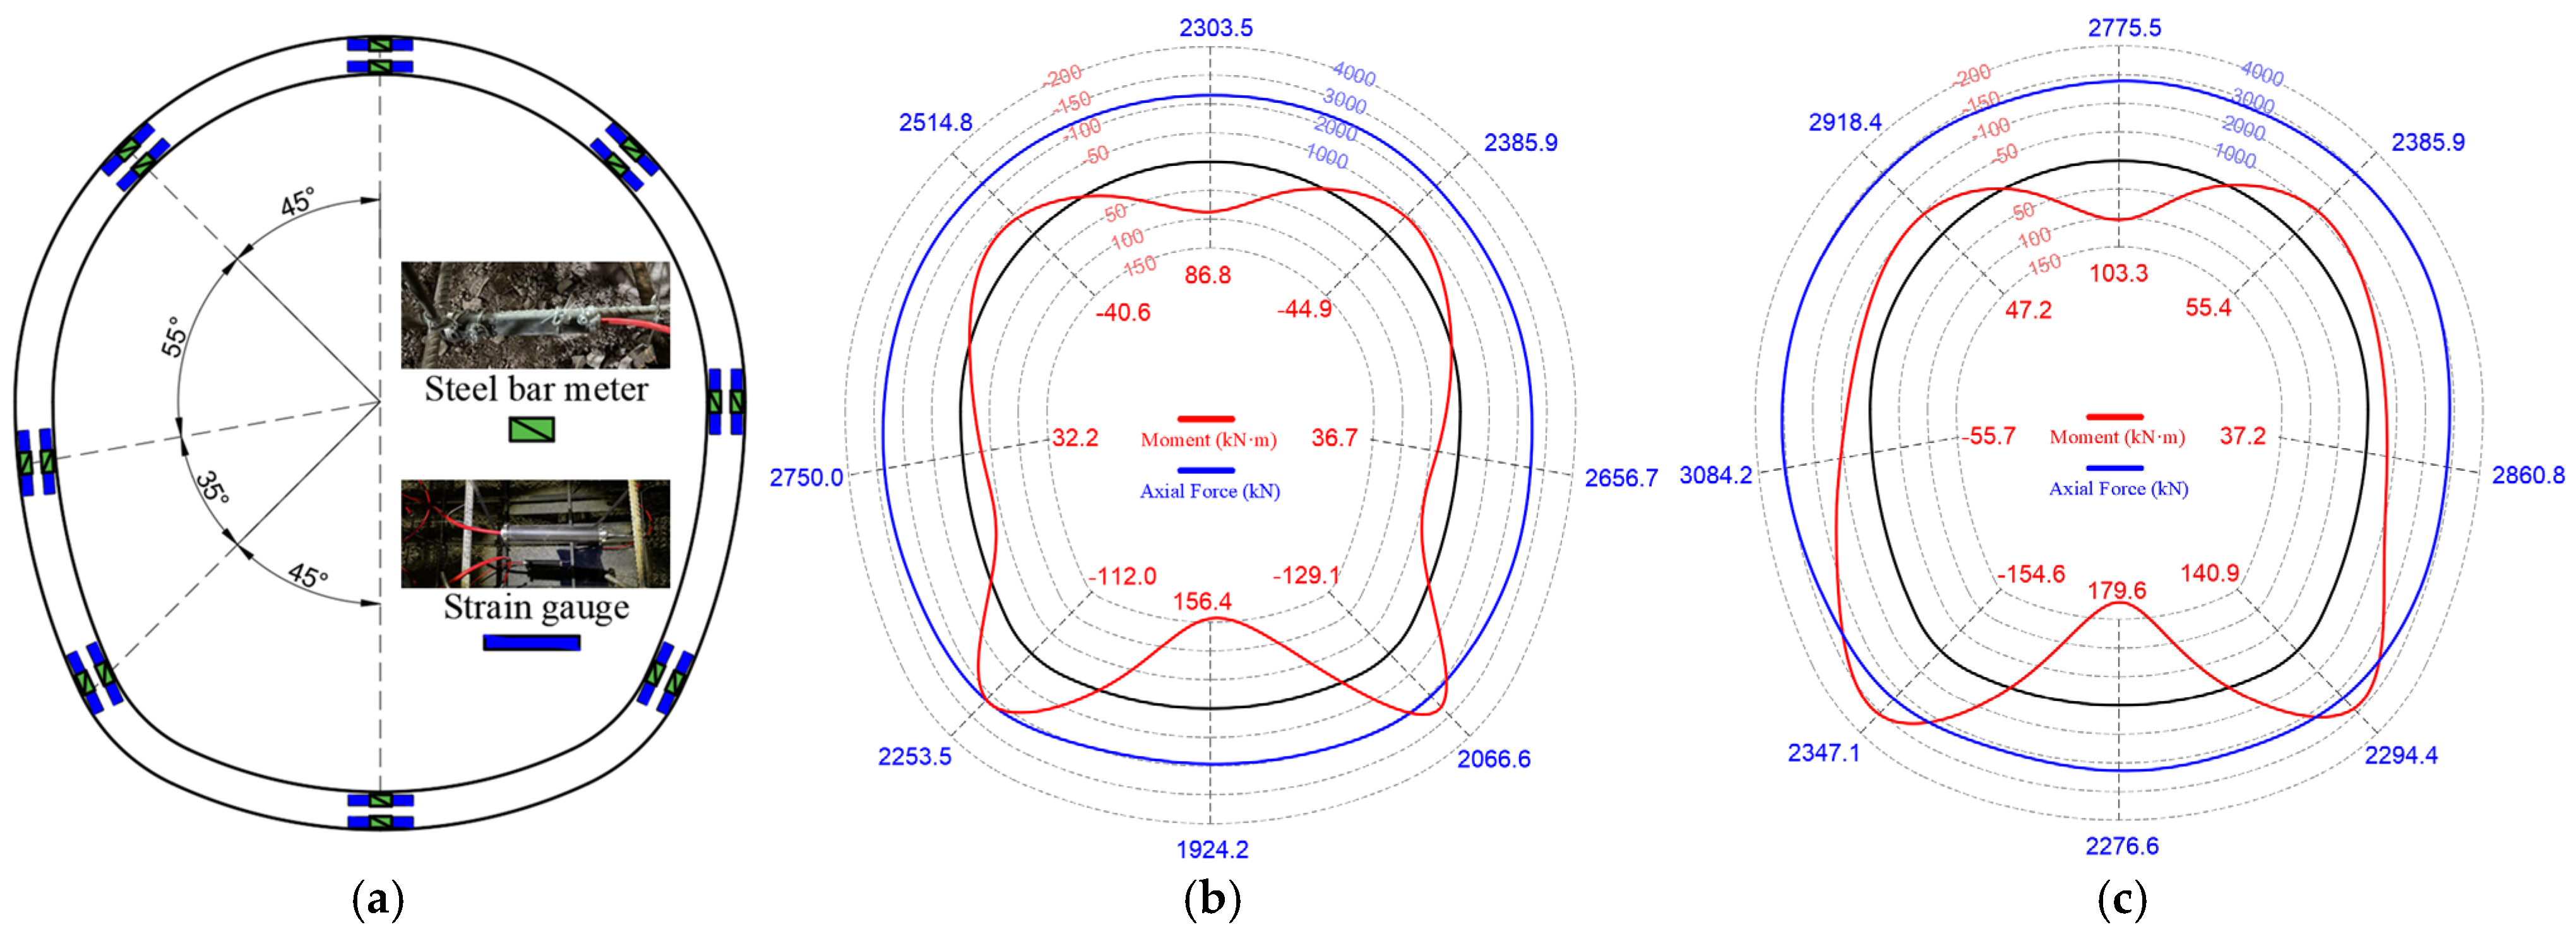
- The performance of the reinforced concrete lining structure continuously deteriorates, leading to a redistribution of the internal forces. As the corrosion rate increases from 0% to 30%, the axial force in the lining structure slightly increases. Specifically, the axial force in the vault increases from 2042.35 kN to 2207.80 kN, representing the largest increase of 8.10%. The trends in bending moment variation differ across the various parts of the lining, with the bending moments at the vault, hance, and invert decreasing, while those at the spandrel and arch foot increase.
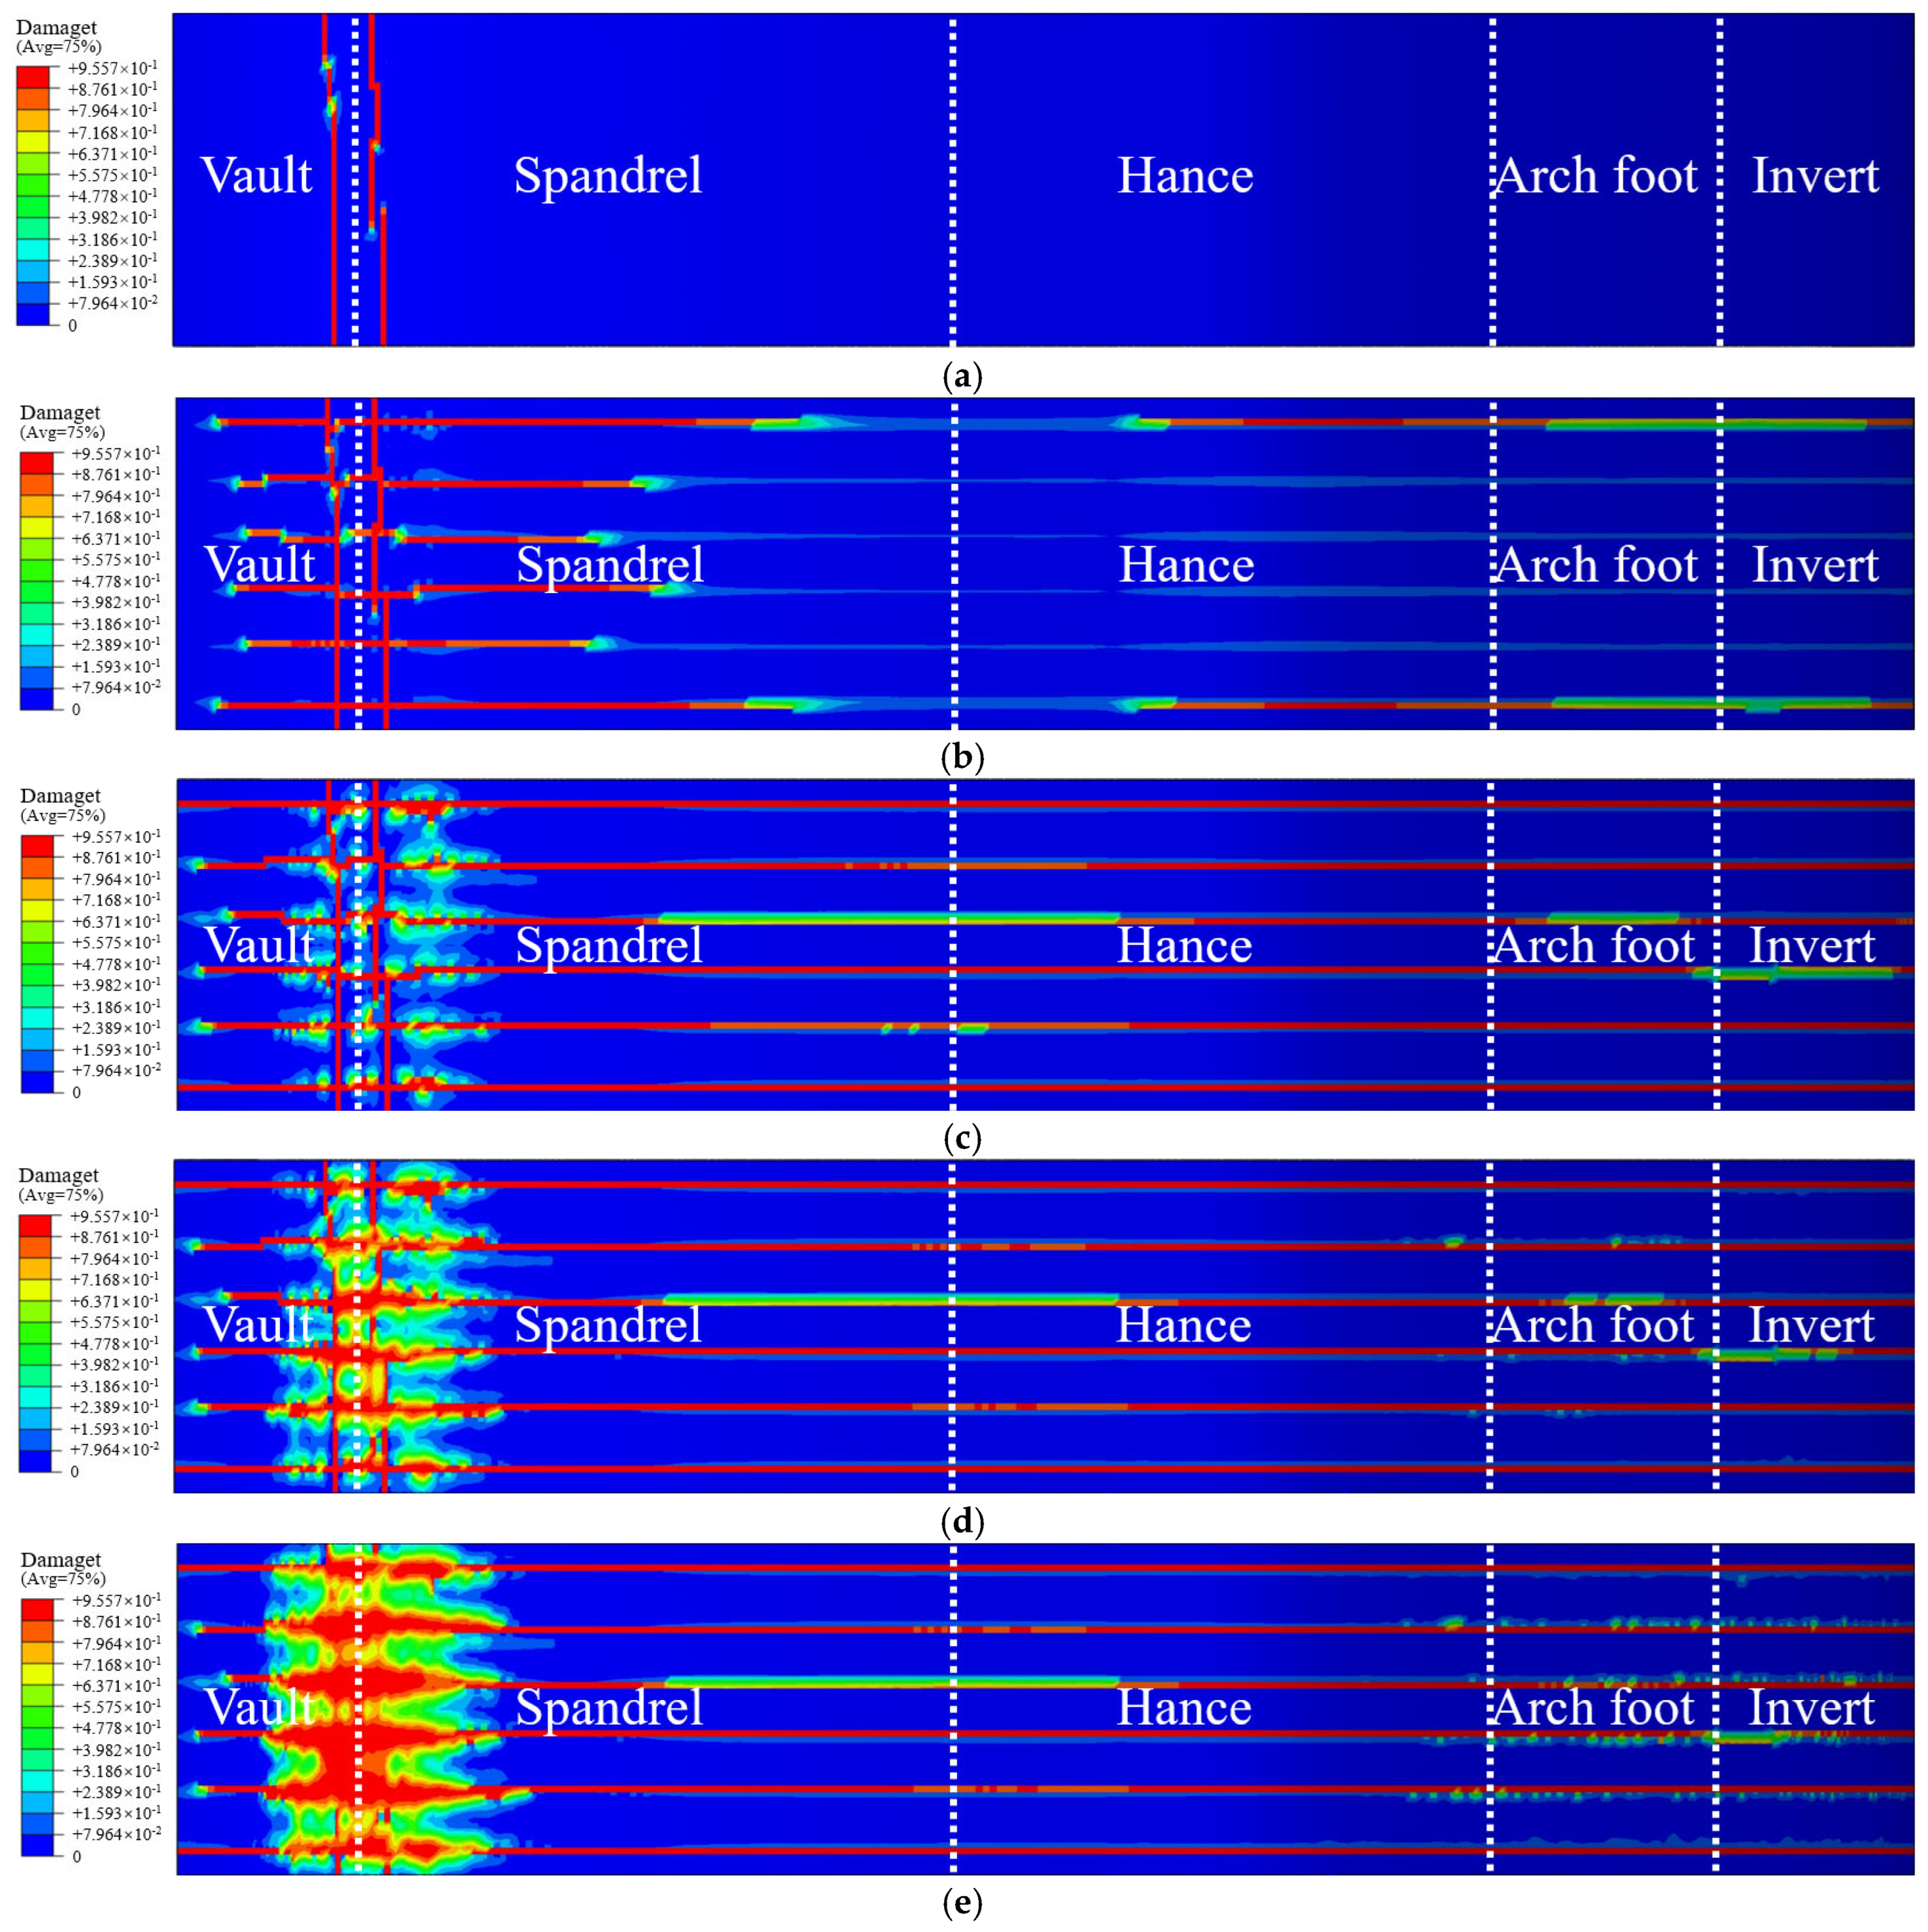
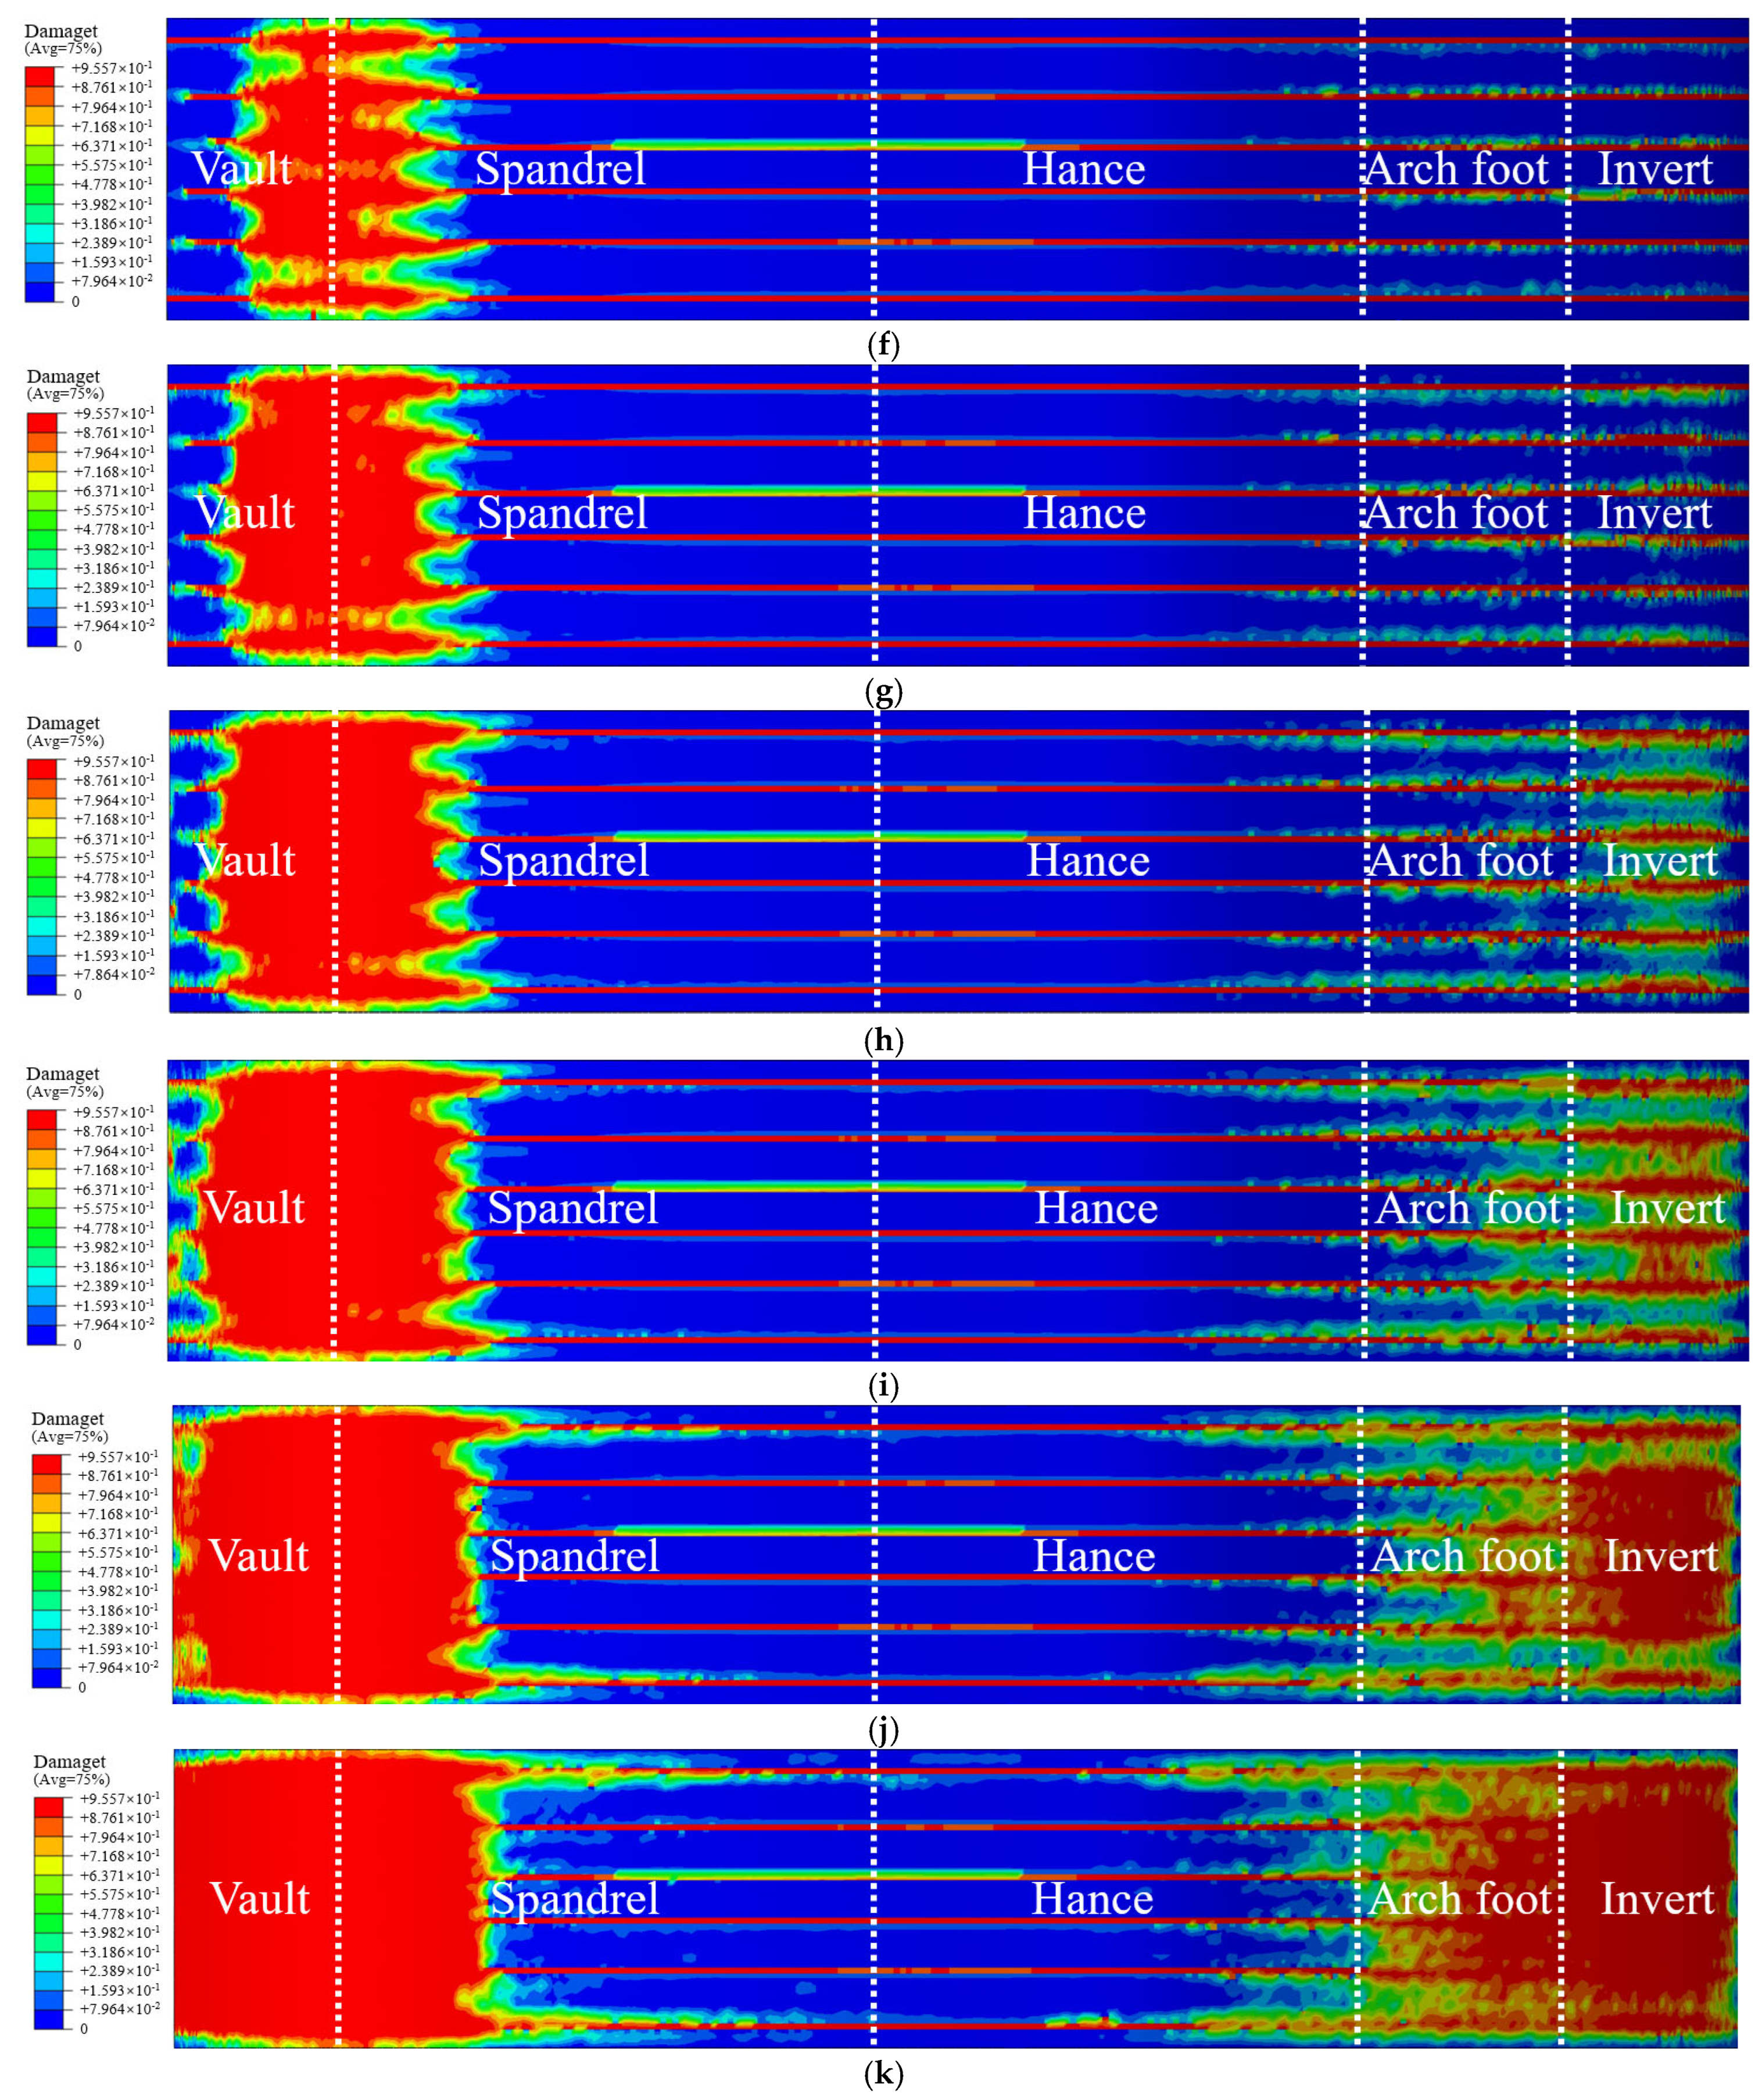
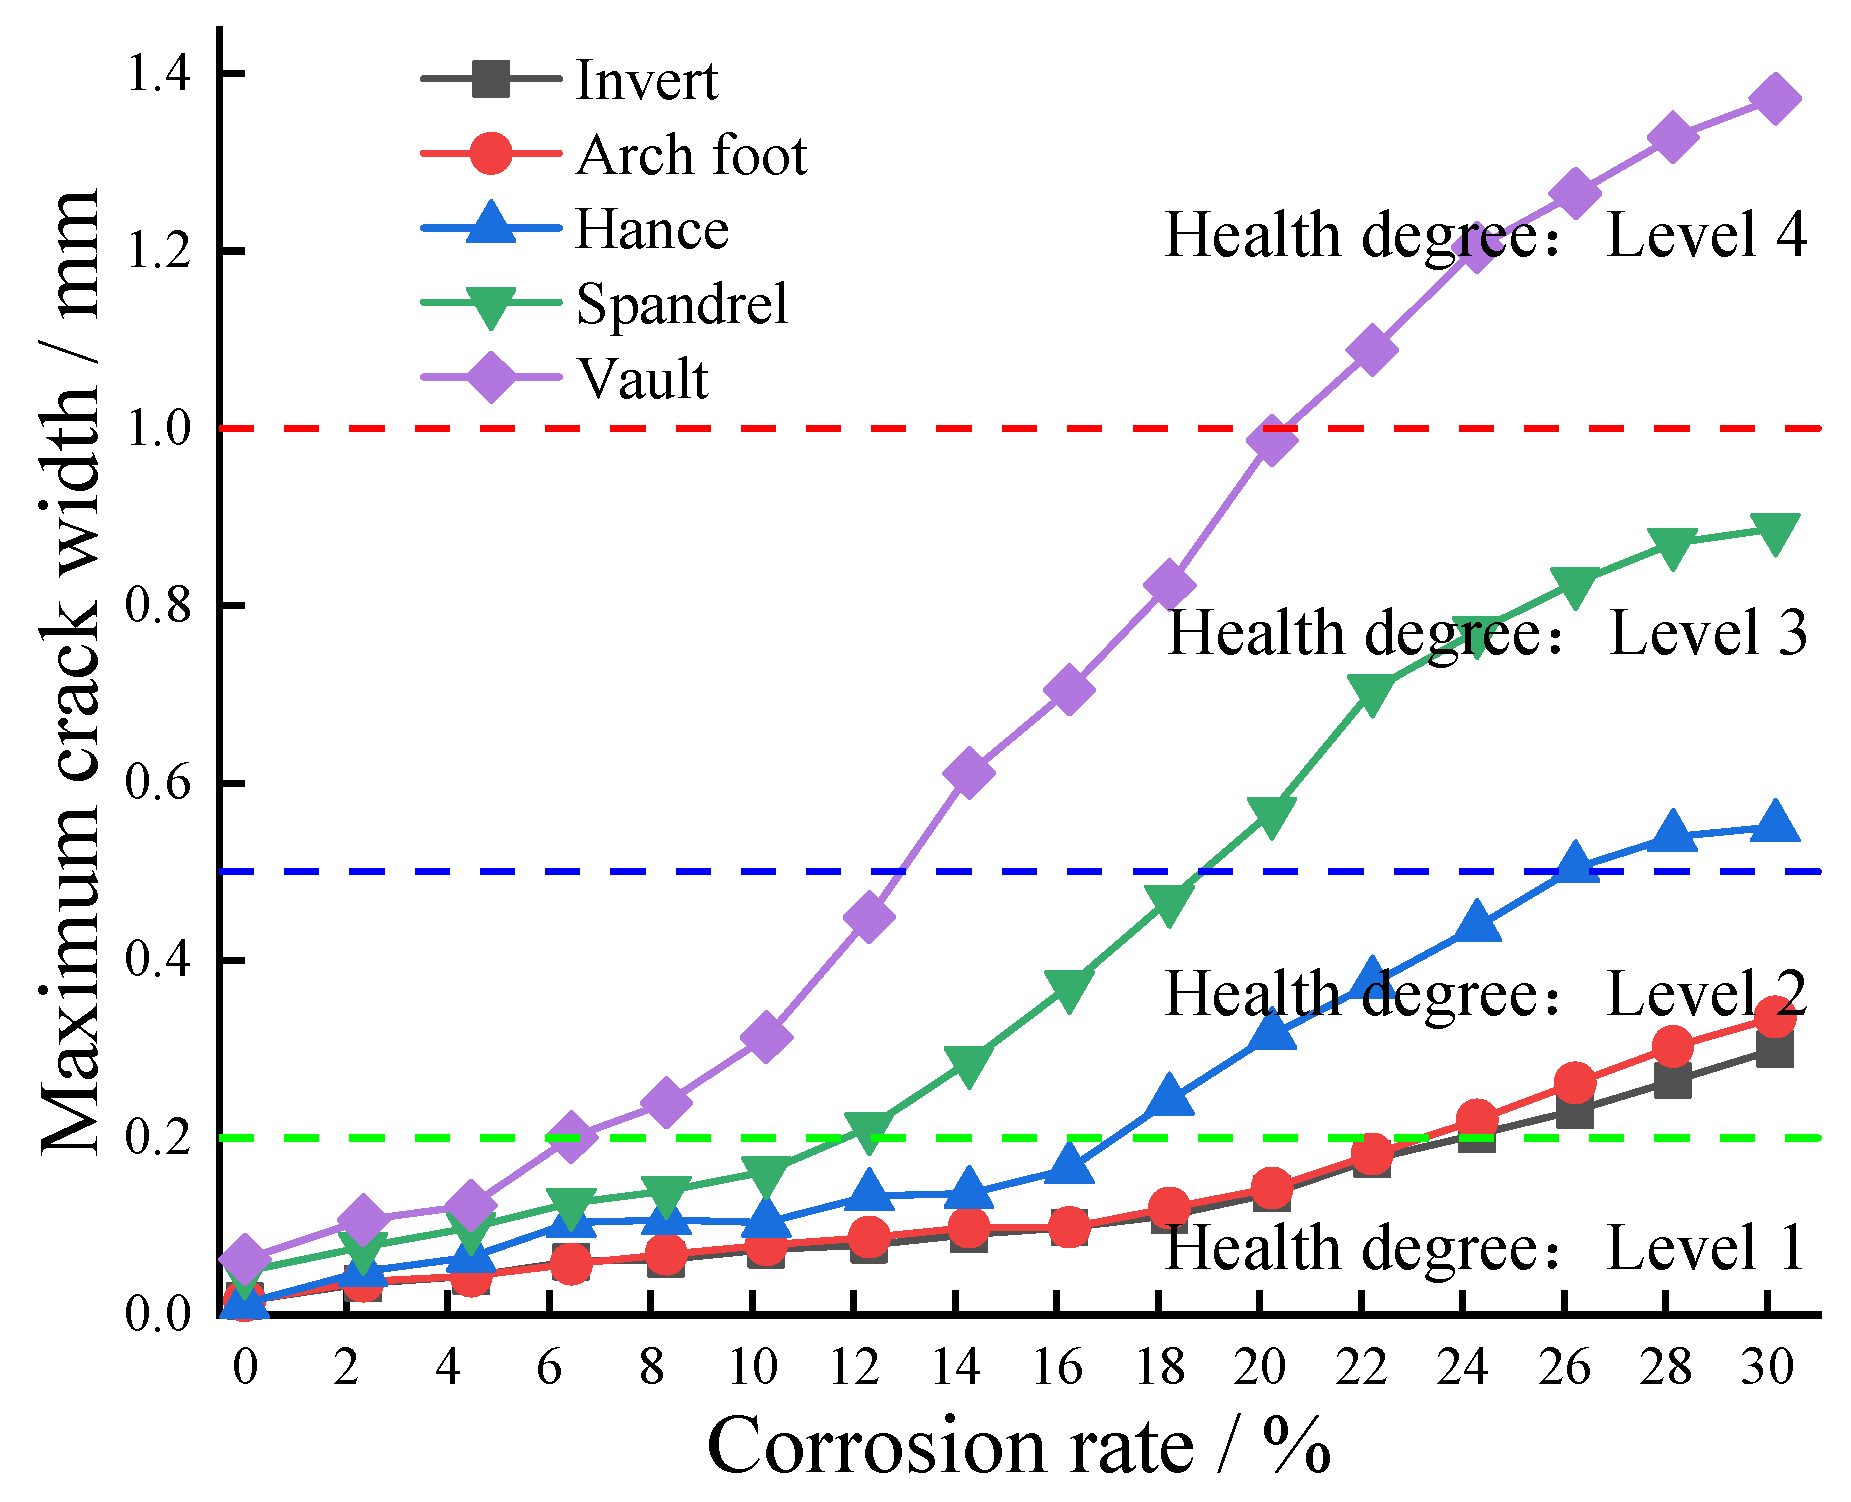
- The damage range of the tunnel lining structure continuously increases as corrosion progresses, with significant differences in the damage between the surrounding rock side and the free face side of the lining. The damage at the vault deepens as corrosion develops, suggesting that there is a risk of the lining being penetrated, while the corrosion depths at the spandrel and arch foot remain relatively small. Similarly, the maximum crack width develops most rapidly at the vault. When the corrosion rate reaches 30%, the crack widths at the vault, spandrel, hance, arch foot, and invert are 1.37 mm, 0.89 mm, 0.55 mm, 0.34 mm, and 0.30 mm, respectively.
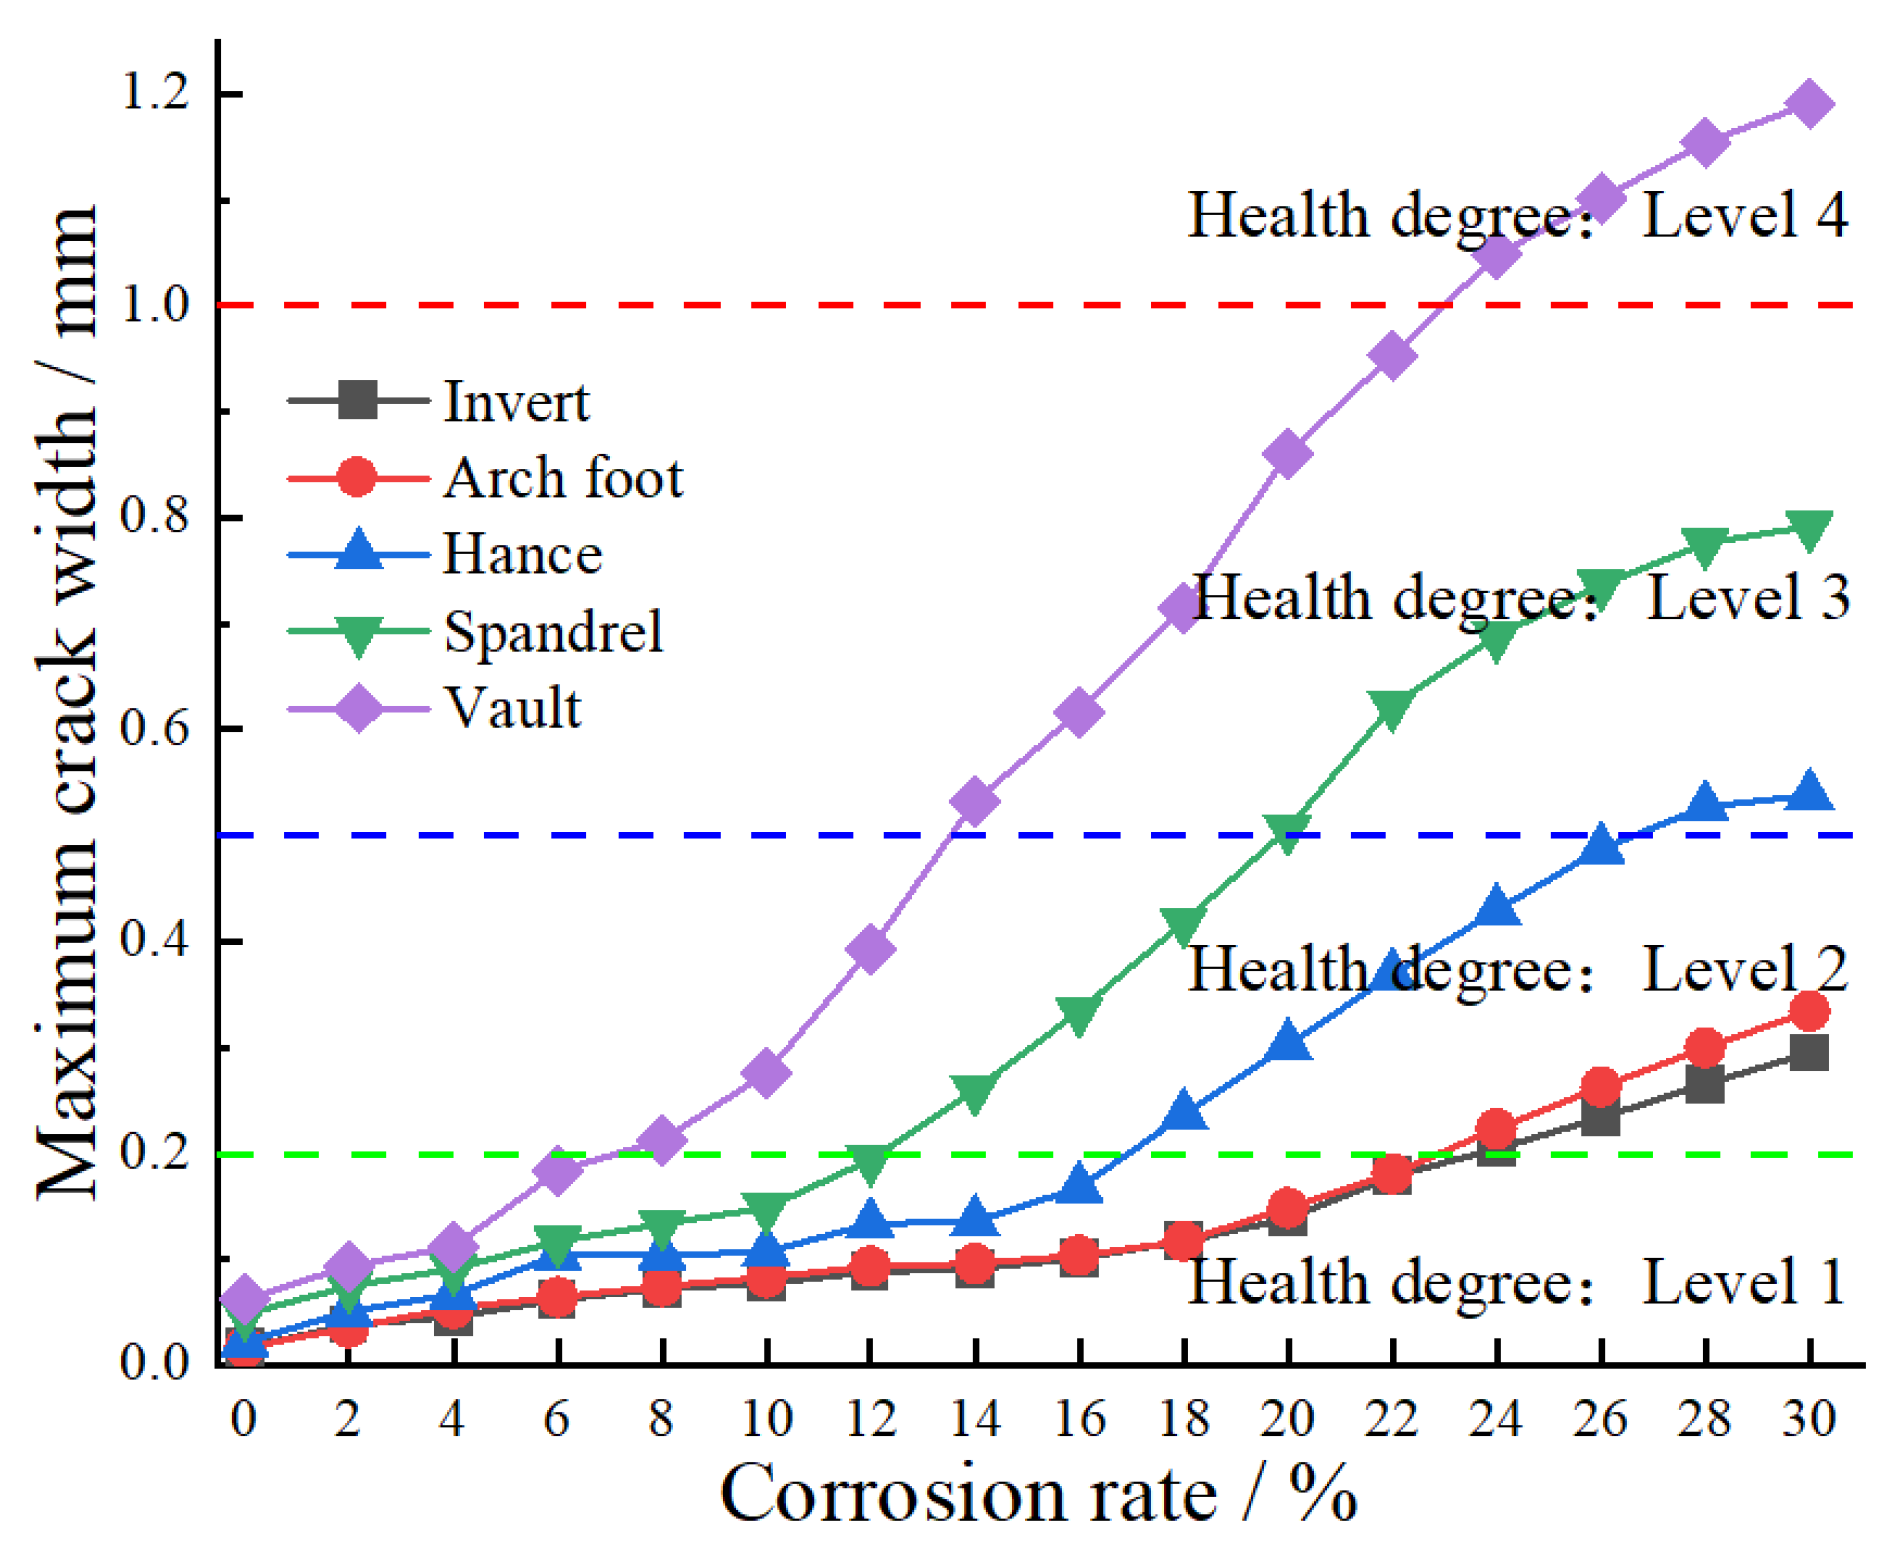
- Water pressure has a significant impact on the internal forces and crack width of the lining structure. As the water level decreases, both the bending moment and the axial force decrease, while the damage range and crack width of the structure increase. When the corrosion rate is 30%, the crack widths at the vault under high and low water pressure conditions are 1.19 mm and 1.37 mm, respectively, demonstrating an increase of 15.12%.
Author Contributions
Funding
Data Availability Statement
Conflicts of Interest
References
- Sarfaraz, A.; Harish, K.V. Experimental study on the fatigue performance of deep reinforced concrete beams subjected to simultaneous reinforcement corrosion. Int. J. Fatigue 2025, 193, 108779. [Google Scholar] [CrossRef]
- Baji, H.; Li, C.Q.; Scicluna, S.; Dauth, J. Risk-cost optimised maintenance strategy for tunnel structures. Tunn. Undergr. Space Technol. 2017, 69, 72–84. [Google Scholar] [CrossRef]
- Wang, J.B.; Niu, D.T.; Wang, Y.; He, H.; Liang, X.Y. Chloride diffusion of shotcrete lining structure subjected to nitric acid, salt-frost degradation, and bending stress in marine environment. Cem. Concr. Compos. 2019, 104, 103396. [Google Scholar] [CrossRef]
- Zhu, W.J.; Ren, Y.; Yu, Z.X.; Tang, F.; Xu, Y.D.; Xu, Y.Y. Characteristics of the non-uniform corrosion of the steel bars extracted from the marine transportation infrastructures. J. Build. Eng. 2024, 87, 109108. [Google Scholar] [CrossRef]
- Lee, H.S.; Kyung, J.W.; Lee, S.B. Study on the mechanical properties of reinforcement damaged by reinforcement corrosion. Key Eng. Mater. 2007, 348, 433–436. [Google Scholar] [CrossRef]
- Cao, C.; Cheung, M.M.S.; Chan, B.Y.B. Modelling of interaction between corrosion-induced concrete cover crack and steel corrosion rate. Corros. Sci. 2013, 69, 97–109. [Google Scholar] [CrossRef]
- Zhu, W.; Ren, Y.; Tang, F.; Xu, Y.D.; Yu, L.W.; Xu, Y.Y. Morphology of Corrosion Pits Induced by Stray Current and Chloride in RC Transportation Infrastructure. J. Mater. Civil. Eng. 2025, 37, 04025136. [Google Scholar] [CrossRef]
- Jiang, L.; Huang, G.H.; Xu, J.; Zhu, Y.; Mo, L.L. Influence of chloride salt type on threshold level of reinforcement corrosion in simulated concrete pore solutions. Constr. Build. Mater. 2012, 30, 516–521. [Google Scholar] [CrossRef]
- Guo, Z.; Fan, J.; Feng, S.; Wu, C.; Yao, G. Bayesian-Network-Based Evaluation for Corrosion State of Reinforcements Embedded in Concrete by Multiple Electrochemical Indicators. J. Nondestruct. Eval. 2024, 43, 92. [Google Scholar] [CrossRef]
- Xue, Q.; Zhang, L.W.; Mei, K.Y.; Li, X.C.; Newell, P.; Wang, Y.; Cheng, X.W.; Zheng, W. CO2-induced evolution of chemical, structural and mechanical properties of reinforced concrete: A review. Constr. Build. Mater. 2022, 353, 129069. [Google Scholar] [CrossRef]
- Tittarelli, F.; Carsana, M.; Bellezze, T. Corrosion behavior of reinforced no-fines concrete. Corros. Sci. 2013, 70, 119–126. [Google Scholar] [CrossRef]
- Cervenka, V.; Cervenka, J.; Rimkus, A.; Gribniak, V. Finite Element Modeling of Crack Width and Localization in Reinforced Concrete. Buildings 2025, 15, 529. [Google Scholar] [CrossRef]
- Pranno, A.; Greco, F.; Lonetti, P.; Luciano, R.; De Maio, U. An improved fracture approach to investigate the degradation of vibration characteristics for reinforced concrete beams under progressive damage. Int. J. Fatigue 2022, 163, 107032. [Google Scholar] [CrossRef]
- Rimkus, A.; Cervenka, V.; Gribniak, V.; Cervenka, J. Uncertainty of the smeared crack model applied to RC beams. Eng. Fract. Mech. 2020, 233, 107088. [Google Scholar] [CrossRef]
- De Maio, U.; Gaetano, D.; Greco, F.; Luciano, R.; Pranno, A. Degradation analysis of dynamic properties for plain concrete structures under mixed-mode fracture conditions via an improved cohesive crack approach. Fract. Struct. Integr. 2024, 18, 422–439. [Google Scholar] [CrossRef]
- Hu, X.F.; Xu, H.Q.; Xi, X.; Peng, Z.; Yang, S.T. Meso-scale phase field modelling of reinforced concrete structures subjected to corrosion of multiple reinforcements. Constr. Build. Mater. 2022, 321, 126376. [Google Scholar] [CrossRef]
- Marí, A.; Bairán, J.M.; Oller, E.; Duarte, N. Modeling serviceability performance and ultimate capacity of corroded reinforced and prestressed concrete structures. Struct Concr. 2022, 23, 6–15. [Google Scholar] [CrossRef]
- Šavija, B.; Luković, M.; Pacheco, J.; Schlangen, E. Cracking of the concrete cover due to reinforcement corrosion: A two-dimensional lattice model study. Constr. Build. Mater. 2013, 44, 626–638. [Google Scholar] [CrossRef]
- Chen, H.P.; Jiang, Y.; Xiao, L.F.; Liu, J.H. Lifetime reliability analysis of concrete columns damaged by reinforcement corrosion. Front. Mater. 2022, 9, 926259. [Google Scholar] [CrossRef]
- Zhang, Z.Q.; Gong, R.K.; Zhang, H.; He, W.P. The sustainability performance of reinforced concrete structures in tunnel lining induced by long term coastal environment. Sustainability 2020, 12, 3946. [Google Scholar] [CrossRef]
- Yousif, A.M. Study on the Strength for Corroded Tunnel Lining. Doctoral Thesis, Southwest Jiaotong University, Chengdu, China, 2013. [Google Scholar]
- Zhang, W.P.; Qiu, J.L.; Zhao, C.L.; Liu, X.; Huang, Q.H. Structural performance of corroded precast concrete tunnel lining. Tunn. Undergr. Space Technol. 2022, 128, 104658. [Google Scholar] [CrossRef]
- Xu, Q.; Wang, H.; Huang, X. Study on the evolution patterns of concrete lining’s physical and mechanical properties under sulfuric acid corrosion conditions. In Proceedings of the GeoShanghai International Conference 2024, Shanghai, China, 26–29 May 2024; Volume 1333, p. 012026. [Google Scholar]
- Zhang, W.P.; Qiu, J.L.; Zhao, C.L. Structural behavior degradation of corroded metro tunnel lining segment. Struct. Infrastruct. Eng. 2024, 20, 529–545. [Google Scholar] [CrossRef]
- Li, C.; Chen, Q.; Wang, R.L.; Wu, M.X.; Jiang, Z.W. Corrosion assessment of reinforced concrete structures exposed to chloride environments in underground tunnels: Theoretical insights and practical data interpretations. Cement Concrete Comp. 2020, 112, 103652. [Google Scholar] [CrossRef]
- Seok, S.; Haikal, G.; Ramirez, J.A.; Lowes, L.N.; Lim, J. Finite element simulation of bond-zone behavior of pullout test of reinforcement embedded in concrete using concrete damage-plasticity model 2 (CDPM2). Eng. Struct. 2020, 221, 110984. [Google Scholar] [CrossRef]
- Wang, Z.Q.; Yu, Z.W. Concrete damage model based on energy loss. J. Build. Mater. 2004, 2004, 365–369. [Google Scholar] [CrossRef]
- Liu, D.W.; Deng, Y.; Yang, F.; Xu, G.Y. Nondestructive testing for crack of tunnel lining using GPR. J. Cent. South Univ. Technol. 2005, 12, 120–124. [Google Scholar] [CrossRef]
- Jin, L.; Liu, M.; Zhang, R.; Du, X.L. Cracking of cover concrete due to non-uniform corrosion of corner rebar: A 3D meso-scale study. Constr. Build. Mater. 2020, 245, 118449. [Google Scholar] [CrossRef]
- Xu, W.; Zhang, C.; Liu, H.; Yang, J.L.; Wang, X.S.; Tian, W.; Cao, K.Z.; Zhang, T.P. Simulation and analysis of corrosion fracture of reinforced concrete based on phase field method. Case Stud. Constr. Mater. 2022, 17, e01366. [Google Scholar] [CrossRef]
- Chen, F.X.; Jin, Z.Q.; Wang, E.D.; Wang, L.Q.; Jiang, Y.D.; Guo, P.F.; Gao, X.Y.; He, X.Y. Relationship model between surface strain of concrete and expansion force of reinforcement rust. Sci. Rep. 2021, 11, 4208. [Google Scholar] [CrossRef]
- Zhang, P.S.; Lu, M.; Li, X.Y. Mechanical property of rustiness reinforcement steel. Ind. Constr. 1995, 1995, 41–44. [Google Scholar]
- Wang, Q.W.; Wang, C.W.; Liu, L.; Han, W.C. Research status and analysis progress of the interfacial bond performance of con crete-filled steel tubes. Build. Struct. 2021, 51, 91–97. [Google Scholar]
- Cao, Y.; Wang, P.; Jin, X.; Wang, J.; Yang, Y. Tunnel structure analysis using the multi-scale modeling method. Tunn. Undergr. Space Technol. 2012, 28, 124–134. [Google Scholar] [CrossRef]
- Wang, Z.; Hu, M.; Lai, J.; Xie, S.; Cai, Y. Reliability analysis method for tunnel structural design: Brief review and relevant prospects. Structures 2023, 55, 1894–1905. [Google Scholar] [CrossRef]
- Fu, J.P.; Wang, X.F.; Zhu, A.P.; Yang, P.A. Experimental investigation on simply supported RC beams with 500MPa reinforcement under long-term loads. J. Build. Struct. 2011, 32, 43–49. [Google Scholar]
- GB 50108-2008; Technical Code for Waterproofing of Underground Works. China Plans Publishing House: Beijing, China, 2008.
- CJJ/T 289-2018; Technical Standard for Maintenance of Tunnel Structures in Urban Rail Transit. China Architecture & Building Press: Beijing, China, 2018.
- Luo, D.; Li, Y.; Li, J.; Lim, K.S.; Nazal, N.A.M.; Ahmad, H. A recent progress of steel bar corrosion diagnostic techniques in RC structures. Sensors 2018, 19, 34. [Google Scholar] [CrossRef]
- Jaśniok, M.; Jaśniok, T. Evaluation of maximum and minimum corrosion rate of steel rebars in concrete structures, based on laboratory measurements on drilled cores. Procedia Eng. 2017, 193, 486–493. [Google Scholar] [CrossRef]
- Qiao, X.F.; Mu, P.A.; Dai, S.G.; Wang, B. Design and research of corrosion monitor instrument based on a novel coupon-type electrical resistance probe. In Electronics, Electrical Engineering and Information Science: Proceedings of the 2015 International Conference on Electronics, Electrical Engineering and Information Science (EEEIS2015), Guangzhou, China, 7–9 August 2015; World Scientific Publishing Co., Inc.: Hackensack, NJ, USA, 2016; pp. 325–333. [Google Scholar]
- Lopez-Calvo, H.Z.; Montes-García, P.; Jiménez-Quero, V.G.; Gómez-Barranco, H.; Bremner, T.W.; Thomas, M.D.A. Influence of crack width, cover depth and concrete quality on corrosion of steel in HPC containing corrosion inhibiting admixtures and fly ash. Cement Concrete Comp. 2018, 88, 200–210. [Google Scholar] [CrossRef]


| Dilatancy Angle ψ/° | Flow Parameters | fb0/fc0 | K | μ |
|---|---|---|---|---|
| 30 | 0.1 | 1.16 | 0.6667 | 5 × 10⁻⁴ |
| Test Results | Experimental Value | Calculated Value | Relative Error/% |
| Maximum pulling force/kN | 35.647 | 36.9561 | 3.672 |
| Sliding displacement/mm | 0.633 | 0.63563 | 0.415 |
| Elastic | Fracture Criterion Maxs | Damage Evolution | |||
| Normal stiffness (MPa/mm) | Tangential stiffness (MPa/mm) | Normal damage onset stress (MPa) | Tangential damage onset stress (MPa) | Normal fracture energy (MPa·mm) | Tangential fracture energy (MPa·mm) |
| 32.5 | 29.7 | 16.2 | 8.3 | 16.2 | 8.1 |
| Corrosion Rate/% | High Water Pressure | Low Water Pressure | ||
|---|---|---|---|---|
| Displacement | Displacement Difference | Displacement | Displacement Difference | |
| 0 | 4.305 | 0 | 2.803 | 0 |
| 10 | 5.233 | 0.928 | 3.710 | 0.907 |
| 20 | 5.779 | 1.474 | 4.241 | 1.438 |
| 30 | 7.136 | 2.831 | 5.580 | 2.777 |
| Internal Force | Working Conditions | 1 | 2 | 3 | 4 | 5 | 6 | 7 | 8 | 9 | |
|---|---|---|---|---|---|---|---|---|---|---|---|
| Bending moment (kN·m) | Low-water level | η = 0% | 90.6 | 28.7 | −31.2 | −8.2 | 23.4 | −130.2 | −71.6 | 96.2 | 139.5 |
| η = 30% | 35.2 | 5.0 | −53.4 | −20.4 | 2.4 | −182.3 | −107.1 | 10.9 | 67.9 | ||
| Rate of change /% | 61.2 | 82.5 | 71.1 | 148.8 | 89.9 | 40.1 | 49.7 | 88.6 | 51.3 | ||
| High-water level | η = 0% | 98.7 | 31.2 | −40.2 | −10.6 | −78.8 | −158.3 | −85.5 | 114.3 | 165.2 | |
| η = 30% | 39.3 | 5.6 | −70.0 | −26.9 | −115.8 | −226.9 | −131.0 | 13.3 | 89.5 | ||
| Rate of change /% | 60.2 | 82.0 | 74.1 | 154.1 | 46.9 | 43.3 | 53.2 | 88.4 | 45.8 | ||
| Axial force (kN) | Low-water level | η = 0% | 2042.4 | 1991.5 | 2444.3 | 3222.9 | 2348.5 | 1863.4 | 1622.7 | 1636.8 | 1792.8 |
| η = 30% | 2207.8 | 2156.7 | 2612.6 | 3387.3 | 2500.1 | 2023.9 | 1795.1 | 1809.7 | 1969.1 | ||
| Rate of change /% | 8.1 | 8.3 | 6.9 | 5.1 | 6.5 | 8.6 | 10.6 | 10.6 | 9.8 | ||
| High-water level | η = 0% | 2591.1 | 2508.2 | 3040.7 | 3998.7 | 2903.4 | 2304.7 | 2015.5 | 2057.1 | 2260.0 | |
| η = 30% | 2823.4 | 2722.9 | 3290.2 | 4242.3 | 3125.8 | 2534.1 | 2249.7 | 2279.0 | 2494.0 | ||
| Rate of change /% | 9.0 | 8.6 | 8.2 | 6.1 | 7.7 | 10.0 | 11.6 | 10.8 | 10.4 | ||
Disclaimer/Publisher’s Note: The statements, opinions and data contained in all publications are solely those of the individual author(s) and contributor(s) and not of MDPI and/or the editor(s). MDPI and/or the editor(s) disclaim responsibility for any injury to people or property resulting from any ideas, methods, instructions or products referred to in the content. |
© 2025 by the authors. Licensee MDPI, Basel, Switzerland. This article is an open access article distributed under the terms and conditions of the Creative Commons Attribution (CC BY) license (https://creativecommons.org/licenses/by/4.0/).
Share and Cite
Liu, G.; Zhu, X.; Yang, J.; Zhang, Z.; Song, J.; Yang, Y. Study of Structural Deterioration Behavior of Mining Method Tunnels Under Steel Reinforcement Corrosion. Buildings 2025, 15, 1902. https://doi.org/10.3390/buildings15111902
Liu G, Zhu X, Yang J, Zhang Z, Song J, Yang Y. Study of Structural Deterioration Behavior of Mining Method Tunnels Under Steel Reinforcement Corrosion. Buildings. 2025; 15(11):1902. https://doi.org/10.3390/buildings15111902
Chicago/Turabian StyleLiu, Gang, Xingyu Zhu, Jiayong Yang, Zhiqiang Zhang, Jilin Song, and Yuda Yang. 2025. "Study of Structural Deterioration Behavior of Mining Method Tunnels Under Steel Reinforcement Corrosion" Buildings 15, no. 11: 1902. https://doi.org/10.3390/buildings15111902
APA StyleLiu, G., Zhu, X., Yang, J., Zhang, Z., Song, J., & Yang, Y. (2025). Study of Structural Deterioration Behavior of Mining Method Tunnels Under Steel Reinforcement Corrosion. Buildings, 15(11), 1902. https://doi.org/10.3390/buildings15111902