Article

Study on the Shear Lag Calculation Method for Damaged Box Girder

1
Guangxi Communications Investment Group Corporation Ltd., Nanning 530000, China
2
The Natural Resources Bureau of Tongle Town, Leye County, Baise City 533200, China
3
School of Highway, Chan’an University, Xi’an 710000, China
*
Author to whom correspondence should be addressed.
Buildings 2025, 15(11), 1901; https://doi.org/10.3390/buildings15111901
Submission received: 3 April 2025 / Revised: 24 May 2025 / Accepted: 28 May 2025 / Published: 31 May 2025
(This article belongs to the Section Building Materials, and Repair & Renovation)

Abstract

Shear lag stresses increase significantly in cracked concrete box girders; however, most existing models assume intact sections and are, therefore, unsuitable for rapid field diagnosis. This study integrates a stepped stiffness model with deflection influence lines to accurately capture the mechanical response of damaged, simply supported box girders. Regions containing flexural cracks are assigned a reduced bending stiffness E I , whereas intact zones retain the original stiffness E I . A closed-form stiffness-reduction coefficient φ = E I / E I is obtained from crack geometry and, independently, from the second derivative of the deflection influence line. Embedding φ in a variational shear lag formulation yields explicit expressions for flange displacement and normal stress without numerical iteration. This approach is validated by finite element simulations of a plexiglass scale model with four preset damage levels and by a load test on a 30 m prestressed concrete box girder bridge. Field measurements show that midspan stiffness decreased to 81% of the as-built value; the proposed method reproduces this value with a deviation of 3%. Predicted upper-flange stresses differ from measured values by 5.7–13.6% and from finite element results by less than 10% for damage ratios up to 40%. The second derivative of the influence line difference exhibits a distinct peak at the cracked region, accurately localizing the damage. Compared with classical formulas, the proposed model (i) is fully closed-form, (ii) links global deflection data to local shear lag stresses, and (iii) delivers conservative estimates suitable for routine bridge assessment.

1. Introduction

Box girders have thin-walled, closed cross-sections that are subjected to high transverse shear. As a result, the longitudinal stress distribution deviates from the uniform pattern predicted by elementary beam theory. This non-uniformity is referred to as shear lag [1]. Shear lag produces stress concentrations at web–flange junctions and stress depletion at free edges. Combined with transverse deformation constraints and boundary conditions, these concentrations may initiate cracks and compromise structural safety.
Recent research on shear lag has focused on (i) variational methods based on the principle of minimum potential energy [2,3,4,5] and (ii) finite beam segment methods incorporating shear deformation laws [6,7,8]. Most studies on warping displacement functions focus on their effects on shear lag [9,10]. However, shear lag analysis for damaged in-service box girders remains limited. For example, Cao et al. [11] employed the transformed section method and variational principles to study shear lag in cracked simply supported box girders. He et al. [12] investigated shear lag effects in cracked reinforced concrete. Samani et al. [13] developed an extended shear lag model using crack density micromechanics, deriving closed-form solutions for stiffness degradation and crack density evolution. Current studies on shear lag in cracked box girders focus primarily on stress and stiffness calculations but often lack whole-span indicators suitable for rapid field detection. Recent research has explored deflection influence lines as a global measure of stiffness change, enabling efficient monitoring with minimal sensor deployment. Wang [14] explored the use of deflection influence line methods for urban simply supported bridges. Zhang et al. [15] proposed a second-derivative analysis of deflection difference influence lines, enabling rapid damage localization and quantification. Zhou et al. [16] derived analytical deflection influence lines for variable-section hingeless arches using the force method and proposed explicit formulas for damage-induced curvature differences and arch-specific damage indices.
Existing shear lag formulas rely on the plane-section assumption. When concrete cracking reduces bending stiffness, these formulas fail to capture stress redistribution and thus compromise the reliability of bridge health monitoring. While deflection influence lines are effective in detecting global stiffness changes with minimal sensor deployment, existing methods fail to establish a quantitative link between these lines and shear lag phenomena in damaged box girders. This study aims to (1) extend the analysis from concrete beams to thin-walled box girders by assigning zones of E I (intact) and E I (damaged), thereby pioneering its application in shear lag analysis; (2) develop a new stiffness-related coefficient λ based on deflection increments, enabling direct stiffness calculation from the second derivative of deflection influence lines without iteration; (3) integrate the stiffness-reduction coefficient ( φ ) with shear lag stress fields through energy variation, in order to relate shear lag analysis to damage detection using deflection influence lines; (4) establish second-derivative peaks in deflection influence lines as markers for damage localization and validate through load testing and multi-level finite element model (FEM) analysis.

2. Stepped Stiffness Modeling and Deflection Influence Line

2.1. Stepped Stiffness Modeling

The stepped stiffness model has been used to theoretically analyze cracked simply-supported concrete beams [17]; combined with the standards mentioned in reference [18], the reduced stiffness of beams with flexural cracks can be determined [18], and the mechanical performance of cracked beam can thus be calculated [19]. Based on the methodology proposed by Dong [20], crack propagation in damaged regions is quantified using three morphological parameters: the average crack height h ¯ c r , the average crack width l ¯ c r , and the total crack width c r .
h ¯ cr = i = 1 n h cri n ;   l ¯ cr = i = 1 n 1 l cri n 1 = l cr n 1 ;   Δ cr = i = 1 n Δ cri
In Equation (1) and Figure 1a, h c r i is the height for each crack; l c r i is the width between the cracks; l c r is the crack range; c r i is the extent to which each crack develops; n is the number of cracks. The nominal tensile strain ε ¯ c t and sectional curvature ρ are calculated using Equations (2) and (3), based on l c r and c r , under a bending moment M generated by external loads acting on the transformed centroidal axis of the cracked section.
ε ¯ ct = Δ cr l cr
ρ = ε ¯ ct h cr
From Equations (2) and (3), the equivalent flexural stiffness E I of the damaged section can be derived based on the relationship between bending moment and curvature.
E I = M ρ
Under shear lag conditions, bending stress analysis in damaged bridge girders requires identifying and computing stiffness degradation in damaged segments. Cracked or severely damaged segments are modeled as stepped stiffness sections, with undamaged zones retaining the original stiffness E I and damaged zones assigned a reduced stiffness E I (see Figure 1).
According to Figure 1b, the relationship between the deflection and bending moment is given by Equation (5). To account for stiffness reduction in each segment of the cracked beam, the deflection is calculated using Equation (6). Here, ω denotes the actual deflection in a given segment under damage conditions. E I i represents the flexural stiffness assigned to the i-th segment L i in the stepped stiffness model (where i = 1, 2, 3…):
ω ( x ) = M ( x ) E I
ω ( x ) = 0 x 0 x M ( x ) E I d x d x ,   0 < x < L 1 0 L 1 0 L 1 M ( x ) E I d x d x + L 1 x L 1 x M ( x ) E I 1 d x d x ,   L 1 < x < L 1 + L 2 0 L 1 0 L 1 M ( x ) E I d x d x + L 1 L 2 L 1 L 2 M ( x ) E I 1 d x d x + L 2 x L 2 x M ( x ) E I 2 d x d x ,   L 1 + L 2 < x < L 1 + L 2 + L 3

2.2. Deflection Influence Lines

Deflection influence lines, derived from internal force influence lines, characterize structural deflection responses induced by a unit moving a concentrated load (Figure 2).
For a simply supported beam subjected to a moving load P, equilibrium equations yield the bending moment at any section x. Vertical deflections at arbitrary locations are calculated using the virtual work principle and the unit load method. A unit downward force F = 1 , applied at the target section (see point D, indicated by a dashed line in Figure 2), generates corresponding bending moments M F ( x ) throughout the structure.
M P x = L x p L P x 0 x x p P x p P x p L x   b x L     M F x = L a L x 0 x a a a L x a x L
In Equation (7), a is the distance of unit load F to point A, L is the span of support beam, and x p is the distance of load P to point A. According to Mohr’s integral, the vertical deformation of simply supported beams is primarily governed by bending behavior. The contributions of shear and torsion to the overall deflection are typically negligible. As a result, the generalized displacement δ at any spanwise location can be expressed using an integral formulation. In this context, M P ( x ) and M F ( x ) represent the bending moments generated by the external load and the unit load, respectively.
δ = 1 E I M P M F d x
In the damaged segment, the original stiffness E I is replaced by a reduced stiffness E I , resulting in a deflection influence line that reflects the stiffness degradation. This approach yields the actual deflection ω , without damage at cross-section D, allowing damage effects on deflection and shear lag to be evaluated.

2.3. Stiffness-Reduction Coefficient in the Damaged Segment of the Beam

As shown in prior research [21], the onset of flexural cracking reduces the effective stiffness of beams, leading to greater deflections under loading. The total deflection ω , usually separated as the deflection ω 0 without damage at cross-section D, and the additional deflection ω , due to damage, are quantified in Equation (9):
Δ ω = ω ω 0
ω 0 may be obtained from theory or early-stage monitoring of the undamaged beam, while ω reflects the deflection under current damage conditions. The deflection increment ω can be used to identify and assess the severity of structural damage. The stiffness ratio β is defined as the proportion of damage-induced deflection ω to the total deflection ω . Equation (11) quantifies beam stiffness reduction based on changes in deflection. Accordingly, the stiffness-reduction coefficient φ for the damaged beam can be calculated using Equation (13).
β = Δ ω ω
E I + β E I = 1 + β E I = E I
E I = 1 1 + β E I
φ = 1 1 + β = E I E I = ω 2 ω ω 0
As shown in Figure 2 and Equations (7)–(9), the deflection increment ω becomes a function of the load position x p , denoted ω ( x p ) . The second derivative of the influence line difference ω ( x p ) is zero in undamaged segments but becomes nonzero within the damaged region. The value of [ c d , c + d ] is not 0 [14,22], as defined for c d x p c + d .
Δ ω ( x p ) = ( 1 E I 1 E I ) ( c - d x p P x ( 1 x p L ) a ( 1 x L ) d x + x p c + d P x p ( 1 x L ) a ( 1 x L ) d x ) = 1 E I 1 E I P a 6 L 2 L x p 3 3 L 2 x p 2 + 4 d 3 + 3 c 2 d + 6 L 2 c + d + 3 L c d 2 x p + 2 L c d 3 3 L 2 c d 2
Δ ω ( x p ) = 1 E I 1 E I p a L x p L
From Equation (15), we can introduce λ :
λ = Δ ω x p E I L P a x p P a L
Thus, the stiffness-reduction coefficient φ can also be derived from variations in deflection influence lines, as expressed in Equation (17). Two derivation approaches are presented in this chapter: one based on the stepped stiffness model and the other on the nonzero curvature in influence lines.
φ = E I E I = 1 1 λ

3. Derivation of the Shear Lag Variational Equation for Damaged Box Girders

To assess bending damage in main box girders, the deflection ω at each cross-section must be determined using damage-based deflection influence lines. This involves integrating φ to account for shear lag effects induced by damage. This approach enables the derivation of bending normal stress expressions under the combined influence of shear lag and damage. Figure 3 illustrates the resulting stress distributions across the flanges and webs in a single-cell box section.
The subsequent derivations are based on the following assumptions: (1) linear elasticity with small deformations, (2) the validity of plane-section behavior, (3) negligible coupling between axial force and bending, and (4) coupling terms in potential energy derived from the classical theory of thin-walled box girders. However, the model has several limitations. Concrete plasticity and post-yield stiffness degradation are not considered, which reduces the model’s accuracy under high-load or long-term conditions. Additionally, the assumption of uniform transverse stiffness may not be valid for sections with complex geometries or reinforcement layouts.
The deflection along the girder’s longitudinal axis x is denoted by ω ( x p ) , which inherently reflects the influence of damage. Shear lag-induced transverse deformation in the y -direction is described by a corrected displacement function, as given in Equation (18). In this formulation, B represents the flange width (top and bottom); u   ( x ,   y ) denotes the longitudinal displacement at lateral coordinate y under shear lag; h i is the vertical distance from the section centroid (neutral axis) to the mid-surfaces of the top and bottom slabs; and u   ( x ) indicates the maximum differential shear-induced rotation between flanges. This formulation enables a more refined description of transverse deformation behavior due to shear lag effects.
u x , y = h i ω + 1 y 4 B 4 u x

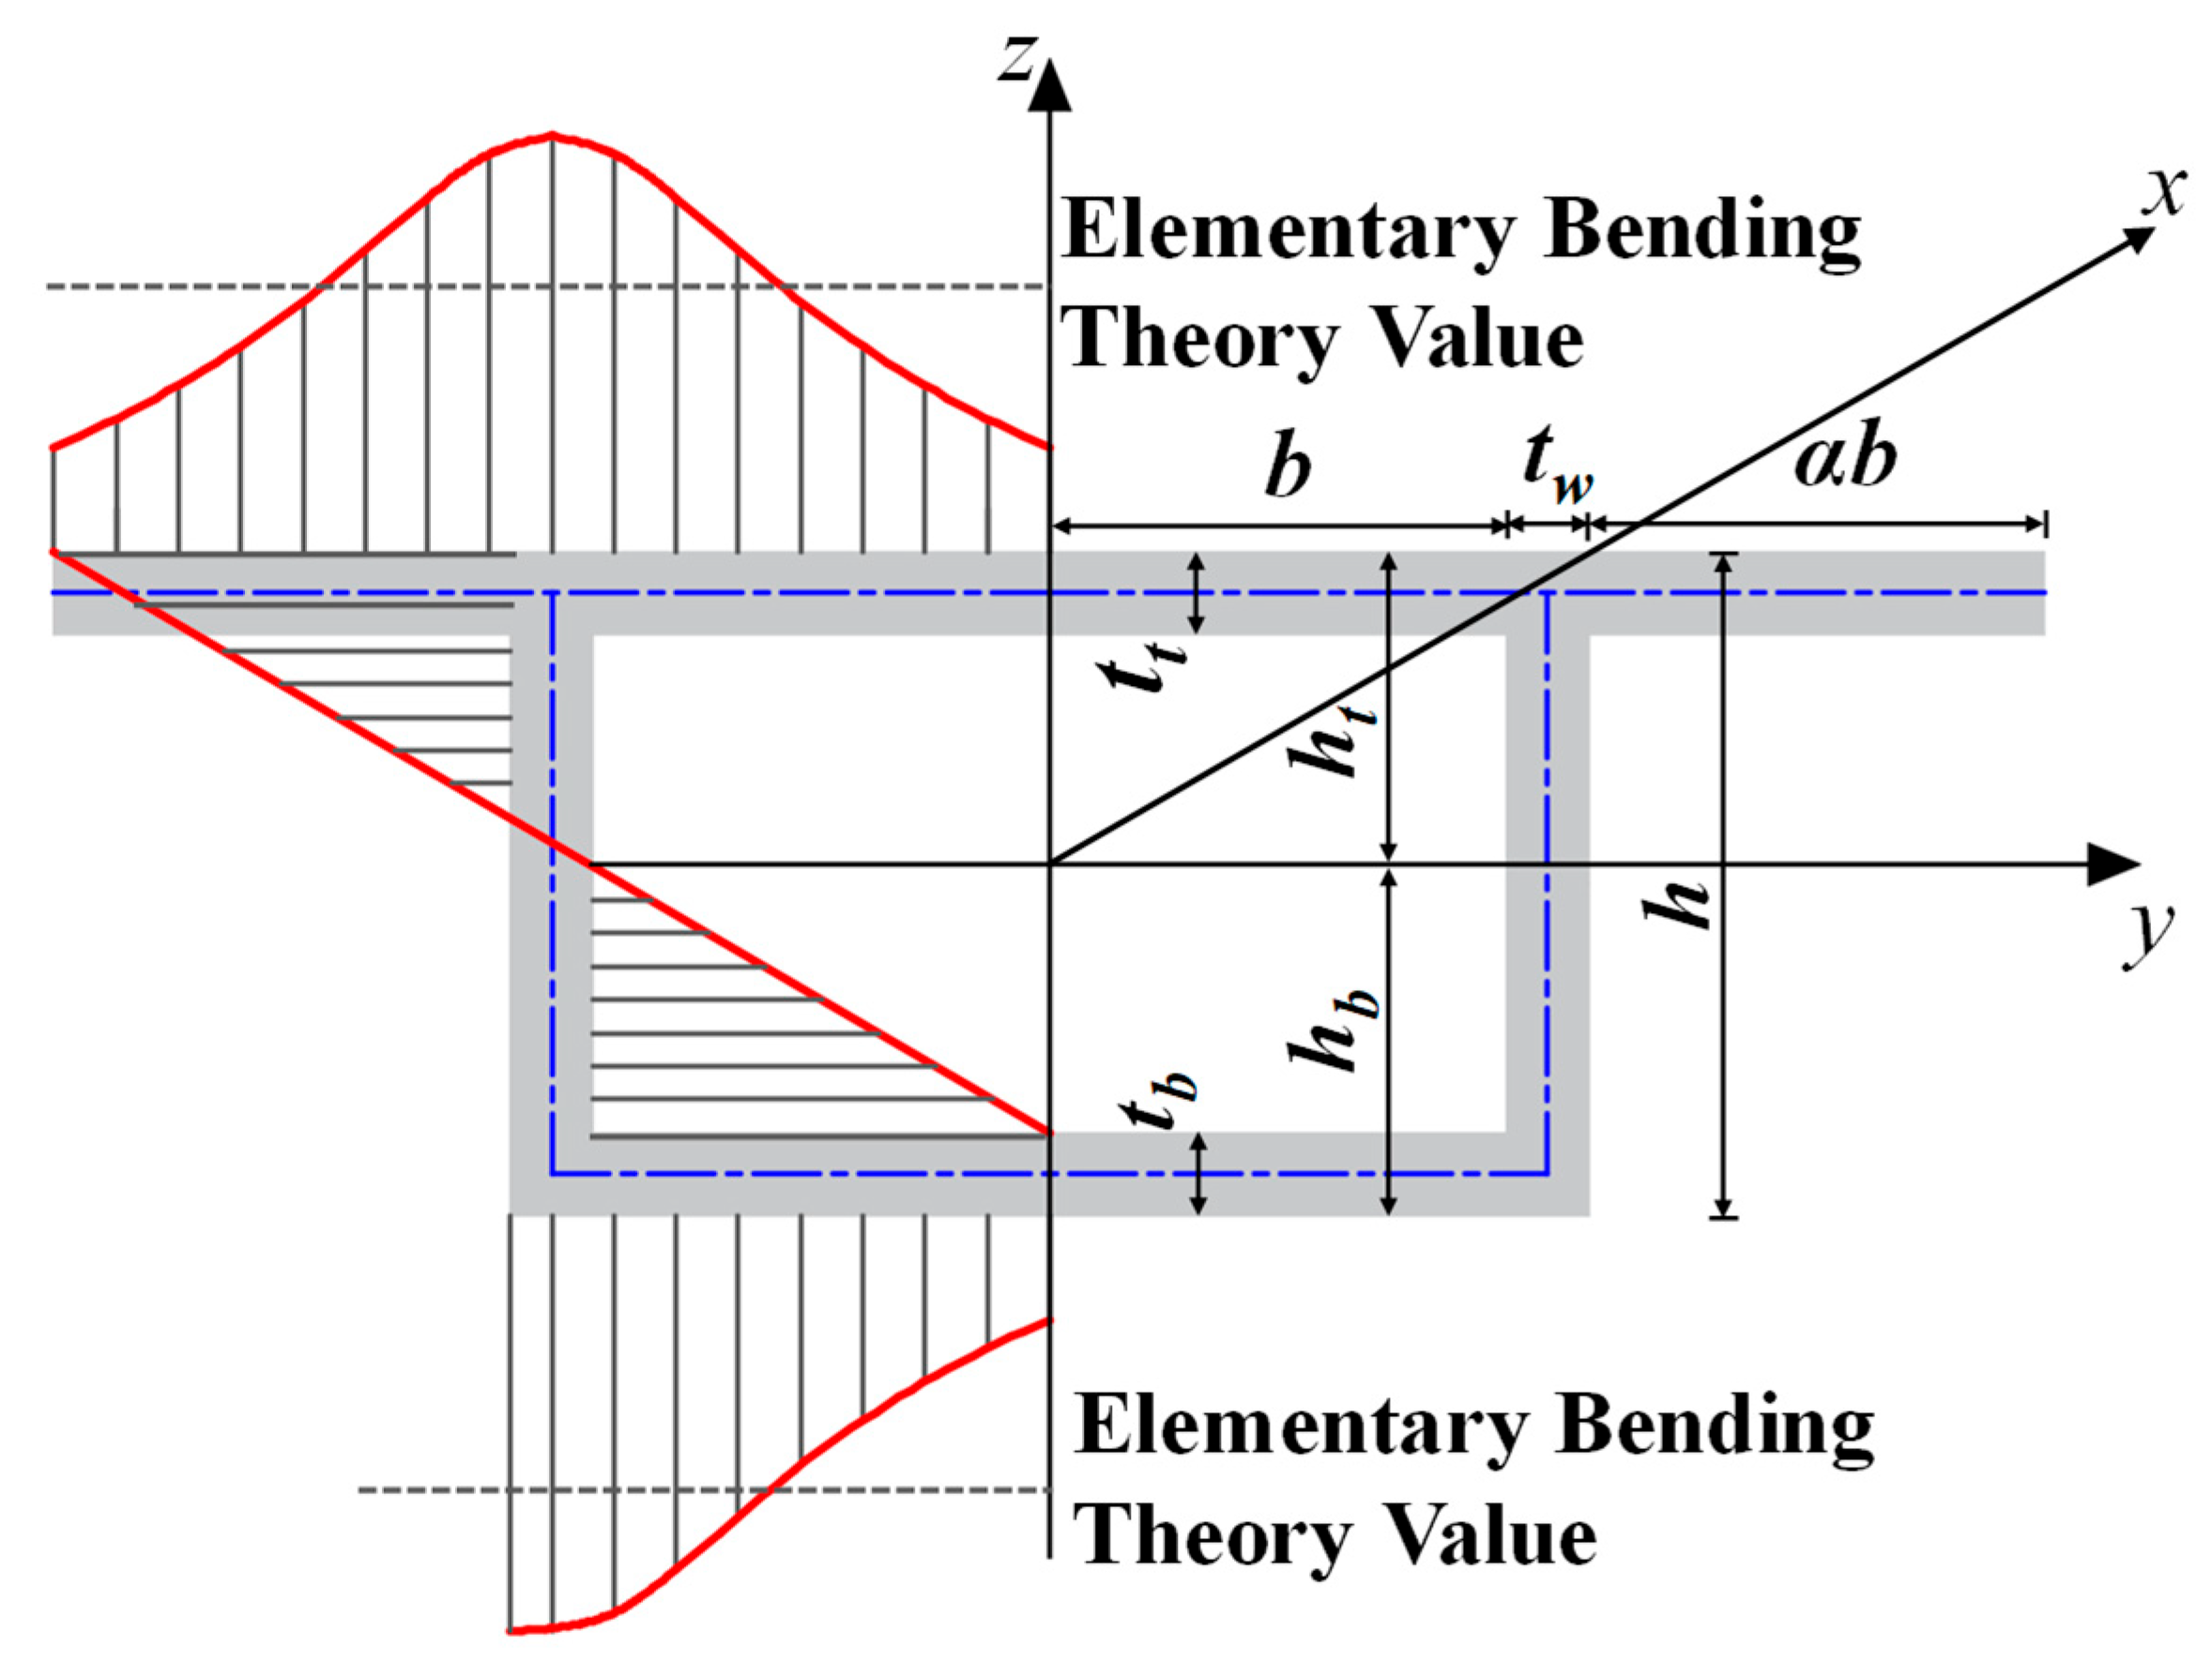
3.1. Potential Energy Equation and Individual Strain Energies

According to the principle of minimum potential energy, the total potential energy Π of a box girder under bending consists of the work completed by external forces and the sum of strain energies stored in its components. These include the strain energy of the web V w , the top flange V f t , and the bottom flange V f b , respectively.
Π = W + V w + V f t + V f b
Equation (20) represents the potential energy of external forces acting on the beam under bending. In this formulation, ω ( x ) is considered the vertical deflection of a cracked beam.
W = M x ω d x
V w = 1 2 φ E I w ω 2 d x
V f t = 1 2 t t E u u x , y x 2 + G u u x , y y 2 d x d y
V f b = 1 2 t b E u b x , y x 2 + G u b x , y y 2 d x d y
The variable M ( x ) is the cross-sectional bending moment; E is the elastic modulus; G is the shear modulus; t t and t b are the thicknesses of the top and bottom flanges; I w is the web’s moment of inertia. When I f represents the combined moment of inertia of both flanges, the total potential energy Π can be expressed more specifically by integrating these individual strain energies.
I f = 2 α t t h t 2 + 2 b t t h t 2 + 2 t b h b 2
Π = ( M x ω + 1 2 φ E I w ω 2 ) d x + 1 2 φ E I f [ ω 2 + 32 45 u 2 + 8 5 ω u ] d x + 1 2 G I f 16 7 u 2 b 2 d x
The variation of Equation (25) leads to the three Euler–Lagrange equations given in Equation (26). The full derivation is provided in Appendix A.
M x + φ E I ω + 8 5 φ E I f u = 0 16 7 u b 2 G I f 32 45 u φ E I f 8 5 ω φ E I f = 0 φ E I f 32 45 u + 8 5 ω δ u | 0 l = 0

3.2. Shear Lag Differential Equation and Solution

By applying the condition δ Π = 0 , a system of differential equations is obtained through variational analysis. Further simplification leads to a typical shear lag differential equation and its general solution, as presented in Equations (28) and (29).
u k 2 u = 9 m Q ( x ) 4 E I
u ( x ) = 9 m 4 E I C 1 s i n h k x + C 2 c o s k x + u *
Here, C 1 and C 2 are constants determined by the girder’s boundary conditions, and u * denotes a particular solution. The function Q ( x ) , defined as the first derivative of the bending moment M ( x ) , represents the shear force at a given cross-section. Both Q ( x ) and m characterize the coupling between shear lag effects and girder damage parameters.

3.3. Bending Stress Expression

Equation (25) shows that both the second derivative of the main girder deflection, ω , and the shear lag correction term, u ( x ) , involve the parameter φ . While ω includes φ explicitly, u ( x ) incorporates it implicitly through the coefficient m in its formulation. Combining the coordinate-based flange deformation in Equation (18) with the stress–strain relationship yields the bending normal stress in a damaged, simply supported girder affected by shear lag.
ω = 1 I M x φ E + 8 I f u 5
σ x = φ E u ( x , y ) x = ± φ E h i M ( x ) φ E I 1 y 4 b 4 8 I f 5 I u
To account for damage in the main girder, a stiffness-reduction coefficient φ is introduced. This parameter influences both the flange displacement distribution and the resulting expression for bending normal stress, thereby improving the accuracy of the mechanical model compared to the undamaged condition. Severe damage amplifies shear lag effects, resulting in greater non-uniformity in flange stress distribution. These effects are confirmed by numerical analyses and validated using in situ bridge monitoring data.

4. Real Bridge Load Testing and FEM Analysis

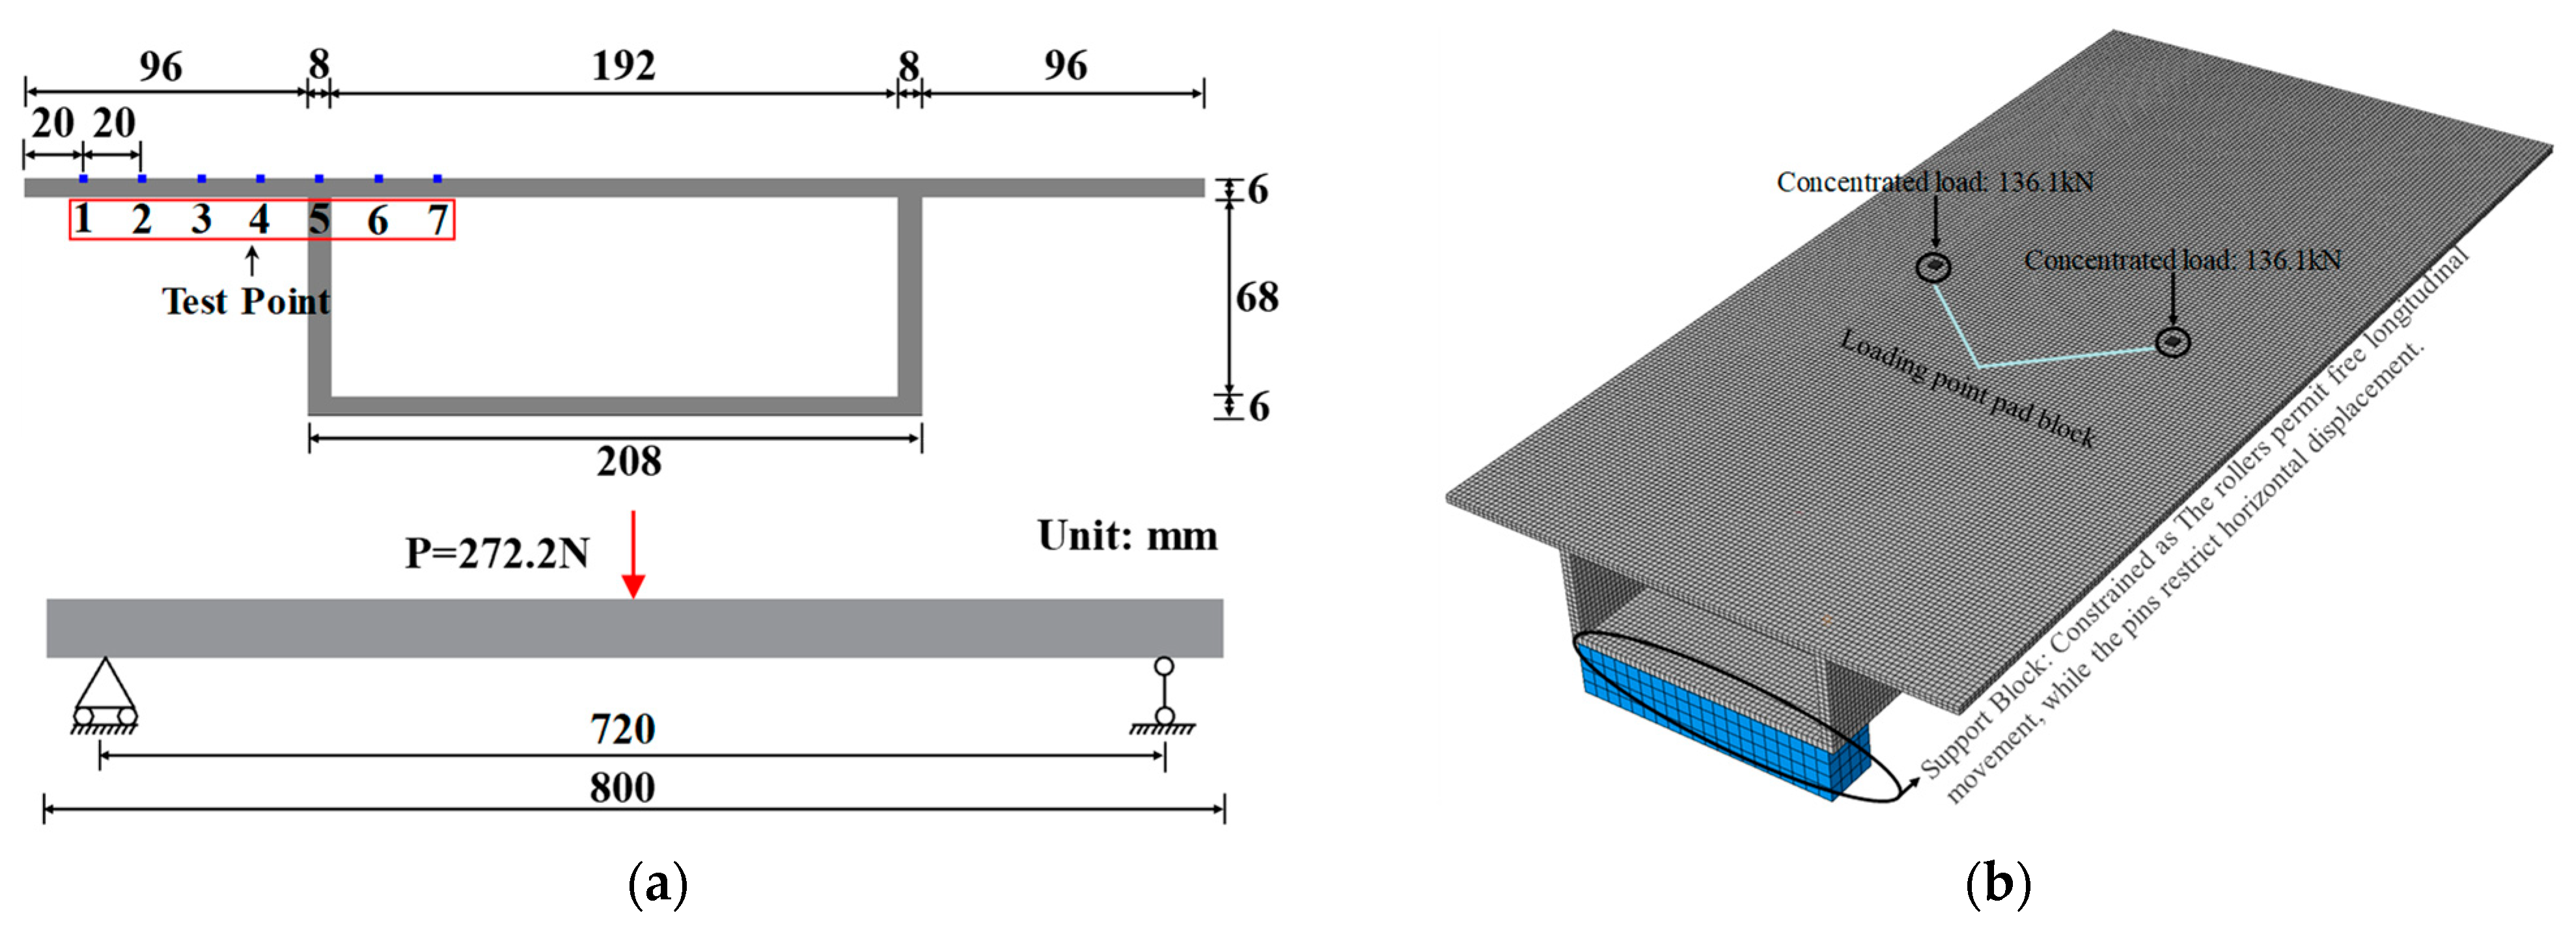
4.1. Bridge Load Testing Procedure Brief Description

Field load test data from the actual bridge were used to validate the proposed theoretical framework. The proposed normal stress formula was validated using data from a field load test conducted on a damaged simply supported concrete box girder bridge in Guizhou Province, China. The bridge comprises three 30 m spans, with hollow slab structures on both sides and a box girder in the middle span. It features six main girders, each measuring 1.6 m in height and 3.3 m in width. The overall width of the bridge is 20 m, and the concrete grade used for the girders is C50. Figure 4a shows the midspan cross-section, which includes six girders, each measuring 1.6 m in height and 3.2 m in width. Three strain gauges are placed on the bottom surface of the top flange to monitor tensile stress. This study reports damage observed in span 2 of the bridge, including concrete spalling of the flange at midspan with exposed reinforcement, as well as transverse and longitudinal cracks in the external webs. The quantitative descriptions of these damages are summarized in Table 1.
Figure 4b shows that the load test employed a moderate loading condition using four tri-axle trucks (400 kN per vehicle), resulting in a total midspan concentrated load of 1600 kN. The stiffness-reduction coefficient can be obtained by comparing the deflection measured after bridge completion with that of the damaged bridge.
φ = ω 2 ω ω 0 = 11.34 2 × 11.34 8.69 = 0.8106
Then, by considering the ratio of midspan deflection to the total deflection of each main girder, the proportion of the total load carried by the middle girder under centralized loading can be determined. This proportion is then used to allocate the total load to the middle girder, thereby calculating the concentrated load it sustains.
P 3 = y 3 i = 1 6 y i × P = 11.34 7.24 + 8.48 + 11.34 + 10.81 + 8.29 + 7.14 × 1600 370.41 kN
In Equation (32), P is the total load; y i is the deflection of the i # girder; P 3 refers to the load on the middle girder.

4.2. Finite Element Model (FEM) of Box Girder

The plexiglass scale model [14,23,24] has been widely used to validate theoretical shear lag trends.
This study uses ABAQUS to establish an FEM of a box girder with a length of 800 mm and a span of 720 mm, based on the plexiglass scale model by Luo et al. The model aims to validate the predicted shear lag behavior in thin-walled box girders. The FEM uses a C3D8R hexahedral mesh with an element edge length of 4 mm, totaling 64,000 elements. Plexiglass material properties were assigned, with a modulus of elasticity E = 3000   M P a and Poisson’s ratio ν = 0.385 . A linear constitutive model was adopted due to the absence of reinforcement and cracking. Stress was extracted at seven measurement points along the top flange, spaced at 20 mm intervals. The steel pin–roller bearings at the ends are modeled using multi-point constraints (MPC). The longitudinal movement is free at the rollers, while the horizontal displacement is constrained at the pins (Figure 5).
Midspan load-induced damage is simulated using a stepwise stiffness model. When φ = 1 (i.e., no stiffness reduction), the case is used to normalize the theoretical curve and verify consistency with classical solutions under the uncracked-section assumption. The φ = 0.8 case corresponds to the load-tested bridge in this study. Field measurements indicate a stiffness reduction of 81.06% (Equation (31)). According to the description in JTG/T H21-2017, when minor or partial failure of upper structural components results in slight-to-moderate stiffness degradation (i.e., failure area 30 % of the component’s dimensions), this corresponds to the 30% stiffness-reduction case analyzed in this study; Xu et al. [25] reported an approximately 40% stiffness reduction ( φ = 0.6 ) in cracked box girders during the advanced stage of damage. Accordingly, this study employs a stepped stiffness model to simulate midspan damage scenarios. Progressive damage levels are represented by local stiffness reductions of 40%, 30%, and 20%, in comparison to an undamaged reference model.
To verify the effectiveness of second-derivative-based damage detection, an FEM of a simply supported flangeless box girder was constructed using beam elements. To simulate quasi-static loading based on load test conditions, the span was divided into 18 equal segments, with a moving load applied at each midpoint.

5. Results of Real Bridge Test Data and FEM Analysis

Based on the previously derived shear lag analysis for a damaged main girder (the glass beam model in the past test), the bending normal stress at the flange measurement points is computed by referencing Equations (18)–(30). These equations address the controlling differential equations and the piecewise solutions for 0 x L / 2 and L / 2 x L , along with boundary conditions. The physical implications and engineering interpretation of the boundary conditions in Equation (34) are shown in Table 2:
u 1 = 9 m P 8 E I C 1 s i n h k x + C 2 c o s h k x 1 2 k 2 0 x L 2 u 2 = 9 m P 8 E I C 3 s i n h k x + C 4 c o s h k x + 1 2 k 2 L 2 x L
u 1 | x = 0 = 0 u 2 | x = 0 = 0 u 1 | x = 1 2 = u 2 | x = 1 2 u 1 + 9 m M ( x ) 8 E I | x = 1 2 = u 2 + 9 m M ( x ) 8 E I | x = 1 2
Solving for the integration constants C 1 through C 4 allows the bending stress in the flange of a damaged simply supported girder under shear lag to be calculated, as given in Equation (35).
σ x = ± φ E h i M ( x ) φ E I 1 y 4 b 4 4 I s 5 I 9 m P 8 E I k s i n h ( k L / 2 ) s i n h ( k L ) s i n h k x 0 x L 2 σ x = ± φ E h i M ( x ) φ E I 1 y 4 b 4 4 I s 5 I 9 m P 8 E I k s i n h k L 2 c o h k x s i n h k L 2 c o t h k L s i n h k x L 2 x L
Substituting deflection measurements from completion and recent inspections into Equation (8) indicates that the midspan stiffness has reduced to 81% of its original value. Application of the proposed stress formula (Equation (30)) yields the upper flange normal stress at the midspan of the central girder. The calculated results are validated against field-measured data, as shown in Table 3. The corresponding errors and dispersion metrics are also presented for each dataset, including the relative error (RE), mean squared error (MSE), root mean squared error (RMSE), normalized RMSE (NRMSE), and coefficient of variation (COV).
When the flexural stiffness (EI) of the actual bridge is reduced by 18.9% (i.e., to approximately 81% of its original value), the shear lag analytical model for the damaged beam predicts flange-edge stresses with an error of less than 10% across five evaluation metrics.
Deflection data were obtained from the FEM of the damaged beam. Using Equation (7), the stiffness values for each model group were calculated. The numerical results and the displacement contour plot from the FEM are presented in Figure 6a. The stress values at the test points, obtained from the FEM results and calculated using Equation (21), are summarized in Table 4. The corresponding error metrics for each dataset are listed in Table 5.
FEA results show that the damaged beam shear lag model in this study achieves excellent accuracy (RE < 10%) near concentrated loads, with conservative flange-edge predictions. The analytical model maintains stable engineering accuracy (0~40% stiffness reduction) for shear lag stress distribution.
The second derivative of the influence line of the deflection difference (Figure 7) exhibits a sharp increase at the midspan, confirming its effectiveness for damage localization. The second derivative of the deflection difference influence line exhibits a distinct peak near the midspan. The identified fluctuation indicates a damaged region, which aligns with field inspection observations of cracking and concrete spalling. These results validate the applicability of the proposed method under real-world engineering conditions.

6. Discussion

Table 3 presents deflection measurements from full-scale bridge tests, revealing discrepancies of 13.61%, 8.22%, and 5.73% between calculated and measured values at three critical test points under main girder damage. These results validate the reliability of the proposed formula.
Shear lag errors arise from classical assumptions neglecting web shear deformation and free-edge warping. While this study prioritizes flexural deformation, cantilevered box girders exhibit amplified warping inertia, causing stress deviations at edges. Additionally, web shear deformation affects shear lag. Traditional methods assume rigid webs, but actual webs undergo shear distortion under transverse loads, reducing flange participation in longitudinal resistance. Accurate stress prediction requires accounting for both flange and web shear flexibility. The free-edge cantilever effect refers to local bending of flange overhangs. Longer cantilevers amplify shear deformation [26,27]. Field observations show spalling concentrated on flanges and cracks on outer web surfaces, exacerbating shear displacement, warping, and cantilever effects. This explains the elevated edge errors in bridge load tests.
Figure 6 illustrates a 4.97% discrepancy between calculated and measured stiffness reductions at 60% EI (midspan damage), exceeding discrepancies at 70% EI (2.53%) and 80% EI (3.08%). These results validate the proposed stiffness-reduction formula’s accuracy across damage levels, as shown in Table 3.
Figure 8 illustrates stress discrepancies between calculations and simulations at measurement points 4~6 (10%), with errors increasing progressively away from the load center. Notably, points 1~3 (near the flange free edge, termed the boundary zone) exhibit significant deviations from classical beam theory predictions.
At measurement points 4, 5, and 6, the discrepancy between calculated and simulated stress is within 10%; moving farther from the load center, the error gradually increases. At measurement points 1~3 near the flange free edge (“boundary zone”), longitudinal stress distributions deviate significantly from classical beam theory. FEA-derived shear lag curves exhibit sharper peaks near free edges, aligning with elevated errors at these locations. Li et al. [5] documented analogous discrepancies in energy-based methods, which were mitigated by incorporating edge-effect corrections (reducing errors to single-digit percentages. The constrained state of the flange behaves similarly to a short cantilever, which invalidates the plane-section assumption and induces warping. While FEM analysis captures this warping and the associated stress concentrations, our theoretical model neglects such two-dimensional deformation modes in the flange, thereby contributing to discrepancies. In addition, the simplified assumption that models the top flange as a homogeneous thin plate underestimates the reduction in effective flange width caused by shear lag. The theoretical formulation also neglects the shift of the neutral axis due to shear lag and uses approximate displacement shapes that fail to capture free-edge warping. These limitations result in the underestimation of stress magnitudes in the FEA compared to the theoretical predictions [5,28].
To demonstrate the consistency between theoretical and FEM analysis results across measurement points, the stresses are normalized using the average flange stress and the normalized transverse coordinate y / b , where b denotes the half-width of the flange. Figure 9 shows that the FEA and theoretical curves nearly coincide in the central regions of the flange, indicating that global moment equilibrium is preserved. The observed discrepancies are primarily attributed to differences in the shape of the stress distribution profiles, rather than an overall imbalance in the force equilibrium. The theoretical model assumes that the stiffness-reduction coefficient φ uniformly modifies the flange stiffness, but it does not account for the increased flexibility in the flange boundary regions. As φ decreases, the theoretical stress distribution becomes flatter; however, the edge stresses obtained from FEM analysis remain nearly constant. This is because shear lag effects lead to stress concentrations near the web, with the FEA peak value reaching approximately 1.35, independent of φ , due to load transfer primarily occurring through the inner regions of the flange. The peak stress values predicted by the theoretical model decrease proportionally with the value of φ , from 1.26 to 1.15, thereby underestimating the stress concentration by approximately 8–17%. This confirms that φ -scaling alone cannot account for the shear lag-induced amplification of stress near the flange edges. Consequently, additional shape factors or higher-order terms may be required to improve accuracy. In contrast, FEM analysis results show minimal dependence on φ , reflecting the influence of geometric constraints and stress redistribution mechanisms. While uniform φ -scaling affects global stiffness, it does not alter the shape of the stress distribution, which explains the increasing deviation between theory and FEA at higher levels of stiffness reduction.
Overall, the calculated and simulated values exhibit consistent trends. With the exception of measurement points 1, 2, and 3, the theoretical results agree well with the simulation data. At all measurement points, the simulated stress values are lower than the theoretical predictions, indicating that the calculated flange bending stress is conservatively high. This tendency is consistent with the results observed in the full-scale bridge load test. Therefore, the bending stress estimates obtained from the proposed method are suitable for structural design reference and demonstrate high reliability. A further comparison of stress errors under different damage levels shows that measurement points 1, 2, and 3 exhibit increasing deviation as damage accumulates, whereas points 4 through 7 remain within a 15% error margin. This finding supports the applicability of the proposed approach for predicting flange bending stress. In particular, points 1, 2, and 3 yield more conservative stress estimates, resulting in higher safety margins. Such conservatism is especially valuable near the cantilever edges, where stress concentrations are more sensitive under damage conditions. Ensuring sufficient load-carrying capacity in these regions is critical for maintaining structural safety.
In summary, the proposed method is applicable to flange stress evaluation under structural damage and offers practical support for structural design decisions.

7. Conclusions

Most conventional shear lag models assume that the box girder is undamaged and require calibration using the FEM. In contrast, the stepped stiffness model and the deflection influence line method proposed in this study yield closed-form analytical solutions without the need for numerical calibration. Furthermore, the method provides an explicit formula for locating damage, supporting practical applications in the rapid condition assessment and life-cycle evaluation of in-service box girders with damage. This study systematically investigates the shear lag behavior of damaged simply supported box girders and yields the following key findings:
  • This study quantifies damage in box girders through a stiffness-reduction coefficient φ , derived from (1) the principle of minimum potential energy and classical shear lag theory and (2) a stepped stiffness model incorporating crack statistics. The proposed method establishes a relationship between φ and differences in deflection influence lines. It accurately identifies damage locations, as sharp peaks in the second derivatives of the deflection influence lines correspond to predefined damage zones at the midspan. These results demonstrate the effectiveness of the influence line approach for damage localization.
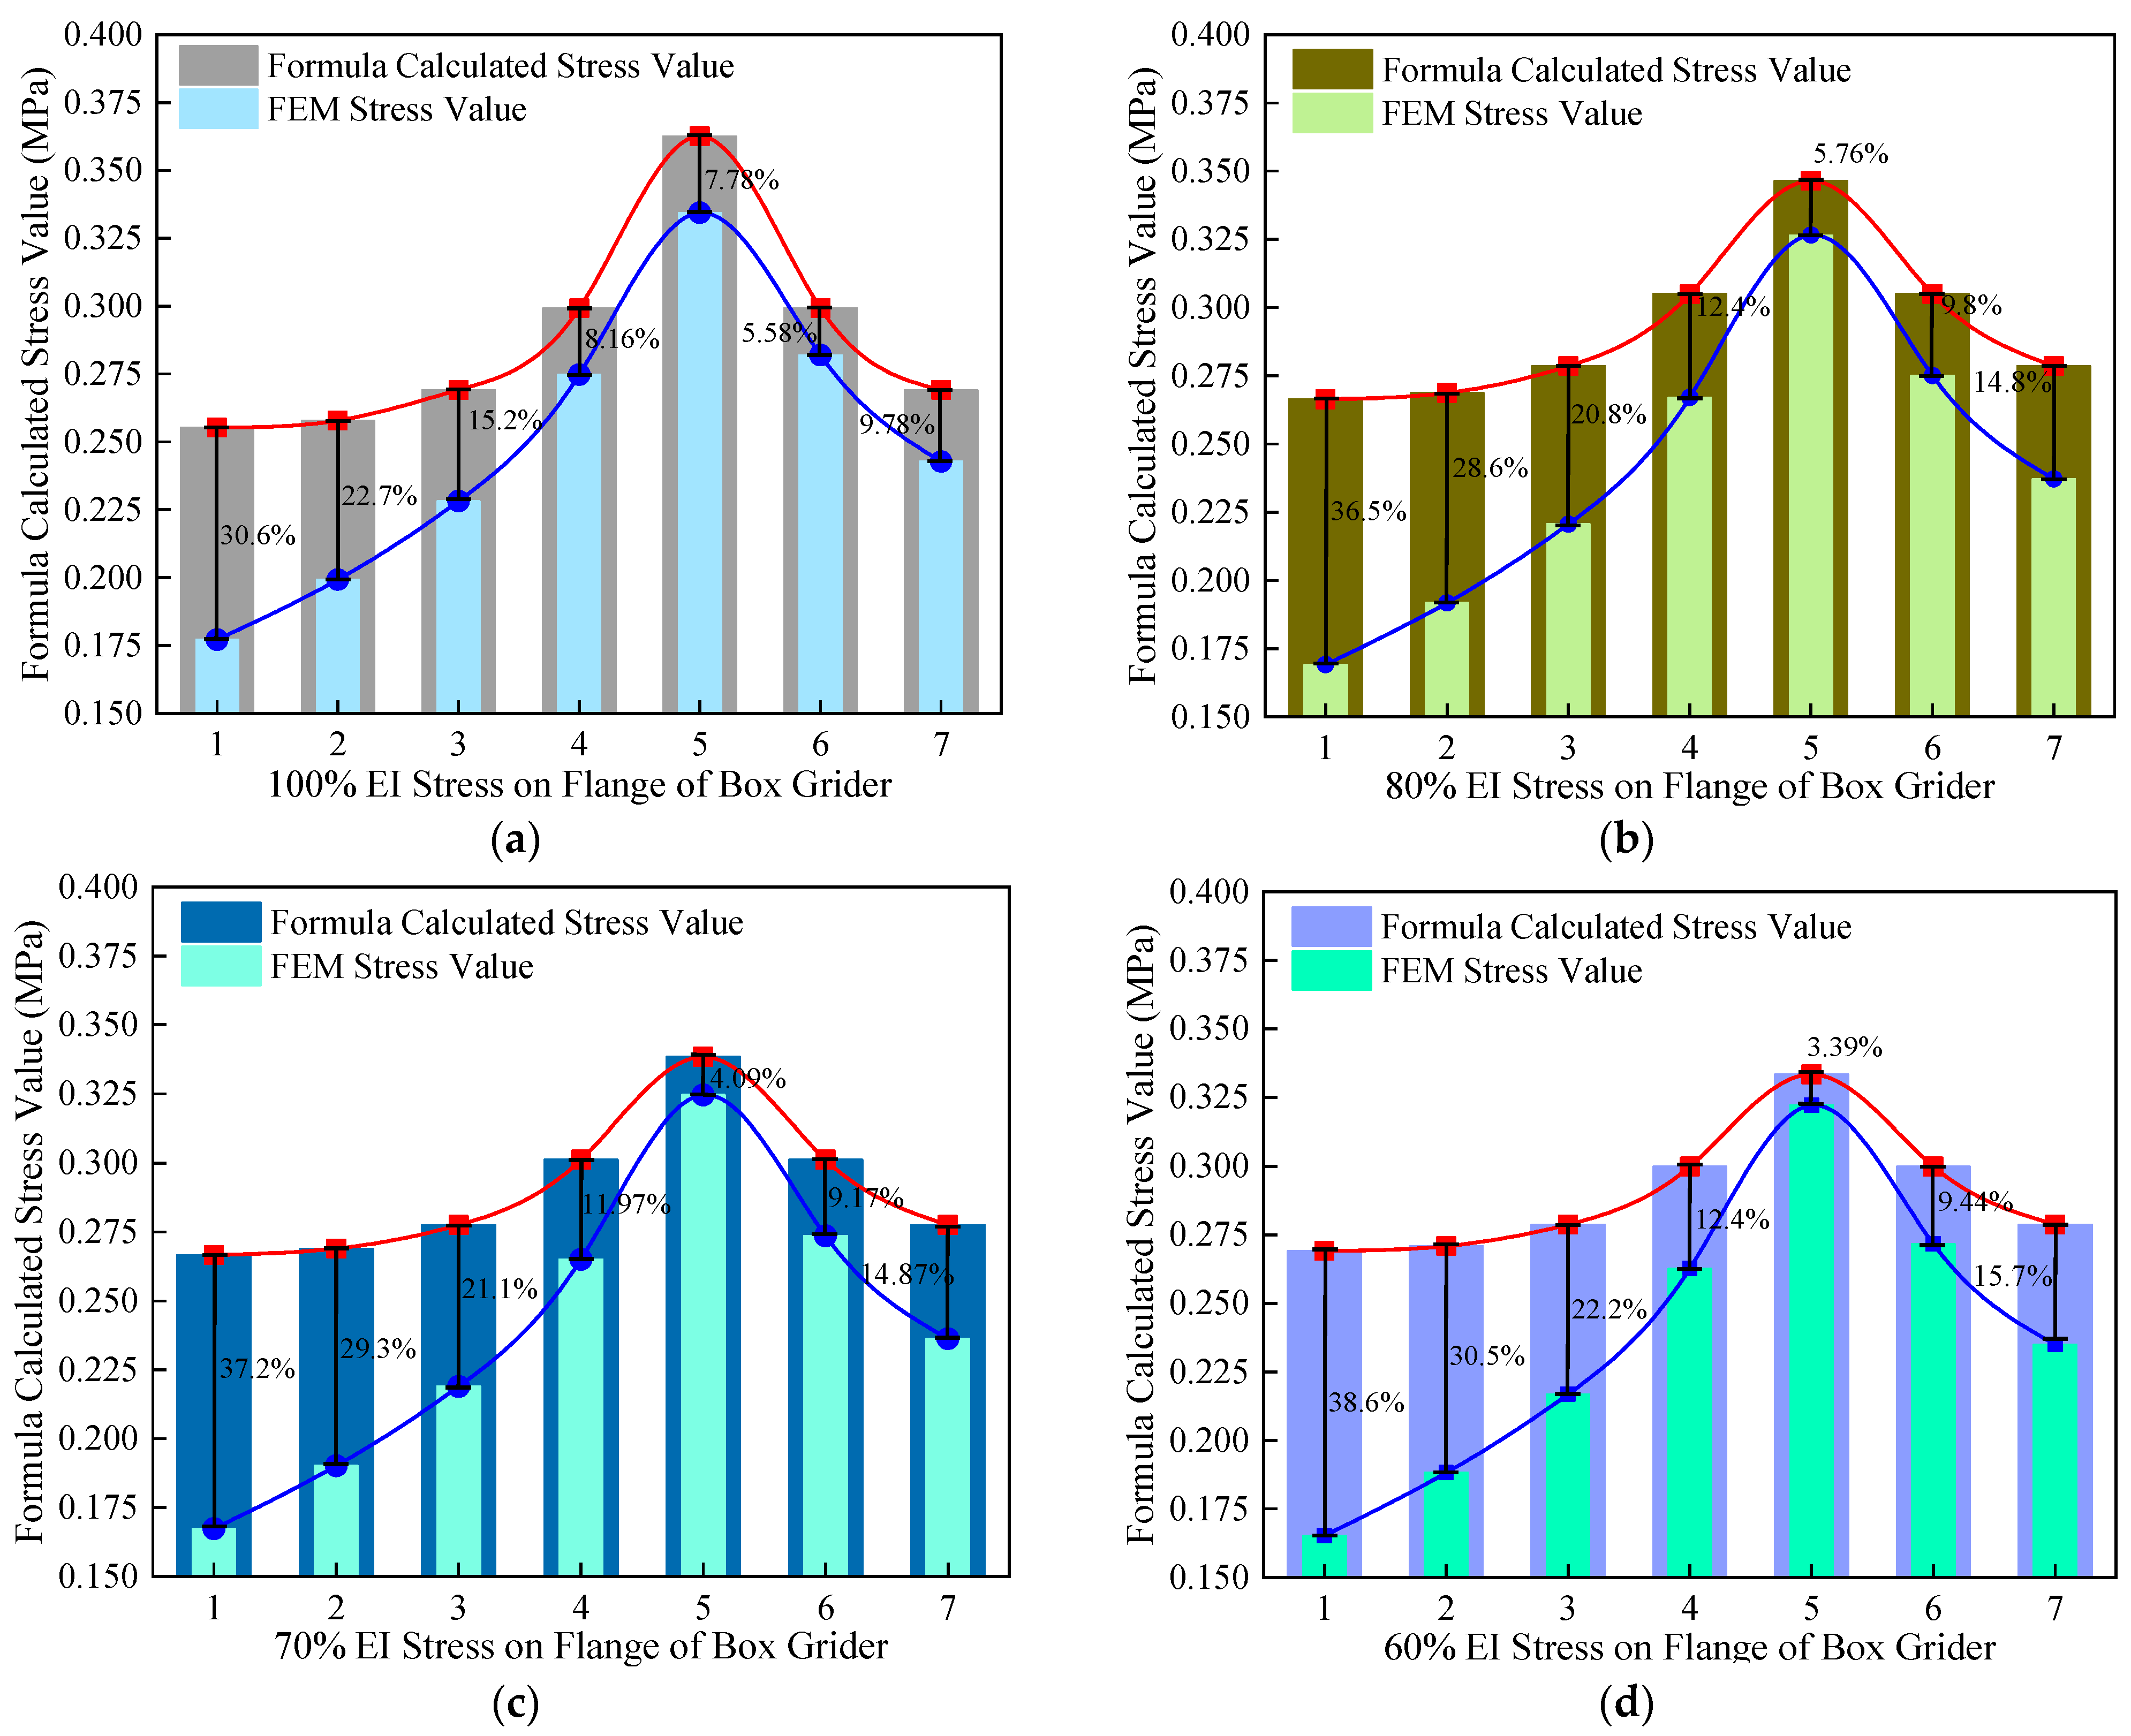
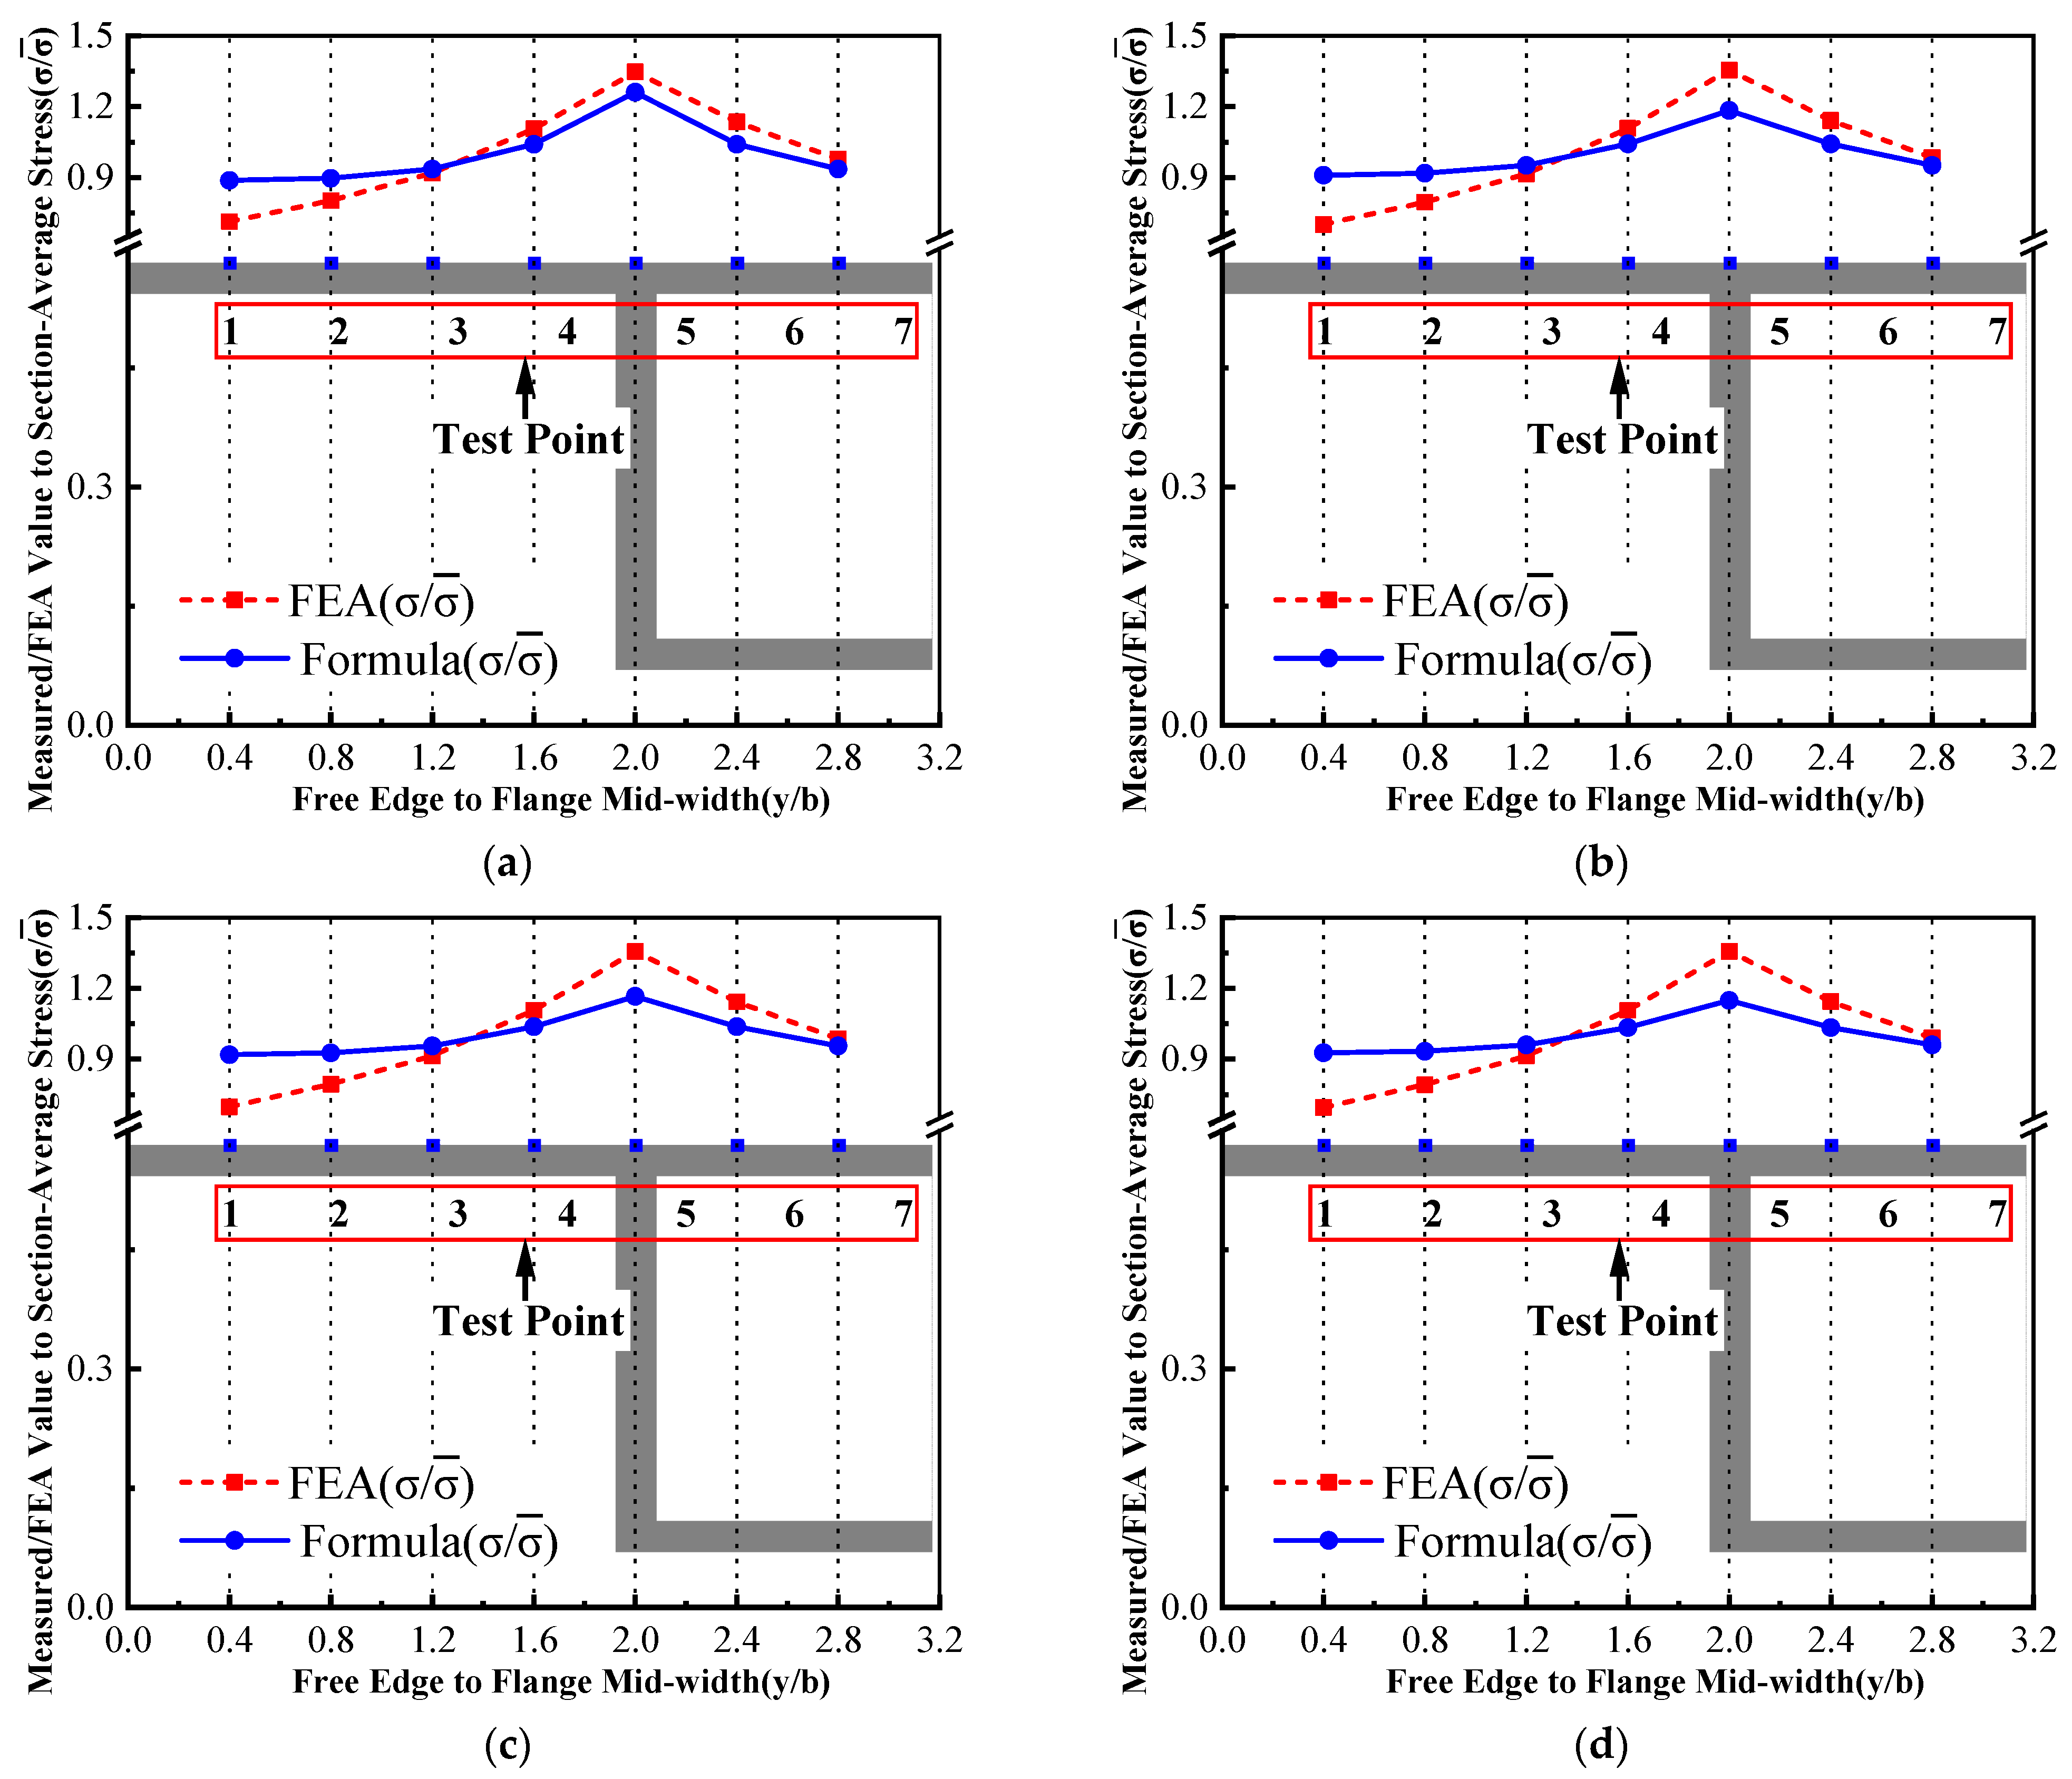
  • Based on field inspections, design codes, and relevant literature, this study defined three levels of structural damage and conducted FEM analyses on plexiglass box girder models. The relative error (RE) between the FEM and theoretical results remained within 10% for inner flange points (Points 4–7) under stiffness reductions ranging from 0% to 40%. The maximum error was observed at Point 1, located near the free edge, where the RE reached approximately 38%. After normalizing the data using dimensionless parameters σ / σ ¯ and y / b , the FEM and theoretical curves converged for y / b 0.8 , indicating that the global bending moment equilibrium was well maintained. Discrepancies were primarily concentrated in the shear lag-affected boundary region near the free edge ( y / b 0.3 ).
  • Based on deflection measurements from completion and load tests, according to Equations (13) and (17), the midspan equivalent stiffness reduced to 81.06%. FEM back-analysis showed a 3.08% deviation, validating the field inspection applicability of the theory. At 81% stiffness, field-measured normal stresses showed 5.73%~13.61% relative error. Global error metrics confirm the validity of the theory.
  • Theoretical stresses consistently exceeded FEM results by 3–10%, indicating conservative safety margins in the proposed shear lag theory. However, current methods omit web shear deformation and higher-order warping at free edges, causing larger errors in flange tips.
Future efforts may extend the method’s applicability to multi-span continuous box girders and prestressed concrete box girders. Follow-up studies should incorporate additional factors, including web shear displacement and rebar configurations in damaged thin-walled RC box girders. Parametric FEM analyses (e.g., span-to-depth ratios and cantilever flange ratios) can validate analytical solutions and derive empirical φ correction formulas for various geometries. Edge stress variations should be evaluated considering flange bending–shear lag coupling and diaphragm effects. Edge correction coefficients or higher-order warping functions may further reduce errors. The proposed deflection influence line-damage coefficient method could be integrated with dynamic load tests (impact coefficient measurements) to establish field-verified correlations among deflection, dynamic strain, and φ , enhancing practical applicability for in-service bridges.

Author Contributions

Conceptualization, X.W.; methodology, J.W. and Y.S.; software, J.W. and J.Y.; validation, J.W., J.Y. and Y.Z.; formal analysis, J.W., J.Y. and Y.S.; investigation, J.W. and X.W.; resources, Y.Z.; data curation, J.W.; writing—original draft preparation, J.W.; writing—review and editing, J.W., X.W. and Y.S.; visualization, J.W. and X.W.; supervision, X.W.; project administration, X.W. and Y.Z.; funding acquisition, X.W. and Y.Z. All authors have read and agreed to the published version of the manuscript.

Funding

This research was funded by the Chinese Guangxi Key Research and Development Program, grant number 2024AB15010.

Data Availability Statement

All data, models, and code generated or used during this study appear in the submitted article.

Acknowledgments

During the preparation of this manuscript, the authors used ABAQUS 2022 for the purposes of finite element modeling and simulation analysis, and Origin 2023 for plotting and data visualization. The authors have reviewed and edited the output and take full responsibility for the content of this publication. The authors also acknowledge the support from relevant research projects and express gratitude to the teams involved in field load testing and data acquisition.

Conflicts of Interest

Author Yulong Zhang is employed by the Guangxi Communications Investment Group Corporation Ltd. The remaining authors declare that the research was conducted in the absence of any commercial or financial relationships that could be construed as a potential conflict of interest.

Appendix A

The appendix shows the derivative process of the critical formula.
The equation derivation process of the undamaged beam segment (Figure 2) second derivative of the influence line difference, Δω″(xp):
Δ ω ( x p ) = 1 E I 1 E I P a d 3 L 2 d 2 + 6 c 2 12 c L + 6 L 2 × x p , 0 x p c d  
Δ ω ( x p ) = 0
Δ ω ( x p ) = 1 E I 1 E I P a 6 l 2 L x p 3 3 L 2 x p 2 + 4 d 3 + 3 c 2 d + 6 L 2 c + d + 3 L c d 2 x p + 2 L c d 3 3 L 2 c d 2 , c - d x ¯ c + d
Δ ω ( x p ) = 1 E I 1 E I p a L x p L
Δ ω ( x p ) = 1 E I 1 E I P a d 3 L 2 6 L c 2 d 2 6 c 2 × x p L , c + d x p L
Δ ω ( x p ) = 0
In the box girder system’s total potential energy Π expression, Equation (14), If is the sum of the bending moments of inertia of the upper and lower flanges:
I f = 2 α t t h t 2 + 2 b t t h t 2 + 2 t b h b 2
The variational derivation from Equations (25)–(A12) proceeds as follows: First, the first variation of Π is taken:
δ Π = 0 l ( M + φ E I w ω + φ E I f ω ) δ ω + φ E I f 32 45 u δ u + 4 5 ( ω δ u + u δ ω ) + 16 7 G I f u δ u b 2 d x
Then, the variation of ω is twice integrated:
0 l ( M + φ E I w ω + φ E I f ω + 4 5 φ E I f u ) δ ω d x = ( M + φ E I w ω + φ E I f ω + 4 5 φ E I f u ) δ ω 0 l 0 l M + φ E I w ω + φ E I f ω + 4 5 φ E I f u δ ω d x
The integrand of the inner integral must be zero. Then, trade Iw for I to obtain the following:
M x + φ E I ω + 8 5 φ E I f u = 0
The variation of ω is once integrated. The terms contained need to be isolated at first; then, add the terms of Equation (A11) to obtain Equation (A12):
φ E I f 0 l 32 45 u + 8 5 ω δ u d x = φ E I f 32 45 u + 8 5 ω δ u 0 l φ E I f 0 l 32 45 u + 8 5 ω δ u d x
0 l 16 7 G I f u / b 2 δ u d x
16 7 u b 2 G I f 32 45 φ E I f u 8 5 φ E I f ω = 0
Finally, the endpoint terms from integration by parts (once or twice) yield the natural boundary conditions.
φ E I f 32 45 u + 8 5 ω δ u | 0 l = 0
Combining Equation (A10) and Equation (A14) yields the final form of the three Euler–Lagrange equations:
M x + φ E I ω + 8 5 φ E I f u = 0 16 7 u b 2 G I f 32 45 u φ E I f 8 5 ω φ E I f = 0 φ E I f 32 45 u + 8 5 ω δ u | 0 l = 0
The system of differential equations, which recalls the beginning of Section 2.2, is as follows: Crossing Equation (A8) can obtain Equations (15) and (16). The coefficients in Equations (15) and (16) were expressed as follows:
m = 1 φ 1 18 I f 5 I ,   k = 1 b 45 G m 14 E
The calculation details for Equations (19)–(21) are as follows:
M ( x ) = P x 2 Q ( x ) = P 2 0 x L 2   M ( x ) = P ( L x ) 2 Q ( x ) = P 2 L 2 x L
The piecewise solutions for 0 ≤ x ≤ L/2 and L/2 ≤ x ≤ L, along with boundary conditions, are as follows:
u 1 = 9 m P 8 E I C 1 s i n h k x + C 2 c o s h k x 1 2 k 2 0 x L 2 u 2 = 9 m P 8 E I C 3 s i n h k x + C 4 c o s h k x + 1 2 k 2 L 2 x L
u 1 | x = 0 = 0 u 2 | x = 0 = 0 u 1 | x = 1 2 = u 2 | x = 1 2
u 1 + 9 m M ( x ) 8 E I | x = 1 2 = u 2 + 9 m M ( x ) 8 E I | x = 1 2
C 1 = 0 ,   C 2 = s i n h ( k L / 2 ) k 2 s i n h ( k L ) ,   C 3 = s i n h ( k L / 2 ) k 2 ,   C 4 = s i n h k L 2 c o t h ( k L ) k 2
u 1 = 9 m P 8 E I s i n h ( k L / 2 ) k 2 s i n h ( k L ) c o s h k x 1 2
u 2 = 9 m P 8 E I s i n h ( k L / 2 ) k 2 s i n h k x s i n h k L 2 c o t h ( k L ) k 2 c o s h k x + 1 2
Finally, for the bending normal stress in the flange of a damaged simply supported girder under shear lag, see Equation (21).

Appendix B. Symbol Table

SymbolName/QuantityUnits
E Elastic modulusUnits
G Shear modulusMPa
ν Poisson’s ratioMPa
E I Flexural stiffness (intact)
EI′Flexural stiffness (damaged)N·m2
φ Stiffness-reduction coefficientN·m2
β Stiffness allocation coefficient
λ Damage index
ω ( x ) Deflection
ω 0 ( x ) Baseline deflectionmm
Δ ω ( x ) Additional deflectionmm
M ( x ) Bending momentmm
Q ( x ) Shear forcekN·m
ρ Nominal curvaturekN
h ¯ c r Average crack height
l ¯ c r Average crack spacingmm
Δ c r Total crack widthmm
u ( x , y ) Flange longitudinal displacementmm
u ( x ) Max. rotation differencemm
k Shear-lag eigen parametermm
B Flange width1/m2
h i Centroid to flange mid-surfacemm
t b , t t Flange thicknessmm
I f Flange moment of inertiamm⁴
I w Web moment of inertiamm⁴
L Span lengthmm
x p Moving load positionm
a Unit load positionm
P Concentrated loadm
P 3 Load on middle girderkN
ε ¯ c t Nominal tensile strain1/m

References

  1. Lin, Z.; Zhao, J. Revisit of AASHTO Effective Flange-Width Provisions for Box Girders. J. Bridge Eng. 2011, 16, 881–889. [Google Scholar] [CrossRef]
  2. Qin, X.X.; Liu, H.B.; Wang, S.J.; Yan, Z.H. Symplectic Analysis of the Shear Lag Phenomenon in a T-Beam. J. Eng. Mech. 2015, 141, 04014157. [Google Scholar] [CrossRef]
  3. Zhou, S. Shear Lag Analysis in Prestressed Concrete Box Girders. J. Bridge Eng. 2011, 16, 500–512. [Google Scholar] [CrossRef]
  4. Zhang, Y. Improved Finite-Segment Method for Analysing Shear Lag Effect in Thin-Walled Box Girders. J. Struct. Eng. 2012, 138, 1279–1284. [Google Scholar] [CrossRef]
  5. Li, Y.; Xie, J.; Wang, F.; Li, Y. Shear Lag Effect of Ultra-Wide Box Girder under Influence of Shear Deformation. Appl. Sci. 2024, 14, 4778. [Google Scholar] [CrossRef]
  6. He, X.; Xiang, Y.; Qiu, X.; Chen, Z. Shear Lag Including Axial Balance of Box Beams by Finite-Segment Model. J. Constr. Steel Res. 2022, 189, 107043. [Google Scholar] [CrossRef]
  7. Wang, C.S.; Zhang, W.T.; Li, H.T.; Zhai, X.L.; Xin, Y.F. Shear Lag Effect of Twin I-Shaped Composite Girders in Cable-Stayed Bridges. Thin-Walled Struct. 2022, 180, 109822. [Google Scholar] [CrossRef]
  8. Zhou, P.; Lin, P. Finite-Segment Method of Shear Lag Analysis of Continuous Box Girders with Variable Height. J. Railw. Sci. Eng. 2018, 15, 948–955. [Google Scholar] [CrossRef]
  9. Cen, F.; Gan, Z.; Gao, P. Analysing Shear lag Warping Displacement Functions and Mechanical Characteristics of Rectangular Concrete Box-Girder Bridges. ZAMM—J. Appl. Math. Mech. 2025, 105, e202400676. [Google Scholar] [CrossRef]
  10. Li, X.; Wan, S.; Shen, K.; Zhou, P.; Wang, X. Prediction of Shear Lag Effect in Thin-Walled Single-Box Multicell Box Girder Based on the Modified Warping Displacement Function. Adv. Civ. Eng. 2020, 2020, 6815092. [Google Scholar] [CrossRef]
  11. Cao, G.; Fang, Z. Shear Lag Effect of Cracked Simply Supported Box Girder Analysed by Variational Principle. Chin. J. Comput. Mech. 2007, 24, 853–858, 864. [Google Scholar] [CrossRef]
  12. He, Z.; Liu, Y.; Zhou, P.; Lin, P. Analysis on Shear Lag Effect of Concrete Box Girder after Cracking. Railw. Eng. 2017, 57, 25–30. [Google Scholar]
  13. Samani, M.A.; Farrokhabadi, A.; Boora, S.H. Determining a Closed-Form Relation for Evolution of Crack Density and Induced Delamination in Off-Axis Composite Laminates under Uniaxial Loading Condition. Mech. Adv. Mater. Struct. 2020, 27, 859–868. [Google Scholar] [CrossRef]
  14. Wang, X. Study on Damage Identification of Urban Simply Supported Beam Bridge Based on the Deflection Influence Line. Master’s Thesis, Southwest University of Science and Technology, Mianyang, China, 2017. [Google Scholar]
  15. Zhang, J.; Dong, J.; Li, G.; Zhu, S.; Wang, X. Study on Damage Identification of Continuous Girder Bridge Structure Model Based on Influence Line. Build. Struct. 2021, 51, 1451–1455. [Google Scholar]
  16. Zhou, Y.; Li, M.; Shi, Y.; Xu, C.; Zhang, D.; Zhou, M. Research on Damage Identification of Arch Bridges Based on Deflection Influence Line Analytical Theory. Buildings 2024, 14, 6. [Google Scholar] [CrossRef]
  17. Wang, L.; Zhao, Y. Analysis of Residual Bearing Capacity of Cracked Prestressed Concrete Continuous Box Bridges. J. Railw. Sci. Eng. 2015, 12, 127–131. [Google Scholar] [CrossRef]
  18. Huang, H.; He, P.; Zhou, F.; Tan, Y. Flexural Behaviour Test and Normal-Section Bearing Capacity of RC Beam Strengthened with Aluminium Alloy Plate. J. Highw. Transp. Res. Dev. 2024, 41, 105–115, 125. [Google Scholar]
  19. Ma, Z.; Wu, X.; Chang, X.; Huang, J. Concrete Bridge Bearing Capacity Degradation Based on Crack Patterns. J. Highw. Transp. Res. Dev. 2024, 41, 154–161. [Google Scholar]
  20. Dong, S. Model Experimental Study of Deflection of the Cracked Prestressed Concrete Beam. Master’s Thesis, Chang’an University, Xi’an, China, 2010. [Google Scholar]
  21. Wu, X.; Qian, R.; Su, P. Calculation of Transverse Distribution of Assembled T-Beam Bridge Considering Stiffness Damage. J. Highw. Transp. Res. Dev. 2018, 35, 61–66. [Google Scholar]
  22. Li, M.; Zhang, D.; Liu, R. Damage Identification of Simply Supported Beams Based on Deflection Influence Line Difference Curvature. J. Nanyang Inst. Technol. 2023, 15, 90–94. [Google Scholar] [CrossRef]
  23. Luo, Q. Theoretical and Model Test Studies of the Shear Lag in Thin-Walled Box Girders Based on Energy Principle. Ph.D. Thesis, Hunan University, Changsha, China, 2005. [Google Scholar]
  24. Luo, Q. Analysis of the Shear Lag Effect on Continuous Box Girder Bridges with Variable Depth. China J. Highw. Transp. 1998, 1, 65–72. [Google Scholar] [CrossRef]
  25. Xu, X.; Zhang, F.; Wei, C. Stiffness Damage Assessment of Prestressed Concrete Box-Girder after Cracking. Eng. Mech. 2015, 32, 95–102. [Google Scholar]
  26. Xu, X.; Ye, W.; Qiang, S. Torsion and Distortion Analysis of Thin-Walled Box Girder with Cantilever Flanges. J. China Railw. Soc. 2015, 37, 83–91. [Google Scholar] [CrossRef]
  27. Vukoja, H.; Vlašić, A.; Srbić, M. Shear Lag Effect on Box Steel Beams with Wide Curved Flanges. Appl. Sci. 2024, 14, 8481. [Google Scholar] [CrossRef]
  28. Zhu, D.; Huang, N.; Li, J.; Zhou, S.; Wu, C. Shear Lag Analysis of Simply Supported Box Girders Considering Axial Equilibrium and Shear Deformation. Buildings 2023, 13, 2415. [Google Scholar] [CrossRef]
Figure 1. Schematic of the stepped stiffness model for damaged beams. (a) Crack morphology and parameter definitions for a simply supported concrete beam. (b) Equivalent stepped stiffness model: intact segments are assigned the original flexural stiffness E I , while the cracked segment is assigned a reduced stiffness E I .
Buildings 15 01901 g001
Figure 2. Schematic of a simply supported beam subjected to a moving load and stiffness degradation.
Buildings 15 01901 g002
Figure 3. Bending stress distribution in a single-cell box girder section under shear lag effects.
Buildings 15 01901 g003
Figure 4. Measurement points layout and field loading configuration. (a) Midspan cross-section of the box girder (units: mm), showing flange and web dimensions with seven strain gauge positions (blue squares). (b) Plan view of the six-girder deck and the axle layout of four 400 kN trucks.
Buildings 15 01901 g004
Figure 5. FEM used for validation of plexiglass scale model experiment. (a) FEM elevation and section of the box girder (units: mm) with seven stress-measurement points. (b) ABAQUS solid model and boundary conditions.
Buildings 15 01901 g005
Figure 6. Deflection results calculated by Equation (7) and FEM analysis. (a) Comparison of stiffness variations and errors in the main beam obtained from simulation and theoretical calculation. (b) Displacement contour plot from ABAQUS-based FEA.
Buildings 15 01901 g006
Figure 7. Finite element verification of the damage localization method using the deflection difference influence line under 80% EI stiffness reduction.
Buildings 15 01901 g007
Figure 8. Variation pattern of calculated and simulated stress in the upper flange of the different stiffness box girder: (a) 100% EI stress variation pattern of the flange of the box girder; (b) 80% EI stress variation pattern of the flange of the box girder; (c) 70% EI stress variation pattern of the flange of the box girder; (d) 60% EI stress variation pattern of the flange of the box girder.
Buildings 15 01901 g008
Figure 9. Normalized longitudinal stress distribution on top flange under varying stiffness-reduction levels (FEA vs. theoretical formula): (a) 0% stiffness-reduction level; (b) 20% stiffness-reduction level; (c) 30% stiffness-reduction level; (d) 40% stiffness-reduction level.
Buildings 15 01901 g009
Table 1. Survey and statistical summary of damage in the main girder of the test bridge.
Member IDDamage LocationDamage TypeDamage Size
6#Flange plateConcrete spalling with exposed reinforcement0.6 m × 1 m
2#Flange plateConcrete spalling with exposed reinforcement0.4 m × 0.1 m × 0.08 m
2#Outer web, midspanTransverse cracks4 cracks: L = 15   cm ; W = 0.15   mm ; L = 1.5   m ; W = 0.02   mm
3#Outer web, midspanLongitudinal crack
Note: The “Member ID” refers to the ordinal number of each beam, counted from left to right (see Figure 4b). Here, L is the crack length, and W is the crack width; L is the average crack length, and W is the average crack width.
Table 2. Summary of boundary conditions and physical implications of shear lag-induced additional displacements.
Boundary ConditionsPositionPhysical ImplicationsEngineering Interpretation
u 1 | x = 0 = 0 Left side of the beam: x = 0Slope of shear lag is zeroAt the support (or symmetry plane), the additional axial strain from shear lag is zero; warping is fully restrained.
u 2 | x = 0 = 0 Left side of the beam: x = 0Repeat for the adjacent half-spanThe second web/half-span has the same zero shear lag strain at the support, ensuring symmetric boundary restraint.
u 1 | x = 1 2 = u 2 | x = 1 2 Midpoint: x = L / 2 Displacements are continuousThe additional axial displacements of the two segments are continuous at midspan, preventing longitudinal mismatch or opening.
u 1 + 9 m M ( x ) 8 E I | x = 1 2 = u 2 + 9 m M ( x ) 8 E I | x = 1 2 Midpoint: x = L / 2 Shear lag slope + bending correctionContinuity of “shear lag slope + bending correction” at the interface keeps shear flow and axial force balanced without jumps.
Table 3. Comparison between measured and calculated flange edge stresses from the load test.
81.06% EICalculated Point
123
Test value (MPa)2.6452.9363.523
Calculated value (MPa)3.0253.1663.683
RE13.61%8.22%5.73%
MSE0.074
RMSE0.273
NRMSE0.090
COV0.101
Table 4. Normal stress in the upper flange of the simply supported box girder at x = 380 mm.
Setting Stiffness ReductionStress of Test Point (MPa)Test Point Code
1234567
0%FEA0.1772 0.1993 0.2282 0.2748 0.3344 0.28190.2428
Formula0.2553 0.2579 0.2691 0.2992 0.3626 0.29920.2691
RE30.60%22.73%15.21%8.16%7.78%5.78%9.78%
20%FEA0.1692 0.1918 0.2206 0.2671 0.3266 0.27510.2372
Formula0.2663 0.2687 0.2785 0.3050 0.3465 0.30500.2785
RE36.48%28.63%20.79%12.44%5.76%9.80%14.86%
30%FEA0.1674 0.1901 0.2189 0.2651 0.3245 0.27360.2363
Formula0.2667 0.2690 0.2775 0.3012 0.3384 0.30120.2775
RE37.24%29.32%21.12%11.98%4.09%9.17%14.87%
40%FEA0.1653 0.1883 0.2169 0.2628 0.3221 0.27170.2350
Formula0.2691 0.2709 0.2788 0.3000 0.3334 0.30000.2788
RE38.57%30.51%22.21%12.38%3.39%9.44%15.72%
Table 5. Global error metrics between the analytical formula and FEA predictions under four levels of stiffness reduction.
Setting Stiffness ReductionMSERMSENRMSECOV
0%0.00190.04410.280.131
20%0.00330.05750.3650.097
30%0.00340.05790.3680.088
40%0.00370.06050.3860.079
Disclaimer/Publisher’s Note: The statements, opinions and data contained in all publications are solely those of the individual author(s) and contributor(s) and not of MDPI and/or the editor(s). MDPI and/or the editor(s) disclaim responsibility for any injury to people or property resulting from any ideas, methods, instructions or products referred to in the content.

