Article

Effect of Charge Eccentric Position on the Response of Reinforced Concrete Columns Under Blast Loading

1
Key Laboratory of Impact and Safety Engineering, Ningbo University, Ministry of Education, Ningbo 315211, China
2
School of Civil & Environmental Engineering and Geography Science, Ningbo University, Ningbo 315211, China
*
Authors to whom correspondence should be addressed.
Buildings 2025, 15(11), 1898; https://doi.org/10.3390/buildings15111898
Submission received: 1 May 2025 / Revised: 21 May 2025 / Accepted: 23 May 2025 / Published: 30 May 2025
(This article belongs to the Section Building Structures)

Abstract

This study investigates the failure modes and damage extent of reinforced concrete (RC) columns under the combined action of eccentric blast loading and axial compressive loading through experimental tests and numerical simulations. Field blast tests were performed using half-scaled-down models for close-in airburst tests. The effects of charge mass, explosive position, and axial load on the failure modes and damage levels of RC columns under close-range blast loading were investigated. Eight experimental datasets of blast overpressure were obtained, and curve fitting was performed on these data to establish an empirical formula, thereby enhancing the predictive accuracy of blast effect assessment in practical engineering scenarios. The test results indicated that when the explosive position is closer to the column base, the structural failure mode becomes closer to shear failure. To further interpret the experimental data, a detailed finite element model of RC columns was developed. Numerical simulations of RC columns were conducted using the RHT model. The rationality of the model was validated through comparison with experimental data and the SDOF method, with dynamic response analyses performed on cross-sectional dimensions, the longitudinal reinforcement ratio, the scaled distance, the explosion location, and axial compression. An empirical formula was ultimately established to predict the maximum support rotation of RC columns. Studies have shown that when the explosive position is closer to the column base, the structural failure mode approaches shear failure, and axial compression significantly increases the propensity for shear failure.

1. Introduction

The rising incidence of explosions, triggered by factors such as terrorist attacks, as well as inadvertence in both industrial and civilian contexts, has resulted in significant loss of life and property, underscoring the need for effective measures to prevent accidental explosions in building structures [1]. However, the structural response to blasting impact differs markedly from its behavior under static and quasi-static loading conditions [2,3,4,5]. In response to these concerns, extensive research has been conducted on the mechanical behavior of RC structures under explosive loading conditions [6,7,8,9].
In order to study the dynamic characteristics of RC members under explosive loads, many scholars have carried out a large number of tests under different load conditions. Fujikura et al. [10] proposed using the strong bending resistance of concrete-filled steel tubular columns to design multi-column piers and conducted experimental research on columns subjected to explosive loads. They also designed a simplified blasting test scheme for explosive analysis. Yuan et al. [11] focused on contact explosion conditions and found that the critical impulse of square RC columns was 23–26% lower than that of circular columns due to the stress concentration effect. Shi et al. [12] clarified the influence of proportional distance and axial compression ratio on the damage of RC columns through field explosion tests; under the influence of close-range explosion, the proportional distance increases by only 3.7%, but the structural damage increases by 25%. In addition, through the residual bearing capacity test, they concluded that the influence of the axial compression ratio on the anti-explosion performance showed nonlinear characteristics with the change in proportional distance. Zhang et al. [13] further quantified the blast resistance advantages of UHPC slabs: compared with ordinary concrete slabs, the penetration failure threshold charge of UHPC slabs increased by 2–3 times, and a prediction model for the explosion damage range was established through dimensional analysis. Li et al. [14] verified the progressive collapse resistance potential of UHPC columns via residual bearing capacity tests after blasting and achieved accurate simulation of damage evolution based on an LS-DYNA model. Burrell et al. [15] carried out shock tube tests on steel fiber-reinforced concrete. The results showed that a 1.5% volumetric fiber content reduced the residual displacement of columns by more than 30%. Hu et al. [16] revealed the synergistic effect of CFRP layer thickness and stirrup ratio on blast resistance through double-end initiation tests. They proposed a quantitative design formula based on residual bearing capacity but noted that the weak reinforcement details at column ends remain a technical bottleneck.
Similarly, in recent years, significant progress has been made in the simulation of building structures under blast loads. Bao et al. [17] and Wu et al. [4] systematically studied the dynamic response of components under near-field explosions, considering that outer columns are vulnerable to terrorist attacks. The former used LS-DYNA to construct a refined model. Based on 12 sets of parametric analyses, they found that an increase in the transverse reinforcement ratio could enhance the shear bearing capacity by 22–35%, and the residual bearing capacity of the component peaked when the axial compression ratio was within 0.15–0.2. The latter established a prediction formula for residual bearing capacity based on explosion-equivalent parameters, with the determination coefficient R2 of the regression model reaching 0.92, providing a quantitative basis for safety assessment. Liu et al. [18] revealed the relationship between the bending failure mode of RC beams and parameter variations through explosion tests with different scaled distances and explosive masses. Yao et al. [19] explored the effects of the transverse reinforcement ratio and spacing on the blast damage behavior of fixed-end RC beams via experimental studies. Wang et al. [20] analyzed the differences between overall bending failure modes and local punching failure modes through charge quantity comparison tests. Do et al. [21] investigated the dynamic response of unbonded prestressed precast concrete segmental columns under vehicle collision using numerical simulation methods. Williamson et al. [22] experimentally investigated the dynamic response of RC bridge columns under close-in blast loads through testing of ten half-scale bridge columns. Three transverse reinforcement configurations were examined: conventional design, seismic design, and blast-resistant design. The experimental findings indicated that blast resistance improved with decreased stirrup spacing, with blast-resistant design outperforming seismic design, while both designs demonstrated superior performance compared to conventional design. However, Fujikura et al. [23] conducted close-in explosion tests on seismically designed RC bridge columns, revealing that the seismic columns failed to exhibit ductile behavior under blast loading, demonstrating instead a brittle direct shear failure at the base. Their study concluded that seismic design provided no significant advantage under close-in blast conditions. Saatcioglu et al. [24] investigated the influence of seismic transverse reinforcement design on the blast response of RC frames using an inelastic dynamic analysis method. The results demonstrated that implementing seismic transverse reinforcement design in columns could enhance the blast resistance of RC frame structures, thereby reducing their potential for progressive collapse. Kyei et al. [25] conducted numerical simulations of the dynamic response of seismically designed RC columns under blast loading. The computational results revealed that reducing stirrup spacing led to a significant reduction in lateral deformation of RC columns under far-range explosions, although the influence of stirrup spacing became negligible in near-field blast scenarios.
This study primarily introduces field blast tests experiments on RC columns. Six half-scale RC column specimens were designed and fabricated for the field blast tests. A detailed finite element model of RC columns under blast loading was established, which was validated against experimental results and SDOF to confirm its reliability and effectiveness. Subsequently, based on the validated FE model, parametric analyses were conducted to investigate the influences of scaled distance, blast location, longitudinal reinforcement ratio, cross-sectional dimensions, and axial compression ratio on the dynamic response of blast-damaged RC columns. in order to reveal the quantitative influence mechanism of explosive parameters and cylinder geometric characteristics on the maximum rotation angle of the structure, based on this goal, through numerical simulation and experimental verification, the least squares method is used to fit the general formula of rotation angle calculation.

2. Experiment Program

2.1. Concrete Preparation

The test (scale model) was conducted using an RC square column in the frame structure of civil buildings as the prototype. The parameter design of the square column strictly followed Chinese Code for Design of Concrete Structures GB 50010-2010 [26] and Technical Specification for Concrete Structures of Tall Buildings JGJ 3-2010 [27].
According to the investigation, the average axial design load of reinforced concrete square columns in mid-to-high-rise civil buildings is 2800 kN. The experimental column height was set as 3000 mm (based on the typical floor height of approximately 3 m in civil buildings), using C40 concrete and HRB400 steel reinforcement. The calculation formula for axially compressed members provided in the Code for Design of Concrete Structures GB 50010-2010 is
N = 0.9 φ f c A + f y A s
where N   is   the   axial   pressure ,   φ   is   the   structural   coefficient , ρ is the reinforcement ratio, f c is the compressive strength of concrete, and f y is the reinforcement yield strength.
A = N 0.9 φ f c + f y ρ = 2800 × 1 0 3 0.9 × 1 16.72 + 360 × 0.01 = 153.11 × 1 0 3   mm 2
Due to the use of a square column, b = A = 391.29   mm = h , b × h = 400 × 400   mm 2 .
A s = N 0.9 φ f c A 0.9 φ f y = 2800 × 1 0 3 0.9 × 1 × 16.72 × 400 × 400 0.9 × 1 × 360 = 1211   mm 2
where the diameter of the steel bar is 16 cm, 8 Φ 16   ( A s = 1608   mm 2 ) .
ρ = 1608 400 × 400 = 1.005 % > 0.6 % = ρ m i n
where ρ is the reinforcement ratio, ρ m i n is the minimum reinforcement ratio.
A 1:2 scale test was performed for the field blasting test due to the fact that the original-size components are difficult to transport, and it is difficult to apply axial pressure. The cross-sectional dimensions of the designed column were 200 mm × 200 mm, with a column height of 1500 mm. C40-grade concrete was used, and HRB400 longitudinal steel bars with diameters of 8 mm were selected. The reinforcement ratio was 1% (meeting the minimum requirement of 0.6%), and the concrete cover thickness was 10 mm. HRB335 steel stirrups with a diameter of 8 mm were used, spaced at 100 mm in the uniform section and 50 mm in the end confinement zones. To simulate realistic boundary conditions, large concrete blocks (400 mm × 400 mm × 400 mm) were cast at both ends of the column. The longitudinal bars in the column were extended and anchored into these blocks. The specimen configuration is illustrated in Figure 1.
The prefabricated processing of RC columns was completed at a precast component factory in Ningbo, with the technological process strictly adhering to current construction specifications. The procedure commenced with steel reinforcement processing: HRB400-grade longitudinal reinforcement bars and HPB335-grade stirrups were fabricated according to the geometric parameters and mechanical performance grades specified in the structural design. These components were subsequently secured using galvanized iron wire binding. An ordinary wooden formwork was employed for mold installation. Concrete mixing strictly followed the design mix ratio to produce C40 ready-mix concrete. The single continuous pouring technique was implemented for casting. Formwork removal was conducted after initial concrete setting upon achieving demolding strength, followed by 28 days of continuous curing. Only after the concrete attained its design strength were hoisting and transportation operations permitted. The manufacturing process of the RC columns is illustrated in Figure 2.

2.2. Mechanical Properties of Concrete and Reinforcement

The material performance test is shown in Figure 3. The experiment utilized two grades of steel reinforcement, HRB400 and HRB335. To measure their mechanical properties, six specimens were randomly sampled and tested using the UTC100kN microcomputer-controlled electro-hydraulic servo universal testing machine (manufactured by Shenzhen Regel Instrument Co., Ltd., Ningbo, China) at the School of Civil Engineering, Ningbo University. The measured mechanical properties are shown in Table 1.
In accordance with GB/T 50081-2016 [28] Standard for Test Methods of Mechanical Properties of Ordinary Concrete, the compressive strength of three reserved 150 mm × 150 mm × 150 mm cube specimens from three castings was tested using the YE5000 compression testing machine (manufactured by Shenzhen Regel Instrument Co., Ltd., Ningbo, China) at the School of Civil Engineering, Ningbo University. The test results are presented in Table 2. The compressive strengths of the three concrete castings measured 40.2 MPa, 41.1 MPa, and 40.3 MPa, respectively, yielding an average strength of 40.53 MPa.

2.3. Test Instrument

The test was conducted on site, with the RC column secured in a hydraulic press during the experiment, as shown in Figure 4a. The column was restrained using a completely fixed boundary condition, and the explosive charges were suspended at a specified height in front of the specimen, as illustrated in Figure 4b. The explosive used was a commercial emulsion explosive, triggered by an electric detonator.
The layout of the pressure sensor installation is illustrated in Figure 5. A series pressure sensor was selected for the experiment. The data cable was routed through the internal bore of the experimental setup and connected to the overpressure sensor. Due to the violent vibration caused by the high-speed movement of the cylinder under the explosive environment, the fixed bracket of the displacement sensor falls off, resulting in data drift. This study focuses on dynamic analysis through numerical simulation.
Figure 6a shows the material parameters of the explosive charge. Two overpressure sensors were positioned at 80 cm and 90 cm from the explosion center on both sides, respectively. The spherical explosive charge was centrally initiated using a detonator. The charge equivalent in the subsequent proportional distance of the emulsion explosive was multiplied by the coefficient of 0.7 [29,30]. The masses of the charges, determined by weighing, were 1 kg, 4 kg, and 6 kg, respectively. The 6 kg charge configuration is shown in Figure 6b. The experimental procedure was conducted as follows: First, the RC column was hoisted and securely fixed. Pressure sensors and displacement sensors were subsequently installed and connected to the data acquisition system. A multimeter was employed to perform continuity testing on sensor signal transmission channels to verify operational integrity. Following system calibration, emulsified explosives were suspended via a cord at the predetermined blast height in front of the specimen. Detonators were then installed and connected to the explosive charge. After confirming initiation circuit continuity, the AC initiation power supply was engaged. All monitoring systems were maintained in pre-trigger standby mode until remote detonation was executed. The specific experimental setup configuration is illustrated in Figure 6c.

2.4. Test Scheme

The purpose of the blast test was to investigate the effects of the axial compression ratio and detonation location d on the dynamic response and damage characteristics of RC columns under blast loading. The definition of d is shown in Figure 7. The experimental design is summarized in Table 3. Each test case was labeled using a combination of the definition of d, scaled distance (Z), and the column’s axial compression ratio. The axial compression ratio was calculated using the following formula:
u = N f c × A
In the formula, u denotes the axial compression ratio; N represents the initial axial force; A signifies the cross-sectional area of the column; f c refers to the design value of concrete axial compressive strength, sourced from the Code for Design of Concrete Structures GB 50010-2010 [26]. The experimental scheme considered initial axial forces of 216 kN and 432 kN, corresponding to axial compression ratios of 0.15 and 0.30, respectively.

2.5. Experimental Results

Figure 8 shows the reflected Reflected overpressure time histories of the blast loading. It can be observed that when the shock wave reaches the pressure transducers, the pressure rapidly increases, followed by an exponential decay of overpressure with time. Additionally, the 1 kg charge exhibits two distinct overpressure phases, attributed to a secondary detonation of the emulsion explosive [31]. The overpressure demonstrates a sharp peak surge with increasing scaled distance (Z = R/W1/3, where R is standoff distance and W is charge mass), which may be induced by the detonation products of the emulsion explosive. The validity of the data is cross-verified through the right-side overpressure measurements in scenarios A4, A5, and A6.
The observed exponential growth of overpressure with increasing scaled distance motivates this study to establish the relationship between overpressure and scaled distance through curve fitting, as illustrated in the accompanying Figure 9. This paper further proposes an empirical formula (Formula (2)) to offer practical guidance for engineering applications.
P = 1958 e 7.306 Z
where P is the overpressure, and Z is the scale distance. The curve fitting R2 is 0.9633.
The damage of the RC column after the explosion is shown in Figure 10. In Test A1, due to the relatively small explosive equivalent used, minor concrete spalling occurred on both sides of the RC column, while no central blast crater formed, as shown in Figure 10a–c. The overall structural integrity of the column remained intact, with no through-cracks or other forms of damage. This indicates that lower explosive equivalents induce limited destructive effects on RC columns.
When the explosive equivalent was moderately increased in Test A2, localized concrete spalling (approximately 10 cm in depth) developed on both sides of the RC column, though the central region remained free of craters (Figure 10d–f). Despite significant spalling, the global structural integrity was preserved, with only minor surface cracks observed and no through-cracking. Post-blast residual load-bearing capacity tests were subsequently conducted.
In Test A3, with a 6 kg explosive equivalent, a distinct blast crater with a 22 cm radial formed. The shockwave caused extensive surface concrete spalling and partial and through-thickness diagonal cracks on the sides (Figure 10g–i). Residual capacity tests confirmed that the column retained partial load-bearing functionality without complete structural failure.
Test A4 demonstrated significantly aggravated damage due to the combined effects of high axial compression and eccentric blast loading. The blast crater expanded to 36 cm in width (Figure 10j–l), accompanied by severe longitudinal cracking that critically compromised the load-bearing capacity. Exposed reinforcement exhibited pronounced bending/twisting deformations, indicating substantial blast-induced structural degradation.
Using a 6 kg charge positioned 25 cm from the column base in Test A5, the crater width reached 36 cm (Figure 10m–o). This configuration induced notable shear failure characteristics, including base-penetrating shear cracks, highlighting the critical influence of detonation positioning on blast resistance.
In Test A6, with a centrally positioned 6 kg charge, minimal damage was observed (Figure 10p–r): only minor bilateral concrete spalling occurred, without through-cracking, confirming that eccentric blast loading predominantly drives mechanisms in RC columns.
By comparing Tests A1, A2, and A3, it can be observed that structural damage increases with the growth in the charge equivalent. Specifically, comparing A1 with A2 and A2 with A3 reveals that this increase is not linear but follows an exponential trend. Notably, Test A4 exhibits the most severe damage, characterized by penetrating diagonal cracks in the structure. This outcome stems from the extreme test conditions involving a large scaled distance, high axial compression, and eccentric explosion. In contrast, when comparing Test A3 with A4 under halved axial compression, both the number and size of visually observable diagonal cracks are significantly reduced. Tests A3, A5, and A6 illustrate the influence of explosive positioning on structural damage. While the structural integrity of A6 appears relatively preserved, the external differences in damage between A5 and A6 are subtle. Consequently, residual load-bearing capacity tests were conducted for Tests A5 and A6. As shown in Figure 11, the residual load-bearing capacity of the reinforced concrete column decreases when the explosion occurs closer to the column base. This phenomenon occurs because proximity to the column base increases susceptibility to shear failure.

3. Numerical Simulation

This section adopts a numerical simulation methodology to address the cost limitations inherent in conventional experimental approaches. Building upon the field blast test data from Section 2 and incorporating experimental results from Wu [4] and Shi [12], an RC column numerical model was developed and validated using ANSYS LS-DYNA 2024 R1 analysis software. First, a fluid–structure coupling algorithm was implemented to establish a computational model simulating RC structures under combined blast shockwave and axial loading, with verification focusing on damage extent and failure modes. Subsequently, dynamic response characteristics and damage patterns of RC columns were systematically analyzed through numerical simulations.

3.1. Finite Element Model

Three-dimensional finite element models were established for the RC columns from the previous study and Shi’s [12] and Wu’s [4] experimental specimens, with simulation validation of the finite element material parameters. The material parameters are shown in Table 4. The concrete was simulated using eight-node solid elements, while the reinforcement bars were modeled with beam elements. The simulation model of this test is shown in Figure 12.

3.2. Material Constitutive Model

TNT and the surrounding air medium were discretized using Eulerian mesh, while solid structures such as RC columns were modeled with Lagrangian mesh. The fluid–structure interaction between blast shockwaves and structures was achieved using the fully coupled Eulerian–Lagrangian contact algorithm provided by LS-DYNA.
Regarding material constitutive models, TNT employs the Jones–Wilkins–Lee (JWL) equation of state for pressure characterization, expressed as
P = A 1 w R 1 V e R 1 V + B 1 w R 2 V e R 2 V + w E V
where P denotes the detonation pressure of TNT, V represents the relative volume of air, E is the internal energy per unit mass, and A, B, R1, R2, and ω are material constants. The specific parameters of the TNT explosive are listed in Table 5.
The state parameters of the air medium are mathematically characterized using the ideal gas equation of state. Specifically, they are determined through the constitutive relationship between its pressure P and specific internal energy e:
P = γ 1 ρ e
where ρ denotes the air density, e represents the specific internal energy of the gas, and γ is a material constant. The specific material parameters for air are provided in Table 6.
The selection of the MAT_RHT material model in LS-DYNA for concrete materials can effectively capture the damage characteristics of concrete under high strain rates and pressure. This model has been proven multiple times to yield favorable simulation results when subjected to explosive loading conditions [32].
The parameters A 1 ,   A 2 ,   A 3 ,   B 0 ,   B 1 ,   T 1 ,   T 2 ,   P e l ,   G ,   β c ,   β t ,   f c ,   ρ 0 , and   α 0 were determined through theoretical derivations. As indicated in Reference [20], B = 0.0105   g t * = 0.7   . The model-prescribed values ε 0 c ,     ε 0 t ,     ε c ,     ε t , and D 2 , along with 21 parameters acquired via theoretical calculations and quasi-static tests, were adopted from Reference [33] due to experimental acquisition complexities. The complete parameter set is tabulated in Table 7.
The material parameters for the steel reinforcement in this study were determined through material property tests and recommended values from References [34,35]. The specific parameters are listed in Table 8.

3.3. Convergence Analysis

Three mesh sizes (1 cm, 2 cm, and 3 cm) were investigated for grid discretization schemes. This mesh size is also consistent with previous studies [36,37,38]. Using experimental Case 2 for analysis, Figure 13b presents the computational results under different mesh densities. The 1 cm and 2 cm meshes demonstrated minimal discrepancies in blast loading compared with experimental measurements, while the 3 cm mesh exhibited a significant deviation of 32.9% in pressure peak value. The relative errors for 1 cm and 2 cm meshes were 0.89% and 0.96%, respectively. Although finer meshes (e.g., 1 cm) provide more accurate pressure peak predictions, post-peak pressure variations became negligible regardless of mesh refinement. Therefore, considering the optimal balance between computational accuracy and resource expenditure, the 2 cm mesh configuration was selected for subsequent finite element analyses. At the same time, in order to prove the reliability of the simulation, it is compared with the experimental overpressure data, as shown in Figure 13.

3.4. Model Verification

To validate the applicability and effectiveness of the finite element model proposed earlier, the aforementioned model was employed to simulate the dynamic response and damage patterns of the half-scale RC columns described in Section 2 and the RC columns tested by Shi [9] under blast loading. The numerical simulation results were then compared with experimental findings. This section specifically focuses on analyzing the dynamic behavior and failure modes of the test columns from this study, Shi’s [12] experiment, and Wu’s [4] experiment under field blast loads through simulation and comparative analysis. Figure 14a–d present comparative damage diagrams for Conditions A2 and A3 from the experimental study in this paper. Figure 14e–h, respectively, show simulated damage comparisons for Wu’s [4] and Shi’s [12] tests, which demonstrate typical failure modes including diagonal shear failure, surface spalling, collapse, and flexural failure. This study used equivalent plastic strain as the strain criterion for the simulation. In the RHT constitutive model, the option is displayed as history variable #4.

3.5. Model of Damage

Figure 15 shows the damage process of reinforced concrete columns under typical eccentric explosion conditions. In the initial stage, the concrete on the blasting surface of the column is subjected to huge compressive stress under the action of explosive impact load. Due to the existence of the free surface on both sides, the stress boundary is formed, which makes the area more prone to fragmentation and spalling than the central area, and the back surface is stretched by a layer of cracks due to the stress wave. At 4 ms, there is obvious damage at the end of the support away from the explosion source. The shock wave may cause energy concentration at the corner of the support to form corner damage due to the geometric shape focusing. Compared with 1 ms, the front damage is almost similar, while there are a small number of cracks on the side, and the damage range on the back is further aggravated. This is due to the further reflection of the stress wave, and the column begins to bend. At 10 ms, the front damage of the column is further aggravated, penetrating cracks appear on the side, and the bending displacement of the column reaches the maximum. At 20 ms, completely penetrating cracks appear on the front of the column, and the damage radius increases. Completely penetrating cracks also appear on the side, and the built-in steel bars are exposed.
In order to study the failure modes of RC columns under different charge positions, numerical simulations were conducted based on verified test conditions with a fixed detonation distance of 0.4 m and a charge amount of 4 kg. The failure characteristics of the specimen were analyzed for d = 0, d = 25 mm, and d = 50 mm, focusing on typical working conditions, as illustrated in Figure 16.
When d = 0, concrete spalling occurs on both sides of the column’s front face, accompanied by significant tensile failure on the back face, and the structure exhibits pronounced bending displacement (Figure 16a). For d = 25 mm, the front damage zone shifts downward. In addition to concrete spalling on both sides, penetrating cracks develop in the mid-section. The back face shows a larger but less severe damage area compared to the center, while oblique shear cracks penetrate the sides (Figure 16b). When d = 50 mm, the front damage zone further shifts downward, resulting in severe shear failure of the column, with side cracks propagating from the support to the front surface (Figure 16c).

4. Dynamic Response Analysis

In this section, the equivalent single-degree-of-freedom (SDOF) method and Shi’s experimental data are used to validate the numerical simulation results. Additionally, the dynamic response data from simulations under different parameters are analyzed. Finally, a formula for the maximum bearing rotation angle is derived based on the simulation data.

4.1. SDOF Method

The equivalent SDOF model, as outlined in UFC 3-340-02 [
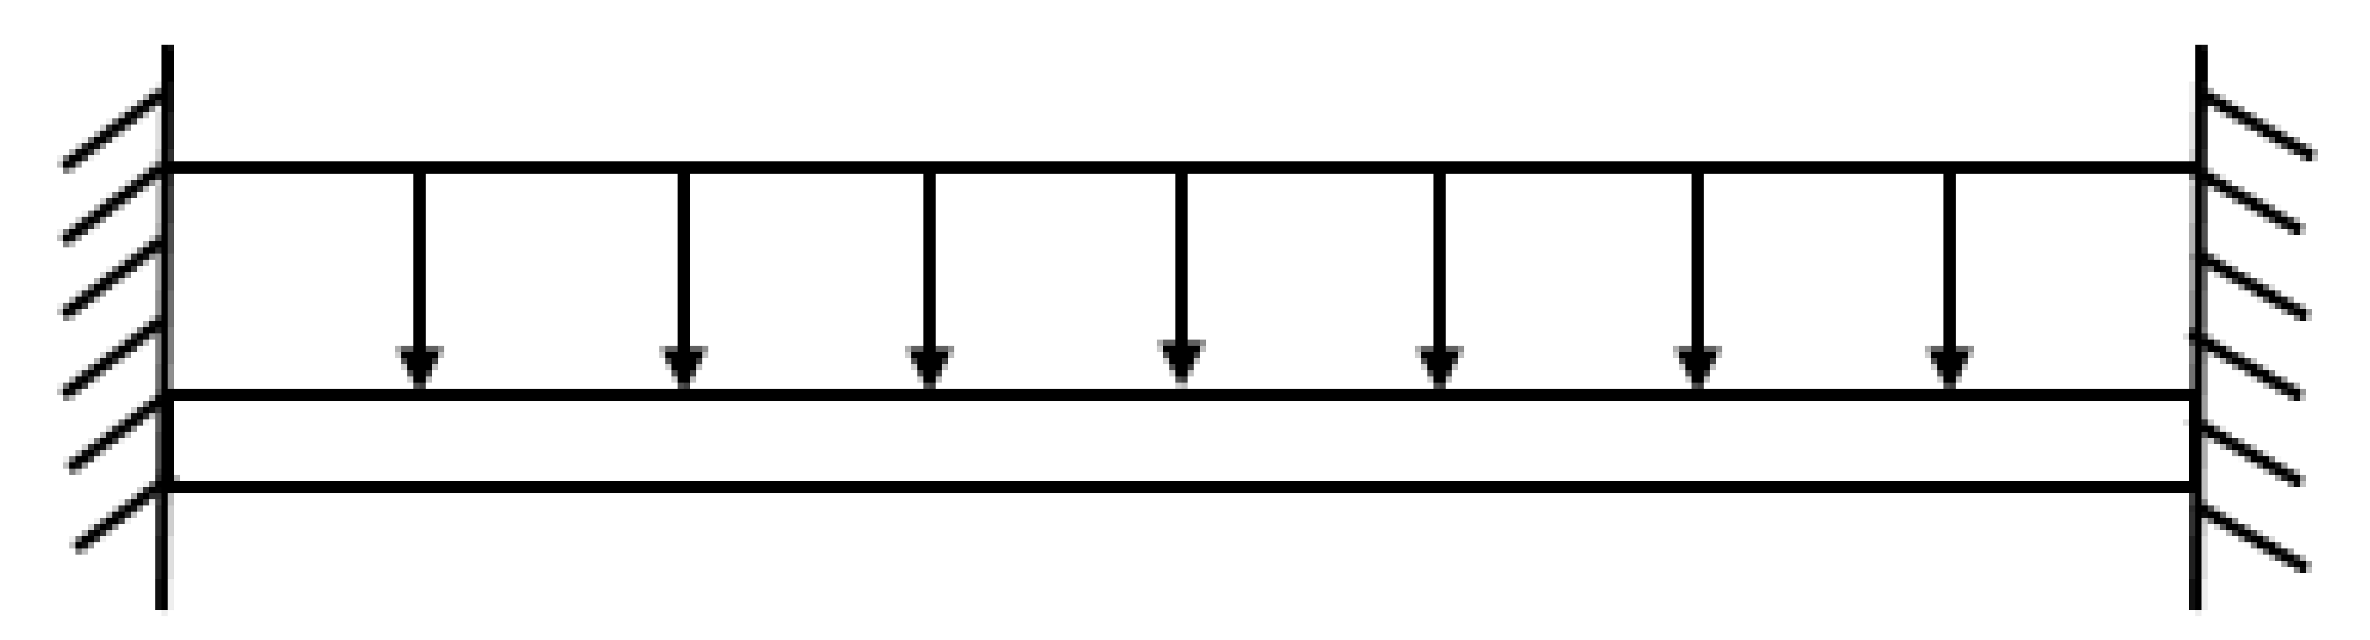
39], serves as the foundation for structural explosion-proof design and is extensively employed in the calculation of bending deformations of reinforced concrete structures under explosive loads. This model is derived based on an assumed deformation shape function and a fully elastic–plastic resistance function, which transforms the uniformly loaded beam into a concentrated mass–spring–load system. The dynamic equation governing the equivalent SDOF model can be expressed as follows:
M e u e t + C e u e t + R e u e t = F e ( t )
K m M c u e t + K L R e u e t = K L F c ( t )
where M e is the equivalent structural mass, F e ( t ) is the total load acting on the structure after equivalence, M c is the real mass of the structure, F c is the real total load acting on the structure, K m is the equivalent mass coefficient, K L is the equivalent load coefficient, C e = ξ C c r   is the viscous damping coefficient of the component, ξ is the damping rate, C c r is the critical damping constant, and R e is the resistance function. Damping is neglected as successive loading cycles are not considered. In fact, the first peak displacement represents the most critical case, as the structure is unlikely to collapse after unloading [40].
K L = 0 L p ( x ) u ( x ) d x 0 L p ( x ) d x
K m = 0 L m ( x ) u 2 ( x ) d x 0 L m ( x ) d x
where m x is the mass per unit length of the component, u ( x ) is the deformation shape function of the component under the action of explosion load, p x   is the explosion dynamic load borne by the component, and L is the length of the component. The following parameters, shown in Table 9, are used to solve the problem.
In this paper, the trilinear resistance equation is used, as shown in Figure 17. Ke = 384EI, Kp = 384EI/5. The Newmark-β method is used to solve the equation.

4.2. Displacement Verification

Since the subsequent sections will analyze the dynamic response of the RC column, the displacement data from the numerical simulation are verified against both the SDOF method and the test results. However, due to the lack of displacement measurements in the current experiment, displacement data from Shi’s experimental study were compared with the numerical simulation (which employed the same material parameters as this study). The comparison results are shown in Figure 18.

4.3. Parameter Analysis of Dynamic Response of RC Columns

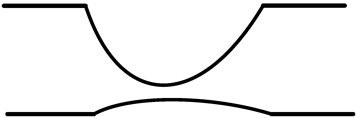
Using the aforementioned finite element model and parametric analysis method, this study further investigates the effects of cross-sectional dimensions, longitudinal reinforcement ratio, blast location, and axial compression on the dynamic response of RC columns under blast loading. The ranges of parameters considered in the parametric analysis of this section are provided. In this section, the clear span of all columns is consistently set as 1.5 m. The specific conditions are shown in Table 10.
The section size of the reference condition is 300 mm × 300 mm, the axial compression is 432 kN, the net span of the column is 1500 mm, the axial compressive strength of concrete is f c = 40   MPa , the longitudinal reinforcement ratio is ρ = 0.016 , and the stirrup ratio is ρ = 0.01 .
Figure 19a gives the horizontal displacement–time history of the midpoint of the RC column under the same explosive load when the section sizes are 200 mm × 200 mm, 300 mm × 300 mm, and 400 mm × 400 mm, respectively. It can be observed from the diagram that as the section size of the RC column increases, the maximum horizontal displacement and residual displacement at the column’s midpoint are significantly reduced. This result aligns with physical expectations, as increasing the cross-sectional size enhances the column’s bending and shear stiffness, thereby reducing the maximum horizontal displacement during loading.
Figure 19b gives the horizontal displacement–time history curve of the middle point of the RC column under the same explosive load when the reinforcement ratio is 1%, 1.6%, and 2%, respectively. This revision maintains the original meaning while improving readability and technical accuracy. If residual displacement behavior is a critical point, consider adding experimental data or a separate clause to explain its relationship with the reinforcement ratio explicitly.
Figure 19c shows the horizontal displacement–time history curves of the middle point of the RC column under the same explosion load when the proportional distance is 0.48 m/kg1/3, 0.5 m/kg1/3, 0.55 m/kg1/3, and 0.6 m/kg1/3, respectively. The experimental results depicted in the figure demonstrate an inverse correlation between the proportional distance parameter and the maximum horizontal displacement at the column’s midspan.
Figure 19d shows the horizontal displacement–time history curves of the middle point of the RC columns with axial compression of 216 kN, 432 kN, 648 kN, and 864 kN under the same explosive load. It can be seen from the diagram that with the increase in axial pressure, the maximum horizontal displacement of the midpoint of the column decreases, but the decrease rate decreases significantly. This result is in line with the objective situation, because the appropriate axial compression can increase the bending stiffness of the column, but to a certain extent, it will lead to serious damage in the concrete compression zone.
Figure 19e gives the horizontal displacement–time history curve of the middle point of the RC column under the same explosion load when the explosion position is 0 mm, 250 mm, and 500 mm away from the center explosion distance, respectively. It can be observed from the figure that the maximum horizontal displacement of the column’s midpoint decreases significantly as the distance between the explosion position and the center of the RC column increases. This result aligns with physical expectations: when the explosion occurs closer to the column’s base, the effective span of the corner region is reduced, leading to smaller displacements. The rotational behavior of the column was quantified using calculated rotation angles of 0.063, 0.075, and 0.1, corresponding to increasing explosion distances. These values indicate that the column’s rotation angle increases significantly as the explosion position moves farther from the column’s center. This trend matches observed structural behavior, as greater explosion distances create larger rotational moments due to increased lever-arm effects.
The failure criterion for the dynamic response of RC columns cannot be determined solely through maximum displacement. As shown in the previous section, while the maximum displacement decreases as the explosion position changes, the damage level does not reduce. Since the bearing rotation angle is a dimensionless parameter based on peak deformation and span length, this study adopts the maximum bearing rotation angle to assess damage severity, as it provides a more consistent evaluation criterion. The maximum bearing rotation angle is calculated using Formula (4) in this study.
θ = arctan   ( x m a x l m i n )
In the equation, l m i n   denotes the distance from the peak displacement point to the nearest support (for central blast conditions, l m i n is equivalent to half of the span), while x m a x represents the maximum peak displacement of the structure subjected to blast loading, as shown in Figure 20.
According to the UFC 3-340-02 [39] specification, the damage grade of the bending member is divided into the following: 0° < θ < 2°, mild damage; 2° < θ < 6°, moderate damage; 6° < θ < 12°, severe damage. The structural damage corresponding to the angle is shown in Table 11. The ACI mainly defines structural damage by describing the lateral deformation of the structure. Since the explosion load is not regulated, the seismic load is used for reference, and the limit value of the normal use limit state is converted to an angle of 1.75~2.29°; this is consistent with the mild damage range.
By applying the least squares method to analyze the displacement data illustrated in Figure 19, displacement function fitting was performed. Both independent and dependent variables underwent dimensionless normalization. Due to the presence of blast-induced displacements, the dependent variable employs the maximum support rotation ( θ m a x ) as the governing parameter. The predictive equation for maximum support rotation is formulated as follows:
θ m a x = exp   ( 2.5028 × S 300 0.3309 × N 432 0.8679 × P 0.6029 × ρ 0.016 5.7811 × Z 0.5 + 10.7413 )
where θ m a x   is the maximum support rotation angle; S is the section size (200 mm ≤ S ≤ 400 mm); N is axial compression (216 kN ≤ N ≤ 864 kN); P is the explosion position (0 ≤ P ≤ 500 mm); ρ is the longitudinal reinforcement ratio (0.01 ≤ ρ ≤ 0.02); Z is the explosive proportional distance (0.48 m/kg1/ ≤ 0.6 m/kg1/3). the damage degree of the component is judged by calculating the bearing rotation angle. The empirical formula of the rotation angle is verified by the Z1A2, Z4A2, and Z5A2 tests of Shi [12] and Wang’s SDOF calculation method. The results are shown in Table 12 below; it can be seen that the error is less than 20%.

5. Discussion

(1)
Scaled Distance Effects
Under the test conditions of a 1 kg charge mass, a 0.4 m standoff distance (scaled distance: 0.4 m/kg1/3), a 15% axial compression ratio, and a 25 cm eccentric detonation, the RC column exhibited no significant damage, demonstrating satisfactory blast resistance. When increasing the charge to 4 kg (scaled distance: 0.252 m/kg1/3) under identical axial compression and eccentricity, localized spalling occurred on both flanges. Further escalation to 6 kg (scaled distance: 0.22 m/kg1/3) induced severe diagonal shear failure characterized by through-thickness concrete cracking, resulting in substantial load-bearing capacity degradation. The damage progression follows a nonlinear growth pattern: the transition from 1 kg to 4 kg corresponds to minor-to-moderate damage, whereas the 4–6 kg increment triggers a critical failure threshold shift.
(2)
Axial Compression Effects
For a 6 kg charge (0.22 m/kg1/3 scaled distance) with 15% axial compression and 25 cm eccentricity, the RC column sustained severe diagonal shear failure accompanied by through-cracking. Maintaining identical blast parameters while increasing axial compression to 30% exacerbated damage severity without altering the failure mode. This demonstrates that axial compression amplification intensifies structural damage while preserving failure mechanism consistency.
(3)
Detonation Position Effects
For a 6 kg charge (0.22 m/kg1/3 scaled distance) at 15% axial compression with 50 cm eccentric detonation, shear failure predominated at the column base, featuring through-cracks propagating from the footing connection and causing pronounced capacity reduction. Spatial variation in the blast location modifies failure mechanisms, with detonations near support regions inducing more severe load-bearing deterioration.
(4)
Mesh Convergence Analysis
The Arbitrary Lagrangian–Eulerian (ALE) fluid–structure coupling method was employed for blast load simulation. Comparative analysis of 1 cm, 2 cm, and 3 cm mesh resolutions revealed a 32.9% peak pressure error for the 3 cm grid, while 1 cm and 2 cm grids exhibited comparable accuracy. Considering computational efficiency, a 2 cm mesh size was selected as optimal for subsequent analyses.
(5)
Parametric Sensitivity Assessment
The parametric analysis of RC columns under blast loading revealed that increasing the cross-sectional dimensions from 200 × 200 mm to 400 × 400 mm reduced the maximum lateral displacement by approximately 57%, while increasing the longitudinal reinforcement ratio from 1% to 2% decreased the peak displacement by 42%, though with diminishing returns beyond 1.6%. A 50 cm eccentricity in detonation location increased the rotation angle by 59% compared to central explosions, and raising the axial compression from 432 kN to 864 kN reduced the maximum displacement by 23%, although excessive compression beyond 648 kN induced premature concrete crushing.
(6)
Failure Mode Characterization
RC columns under blast loading exhibited three primary failure mechanisms: flexural failure, shear failure (direct shear at supports or diagonal shear in shear spans), and combined flexural–shear failure. This study demonstrates that eccentric detonation locations and elevated axial compression significantly amplify shear-dominated failure tendencies.

6. Conclusions

Based on field blast tests and numerical simulation results, this paper analyzes the blast resistance of RC columns and investigates their dynamic response and failure modes under blast loading.
The main conclusions are as follows:
(1)
Based on field blast test results, the effects of axial compression, explosive position, and equivalent charge on RC columns under blast loading were analyzed. The results indicated that when the explosive position is closer to the column base, the structural failure mode becomes closer to shear failure.
(2)
Field blast tests were conducted on six scaled-down RC columns. The results demonstrated that the RC columns exhibited excellent blast resistance. At a scaled distance of 0.4 m/kg1/3, no significant damage was observed in the RC columns. When the scaled distance decreased to 0.252 m/kg1/3, local spalling occurred on both sides of the column surface without apparent structural failure. At a scaled distance of 0.22 m/kg1/3, flexural–shear failure occurred in the RC column under an explosive eccentricity of 0.25 m, while shear failure at the column base was observed under an explosive eccentricity of 0.5 m. Additionally, axial compression was shown to significantly exacerbate the damage severity.
(3)
Numerical simulations were employed to investigate the damage patterns and dynamic responses of RC columns under blast loading. The results revealed that a 2 cm mesh size was determined as the optimal grid resolution for computational efficiency. Cross-sectional dimensions exhibited the most significant influence on structural dynamic response. The effect of axial compression on the dynamic response initially increased and then decreased, while the explosive position primarily governed different failure modes. Under blast loading, RC column failure modes were categorized into two types: shear failure and flexural failure. Eccentric blast loads and axial compression were found to markedly increase the propensity for shear failure.
(4)
Based on dynamic analysis results from numerical simulations, an empirical formula for predicting the maximum support rotation angle was developed using the least squares method. This provides a quantitative basis for the damage assessment of RC columns.
This study establishes a prediction formula for determining the P-I curves of arbitrary reinforced concrete rectangular columns using the least squares fitting method, providing a theoretical basis for practical applications. It reveals that explosions closer to the column base are more likely to induce shear failure, offering foundational insights for blast protection. However, the research primarily focuses on the blast resistance performance of reinforced concrete columns under close-range explosions, while long-distance explosions require further investigation. Given the complexity and diversity of explosion-related issues, the following aspects warrant continued attention in subsequent studies:
(1)
This study adopts external airburst scenarios as the preset research conditions. It should be emphasized that although implementing protective measures can effectively mitigate terrorist attack risks targeting critical infrastructure and their internal spaces, non-negligible explosive threats persist in real-world security environments. Examples include the dynamic response characteristics and damage evolution mechanisms of reinforced concrete columns under internal building explosion loads.
(2)
The research solely investigates the damage and failure of individual structural components without analyzing the progressive collapse of reinforced concrete frame structures under blast loads. In reality, however, the failure of single components often triggers chain collapse in many structures.

Author Contributions

S.S.: writing—original draft preparation; R.Z., W.W. and C.Y.: writing—review and editing. All authors have read and agreed to the published version of the manuscript.

Funding

This research received no external funding.

Data Availability Statement

All relevant data are within the manuscript.

Conflicts of Interest

The authors declare no conflict of interest.

References

  1. Little, R.G. Protecting People in Buildings from Terrorist Attack. J. Perform. Constr. Facil. 2004, 18, 66–67. [Google Scholar] [CrossRef]
  2. Bailly, P.; Brossard, J. Effect of a Blast Wave on a Structure. Vib. Chocs. Colloq Int. Part 1 1986, 1986, 73–76. [Google Scholar]
  3. Wang, W.; Zhang, D.; Lu, F.; Wang, S.-C.; Tang, F. A new non-uniform blast load model for SDOF method of one-way reinforced concrete slab. EPJ Web Conf. 2012, 26, 04016. [Google Scholar] [CrossRef]
  4. Wu, K.C.; Li, B.; Tsai, K.C. Residual axial compression capacity of localized blast-damaged RC columns. Int. J. Impact Eng. 2011, 38, 29–40. [Google Scholar] [CrossRef]
  5. Ozturk, B. Seismic behavior of two monumental buildings in historical Cappadocia region of Turkey. Bull. Earthq. Eng. 2017, 15, 3103–3123. [Google Scholar] [CrossRef]
  6. Gholipour, G.; Zhang, C.; Mousavi, A.A. Numerical analysis of axially loaded RC columns subjected to the combination of impact and blast loads. Eng. Struct. 2020, 219, 110924. [Google Scholar] [CrossRef]
  7. Dua, A.; Braimah, A.; Kumar, M. Experimental and numerical investigation of rectangular reinforced concrete columns under contact explosion effects. Eng. Struct. 2020, 205, 109891. [Google Scholar] [CrossRef]
  8. Wang, W.; Song, X.; Yang, J.; Liu, F.; Gao, W. Experimental and numerical research on the effect of ogive-nose projectile penetrating UR50 ultra-early-strength concrete. Cem. Concr. Compos. 2023, 136, 104902. [Google Scholar] [CrossRef]
  9. Wang, W.; Huo, Q.; Yang, J.-C.; Wang, J.-H.; Wang, X. Experimental investigation of ultra-early-strength cement-based self-compacting high strength concrete slabs (URCS) under contact explosions. Def. Technol. 2023, 24, 326–339. [Google Scholar] [CrossRef]
  10. Fujikura, S.; Bruneau, M.; Lopez-Garcia, D. Experimental Investigation of Multihazard Resistant Bridge Piers Having Concrete-Filled Steel Tube under Blast Loading. J. Bridge Eng. 2008, 13, 586–594. [Google Scholar] [CrossRef]
  11. Yuan, S.; Hao, H.; Zong, Z.; Li, J. A study of RC bridge columns under contact explosion. Int. J. Impact Eng. 2017, 109, 378–390. [Google Scholar] [CrossRef]
  12. Shi, Y.; Hu, Y.; Chen, L.; Li, Z.-X.; Xiang, H. Experimental investigation into the close-in blast performance of RC columns with axial loading. Eng. Struct. 2022, 268, 114688. [Google Scholar] [CrossRef]
  13. Zhang, W.; Mao, J.; Zhou, B.; Yu, X.; Hu, F.; Wang, L.; Luo, D.; Mu, C. The impacts of contact explosions on ultra-high performance reinforced concrete slabs: Experimental study and dimensional analysis. Sci. Rep. 2024, 14, 25700. [Google Scholar] [CrossRef] [PubMed]
  14. Li, J.; Wu, C.; Hao, H. Residual Loading Capacity of Ultra-High Performance Concrete Columns After Blast Loads. Int. J. Prot. Struct. 2015, 6, 649–669. [Google Scholar] [CrossRef]
  15. Burrell, R.P.; Aoude, H.; Saatcioglu, M. Response of SFRC Columns under Blast Loads. J. Struct. Eng. 2015, 141, 04014209. [Google Scholar] [CrossRef]
  16. Hu, Y.; Chen, L.; Fang, Q.; Kong, X.; Shi, Y.; Cui, J. Study of CFRP retrofitted RC column under close-in explosion. Eng. Struct. 2021, 227, 111431. [Google Scholar] [CrossRef]
  17. Bao, X.; Li, B. Residual strength of blast damaged reinforced concrete columns. Int. J. Impact Eng. 2010, 37, 295–308. [Google Scholar] [CrossRef]
  18. Liu, Y.; Yan, J.; Li, Z.; Huang, F. Improved SDOF and numerical approach to study the dynamic response of reinforced concrete columns subjected to close-in blast loading. Structures 2019, 22, 341–365. [Google Scholar] [CrossRef]
  19. Yao, S.J.; Zhang, D.; Lu, F.Y.; Wang, W.; Chen, X.G. Damage features and dynamic response of RC beams under blast. Eng. Fail. Anal. 2016, 62, 103–111. [Google Scholar] [CrossRef]
  20. Wang, H.; Wang, Z.; Wang, J.; Wang, S.; Wang, H.; Yin, Y.; Li, F. Effect of confining pressure on damage accumulation of rock under repeated blast loading. Int. J. Impact Eng. 2021, 156, 103961. [Google Scholar] [CrossRef]
  21. Do, T.V.; Pham, T.M.; Hao, H. Numerical investigation of the behavior of precast concrete segmental columns subjected to vehicle collision. Eng. Struct. 2018, 156, 375–393. [Google Scholar] [CrossRef]
  22. Williamson, E.B.; Bayrak, O.; Davis, C.; Daniel Williams, G. Performance of bridge columns subjected to blast loads: Results and recommendations. J. Bridge Eng. 2011, 16, 703–710. [Google Scholar] [CrossRef]
  23. Fujikura, S.; Bruneau, M. Experimental investigation of seismically resistant bridge piers under blast loading. J. Bridge Eng. 2010, 16, 63–71. [Google Scholar] [CrossRef]
  24. Saatcioglu, M.; Ozbakkaloglu, T.; Naumoski, N.; Lloyd, A. Response of earthquake-resistant reinforced-concrete buildings to blast loading. Can. J. Civ. Eng. 2009, 36, 1378–1390. [Google Scholar] [CrossRef]
  25. Kyei, C.; Braimah, A. Effects of transverse reinforcement spacing on the response of reinforced concrete columns subjected to blast loading. Eng. Struct. 2017, 142, 148–164. [Google Scholar] [CrossRef]
  26. GB 50010-2010; RC Columns. Code for Design of Concrete Structures. China Architecture & Building Press: Beijing, China, 2010.
  27. JGJ 3-2010; Technical Specification for Concrete Structures of Tall Buildings. China Architecture & Building Press: Beijing, China, 2010.
  28. GB 50080-2016; Chinese Academy of Architectural Research. Standard for Performance Test Method of Ordinary Concrete Mixture. China Building Industry Press: Beijing, China, 2014.
  29. Zhang, Z.; Wang, X.; Deng, Y. Dynamic response of square recycled aggregate concrete-filled steel tube columns subjected to close-range blast loads. J. Build. Eng. 2022, 52, 104427. [Google Scholar] [CrossRef]
  30. GB 6722-2014; China Engineering Blasting Association. Safety Regulations for Blasting. SAC: Beijing, China, 2014.
  31. Hu, Y.; Chen, L.; Fang, Q.; Xiang, H. Blast loading model of the RC column under close-in explosion induced by the double-end-initiation explosive cylinder. Eng. Struct. 2018, 175, 304–321. [Google Scholar] [CrossRef]
  32. Borrvall, D.T. The RHT Concrete Model in Ls-DYNA. In Proceedings of the 8th European LS-DYNA User Conference, Strasbourg, France, 23–24 May 2011. [Google Scholar]
  33. Xie, L.X.; Lu, W.B.; Zhang, Q.B.; Jiang, Q.H.; Chen, M.; Zhao, J. Analysis of damage mechanisms and optimization of cut blasting design under high in-situ stresses. Tunn. Undergr. Space Technol. 2017, 66, 19–33. [Google Scholar] [CrossRef]
  34. Dawood, H.; Elgawady, M.; Hewes, J. Factors affecting the seismic behavior of segmental precast bridge columns. Front. Struct. Civ. Eng. 2014, 8, 388–398. [Google Scholar] [CrossRef]
  35. Wang, W.; Zhang, D.; Lu, F.Y.; Tang, F.J.; Wang, S.C. Anti-explosion performances of square reinforced concrete slabs under close-in explosions. Explos. Shock Waves 2012, 32, 251–258. [Google Scholar]
  36. Sogut, K.; Dirar, S.; Theofanous, M.; Faramarzi, A.; Nayak, A.N. Effect of transverse and longitudinal reinforcement ratios on the behaviour of RC T-beams shear strengthened with embedded FRP BARS. Compos. Struct. 2021, 262, 113622. [Google Scholar] [CrossRef]
  37. Dirar, S.; Caro, M.; Sogut, K.; Quinn, A. Experimental behaviour, FE modelling and design of large-scale reinforced concrete deep beams shear-strengthened with embedded fibre reinforced polymer bars. Structures 2024, 67, 106938. [Google Scholar] [CrossRef]
  38. Dirar, S.; Sogut, K.; Caro, M.; Rahman, R.; Theofanous, M.; Faramarzi, A. Effect of shear span-to-effective depth ratio and FRP material type on the behaviour of RC T-beams strengthened in shear with embedded FRP bars. Eng. Struct. 2025, 332, 120105. [Google Scholar] [CrossRef]
  39. UFC 3-340-02; Structures to Resist the Effects of Accidental Explosions. U.S. Army Corps of Engineers: Washington, DC, USA, 2008.
  40. Riedel, W.; Fischer, K.; Kranzer, C.; Erskine, J.; Cleave, R.; Hadden, D.; Romani, M. Modeling and validation of a wall-window retrofit system under blast loading. Eng. Struct. 2012, 37, 235–245. [Google Scholar] [CrossRef]
Figure 1. Section style.
Buildings 15 01898 g001
Figure 2. Structural design drawing.
Buildings 15 01898 g002
Figure 3. Material performance test.
Buildings 15 01898 g003
Figure 4. Testing arrangement.
Buildings 15 01898 g004
Figure 5. Sensor arrangement.
Buildings 15 01898 g005
Figure 6. Explosive parameters and arrangement.
Buildings 15 01898 g006
Figure 7. Definition of d.
Buildings 15 01898 g007
Figure 8. Reflected overpressure time histories.
Buildings 15 01898 g008aBuildings 15 01898 g008b
Figure 9. Overpressure fit.
Buildings 15 01898 g009
Figure 10. Overall damage of RC columns under various blast scenarios.
Buildings 15 01898 g010aBuildings 15 01898 g010b
Figure 11. Residual bearing capacity axial compression test.
Buildings 15 01898 g011
Figure 12. The test simulation diagram.
Buildings 15 01898 g012
Figure 13. Analysis of overpressure.
Buildings 15 01898 g013
Figure 14. Simulation Damage verification. (a) A2 Test; (b) A2 Simulation; (c) A3 Test; (d) A3 Simulation; (e) Wu [4] Test; (f) Simulation; (g) Shi [12] Test; (h) Simulation.
Buildings 15 01898 g014
Figure 15. Damage process of eccentric explosion in lower column.
Buildings 15 01898 g015
Figure 16. Damage diagram of different charge positions.
Buildings 15 01898 g016
Figure 17. Trilinear resistance function.
Buildings 15 01898 g017
Figure 18. Simulation verification.
Buildings 15 01898 g018
Figure 19. Displacement–time history. (a) Displacement–time history of different section sizes. (b) Displacement–time history of columns with different reinforcement ratios. (c) Displacement–time history of columns with different scale distances. (d) Displacement–time history of different axial compression columns. (e) Displacement–time history of the column at different explosion positions.
Buildings 15 01898 g019aBuildings 15 01898 g019b
Figure 20. Residual capacity test time history.
Buildings 15 01898 g020
Table 1. Reinforcement parameters.
ModelYield Strength (MPa)Average Yield Strength (MPa)Ultimate Tensile Strength (MPa)Average Ultimate Strength (MPa)
HRB400447.37447.78621.59622.52
447.82622.06
448.14623.91
HRB335385.22388.35511.15515.67
388.15517.21
391.69518.66
Table 2. Concrete parameters.
ModelAxial Force (kN)Average Axial Force (kN)Compressive Strength (MPa)Average Compressive Strength (MPa)
C40-1904.3911.7740.240.53
C40-2924.341.1
C40-3906.740.3
Table 3. Test conditions.
NumberSection Size (mm × mm)d (mm)u (%)Scale Distance Z (m/kg1/3)
A1200 mm × 200 mm500150.45
A2150.284
A3150.248
A4300.248
A5250150.248
A6750150.248
Table 4. Parameters of test materials for Shi and Wu.
TextClear Span (mm)Width (mm)Length (mm)Ratio of Reinforcement (%)Stirrup Ratio (%)Reinforcement Strength (MPa)
Shi30002502502.430.5426
Concrete cube strength (MPa)Elastic modulus of reinforcement (GPa)Elastic modulus of concrete (GPa)
42.516343
WuClear span (mm)Width (mm)Length (mm)Ratio of reinforcement (%)Stirrup ratio (%)Reinforcement strength (MPa)
24004004001.572.1420
Concrete cube strength (MPa)
40
Table 5. Explosive state equation parameters.
ρ / ( g c m 3 ) A   ( 1 0 2   G P a ) B   ( G P a ) R 1 R 2
1.6103.7120.03234.150.95
w E 0 ( M J / K g ) V
0.37.01.00
Table 6. Air material parameters.
ρ / ( g c m 3 ) e 0   ( 1 0 5 kJ / kg ) γ
1.2932.0681.4
Table 7. RHT concrete material parameters.
ρ / ( g c m 3 ) G / MPa f c / MPa ε f b 0
2.4420704021.22
b 1 t1/MPaan f s *
1.2235001.60.610.48
f t * q0bt2
0.070.68050.01050
Table 8. Steel reinforcement material parameters.
ρ / ( kg m 3 ) E / GPa ν σ / MPa E t / MPa f s
78002070.340011000.092
Table 9. K L , K m ,   K L M value.
Boundary Conditions and Load FormsPhase
Equivalent   Mass   Factor   K m
Equivalent   Mass   Factor   K L
Equivalent   Mass   Load   Factor   K L M
Buildings 15 01898 i001Elasticity0.410.530.77
Elastoplastic0.500.640.78
Plasticity0.330.500.66
Table 10. Finite element model operating conditions.
Section Size (mm × mm)Longitudinal Reinforcement Ratio (%)d (mm)Axial Compression (kN)Scale Distance
200   ×   200 102160.6
300   ×   300 1.62504320.55
400   ×   400 25006480.5
8640.48
Table 11. Damage table corresponding to different rotation angles.
Visual Damage SeverityManifestationRotation AngleDamage Classification
Buildings 15 01898 i002The concrete on the side of the column falls off.θ < 2%mild damage
Buildings 15 01898 i003There are obvious craters in the middle of the column.2% < θ < 6%moderate damage
Buildings 15 01898 i004The blasting pit on the front blasting surface is large, the longitudinal reinforcement is exposed in a large area, and the concrete in the central area of the back blasting surface falls off.6% < θ < 12%severe damage
Table 12. Rotation angle prediction.
Test Experimental   Value   θ m a x   ( X ° ) Predicted Value
θ m a x   ( X ° )
Wang [3] Calculated ValueError (%)
Z1A20.4770.4720.4811.050.84
Z2A24.1943.7843.5219.7816.05
Z4A24.9534.7694.5394.398.36
Disclaimer/Publisher’s Note: The statements, opinions and data contained in all publications are solely those of the individual author(s) and contributor(s) and not of MDPI and/or the editor(s). MDPI and/or the editor(s) disclaim responsibility for any injury to people or property resulting from any ideas, methods, instructions or products referred to in the content.

