Article

Development and Performance of Coconut Fibre Gypsum Composites for Sustainable Building Materials

by
María Fernanda Rodríguez-Robalino
,
Daniel Ferrández
*,
Amparo Verdú-Vázquez
and
Alicia Zaragoza-Benzal
Departamento de Tecnología de la Edificación, Universidad Politécnica de Madrid, Avda. Juan de Herrera, 6, 28040 Madrid, Spain
*
Author to whom correspondence should be addressed.
Buildings 2025, 15(11), 1899; https://doi.org/10.3390/buildings15111899
Submission received: 1 May 2025 / Revised: 23 May 2025 / Accepted: 27 May 2025 / Published: 30 May 2025
(This article belongs to the Collection Sustainable and Green Construction Materials)

Abstract

In 2022, the building sector accounted for 30% of global energy demand and 27% of CO2 emissions, of which approximately 9% came from building material production. To mitigate this impact, it is critical to develop sustainable alternatives that reduce the environmental footprint of construction materials. This paper presents an original study where the effect of coconut fibre as a reinforcing material in gypsum composites is analysed. These plant-based fibres reduce the composite’s density, improve thermal behaviour, and integrate circular economy criteria in construction. In this way, a physico-mechanical characterisation of these novel gypsum-based composites is addressed, and their potential application for developing prefabricated slabs is innovatively explored. Composites were prepared with coconut fibre incorporation in volume up to 17.5%, and mechanical and thermal properties and their behaviour under water action were evaluated. The results indicate that the fibre addition reduced density by about 10.0%, improved flexural strength by 20.5% and compressive strength by 28.4%, and decreased thermal conductivity by 56.3%, which increased the energy efficiency of the building facade by 7.8%. In addition, hydrophobic properties improved, reducing capillary absorption by 15.9% and open porosity by 3.3%. These findings confirm the technical feasibility of coconut fibre-reinforced plaster for application in prefabricated wall and ceiling elements, promoting the efficient use of natural resources and driving the development of sustainable building materials.

1. Introduction

The building sector is one of the largest consumers of natural resources and producers of greenhouse gas emissions worldwide. In 2022, buildings accounted for 30% of the final energy demand, mainly for operational needs such as heating and cooling. When including the energy required to produce building materials, this figure increased to 34%, representing a growth in energy demand in the sector of just over 1% per year [1,2].
Emissions related to energy demand in buildings accounted for about 27% of global CO2 emissions [3], of which 7% to 9% come from manufacturing building materials (cement, steel, aluminium, glass, bricks). Emissions from embodied carbon in building materials contribute about 11% of all global carbon emissions [4], accounting for about 50% of total emissions in new buildings. Overall, CO2 emissions from building operations and construction reached new highs in 2022, accounting for 37% of total global CO2 emissions [1].
Sustainable construction has been promoted in response to the environmental impact and resource depletion caused by the building sector. General strategies include optimising material use, searching for sustainable materials, implementing design techniques that improve building energy efficiency, and adopting technologies that promote resource efficiency and reduce greenhouse gas (GHG) emissions during the construction and operation phase [5,6].
Material-use efficiency helps reduce overall demand and minimise the need for emissions-intensive production. These actions extend the product lifespan by covering the entire supply chain, from extraction to recycling. These strategies promote a greener life cycle for buildings, from materials selection to eventual dismantling [7].
This approach has driven the growth of materials derived from renewable raw materials. The green building materials market has experienced remarkable growth, estimated at approximately USD 298.52 billion by 2025 [8]. Bio-based materials derived from renewable and organic resources, such as plant biomass (bamboo, coconut, typha, etc.) and agricultural biomass (crop residues and by-products), represent a viable and sustainable alternative to conventional construction methods. Their use supports the decarbonisation of construction and promotes circularity in resource use. Studies indicate that the annual biomass supply exceeds the sector’s demand, reinforcing its viability. In addition, the recovery of forestry and agricultural by-products reduces forest fires and crop burning [9].
One material that is environmentally favourable due to its low carbon footprint and ability to reuse industrial waste is gypsum [10]. Spain ranks fourth worldwide in production, with an area of 21,700 km2 of exploitable mineral deposits [11]. In construction, gypsum is mainly used as a binder, interior finishing material, prefabricated boards for partitions and acoustic insulation, and self-levelling floors [10,12,13]. In addition, it stands out for its excellent fire resistance, good workability, aesthetic qualities, low density, volumetric stability, thermal resistance, easy fabrication and low cost [10,13,14].
Despite its many advantages, gypsum has some weaknesses, such as brittleness and low tensile strength, which can compromise its durability and structural performance, thus limiting its applicability [15]. The chemical structure of gypsum, which confers its fire resistance through two endothermic dehydration reactions upon heating, is affected when the material is first converted to hemi-hydrated gypsum (≈128 °C) and then to anhydrous gypsum (>300 °C) [16]. Once gypsum has fully reverted to its anhydrous form due to the complete loss of chemically bound water, it loses its ability to provide thermal protection, which leads to decomposition and cracking [17].
To overcome the intrinsic limitations of gypsum, recent research has focused on optimising the incorporation of inorganic and organic aggregates into gypsum mixtures, evaluating their influence on its physical and mechanical properties. Inorganic aggregates offer advantages regarding fire resistance, while organic aggregates are lighter and more economical. On the other hand, inorganic lightweight aggregates, such as expanded perlite and vermiculite, and organic ones, such as recycled polystyrene, polyurethane foam, tire rubber, cork, palm fibres, hemp, and wood waste, improve thermal and acoustic properties in gypsum composites [10,18]. In recent years, the addition of inorganic and organic fibres as reinforcement in gypsum mixtures has been investigated to improve these composites’ physical and mechanical properties [17].
In this research, the Web of Science search engine was used with the following criteria:
ALL = ((“Gypsum*” OR “Plaster*”) AND (“Coconut” OR “Coco” OR “Coir”) OR (“Natural Fib*”) NOT “Cement”))
Only articles in English or Spanish were included, excluding those without access to the full text or whose application was not oriented to the construction field.
Table 1 summarises the studies conducted in the last decade on plasters with natural fibre addition. The analysis of these articles made it possible to select those studies that carried out tests similar to those contemplated in this research, thus establishing a robust comparative basis for validating the results. Among the fibres investigated, coconut fibre [19,20,21], date palm fibre [22], pineapple fibre [23], pine wood fibre [24], abaca fibre [25], sisal fibres [15,26], jute fibres [27], straw [28] and hemp [29] stand out.
Considering the background information reviewed, it was observed that no extensive studies on coconut fibre exist despite its promising performance in gypsum composites, particularly in improving mechanical properties. Coconut fibre also has massive availability, low cost, and favourable physicochemical characteristics.
Coconut fibre, an agricultural by-product widely available in tropical regions and traditionally used to manufacture carpets, brushes, and ropes, has begun to find new applications in the construction sector, specifically in producing composite materials. Its abundance, low cost, high tensile strength, durability, and high lignin content (37–42%) give it remarkable resistance to biodegradation and good absorption capacity [20,30].
In 2019, global coconut production reached approximately 62 million tons, generating about 20 million tons of shells and thus a theoretical potential of 6 million tons of coconut fibre. The Food and Agriculture Organisation of the United Nations estimated that coconut fibre production in 2019 was approximately 1.26 million tons globally. These data show that large quantities of coconut fibre remain unused, as only a fraction of the available husks are processed in coconut fibre mills [30].
By integrating coconut fibre with gypsum, the aim is to take advantage of this fibre’s mechanical and insulation properties to improve the characteristics of building panels. The resulting composites can potentially improve mechanical properties such as compressive strength, flexural strength, and overall durability of the material [27]. In addition, coir fibre offers excellent thermal and acoustic insulation, attributes that are particularly attractive for improving the energy efficiency of buildings [19].
However, challenges remain related to coconut fibre’s hydrophilic nature. This makes it prone to moisture degradation, limiting its applicability in large volumes without proper treatment [20]. Despite these difficulties, the combination of coconut fibre with gypsum is being evaluated as a viable option for the construction of more durable and sustainable partition panels and false ceiling slabs [30].
Despite the growing interest in bio-based materials and using natural fibres in construction composites, no specific literature has been found on incorporating coconut fibre in plaster. This study seeks to evaluate the physical and mechanical properties of plaster composites reinforced with coconut fibre coco (P-CF) and explore its feasibility as a sustainable building material, focusing on its use for prefabricated wall and roof panels. Thus, it will contribute to reducing dependence on non-renewable resources and improving the efficiency of building systems.

2. Materials and Methods

This section describes the raw materials used in preparing the plaster composite under study, the dosages used, and the experimental programme carried out.

2.1. Materials

The materials used for this work include plaster, water, and coconut fibres.

2.1.1. Binder

The binder material used in this study is IBERYOLA E-35 plaster, produced by Saint-Gobain Placo Ibérica S.A. (Madrid, Spain) [31]. It is classified as type A (classification for construction plasters) according to UNE-EN 13279-1:2009 [32]. It is a gypsum-based conglomerate, consisting mainly of natural semi-hydrate calcium sulphate. This material is used primarily in decorative works, executing prefabricated elements, and finishing. The material properties provided by the manufacturer are detailed in Table 2.

2.1.2. Water

Drinking water from Canal de Isabel II (Madrid, Spain) was used. This water complies with Council Directive 98/83/EC [33], which guarantees its suitability for use in building materials. The water used has been effectively applied in previous studies [29] and is characterised in Table 3.

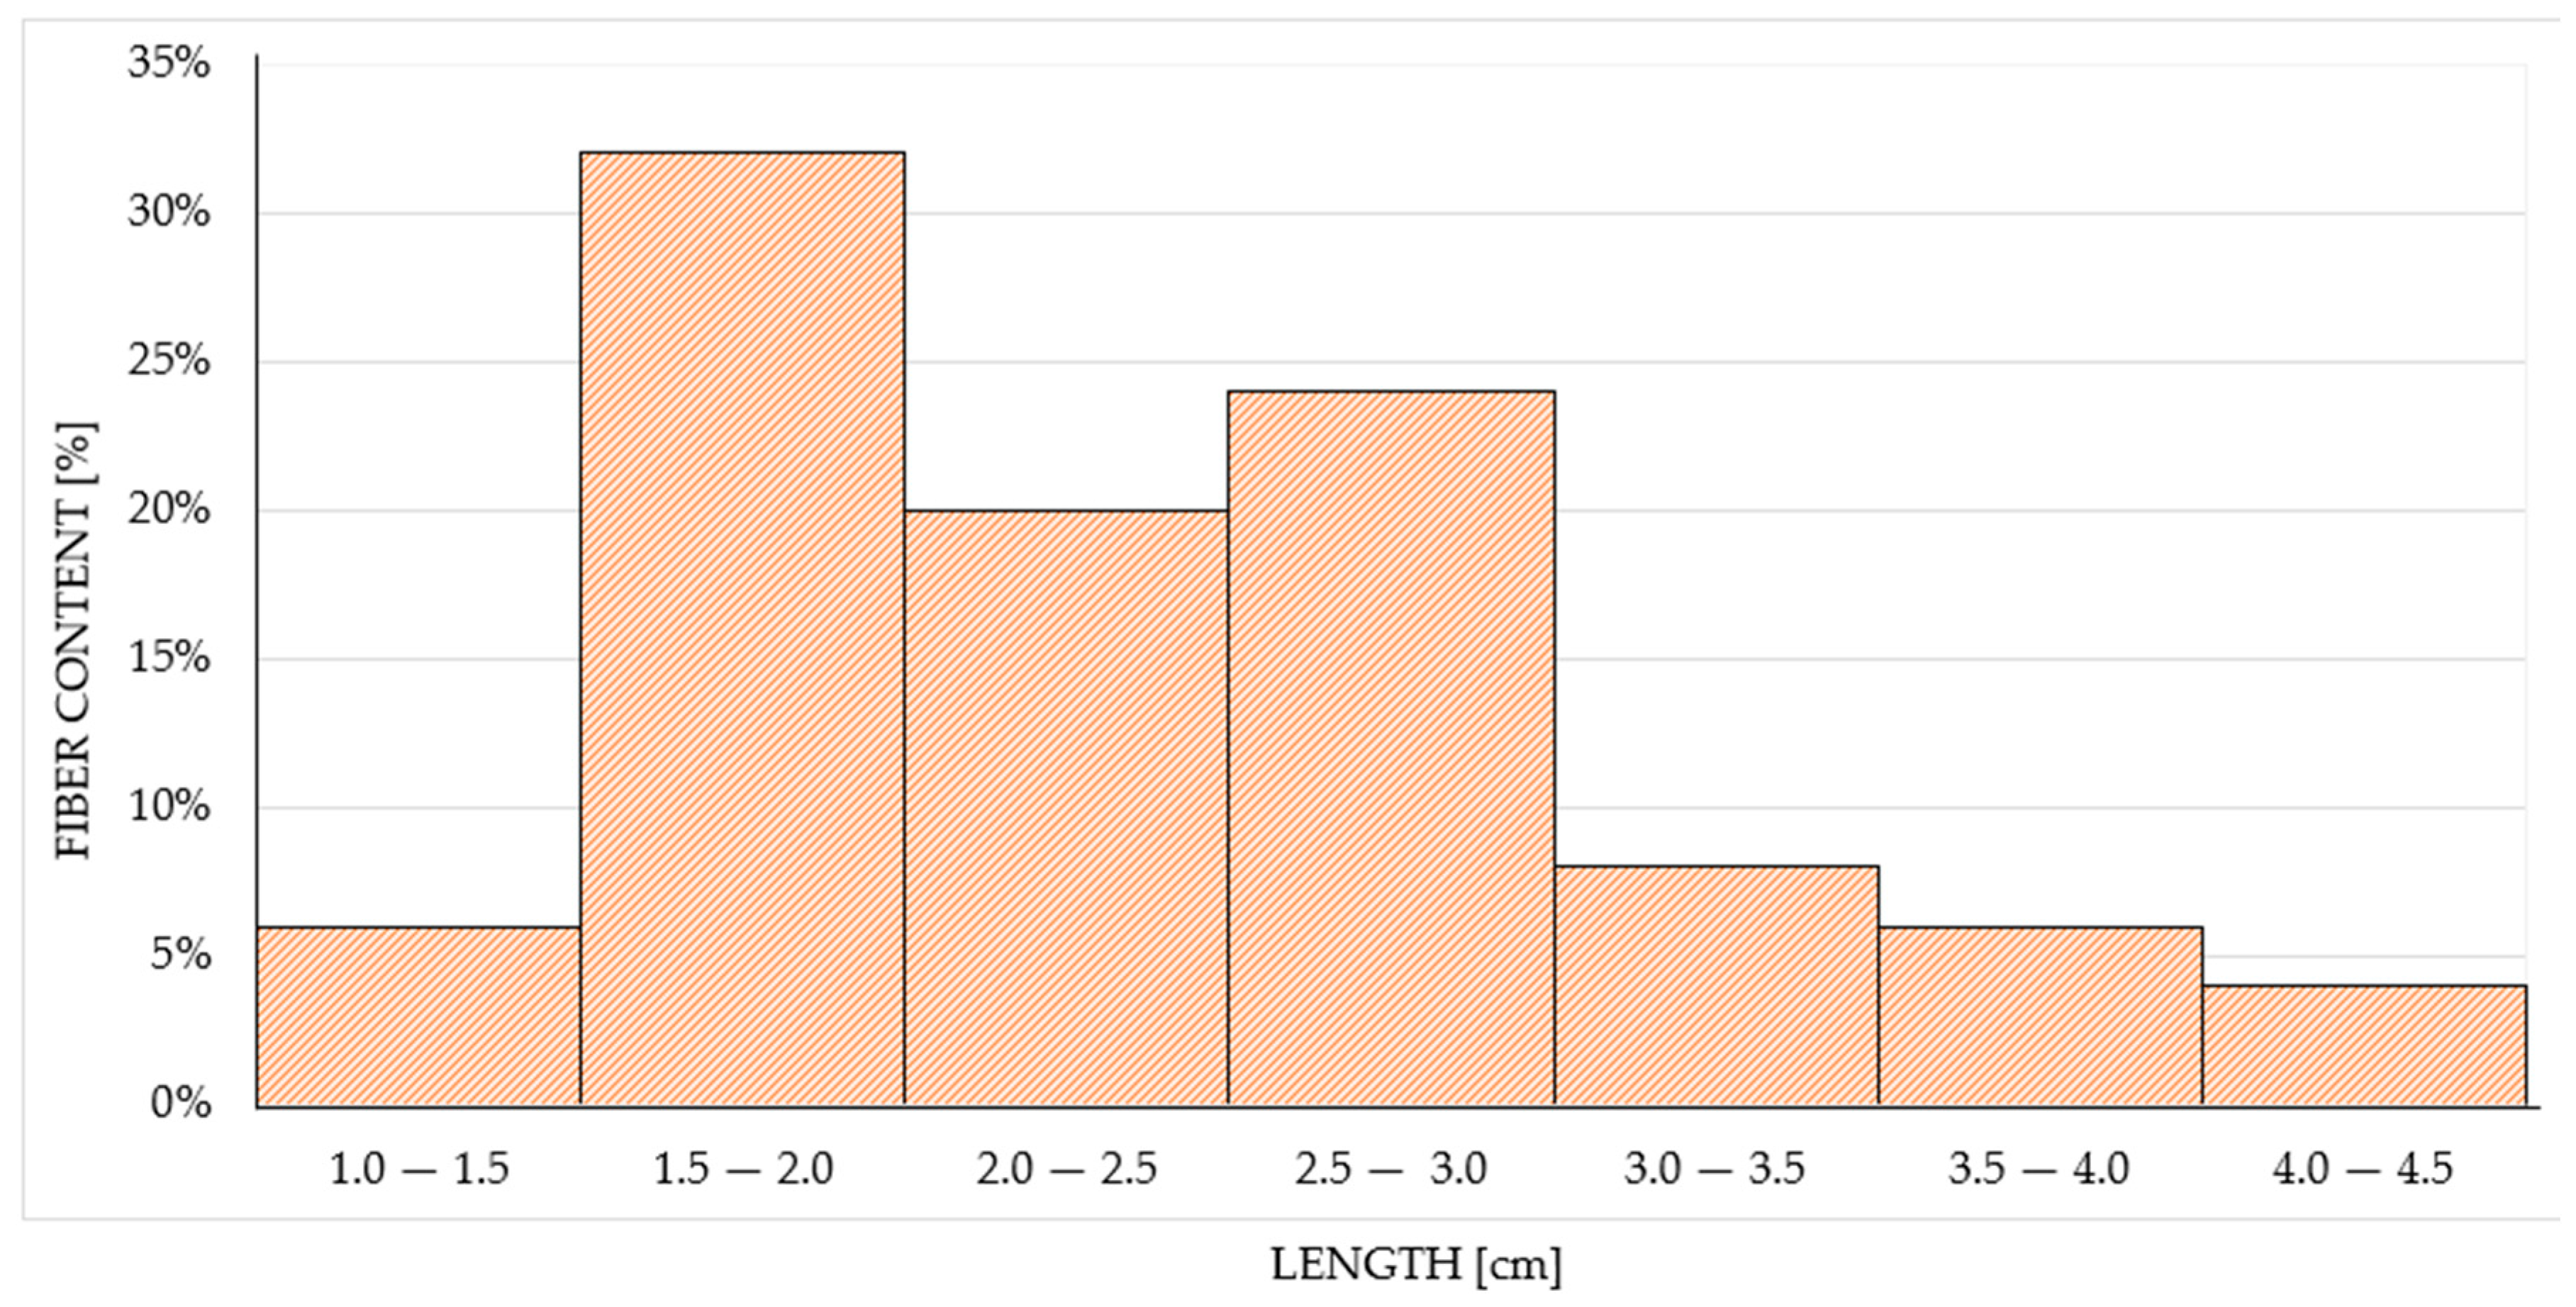
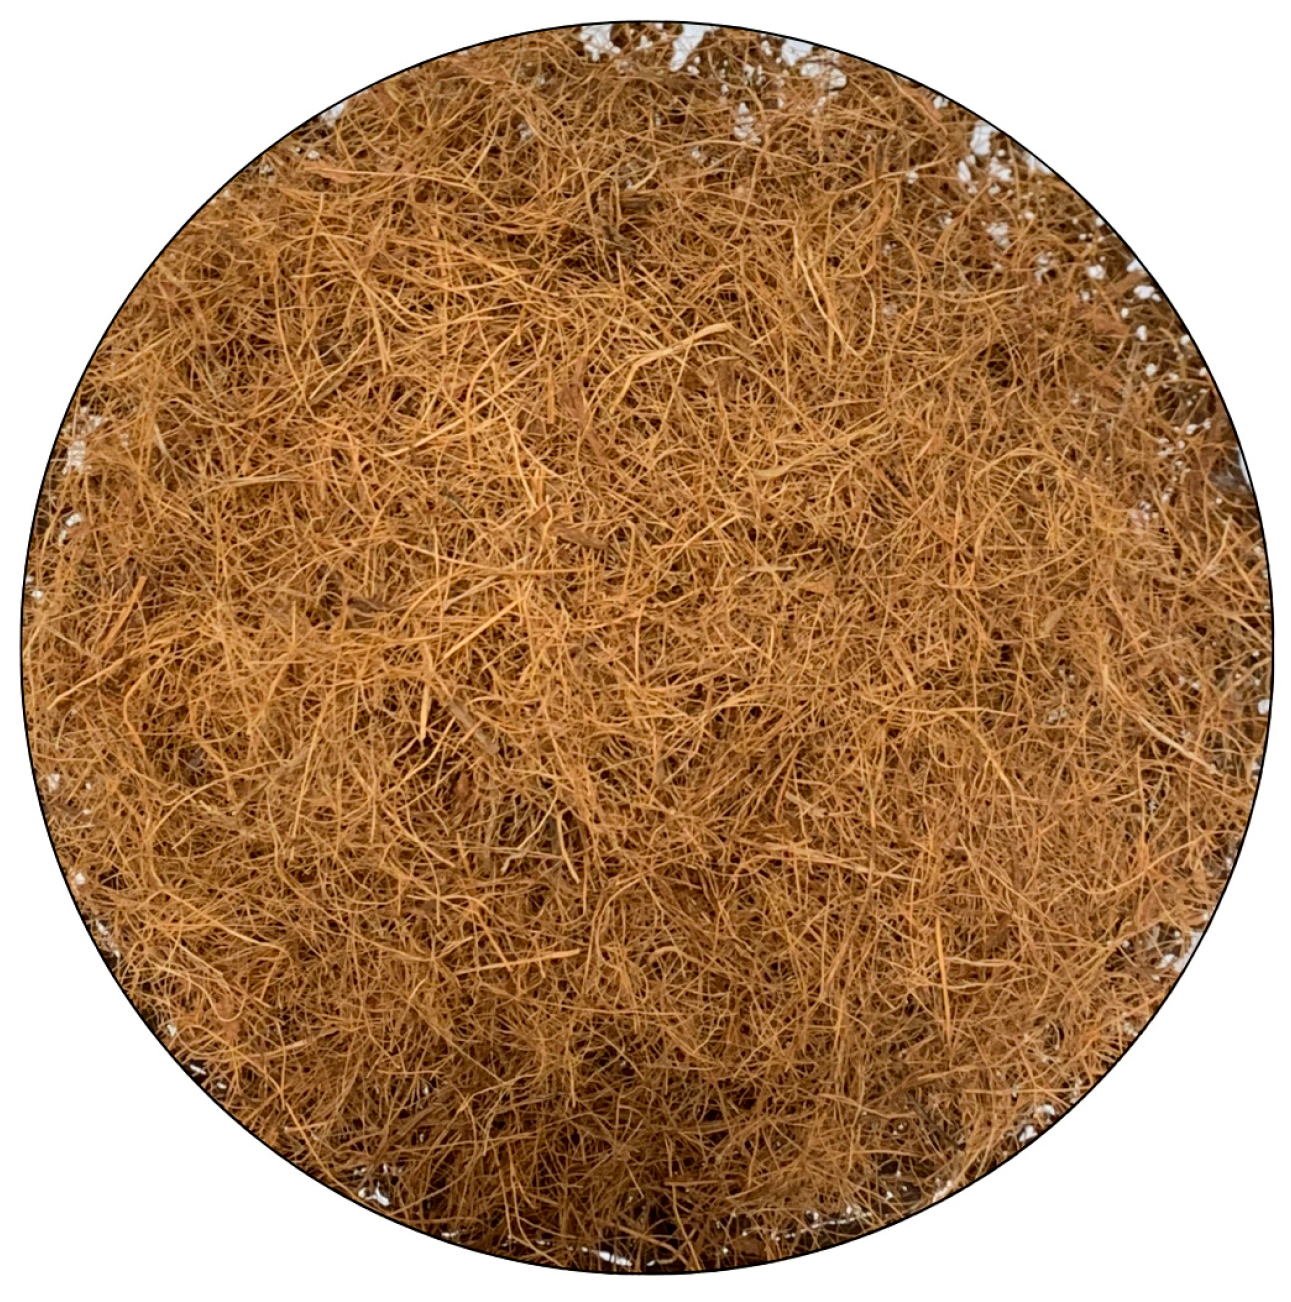
2.1.3. Coconut Fibre

In order to characterise the lengths of the coconut fibres, they were obtained from their original form (50 cm wide and 2.5 cm thick roll) and cut manually into minimum lengths of 10 mm to ensure uniformity in the sample. This minimum length served as a technical benchmark, reflecting the typical length of commercial fibres used to reinforce gypsum-based prefabricated products. Such is the case with glass or propylene fibre, whose usual measurement is approximately 12 mm [34,35]. Subsequently, 100 fibres were selected and measured individually using a millimetre-precision ruler. With these measurements, the average length (2.45 cm) was calculated and classified into specific ranges: 1.0–1.5 cm, 1.5–2.0 cm, 2.0–2.5 cm, 3.0–3.5 cm, 3.5–4.0 cm, and 4.0–4.5 cm, which allowed for the calculation of their percentage distribution (Figure 1).
These fibres are extracted from the coconut tree (Figure 2), which grows relatively frequently in tropical and subtropical regions [36]. To extract the fibres, the coconut is first stripped of its husk. The shells are then immersed in water for 48 h to separate the impurities from the fibres. The fibres obtained are dried to remove the absorbed water for 24 h at 60 °C. The properties of the analysed fibres are detailed in Table 4.

2.1.4. Kraft Paper

Kraft paper is made from 100% virgin pulp obtained through the Kraft process, in which the pulp undergoes a chemical treatment that gives it high tensile strength and the ability to withstand significant loads. This material is composed of unbleached long-fibre pulp and is characterised by its natural brown colour and biodegradable and recyclable properties. The characteristics of Kraft paper are detailed in Table 5.

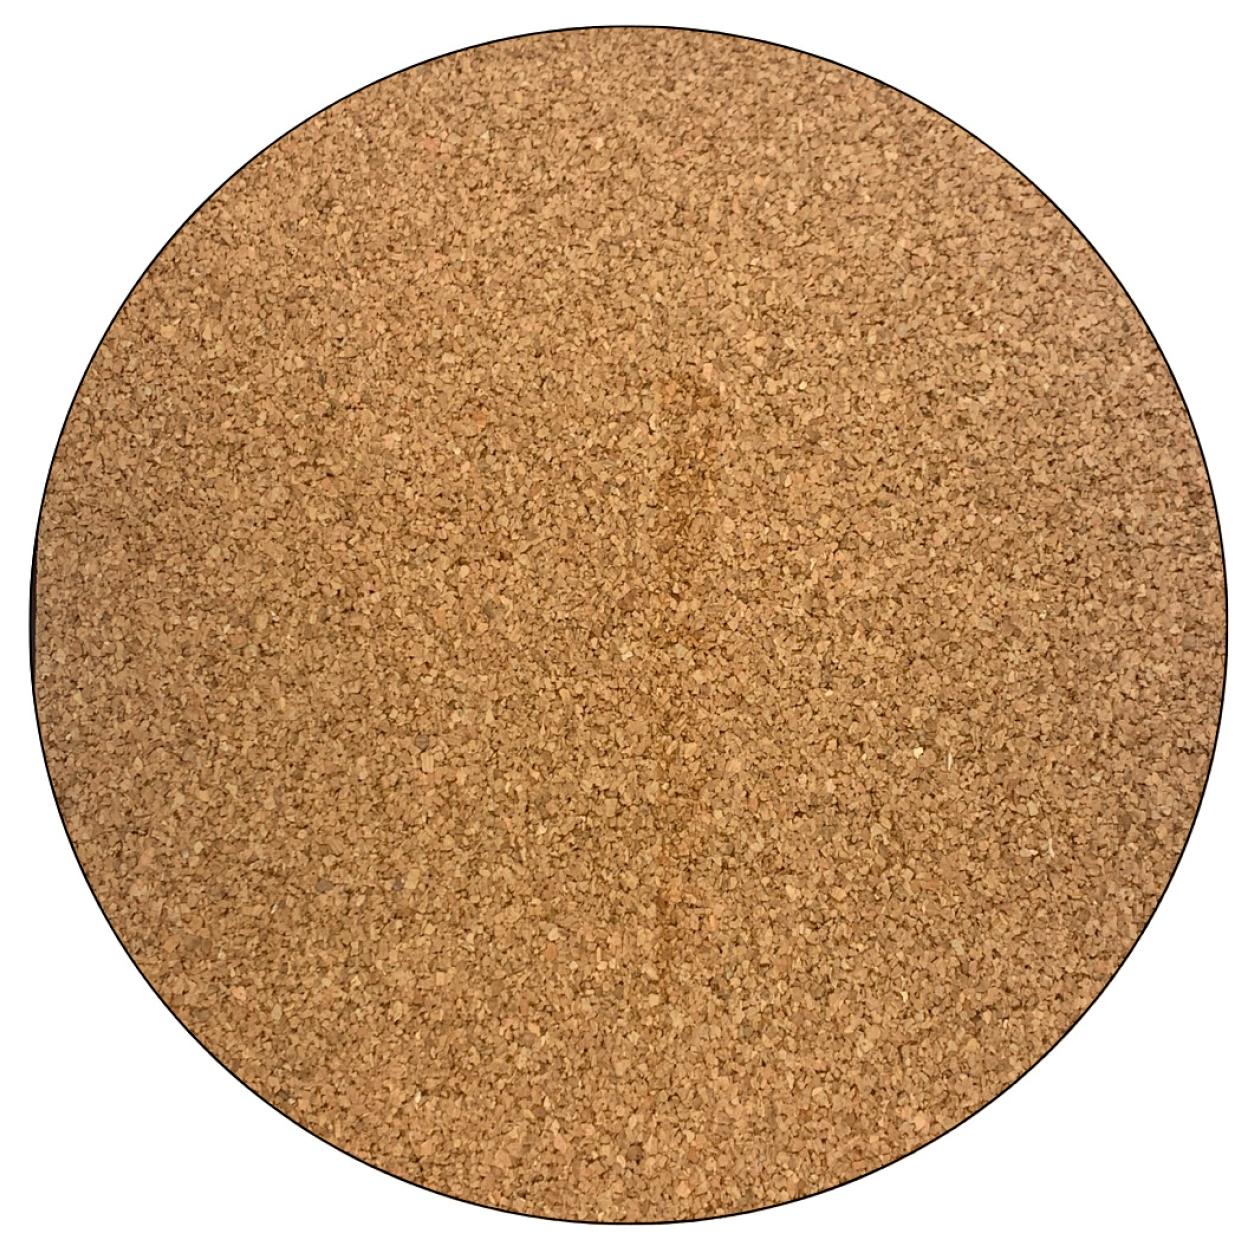
2.1.5. Expanded Cork Agglomerate

Expanded cork agglomerate enhances thermal performance in prefabricated roof panels. Table 6 details the key properties of this cork material (Figure 3), supplied by Amorim Cork (Santa Maria de Lamas, Portugal) [40].

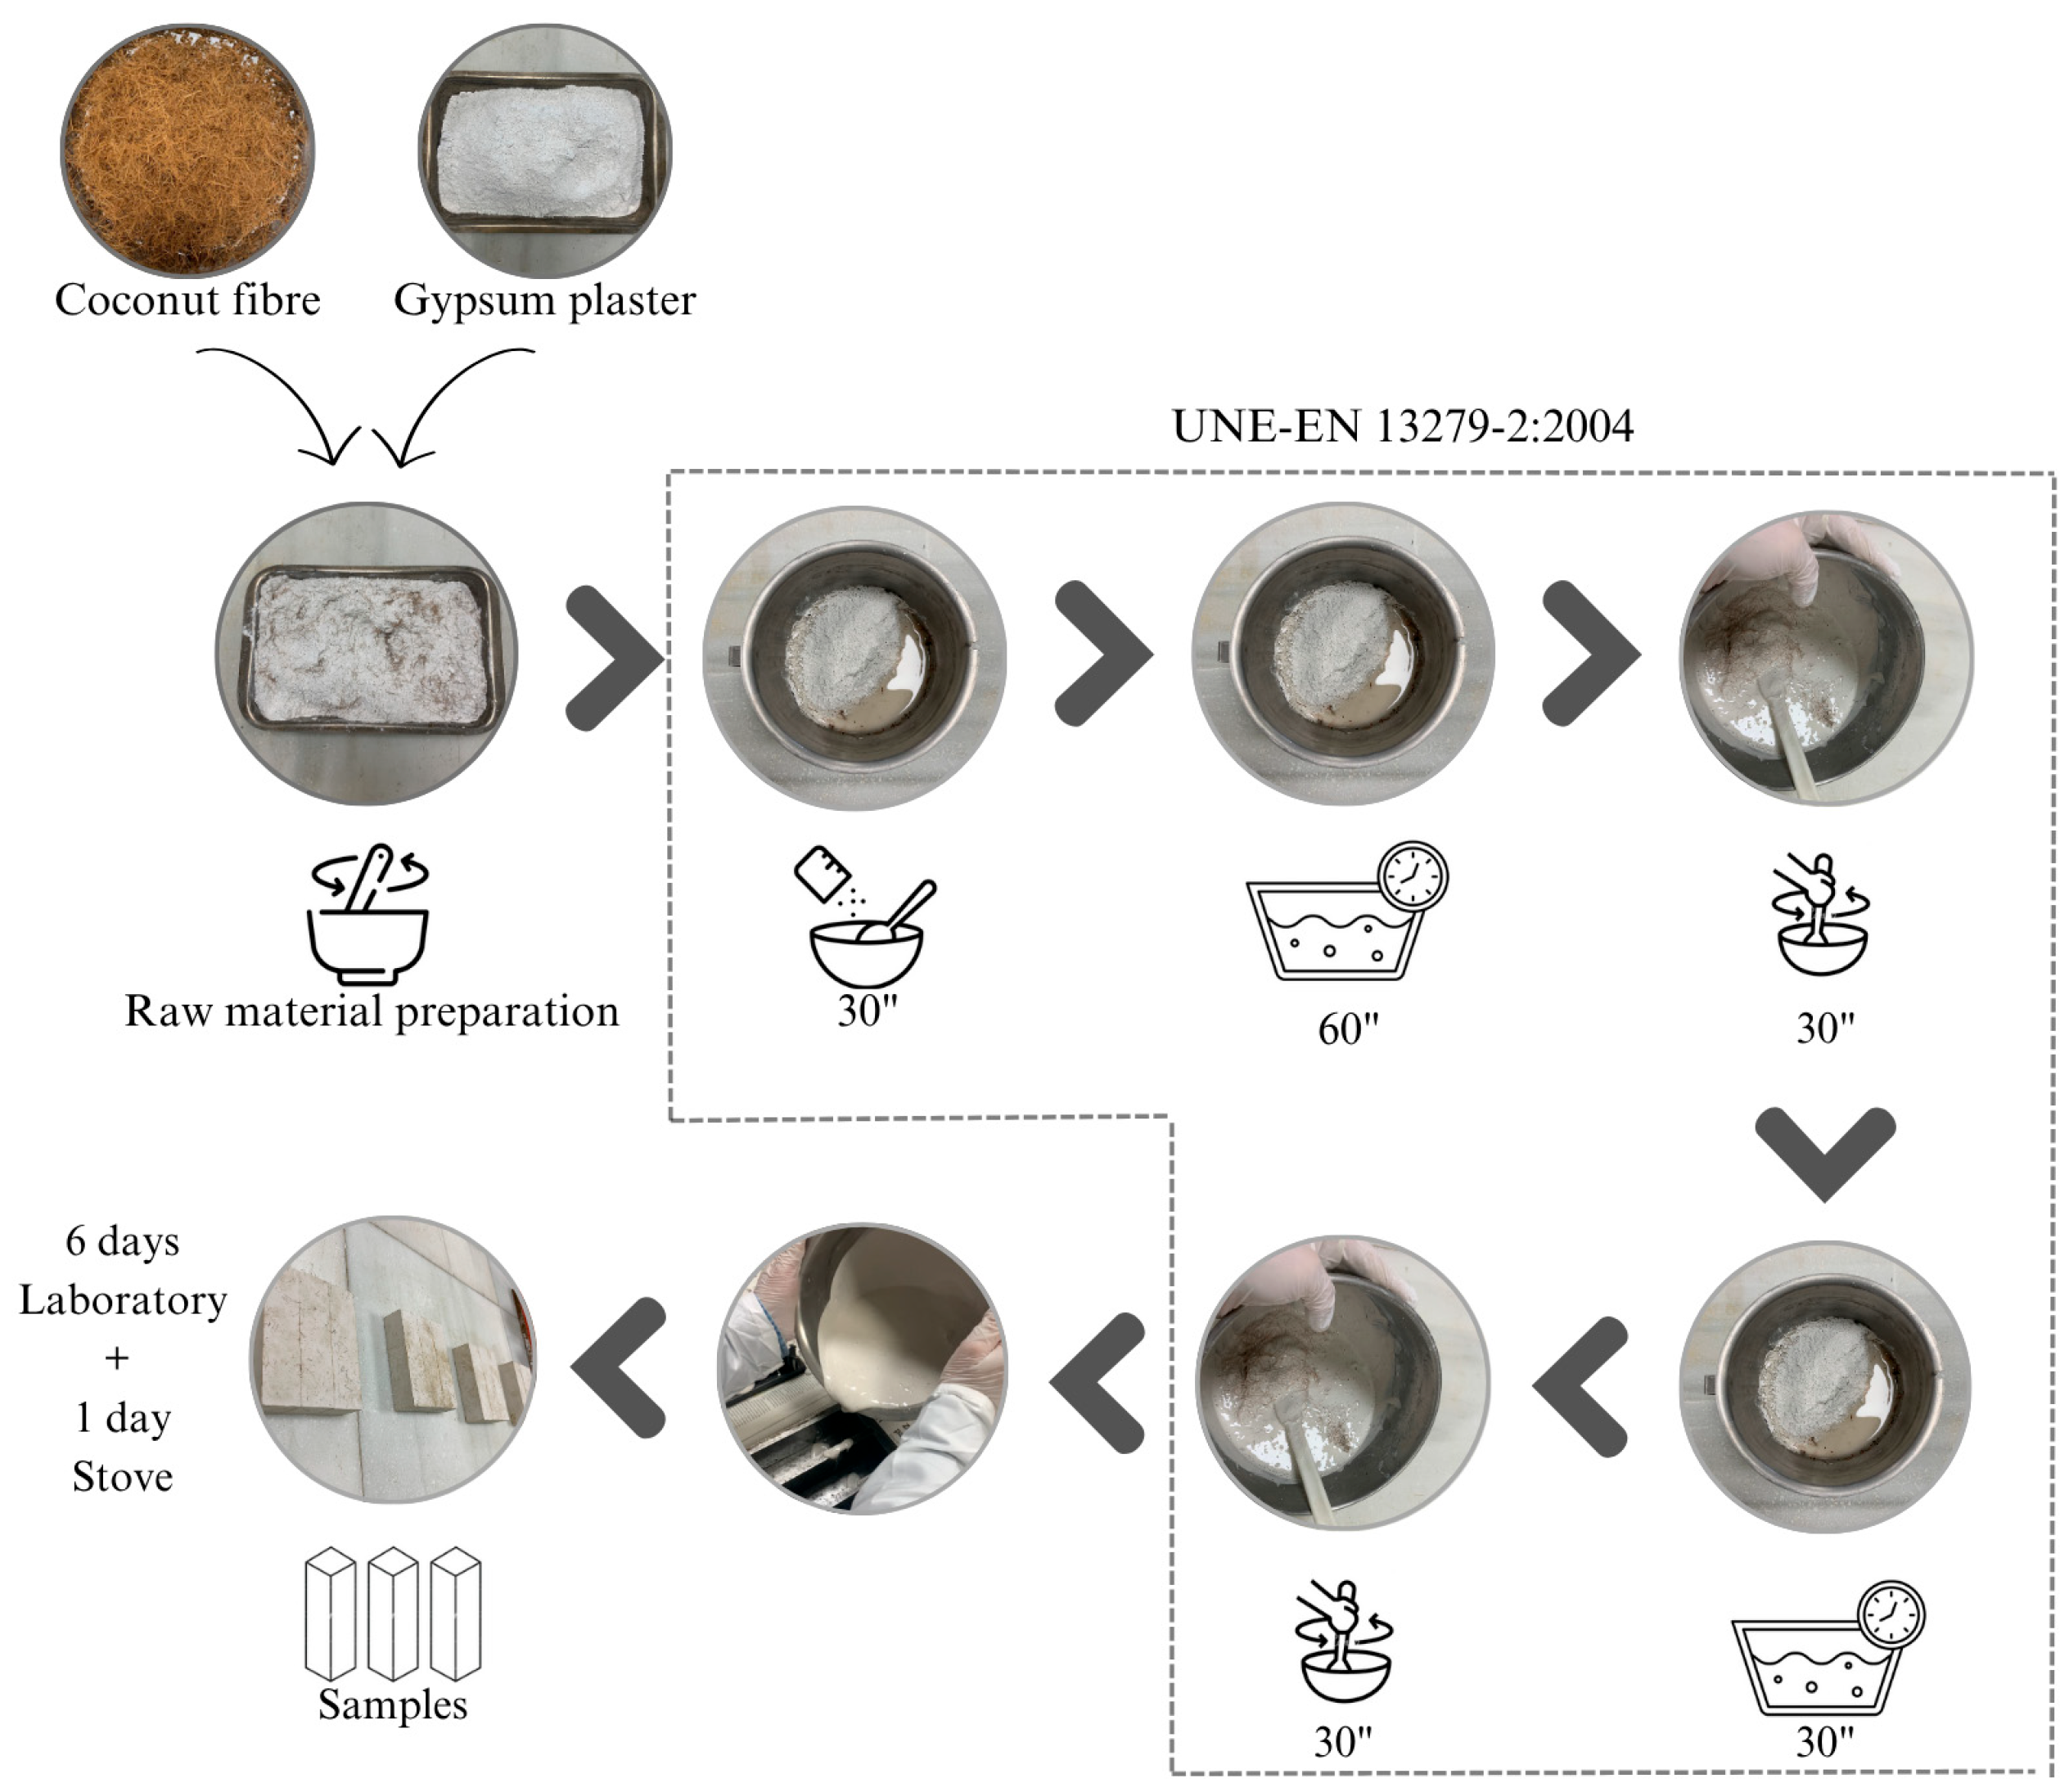
2.2. Sample Preparation

To define the dosages of the plaster–coconut fibre composites, the water/binder (W/B) ratio by mass was initially determined by UNE-EN 13279-2:2014 [41]. This analysis identified a W/B ratio of 0.7 as ideal for E35 plaster, obtaining a plastic consistency for the mixture in the fresh state [31]. The specimens were moulded in standardised dimensions of 40 × 40 × 160 mm. The preparation of the composites involved the progressive substitution of the plaster for coconut fibre, limiting the substitution to a maximum of 17.50% by volume. Thus, after a progressive replacement of the plaster material in percentage increments of 2.5% by volume, a limit for the workability of the fresh mix of 17.5% was obtained with a water/binder ratio of 0.7. Excessive agglomeration of the fibres was observed for higher substitution values, and a homogeneous dispersion of the reinforcing material in the matrix was not obtained. However, this ratio could be varied using commercial superplasticisers, increasing the water content or modifying the aspect ratio of the fibres used [18].
The nomenclature for the prepared specimens is defined as follows: “P0.7” represents the water/plaster ratio used, and the number after “CF” indicates the percentage of coconut fibre content by volume of the binder.
The proportions used to create the plaster composites are detailed in Table 7.
The preparation of the composites followed the guidelines specified in UNE-EN 13279-2:2014 [41]. The procedure followed is described below and detailed in Figure 4. Initially, the coconut fibre was incorporated into the plaster powder, and both dry materials were manually mixed before starting the preparation process of the composites. Once the homogeneous distribution of the fibres was achieved, the mixing process was started according to the standards mentioned above.
The increase in the amount of fibre reduced the fluidity of the mixture, decreasing its homogeneity and causing agglomeration of the fibres. This was due to the geometry of the fibres and their water absorption capacity [24].
Once the composites were prepared, they were cured under laboratory conditions at 20 ± 2 °C and 50 ± 5% relative humidity for six days. After this period, the samples were placed at 40 ± 2 °C and 50 ± 5% relative humidity for 24 h before testing to ensure uniform initial conditions. The final state of the composites and the appearance of the matrices are shown in Figure 5.

2.3. Experimental Programme

This section describes the tests performed for the physical and mechanical characterisation of the composites developed in this research. The experimental programme is schematically represented in Table 8.

2.3.1. Physical Characterisation

Bulk density: it was determined following the procedure established in standard UNE-EN 102042:2023 [42]. This parameter was calculated as the average value obtained from three standardised specimens, prepared for each type of dosage, with dimensions of 40 × 40 × 160 mm. The bulk density was calculated by dividing the dry mass of the sample by its volume. For this purpose, an electronic balance with a precision of 0.01 g was used.
Density classes were defined according to UNE-EN 12859:2012 [47], establishing three density ranges as detailed in Table 9.
Shore C hardness: The test followed UNE 102042:2023 standard [42]. Three prismatic specimens with 40 × 40 × 160 mm dimensions were evaluated for each dosage using a Shore C hardness tester from Baxlo (Barcelona, Spain). The methodology consists of taking five measurements on each of the two flat parallel faces of the specimens, ensuring that each face is separated by at least 2 cm from the other and the ends. This guarantees a comprehensive evaluation of the surface hardness along the specimen.
Dynamic elastic modulus (MOEus): This was measured using the Ultrasonic tester E46 220 V and 50 Hz from Ibertest (Madrid, Spain). The test was performed along prismatic specimens measuring 40 × 40 × 160 mm, using three samples for each dosage analysed in this research. Petroleum jelly was applied at the interface to ensure proper contact between the transducers and the specimens. This procedure was carried out according to the guidelines of UNE-EN ISO 12680-1:2007 [43].
SEM analysis: This analysis makes it possible to observe, at the microstructural level, the transition zone between the added fibre and the binder matrix. The samples used for this analysis were obtained from the fractured face in bending without modifying its surface. The equipment for this test was a Jeol JSM-820 microscope (Tokyo, Japan) operating at 20 kV, equipped with Oxford EDX analysis (Oslo, Norway). Before this test, the samples were coated with a thin layer of gold to improve their conductivity, using a Cressington 108 metalliser (Watford, UK).

2.3.2. Mechanical Characterisation

Flexural and compressive strength: To determine the flexural and compressive strength, an Ibertest hydraulic press, model PROTEZIONE PER (Madrid, Spain), with a maximum force of 10 kN, was used. The tests were performed following EN 13279-2:2014 standard [41]. The three-point bending test was carried out on standardised specimens of 40 × 40 × 160 mm at a loading rate of 10 N/s until fracture, testing three specimens of each type of plaster composite.
Compressive strength was measured with the same equipment, maximum force 200 kN, using the coupled compressive load modulus. Half specimens from the previous flexural tests were used, resulting in six specimens for each dosage type. The load was applied on the 40 × 40 mm surfaces at a rate of 20 N/s until failure.

2.3.3. Water Properties

Capillarity water absorption and capillarity height: A procedure based on EN 1925:1999 [44] was followed. This method measures the mass of water absorbed per unit area over time. Specifically, the capillary water absorption coefficient ( C c a p , t ) was calculated using standardised specimens with dimensions of 40 × 40 × 160 mm. The coefficient is expressed in kg/m2·s1/2, and the calculation was performed according to the following Equation (1):
C c a p , t = W _ t W _ 0 A _ s   ·   t
where W_t is the weight of the sample at time t; W_0 is the initial dry weight of the sample; A_s is the area of the submerged surface (16 cm2); and t is the time in seconds.
The water level was consistently maintained at 10 ± 1 mm throughout the test, with measurements taken at 1, 3, 5, 10, 15, 20 and 40 min intervals.
Additionally, the maximum height reached by the water in each composite sample was recorded. This measurement, known as capillary height, was determined as the average of three values obtained for each specimen, reflecting the height reached by the water after 40 min of testing. Images were captured using infrared thermography to understand water distribution within the composites better.
Total water absorption: The method of the UNE-EN 14617-1:2013 standard was applied [45]. The test was performed on specimens with dimensions of 40 × 40 × 160 mm, previously dried to ensure consistent initial conditions in all specimens. The specimens were fully immersed in water for 24 h and then weighed to obtain the average mass of three specimens per dosage. This allowed the percentage change in mass due to water absorption to be evaluated.
Open porosity: The procedure of EN 1936:2007 [46] was adopted. This property is defined as the ratio between the volume of accessible pores and the apparent volume of the material. Three standardised specimens of each composite type, with dimensions of 4 × 4 × 16 cm, were used. The open porosity coefficient was calculated using the following Equation (2):
P O R O P E N   = W _ s a t   W _ 0   W _ s a t   W _ i m m
The open porosity was determined by first obtaining each composite’s saturated weight (W_sat) after immersing the samples in water for 24 h. Each dry sample’s initial weight (W_0) was recorded, and the saturated specimens’ submerged weight (W_imm) was measured using a hydrostatic balance.

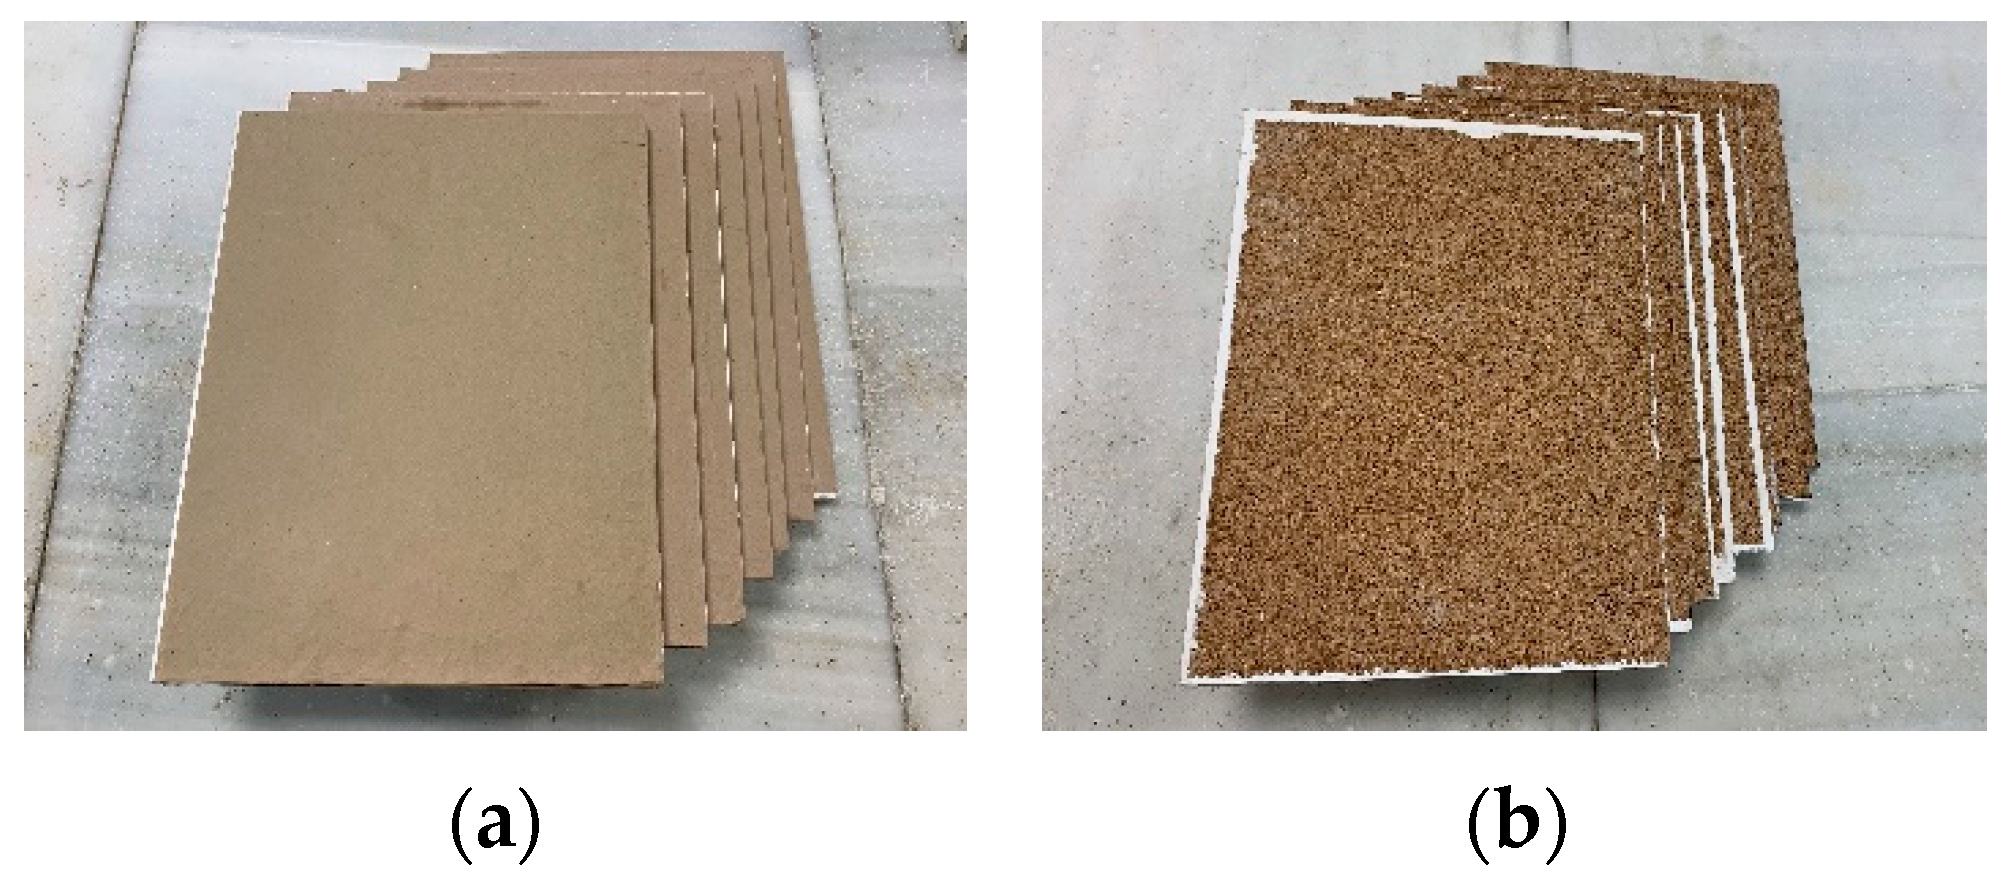
2.3.4. Physical and Mechanical Properties of Panels

In the final phase, tests were carried out on plates with dimensions of 40 × 30 × 1.5 cm and 24 × 24 × 3 cm, to analyse their physical and mechanical characteristics and evaluate their application in wall partitions and/or ceiling plates. Three plates for each type of panel and dosage analysed in this section were elaborated.
Flexural strength in panels: This was carried out on panels with dimensions of 40 × 30 × 1.5 cm for each dosage, evaluating two types of configurations: with a double sheet of Kraft paper [39] on both surfaces of the plates and with a sheet of cork agglomerate [40] on one side. The purpose of this test was to evaluate the bending strength of the boards and their viability for ceiling applications. UNE-EN 12859:2012 [47], which establishes a minimum breaking load for prefabricated plates of 0.18 kN, and UNE-EN 14246:2007 [48], which considers that a plate “complies” if it withstands the load without breaking or fracturing, were followed. In addition, all defects observed during the test were recorded, and the surface appearance of the plate was evaluated at a distance of 30 cm. The test was performed using an ETI H0285 bending machine from Proeti (Madrid, Spain), with a maximum load of 30 kN, which applies a load to the plate, supported horizontally at two points 350 mm apart, until failure occurs.
Thermal conductivity: Tests were carried out on a set of seven samples, each with 24 × 24 × 3 cm dimensions. An equipment known as Heat Insulation House, equipped with thermocouples, was used. The guidelines established in the UNE-EN ISO 8990:1997 standard [50] were followed. The samples were placed inside an insulated box with expanded polystyrene plates. The internal resistance of the Heat Insulation House generated a heat flow. After 24 h, once a stationary heat flow was reached, thermocouples recorded the inside and outside temperatures and the surface temperatures on both sides of the samples, every 30 s for 10 min. Data were recorded using Measure software (2008), version 4.5.3.0, which facilitated the visualisation of the temperatures recorded by each thermocouple, the total measurement time and the elapsed time since each reading. Thermal conductivity was calculated by applying Fourier’s Law (3).
ϕ = λ e   ·   S   ·   T _ i n t T _ e x t
where ϕ [W] represents the heat flux; λ is the thermal conductivity coefficient of the material under test [W/m·°C]; e represents the thickness of the plate; S is its surface area [m2]; and T_int and T_ext are the internal and external temperatures [°C], respectively, of the Heat Insulation House.
Thermal Conductivity Simulation: THERM v7.8 software was used to simulate the thermal behaviour of a facade wall. This simulation was designed according to the parameters established in the Basic Document on Energy Saving (DBHE) [51], applying technical data on commercial materials. It was then compared with a similar configuration, including plates with a new plaster composite and coconut fibre.

3. Results and Discussion

3.1. Physical and Mechanical Characterisation

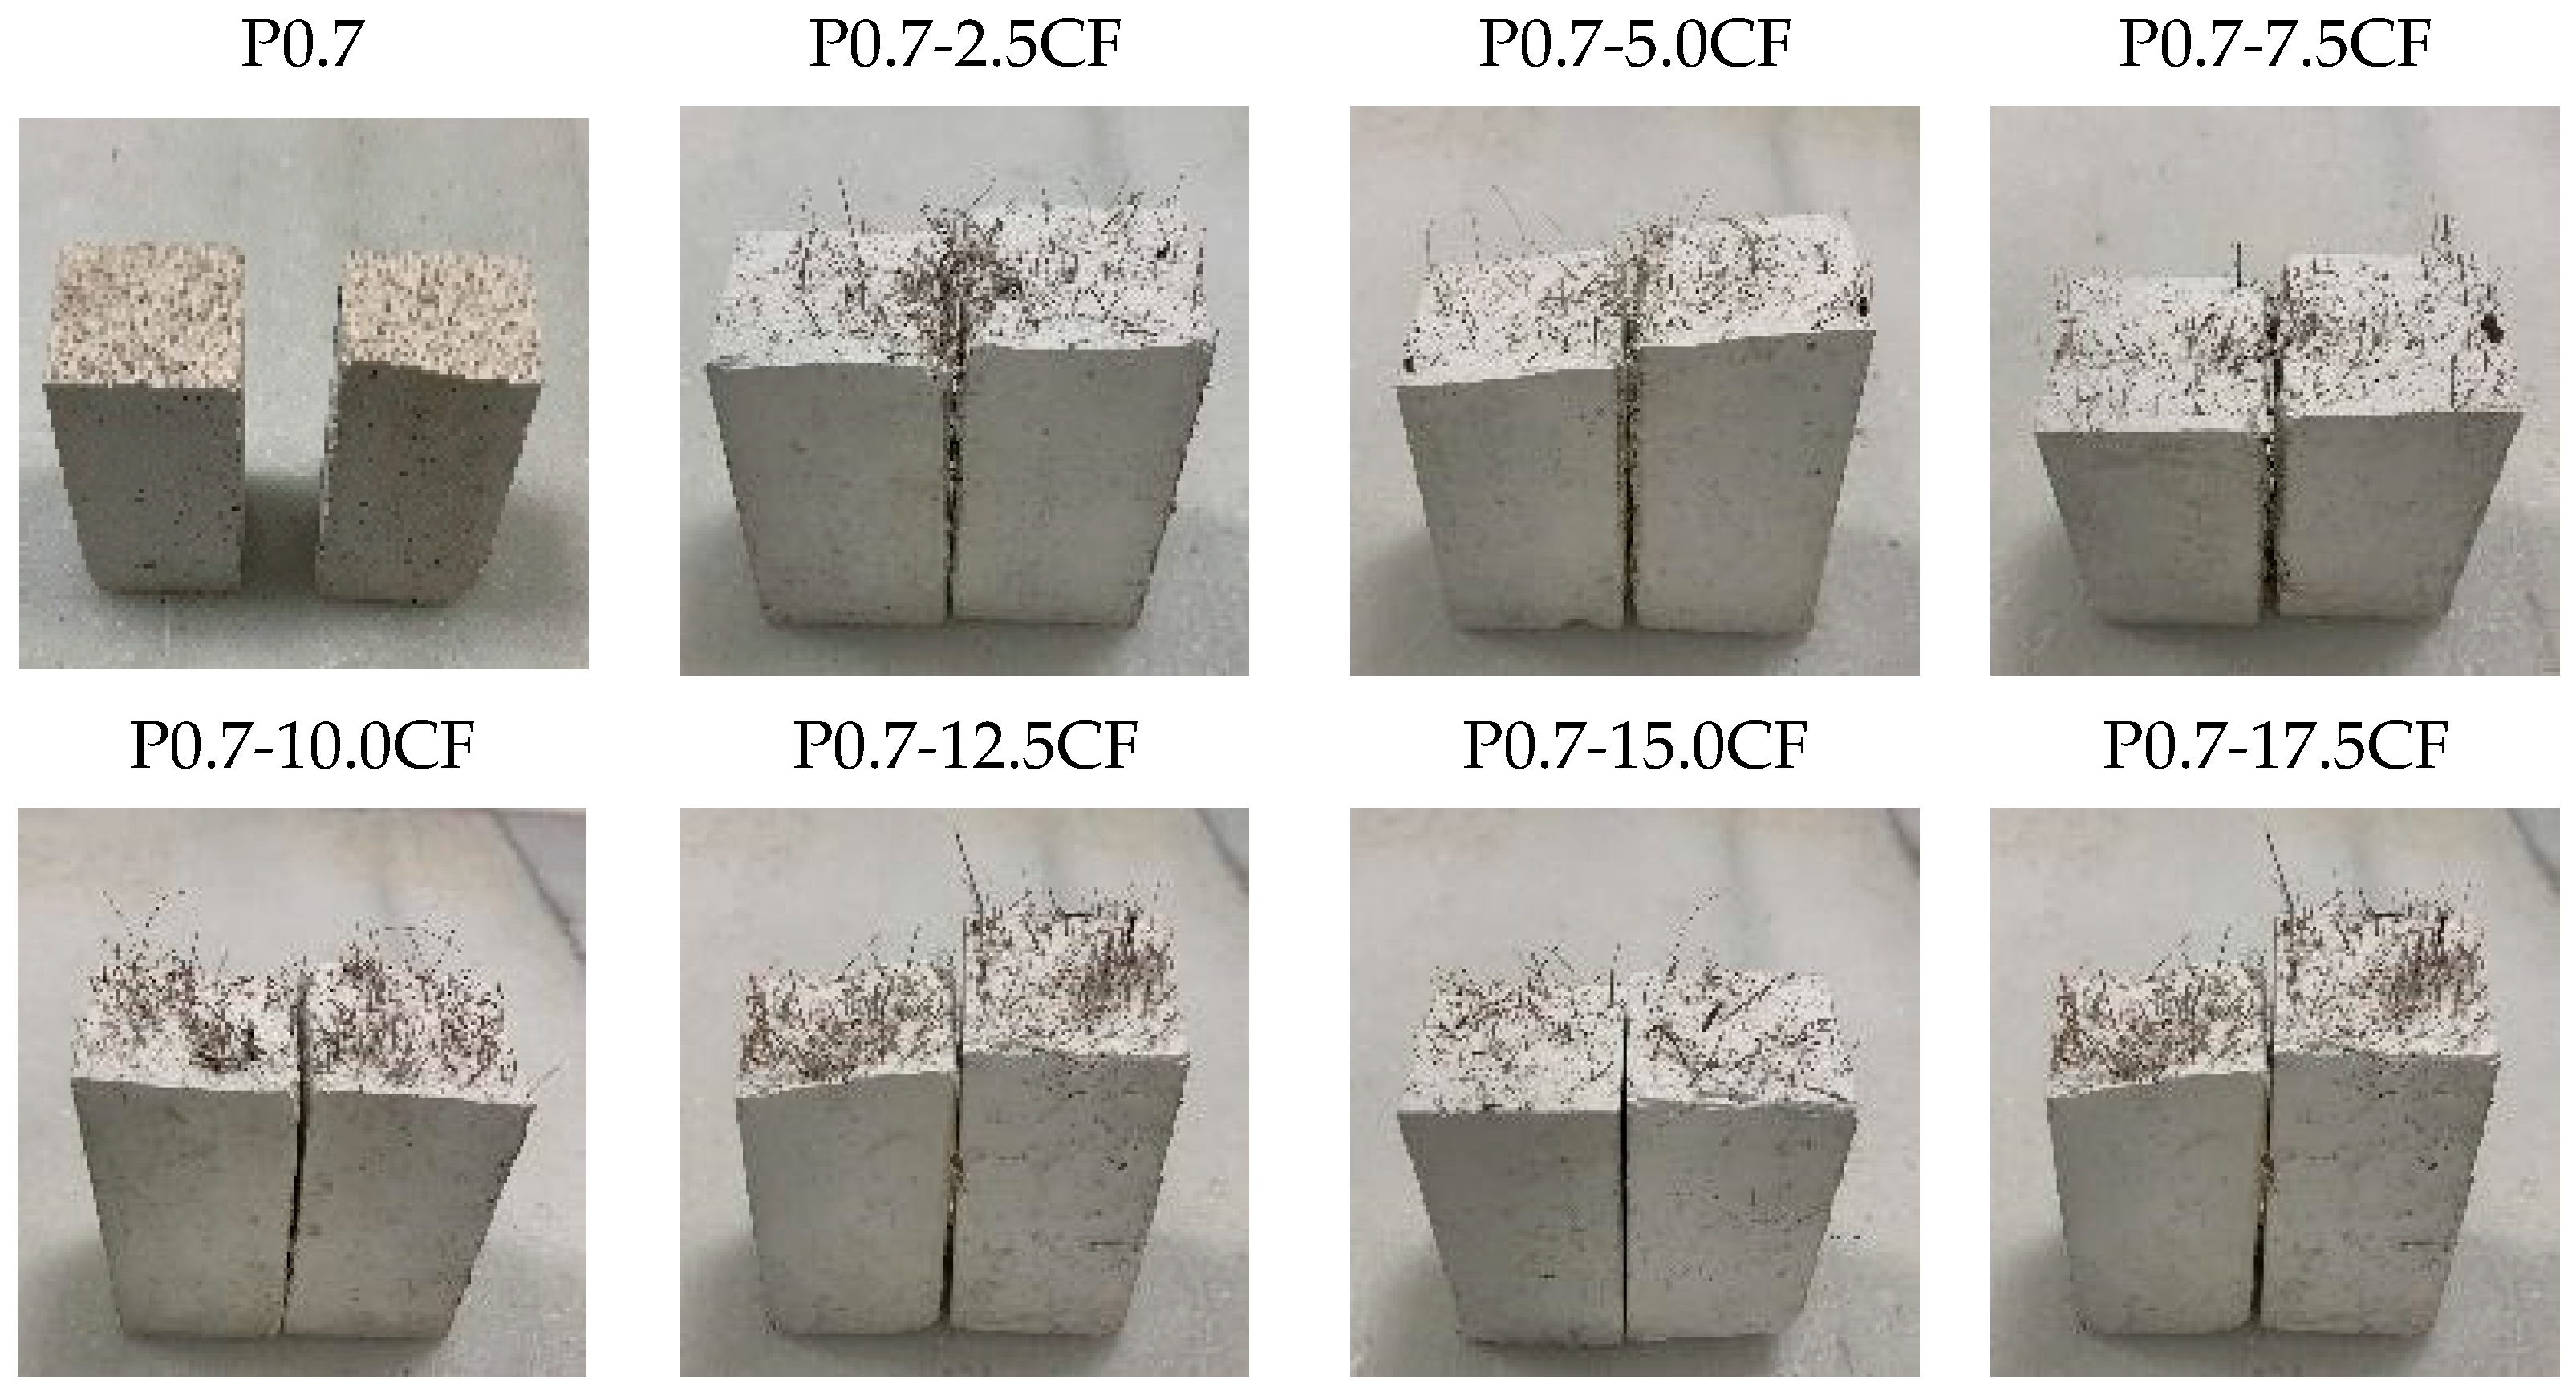
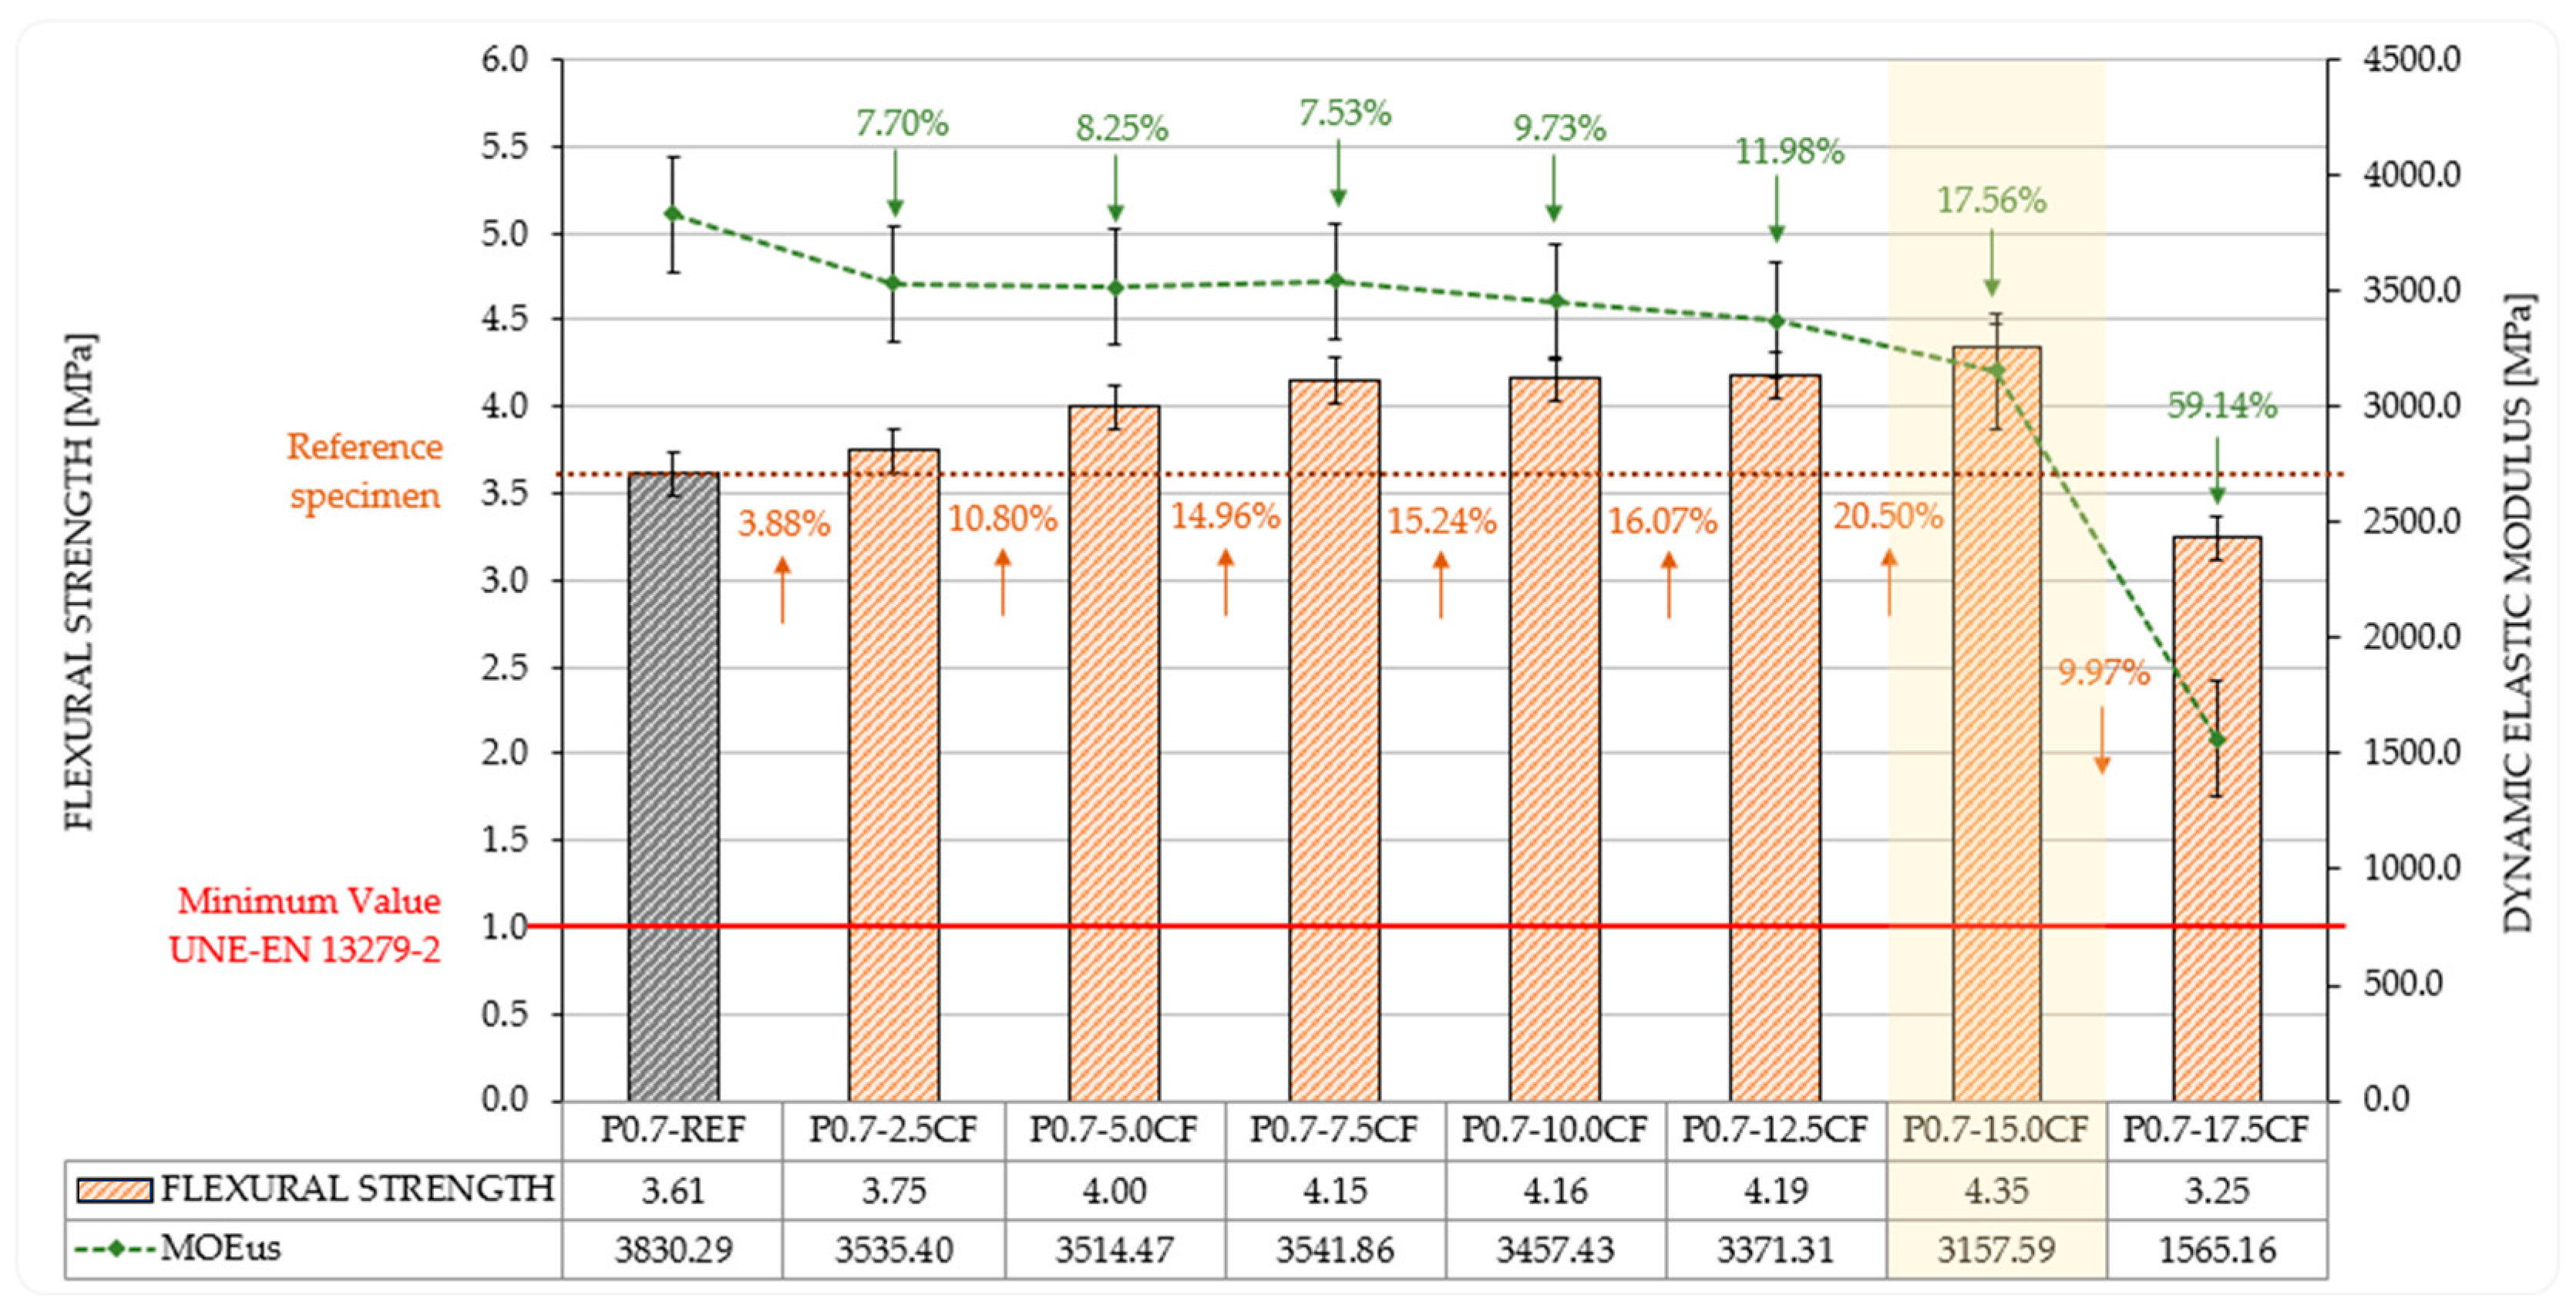
3.1.1. Flexural Strength and Dynamic Elastic Modulus (MOEus)

The results presented in Figure 6 show the relationship between flexural strength and dynamic modulus of elasticity (MOEus) as a function of fibre content in the composites. These two measurements are closely related since the ultrasonic wave’s propagation velocity depends on the material’s density and porosity, which condition the mechanical strength. Thus, studies such as that by Rosell and Cantalpiedra have shown a strong correlation between both properties, making the dynamic modulus of elasticity a very useful non-destructive test for composite materials [52].
As the fibre content increased, the flexural strength experienced an increase, reaching a maximum of 4.35 MPa in the P0.7-15.0CF specimen, which represented an improvement of 20.50% compared to the reference specimen. This behaviour coincides with that reported in other studies [20,21], which also observed improvements in flexural strength with the incorporation of fibres in gypsum composites. It should be noted that all the evaluated composites exceeded the minimum recommended value of 1 MPa, as specified by UNE-EN 13279-2:2014 [41]. However, excessive fibre content, such as in specimen P0.7-17.5CF, reduced load-bearing capacity, consistent with findings from previous research [20,24,25,29]. Table 10 details the flexural strength test results for different fibre types.
The results obtained for the dynamic modulus of elasticity show a progressive decrease as the fibre content increases. A reduction of 59.14% of this parameter was observed in specimen E0.7-17.5FC, which registered a value of 1565.16 MPa. This behaviour coincides with previous studies on gypsum composites reinforced with other natural fibres, such as hemp [29], where a reduction in MOEus was also observed as the fibre content increased.
In the case of coconut fibres, the strength reached 4.16 MPa at 10.00% fibre content, which represents an increase of 34.19% over the 3.1 MPa reported by Aramwit et al. [20] and 254.04% compared to the 1.175 MPa obtained by Guna et al. [21] at the same percentage.
When compared with pine and abaca wood fibres, the coconut-reinforced composites at 2.50% achieved a resistance of 3.75 MPa, exceeding by 171.74% the 1.38 MPa recorded for pine fibres [24] and by 37.36% the values of abaca fibres (2.73 ± 0.19 MPa) at 2.00% [25]. At higher ratios, pine fibres evidenced a decrease in strength, reaching 0.72 MPa at 6.00%, translating into a difference of 476.39% compared to the 4.15 MPa obtained with composites at 7.50%.
Finally, for hemp fibres, the results indicate that at 15.00%, a strength of 4.8 MPa was achieved [29], 10.34% higher than the 4.35 MPa obtained in this research at the same percentage.

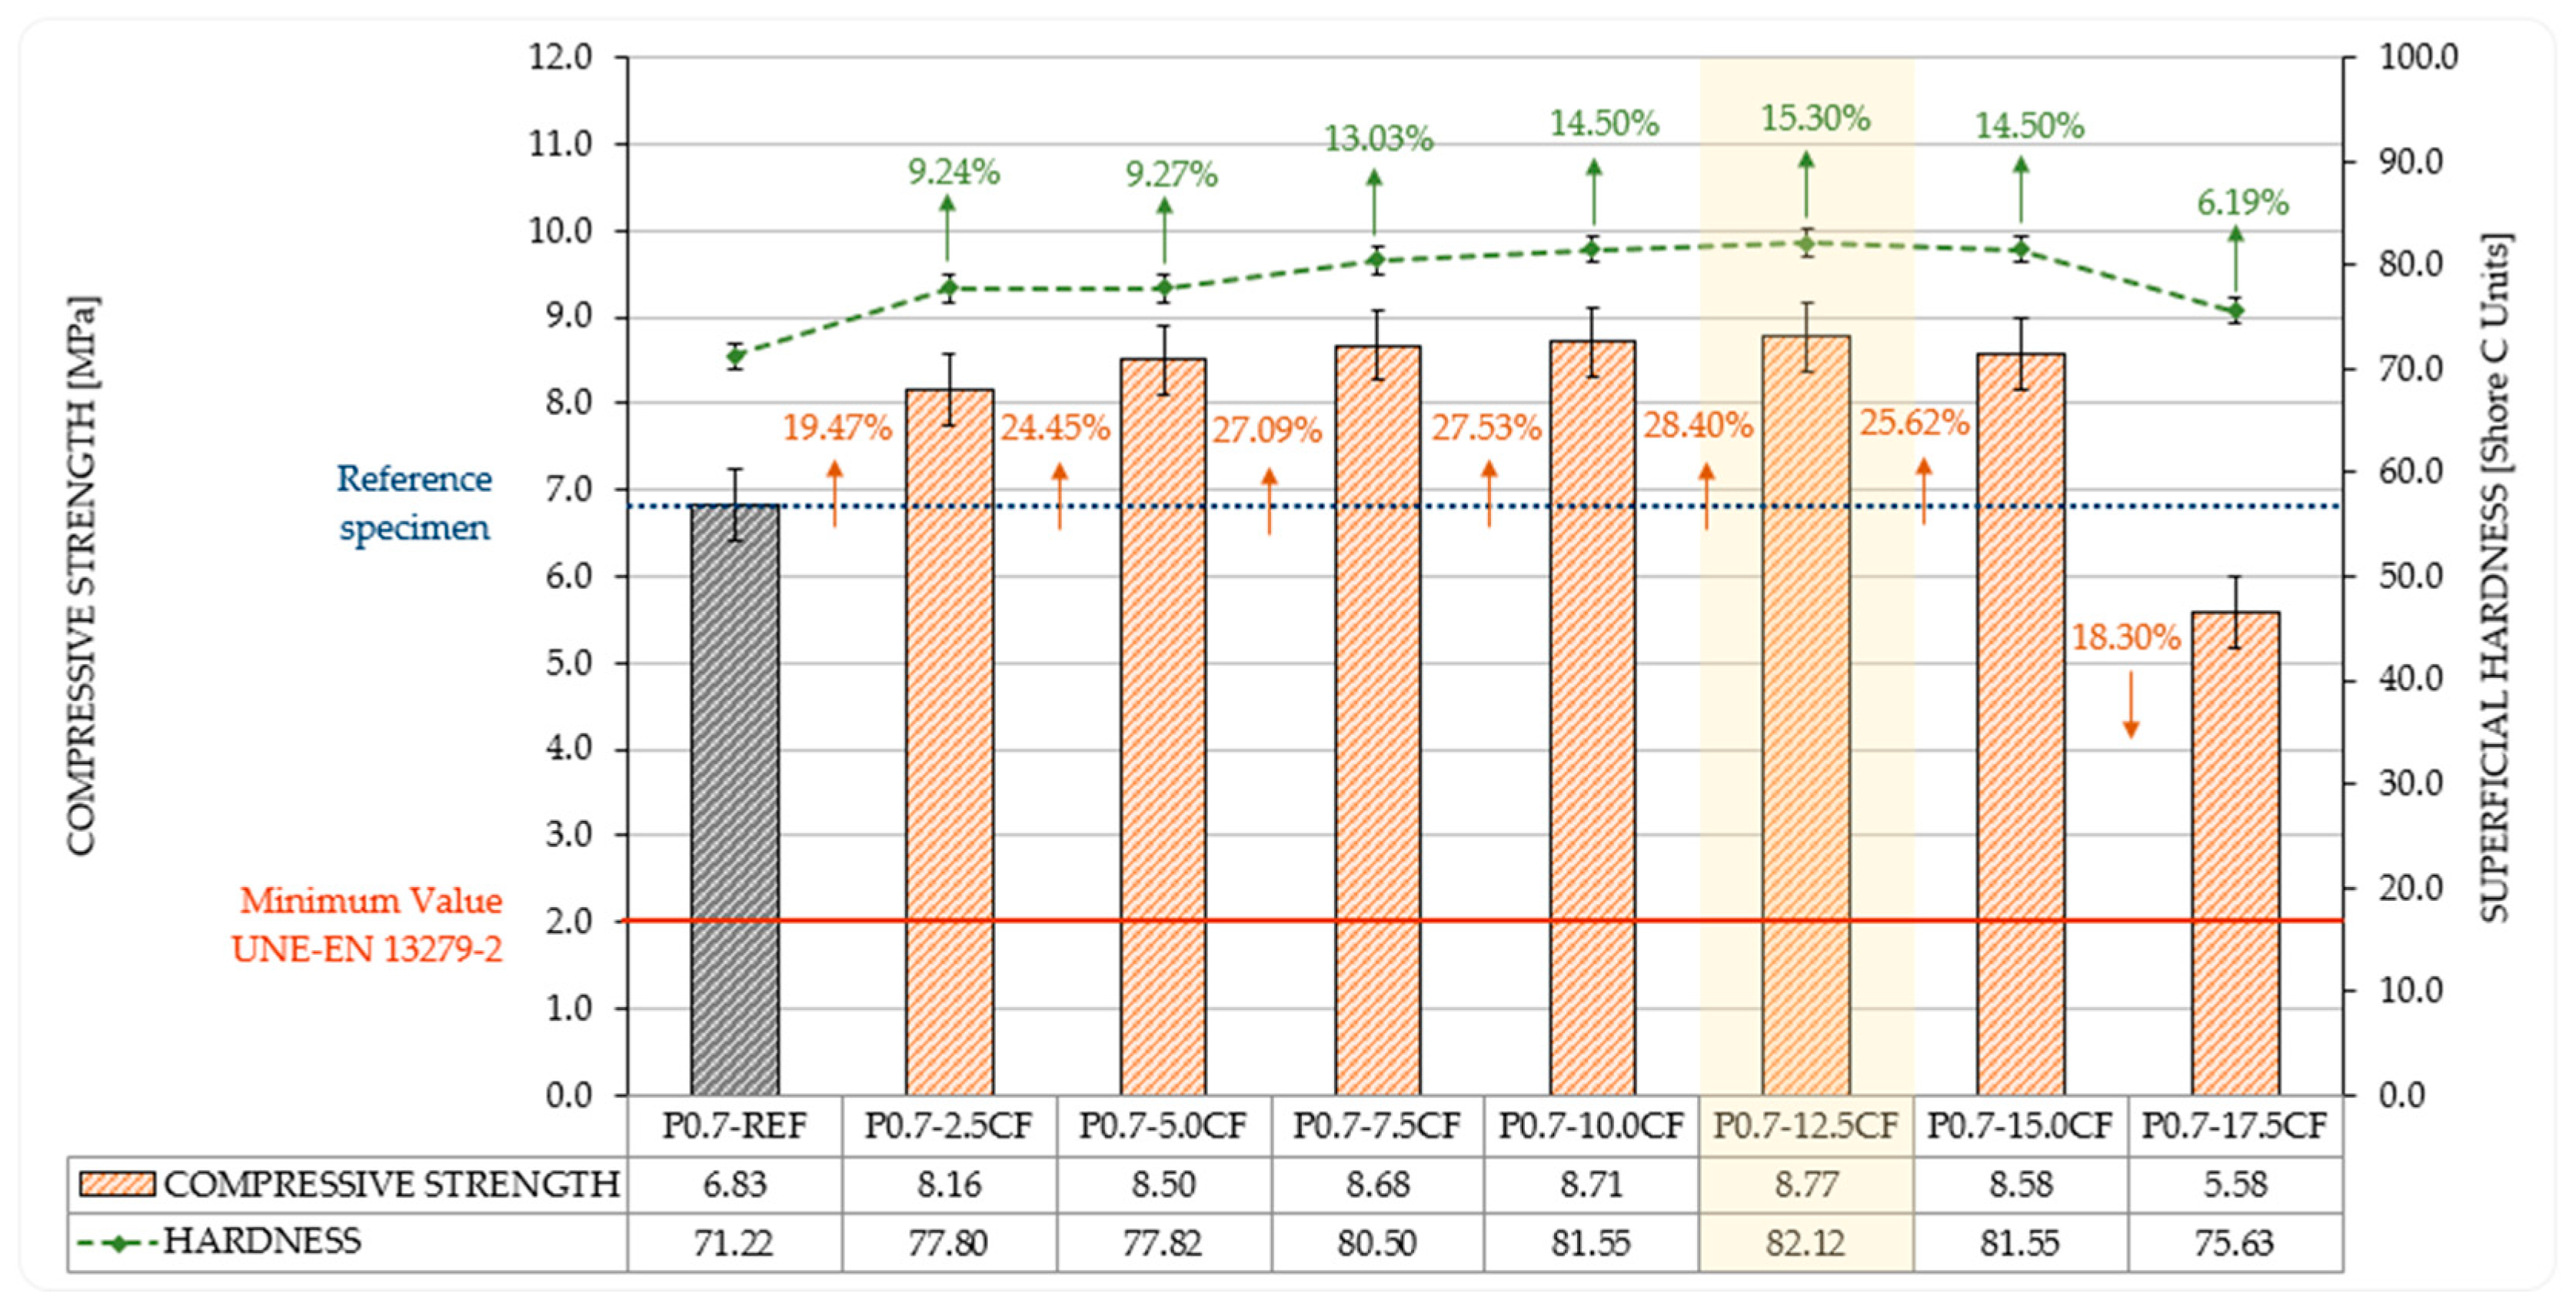
3.1.2. Compressive Strength and Superficial Hardness
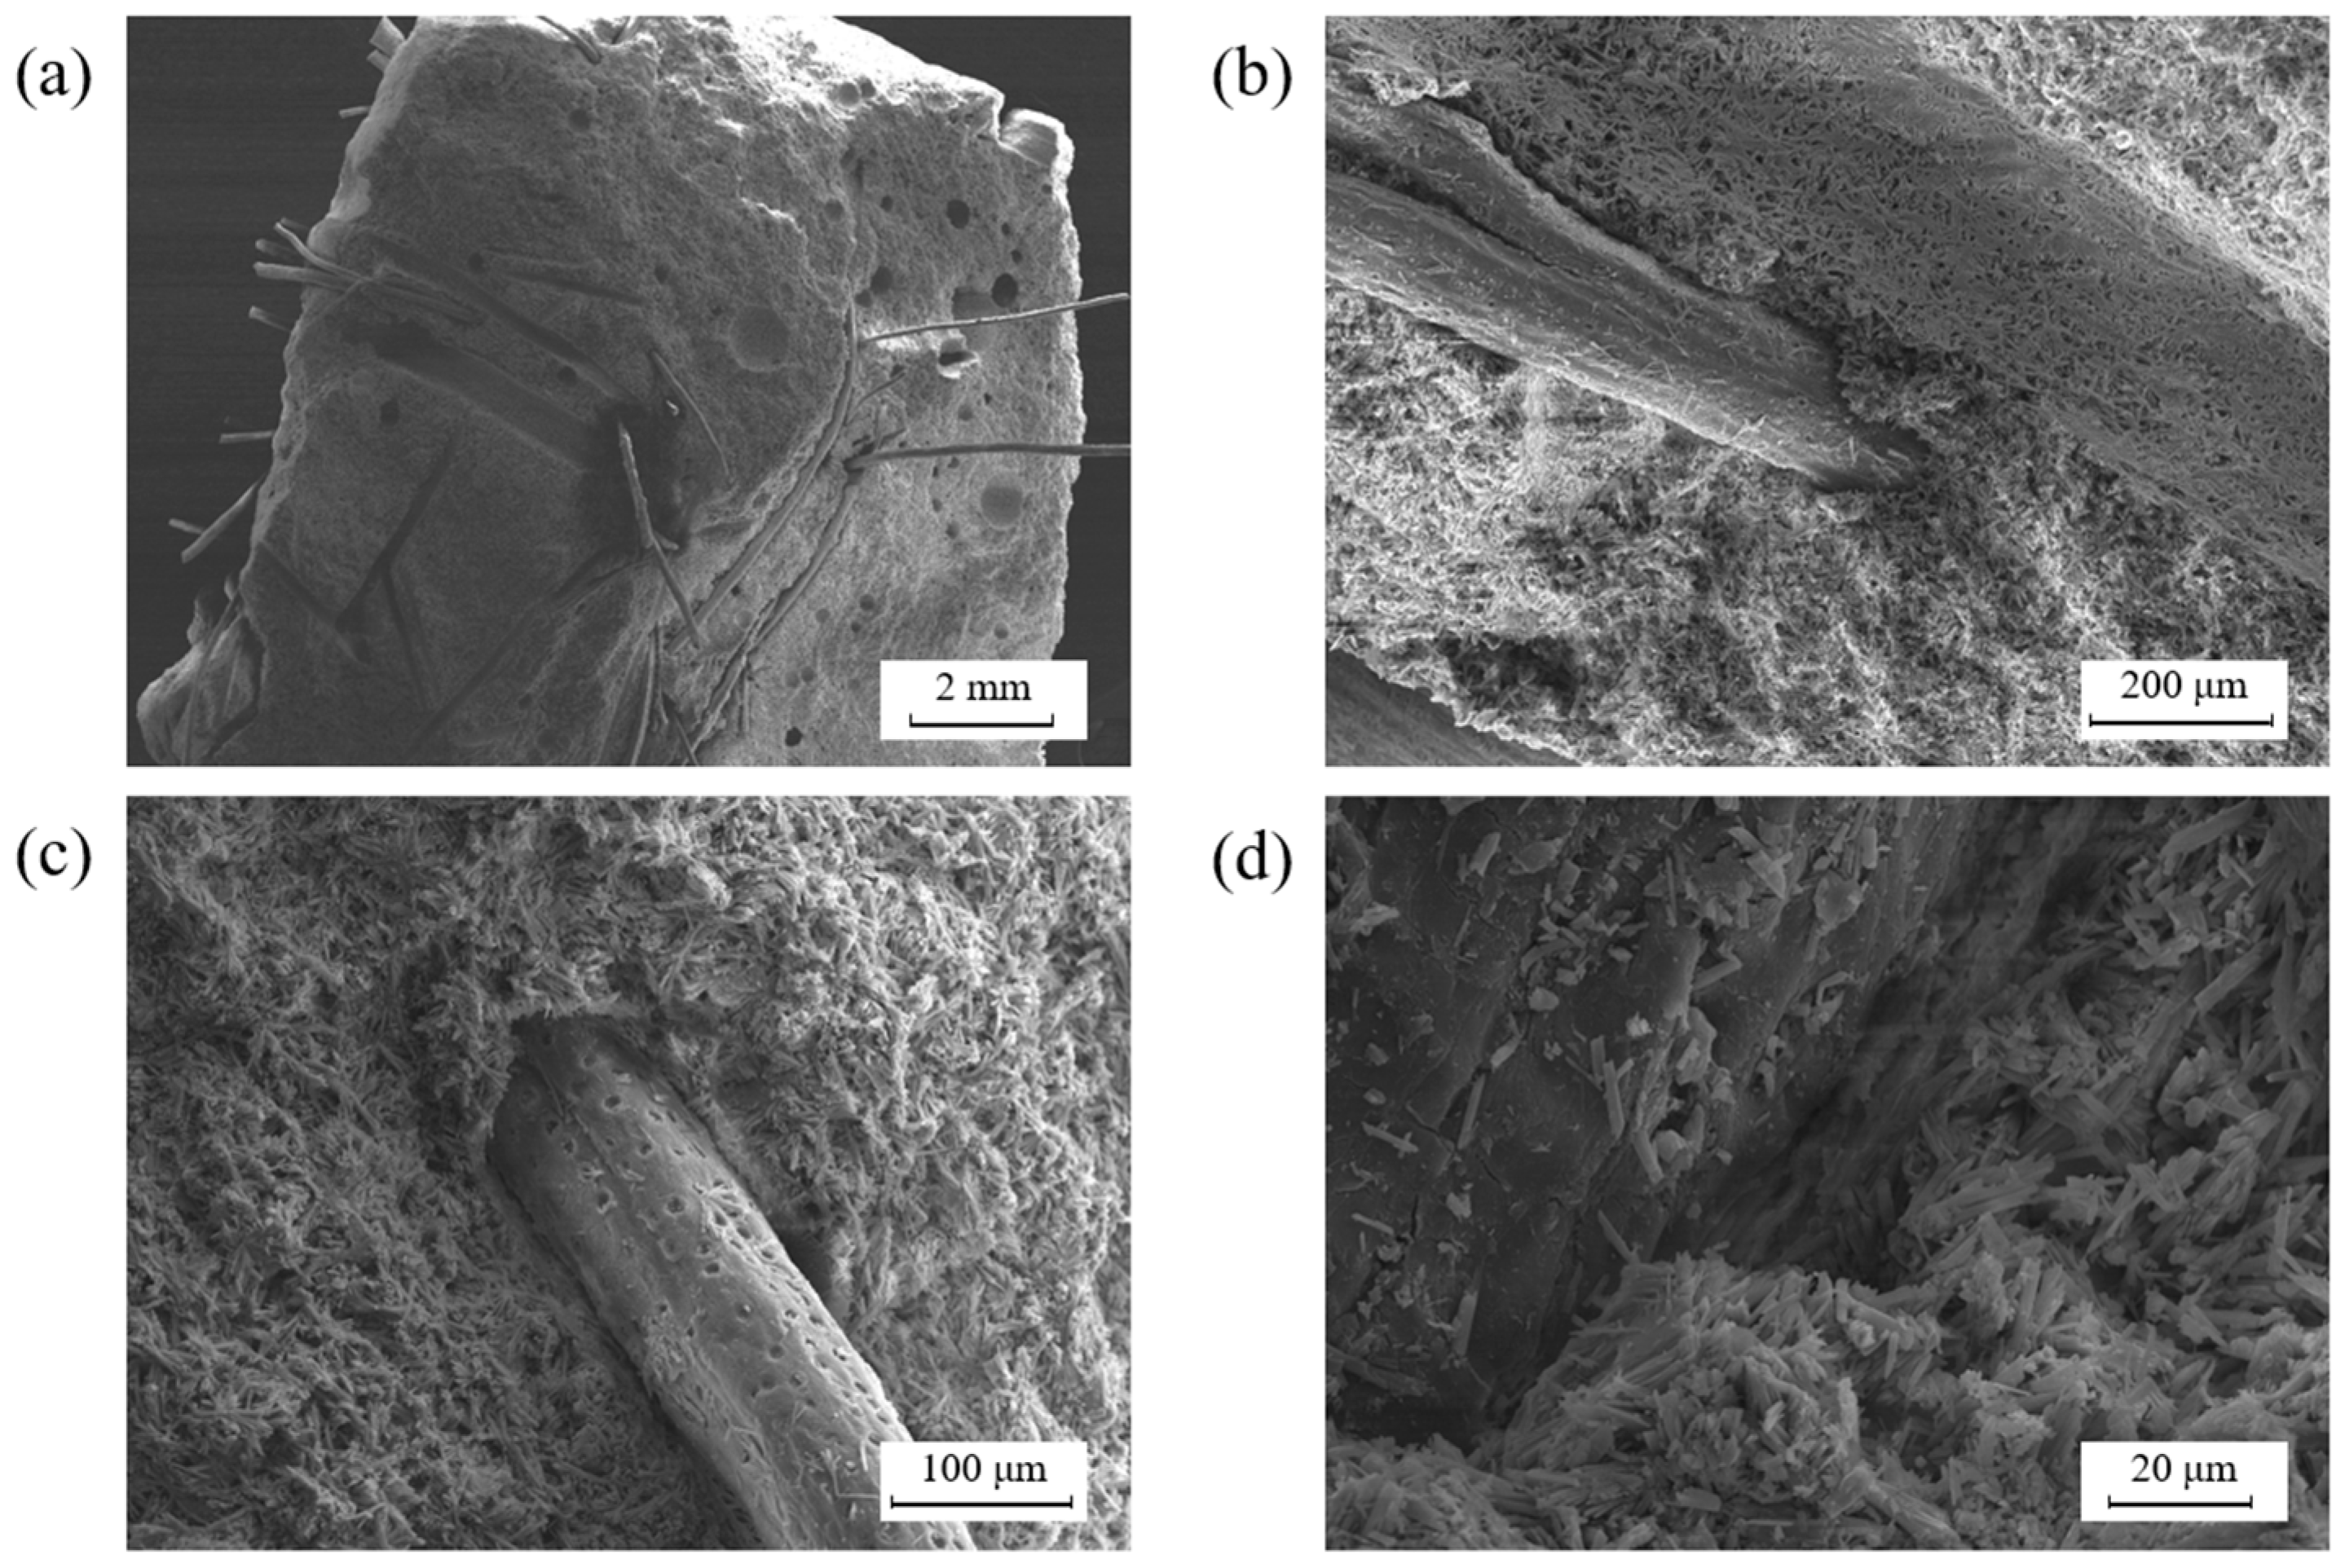
The direct relationship between surface hardness and compressive strength is widely known in the construction sector, and many articles in recent years support it. Both properties are directly related since they depend on the internal cohesion of the material and its capacity to resist external stresses without breaking or deforming [53,54]. The results obtained in this study and shown in Figure 7 follow a similar trend to that observed in previous research, in which it was evidenced that the incorporation of fibres improves compressive strength [24,27]. In line with these findings, a progressive increase in compressive strength was observed as fibre content increased, reaching a maximum value of 8.77 MPa in sample P0.7-12.5CF. All samples met the requirements established for construction applications, exceeding the minimum value of 2 MPa according to UNE-EN 13279-2:2014 [39]. However, the compressive strength decreased when the fibre content exceeded the optimum level, as reported in previous research [15,24]. In this study, a similar behaviour was observed in the P0.7-17.5CF specimen, which presented a decrease of 18.30% compared to the reference specimen, obtaining a value of 5.58 MPa. This reduction in strength is attributed to the increase in the porosity of the composite and to a non-homogeneous distribution of the fibres, which affects its capacity to withstand compressive loads effectively.
Simultaneously, the surface hardness of the samples tended to increase with the incorporation of fibres, reaching values higher than those established by UNE-EN 102042:2023 [40], which sets a minimum of 45 Shore C units. However, it is essential to note that an excessive addition of fibres, as observed in other studies [24,29], can reduce surface hardness. This phenomenon was observed in sample P0.7-17.5CF, which has the highest fibre content and is attributed to increased porosity in the composite material, thus affecting its ability to maintain a rigid surface.
As shown in Figure 7, surface hardness showed a direct relationship with compressive strength, since materials with higher hardness tend to exhibit higher strength due to their lower deformability. The addition of fibres influenced both compressive strength and surface hardness, corroborating that, although a moderate fibre content improves mechanical properties, an excess of fibres can have an adverse effect, as documented by other studies [24,29].

3.1.3. SEM Analysis

SEM was used to understand the interface between the coconut fibre and the plaster matrix. Figure 8 presents the SEM images obtained for the P0.7-15.0CF composite, which contained the highest amount of coconut fibre per cubic metre. These images were extracted from the sample’s interior after the flexural test. At no time was the composite’s surface texture modified, and the images were obtained trying to ensure maximum representativeness for the whole matrix of the analysed sample.
First, Figure 8a shows a general composite image with the random distribution of coconut fibres in its matrix. Some porosity in the plaster matrix is appreciated due to the possible occluded air during setting; this effect has been observed in previous investigations in gypsum composites with natural fibres [55]. Recent investigations have confirmed that these cavities in gypsum-based materials substantially impact their bulk density, thermal conductivity, and water absorption [56]. Likewise, a homogeneous distribution of the fibre in the composite matrix is also observed, which evidences its good dispersion during the mixing process. Figure 8b shows the good mechanical bond between the fibre and the plaster matrix, where a strong adhesion is evident that prevents fibre slippage during mechanical tests and reduces brittle fracture [57]. This bonding can be seen in more detail in Figure 8c,d, where the formation of dihydrate crystals (CaSO4·2H2O) at the fibre–matrix bond interface is observed, which evidences its good anchorage and integration of these reinforcing materials in the plaster composites [23]. Additionally, no damage is observed on the surface of the coconut fibres (Figure 8c), which implies that during the setting process, the hydration reactions of the gypsum material do not attack this plant-based reinforcement.

3.2. Water Properties

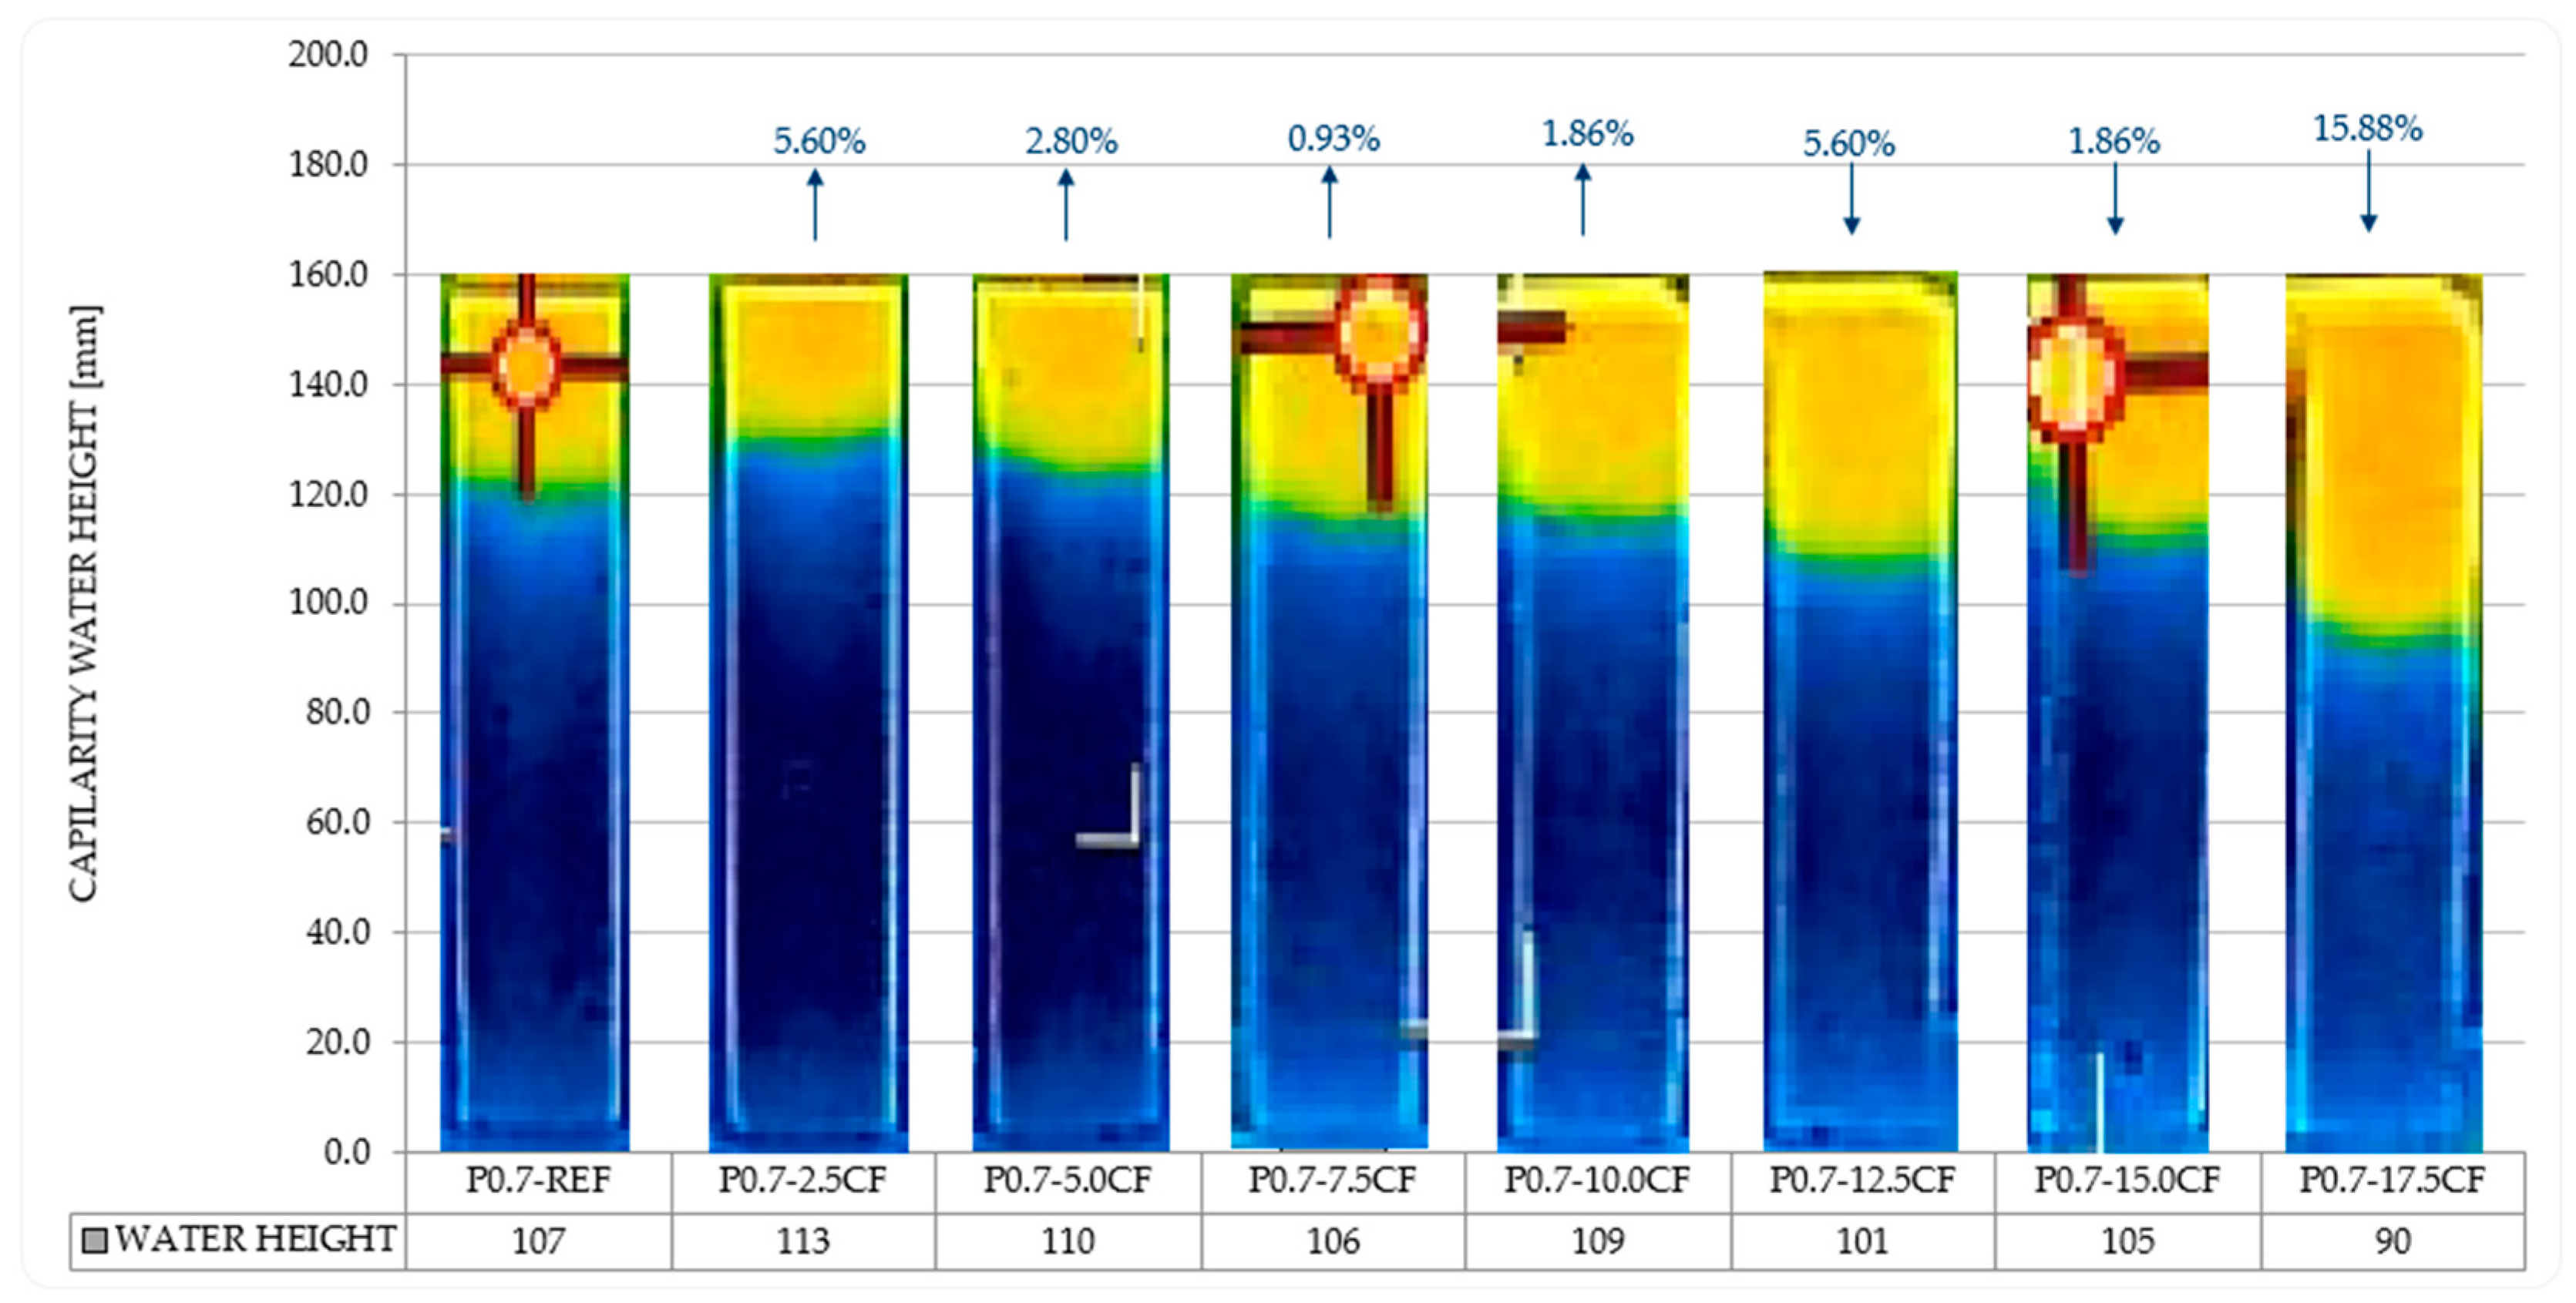
3.2.1. Capillary Water Absorption and Capillary Water Height

Figure 9 presents the results of the capillary water absorption test, complemented with a thermographic analysis performed after the test (Figure 10). It can be observed that progressively increasing the coconut fibre content in the composites decreases the slope of the regression lines obtained during the capillary water absorption test. This is due to the effect of the fibres that reduce water absorption by generating heterogeneity in the connection between the internal pores of the composite, as has been observed in previous investigations [29]. Thus, for the composite with higher fibre content P0.7-17.5CF, the lower slope of the regression line can be observed, i.e., a lower mass of water absorbed per unit time. Likewise, Figure 10 shows that these fibres also decrease the connection between the internal pores of the material, so that the height reached by the water after the test is 15.88% lower than that of the reference sample. These findings underscore the effectiveness of fibres in improving the hydrophobic properties of gypsum composites by limiting capillary spaces that could facilitate water infiltration, resulting in reduced moisture absorption.

3.2.2. Total Water Absorption and Open Porosity

Table 11 and Figure 11 show how increasing coconut fibre content causes variable total water absorption, although a general tendency to stabilise at higher fibre values is observed. As for open porosity, a progressive decrease is evident as fibre content increases, reaching its minimum value at compound P0.7-17.5CF. This trend agrees with previous studies [21,29], where water absorption decreased with increasing fibre content. Likewise, open porosity was also reduced by incorporating fibres into the composites [29]. This reduction in pore volume suggests less accessibility of the pores from the outside. By generating a structure with less porous connectivity, the material becomes less permeable, thus improving its hydrophobic properties.

3.3. Application in Precast

This section evaluates the possible applications of the composite materials developed in this research. It focuses on their use in manufacturing prefabricated modular panels for partition walls and false ceilings and highlights their potential to contribute to building energy efficiency.

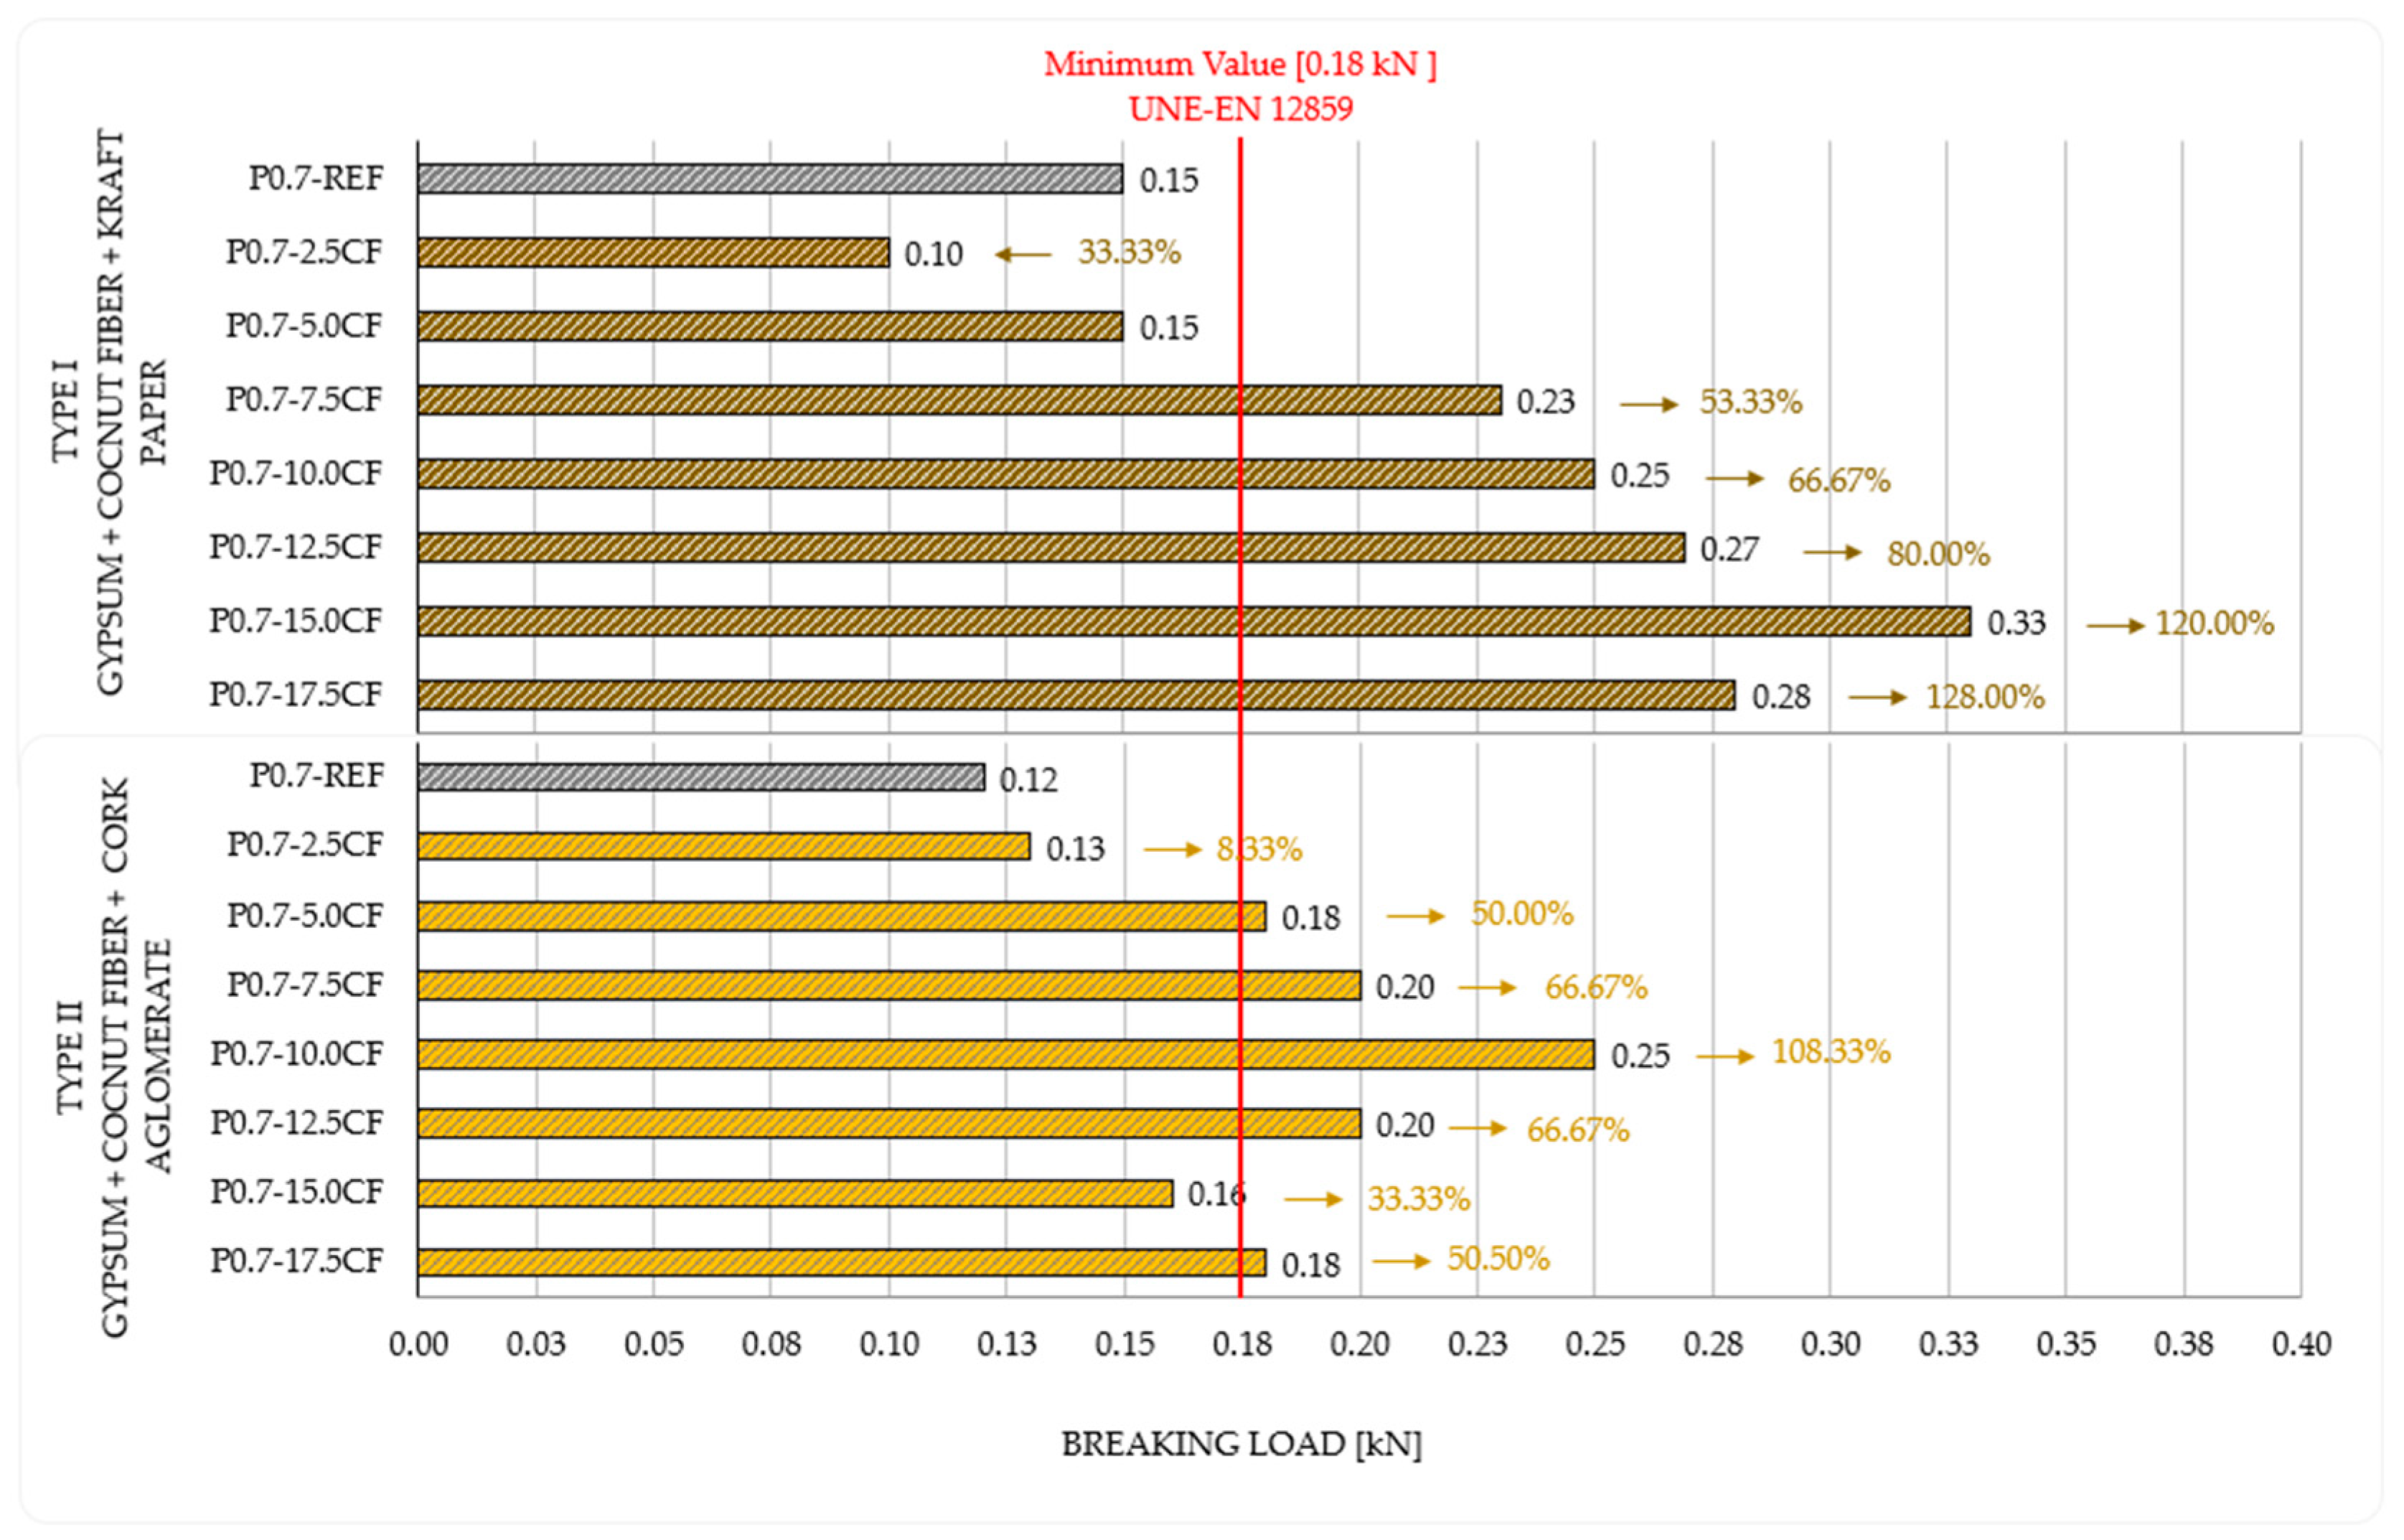
3.3.1. Flexural Strength and Impact Hardness

Two types of plates were designed to evaluate the flexural strength of the coconut fibre plaster plates, each with dimensions of 40 × 30 × 1.5 cm, testing seven specimens per type (Figure 12). The first type was made of plaster and coconut fibre and incorporated two sheets of Kraft paper [39] on both sides of the plates. The second type included a sheet of agglomerated cork [40] on one side.
Figure 13 shows the results obtained for the precast tests. The panels manufactured with partial replacement of plaster by coconut fibre and two sheets of Kraft paper showed the best performance. In particular, the panel with 15.00% fibre outperformed the other configurations. In contrast, the panels incorporating an agglomerated cork sheet generally showed lower flexural strength, with several results below the minimum requirement of 0.18 kN established by UNE-EN 12859:2012 [47]. The panel with a fibre content of 10.00% obtained a higher strength, reaching 108.33% more than the reference plate. These results are consistent with those reported in previous investigations that evaluated the behaviour of composites reinforced with natural fibres [29], where improvements in flexural strength were also observed when incorporating this type of reinforcement.

3.3.2. Thermal Conductivity and Bulk Density

The density and thermal properties of 24 × 24 × 3 cm panels composed of coconut fibre-reinforced plaster were evaluated (Figure 14). The addition of fibres decreased the material density compared to pure plaster panels, which has been reported in previous studies [20,22,24,29], who also identified a similar trend when fibres were introduced in the composites. Specimen P0.7-17.5CF presented the lowest density, with a reduction of 9.46% compared to the reference specimen, which confirms the effectiveness of incorporating fibres to produce lightened composites. Table 12 presents the results obtained in other investigations on the density test applied to different types of fibres.
Table 12 shows that, with an addition of 2.50%, coconut fibres (P-CF) recorded a density of 1055.03 kg/m3, which represents 18.01% more compared to pine wood fibres at 2.00% addition (894 ± 17 kg/m3) [24]. At 5.00%, the P-CF specimens reached a density of 1044.64 kg/m3, while the date palm fibres showed a higher value of 1226.24 kg/m3 [22], which represents a variation of 17.38% more compared to the P-CF specimens.
In the 10.00% range, other researchers [20] reported a density of 1183.59 kg/m3, 9.10% higher than date palm fibres, which registered 1084.48 kg/m3 [22]. On the other hand, the P-CF specimens in this percentage showed a lower value of 1038.26 kg/m3, which represents a reduction of 4.26% compared to date palm fibres [22] and 12.28% compared to the results obtained by Aramwit et al. [20].
In higher proportions, at 15.00%, the specimens of this research recorded a density of 1036.91 kg/m3, while those of date palm and hemp fibre presented a value of 861.86 kg/m3 [22] and 575 kg/m3 [29], respectively, that is, a difference of 20.31% and 80.33%. Finally, in the range of 20.00%, the specimens of coconut fibres [20] presented a higher density compared to those made with date palm fibres [22], and the same occurred at 30.00% for hemp fibres [29].
The reduction in density is directly related to a decrease in thermal conductivity, indicating an improvement in the insulating capacity of the composite. The reduction in thermal conductivity has been documented with the inclusion of fibres [20,21,29], suggesting that the presence of reinforcements, by decreasing the density of the material, positively affects its thermal insulation capacity. This combination of reduced thermal conductivity and lower weight suggests the potential application of these composites in manufacturing lightweight partitions for construction, contributing to energy efficiency and sustainability in buildings.
Table 13 shows the thermal conductivity coefficients of coconut fibre plaster composites, while Table 14 presents the thermal conductivity test results of composites reinforced with different fibres.
Coconut fibre shows lower conductivity than other fibres. At 5.00%, it presents 59.05% less thermal conductivity than date palm fibre; at 10.00%, the reduction is 44.44%; and at 15.00%, the decrease is 39.67% [22], in addition to being 14.12% lower than that of hemp [29]. These results indicate that coconut fibre, in the analysed proportions, presents a competitive thermal conductivity, suggesting its potential for thermal insulation applications in building materials.

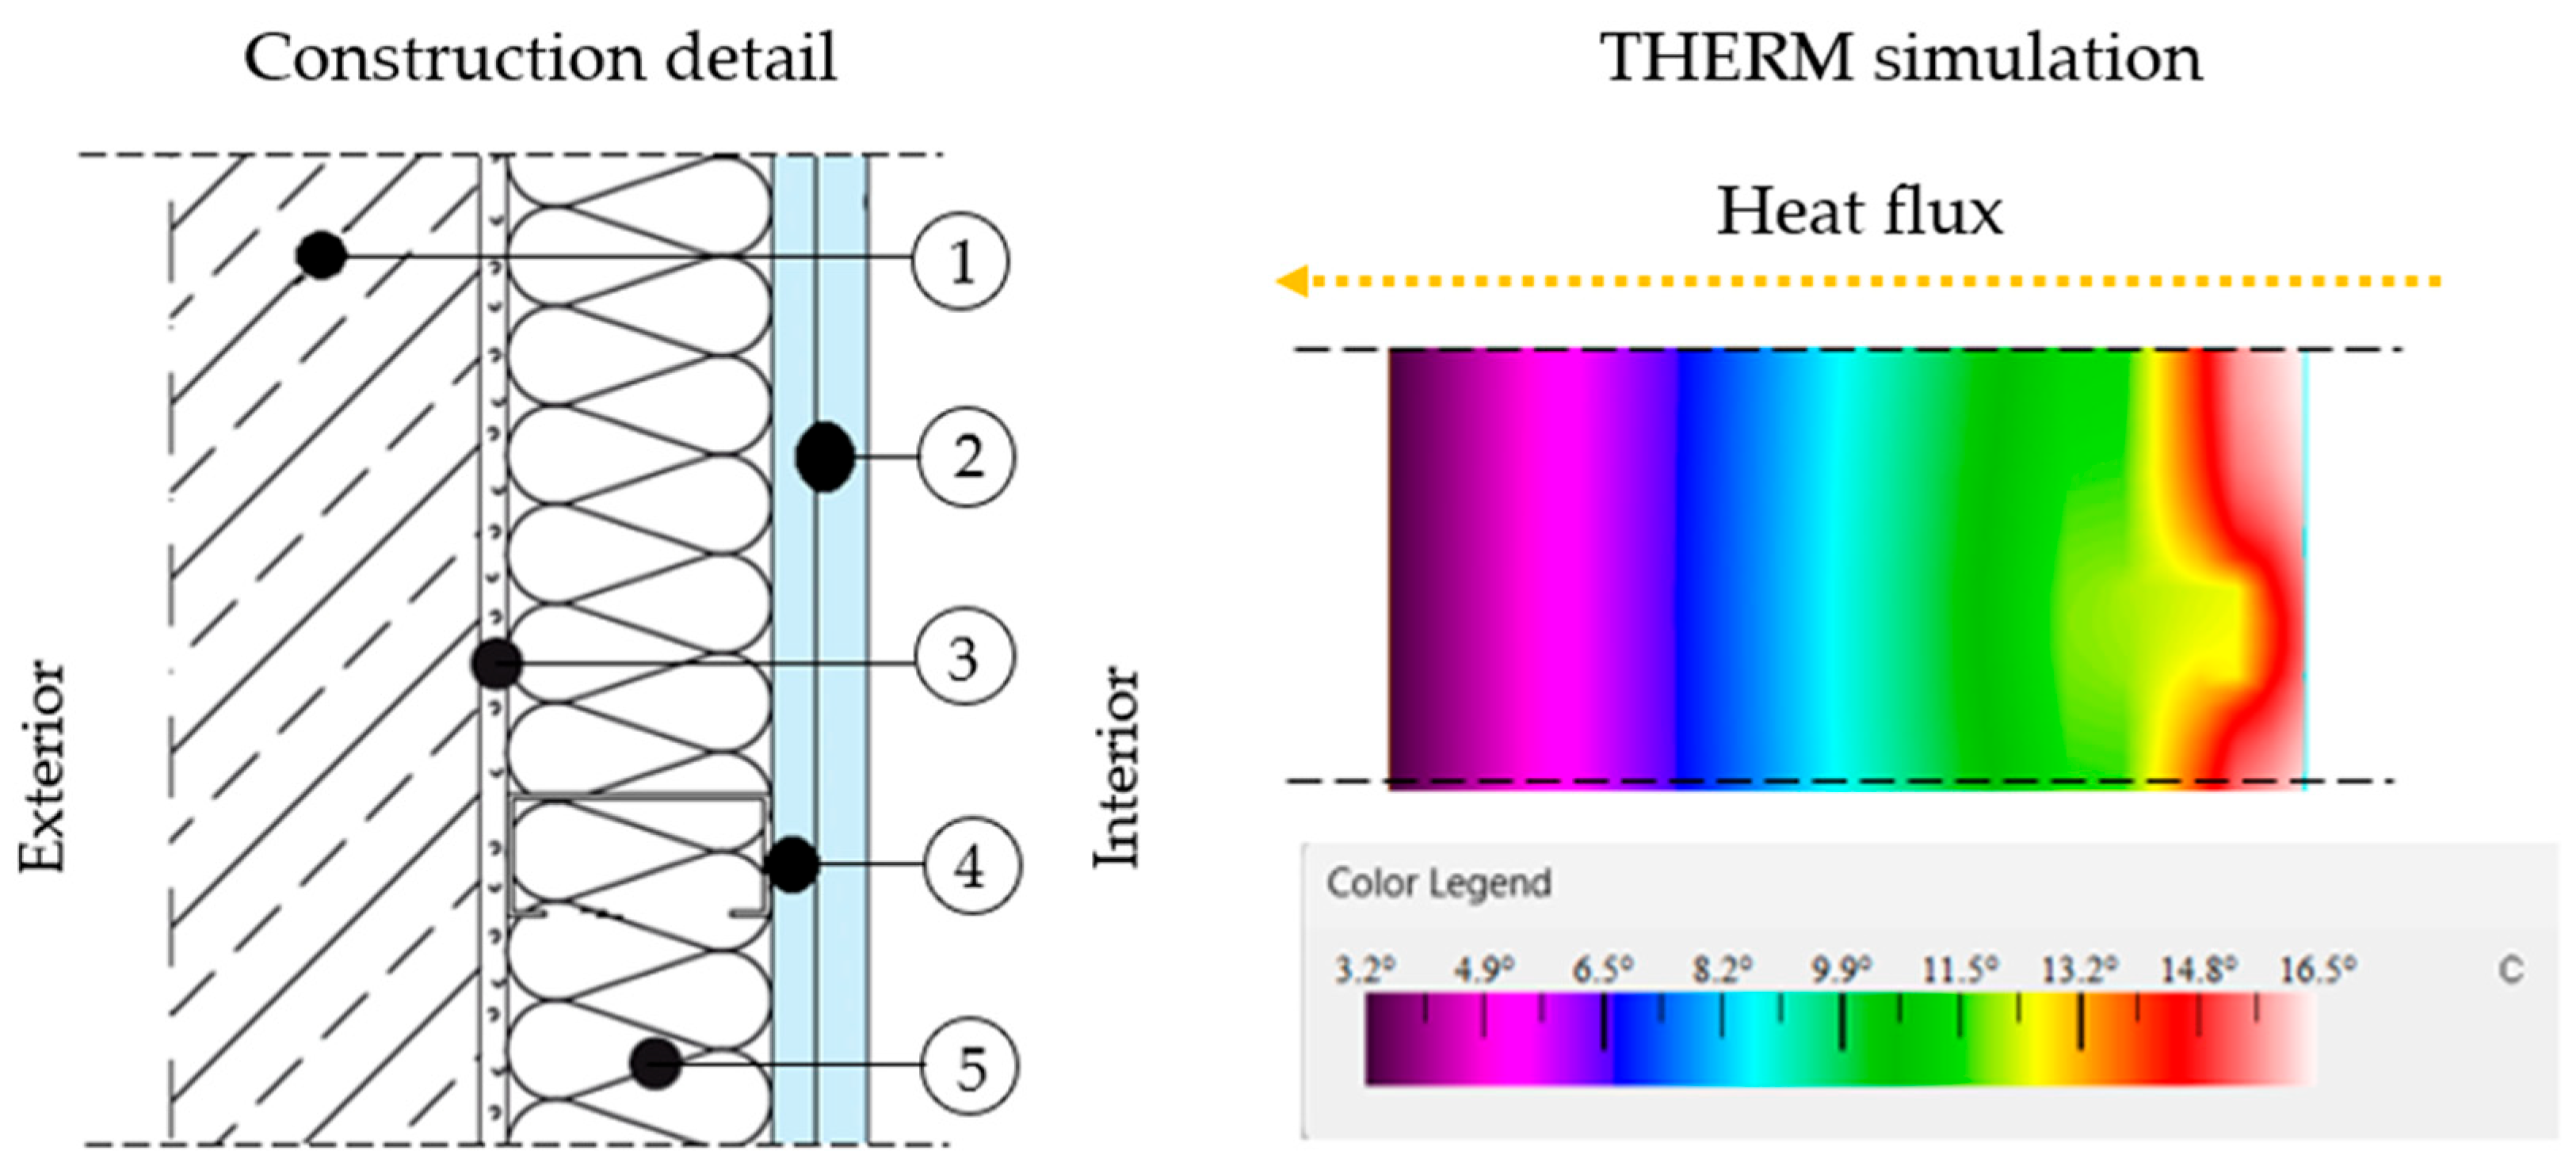
3.3.3. Thermal Performance Simulation

The thermal performance of a wall composed of concrete block, galvanised steel structure, 40 mm rock wool, and two 12.5 mm thick gypsum boards was evaluated, as shown in Figure 15. This construction system was modelled using THERM software to determine its thermal performance in real conditions in Madrid during the winter season.
Table 15 presents the thermal properties of the materials used in the simulation, while Table 16 shows the climatic conditions of Madrid, Spain. Table 17 summarises the results obtained after the simulation, and Figure 16 shows the graphical representation corresponding to the simulation of the composite with the highest coconut fibre content (P0.7-17.5CF), generated using the “Colour Infrared” option of the THERM software; the colour scale indicates the resulting thermal gradient across the dry lining.
In the results obtained, it is observed that, as the dosage of coconut fibre in the plaster increases, the U-Factor decreases progressively, while the R-value increases. The reference mixture presents a U-Factor of 0.4022 W/m2·K, while the best dosage (P0.7-17.5CF) reaches a value of 0.3733 W/m2·K, which represents a 7.19% reduction in thermal transmittance. Conversely, the R-value of the base mix is 2.4865 m2·K/W, increasing to 2.6791 m2·K/W at the P0.7-17.5CF dosage, which implies a 7.75% improvement in thermal resistance.
These results indicate that incorporating coconut fibre in the plaster reduces the mixture’s thermal conductivity, improving its insulating capacity. This optimisation could decrease the energy consumption associated with heating during the winter.
According to the Technical Building Code (CTE-HE1) [51] for climate zone D3 (Madrid), the maximum limit of the U-Factor for opaque walls is 0.41 W/m2·K. All the evaluated configurations comply with this requirement, which validates the system’s viability from a regulatory point of view.

3.4. Critical Reflection and Implications for Industry

The construction sector faces the challenge of developing solutions that balance environmental sustainability, regulatory compliance and technical and economic feasibility. From this perspective, coconut fibre-reinforced plaster composites have been developed, which stand out for their benefits in terms of reduced environmental impacts and improved functional properties.
The research results have shown that these composites’ mechanical and thermal properties are suitable for use in prefabricated elements, complying with current standards. Figure 17 presents a qualitative analysis based on normalised (dimensionless) indexes for the global discussion of the results obtained, where the reference composite (P0.7-REF) is assigned a value of 1.00 for each property analysed, and the rest of the dosages are expressed as relative ratios to this base value. This type of presentation allows a general comparison of the performance of all formulations. The results confirm that these materials guarantee the structural integrity of precast elements and improve energy efficiency. In addition, their reduced density makes it possible to manufacture lighter and easier to transport components, which could optimise logistical costs, facilitate on-site handling, and shorten construction times.
From an environmental perspective, these composites promote circularity by reusing low-cost, highly available agricultural by-products, aligning with market demands for sustainable materials and the global goals of decarbonisation and resource efficiency [62].
However, specific technical challenges were identified for large-scale implementation. Coconut fibres’ moisture absorption poses durability and dimensional stability issues, suggesting the need for surface treatments or additives to mitigate these effects. In addition, natural fibres’ inherent variability requires stringent controls in the supply chain and manufacturing processes to ensure uniformity of final product properties.
For all these reasons, integrating coconut fibres in plaster composites represents an opportunity to move towards more sustainable and efficient construction practices. The results confirmed its technical and regulatory feasibility for applications in prefabricated elements, standing out for its lightness, thermal properties, and environmental benefits. However, several barriers must be overcome to ensure its commercialisation, including high initial cost, risks associated with adopting new materials, and technical, cultural, and perception barriers [63].

4. Conclusions

An innovative material has been developed and evaluated for its potential application in construction solutions, focused on improving thermal insulation and mechanical resistance. Coconut fibre is postulated as an alternative reinforcement material to conventional synthetic fibres for elaborating prefabricated elements. The following main conclusions can be drawn from the experimental programme:
  • The increase in fibre content led to a reduction in bulk density. The P0.7-17.5CF specimen, with higher fibre content, presented a 9.46% lower density than the reference sample, evidencing the fibres’ effectiveness in decreasing the composite’s total weight.
  • Simultaneously with the increase in fibre, the surface hardness increased; however, an excessive addition of fibre, as in specimen P0.7-17.5CF, decreased surface hardness, attributed to increased porosity in the composite material.
  • A progressive decrease in the dynamic modulus of elasticity was observed with increasing fibre content; in particular, the P0.7-17.5CF specimen presented the most significant difference (33.94%) compared to the reference specimen.
  • Fibre reinforcement in the composites improved the flexural strength, reaching a maximum of 4.35 MPa with a 20.50% improvement over the reference specimen, specimen P0.7-15.0CF. However, as in specimen P0.7-17.5CF, excessive fibre content reduced the load-carrying capacity.
  • A progressive increase in compressive strength was achieved, reaching a maximum of 8.77 MPa in sample P0.7-12.5CF; however, when the fibre content exceeded the optimum level, as in sample P0.7-17.5CF, the compressive strength decreased by 18.30%, which is attributed to increased porosity and inhomogeneous fibre distribution.
  • SEM images showed good mechanical bonding between the fibre and matrix, with strong adhesion preventing fibre slippage and reducing the possibility of brittle breakage. In addition, the formation of dihydrate crystals (CaSO4·2H2O) was observed at the fibre–matrix interface, confirming its good anchorage and integration. No damage was evidenced on the surface of the fibres, indicating that the kneading process does not affect their structural integrity.
  • The incorporation of coconut fibre reduced the capillarity of the composite. In particular, adding 17.50% coconut fibre in the plaster matrix decreased the capillary height by 15.88% compared to the reference material. This reduction in water infiltration is attributed to the ability of the fibres to limit capillary spaces within the matrix, thus improving the hydrophobic properties of the material and its moisture resistance. In addition, increasing the coconut fibre content in the plaster matrix influences the composite’s water absorption and open porosity. Although total water absorption varies, it tends to stabilise at higher fibre levels, while open porosity decreases progressively with increasing fibre content, reaching its minimum value at composite P0.7-17.5CF. This reduction in pore volume suggests lower pore connectivity, which limits water accessibility and improves the hydrophobic properties of the material, making it less permeable.
  • The incorporation of coconut fibre in the plaster panels significantly reduced their density, which in turn decreased the thermal conductivity and improved the insulating capacity of the material. In particular, the P0.7-15.0CF composite presented a 4.96% reduction in density compared to the reference, translating into a decreased thermal conductivity of 51.33%. In addition, coconut fibre in plaster improves the thermal efficiency of the rendering, with a reduction in the U-Factor and an increase in the R-value. The best option is the P0.7-17.5CF dosage since it has the lowest U-Factor and the highest thermal resistance. Although the thermal improvement is not drastic, this combination of properties could generate significant energy savings in heating.
However, there are still important aspects to be addressed. A long-term durability study is needed, including accelerated ageing tests to evaluate the behaviour of the composite under real environmental conditions, such as humidity and temperature changes, as well as its resistance to chemical and biological agents. In addition, the acoustic behaviour of these panels should be investigated, since the observed density reduction could contribute to improving their acoustic insulation properties. Finally, tests should be carried out to determine how the inclusion of coconut fibre affects the composite’s ability to resist fire. This involves conducting flammability tests and analysing its behaviour during prolonged exposure to high temperatures.
The use of coconut fibre, which is aligned with circular economy principles, not only utilises a renewable resource but also improves the thermal properties of the composite. This offers a sustainable alternative for ceiling panels and lightweight partitions that can contribute to reducing energy demand in buildings, which is relevant to the sector’s energy efficiency and decarbonisation goals.

Author Contributions

Conceptualisation, D.F. and M.F.R.-R.; methodology, D.F., A.Z.-B. and M.F.R.-R.; software, M.F.R.-R. and A.Z.-B.; validation, D.F., A.Z.-B. and A.V.-V.; formal analysis, D.F. and M.F.R.-R.; investigation, M.F.R.-R.; resources, D.F. and A.Z.-B.; data curation, M.F.R.-R.; writing—original draft preparation, M.F.R.-R. and D.F.; writing—review and editing, D.F., A.Z.-B. and A.V.-V.; visualisation, M.F.R.-R. and A.Z.-B.; supervision, D.F. and A.V.-V.; project administration, D.F. and A.V.-V.; funding acquisition, D.F. All authors have read and agreed to the published version of the manuscript.

Funding

This research was funded by Comunidad de Madrid through the project: Transformación de residuos para desarrollar nuevos productos de construcción medioambientalmente sostenibles con propiedades mecánicas y térmicas mejoradas—WASTE2BUILDINS, grant number M230020126A.

Data Availability Statement

All data have been included in the manuscript.

Acknowledgments

The Madrid Government (Comunidad de Madrid-Spain) has supported this work under the Multiannual Agreement 2023–2026 with Universidad Politécnica de Madrid in Line A, Emerging PhD researchers.

Conflicts of Interest

The authors declare no conflict of interest.

References

  1. United Nations Environment Programme. Global Status Report for Buildings and Construction: Beyond foundations: Mainstreaming Sustainable Solutions to Cut Emissions from the Buildings Sector; United Nations Environment Programme: Nairobi, Kenya, 2024. [Google Scholar] [CrossRef]
  2. Santos, P.; Lopes, P.; Abrantes, D. Thermal Performance of Load-Bearing, Lightweight, Steel-Framed Partition Walls Using Thermal Break Strips: A Parametric Study. Energies 2022, 15, 9271. [Google Scholar] [CrossRef]
  3. IEA. The Energy Efficiency Policy Package: Key Catalyst for Building Decarbonisation and Climate Action; IEA: Paris, France, 2023.
  4. World Green Building Council. Advancing Net Zero Status Report 2023; World Green Building Council: London, UK, 2023. [Google Scholar]
  5. Green Building Council España. Descarbonizar la Edificación en Todo su Ciclo de Vida—Guía Paso a Paso para Ciudades. 2023. Available online: https://gbce.es/wp-content/uploads/2024/05/roadmap-final_guia-paso-a-paso-para-ciudades-2.pdf (accessed on 26 May 2025).
  6. Könnölä, K.; Kangas, K.; Seppälä, K.; Mäkelä, M.; Lehtonen, T. Considering sustainability in cruise vessel design and construction based on existing sustainability certification systems. J. Clean. Prod. 2020, 259, 120763. [Google Scholar] [CrossRef]
  7. IEA Publications International Energy Agency. Energy Technology Perspectives 2023; IEA: Paris, France, 2023.
  8. Mordor Intelligence. Green Building Materials Market Size & Share Analysis. Growth Trends & Forecast (2025–2030). Green Building Materials—Market Size & Report. Available online: https://www.mordorintelligence.com/industry-reports/green-building-materials-market (accessed on 26 May 2025).
  9. United Nations Environment Programme. Building Materials and the Climate: Constructing a New Future; United Nations Environment Programme: Nairobi, Kenya, 2023. [Google Scholar] [CrossRef]
  10. Doleželová, M.; Scheinherrová, L.; Krejsová, J.; Keppert, M.; Černý, R.; Vimmrová, A. Investigation of gypsum composites with different lightweight fillers. Constr. Build. Mater. 2021, 297, 123791. [Google Scholar] [CrossRef]
  11. Global Gypsum. Global Gypsum Supply Top 10—2023. 2023. Available online: https://www.globalgypsum.com/magazine/articles/804-global-gypsum-supply-top-10-2023 (accessed on 26 May 2025).
  12. Mucha, M.; Mróz, P.; Kocemba, A. Polymer composites based on gypsum matrix. In Proceedings of the VIII International Conference on “Times of Polymers and Composites”, Naples, Italy, 19–23 June 2016; American Institute of Physics: College Park, MD, USA, 2016. [Google Scholar]
  13. Yu, Q.; Brouwers, H.J. Microstructure and mechanical properties of b-hemihydrate produced gypsum: An insight from its hydration process. Constr. Build. Mater. 2011, 25, 3149–3157. [Google Scholar] [CrossRef]
  14. Yıldızel, S.A.; Çarbaş, S. Mechanical performance comparison of glass and mono fibres added gypsum composites. Chall. J. Struct. Mech. 2018, 4, 9. [Google Scholar] [CrossRef]
  15. Al-Ridha, A.S.D.; Abbood, A.A.; Hussein, F.M.; Dheyab, L.S.; Abdullah, E.L.N.; Ali, E.H.Z.; Mohialdeen, E.M.S.; Abdulhussein, E.A.A. Effect of Chopped Sisal fibre (CSF) on enhancing the compressive strength of Local Plaster of Paris (LPOP). Mater. Today Proc. 2021, 47, 2575–2579. [Google Scholar] [CrossRef]
  16. Rivero, L. Fabricación de productos de base yeso y sus aplicaciones industriales. Bol. Soc. Esp. Cerám. Vidr. 1997, 36, 591–598. [Google Scholar]
  17. Iucolano, F.; Liguori, B.; Aprea, P.; Caputo, D. Thermo-mechanical behaviour of hemp fibres-reinforced gypsum plasters. Constr. Build. Mater. 2018, 185, 256–263. [Google Scholar] [CrossRef]
  18. del Río-Merino, M.; Vidales-Barriguete, A.; Piña-Ramírez, C.; Vitiello, V.; Santa Cruz-Astorqui, J.; Castelluccio, R. A review of the research about gypsum mortars with waste aggregates. J. Build. Eng. 2022, 45, 103338. [Google Scholar] [CrossRef]
  19. Sheng, D.D.C.V.; Ramegowda, N.S.; Guna, V.; Reddy, N. Groundnut shell and coir reinforced hybrid bio composites as alternative to gypsum ceiling tiles. J. Build. Eng. 2022, 57, 104892. [Google Scholar] [CrossRef]
  20. Aramwit, P.; Daniel Chin Vui Sheng, D.; Krishna Moorthy, G.; Guna, V.; Reddy, N. Rice husk and coir fibres as sustainable and green reinforcements for high performance gypsum composites. Constr. Build. Mater. 2023, 393, 132065. [Google Scholar] [CrossRef]
  21. Guna, V.; Yadav, C.; Maithri, B.R.; Ilangovan, M.; Touchaleaume, F.; Saulnier, B.; Grohens, Y.; Reddy, N. Wool and coir fibre reinforced gypsum ceiling tiles with enhanced stability and acoustic and thermal resistance. J. Build. Eng. 2021, 41, 102433. [Google Scholar] [CrossRef]
  22. Braiek, A.; Karkri, M.; Adili, A.; Ibos, L.; ben Nasrallah, S. Estimation of the thermophysical properties of date palm fibres/gypsum composite for use as insulating materials in building. Energy Build. 2017, 140, 268–279. [Google Scholar] [CrossRef]
  23. Désiré Omgba Betené, A.; Martoïa, F.; Dumont, P.J.J.; Ebanda Betené, F.; Ateba, A. Gypsum plaster composites reinforced with tropical fibre bundles extracted from Rhecktophyllum camerunense and Ananas comosus plants: Microstructure and mechanical performance. Constr. Build. Mater. 2023, 392, 131815. [Google Scholar] [CrossRef]
  24. Kuqo, A.; Mai, C. Mechanical properties of lightweight gypsum composites comprised of seagrass Posidonia oceanica and pine (Pinus sylvestris) wood fibres. Constr. Build. Mater. 2021, 282, 122714. [Google Scholar] [CrossRef]
  25. Iucolano, F.; Caputo, D.; Leboffe, F.; Liguori, B. Mechanical behavior of plaster reinforced with abaca fibres. Constr. Build. Mater. 2015, 99, 184–191. [Google Scholar] [CrossRef]
  26. Zidi, S.; Miraoui, I. Mechanical and morphological analysis of cellulose extracted from sisal fibres and their effect on bio-based composites mechanical properties. Funct. Compos. Struct. 2024, 6, 015008. [Google Scholar] [CrossRef]
  27. Alcaraz, J.S.; Belda, I.M.; Sanchis, E.J.; Gadea Borrell, J.M. Mechanical properties of plaster reinforced with yute fabrics. Compos. Part B Eng. 2019, 178, 107390. [Google Scholar] [CrossRef]
  28. Belayachi, N.; Hoxha, D.; Slaimia, M. Impact of accelerated climatic aging on the behavior of gypsum plaster-straw material for building thermal insulation. Constr. Build. Mater. 2016, 125, 912–918. [Google Scholar] [CrossRef]
  29. Ferrández, D.; Álvarez, M.; Zaragoza-Benzal, A.; Cobo-González, Á.; Santos, P. Development and Characterization of Innovative Hemp–Gypsum Composites for Application in the Building Industry. Appl. Sci. 2024, 14, 2229. [Google Scholar] [CrossRef]
  30. Wolfgang, S.; Narendra, R.; Soren, B.; Anand, R. Coir from Coconut Processing Waste as a Raw Material for Applications Beyond Traditional Uses. BioResources 2023, 18, 2187–2212. [Google Scholar] [CrossRef]
  31. IBERYOLA®. Iberyola® E-30/E35. Technical Sheet. 2023. Available online: https://www.placo.es/documents/fichas-tecnicas/ft-iberyola-es.pdf (accessed on 26 May 2025).
  32. UNE-EN 13279-1:2009; Gypsum Binders and Gypsum Plasters—Part 1: Definitions and Requirements. Asociación Española de Normalización: Madrid, Spain, 2009.
  33. Subdirección de Calidad de las Aguas. Características de Calidad de las Aguas. Análisis Completo; Canal de Isabel II: Madrid, Spain, 2023. [Google Scholar]
  34. TOPCIMENT. Fibratop. Technical Sheet. Available online: https://www.topciment.com/sheets/Fibras_Vidrio_es.pdf (accessed on 26 May 2025).
  35. TOPCIMENT. Fibratop PP. Technical Sheet. Available online: https://www.topciment.com/sheets/Fibras_Polipropileno_es.pdf (accessed on 26 May 2025).
  36. Sanou, I.; Bamogo, H.; Sory, N.; Gansoré, A.; Millogo, Y. Effect of the coconut fibres and cement on the physico-mechanical and thermal properties of adobe blocks. Heliyon 2024, 10, e38752. [Google Scholar] [CrossRef] [PubMed]
  37. ABRIGA NATURE. Fibra de Coco Natural. Technical Sheet. Available online: https://www.abriganature.com/galeria/articulos/ficha-t%C3%A9cnica---fibra-de-coco_12_1.pdf (accessed on 26 May 2025).
  38. Van Dam, J.E.G.; van den Oever, M.J.A.; Keijsers, E.R.P.; van der Putten, J.C.; Anayron, C.; Josol, F.; Peralta, A. Process for production of high density/high performance binderless boards from whole coconut husk. Part 2: Coconut husk morphology, composition and properties. Ind. Crops Prod. 2006, 24, 96–104. [Google Scholar] [CrossRef]
  39. Corgrap, S.A. Papel Kraft Natural 75 gr. Technical Sheet. 2019. Available online: https://embaling.com/productos/relleno-proteccion/22-p-apel-embalaje-carton/papel-kraft-75-gramos (accessed on 26 May 2025).
  40. Amorim Cork Solutions. Agglomerated Cork Resilient Layer for Impact Noise Insulation of Floating Screed. Technical Sheet. Available online: https://amorimcorksolutions.com/media/7705/mds_acousticork_u32_en.pdf (accessed on 26 May 2025).
  41. UNE-EN 13279-2:2014; Gypsum Binders and Gypsum Plasters—Part 2: Test Methods. Asociación Española de Estandarización: Madrid, Spain, 2014.
  42. UNE 102042:2023; Gypsum Plasters. Other Test Methods. Spanish Association for Standardization: Madrid, Spain, 2023.
  43. UNE-EN ISO 12680-1:2007; Methods of Test for Refractory Products—Part 1: Determination of Dynamic Young’s Modulus (MOE) by Impulse Excitation of Vibration (ISO 12680-1:2005). Spanish Association for Standardization: Madrid, Spain, 2007.
  44. UNE-EN 1925:1999; Natural Stone Test Methods—Determination of Water Absorption Coefficient by Capillarity. Spanish Association for Standardization: Madrid, Spain, 1999.
  45. UNE-EN 14617-1:2013; Agglomerated Stone—Test Methods—Part 1: Determination of Apparent Density and Water Absorption. Spanish Association for Standardization: Madrid, Spain, 2013.
  46. UNE-EN 1936:2007; Natural Stone Test Methods—Determination of Real Density and Apparent Density, and of Total and Open Porosity. Spanish Association for Standardization: Madrid, Spain, 2007.
  47. UNE-EN 12859:2012; Gypsum Blocks—Definitions, Requirements and Test Methods. Spanish Association for Standardization: Madrid, Spain, 2012.
  48. UNE-EN 14246:2007; Gypsum Elements for Suspended Ceilings—Definitions, Requirements and Test Methods. Spanish Association for Standardization: Madrid, Spain, 2007.
  49. UNE-EN 520:2005+A1:2010; Gypsum Plasterboards—Definitions, Requirements and Test Methods. Spanish Association for Standardization: Madrid, Spain, 2010.
  50. UNE-EN ISO 8990:1997; Thermal Insulation. Determination of Steady-State Thermal Transmission Properties. Calibrated and Guarded Hot Box (ISO 8990:1994). Spanish Association for Standardization: Madrid, Spain, 1997.
  51. Ministerio de Vivienda y Agenda Urbana. Documento Básico HE Ahorro de Energía. 14 June 2022. Available online: https://www.codigotecnico.org/pdf/Documentos/HE/DBHE.pdf (accessed on 26 May 2025).
  52. Rosell, J.R.; Cantalapiedra, I.R. Simple method of dynamic Young’s modulus determination in lime and cement mortars. Mater. Construcción 2011, 61, 39–48. [Google Scholar] [CrossRef]
  53. Ferrández, D.; Zaragoza-Benzal, A.; Barrak, E.; Santos, P.; Rodrigues, C. Upcycling expanded polyethylene waste for novel composite materials: Physico-mechanical, hygrothermal and life cycle assessment. Results Eng. 2024, 24, 103535. [Google Scholar] [CrossRef]
  54. Romero-Gómez, M.I.; Silva, R.V.; Costa-Pereira, M.F.; Flores-Colen, I. Thermal and mechanical performance of gypsum composites with waste cellulose acetate fibres. Constr. Build. Mater. 2022, 356, 129308. [Google Scholar] [CrossRef]
  55. Xu, R.; Lu, S.; Miao, J.; Tang, C.; Yu, J. Fibre-reinforced gypsum composites with ultra high ductility: Investigation of physical and mechanical properties. Constr. Build. Mater. 2024, 457, 139285. [Google Scholar] [CrossRef]
  56. Sahraoui, A.; Djoudi, T.; Hecini, M. Investigating the impact of date palm fibre waste on the properties of a novel gypsum-based bio-composite. Constr. Build. Mater. 2024, 457, 139419. [Google Scholar] [CrossRef]
  57. Abir, N.; Siddique, A.B.; Begum, H.A.; Gafur, M.A.; Khan, A.N.; Mahmud, M.A. Effect of fibre loading on mechanical properties of jute fibre bundle reinforced gypsum composites. Heliyon 2023, 9, e18147. [Google Scholar] [CrossRef]
  58. KNAUF. W61.es Knauf Trasdosados Directos. Technical Sheet. 2019. Available online: https://knauf.com/es-ES/knauf/soluciones/aplicaciones/trasdosados (accessed on 26 May 2025).
  59. Aurea Consulting. eCondensa2 (Software). 2012. Available online: https://ecoeficiente.es/econdensa2/ (accessed on 26 May 2025).
  60. TECNI-GYPSUM. Perfiles Livianos de Acero Galvanizado STUD Conocido Como Poste. Technical Sheet. 2023. Available online: https://tecnigypsum.com/wp-content/uploads/2023/02/Fichas-Tecnicas-TG-PERFILES-STUD.pdf (accessed on 26 May 2025).
  61. KNAUF. Placa Knauf wolplac LR (Tipo MW). Technical Sheet. 2023. Available online: https://escayolasbedmar.com/wp-content/uploads/2024/04/Ficha-tecnica-Placa-Woolplac-LR.pdf (accessed on 26 May 2025).
  62. Le, D.L.; Salomone, R.; Nguyen, Q.T. Circular bio-based building materials: A literature review of case studies and sustainability assessment methods. Build. Environ. 2023, 244, 110774. [Google Scholar] [CrossRef]
  63. Le, D.L.; Salomone, R.; Nguyen, Q.T.; Versele, A.; Piccardo, C. Status and barriers to circular bio-based building material adoption in developed economies: The case of Flanders, Belgium. J. Environ. Manag. 2024, 367, 121965. [Google Scholar] [CrossRef] [PubMed]
Figure 1. Fibre length distribution.
Buildings 15 01899 g001
Figure 2. Coconut fibre used.
Buildings 15 01899 g002
Figure 3. Cork agglomerate employed.
Buildings 15 01899 g003
Figure 4. Detailed scheme of the workflow to produce specimens.
Buildings 15 01899 g004
Figure 5. Cross sections of the prepared composite matrices, illustrating the effects of different dosages after the flexural test.
Buildings 15 01899 g005
Figure 6. Dynamic modulus of elasticity (MOEus) and flexural strength.
Buildings 15 01899 g006
Figure 7. Shore C hardness and compressive strength test results for the coconut fibre–plaster composites.
Buildings 15 01899 g007
Figure 8. SEM analysis for sample P0.7-15.0CF: (a) ×20 magnification; (b) ×250 magnification; (c) ×250 magnification; (d) ×2000 magnification.
Buildings 15 01899 g008
Figure 9. Results of the capillary water absorption test.
Buildings 15 01899 g009
Figure 10. Capillarity test by thermographic imaging of composites.
Buildings 15 01899 g010
Figure 11. Total water absorption coefficient and open porosity of the developed plaster composites.
Buildings 15 01899 g011
Figure 12. (a) Plaster–coconut fibre–Kraft paper panels; (b) plaster–coconut fibre–cork chipboard panels.
Buildings 15 01899 g012
Figure 13. Results of the flexural strength test. Type I: plaster–coconut fibre panels and two sheets of Kraft paper; Type II: plaster–coconut fibre and one sheet of cork agglomerate.
Buildings 15 01899 g013
Figure 14. Thermocouple location on the inside face of the test specimen: (a) top view; (b) internal view.
Buildings 15 01899 g014
Figure 15. The construction system of dry lining used for the simulation.
Buildings 15 01899 g015
Figure 16. THERM simulation for thermal performance of a wall with P0.7-17.5CF. ① Aerated concrete block [DIN 4165]. ② 2 PL plasterboards with coconut fibre. ③ Mansory cement mortar. ④ Galvanised iron “C” profile. ⑤ Rock wool.
Buildings 15 01899 g016
Figure 17. Qualitative chart of the most relevant properties for composites reinforced with coconut fibre.
Buildings 15 01899 g017
Table 1. Studies carried out with gypsum composites and the incorporation of natural fibres.
ReferenceFibreAddition PercentageFibre LengthProperties Analysed (*)
ABCDEFGHIJKLMN
[19]Coir10–20–30% WT5–10 mm
[15]Sisal1–2% (1 mm long) WT;
1–2% (3 mm long) WT
1–3 mm
[20]Coir10–20–30% WT5–10 mm
[21]Coir10–20–30–40% WT5 mm
[22]Date palm5–10–15–20% WT-
[24]Pine Wood1–2–4–6% WT0.7 mm
[25]Abaca1–2–3% WT10 mm
[27]Jute0.1–0.2% WTJute netting 22 × 22 holes/dm2
[28]Straw0.2–0.3–0.4–0.6% WTOriginal fibre length in straw bales
[29]Hemp15–30% WT0–0.2 mm
2–12 mm
(*) A: bulk density; B: Shore C surface hardness; C: dynamic elastic modulus (MOE); D: SEM analysis; E: flexural strength; F: compressive strength; G: capillarity water absorption; H: capillarity height; I: total water absorption; J: open porosity; K: thermal conductivity; L: acoustic properties; M: fire resistance; N: impact resistance.
Table 2. Physical properties of gypsum-based binder [31].
FeaturesValueFeaturesValue
Water vapour diffusion factor (μ):6Purity index (%):>80
Compressive strength:≥2 N/mm2Granulometry:(SN) 0–0.2 mm
Water/powder ratio:1–1.5 L/kgFire reaction:A1
Flexural strength:≥1 N/mm2pH:>6
Table 3. Water quality parameters to produce plaster composites [33].
pH
[u]
Total Hardness
[mg/L CO3Ca]
Chloride
[mg/L]
Total Organic Carbon [mg/L]Lead
[µg/L]
Cadmium
[µg/L]
Escherichia coli
[CFU/100 mL]
Turbidity
[NTU]
7.1–8.910–5010–211.6–2.5<2.5<2.50.00.3
Table 4. Properties of coconut fibre.
Mechanical Properties [30]Physical Properties Organic Composition [30]
Tensile strength: 165–222 MPaDensity: 100–140 kg/m3Cellulose: 27–36 wt%
Young’s modulus: ≈3.8 GPaThermal conductivity: 0.043–0.045 W/m°C [37]Hemicellulose: 17–23 wt%
Elongation break: ≈40%Long fibre length: 19.5–22.0 cm (avg. 21.0 cm)1 [38]Lignin: 37–42 wt%
Short fibre length: 8.2–10.3 cm (avg. 9.2 cm)1 [38]
Fibre diameter (long fibres): 220–870 µm (avg. 0.34 mm) [38]
Fibre diameter (short fibres): 130–390 µm (avg. 0.21 mm) [38]
Aspect ratio long fibre (l/d): ≈618
Aspect ratio short fibre (l/d): ≈438
Table 5. Physical characteristics of Kraft paper [39].
PropertyValuePropertyValue
Weight [g/m2]:75Tensile index ST [N·m/g]:45
Humidity [%]:6.80% ± 0.20%Burst index [kPa·m2/g]:4.4
SM tensile index [N·m/g]:100Breaking strength [kPa]355
Thickness:0.10 mmCobb-60″ [g/m2]:27
Table 6. Properties of expanded cork agglomerate.
Thermal Properties [41]Physical and Mechanical Properties [41]
Thermal Conductivity: 0.04 W/mKSpecific Weight: 150–220 kg/m3
Tensile Strength: >200 kPa
Recovery after 0.7 MPa: >70.00%
Table 7. Proportions of materials used for the preparation of the plaster composites.
SampleGypsum Plaster [g]Water [g]Coconut Fibre [g]
P0.7-REF1000700.0
P0.7-2.5CF975682.52.8
P0.7-5.0CF950665.05.6
P0.7-7.5CF925647.58.3
P0.7-10.0CF900630.011.1
P0.7-12.5CF875612.513.9
P0.7-15.0CF850595.016.7
P0.7-17.5CF825577.519.4
Table 8. Experimental programme and application regulations.
Experimental Programme and Application Regulations
STAGE I16 × 16 × 4 cm
Buildings 15 01899 i001
Bulk density
UNE-EN 102042:2023 [42]
SEM analysis
-
Superficial hardness
UNE-EN 102042:2023 [42]
Flexural strength
UNE-EN 13279-2:2014 [41]
Dynamic elastic modulus (MOEus)
UNE-EN ISO 12680-1:2007 [43]
Compressive strength
UNE-EN 13279-2:2014 [41]
16 × 16 × 4 cm
Buildings 15 01899 i002
Capillarity water absorption
EN 1925:1999 [44]
Total water absorption
UNE-EN 14617-1:2013 [45]
Capillarity height
-
Open porosity
UNE-EN 1936:2007 [46]
STAGE II40 × 30 × 1.5 cm
Buildings 15 01899 i003
Bulk density
UNE-EN 102042:2023 [42]
UNE-EN 12859:2012 [47]
Flexural strength
UNE-EN 12859:2012 [47]
UNE-EN 14246:2007 [48]
UNE-EN 520:2005 + A1:2010 [49]
24 × 24 × 2 cm
Buildings 15 01899 i004
Thermal conductivity
UNE-EN ISO 8990:1997 [50]
Simulation THERM
DBHE [51]
Table 9. Density classes [47].
Class Density [kg/m3]Class Density [kg/m3]Class Density [kg/m3]
High 1 100 ≤ ρ ≤ 1 500Medium 800 ≤ ρ < 1 100Low 600 ≤ ρ < 800
Table 10. Flexural strength results (MPa) found in the literature for plasters with natural fibres.
Fibre2.00%2.50%5.00%6.00%7.50%10.00%12.50%15.00%17.50%20.00%30.00%
P-CF-3.754.00-4.154.164.194.353.25--
Coir [20]-----3.10---4.305.60
Coir [21]-----1.175---1.301.375
Pine Wood [24]1.38--0.72-------
Abaca [25]2.73 ± 0.19----------
Hemp [29]-------4.80--4.10
Table 11. Total water absorption coefficient and open porosity of the developed plaster composites.
SeriesP0.7P0.7-2.5CFP0.7-5.0CFP0.7-7.5CFP0.7-10.0CFP0.7-12.5CFP0.7-15.0CFP0.7-17.5CF
Total Water Absorption [%]40.6441.2941.0841.1240.7640.7941.6840.85
Open Porosity [%]54.9855.7055.2353.5554.2353.8854.0953.18
Table 12. Density (kg/m3) reported in the literature for various gypsum composites reinforced with natural fibres.
Fibre2.00%2.50%5.00%7.50%10.00%12.50%15.00%17.50%20.00%30.00%
P-CF-1055.031044.641041.181038.261037.851036.91987.83--
Coir [20]----1183.59---1175.781164.06
Date Palm [22]--1226.24-1084.48-861.86-736.31-
Pine Wood [24]894 ± 17---------
Hemp [29]------575.00--470.00
Table 13. Thermal conductivity of plaster composites with coconut fibre.
SampleBulk Density
[kg/m3]
Density Class
[49]
Thermal Conductivity
[W/m·K]
Thermal Resistance
[m2·K/W]
P0.7-REF1094.01 ± 62.24 (—)Media0.300.067
P0.7-2.5CF1055.03 ± 49.84 (↓ 3.30%)Media0.1650.121
P0.7-5.0CF1044.64 ± 30.90 (↓ 4.25%)Media0.1630.123
P0.7-7.5CF1041.18 ± 36.52 (↓ 4.57%)Media0.1590.126
P0.7-10.0CF1038.26 ± 35.88 (↓ 4.83%)Media0.1650.121
P0.7-12.5CF1037.85 ± 11.10 (↓ 4.87%)Media0.1570.127
P0.7-15.0CF1036.91 ± 31.58 (↓ 4.86%)Media0.1460.137
P0.7-17.5CF987.83 ± 33.97 (↓ 9.46%)Media0.1310.153
Table 14. Density and thermal conductivity test results for different fibres.
FibreProperty5.00%10.00%15.00%
P-CFDensity (kg/m3)1044.64 ± 30.901038.26 ± 35.881036.91 ± 31.58
Thermal Conductivity (W/m·K)0.1630.1650.146
Coir [21]Density (kg/m3)-840-
Thermal Conductivity (W/m·K)--
Date Palm [22]Density (kg/m3)1226.241084.48861.86
Thermal Conductivity Flash Method (W/m·K)0.398 ± 0.020.297 ± 0.0070.242 ± 0.018
Hemp [29]Density (kg/m3)--575
Thermal Conductivity (W/m·K)--0.17
Table 15. Thermal properties of wall materials.
MaterialThickness
(mm)
Density.
(kg/m3)
Thermal
Conductivity
W/(m·K)
Thermal
Resistance
(m2·K)/W
Emissivity
Aerated concrete block [DIN 4165] [58]250.00500.000.161.560.90
Mansory cement mortar [59] 20.002000.001.800.010.90
Galvanised iron “C” profile [60]0.507850.0085.005.88 × 10−60.35
Rock wool [61]40.0090.000.0351.150.90
Gypsum board [61]12.50728.000.250.050.90
Plaster and coconut fibreboards12.50See Table 13-
Table 16. Climatic conditions considered in the simulation, Madrid, Spain [51].
Madrid—Zone D3—Winter
AreaFeatureUnitValue
ExteriorTemperature°C3 and 6
Relative humidity%70.00
Rse-0.04
InteriorTemperature°C17 and 20
Relative humidity%55.00
Rsi-0.13
Global heat transfer coefficient through the envelope: Table 3.1.1.a—HE1 thermal transmittance limit values, Ulim [W/m2·K]. Walls and floors in contact with outside air (US, UM). Zone D 0.41 [W/m2·K] [51].
Table 17. Thermal performance for plasterboard and coconut fibre dry lining.
SeriesOutdoor Temperature
[°C]
R-Value Wall
[m2·K/W]
U-Factor Wall
W/[m2·K]
Indoor Temperature
[°C]
P0.7-REF3.22.4865 (—)0.4022 (—)16.4
P0.7-2.5CF3.22.6150 (↑ 5.17%)0.3824 (↓ 4.92%)16.5
P0.7-5.0CF3.22.6181 (↑ 5.29%)0.3820 (↓ 5.02%)16.5
P0.7-7.5CF3.22.6246 (↑ 5.55%)0.3810 (↓ 5.27%)16.5
P0.7-10.0CF3.22.6150 (↑ 5.17%)0.3824 (↓ 4.92%)16.5
P0.7-12.5CF3.22.6280 (↑ 5.69%)0.3805 (↓ 5.40%)16.5
P0.7-15.0CF3.22.6478 (↑ 6.49%)0.3777 (↓ 6.09%)16.5
P0.7-17.5CF3.22.6791 (↑ 7.75%)0.3733 (↓ 7.19%)16.5
Disclaimer/Publisher’s Note: The statements, opinions and data contained in all publications are solely those of the individual author(s) and contributor(s) and not of MDPI and/or the editor(s). MDPI and/or the editor(s) disclaim responsibility for any injury to people or property resulting from any ideas, methods, instructions or products referred to in the content.

