
Technical System for Urban Stormwater Carrying Capacity Assessment and Optimization

Abstract
1. Introduction
2. Methodology
2.1. Definition and Connotation of Urban Stormwater Carrying Capacity
2.1.1. Definition of Urban Stormwater Carrying Capacity
2.1.2. Connotations of Urban Stormwater Carrying Capacity
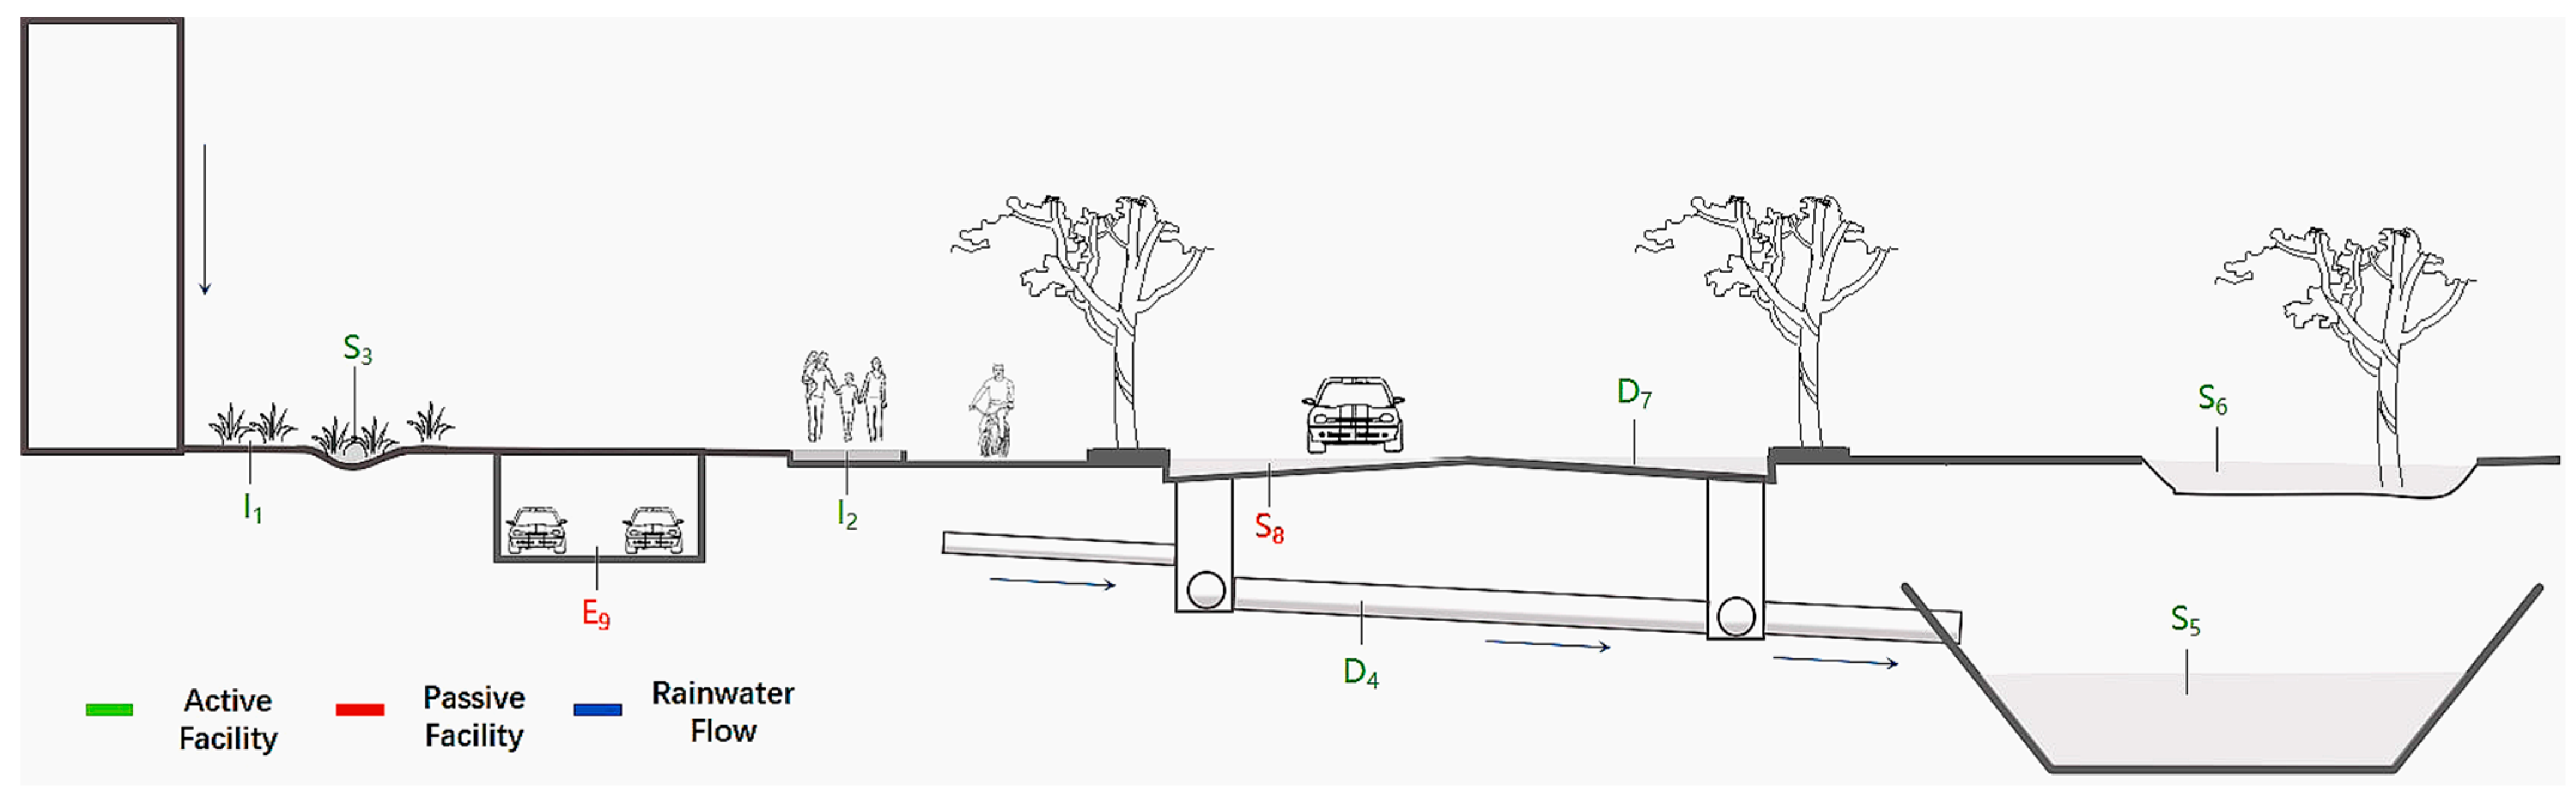
2.2. Classification of Urban Stormwater Storage and Drainage Facilities
2.2.1. Active Stormwater-Bearing Facilities
2.2.2. Passive Stormwater-Bearing Facilities
2.3. Method for Calculating Urban Stormwater Carrying Capacity
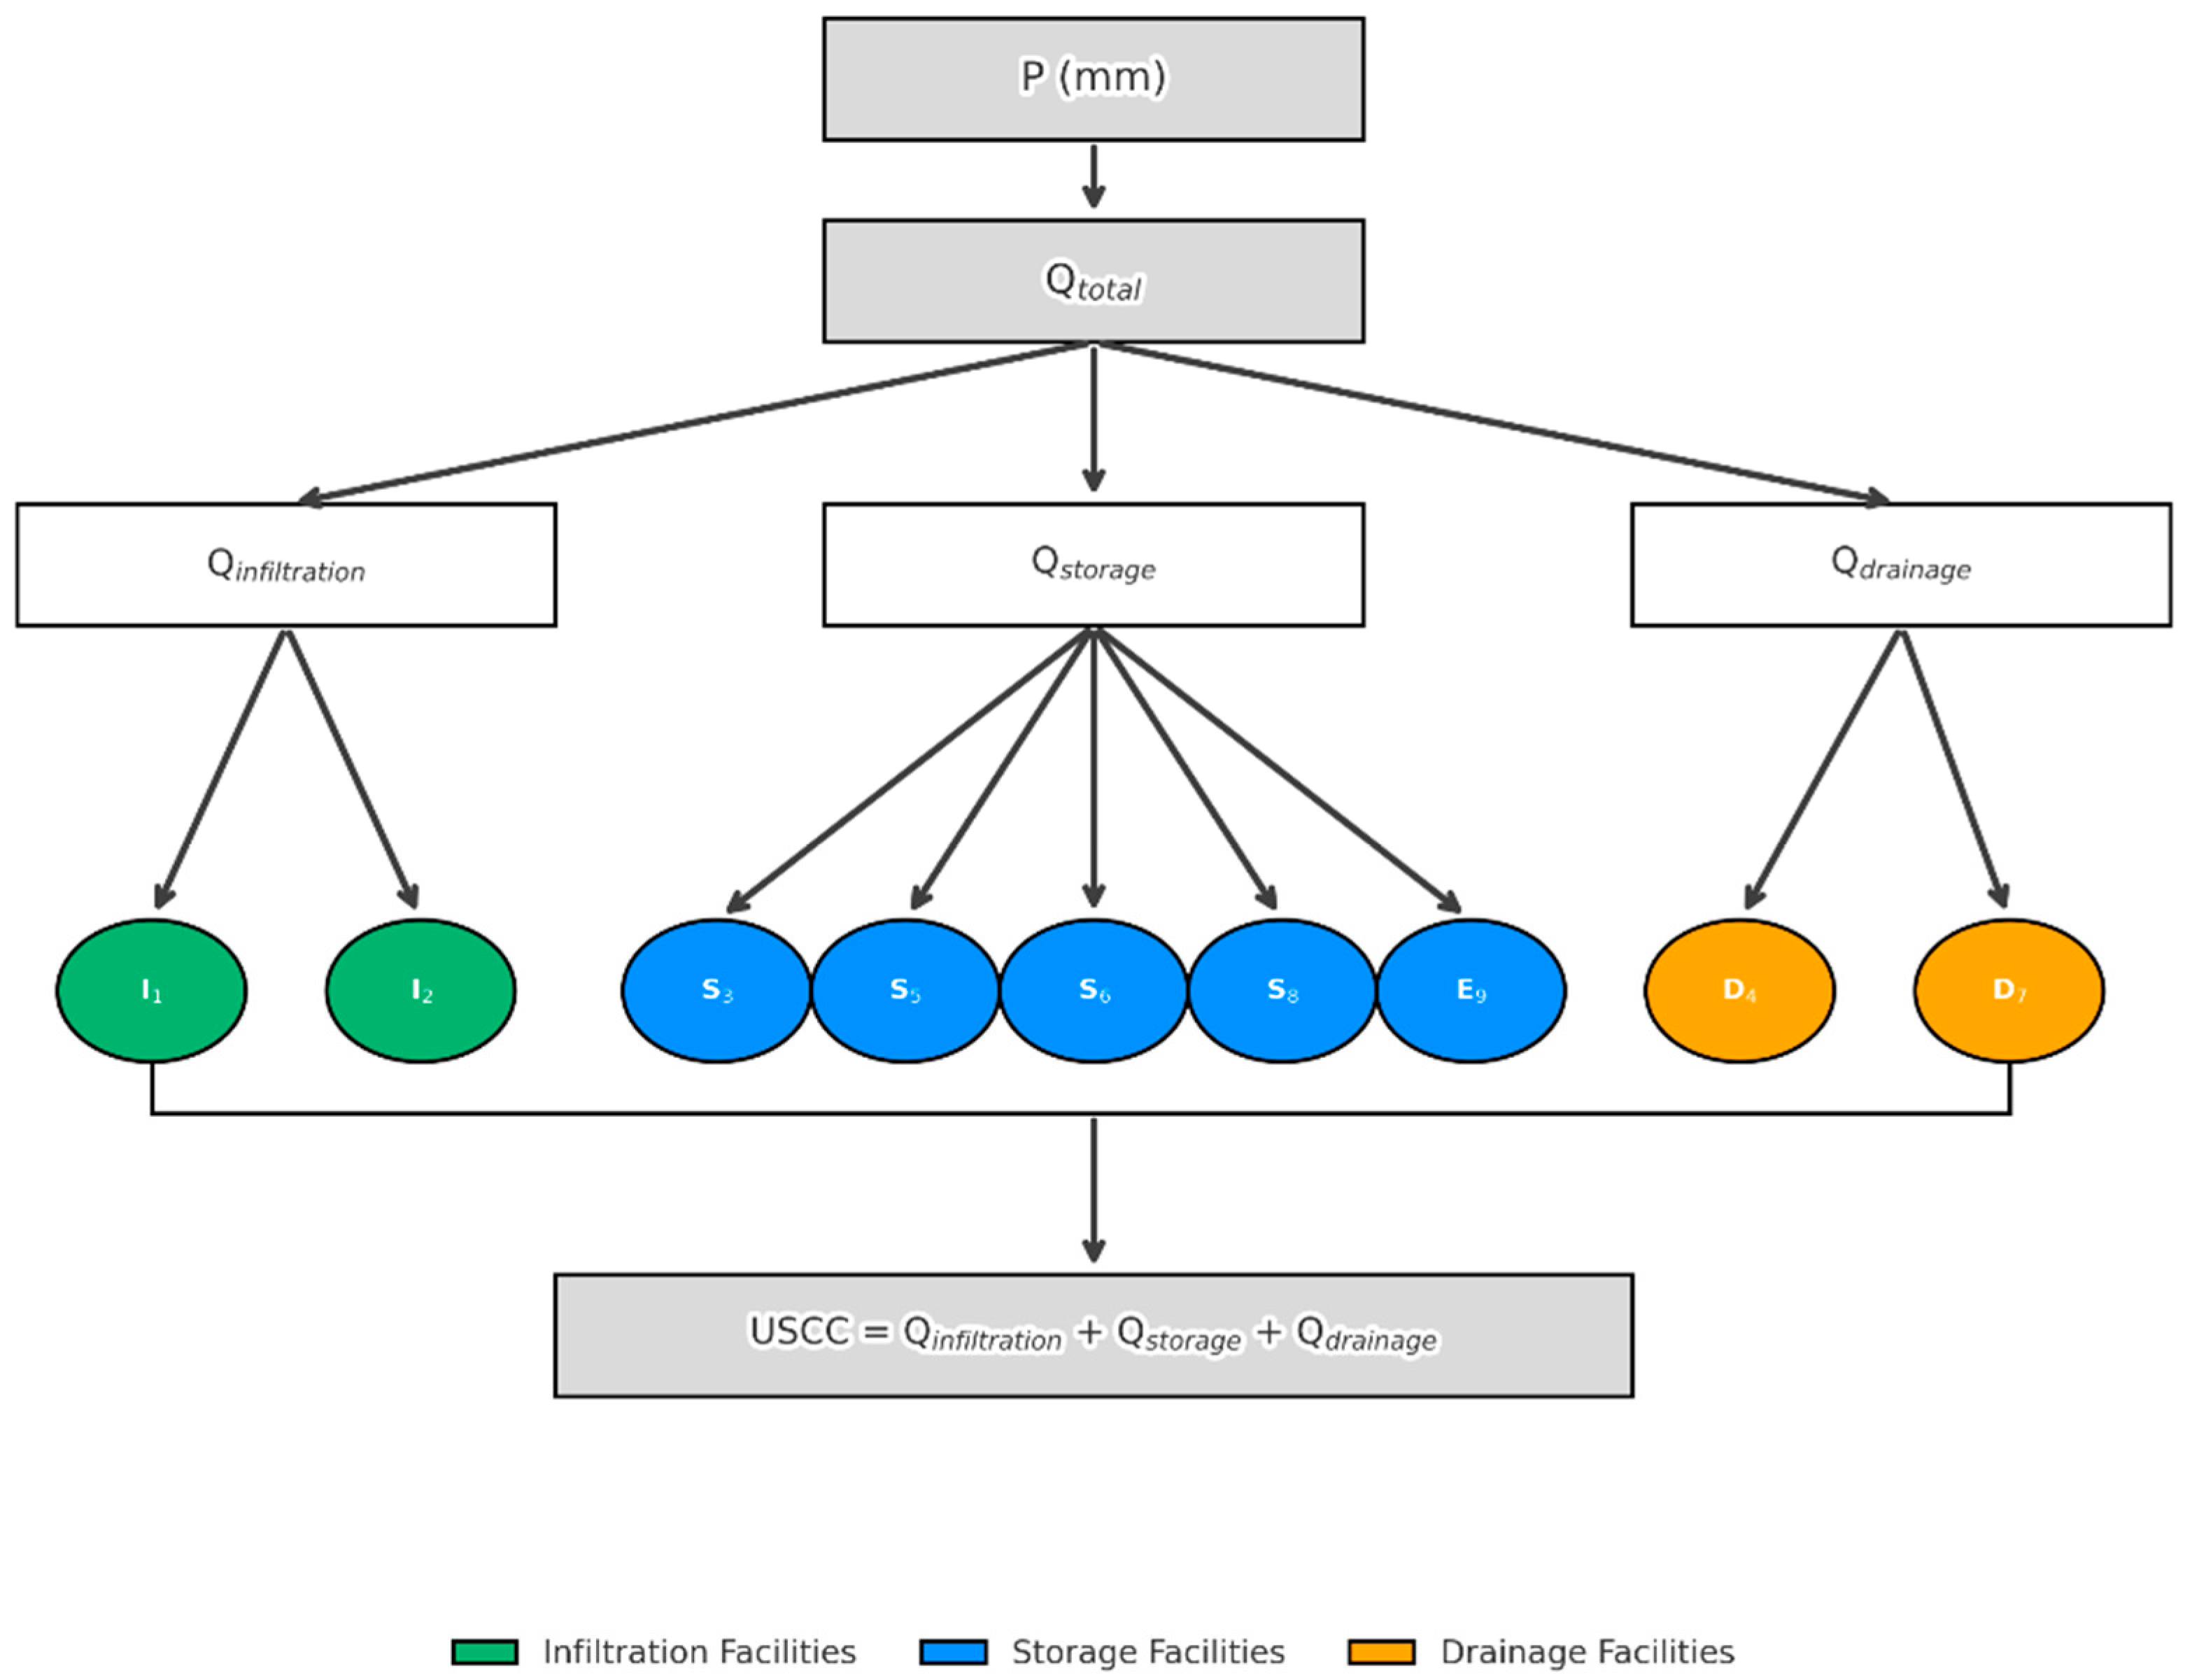
2.3.1. Theoretical Model Development
2.3.2. Estimation Method for Facility-Based Stormwater Absorption Capacity
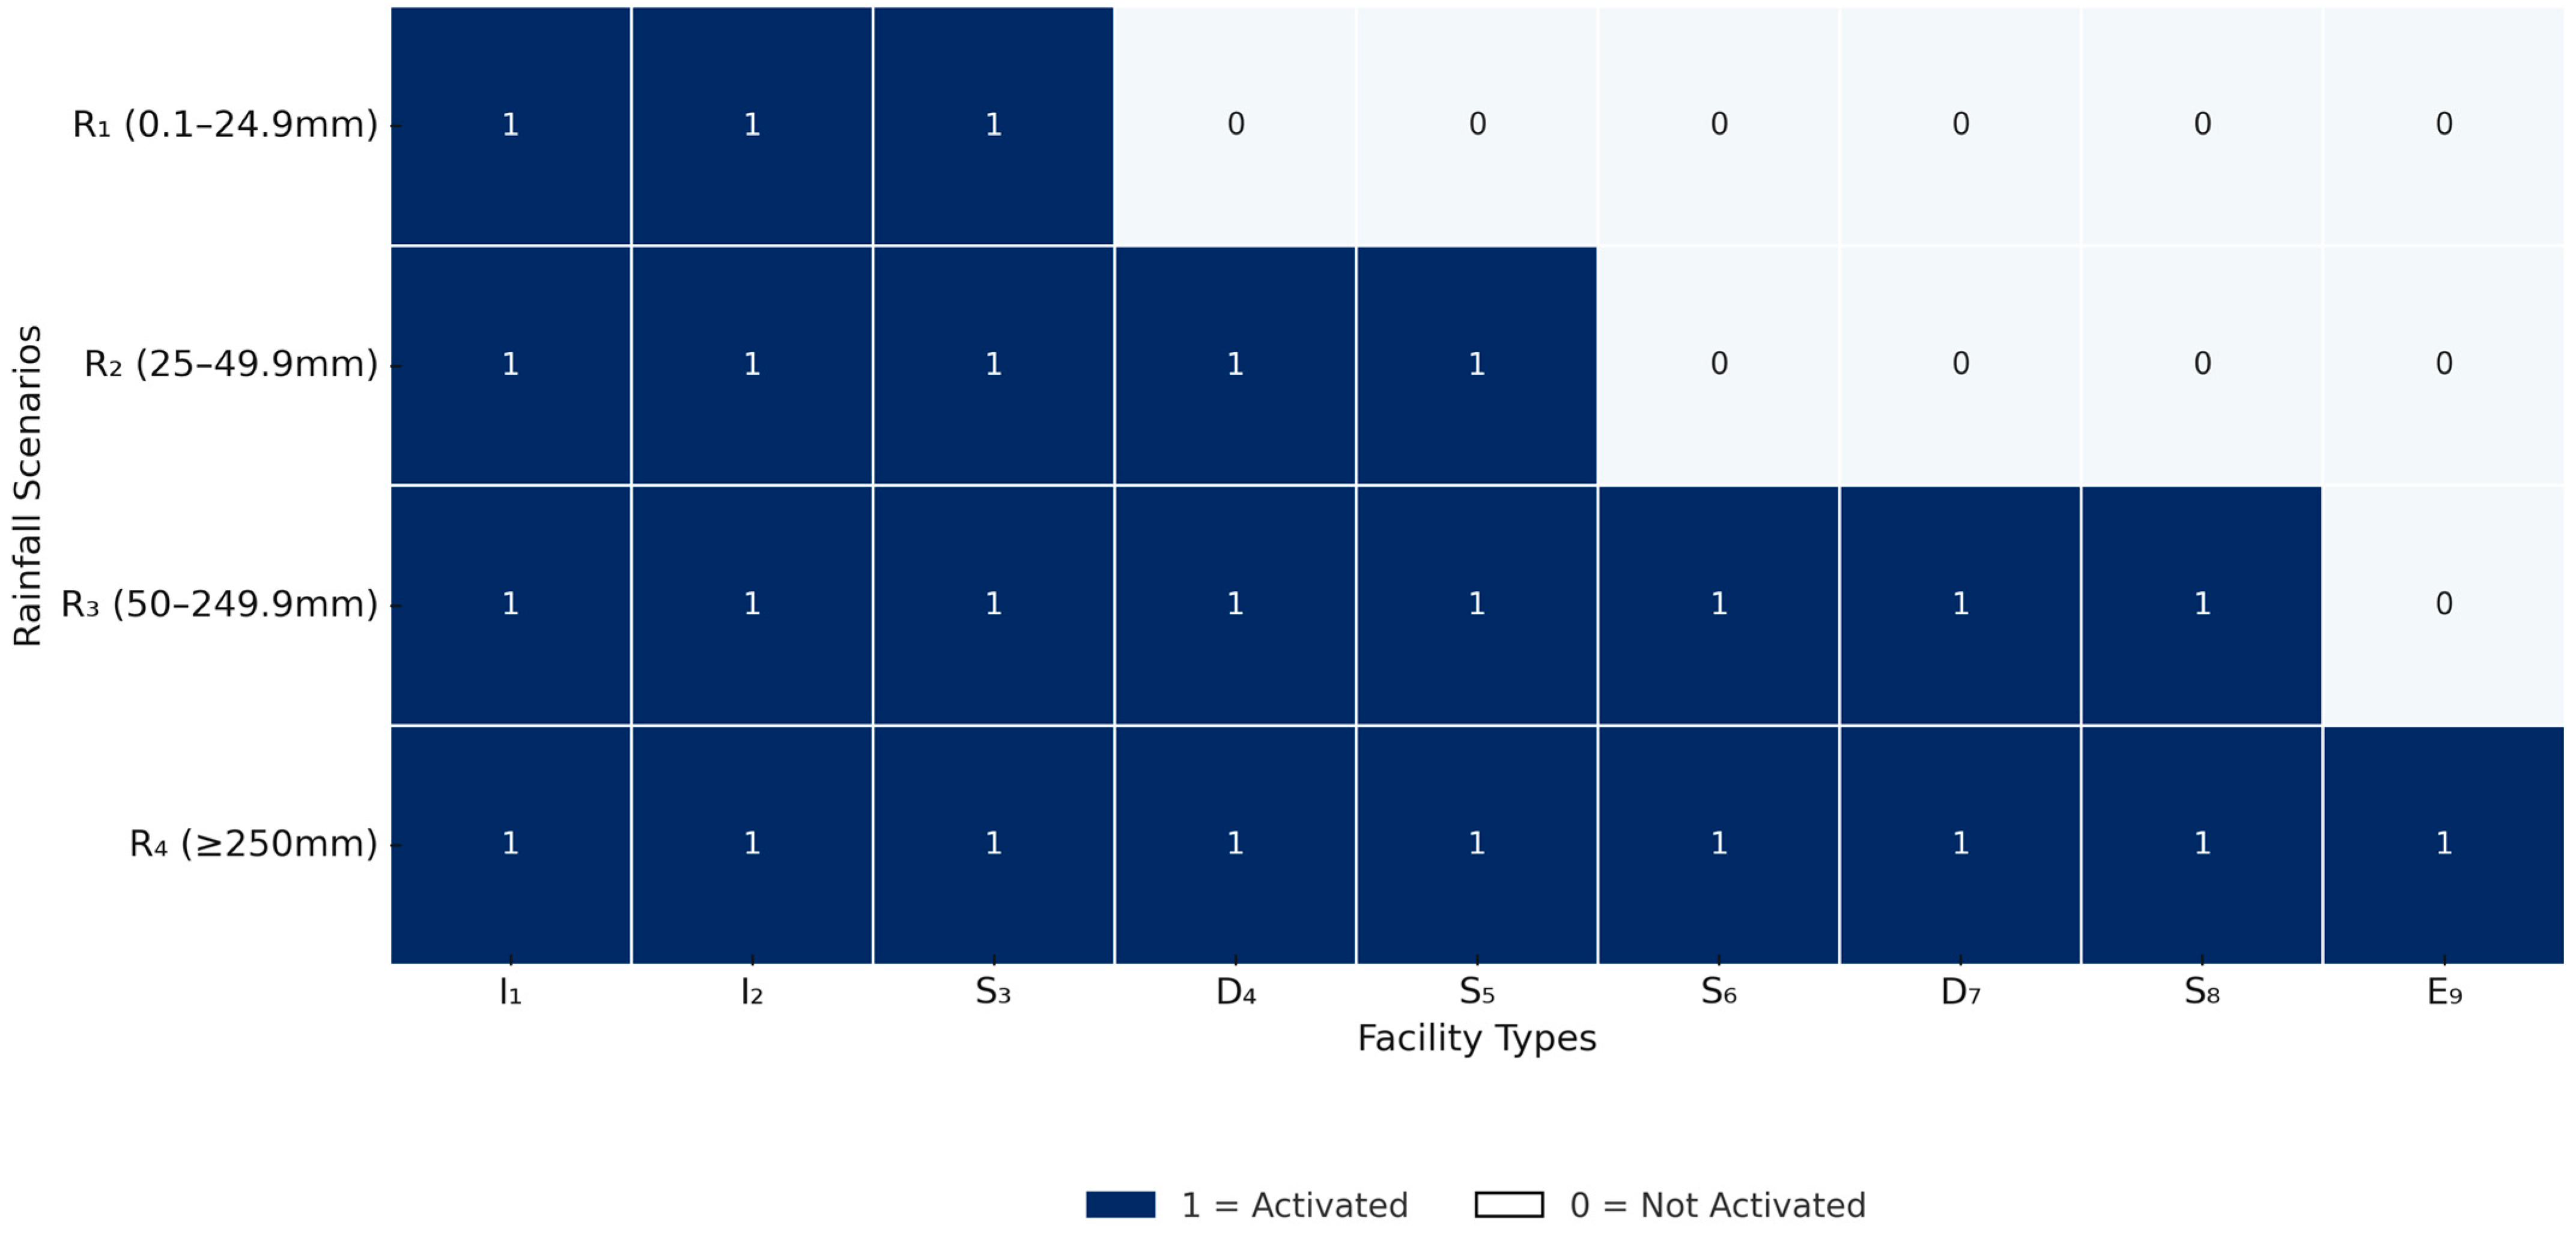
2.4. Classification of Urban Rainfall Scenarios and Management Strategies
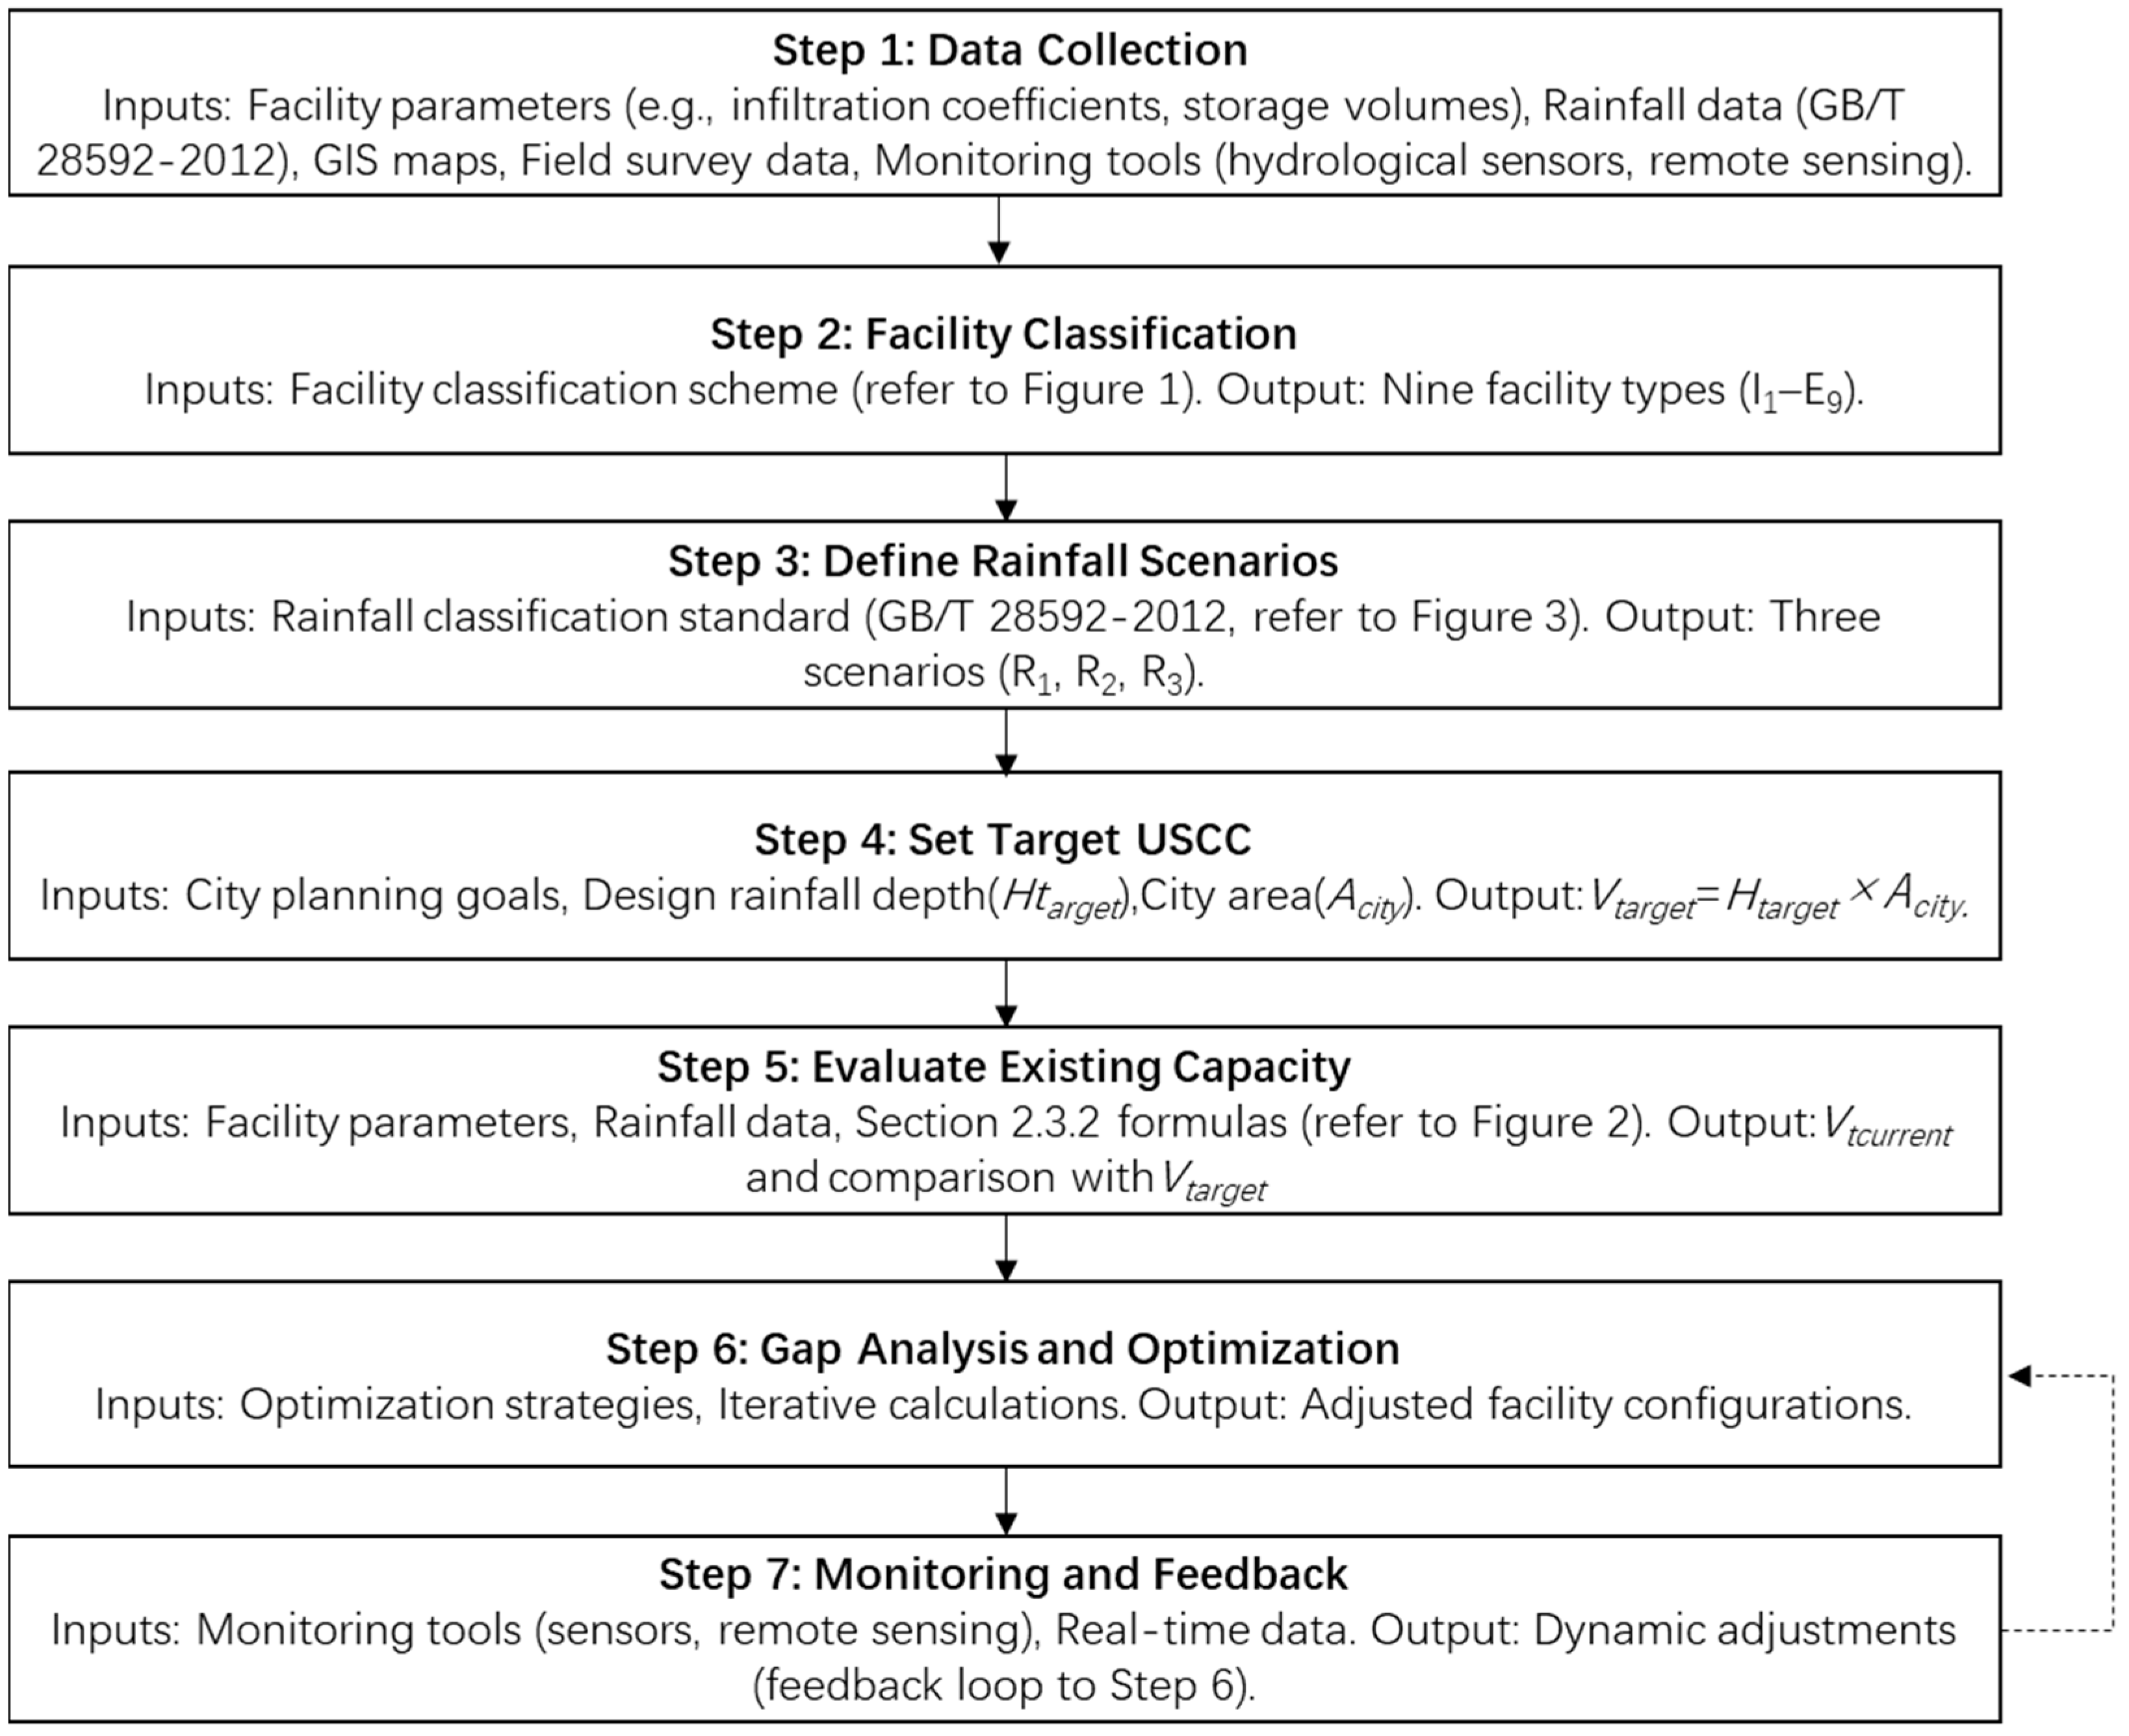
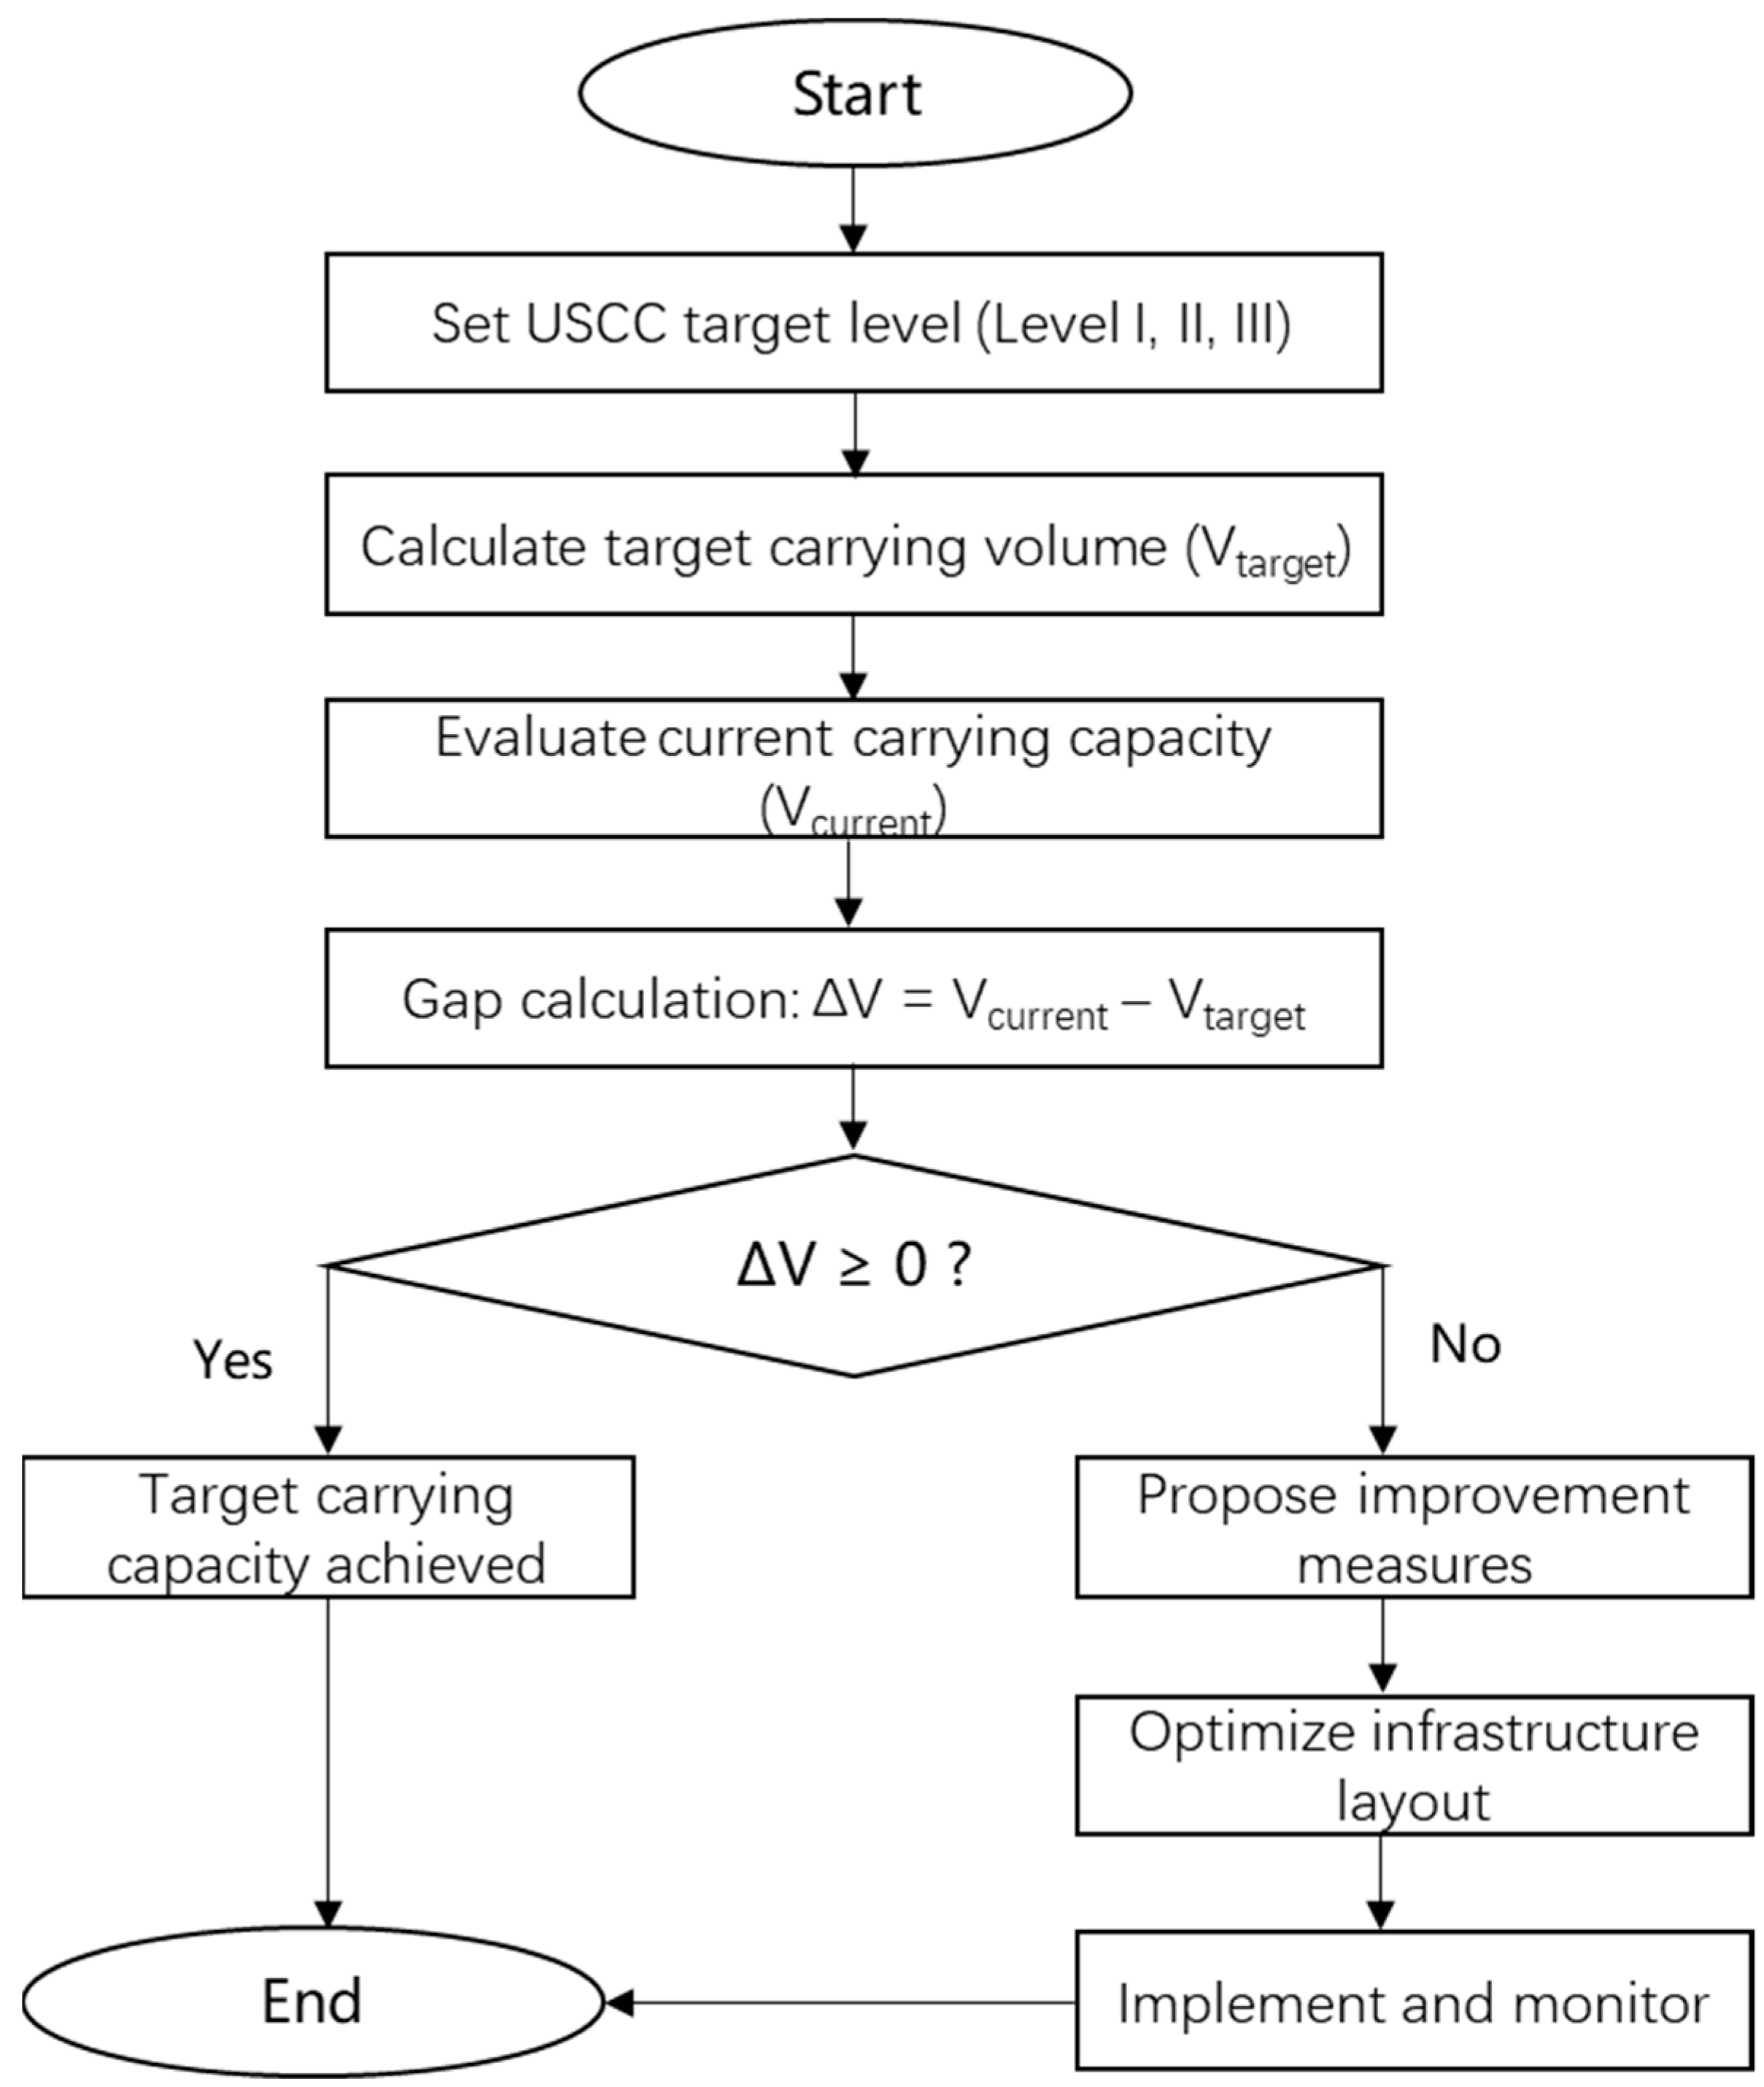
2.5. Quantitative Evaluation Framework for Urban Stormwater Carrying Capacity
2.6. Validation of Urban Stormwater Carrying Capacity Assessment: A Case Study in Weifang
2.6.1. Overview of the Study Area
2.6.2. Calculation of Stormwater Carrying Capacity
2.6.3. Scenario-Based Evaluation Summary
3. Results
3.1. Framework Implementation and Evaluation of the “2-3-9” Technical System
3.1.1. Realization and Optimization of the Dual Management Dimensions
3.1.2. Effectiveness of Refined Management Across Three Rainfall Scenarios
3.1.3. Synergistic Performance of the Nine Stormwater Facilities
3.2. Application and Optimization of the Technical Framework
3.3. Sensitivity and Optimization Analysis of Key Parameters Affecting USCC
3.3.1. Sensitivity to the Composite Runoff Coefficient (C)
3.3.2. Sensitivity to Underground Storage Depth (HE9)
3.3.3. Sensitivity Trends
4. Discussion
4.1. Multi-Scenario Management and Adaptive Capacity
4.2. Synergistic Use of Multi-Scale Facilities
4.3. Comparison with Conventional Stormwater Management Approaches
4.4. Implications of Sensitivity Analysis for Urban Planning
4.5. Framework Scalability and Future Work
4.6. Global Applicability of the “2-3-9” Framework: International Case Studies
4.6.1. Tokyo, Japan
4.6.2. New Orleans, USA
4.6.3. Cape Town, South Africa
4.7. Model Validation Methods
4.8. Limitations of the Study
5. Conclusions
Author Contributions
Funding
Data Availability Statement
Conflicts of Interest
References
- United Nations, Department of Economic and Social Affairs. World Urbanization Prospects: The 2022 Revision; United Nations: New York, NY, USA, 2022. [Google Scholar]
- IPCC. Climate Change 2021: The Physical Science Basis. Contribution of Working Group I to the Sixth Assessment Report of the Intergovernmental Panel on Climate Change; Cambridge University Press: Cambridge, UK, 2021. [Google Scholar]
- Hammond, M.J.; Chen, A.S.; Djordjević, S.; Butler, D.; Mark, O. Urban Flood Impact Assessment: A State-of-the-Art Review. Urban Water J. 2015, 12, 14–29. [Google Scholar] [CrossRef]
- IPCC. Synthesis Report of the IPCC Sixth Assessment Report (AR6); Cambridge University Press: Cambridge, UK, 2023. [Google Scholar]
- Butler, D.; Davies, J.W. Urban Drainage, 4th ed.; CRC Press: Boca Raton, FL, USA, 2018. [Google Scholar]
- Zhao, X.; Li, H.; Cai, Q.; Pan, Y.; Qi, Y. Managing Extreme Rainfall and Flooding Events: A Case Study of the 20 July 2021 Zhengzhou Flood in China. Climate 2023, 11, 228. [Google Scholar] [CrossRef]
- Fletcher, T.D.; Shuster, W.; Hunt, W.F.; Ashley, R.; Butler, D.; Arthur, S.; Trowsdale, S.; Barraud, S.; Semadeni-Devies, A.; Bertrand-Krajewski, J.-L.; et al. SUDS, LID, BMPs, WSUD and More—The Evolution and Application of Terminology Surrounding Urban Drainage. Urban Water J. 2015, 12, 525–542. [Google Scholar] [CrossRef]
- Zhang, Y.; Zhao, W.; Chen, X.; Jun, C. Urban Stormwater Management and Sponge Cities: A Review of Current Status and Future Prospects in China. Environ. Sci. Technol. 2020, 54, 8140–8154. [Google Scholar]
- Ministry of Housing and Urban-Rural Development of China (MOHURD). Technical Guide for Sponge City Construction; China Architecture & Building Press: Beijing, China, 2014. [Google Scholar]
- Li, H.; Ding, L.; Ren, M.; Li, C.; Wang, H. Sponge City Construction in China: A Survey of the Challenges and Opportunities. Water 2017, 9, 594. [Google Scholar] [CrossRef]
- Jato-Espino, D.; Sillanpaa, N.; Charlesworth, S.; Andrés Doménech, I. Coupling GIS with Stormwater Modelling for the Location Prioritization and Hydrological Simulation of Permeable Pavements in Urban Catchments. Water 2016, 8, 451. [Google Scholar] [CrossRef]
- Burns, M.J.; Fletcher, T.D.; Walsh, C.J.; Ladson, A.R.; Hatt, B.E. Hydrologic Shortcomings of Conventional Urban Stormwater Management and Opportunities for Reform. Landsc. Urban Plan. 2015, 134, 139–149. [Google Scholar] [CrossRef]
- Molenveld, A.; van Buuren, A. Flood Risk and Resilience in the Netherlands: In Search of an Adaptive Governance Approach. Water 2019, 11, 2563. [Google Scholar] [CrossRef]
- Armitage, N.; Vice, M.; Fisher-Jeffes, L.; Winter, K.; Spiegel, A.; Dunstan, J. The South African Guidelines for Sustainable Drainage Systems. Water SA 2014, 40, 385–398. [Google Scholar]
- Palla, A.; Gnecco, I. Hydrologic Modeling of Low Impact Development Systems at the Urban Catchment Scale. J. Hydrol. 2015, 528, 361–368. [Google Scholar] [CrossRef]
- Eckart, J.; Sieker, H.; Vairavamoorthy, K. Performance and Implementation of Low Impact Development—A Review. Sci. Total Environ. 2017, 607–608, 413–432. [Google Scholar] [CrossRef]
- Zhang, K.; Chui, T.F.M. A Comprehensive Review of Spatial Allocation of LID-BMP-GI Practices: Strategies and Optimization Tools. Sci. Total Environ. 2018, 621, 915–929. [Google Scholar] [CrossRef] [PubMed]
- Chen, L.; Guo, C.; Yu, Y.; Zhou, X.; Fu, Y.; Wang, S.; Ma, Y.; Shen, Z. Optimization of Green Infrastructures for Sustaining Urban Stormwater Quality and Quantity: An Integrated Resilience Evaluation. J. Hydrol. 2024, 640, 131682. [Google Scholar] [CrossRef]
- Reinstaller, S.; Funke, F.; König, A.W.; Pichler, M.; Kleidorfer, M.; Muschalla, D. Resilient Urban Flood Management: A Multi-Objective Assessment of Mitigation Strategies. Sustainability 2024, 16, 4123. [Google Scholar] [CrossRef]
- Sharifi, A.; Tarlani Beris, A.; Sharifzadeh Javidi, A.; Nouri, M.; Gholizadeh Lonbar, A.; Ahmadi, M. Application of Artificial Intelligence in Digital Twin Models for Stormwater Infrastructure Systems in Smart Cities. Adv. Eng. Inform. 2024, 60, 102485. [Google Scholar] [CrossRef]
- Miguez, M.G.; Veról, A.P.; Bianchini, L. Flood risk assessment and management: A case study in Rio de Janeiro. In WIT Transactions on the Built Environment; WIT Press: Southampton, UK, 2013; Volume 134, pp. 251–262. [Google Scholar]
- Schanze, J. Flood Risk Management—A System-Oriented Perspective. Nat. Hazards 2018, 92 (Suppl. S1), 6239–6259. [Google Scholar]
- Lashford, C.; Rubinato, M.; Cai, Y.; Hou, J.; Abolfathi, S.; Coupe, S.; Charlesworth, S.; Tait, S. SUDS & Sponge Cities: A Comparative Analysis of the Implementation of Pluvial Flood Management in the UK and China. Sustainability 2019, 11, 213. [Google Scholar] [CrossRef]
- Semadeni-Davies, A.; Hernebring, C.; Svensson, G.; Gustafsson, L.-G. The Impacts of Climate Change and Urbanisation on Drainage in Helsingborg, Sweden: Suburban Stormwater. J. Hydrol. 2008, 350, 114–125. [Google Scholar] [CrossRef]
- Knight, D.W.; Shiono, K. River Channel and Floodplain Hydraulics. In Floodplain Processes; Anderson, M.G., Walling, D.E., Bates, P.D., Eds.; John Wiley & Sons: Chichester, UK, 1996; pp. 139–181. [Google Scholar]
- Pender, G.; Faulkner, H. (Eds.) Flood Risk Science and Management: An Introduction. In Flood Risk Science and Management; Wiley-Blackwell: Oxford, UK, 2011; pp. 1–18. [Google Scholar]
- Mehmood, M.S.; Rehman, A.; Sajjad, M.; Song, J.; Zafar, Z.; Shiyan, Z.; Yaochen, Q. Evaluating Land Use/Cover Change Associations with Urban Surface Temperature via Machine Learning and Spatial Modeling: Past Trends and Future Simulations in Dera Ghazi Khan, Pakistan. Front. Ecol. Evol. 2023, 11, 1115074. [Google Scholar] [CrossRef]
- Wu, L.; Su, X.; Ma, X.; Kang, Y.; Jiang, Y. Integrated Modeling Framework for Evaluating and Predicting the Water Resources Carrying Capacity in a Continental River Basin of Northwest China. J. Clean. Prod. 2018, 204, 367–379. [Google Scholar] [CrossRef]
- Bhowmik, N.G.; Demissie, M. Carrying Capacity of Flood Plains. J. Hydraul. Div. 1982, 108, 443–452. [Google Scholar] [CrossRef]
- Yan, B.; Xing, J.; Tan, H.; Deng, S.; Tan, Y. Analysis on Water Environment Capacity of the Poyang Lake. Procedia Environ. Sci. 2011, 10 Pt C, 2752–2757. [Google Scholar]
- Schubert, J.E.; Burns, M.J.; Fletcher, T.D.; Sanders, B.F. A Framework for the Case-Specific Assessment of Green Infrastructure in Mitigating Urban Flood Hazards. Adv. Water Resour. 2017, 108, 55–62. [Google Scholar] [CrossRef]
- Rentachintala, L.R.N.P.; Reddy, M.G.M.; Mohapatra, P.K. Urban Stormwater Management for Sustainable and Resilient Measures and Practices: A Review. Water Sci. Technol. 2022, 85, 1120–1140. [Google Scholar] [CrossRef]
- Rossman, L.A. Storm Water Management Model User’s Manual Version 5.1; U.S. Environmental Protection Agency: Washington, DC, USA, 2015.
- Elliott, A.H.; Trowsdale, S.A. A Review of Models for Low Impact Urban Stormwater Drainage. Environ. Model. Softw. 2007, 22, 394–405. [Google Scholar] [CrossRef]
- Jia, H.; Yao, H.; Yu, S.L. Advances in LID BMPs Research and Practice for Urban Runoff Control in China. Front. Environ. Sci. Eng. 2013, 7, 709–720. [Google Scholar] [CrossRef]
- Ahiablame, L.; Shakya, R. Modeling Flood Reduction Effects of Low Impact Development at a Watershed Scale. J. Environ. Manag. 2016, 171, 81–91. [Google Scholar] [CrossRef]
- Pahl-Wostl, C.; Arthington, A.; Bogardi, J.; Bunn, S.E.; Hoff, H.; Lebel, L.; Nikitina, E.; Palmer, M.; Poff, L.N.; Richards, K.; et al. Environmental Flows and Water Governance: Managing Sustainable Water Uses. Curr. Opin. Environ. Sustain. 2013, 5, 341–351. [Google Scholar] [CrossRef]
- Shibuo, Y.; Furumai, H. Advances in Urban Stormwater Management in Japan: A Review. J. Disaster Res. 2021, 16, 310–320. [Google Scholar] [CrossRef]
- Kane, P.B.; Tebyanian, N.; Gilles, D.; McMann, B.; Fischbach, J.R. Key Drivers of Vulnerability to Rainfall Flooding in New Orleans. Front. Clim. 2024, 6, 1303951. [Google Scholar] [CrossRef]


| Indicator | Unit | Definition and Application |
|---|---|---|
| Total stormwater carrying volume | 104 m3 | Overall capacity; planning and resilience assessment |
| Rainfall depth capacity | mm | Cross-region flood resilience comparison |
| Unit-area capacity | 104 m3/km2 | Spatial optimization; land use planning |
| Stormwater carrying coefficient | Dimensionless | Efficiency indicator for infrastructure performance and synergy |
| Code | Facility Type | Primary Function | Description |
|---|---|---|---|
| I1 | Green spaces | Infiltration | Vegetation interception and soil infiltration |
| I2 | Permeable pavements | Infiltration | High-permeability materials facilitating infiltration |
| S3 | Source detention facilities | Storage | Initial runoff interception and purification |
| D4 | Drainage systems | Drainage | Efficient conveyance to prevent waterlogging |
| S5 | Water bodies | Storage | Natural detention and peak flow mitigation |
| S6 | Dual-purpose surface spaces | Storage | Temporary surface accumulation and infiltration |
| D7 | Overland flow corridors | Drainage | Directed discharge of excess runoff |
| S8 | Temporary floodable roads | Storage | Short-term detention to alleviate drainage load |
| E9 | Dual-purpose underground spaces | Emergency storage | Non-conventional storage under extreme rainfall |
| Category | Activation Condition | Core Function | Representative Facilities |
|---|---|---|---|
| Active facilities | Regular operation | Capture–Infiltration–Conveyance–Storage | Green spaces, permeable pavements, source detention facilities, drainage systems, water bodies, dual-purpose surface spaces, overland flow corridors |
| Passive facilities | Extreme rainfall events | Emergency detention and risk buffering | Temporary floodable roads, dual-purpose underground spaces |
| Symbol | Description | Unit |
|---|---|---|
| Qs | Surface runoff depth | mm |
| Qtotal | Total runoff volume | m3 |
| Qinfiltration | Infiltrated volume (VI1 + VI2) | m3 |
| Qstorage | Stored volume (S3, S5, S6, S8, E9) | m3 |
| Qdrainage | Drained volume (D4 + D7) | m3 |
| Qoverflow | Excess runoff | m3 |
| QD4, QD7 | Instantaneous discharge (D4, D7) | m3/s |
| ID | Facility Name | Parameter Type | Symbol | Unit | Typical Value (Weifang) | Value Range | Measurement/Estimation Method | Source | Sensitivity Ranking |
|---|---|---|---|---|---|---|---|---|---|
| I1 | Green space | Infiltration coefficient | KI1 | m/s | 3.5 × 10⁻⁶ | 10−7–10−5 | Field test | Field test (double-ring infiltrometer, ASTM D3385-09) | Medium |
| I1 | Green space | Effective area | AI1 | km2 | 4.11 | — | GIS | Weifang City Land Use GIS Dataset (2023) | Low |
| I2 | Permeable pavement | Infiltration coefficient | KI2 | m/s | 1.0 × 10⁻⁴ | 10−5–10−3 | Code | Design code GB/T 25993-2023 (B-grade permeable paving) | Medium |
| I2 | Permeable pavement | Effective area | AI2 | km2 | 0.138649 | — | GIS | Weifang City Land Use GIS Dataset (2023) | Low |
| S3 | Source detention facility | Storage volume | VS3 | 104 m3 | 1.8 | — | Survey | Field survey (Weifang City stormwater facility inventory, 2023) | Medium |
| D4 | Drainage system | Manning roughness | nD4 | — | 0.013 | 0.011–0.015 | Code | Design code GB 50014-2016 | Medium |
| D4 | Drainage system | Catchment area | AD4 | km2 | 24 | — | GIS | Weifang City Drainage Network GIS Dataset (2023) | Low |
| S5 | Water body | Storage depth | HS5 | m | 1.94 | — | Design | Design specification | Medium |
| S6 | Dual-purpose surface space | Storage volume | VS6 | 104 m3 | 3 | — | Survey | Field survey (Weifang City public space inventory, 2023) | Medium |
| D7 | Overland flow corridor | Cross-sectional area | CSD7 | m2 | 163.7 | — | Survey | Field survey | Low |
| S8 | Temporary floodable road | Ponding depth | HS8 | m | 0.15 | — | Code | Design code | Low |
| E9 | Dual-purpose underground space | Storage depth | HE9 | m | 1 | — | Survey | Field survey | High |
| Rainfall Scenario | 24-h Rainfall (mm) | Management Objective | Management Strategy |
|---|---|---|---|
| R1 (Light to moderate rain) | Light rain < 10 mm; moderate rain 10–24.9 mm; heavy rain 25–49.9 mm | Ensure normal drainage with no significant surface ponding | Prioritize source control via I1–S3; supplement with D4 for runoff conveyance. |
| R2 (Heavy to very heavy rain) | Heavy rain 50–99.9 mm; very heavy rain 100–249.9 mm | Control flooding, protect key zones | On top of R1, activate D7 and S6 to direct excess runoff; temporarily use S8 for detention. |
| R3 (Extreme rainstorm) | ≥250 mm | Ensure safety, minimize losses, enable recovery | Deploy all facilities (I1–E9); maximize drainage and storage; activate E9 post-evacuation; initiate emergency protocols. |
| Target Level | Rainfall Scenario | Stormwater Management Objective | Return Period T (Years) | Design Rainfall Htarget (mm) |
|---|---|---|---|---|
| I | R1 | No surface ponding | 2–5 years | H1 |
| II | R2 | No urban flooding | 20–50 years | H2 |
| III | R3 | No functional failure | ≥100 years | H3 |
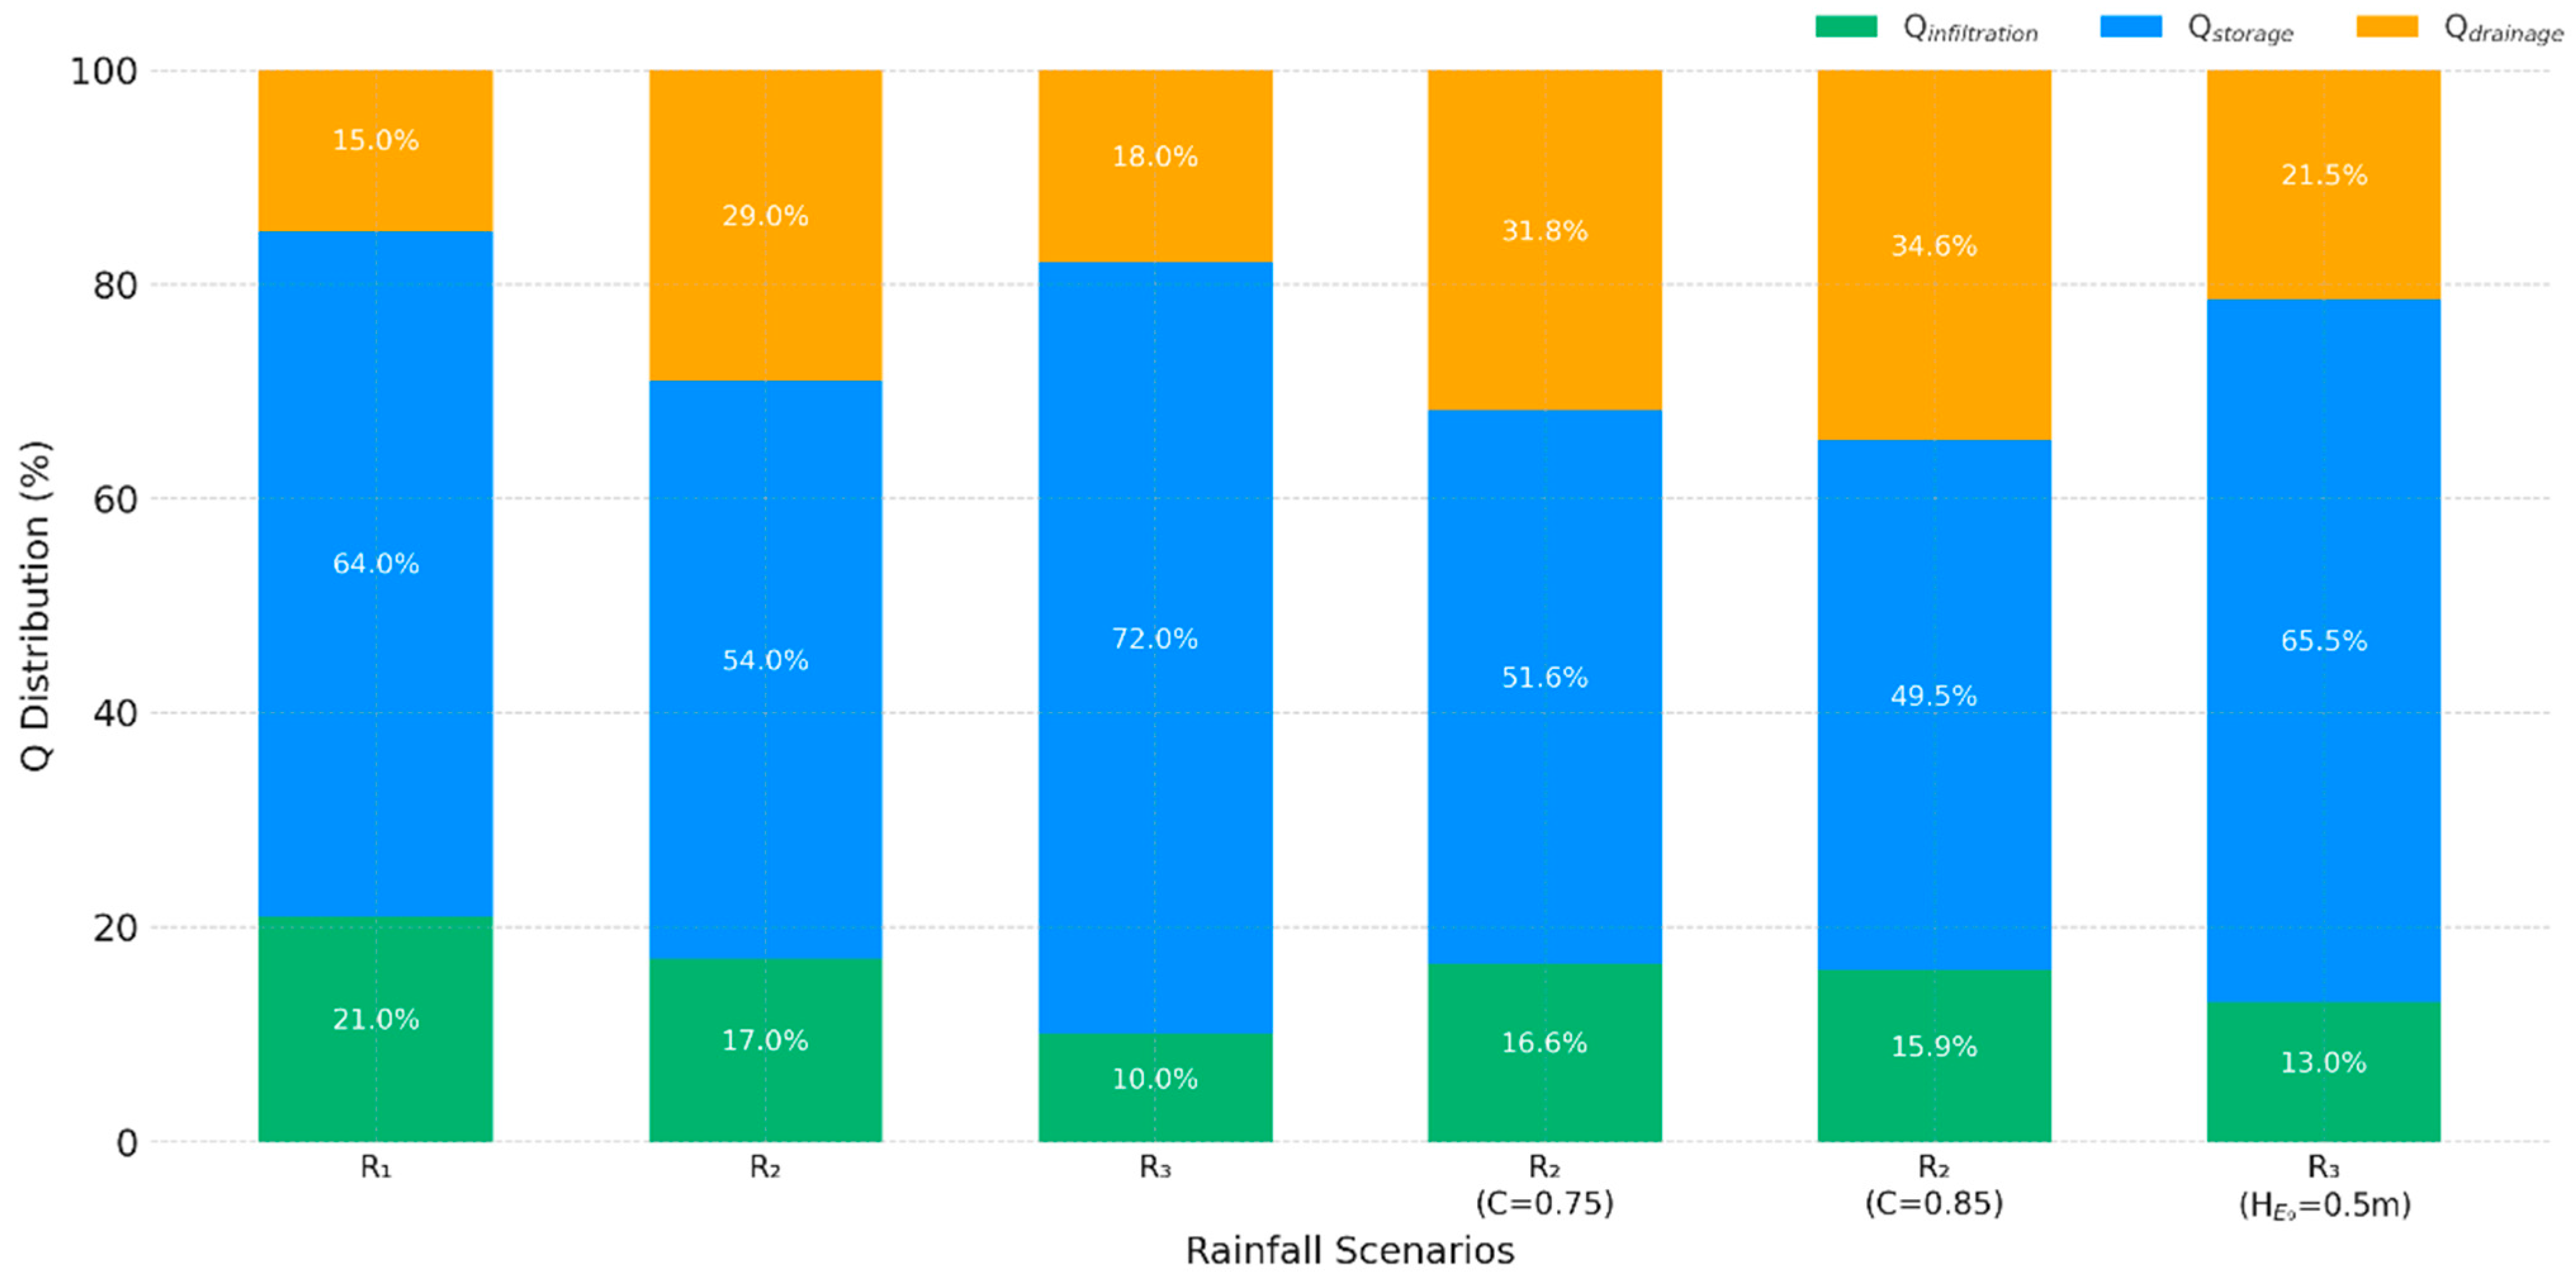
| Scenario | Htarget (mm) | Vtarget (104 m3) | Activated Facilities | Vcurrent (104 m3) | Hcurrent (mm) | η | Q Distribution (%) | Target Achievement |
|---|---|---|---|---|---|---|---|---|
| R1 | 51 | 122.4 | I1–S5 | 484.1 | 202 | 3.96 | Qinfiltration: 21%, Qstorage: 64%, Qdrainage: 15% | No ponding under light rain; significant surplus |
| R2 | 236 | 566.4 | I1–S8 | 585.5 | 244 | 1.03 | Qinfiltration: 17%, Qstorage: 54%, Qdrainage: 29% | No flooding under heavy rain; functions maintained |
| R3 | 300 | 720.0 | I1–E9 | 979.5 | 408 | 1.36 | Qinfiltration: 10%, Qstorage: 72%, Qdrainage: 18% | Withstands extreme rain; core functions protected |
Disclaimer/Publisher’s Note: The statements, opinions and data contained in all publications are solely those of the individual author(s) and contributor(s) and not of MDPI and/or the editor(s). MDPI and/or the editor(s) disclaim responsibility for any injury to people or property resulting from any ideas, methods, instructions or products referred to in the content. |
© 2025 by the authors. Licensee MDPI, Basel, Switzerland. This article is an open access article distributed under the terms and conditions of the Creative Commons Attribution (CC BY) license (https://creativecommons.org/licenses/by/4.0/).
Share and Cite
Mao, K.; Li, J.; Liu, D.; Li, X.; Huang, M.; Xiang, L. Technical System for Urban Stormwater Carrying Capacity Assessment and Optimization. Buildings 2025, 15, 1889. https://doi.org/10.3390/buildings15111889
Mao K, Li J, Liu D, Li X, Huang M, Xiang L. Technical System for Urban Stormwater Carrying Capacity Assessment and Optimization. Buildings. 2025; 15(11):1889. https://doi.org/10.3390/buildings15111889
Chicago/Turabian StyleMao, Kun, Junqi Li, Di Liu, Xiaojing Li, Miansong Huang, and Lulu Xiang. 2025. "Technical System for Urban Stormwater Carrying Capacity Assessment and Optimization" Buildings 15, no. 11: 1889. https://doi.org/10.3390/buildings15111889
APA StyleMao, K., Li, J., Liu, D., Li, X., Huang, M., & Xiang, L. (2025). Technical System for Urban Stormwater Carrying Capacity Assessment and Optimization. Buildings, 15(11), 1889. https://doi.org/10.3390/buildings15111889