Article

Study on Dynamic Response and Progressive Collapse Resistance of Space Steel Frame Under Impact Load

Key Laboratory of Intelligent Health Perception and Ecological Restoration of Rivers and Lakes, School of Civil Engineering, Architecture and Environment, Hubei University of Technology, Wuhan 430068, China
*
Author to whom correspondence should be addressed.
Buildings 2025, 15(11), 1888; https://doi.org/10.3390/buildings15111888
Submission received: 13 April 2025 / Revised: 21 May 2025 / Accepted: 28 May 2025 / Published: 29 May 2025
(This article belongs to the Section Building Structures)

Abstract

:
The dynamic response of multi-story steel frames under impact loading exhibits a complex nonlinear behavior. This study develops a three-story, multi-scale spatial steel frame finite element model using ABAQUS 2023 software, and the contact algorithm and material parameters were validated through published drop-weight impact beam tests. A total of 48 impact parameter combinations were defined, covering rational mass–velocity ranges while accounting for column position variations at the first story. Systematic comparisons were conducted on the influence of varying impact parameters on structural dynamic responses. This study investigates deformation damage and progressive collapse mechanisms in spatial steel frames under impact loading. Structural dynamic responses show significant enhancement with increasing impact mass and velocity. As impact kinetic energy increases, the steel frame transitions from localized denting at impact zones to global bending deformation, inducing structural tilting. The steel frame exhibits potential collapse risk under severe impact conditions. Under identical impact energy, corner column impact displacements differ by <1% from edge-middle column displacements, with vertical displacement variations ranging 0–17.6%. The displacement of the first-floor joints of the structure with three spans in the impact direction was reduced by about 50% compared to that with two spans. When designing the structure, it is necessary to increase the number of frame spans in the impact direction to improve the overall stability of the structure. Based on the development of the rotation angle of the beam members during the impact process, the steel frame collapse process was divided into three stages, the elastic stage, the plastic and catenary stage, and the column member failure stage; the steel frame finally collapsed due to an excessive beam rotation angle and column failure.

1. Introduction

The robustness of building structures under unforeseen circumstances is an evolving area of civil engineering. Structures can be subjected to unforeseen conditions during their service life, resulting in the failure of critical elements and triggering a ripple effect, leading to the failure of adjacent elements and ultimately progressive collapse, where initial localized damage leads to total or disproportionate damage [1].
In recent years, accidental incidents and terrorist attacks have occurred frequently worldwide. Since the 1960s, three typical structural progressive collapse events have occurred, the 1968 Ronan Point apartment gas explosion in the UK [2], the 1995 Murrah Federal Building car bomb attack in the US [3], and the 2001 World Trade Center terrorist attack in New York, US [4]. These events highlight the significant loss of life and property caused by structural collapse, making progressive collapse analysis one of the most critical topics in structural engineering. Extensive research has been conducted on the progressive collapse resistance of structures, and similar to other structural engineering problems, progressive collapse assessment employs analytical, experimental, or numerical techniques. Numerous academic reviews have been conducted on progressive collapse resistance [5,6,7,8]. Traditional design methods to mitigate progressive collapse include conceptual design, the tie force method, the alternate path method, and local strengthening techniques. The conceptual design method enhances the overall integrity, ductility, robustness, and redundancy of structures through structural design and architectural construction. The tie force method designs and verifies that the connections of certain components meet the minimum strength requirements. The alternate path method analyzes the collapse of the remaining structure after removing selected components. The local strengthening method specifically designs key components to have sufficient strength to resist external sudden loads, thereby preventing initial local damage. Currently, the most commonly used method in progressive collapse research is the alternate path method, which is widely applied in progressive collapse experiments and numerical simulations. With the development of advanced high-tech materials, such as ultra-high-performance concrete (UHPC), engineered cementitious composites (ECCs), fiber-reinforced polymers (FRPs), and superelastic shape memory alloy (SMA) bars, these materials are increasingly being applied to structural reinforcement to enhance seismic performance and progressive collapse resistance [9,10,11].
Existing research indicates that the progressive collapse of buildings is a dynamic process. However, traditional anti-progressive collapse design and research often consider only static and quasi-static responses, neglecting dynamic responses [12,13,14]. Additionally, current research on progressive collapse often overlooks the causes of collapse failure and primarily uses the direct column removal method to study the collapse resistance of the remaining structure [15]. During the service life of building structures, they may inevitably be subjected to accidental impact loads, such as the impact of a crashing airplane on high-rise buildings, ship collisions with bridges, accidental car collisions with building structures, and accidental impacts from crane lifting operations at construction sites. These are all collision problems caused by moving objects. Accidental events such as explosions and impacts can cause dynamic responses and local damage, leading to progressive collapse. Therefore, understanding the dynamic response of the entire structure and its components under impact loading is crucial for ensuring an appropriate level of structural safety.
In the design and assessment of building structures, disaster events may induce unique loading patterns and failure modes. Under certain extreme conditions, the failure of critical components may lead to the falling of local components, thereby generating impact loads on the lower structure. However, due to the high cost and difficulty of conducting full-scale structural impact tests, current research on impact loading primarily focuses on the component and joint levels. Specifically, in component-level research, scholars have conducted column impact tests [16,17,18] and beam impact tests [19,20,21] to explore the dynamic response and local damage effects of individual components under impact loading. Additionally, since joints are typically the weak points of structural systems, extensive research has focused on joint impact tests [22,23,24,25], employing a combination of experimental and numerical simulation methods to deeply analyze the mechanical behavior and failure mechanisms of joints under impact loading. However, research on the overall structure under impact loading is relatively limited, with existing studies primarily relying on numerical simulation methods [26,27,28]. Notably, the impact loading’s effect on structures is not only reflected in local damage but also involves the overall vibration and failure of spatial frames [29]. Currently, research on the progressive collapse of overall structures mainly uses the alternate path method [29,30], which focuses on the progressive collapse mechanism of the structure after column failure but does not fully consider the potential impact of accidental loads on adjacent components of the failed column. In fact, under impact loading, the stress state and mechanical properties of the overall structure undergo significant changes and adjacent components may experience deformation and damage due to dynamic effects, with the collapse process often being a complex dynamic phenomenon. As one of the most commonly used building structural forms, the dynamic response and progressive collapse mechanisms of spatial steel frames under impact loading have not been thoroughly investigated.
In this study, a three-story spatial steel frame structure with two spans in the transverse direction and three spans in the longitudinal direction was designed based on current building structural design codes. To improve computational accuracy and efficiency, a multi-scale modeling approach was adopted using ABAQUS 2023 software [31], where the combination of shell and beam elements effectively simulates the overall mechanical behavior and local detailed responses of the structure. The model fully considers the effects of material nonlinearity and geometric nonlinearity to accurately reflect the damage evolution and failure mode of the structure under impact loading. A simplified rigid body was used as the impactor, and 48 impact parameter combinations were defined, covering a reasonable range of mass and velocity, while also considering variations in the position of the impacted columns at the ground floor. Based on the ABAQUS/Explicit explicit central difference algorithm, impact numerical simulations were conducted. By integrating global and local analysis methods, the influence of impact mass, impact velocity, and column position on the dynamic response of the spatial steel frame was thoroughly investigated, and the effects of different impact parameters on the structural dynamic response were systematically compared. Additionally, this paper provides a detailed analysis of the deformation damage and progressive collapse mechanisms of the spatial steel frame under impact loading. The research results offer theoretical foundations for the design and optimization of future building structures and have significant implications for enhancing structural safety under extreme loading conditions.

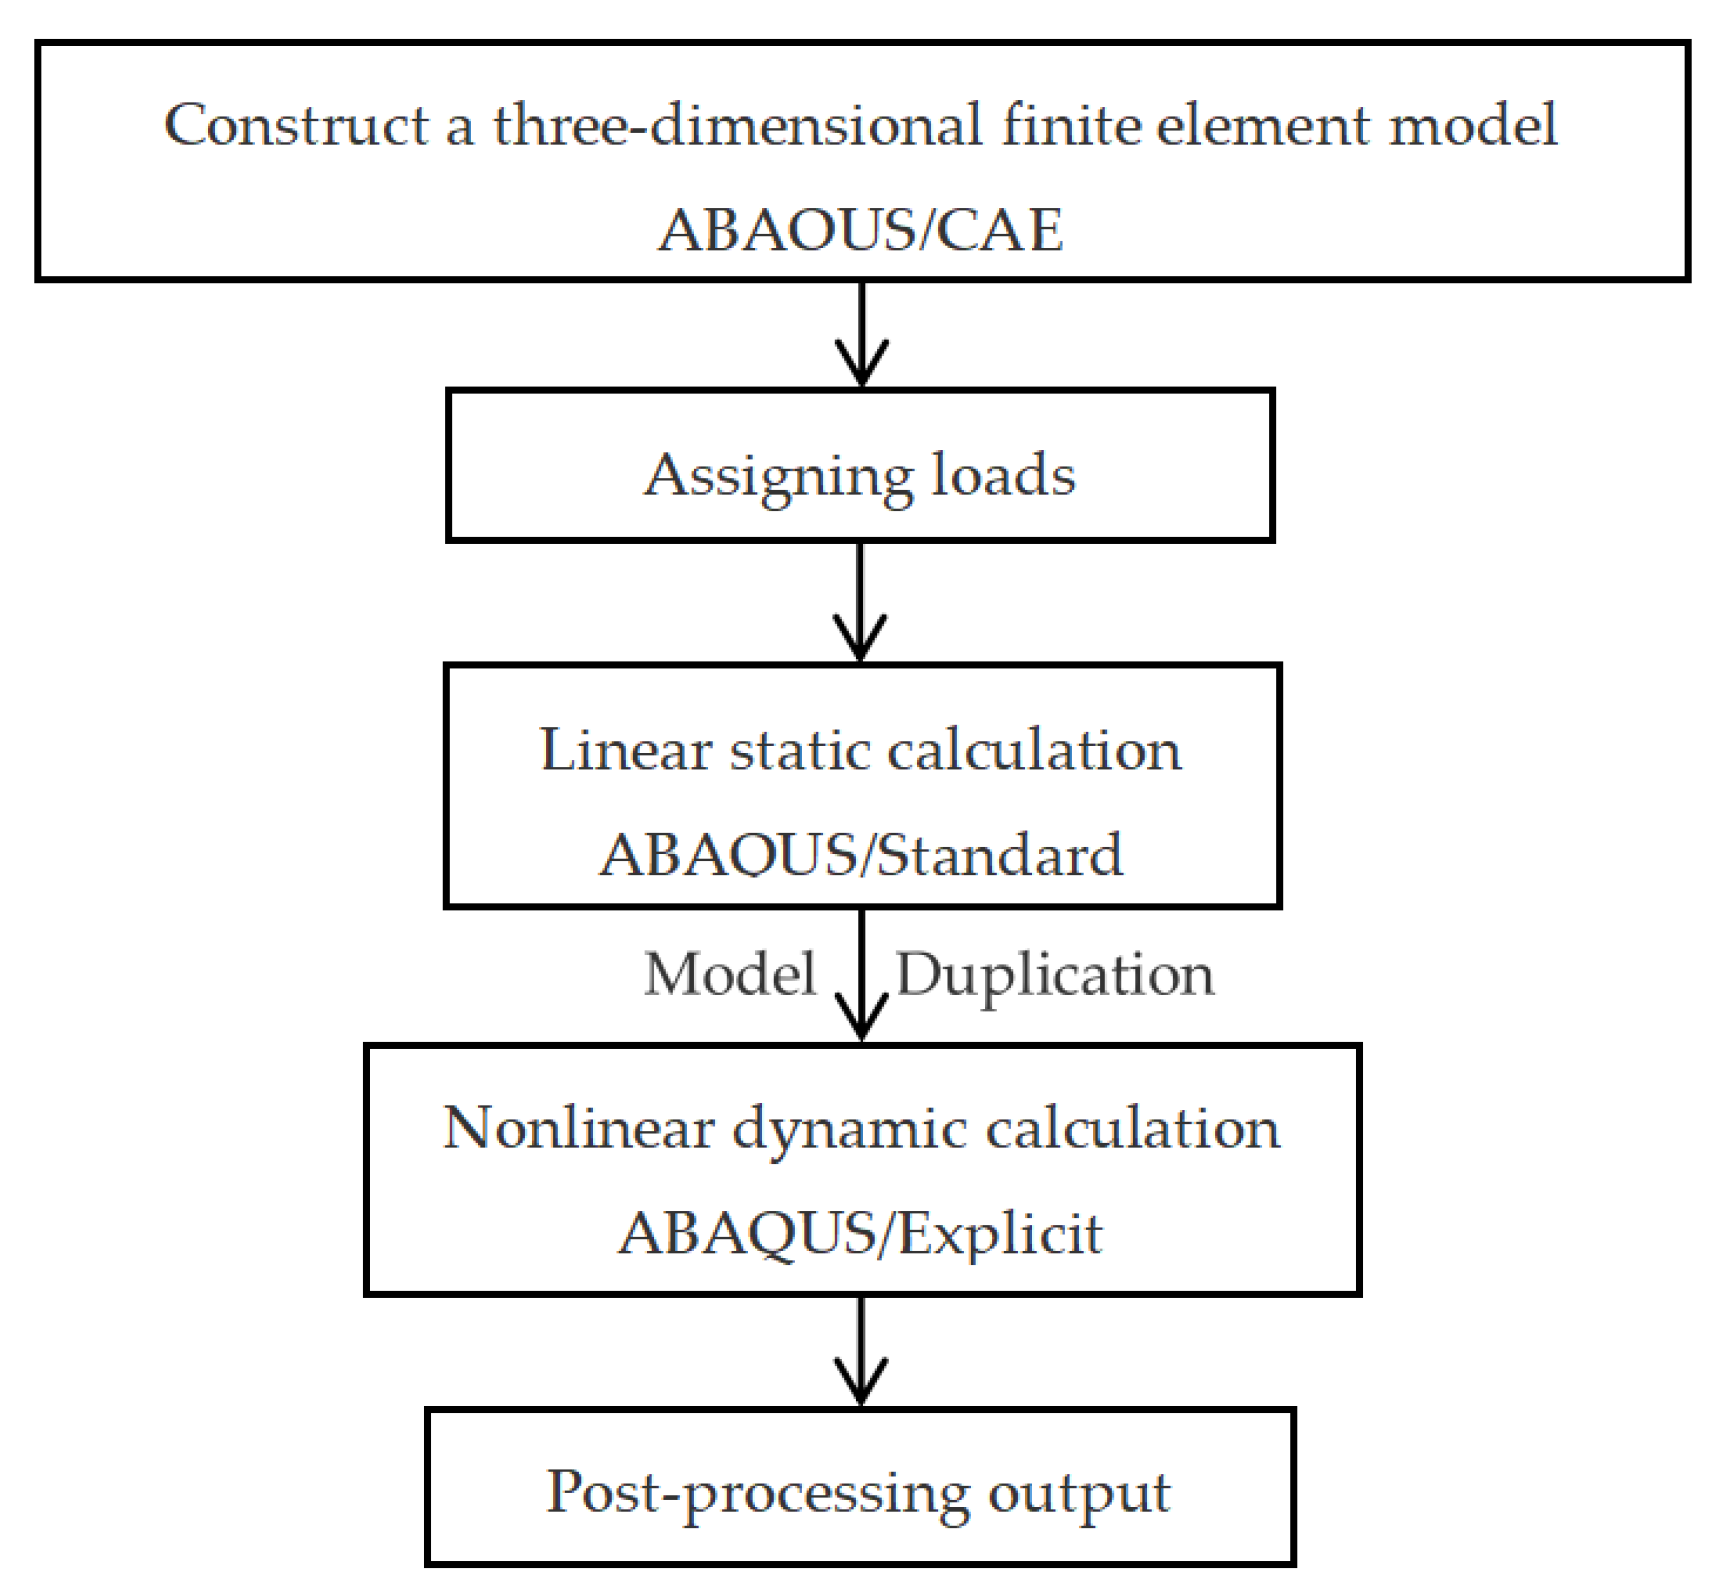
2. Materials and Methods

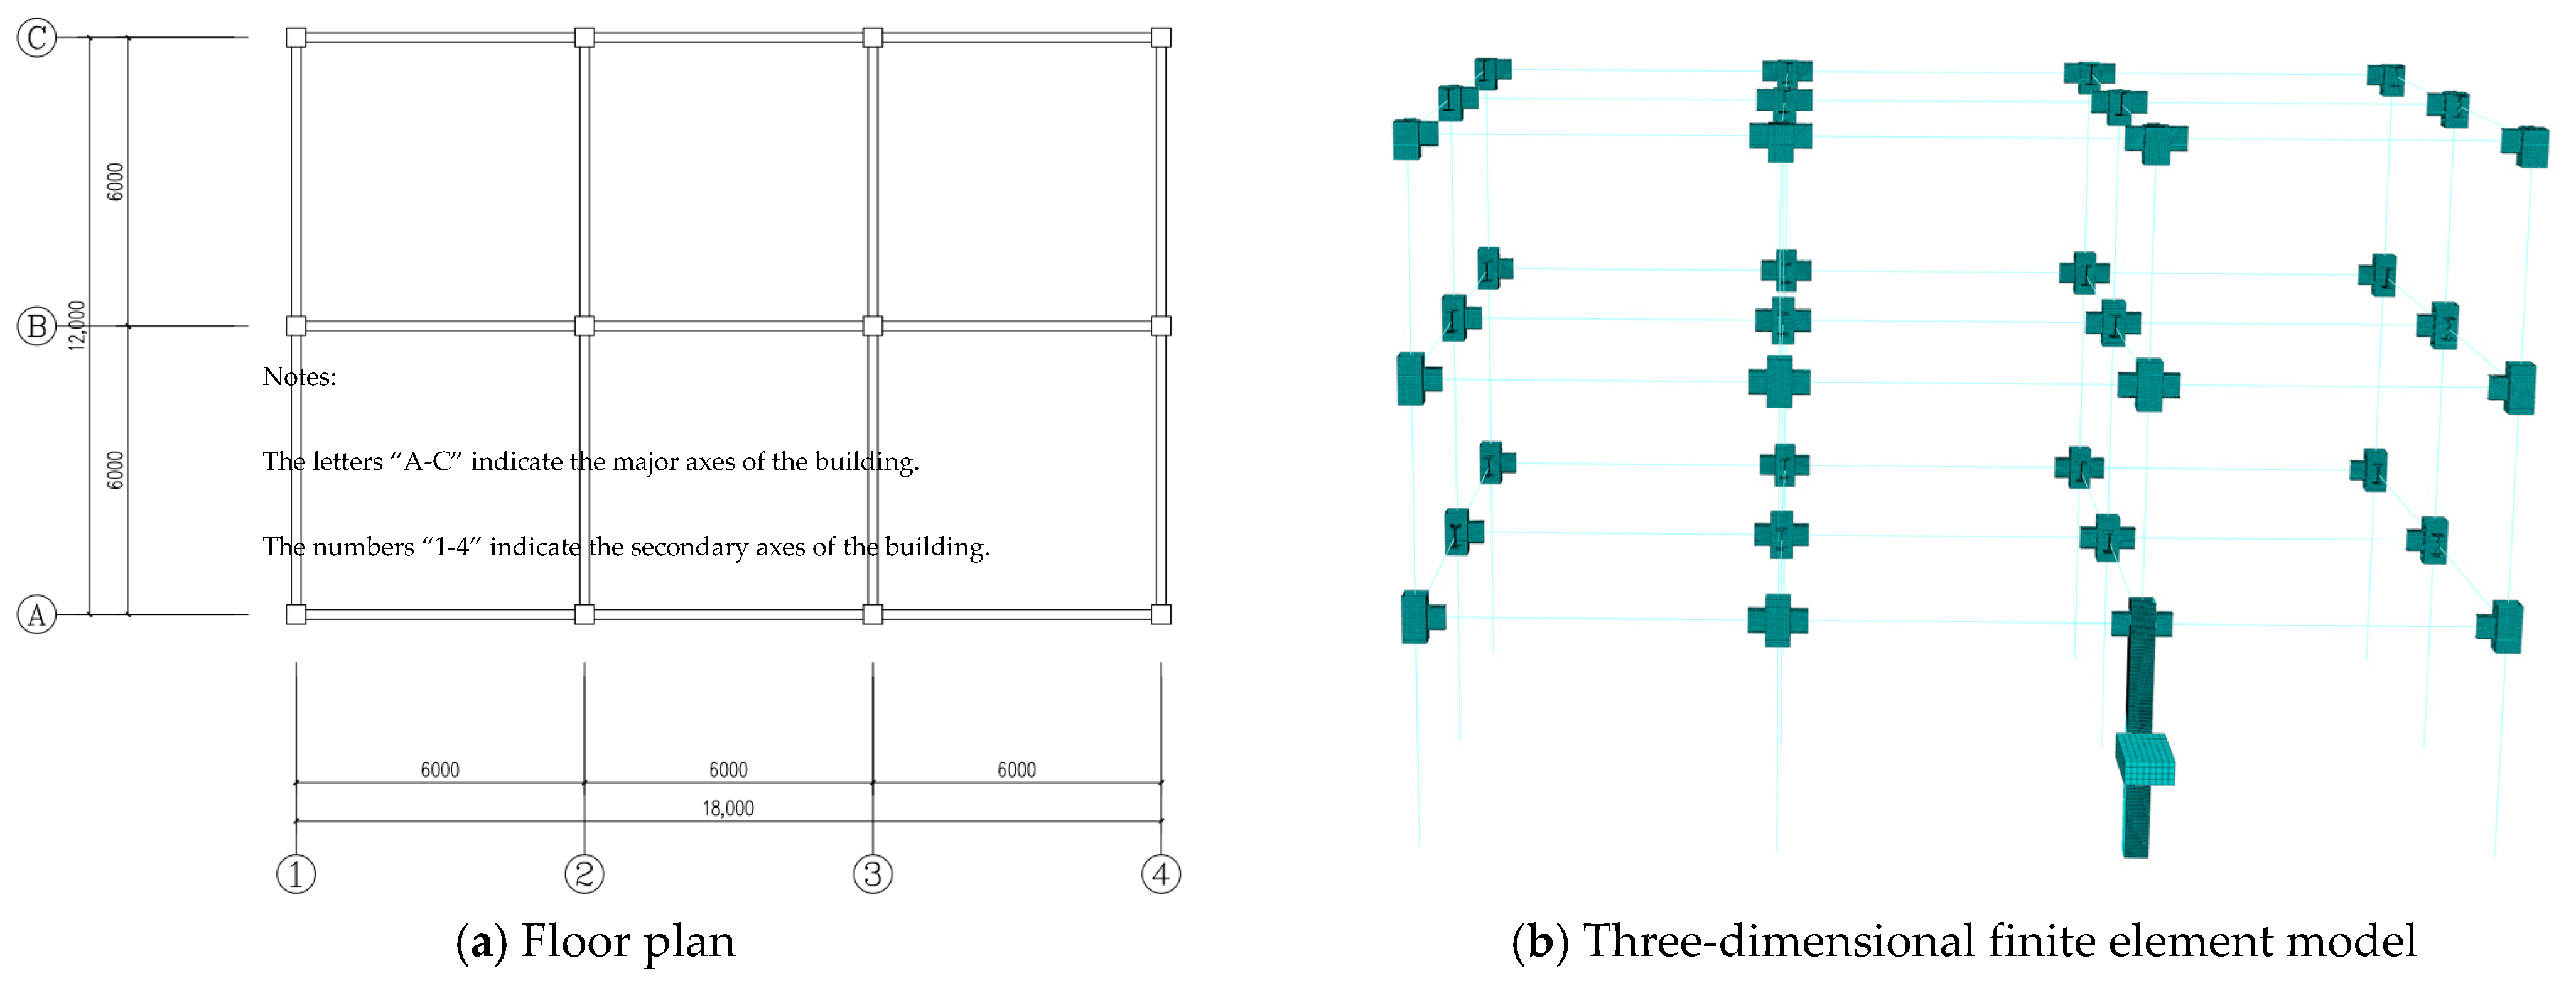
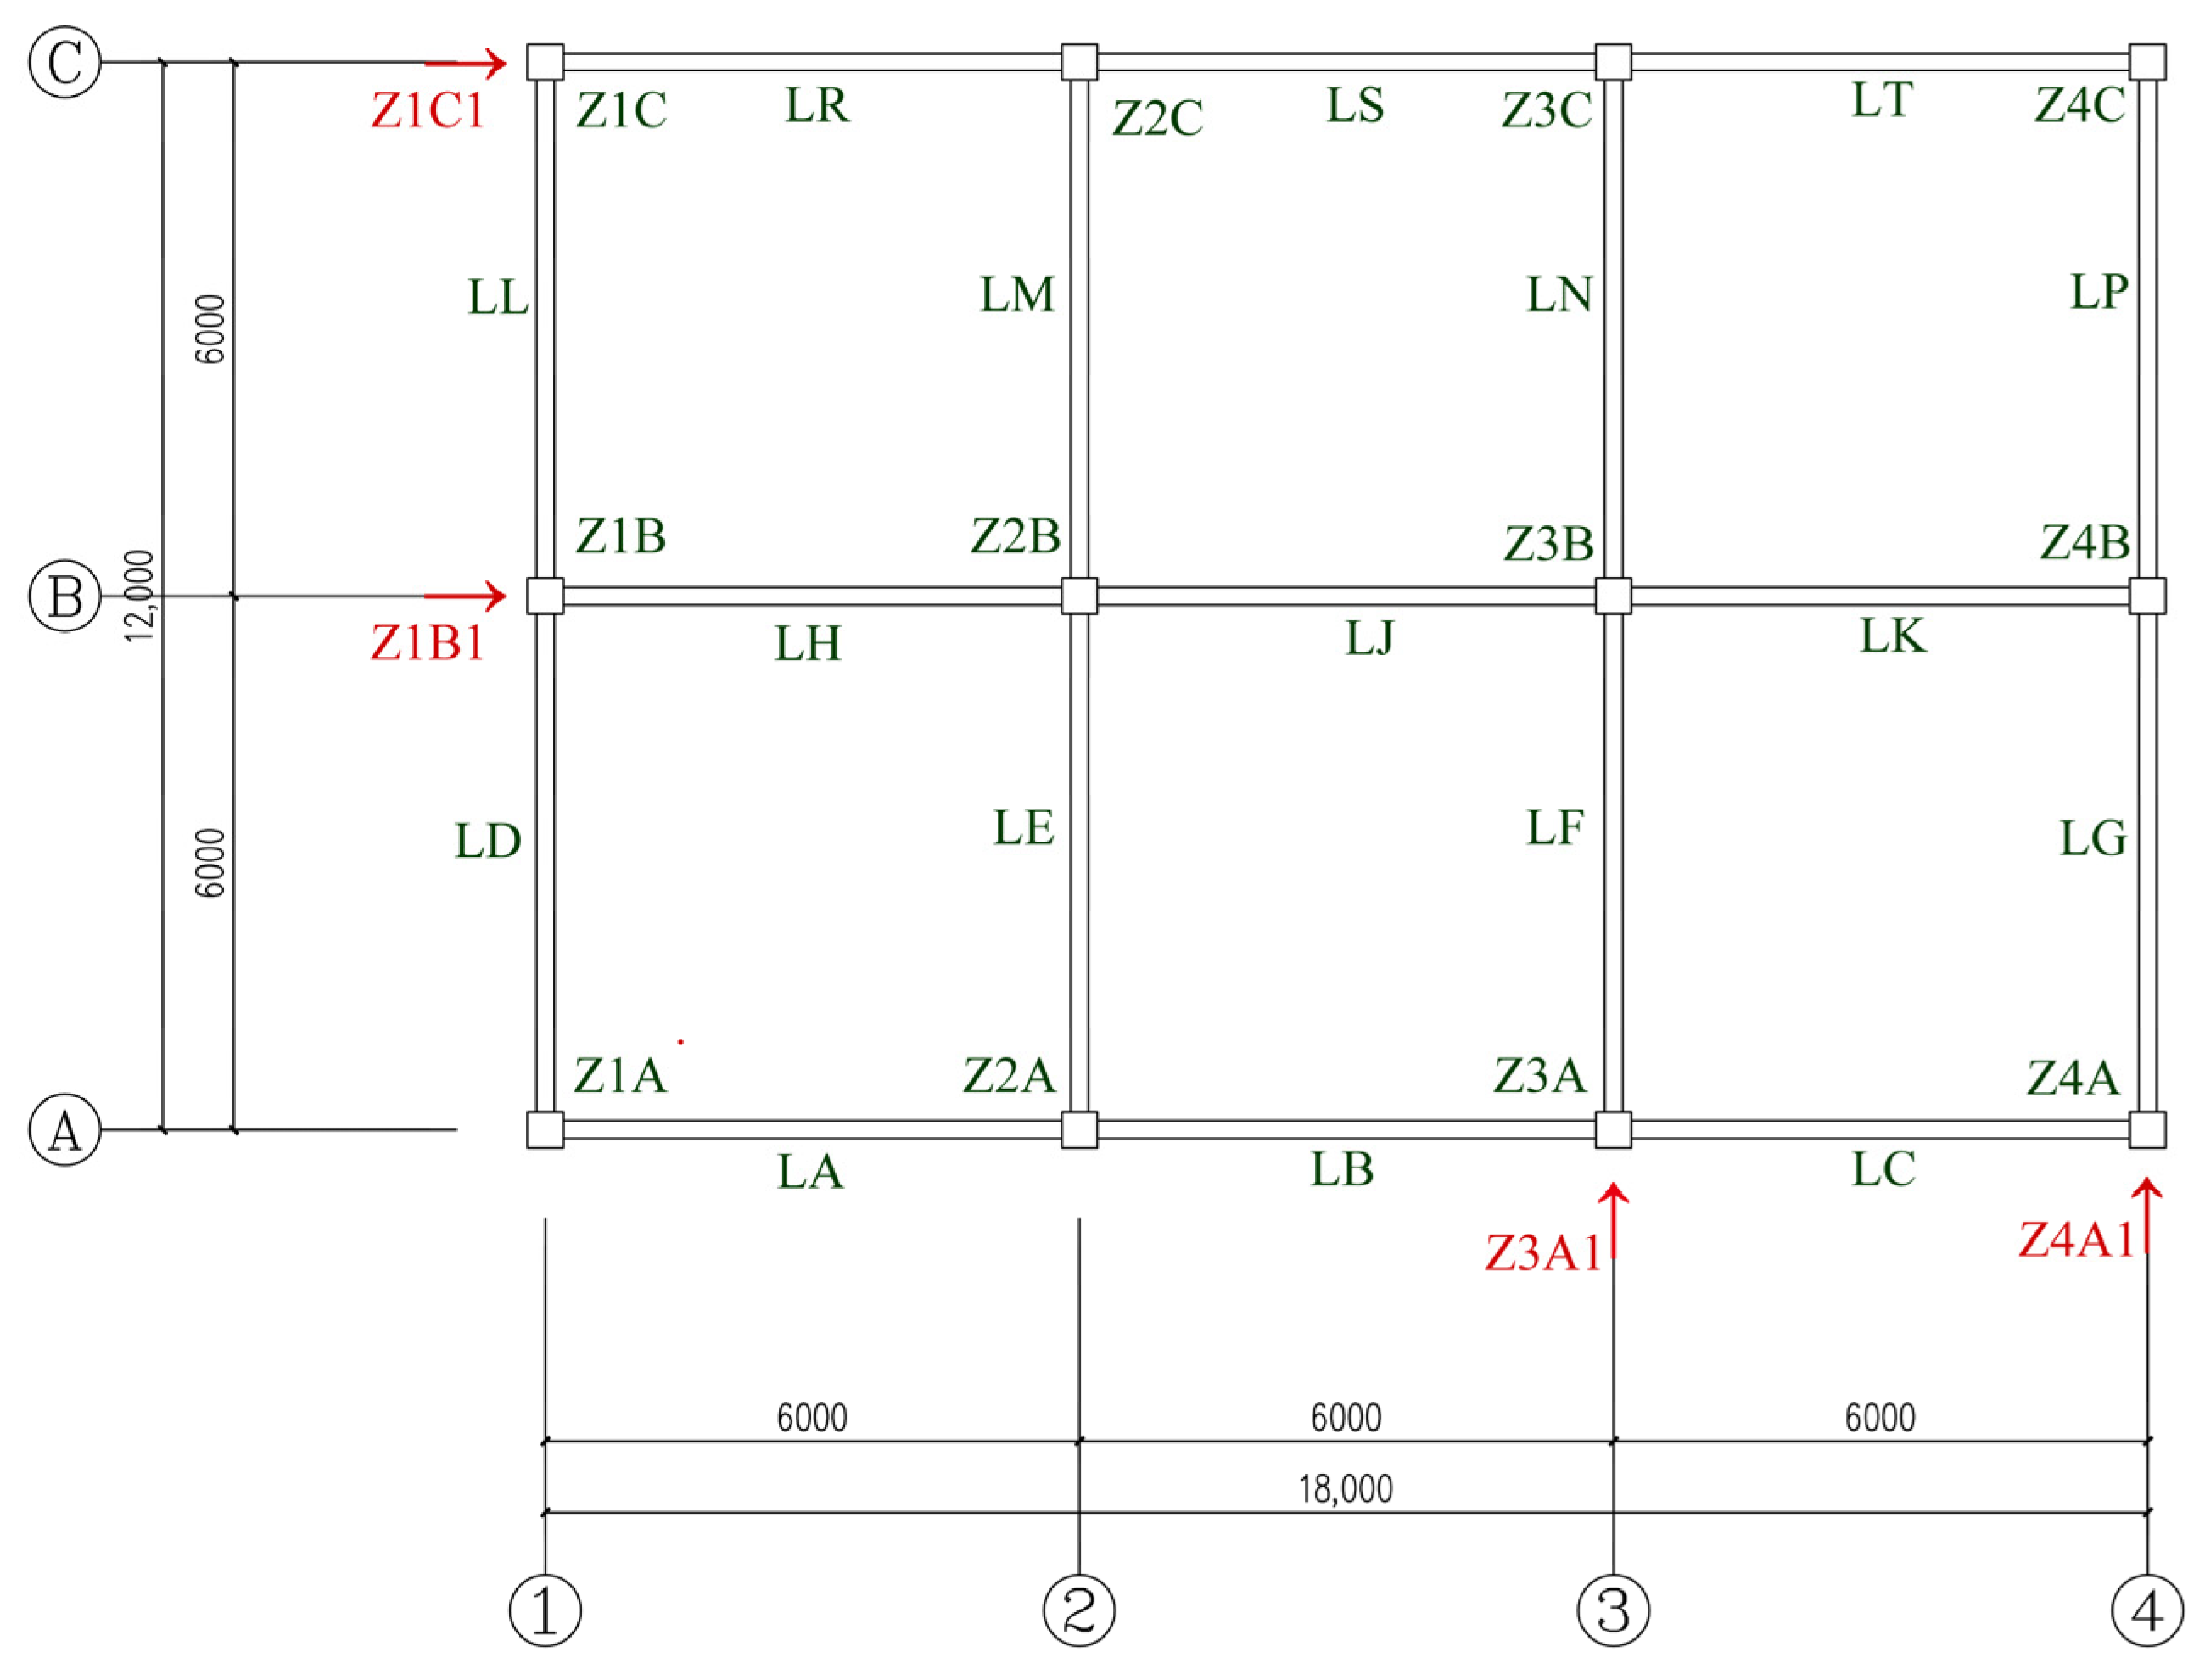
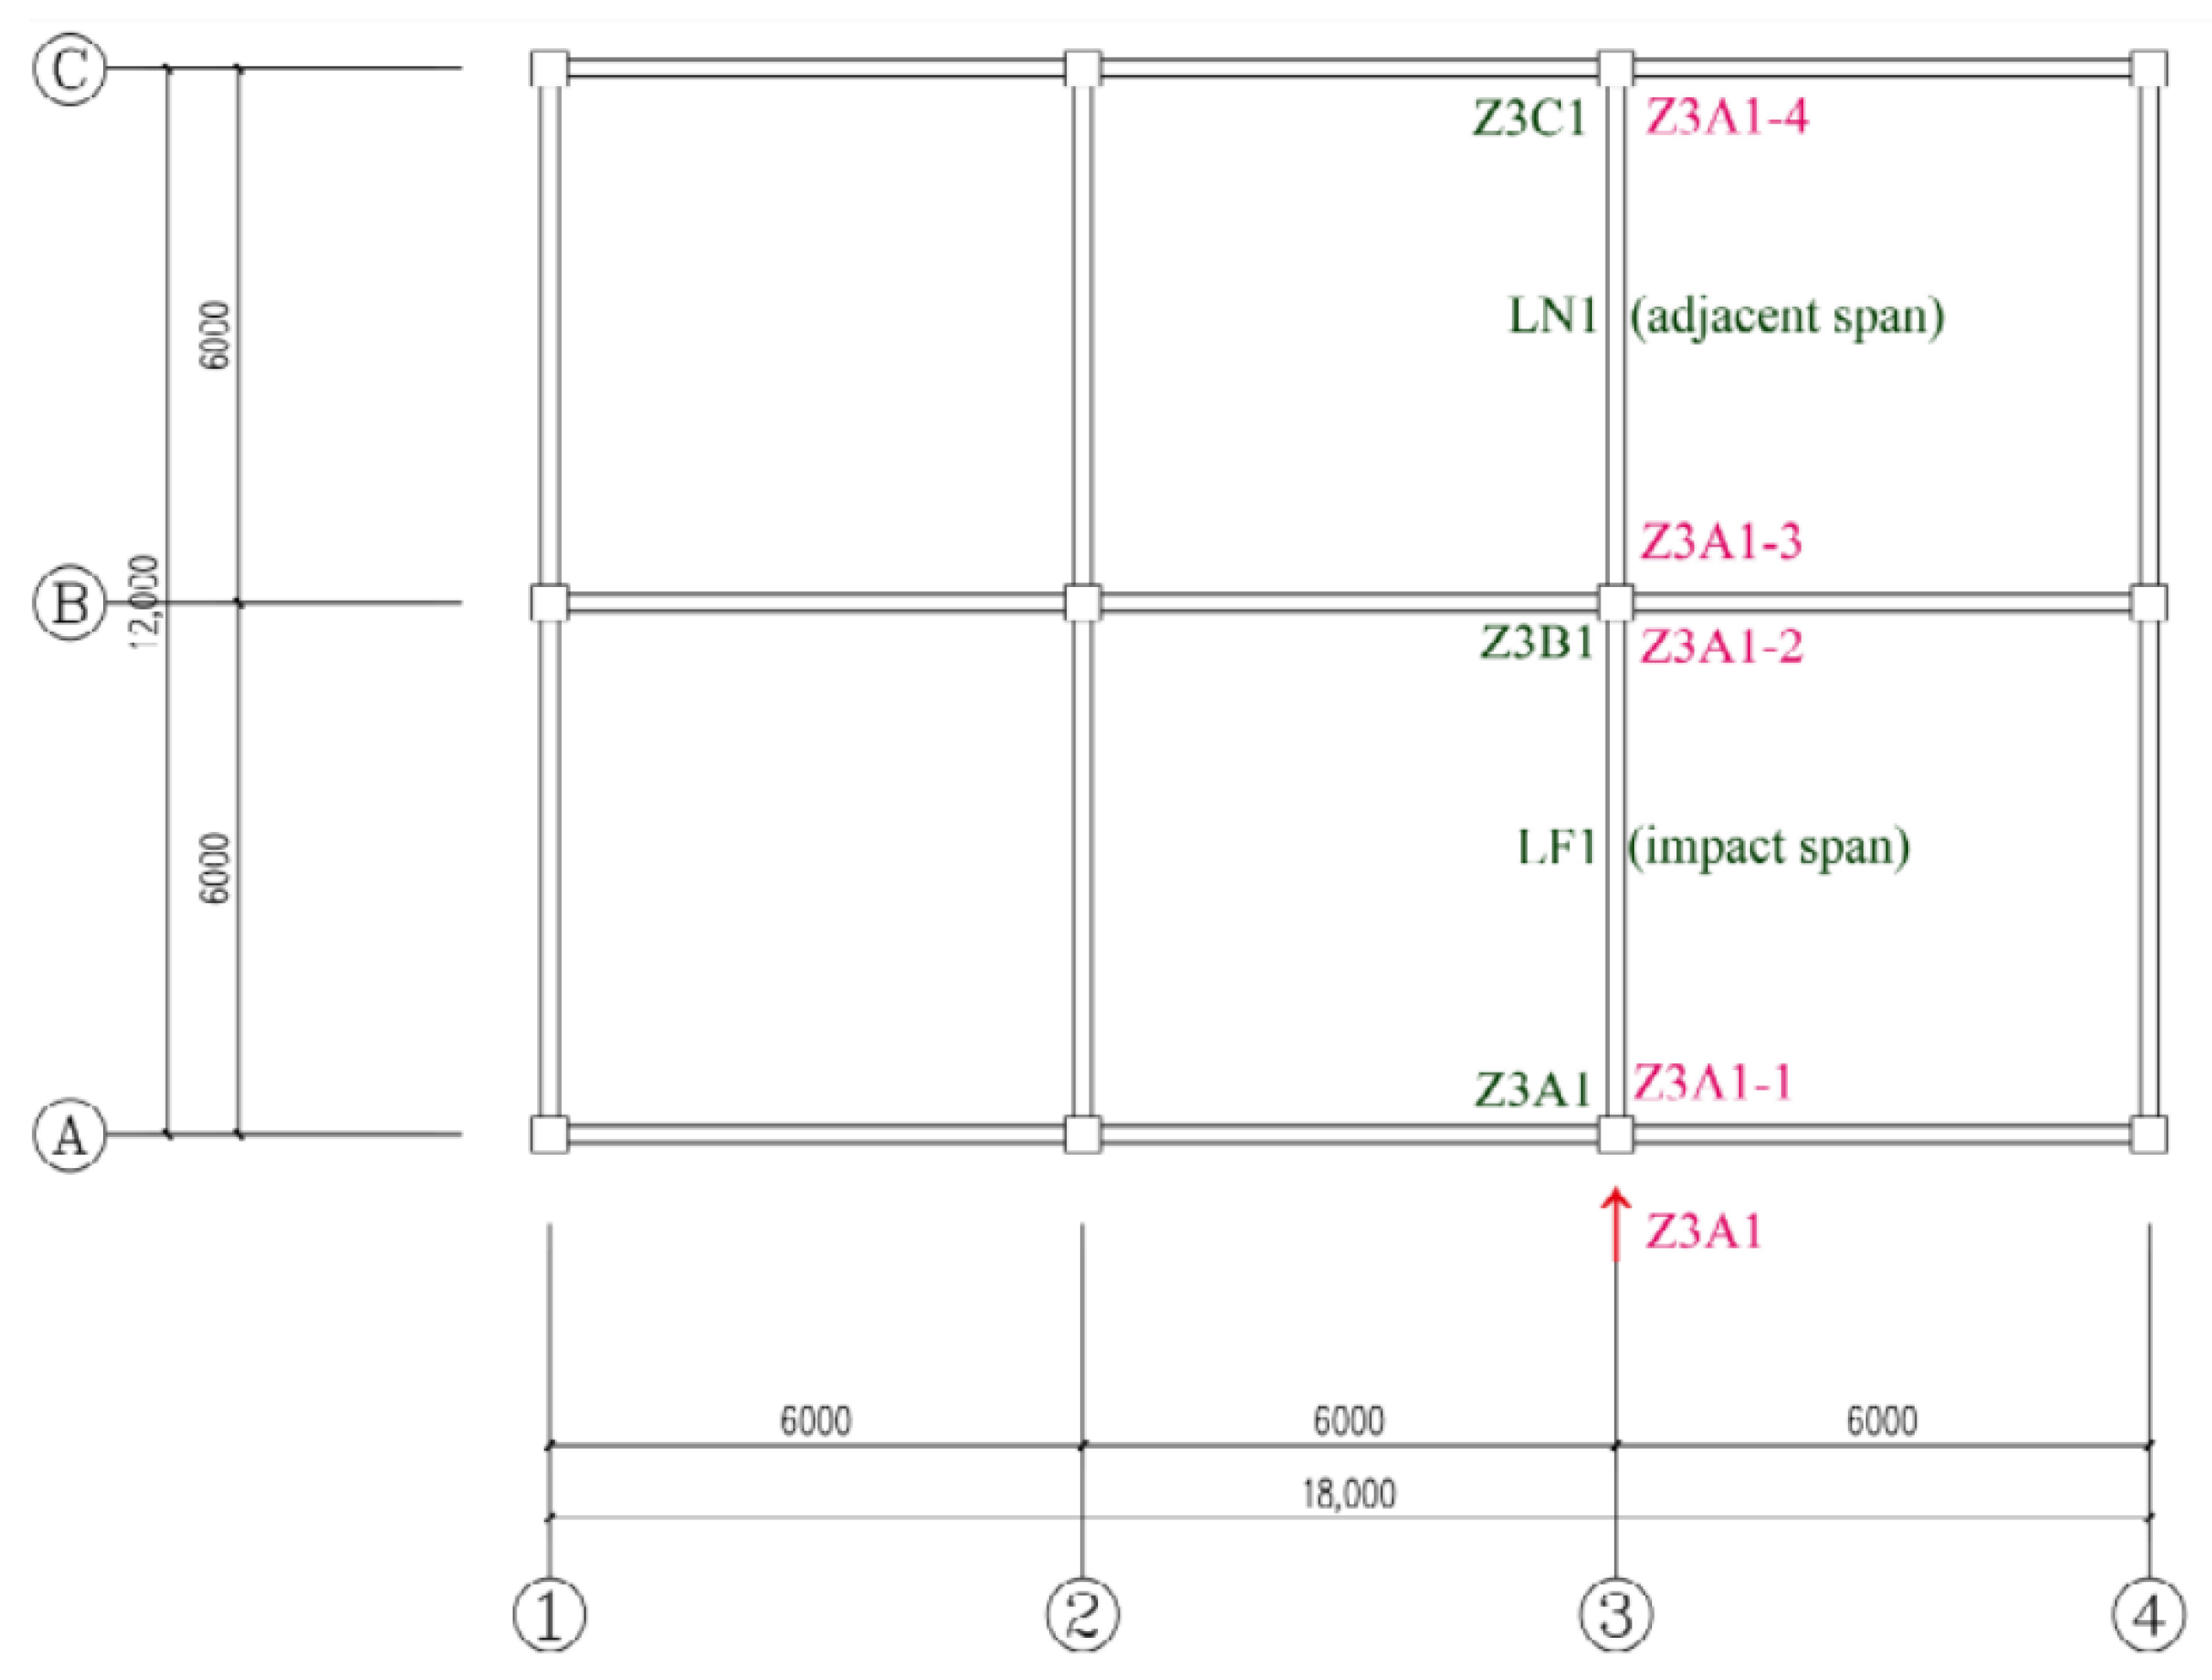
2.1. Model Parameters

2.1.1. Analytical Models

This study implements a two-stage computational workflow of initial structural design using PKPM 2021 software [32] followed by multi-scale finite element modeling with ABAQUS 2023 software. The three-story spatial steel frame was designed to comply with three critical Chinese standards, the GB 50017-2017 code for the design of steel structures [33], the GB 50009-2012 load code for the design of building structures [34], and the CECS 392:2021 code for the anti-collapse design of building structures [35]. The transverse and longitudinal spans are 6 m, with two transverse spans and three longitudinal spans, and the story height is 4 m. The floor plan is shown in Figure 1a. The dead load effect is taken as 4.5 kN/m2 and the live load effect is taken as 2.5 kN/m2, without considering wind and snow loads. Loads are applied as surface loads on shell elements and as line loads on beam elements. Q235B steel is selected as the material, with beam and column dimensions listed in Table 1. The beams and columns are rigidly connected, using the most widely used internal diaphragm joints. According to GB 50017-2017 “Code for Design of Steel Structures”, the thickness of the internal diaphragm is chosen to be the same as the beam flange, and fixed constraints are applied at the column base.
The finite element model is shown in Figure 1b. The steel frame is modeled with multi-scale units to improve computational efficiency. The deformation and damage of the impacted columns and beam–column joints of the steel frame must be focused on. The positions that need to be focused on are refined using the quadrilateral reduced-integral shell unit S4R to establish a refined model, which can simulate the bending and large deformation of the steel structure under the impact load. The rest of the components are modeled by the beam unit B31 to establish a macroscopic model, which can effectively simulate the bending and torsion of the beam unit. The beam–column connection selects the inner diaphragm joint, which can transmit the force well in the joint, and the thickness of the inner diaphragm is 13 mm, which is the same as the thickness of the beam flange. The size of the impact body H × B × L is 400 mm × 800 mm × 1500 mm, and the “Rigid body” in the constraint manager is used to define the impact body as a rigid body in order to ensure that the initial kinetic energy of the impact body is eventually converted into residual kinetic energy and the energy absorbed by the steel frame. The prestressing field applies the initial velocity to the impact body, and the impact body is constrained to move only in the direction of the initial velocity.

2.1.2. Model Loading Sequence

The model loading sequence is shown below and the model solving flowchart is shown in Figure 2.
(1) Apply gravity load and preload on the beam on the steel frame, execute the static universal analysis, and find the equilibrium state of the steel frame. (2) Adopt the initial state method to import the equilibrium state obtained from the static analysis into the new model, ensure that the load is unchanged, perform the display dynamics analysis, and complete the process of impacting the steel frame.

2.2. Material Parameters

The steel frame needs to consider the strain rate effect of steel under impact load [36], so this paper adopts the Johnson–Cook dynamic constitutive model of steel (Abbreviation J-C), and the expression of the J-C constitutive relationship is as follows:
σ e q = ( A + B ε e q n )   ( 1 + C ln ε ˙ e q ) ( 1 T m )
where A, B, n, C, and m are the model parameters; s e q is the equivalent stress; ε e q n is the equivalent strain; ε ˙ e q is the dimensionless equivalent plastic strain rate, ε ˙ e q = ε e q / ε o , where s   ε e q and ε o are the equivalent plastic strain rate and the reference strain rate, respectively; and T m = ( T T r ) / ( T m T r ) is the dimensionless temperature, where T r and T m are the reference temperature and the melting point of the material, and T is the current temperature.
Lin et al. [37] calibrated the J-C strength model through tests and numerical simulation. The values of the intrinsic relationship parameters in Equation (1) are shown in Table 2.
Additionally, the rise in temperature due to high-strain rates must be considered. Assuming the heating process is adiabatic, the increase in material temperature can be expressed as consumed plastic work, which is shown as follows:
T = χ ρ C p σ e q d ε e q
where ρ is the material density; Cp is the specific heat capacity where Cp = 469 Wm−1K−1; and χ is the empirical number of plastic work to heat, where usually χ = 0.9.
The damage initiation criterion is the J-C fracture criterion, and the following unit damage criterion of the J-C cumulative damage criterion is adopted in this paper:
D = ε e q ε f
where D in Equation (3) is the damage factor, and the material fails when the damage factor D exceeds the unit 1; where Δεeq is the equivalent plastic strain increment of an integral cycle; and where εf is the effective fracture strain at the current time step. The original J-C fracture criterion [38] is expressed in Equation (4), whilst [39] in ABAQUS it is expressed in Equation (5). According to Equation (4) of the original criterion to obtain the parameter D3 [18], -D3 should be entered in ABAQUS. The input Johnson–Cook fracture criterion parameters in ABAQUS are in Table 3. Equations (4) and (5) are as follows:
ε f = [ D 1 + D 2 exp ( D 3 η ) ] ( 1 + D 4 ln ε ˙ e q ) ( 1 + D 5 T )
where D1~D3 is the material parameter reflecting the effect of stress triaxiality, D4 is the strain rate sensitive parameter, D5 is the temperature effect parameter. Additionally, η is the stress triaxiality, defined as η = p/ σ e q , where p is the hydrostatic pressure and σ e q is the average stress; ε ˙ e q is the dimensionless equivalent plastic strain rate, ε ˙ e q = ε e q / ε o , where s   ε e q and ε o are the equivalent plastic strain rate and the reference strain rate, respectively; and T m = ( T T r ) / ( T m T r ) is the dimensionless temperature, where T r and T m are the reference temperature and the melting point of the material and T is the current temperature.
For the damage stage of steel Q235B, it is necessary to define both the Johnson–Cook damage initiation criterion and the damage evolution criterion, and in this paper, the damage evolution stage is adopted by the Zhou evolution criterion, which is expressed as follows:
D = 1.3 ( u ¯ p l u ¯ f ) 7.6
where D is the damage factor, u ¯ p l is equivalent plastic displacement, and u ¯ f is the ultimate damage displacement of the steel at fracture obtained from the test, which from the literature [40] is taken to be 15 mm.

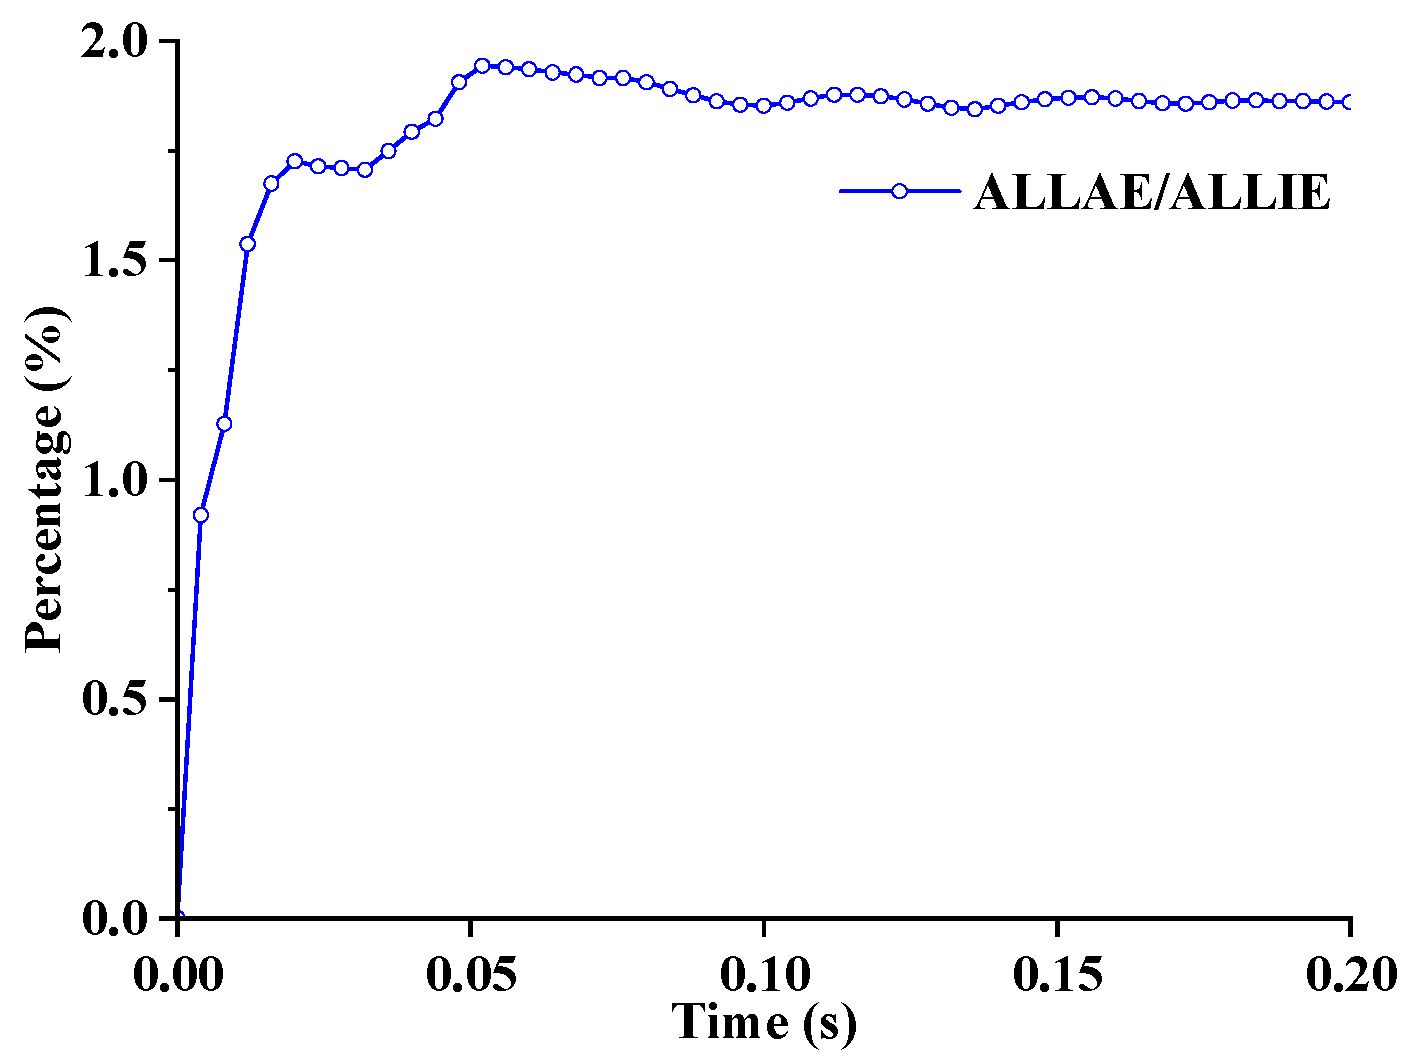
2.3. Contacts, Interactions and Meshing

The ABAQUS built-in MPC multi-point constraint method is used to generate the displacement constraint equations automatically according to the joint positions and member sizes to realize the transition from the beam unit to the shell unit, and the shell unit beams and columns are constrained by tie binding, which is regarded as a rigid connection. The contact surface in the impact process changes greatly; in order to prevent the square steel tube from having its penetration, this paper adopts the general contact that its tangential friction coefficient is 0.15, normal to the hard contact, and allows for separation after contact.
In order to avoid the influence of mesh size on the results, mesh sensitivity analysis was carried out. The analysis parameters were selected as follows, impact mass 6 t, impact velocity 40 m/s, impact column Z3A, and the impact point displacement and the vertical displacement of the top of the column subjected to the impact column is the basis for comparison. The results are shown in Table 4, in which for a mesh division of 30 mm the displacement results are stable, showing mesh convergence. Therefore, a global mesh size of 30 mm was selected. In contrast, the impacted columns are meshed at multiple scales, and local mesh encryption is performed at the impacted locations with an encrypted mesh size of 12 mm.
Hourglass energy is a kind of “zero-energy mode” produced by the quadrilateral reduced-integral shell unit S4R because of the reduction in the unit integration point. The larger hourglass energy will cause errors in the simulation results and produce the hourglass mesh. It is generally believed that the hourglass energy (ALLAE) accounts for less than 5% of the total internal energy of the system (ALLIE). The effect of the hourglass energy on the calculation results can be negligible [41]. Figure 3 shows the time curve of ALLAE/ALLIE, and the ratio of the two is not more than 5% which indicates that the cell size of the finite element model and the calculation results in this paper are correct.

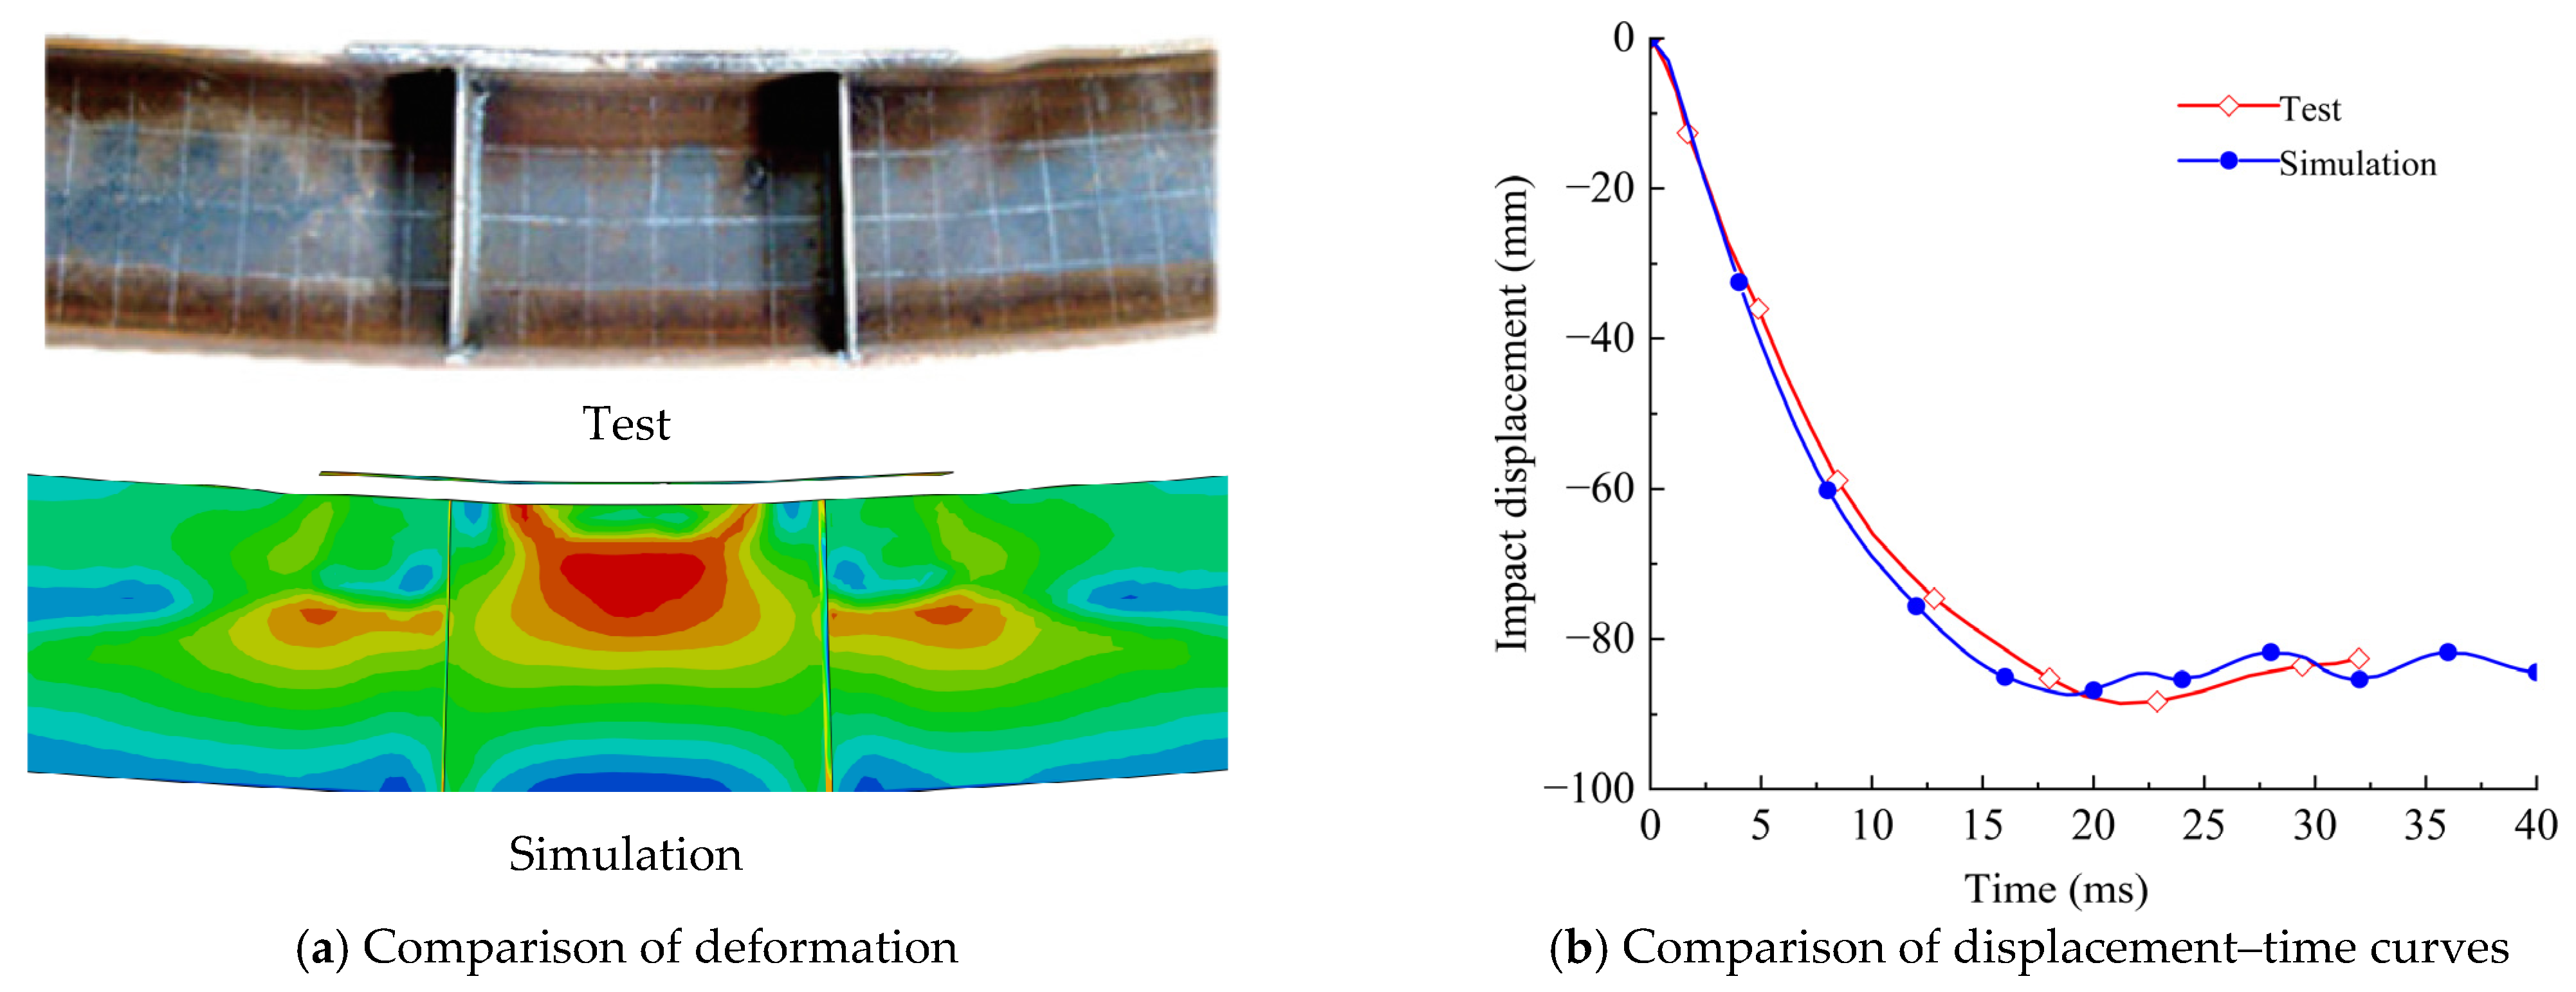
2.4. Modeling Verification

The impact test on H-shaped steel beams conducted by Huo Jingsi [19] was used to validate the material parameters and contact algorithm used in this study. Huo Jingsi performed several drop hammer impact tests on steel beams, and the HR4-6 condition was selected for numerical simulation verification. The test specimen was a Q235 grade hot-rolled H-section steel with cross-sectional dimensions of 250 mm × 125 mm × 6 mm × 9 mm and a total length of 2800 mm. The effective span was 2500 mm, with 9 mm thick flanges and 6 mm thick web. The loading area of the upper flange and hinged ends were locally reinforced, and stiffeners were symmetrically arranged within a 300 mm width at the mid-span. The drop hammer had a mass of 450 kg and was released from a height of 6 m. The steel beam was modeled using S4R reduced-integration shell elements with a global mesh size of 30 mm. The 900 mm region at the mid-span was refined to 12 mm. The finite element modeling of the falling hammer-impacted steel beam is shown in Figure 4. General contact was defined with a tangential friction coefficient of 0.15 and hard contact in the normal direction, allowing separation after contact. The Johnson–Cook constitutive model and fracture criterion were adopted, with detailed parameter definitions and values provided in Section 2.2. The initial velocity was applied through a predefined field, resulting in an impact velocity of 10.8 m/s. The beam ends were modeled as hinged connections, and the impact simulation was performed using the ABAQUS/Explicit module.
A comparison of the deformation between the simulation and the test is shown in Figure 5a, both of which have similar deformation patterns. The steel beam exhibited global bending deformation primarily at the impact location near the mid-span. Therefore, the displacement at the impact point was selected for comparison between simulation and experimental results. The displacement–time curve of the steel beam at the impact point is shown in Figure 5b, and the peak displacement of the simulated impact displacement is 87.4 mm while the peak displacement of the test value is 88.6 mm, with an error of 1.4%. It is believed that the above simulation method can be applied to the numerical simulation of steel frames under impact loading, which can accurately predict the dynamic response of steel frame structures during the impact process.

2.5. Impact Parameter Setting

In the service process of the building the structure may be subject to a variety of incidental impact loads, and so this paper focuses on the collision of moving objects on the structure using a simplified general impact scenario, i.e., the impacting body adopts a simple geometry with mass and velocity variations, affecting the impact response of more parameters, the design of various parameter combinations, and the different parameter combinations of the dynamic response of the steel frame for comparison. The parameters analyzed in this paper include impact mass, impact velocity, and column position. Impact mass M includes 3 cases, 1 t, 3 t, and 6 t, and impact velocity V includes 4 cases, 10 m/s, 20 m/s, 30 m/s, and 40 m/s. Based on engineering practice and the existing literature [26], the impact locations were selected at vulnerable exterior corner and edge columns in the bottom story. Considering the different span numbers in transverse and longitudinal directions, impacts were applied both horizontally and vertically at corner columns. Four typical locations (Z1B1, Z1C1, Z3A1, and Z4A1) in the bottom story were ultimately chosen, resulting in 48 parameter combinations. Although realistic threat modeling for impactors was not conducted, the selected parameter combinations fall within the range of typical vehicle or rockfall impacts and can be considered representative of such scenarios [41]. The impactor was simplified as a rigid body, with the impact location set at 2 m above ground level—corresponding to the mid-height of bottom-story columns.
The naming of each beam and column is shown in Figure 6. According to the axis intersection for column naming, the axis ① and axis Ⓐ intersection position of the column is recorded as Z1A, the corresponding position of the first floor of the column is Z1A1, the second floor of the column is Z1A2, and the third floor of the column is Z1A3. The beams are noted by the alphabetical order, and specific naming is in Figure 6, with each layer of the beams named the same way as the columns. In this paper, M6V40Z3A1 is defined as an impact body mass of 6 tons, an impact body speed of 40 m/s, and impact column of Z3A1. Figure 6 shows the impact direction.

3. Analysis of Dynamic Response

3.1. Displacement Response and Direction of Displacement

In the displacement charts of this paper, residual displacement is the average of the displacements of the last 10 data points of the steady phase. Horizontal displacement is displacement in the same direction as the initial velocity, vertical displacement is the up and down displacement of the top of the column, and impact displacement is the horizontal displacement at the half position of the impacted column. Horizontal displacement is positive in the same direction as the initial velocity, and vertical displacement is positive upward. When the impacted column is Z3A1, the joint numbering method of the top of the bottom column in the velocity direction is shown in Figure 7. Between Z3A1 and Z3B1 is noted as an impact span, whilst between Z3B1 and Z3C1 is noted as an adjacent span. The joint numbering within the impacted span is Z3A1-1 and Z3A1-2 and within the adjacent span it is Z3A1-3 and Z3A1-4, and the numbering method of the rest of the columns is the same as that of Z3A1.
This paper mainly analyzes the dynamic response of the impact displacement of the bottom impacted column, the vertical displacement of the bottom impacted column, and the horizontal displacement of the joints at each story in the direction of the initial velocity. By comparing the displacement response of the steel frame at different locations, the effects of impact velocity, impact mass, and column location on the dynamic response of the steel frame are investigated separately.

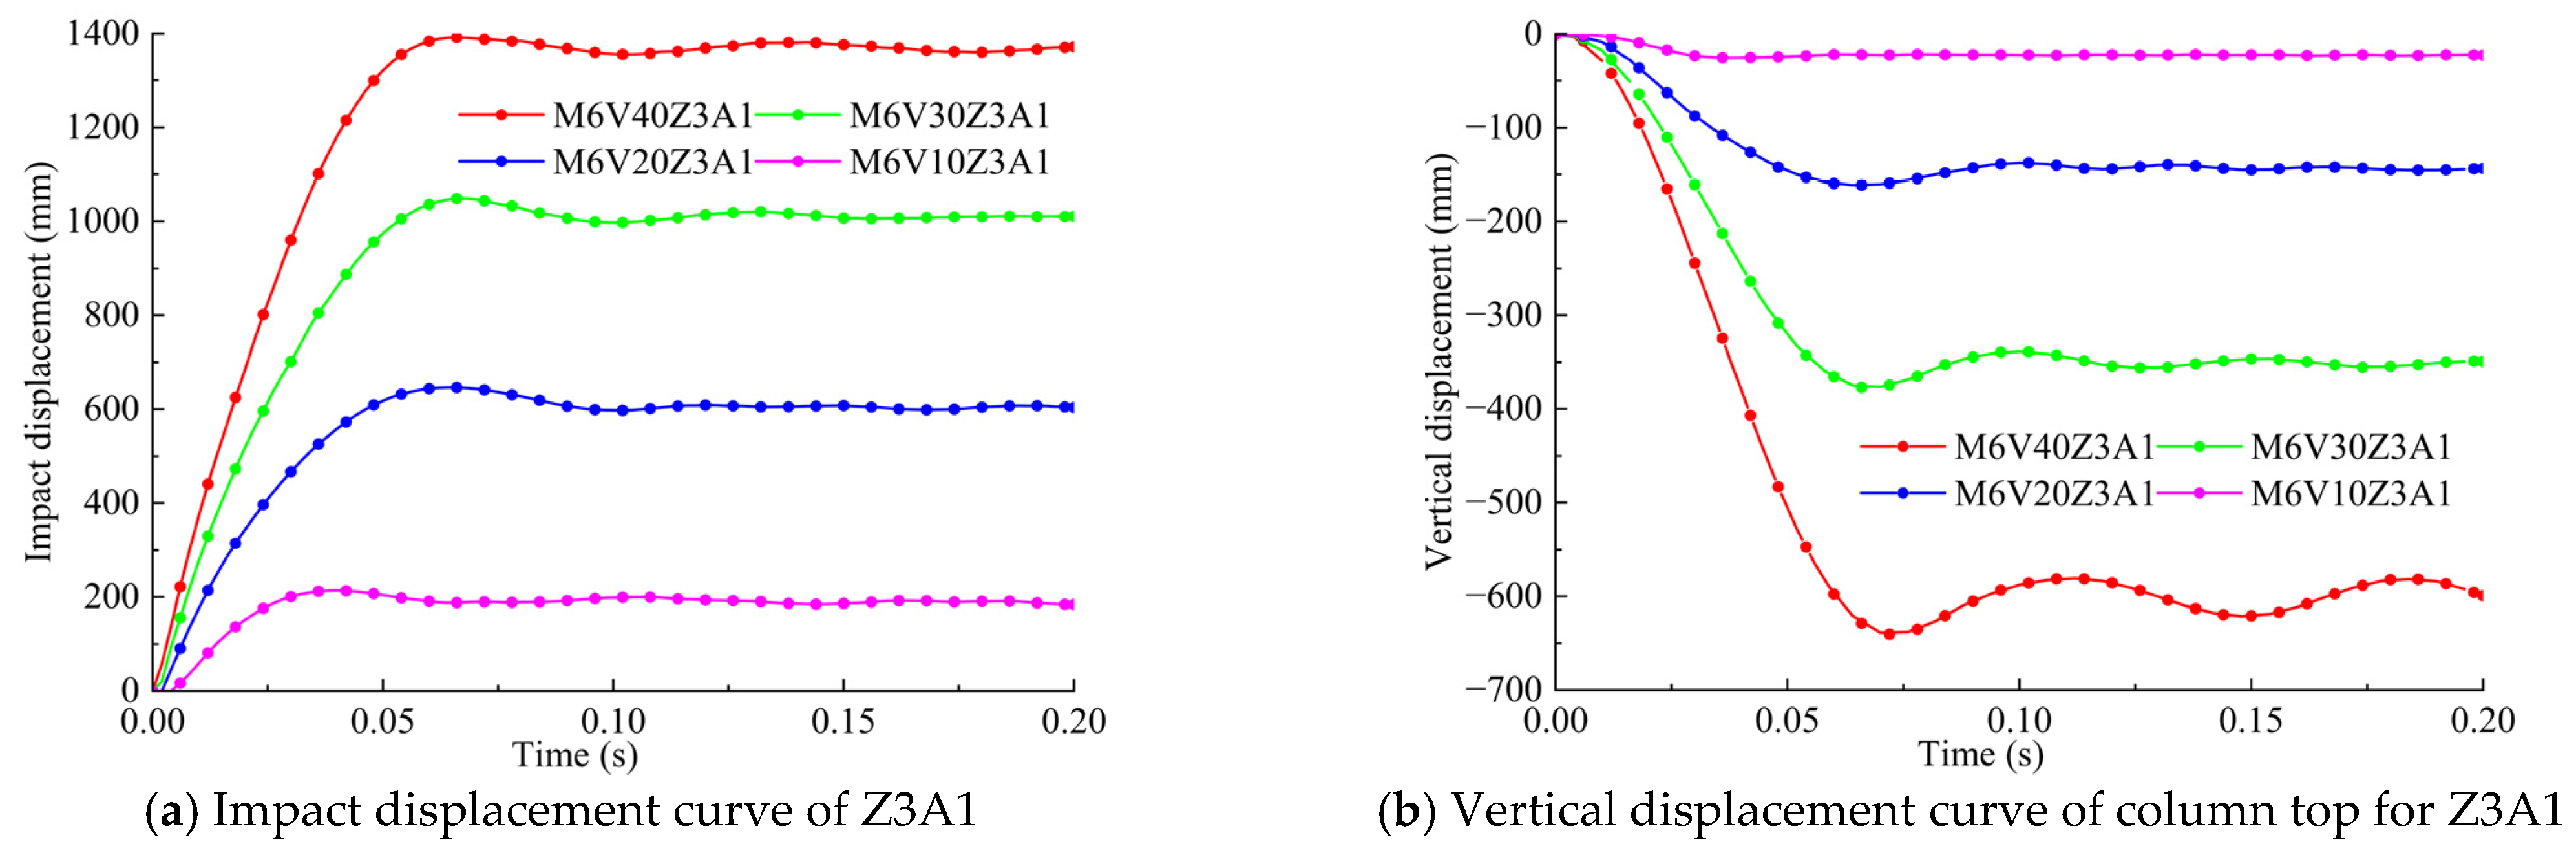
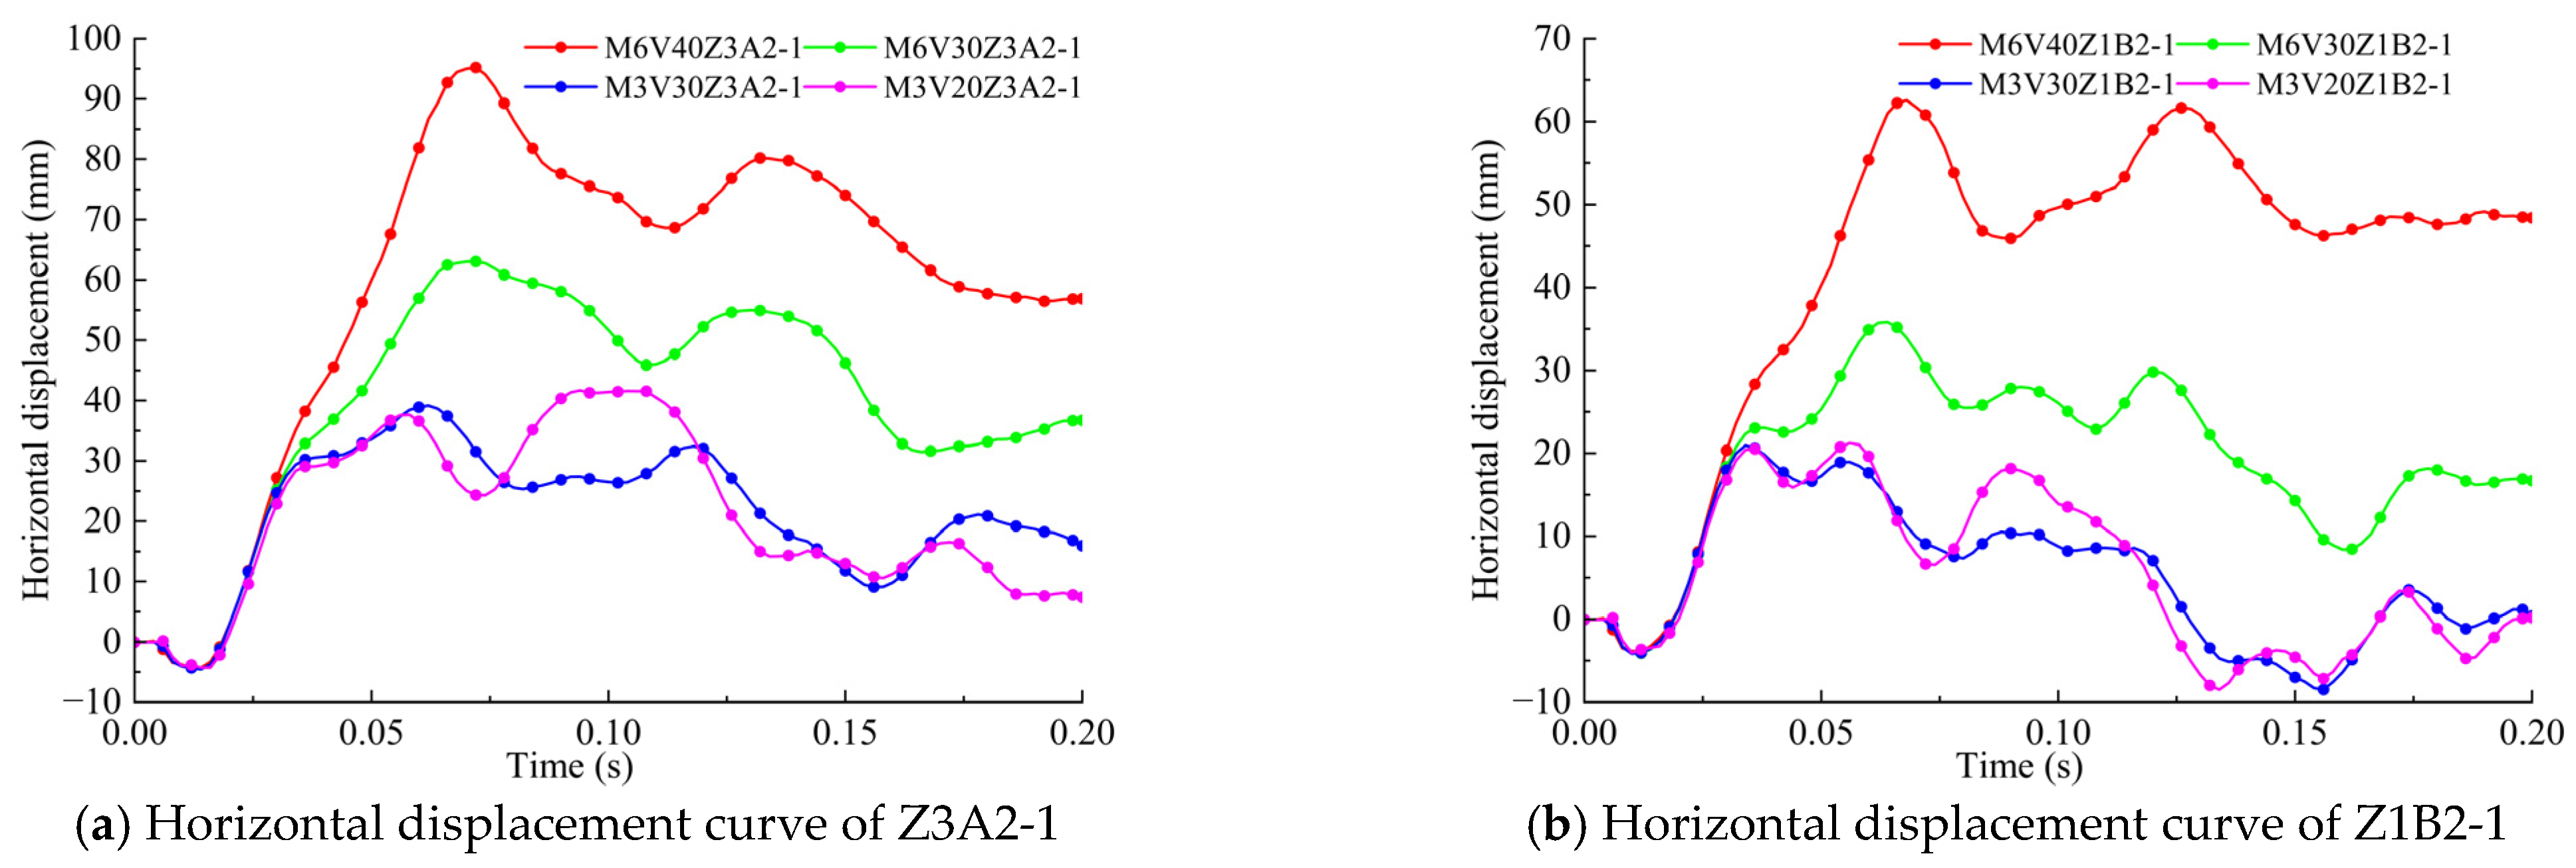
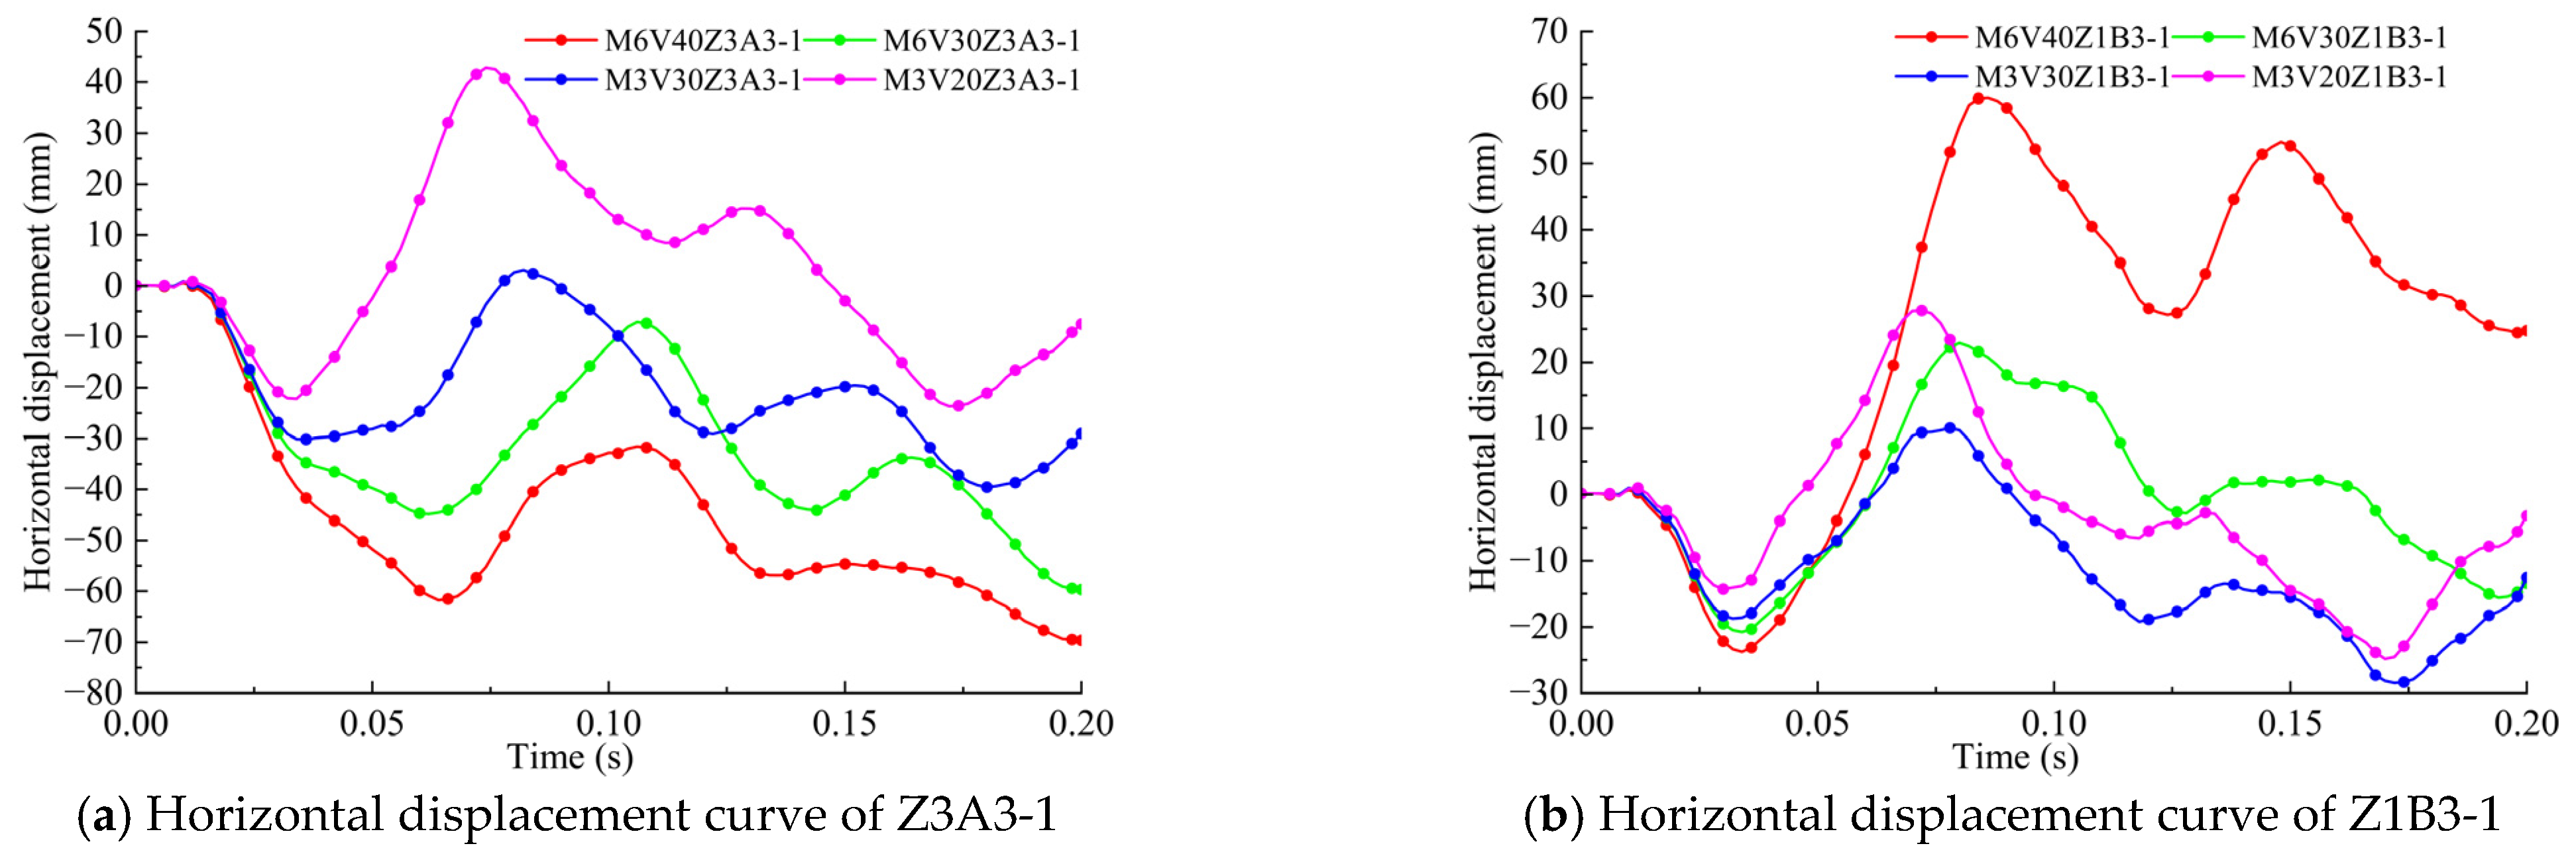
3.2. Impact Velocity and Displacement

Figure 8 shows the impact displacement and vertical displacement when the impact column is Z3A1, the impact mass is 6 t, and the initial impact velocity is 10 m/s, 20 m/s, 30 m/s, and 40 m/s. From Figure 8a, it can be seen that with only a change in the impact velocity, the other conditions remain unchanged; with an increase in impact velocity, the impact displacement increases significantly and the displacement peak time is delayed, indicating that in the increase in the impact velocity the steel frame gradually experiences plastic deformation and that the deformation damage of the impacted columns continue to increase. The deformation of the Z3A1 gradually develops from localized depression deformation to overall bending deformation. When the impact velocity increases from 10 m/s to 40 m/s the increase is 300% as the peak impact displacement rises from 214 mm to 1393 mm, an increase of 551%, and the impact residual displacement rises from 188 mm to 1366 mm, an increase of 627%. This indicates that the increase in impact displacement is greater than that of velocity.
As shown in Figure 8b, the change in impact velocity has a greater effect on the vertical displacement at the top of the column. With an increase in impact velocity, the amplitude of the vertical displacement curve gradually increases and the dynamic response of the steel frame is more drastic. When the impact velocity of the steel frame reaches 40 m/s, the bottom column Z3A1 undergoes serious bending deformation after impact and the vertical residual displacement reaches 596 mm, causing the overall stability of the steel frame to decrease significantly and leading the steel frame to tilt to the side of the impacted column.
Figure 9 compares the horizontal residual displacements between joints Z3A1-1 and Z3A1-2 within the impacted span of the first story under identical impact parameters as Figure 8 (joint numbering convention detailed in Figure 7). At lower impact velocity (10 m/s), column Z3A1 primarily exhibited local indentation deformation at the impact zone. The final deformation at Z3A1-1 was merely 0.45% greater than at Z3A1-2, demonstrating negligible influence on global frame displacement and minor adjacent member deformations. The displacement comparison in Figure 9 reveals that the differential displacement between Z3A1-1 and Z3A1-2 progressively increases with impact velocity. At 40 m/s impact velocity, Z3A1-1’s residual displacement exceeded Z3A1-2’s by 19.9%, representing a substantial increase compared to the 10m/s condition. This indicates a failure mode transition from local indentation to global flexural deformation. The bottom-story column Z3A1 developed significant global horizontal displacement, markedly affecting adjacent members, as seen in beam LF1 connected to Z3A1 which exhibited combined bending–twisting deformation, whilst joint residual deformations also substantially increased.
In summary, the displacement is positively correlated with the impact velocity. The steel frame response is more sensitive to the change in velocity, which mainly causes local deformation when the impact velocity is low. The increase in impact velocity leads to a larger displacement response of the overall structure.

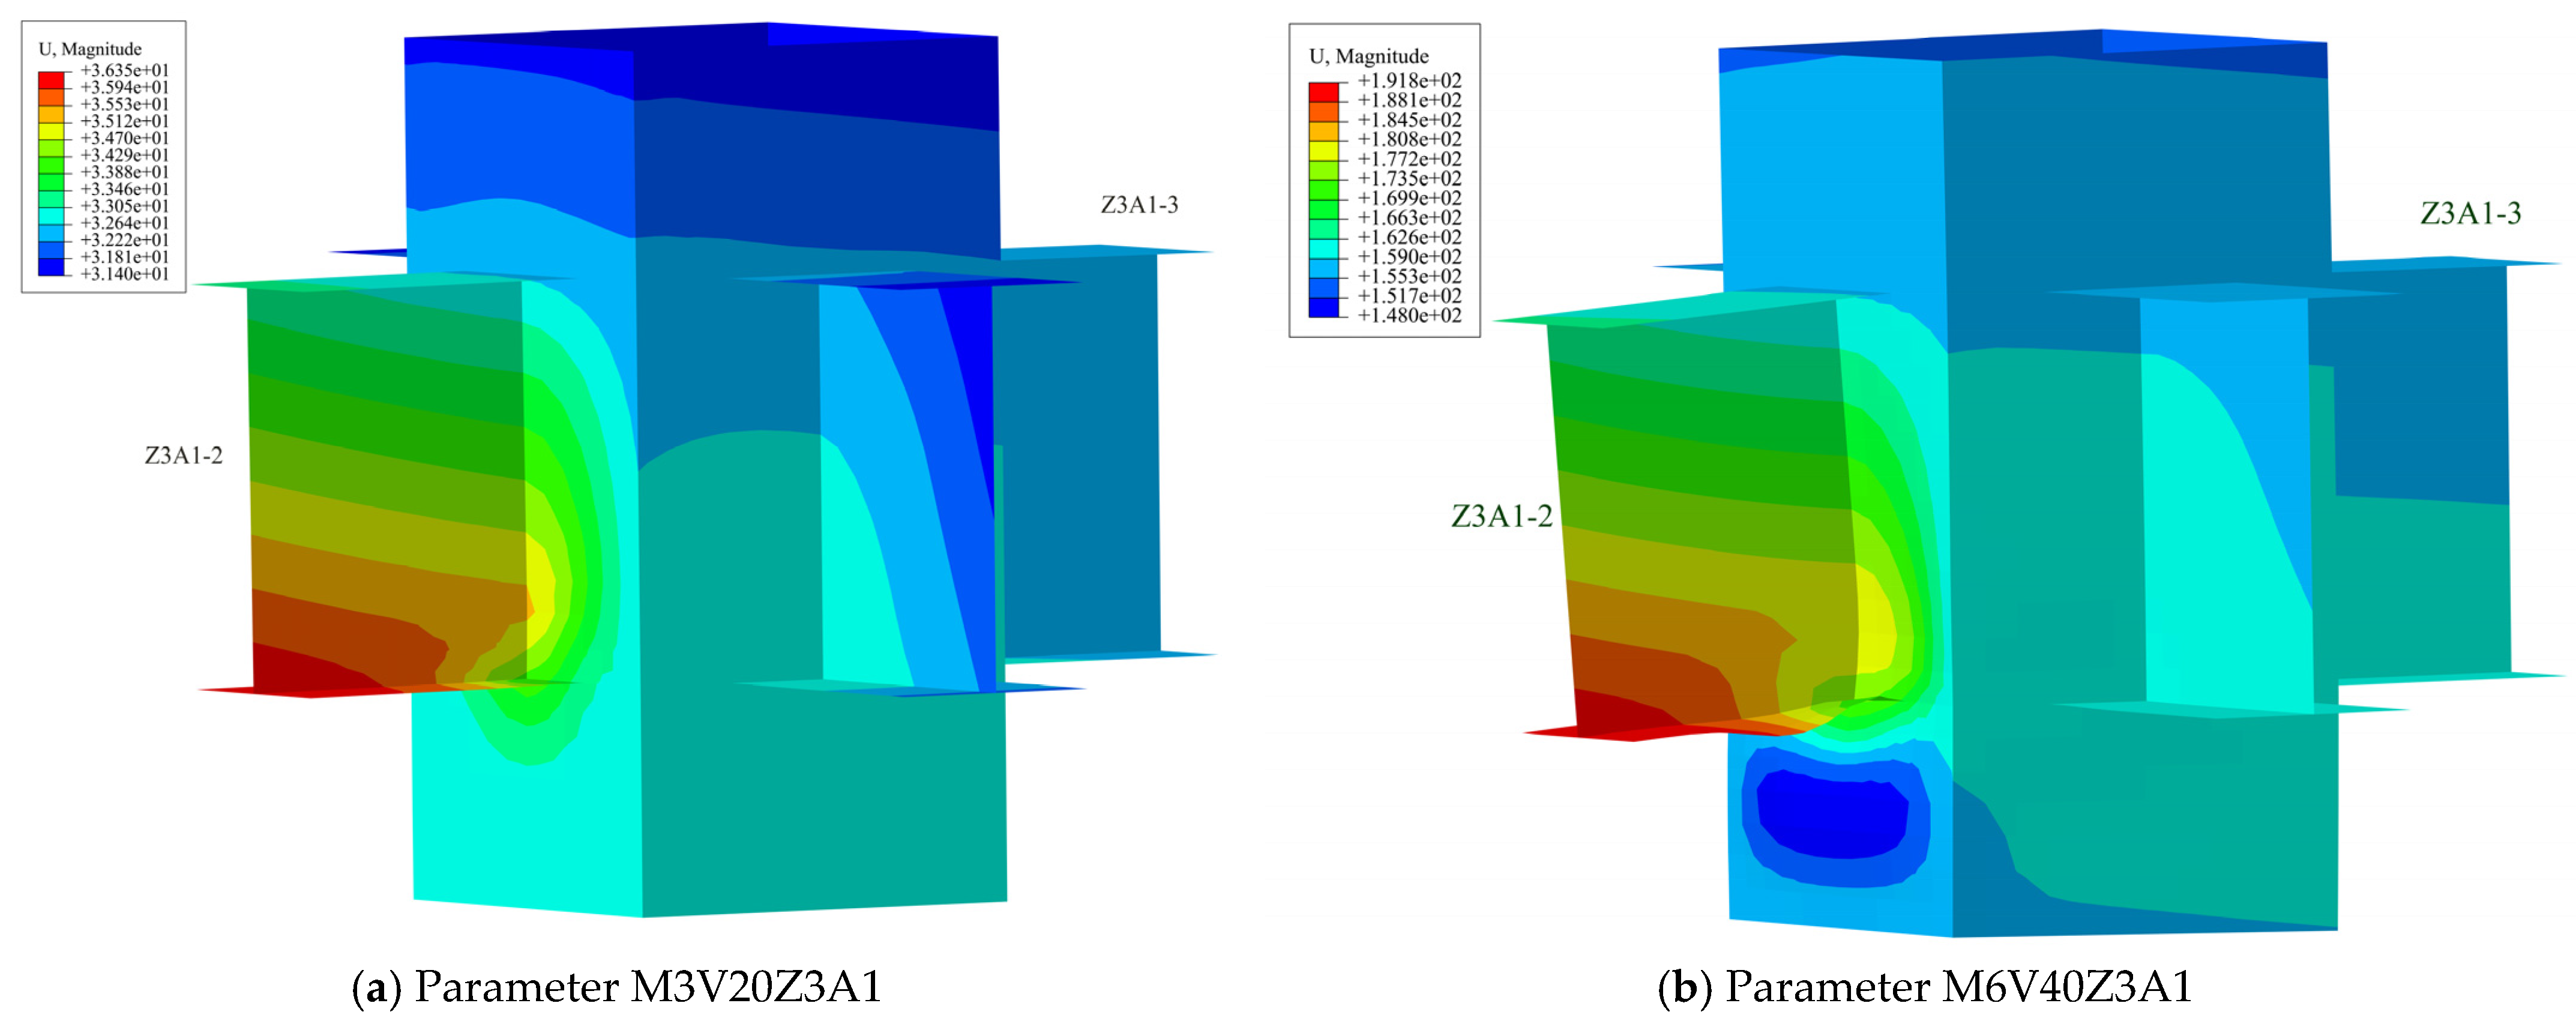
3.3. Impact Mass and Displacement

Figure 10 is the displacement and deformation diagram of the bottom column Z4A1 under different masses when the impact column is Z4A1, the impact velocity is 30 m/s, and the impact mass is 1 t, 3 t, and 6 t, respectively. The increase in impact mass leads to an increase in the maximum value of impact displacement, and its residual deformation also increases. When the impact mass increases from 1 t to 6 t, after the impact process reaches stabilization, the impact residual displacement increases from 229 to 1015 mm, and the impacted column develops to the overall bending deformation from the localized depression deformation. The damage modes of impacted columns under different masses are changed. From the comparison of Figure 10a with Figure 10c, it can be seen that with an increase of overall deformation, the pressure deformation at the top position of the column and the beam connection surface increases, with both sides of the column steel plate bulging, resulting in obvious residual deformation. As the deformation of the impacted column increases, the vertical residual displacement increases from 20 mm to 381 mm, the bearing capacity of the impacted column decreases significantly, and the steel frame as a whole tilts toward the impacted column. This indicates that the increase in impact mass will aggravate the dynamic response of the steel frame structure, reducing the structure’s overall stability and increasing the risk of structural collapse.

3.4. Different Impacted Columns and Displacement

Table 5 shows the vertical residual displacements and impact residual displacements at the top of the column for four different combinations of impact kinetic energy parameters, and the horizontal residual displacements at the bottom joint in the velocity direction are analyzed. Comparison of the impact residual displacement values in Table 5 shows that the difference between the impact displacements of the corner columns and the side center columns is less than 1% when the impact kinetic energy is the same. By comparing the vertical residual displacement it can be seen that the displacement of the corner column is larger than that of the side center column, and the difference between the two displacements ranges from 0% to 17.6%.
It can be seen that the impact displacement is small when the impact kinetic energy is small, and that the impacted columns still have strong bearing capacity; furthermore, the vertical displacements are the same under each parameter, and the difference between them is less than 1%. With an increase in impact kinetic energy, the vertical displacement of the corner column is larger than that of the side center column because more beam members are connected with the side center column. When impacted, the side center column can disperse the load that should be borne by the impacted column with the help of more transmission paths, which manifests as a smaller vertical displacement and a stronger collapse resistance. The vertical displacements of Z3A1 are smaller than those of Z1B1 and those of Z4A1 are smaller than those of Z1C1. This is because Z3A1 and Z4A1 have a greater number of spans perpendicular to the direction of velocity which increase the structure’s redundancy to provide stronger beam-end restraints to slow down the development of vertical displacements of the column members.
From the horizontal residual displacement of the bottom joint in Table 5, it can be seen that under the same parameters the horizontal residual displacement of the joint gradually decreases as it moves away from the impacted column. Taking M3V20Z3A1 and M6V40Z3A1 as an example, the joint deformation at Z3A1-2 and Z3A1-3 positions are shown in Figure 11. Under the parameter M3V20Z3A1, the impact kinetic energy is small, the impacted column mainly experiences local depression deformation, and the influence on adjacent members is small. Furthermore, the adjacent joint deformation in the impact direction is shown in Figure 11a, and the residual deformation of the joint is small. Under the parameter M6V40Z3A1, the impact kinetic energy is larger, and the impacted column undergoes larger bending deformation, causing the neighboring members produce significant residual deformation, and the joint under the impact load undergoes a certain amount of concave deformation so that there is a certain difference in the horizontal displacement of the beam ends on both sides of the node. The deformation of the adjacent joint in the impact direction is shown in Figure 11b, and the lower flange of the beam end on the Z3A1-2 side shows wavy deformation: buckling occurs at this position under pressure. Comparison of the joint displacements of parameters M6V40Z3A1 and M6V40Z1B1 shows that with the increase in the number of spans in the impact direction, the joint displacements of parameter M6V40Z1B1 are significantly smaller than those of M6V40Z3A1. The displacement of the first-floor joints of the structure with three spans in the impact direction was reduced by about 50% compared to that with two spans, showing that the increase in the number of spans in the impact direction provides stronger constraints, significantly reducing the frame’s deformation in the impact direction.
The development of horizontal displacements in the second- and third-story joints above the impacted columns was investigated using the number of spans in the impact direction as a variable. Figure 12 shows the horizontal displacements of the second-layer joints Z1B2-1 and Z3A2-1, and Figure 13 shows the horizontal displacements of the third-layer joints Z1B3-1 and Z3A3-1. Figure 12 shows that the displacement trends of the second-layer joints at different span numbers are similar, and the second-layer joints are first displaced in the opposite direction of the impact after the impact, followed by displacement in the direction of the impact. Figure 12a,b shows that for the same impact kinetic energy, the stability of the frame structure is improved because of the higher number of spans in the impact direction, resulting in a smaller horizontal displacement of the second layer joint Z1B2-1.
As can be seen in Figure 13a, when the number of spans in the impact direction is two spans and with an increase in the kinetic energy of the impact, the overall deformation of the frame increases continuously. Due to the insufficient constraints in the impact direction, the horizontal displacement of the third-layer node Z3A3-1 is negative and shows a continuously decreasing tendency. The steel frame is tilted in the direction of the impacted columns. There exists a certain risk of overall progressive collapse. However, as can be seen from Figure 13b, when the number of spans in the impact direction increases to three spans the horizontal displacement development trend of Z1B3-1 is similar to that of Z1B2-1 and the steel frame can remain stable after the impact without significant overall tilt. When designing the impact resistance of steel frames, it is necessary to increase the number of spans in the direction susceptible to impact to provide stronger restraints for the impacted columns to reduce the overall displacement of the structure along the direction of the impact to ensure that the steel-framed structure can still maintain stability after the impact.

4. Deformation Damage and Collapse Analysis

4.1. Deformation Damage Analysis of Steel Frames

The deformation damage of the steel frame varies under different impact conditions. The damage occurs after the plastic phase of steel and so the impacted members of the steel frame are not damaged under low-impact kinetic energy. In order to analyze the damage process, this paper selects the maximum impact kinetic energy parameter combination M6V40Z1B1 to analyze the deformation damage of the steel frame. Figure 14 shows the overall damage cloud diagram of the steel frame after impact, showing that the damage of the steel frame only occurs in the impact area of the bottom column, the joint position is not damaged and cracked, and the deformation is small, indicating that the stiffness of the inner diaphragm joint is large and in a structure subjected to accidental loads it can still be able to ensure good force transmission.
Deformation of the impacted column mainly occurs at the top of the bottom column, the impacted position, and at the foot of the column. Figure 15 shows the front and side damage cloud diagram of column Z1B1 under the parameters of M6V40Z1B1, in which JCCRT is the judgment index for the beginning of damage. When the value of JCCRT reaches 1, it judges that the material begins to appear damaged. From the damage cloud diagram, it can be seen that the bottom column produces concave deformation at the top position with the steel beam connecting surface, that the steel plate of the column on both adjacent sides bulges under pressure, and that the inner partition plate at the top position of the column produces buckling deformation under pressure. The maximum value of the JCCRT at the top position of the column is 0.463, which indicates that no damage has occurred in this local area and the steel is still in the plasticity stage. In the position of the column foot, the steel plate on the impacted surface is deformed by tension and the steel plate on the side away from the impactor is compressed, resulting in a localized depression. The JCCRT values at the position of the column foot are all less than 1, meaning that the steel at the column foot shows good plasticity and that the steel has not been damaged or fractured.
The bottom column in contact with the impact body caused serious bending deformation of the region, causing both sides of the steel plate to bulge and the impact surface of the steel plate to bend toward the direction of the impact of concave deformation and away from the impact body side of the steel plate to the impact of the opposite direction of the concave deformation. The impact of the body in contact with the upper side of the region of the most serious damage is negatively affect, the beginning of the damage to the basis of determination of the JCCRT reached 1, indicating that damage to the steel in the region of the impact has occurred. Figure 16 shows a cloud of the damage factor D at the location of the largest damage, where the maximum value of the damage factor was D < 1 and the steel did not fracture.

4.2. Analysis of Collapse Resistance

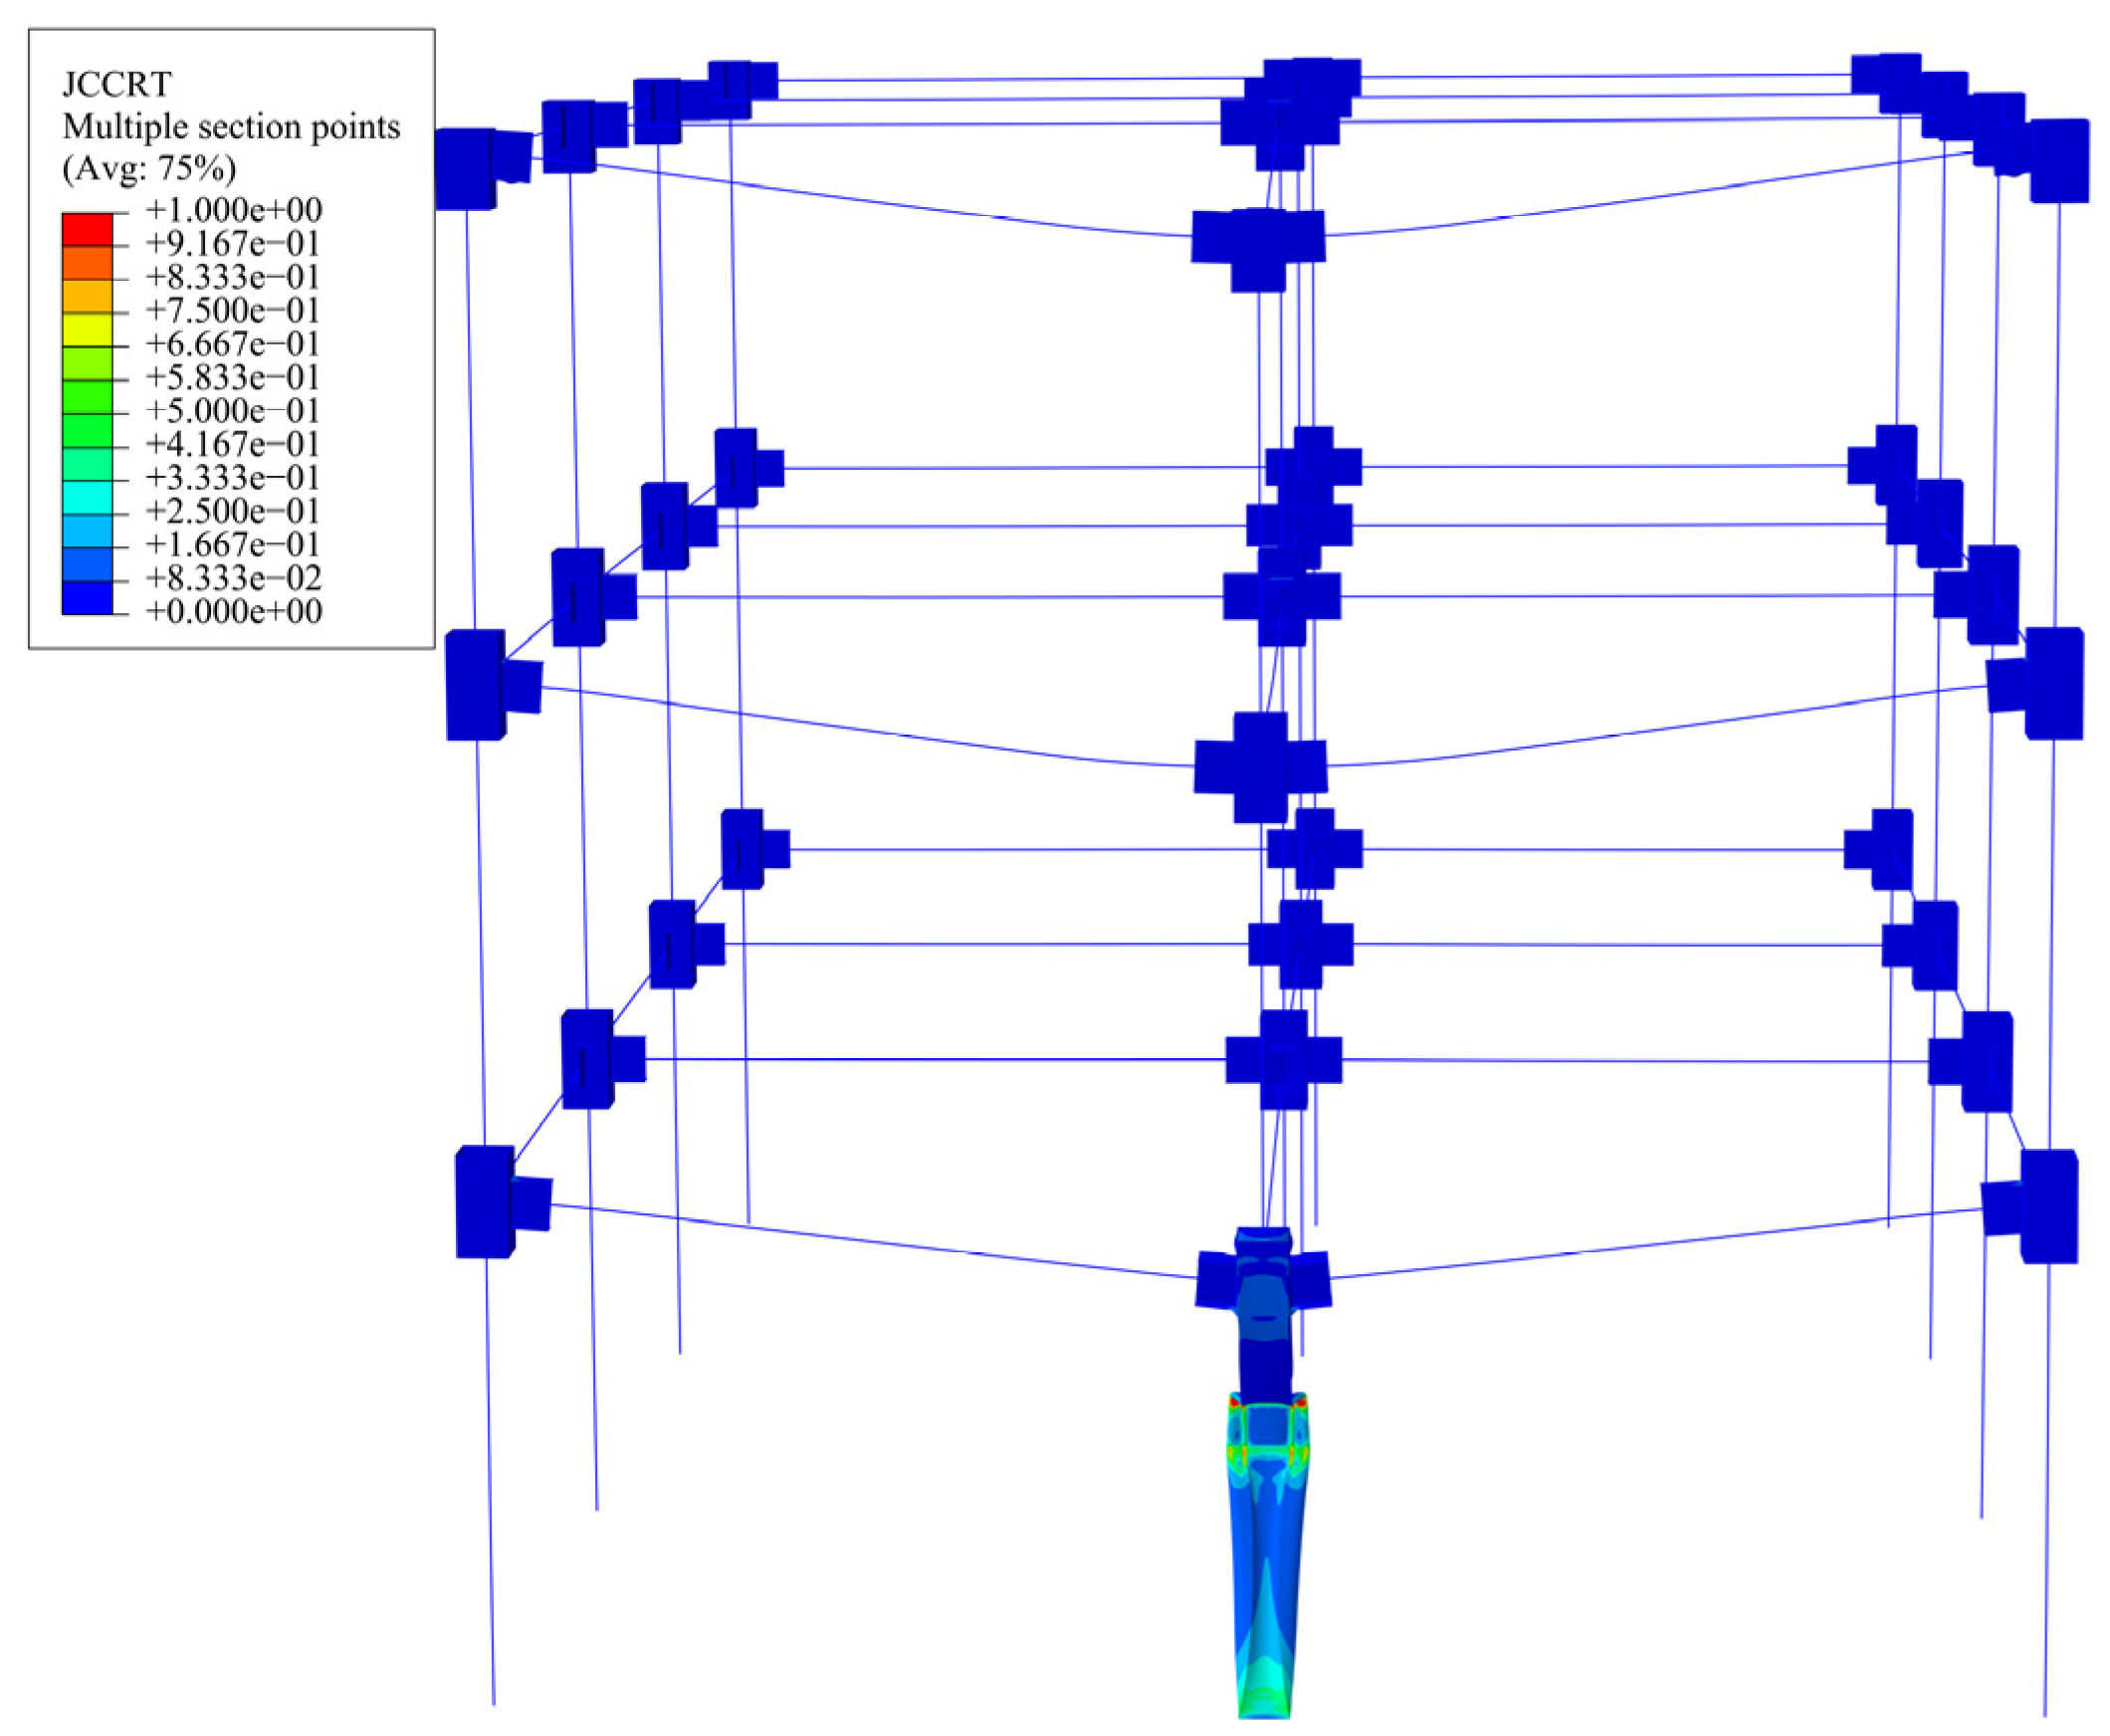
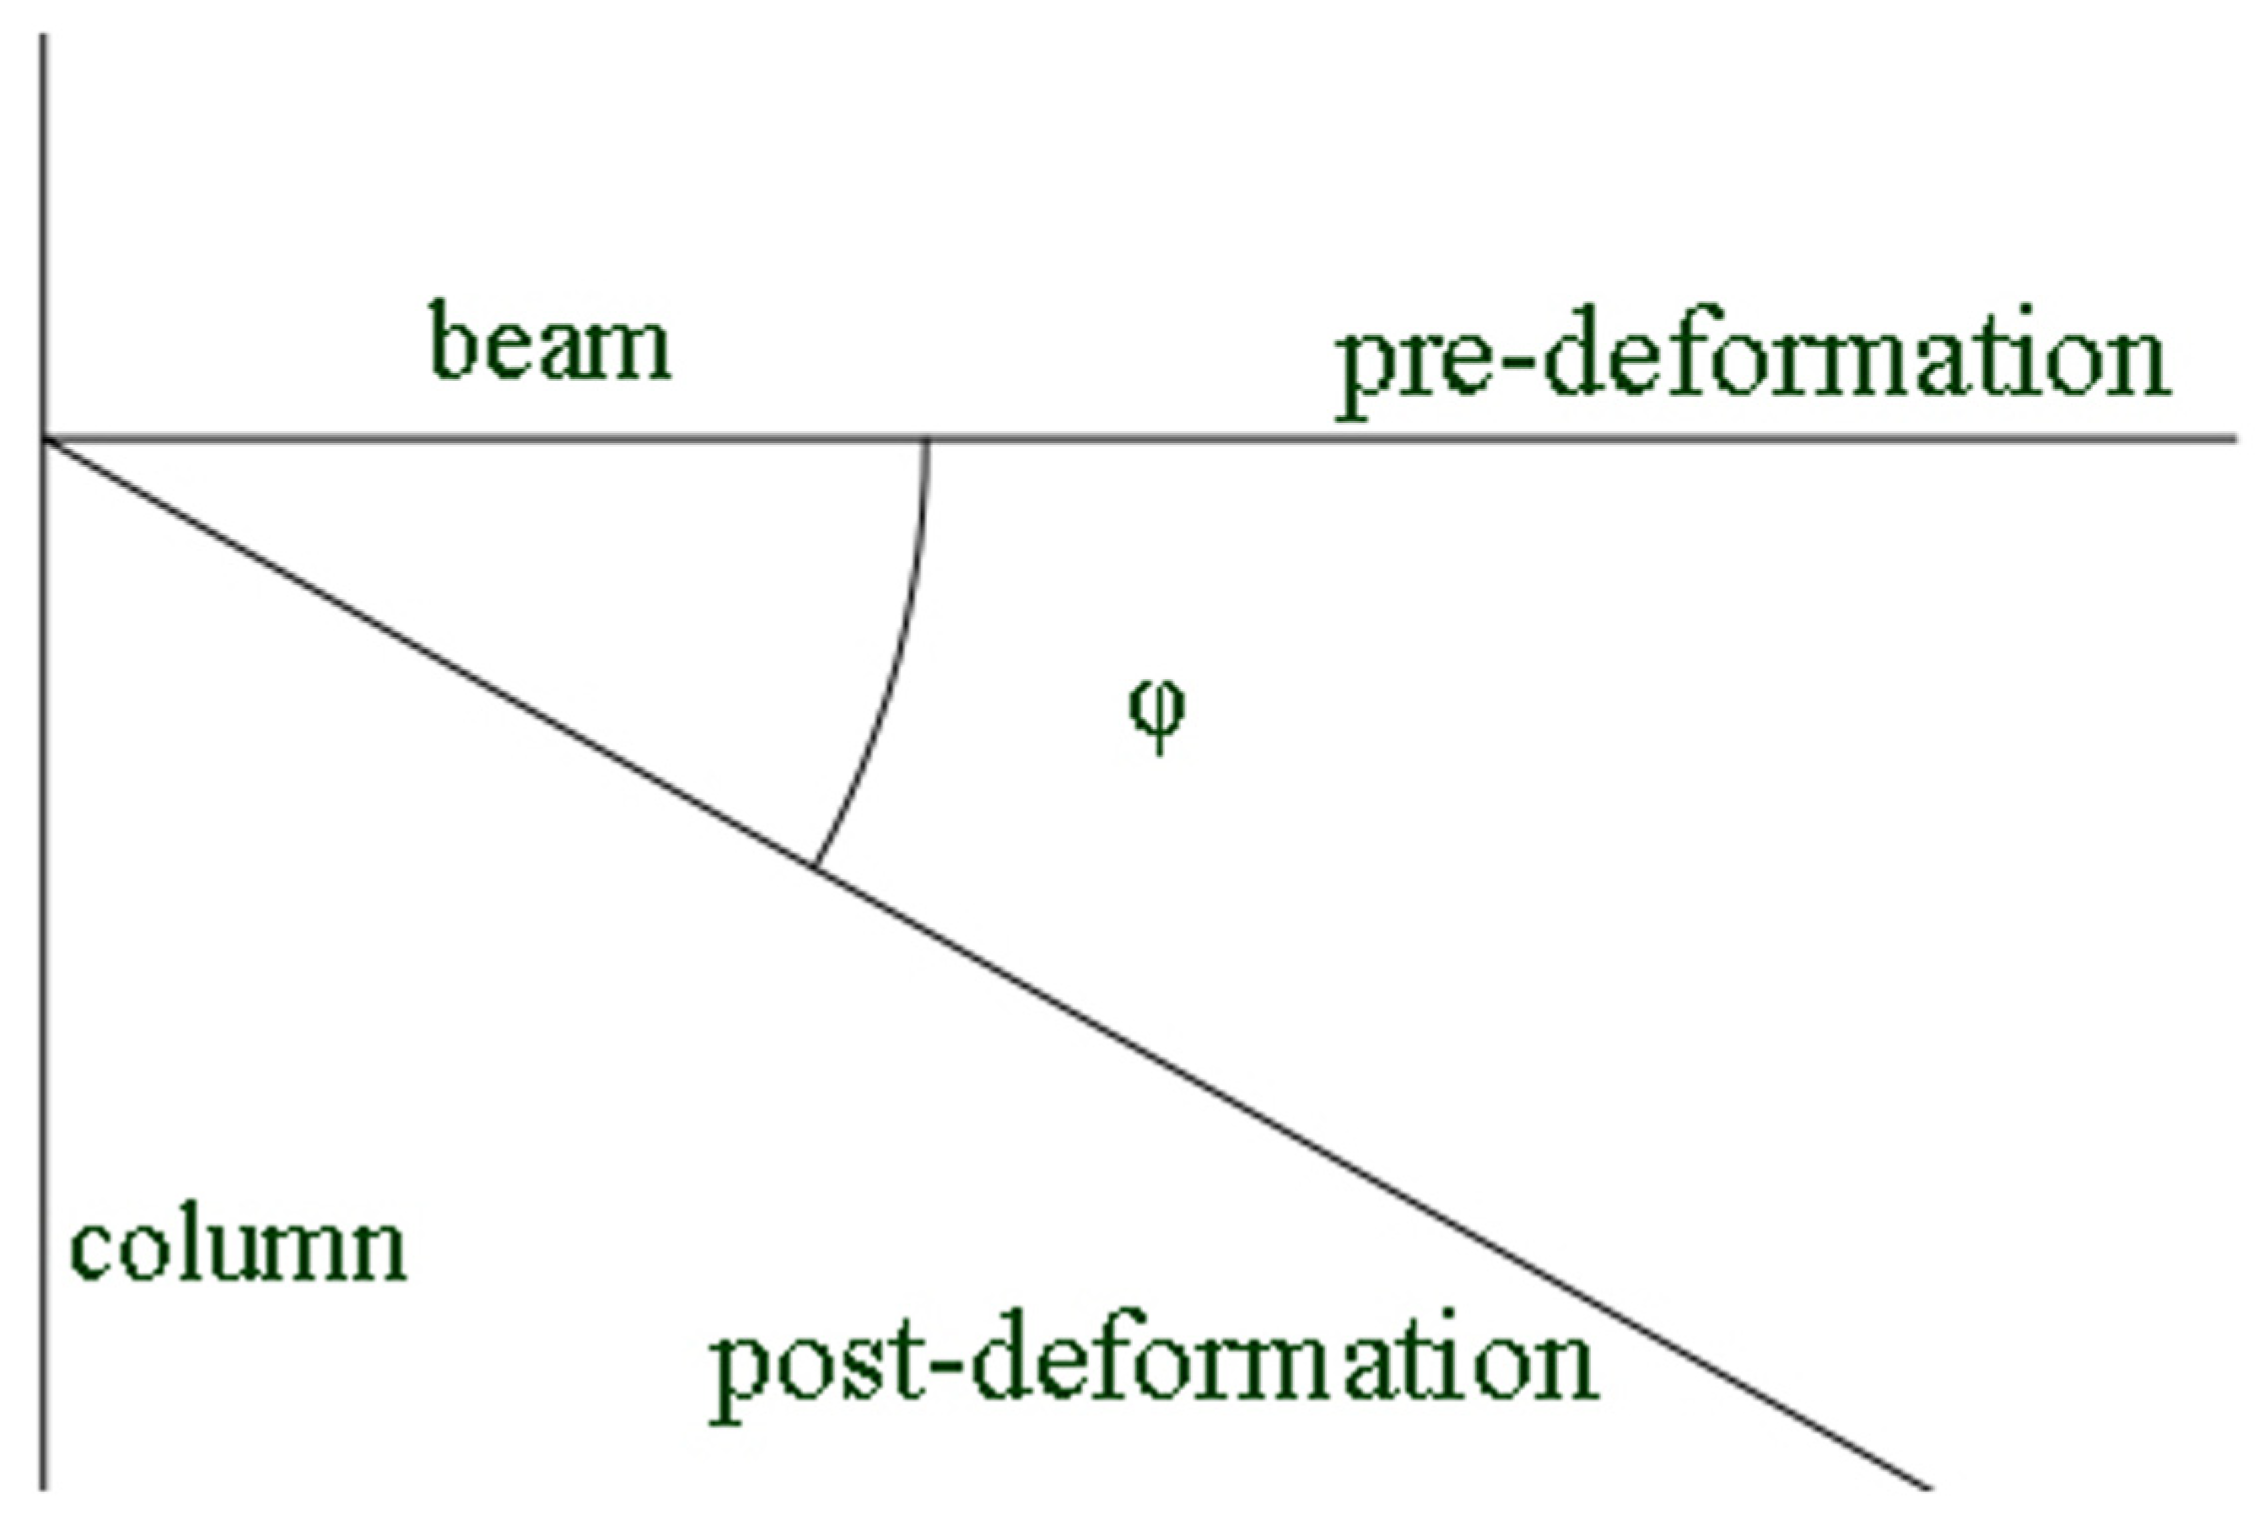
4.2.1. Collapse Determination Criteria

The steel structure has many kinds of collapse determination criteria. This paper adopts the unified facility code (UFC4-023-03) prepared by the U.S. Department of Defense in 2005, referred to as DoD2005 [42]. The collapse determination criterion selects the plastic hinge damage criterion. The specific method is that when the member is damaged the ductile damage inches and the member gradually enters the plastic stage from the elastic stage. The member continues to deform, forming the “plastic hinge”, and the plastic hinge deformation of the member increases under the action of an external load. The member is judged to fail when the plastic angle exceeds 6°. The specific values are shown in Table 6. Since the impact loads in this paper are dynamic loads and there are no floor slabs and load-bearing walls in the model, the plastic hinge determination criterion is applicable to the model in this paper, i.e., when the angle of turn of the beams reaches 6°, it is determined that the member fails and the structure collapses. The plasticity angle is in Figure 17. The initial beam span in this paper is 5600 mm, and the angle algorithm refers to the algorithm in the literature [10], which is tan = δ/L where δ is the vertical displacement of the beam-column joint and L is the effective span of the beam after the impact.

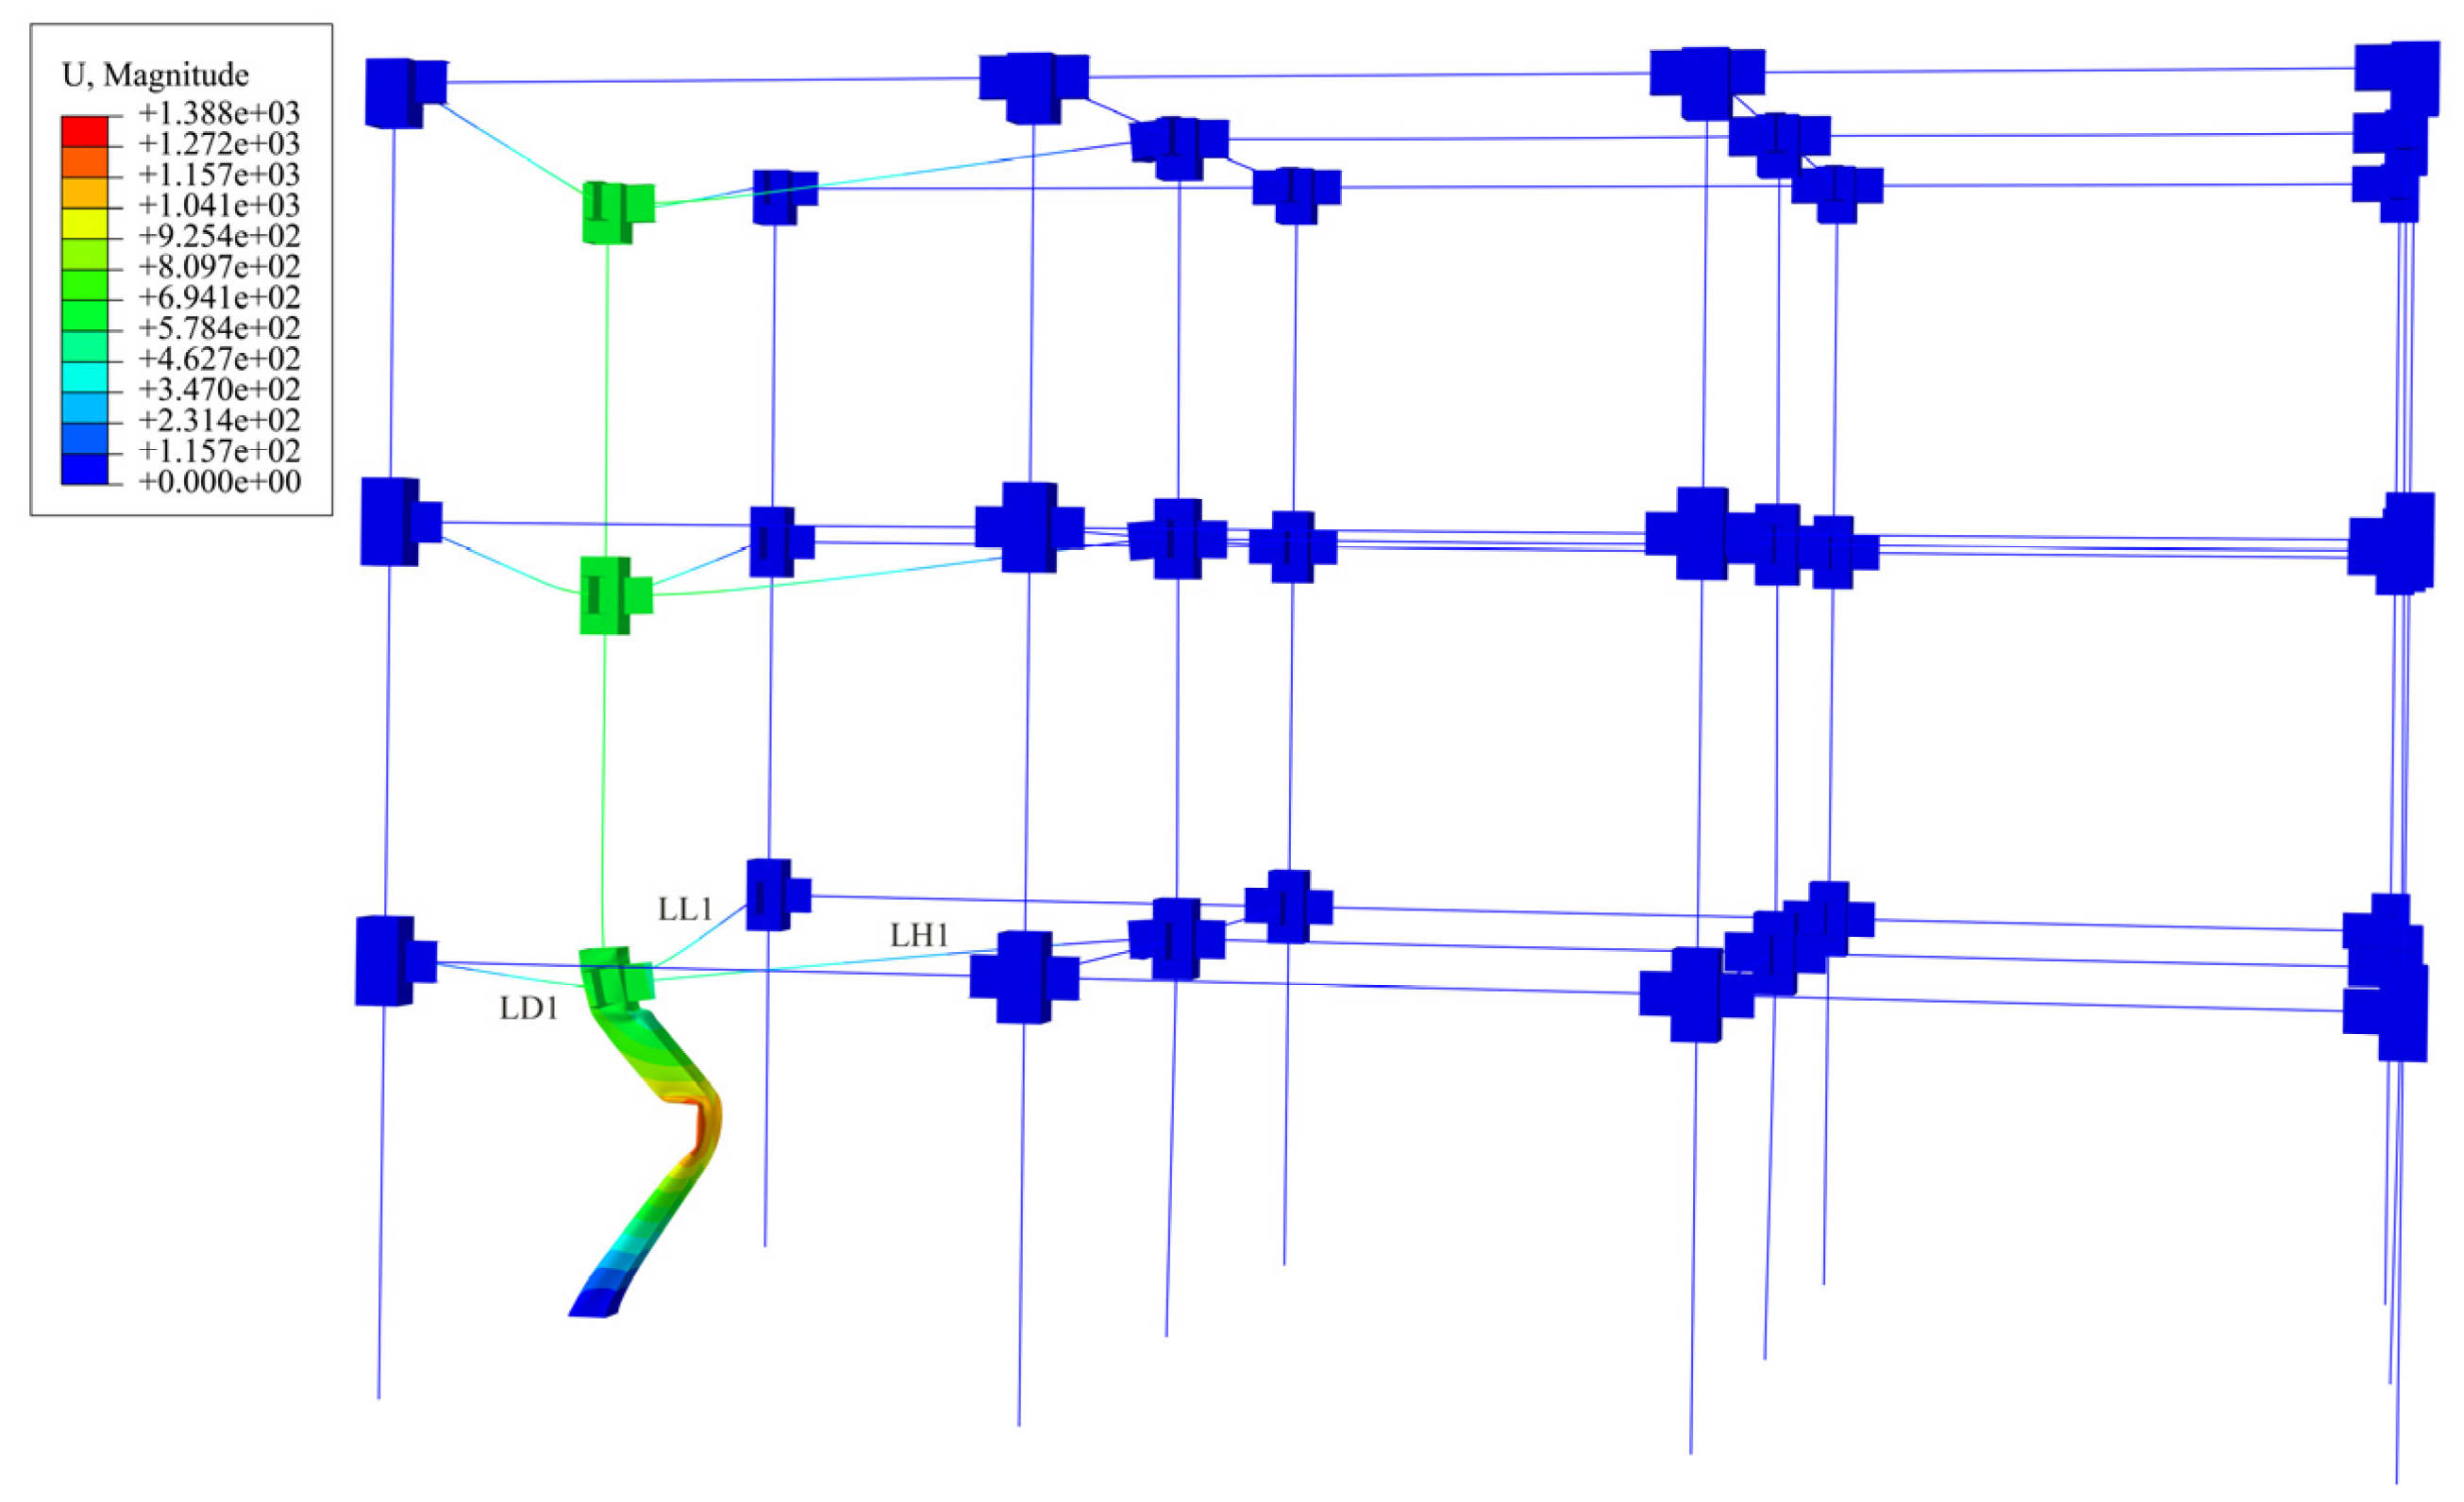
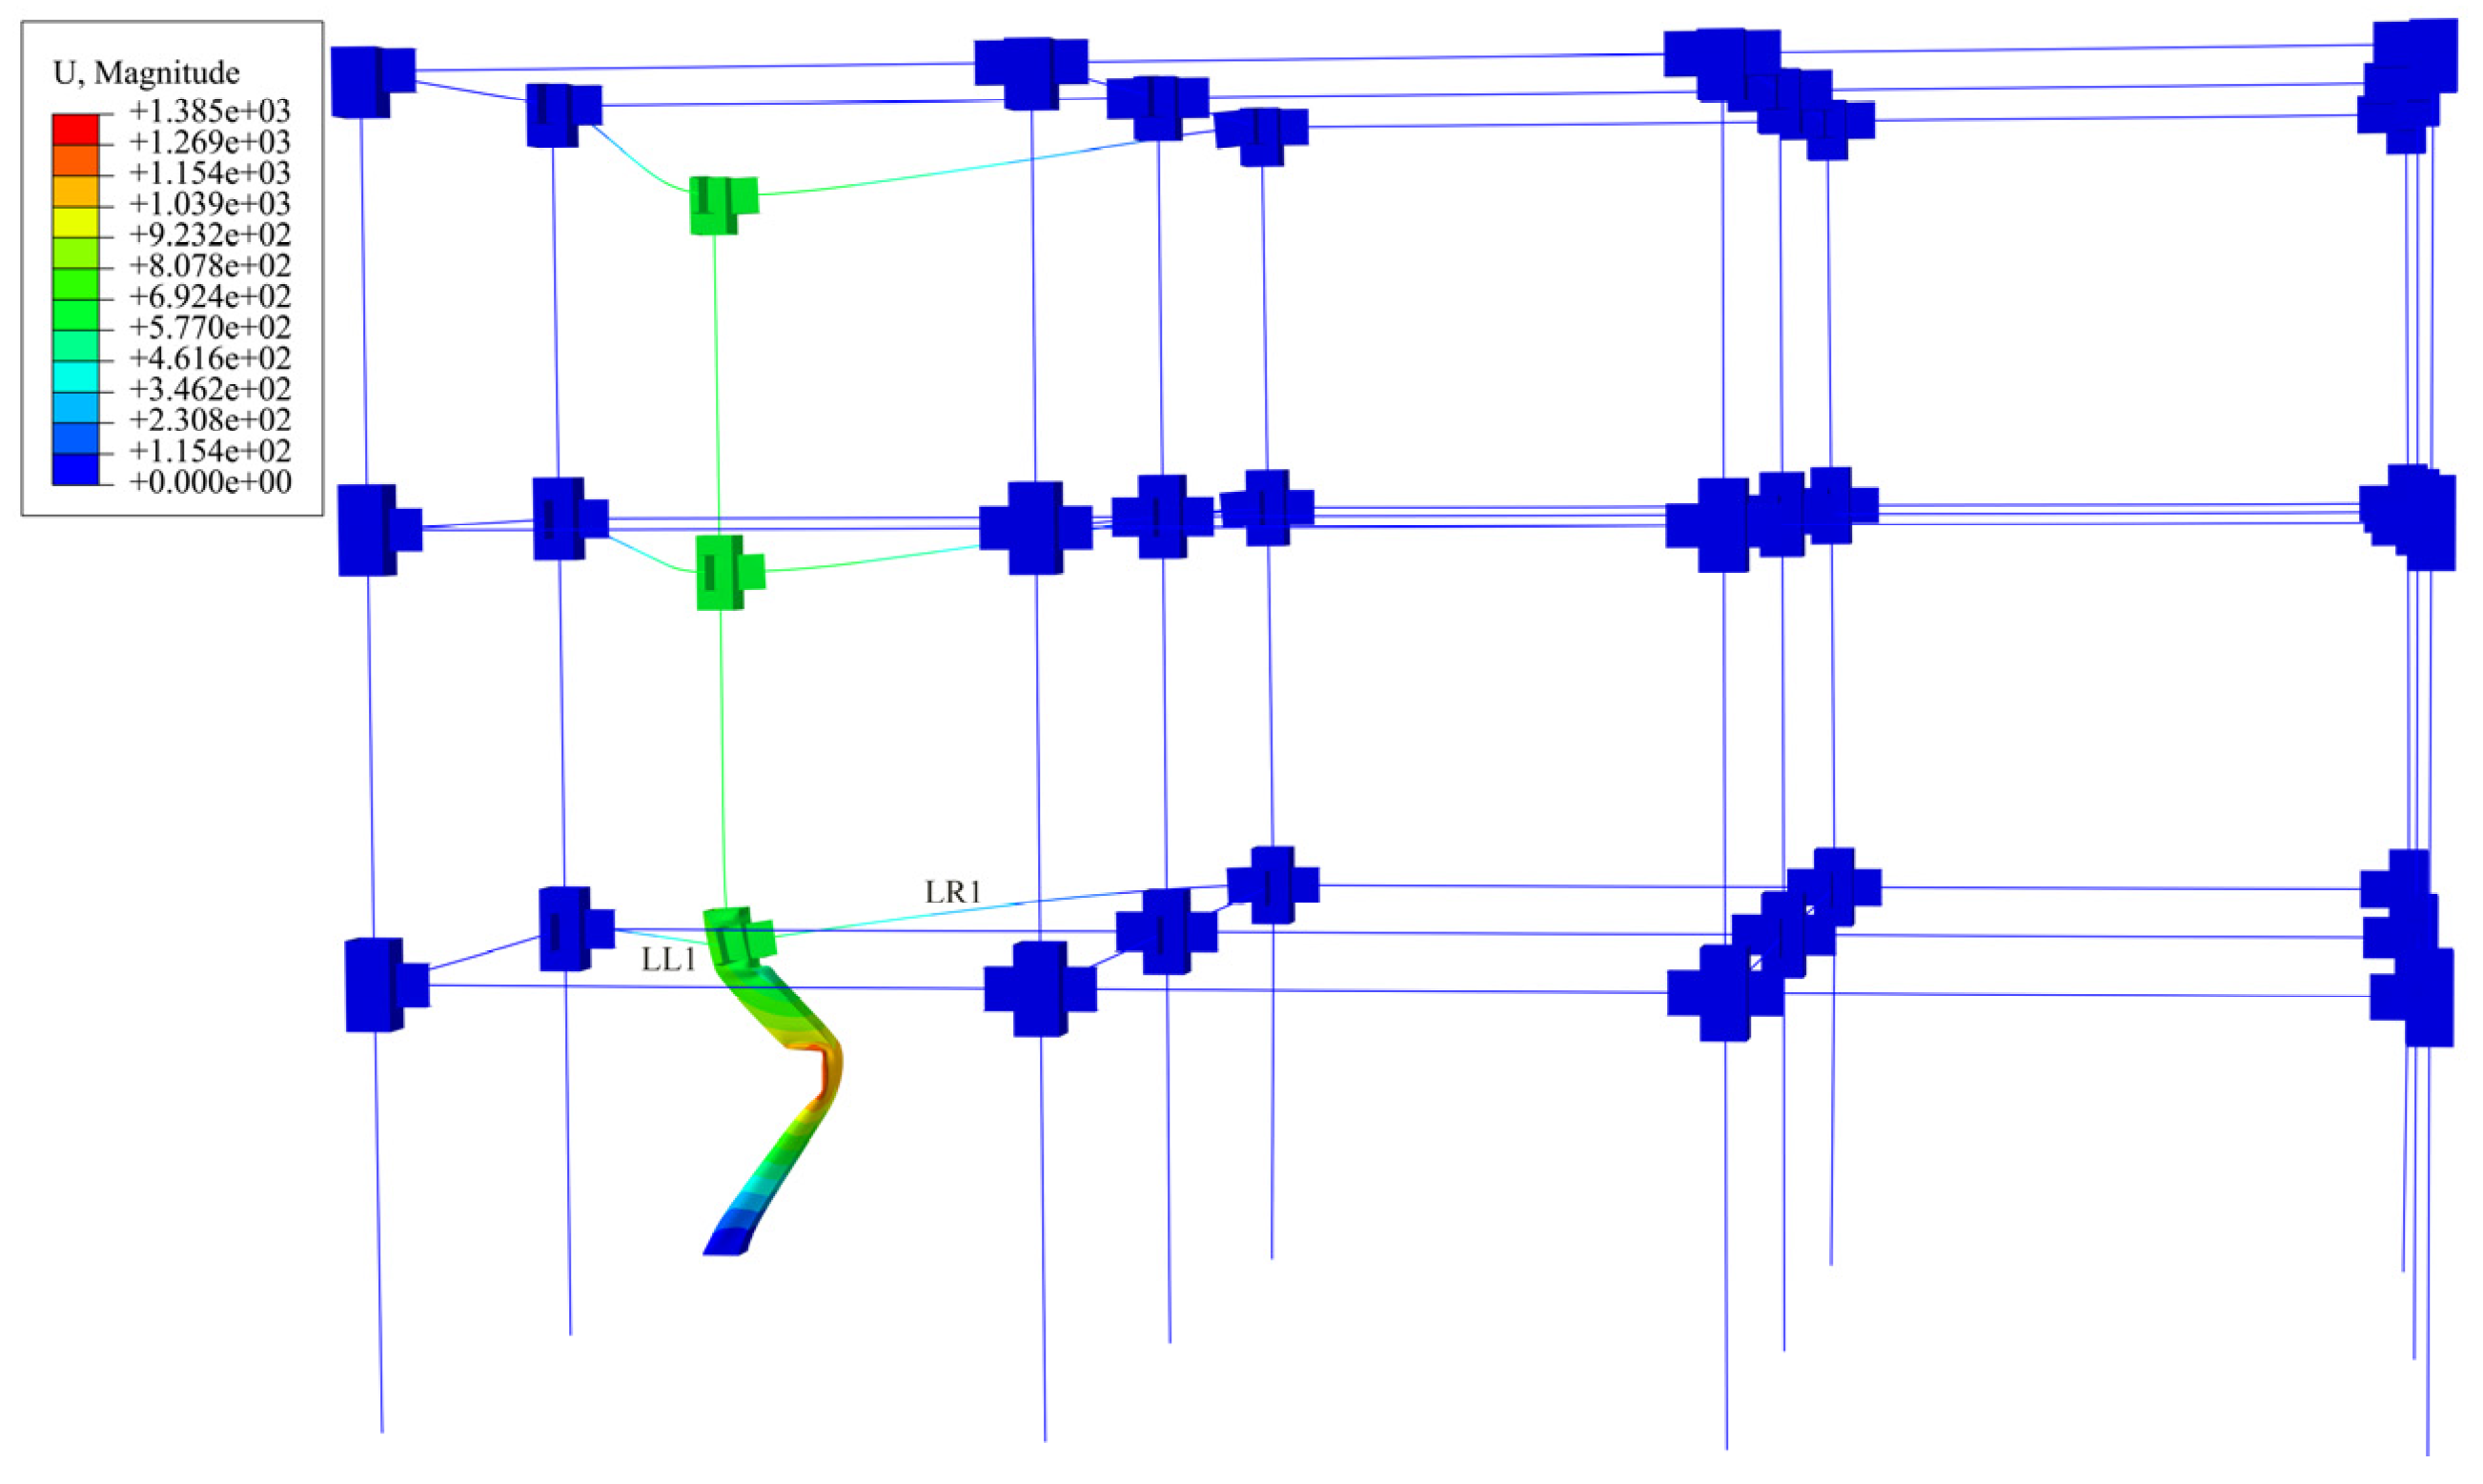
4.2.2. Analysis of the Collapse Process

When impact occurs at different columns, the collapse process of the steel frame is different. We chose the parameter combination M6V40Z1B1 and the parameter combination M6V40Z1C1, which have the largest impact kinetic energy in this paper as an example to be analyzed, and Figure 18 and Figure 19 are the overall displacement diagrams of the M6V40Z1B1 and the M6V40Z1C1 after the impact, respectively, extracted from the final increment of the explicit dynamic analysis. In Figure 18, the final rotation angle of the LD1 beam is 6.51°, the final rotation angle of the LH1 beam is 6.62°, and the final rotation angle of the LL1 beam is 6.52°, which exceeds the determination criterion by 6° and so it considers that LD1, LH1, and LL1 have failed, that column Z1B1 has failed, and that the structure has collapsed, which is of no practical engineering significance. In Figure 19, the final rotation angle of LL1 is 6.78°. The final rotation angle of LR1 is 6.89°, which exceeds the determination criterion by 6°, and it considers that LL1 and LR1 have failed, that column Z1C1 has failed, and that the structure has collapsed.
Due to the fact that formation of the plastic hinge position in the impact process is not completely fixed, in the impact of the corner column the plastic hinge position occurs at the end of the beam, in impact side of the column the plastic hinge formed in at the end of the beam or at the top of the bottom failure column, and for the H-beam the plastic hinge [43] formed in the beam cross-section down half the height of the cross-section. Consequently, this paper has taken the beam end down 200 mm and converted it to the angle of turn, which is about 2.05. Figure 18 shows the rotation angle–time curve of the beam with the largest rotation angle for the selected parameter combination M6V40. The rotation angle–time curve can be divided into the following three stages: If the rotation angle is less than 2.06°, the member is in the elastic stage and the deformation can recover; When the rotation angle reaches 2.06°, the plastic hinge has formed and the member enters into the plastic and the catenary stage meaning that with the increasing vertical displacement, the plastic hinges on the beam are accumulating and the member produces an irreversible plastic deformation; and when the rotation angle is greater than 6°, it can determine that the column fails and structure collapse occurs. In the case of side center column failure, after large deformation of the structure the first layer of beams is tensile causing it to form a catenary effect, the third layer of beams is compressive, and the frame as a whole forms a Vierendeel action mechanism [44] to resist progressive collapse. After the failure of the corner columns, the beams above the columns form cantilever beams due to insufficient beam-end restraints to carry out the catenary effect effectively and the steel frame structure undergoes a localized vertical progressive collapse within the spans connected by the impacted columns. In Figure 20, the corner column reaches the critical failure rotation angle first because the alternate load transfer path of the corner column is less, and the vertical displacement develops faster after impact, resulting in a rapid increase in the rotation angle, and, ultimately, the corner column fails.

5. Conclusions and Limitations

This study develops a three-story, multi-scale spatial steel frame model using ABAQUS finite element software. Shell elements were employed at critical regions prone to deformation and failure, while beam elements were adopted elsewhere. This hybrid shell–beam element approach effectively captures both global structural behavior and local detailed responses. The model comprehensively accounts for both material nonlinearity and geometric nonlinearity to accurately simulate damage evolution and failure modes under impact loading. Drop-weight impact tests validated the contact algorithm and material parameters. Hourglass energy control ensured numerical simulation reliability. Utilizing the explicit central difference algorithm in ABAQUS/Explicit, forty-eight impact parameter combinations were defined to cover rational mass and velocity ranges. Integrated global and local analysis methods thoroughly investigated how impact mass, velocity, and column location affect dynamic responses, and we systematically compared structural responses under different impact parameters and conducted detailed analyses of deformation damage and progressive collapse mechanisms, The main conclusions are as follows:
  • Changing only a single parameter by increasing the mass or velocity, due to the increase in the kinetic energy of the impact, will lead to an increase in the maximum value of the displacement response of the steel frame, causing the steel frame as a whole to produce more significant residual deformation. With the increase in impact kinetic energy, the steel frame develops from the local concave deformation in the impact area to the overall bending deformation, which has a significant impact on the neighboring members and the overall stability is significantly reduced after impact, causing the steel frame as a whole to tilt to the impacted column which may eventually collapse.
  • At the same impact kinetic energy, the difference in impact displacements between corner and side center columns is less than 1%, and the difference in vertical displacements ranges from 0% to 17.6%. The displacement of the first-floor joints of the structure with three spans in the impact direction was reduced by about 50% compared to that with two spans. When designing the structure, it is necessary to increase the number of frame spans in the impact direction to improve the overall stability of the structure.
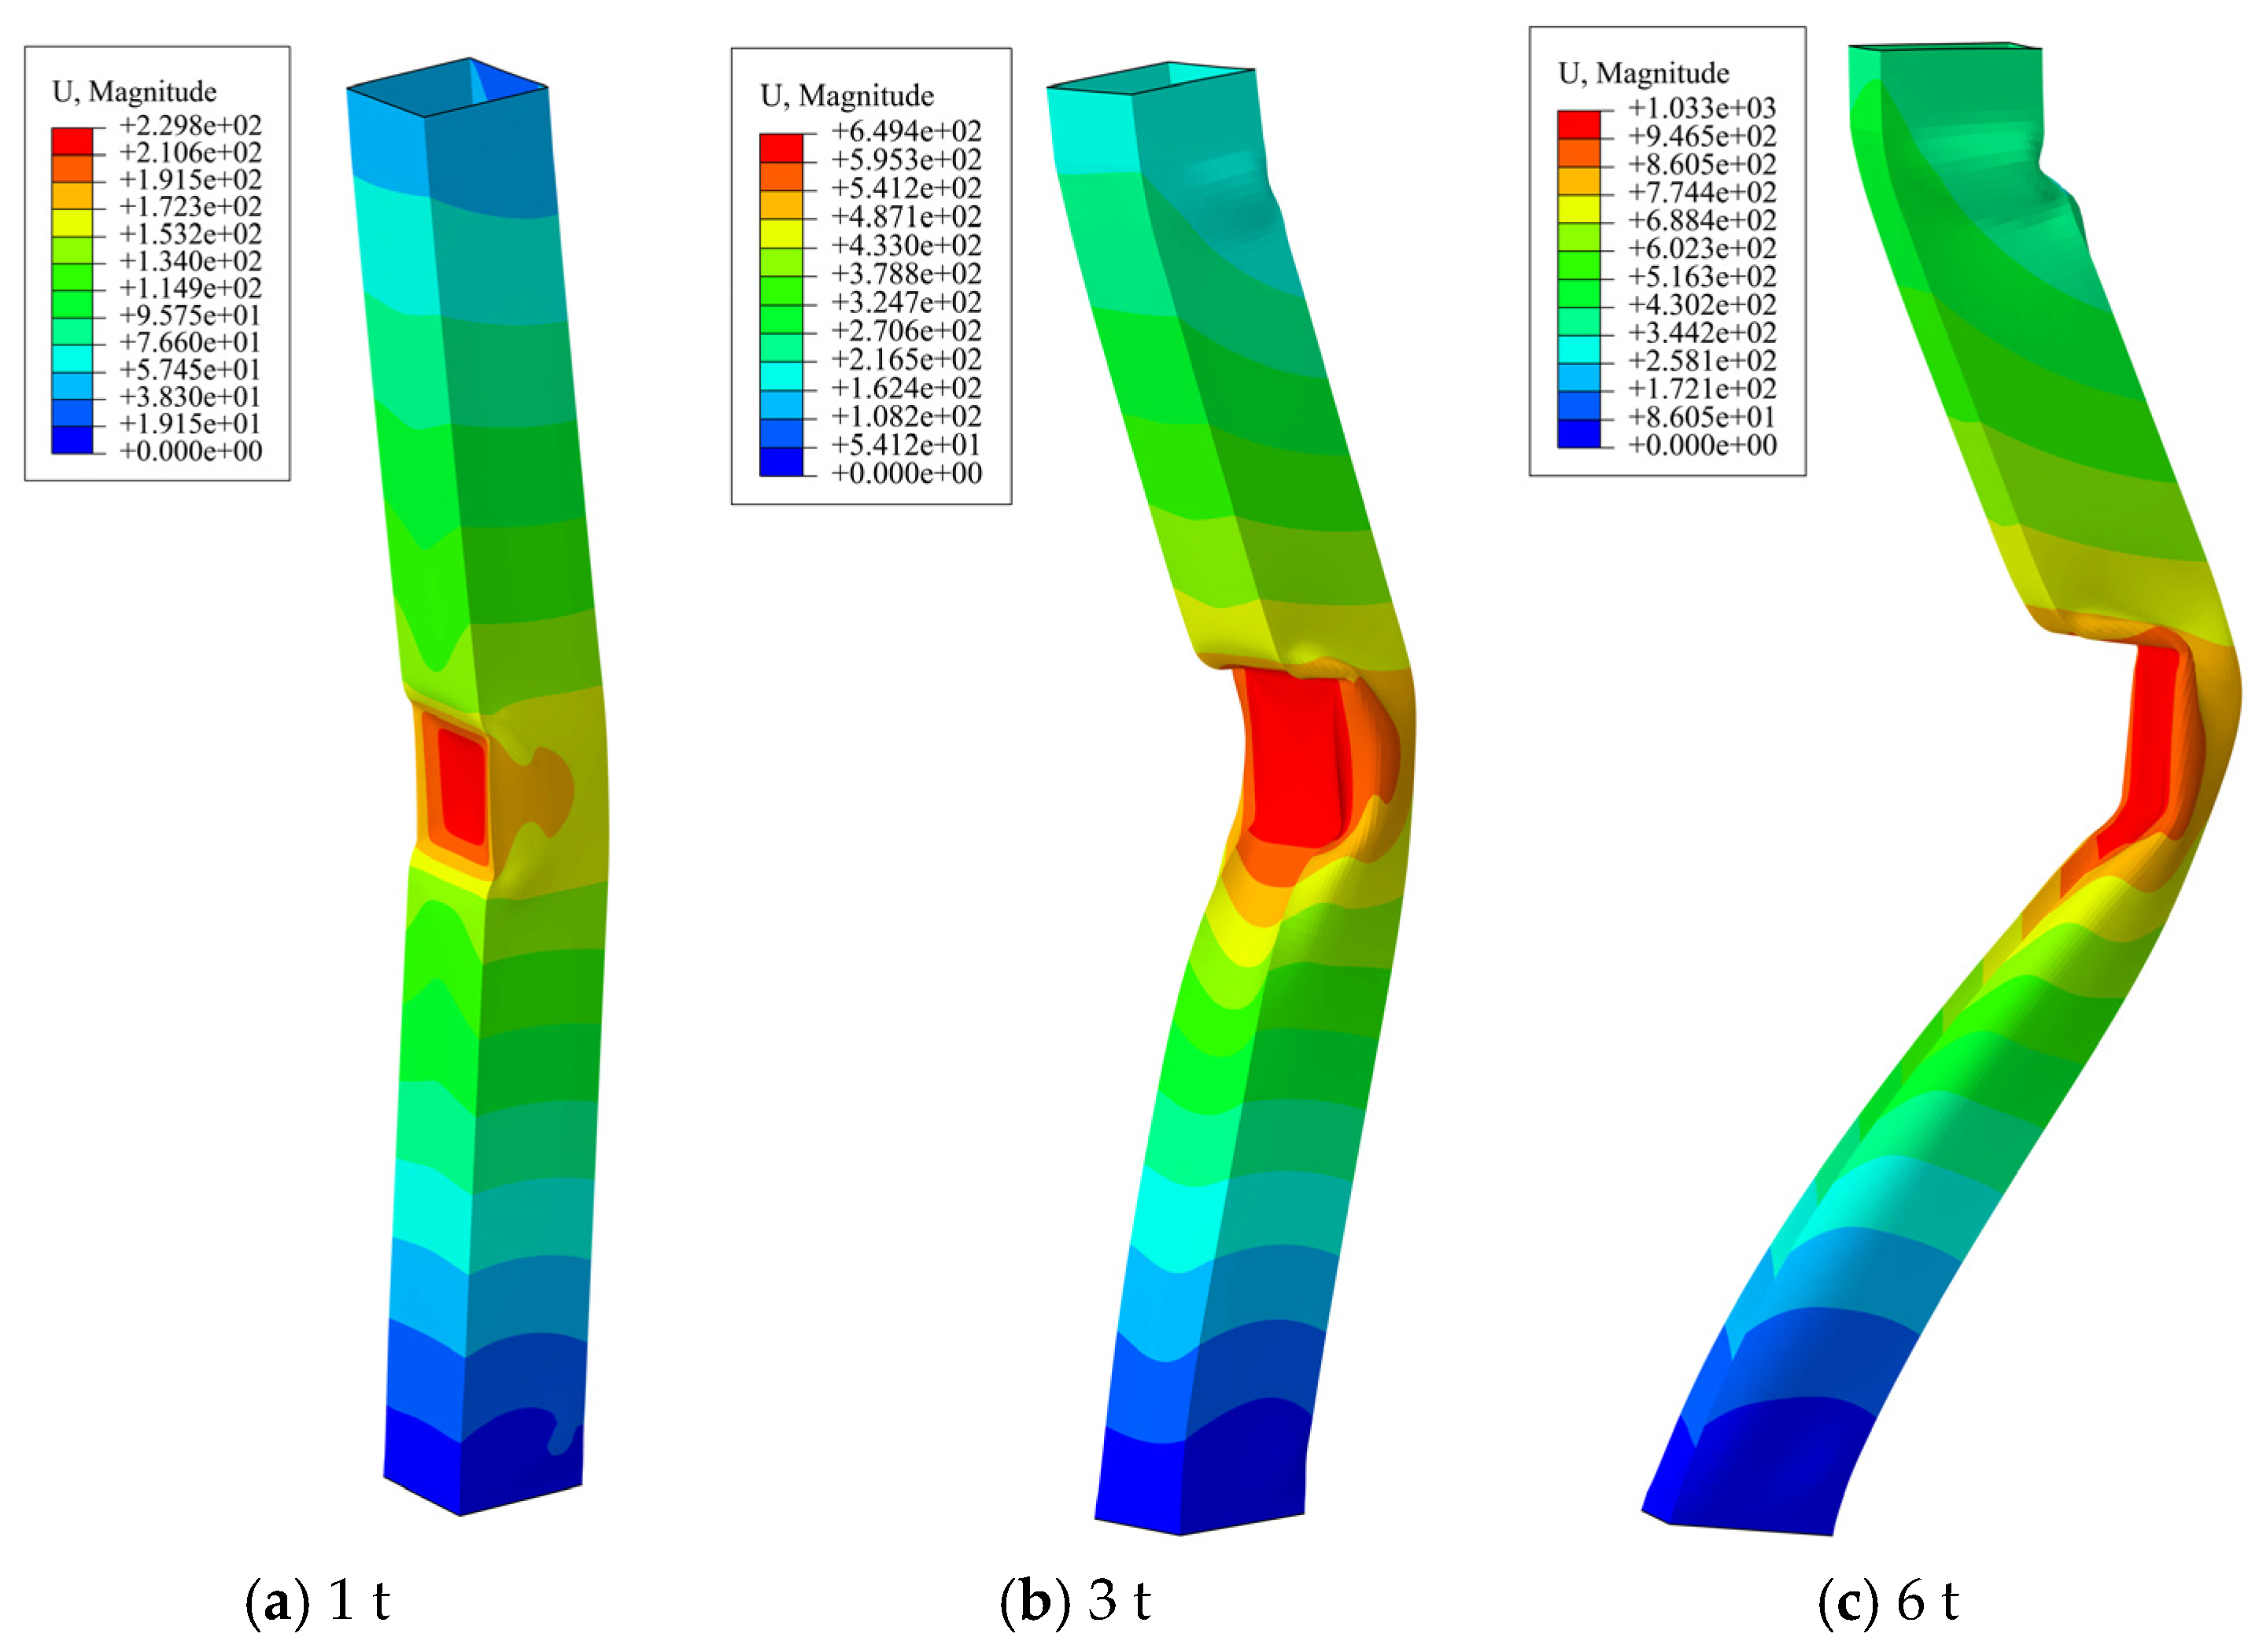
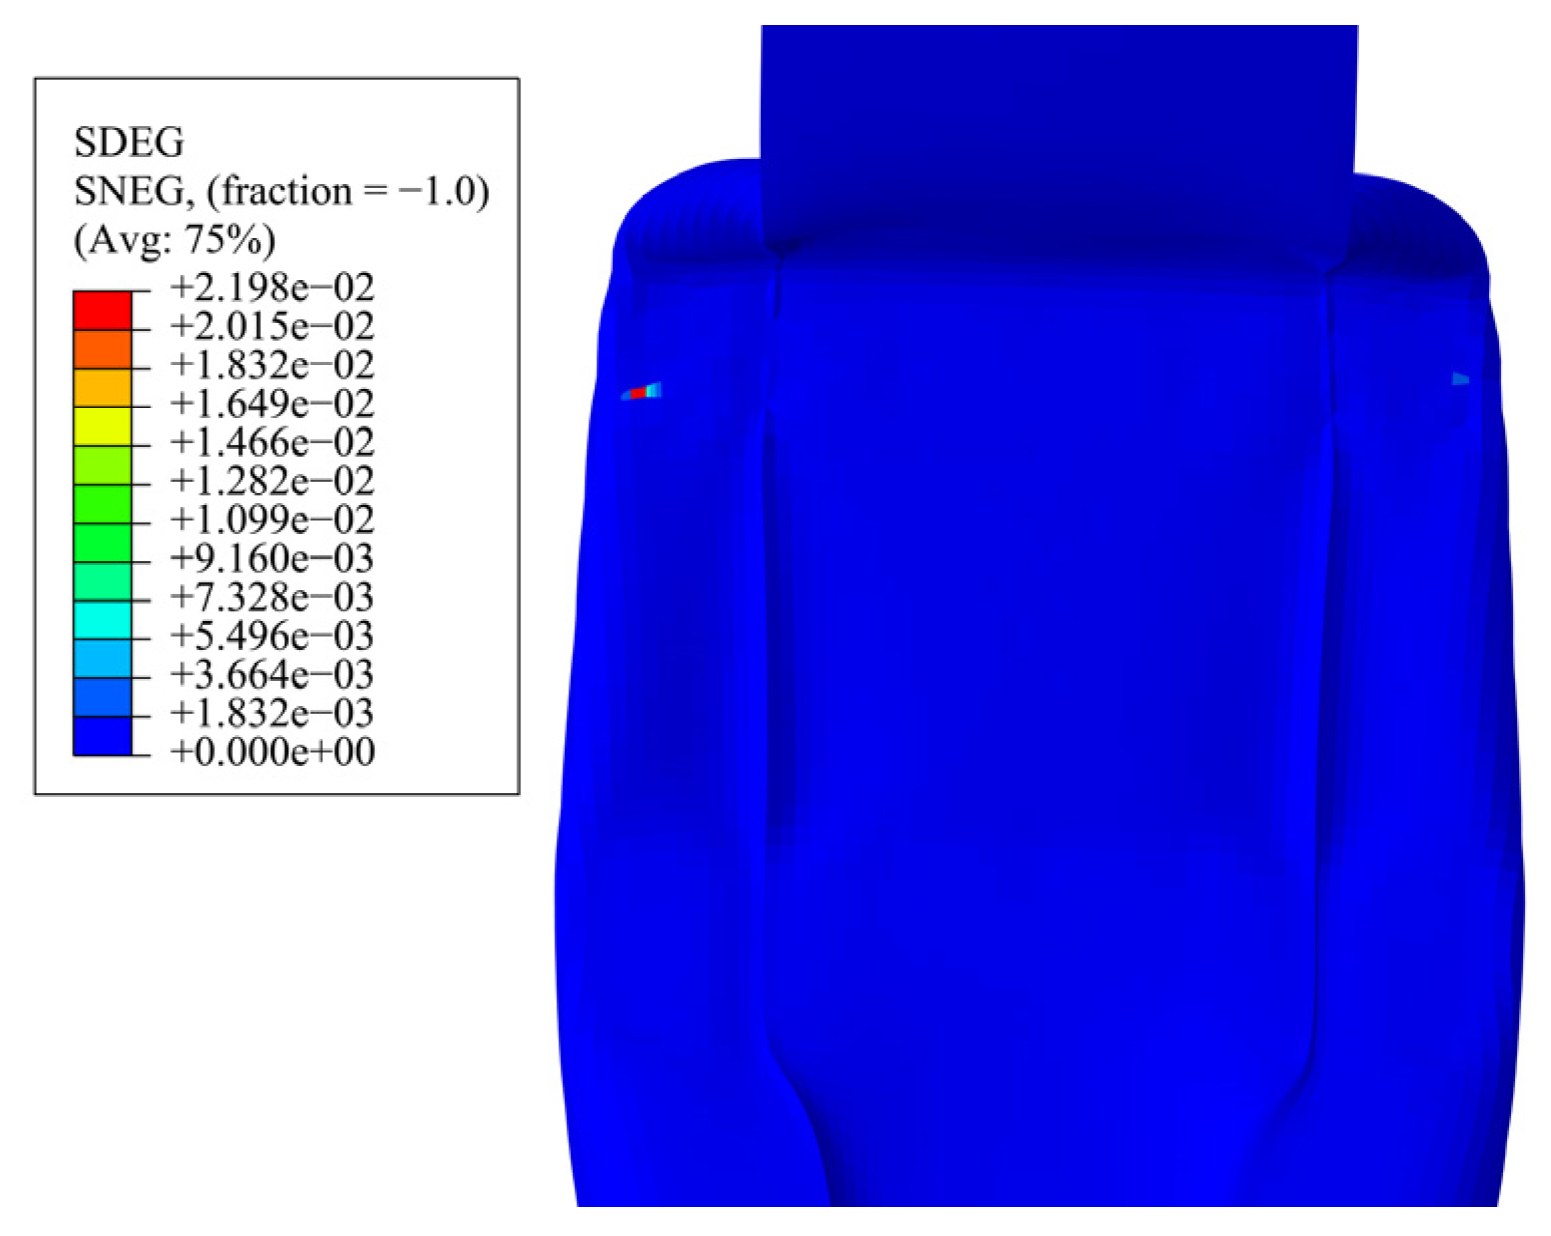
  • The main damage to the steel frame occurs at the impact location. The region produces stress concentration in the impact process, the steel column shows local depression deformation and overall bending deformation, the two sides of the steel plate bulge, the inner diaphragm buckles under pressure, and the steel beam shows bending and compression buckling of the beam-end flanges. Within the parameters of this paper, the top and foot of the impacted column are not damaged, and the steel is still in the plastic phase, indicating that Q235B steel has high plasticity and impact resistance.
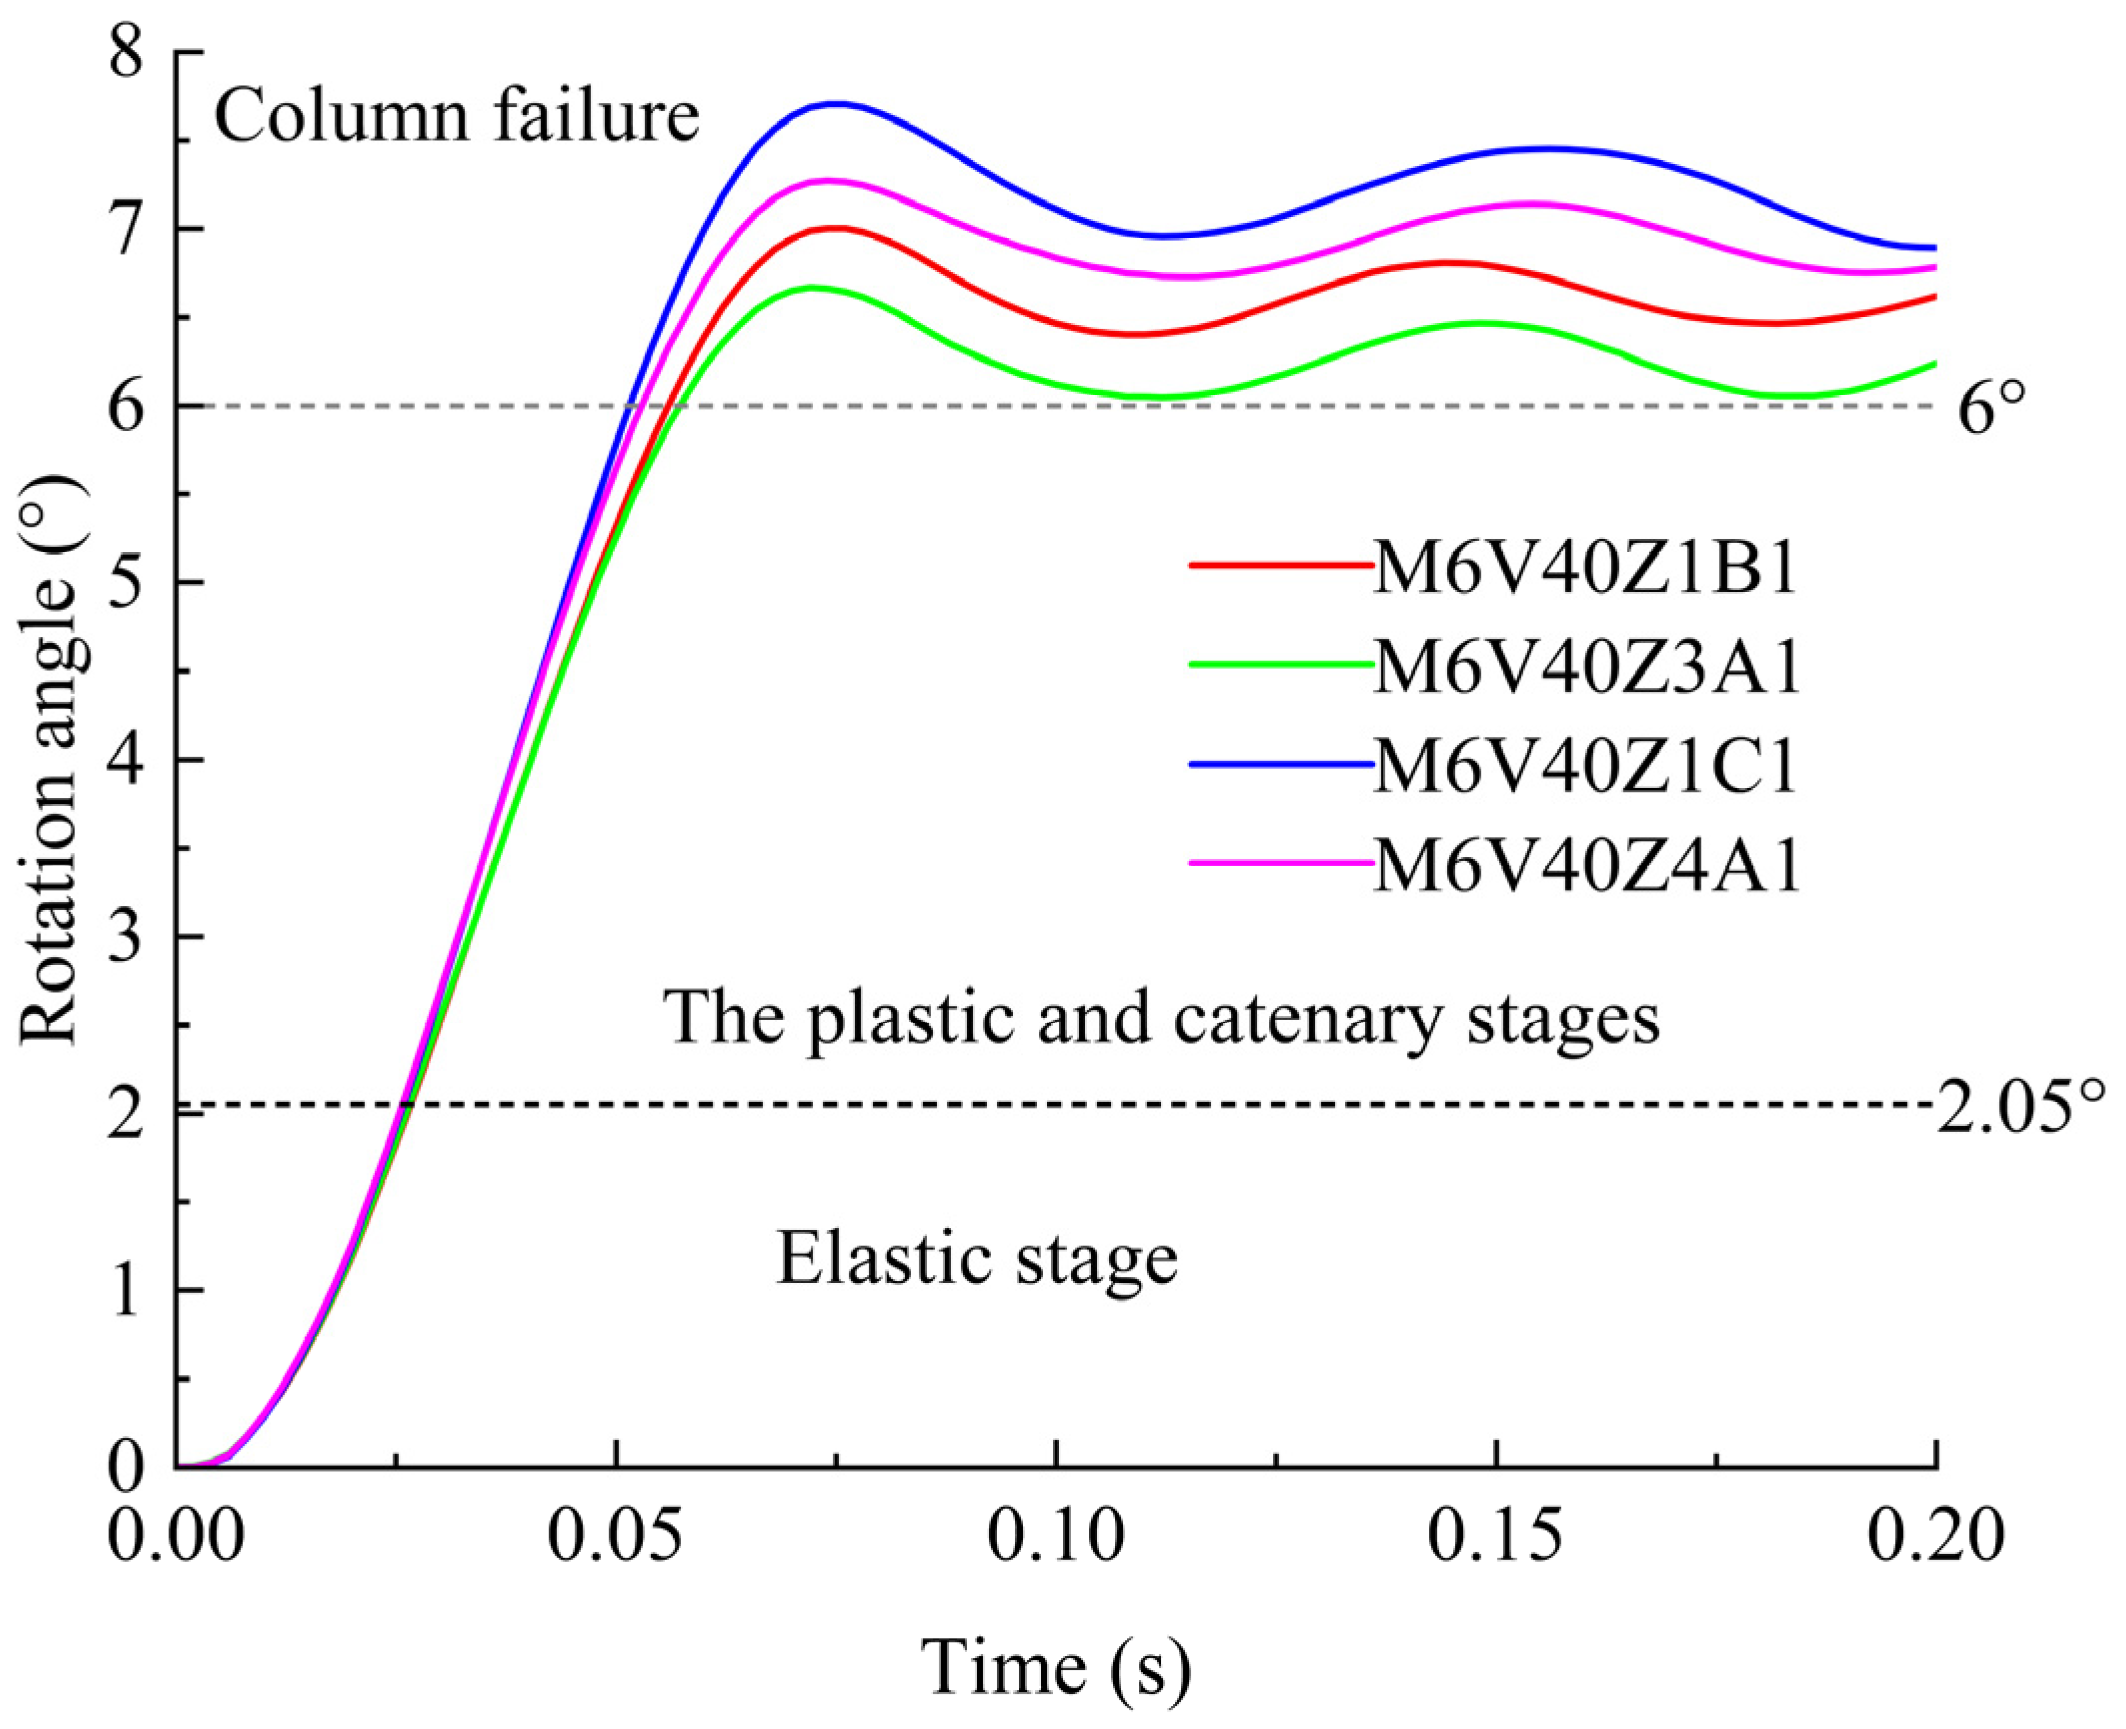
  • The steel frame will collapse when the kinetic energy of the impact is large, and based on the rotation angle of the beams the impact process can be divided into three phases, the elastic phase, the plasticity and catenary phase, and the failure phase of the column members. When impacting the bottom corner columns, the corner columns fail due to the increased deformation under the upper load. The beam members connected with the corner columns fail due to the excessive turning angle, and the steel frame structure undergoes vertical progressive collapse. When the side center columns fail, the overall frame forms a Vierendeel action mechanism to resist the progressive collapse of the structure.
  • In order to further extend the existing research results, it is necessary to conduct a parametric study of space steel frames to investigate the impact dynamic response and structural resistance to continuous collapse under different structural arrangements. The contribution of the floor slab is not considered in this paper, and it is necessary to study the effect of the floor slab of the building structure under impact loads for future research on continuous collapse resistance. Meanwhile, this paper verifies the validity of the numerical model by comparing it with the existing scaled-down tests. However, the simplified and scaled-down steel beam impact tests cannot adequately reflect the impact resistance of actual frame structures. Future research should actively carry out full-scale impact tests of frame structures to obtain more accurate data for numerical validation or practical engineering applications.

Author Contributions

Methodology, J.J. and C.K.; Software, Z.Z.; Validation, Z.Z.; Formal analysis, Z.Z.; Investigation, J.J., Z.Z. and C.K.; Resources, J.J. and C.K.; Data curation, Z.Z.; Writing—original draft, Z.Z.; Writing—review & editing, J.J. and C.K.; Visualization, Z.Z.; Supervision, J.J. and C.K.; Project administration, J.J. and C.K.; Funding acquisition, J.J. and C.K. All authors have read and agreed to the published version of the manuscript.

Funding

This research received no external funding.

Data Availability Statement

The original contributions presented in this study are included in the article. Further inquiries can be directed to the corresponding author.

Conflicts of Interest

The authors declare no conflict of interest.

References

  1. Kiakojouri, F.; Sheidaii, M.R.; De Biagi, V.; Chiaia, B. Progressive collapse of structures: A discussion on annotated nomenclature. Structures 2021, 29, 1417–1423. [Google Scholar] [CrossRef]
  2. Pearson, C.; Delatte, N. Lessons from the Progressive Collapse of the Ronan Point Apartment Tower. In Forensic Engineering (2003); Proceedings of the Third Congress, San Diego, CA, USA, 19–21 October 2012; American Society of Civil Engineers: Reston, VI, USA, 2003; pp. 190–200. [Google Scholar]
  3. Osteraas John, D. Murrah Building Bombing Revisited: A Qualitative Assessment of Blast Damage and Collapse Patterns. J. Perform. Constr. Facil. 2006, 20, 330–335. [Google Scholar] [CrossRef]
  4. Bažant Zdeněk, P.; Le, J.-L.; Greening Frank, R.; Benson David, B. What Did and Did Not Cause Collapse of World Trade Center Twin Towers in New York? J. Eng. Mech. 2008, 134, 892–906. [Google Scholar] [CrossRef]
  5. Russell, J.M.; Sagaseta, J.; Cormie, D.; Jones, A.E.K. Historical review of prescriptive design rules for robustness after the collapse of Ronan Point. Structures 2019, 20, 365–373. [Google Scholar] [CrossRef]
  6. Adam, J.M.; Parisi, F.; Sagaseta, J.; Lu, X. Research and practice on progressive collapse and robustness of building structures in the 21st century. Eng. Struct. 2018, 173, 122–149. [Google Scholar] [CrossRef]
  7. Kiakojouri, F.; De Biagi, V.; Chiaia, B.; Sheidaii, M.R. Progressive collapse of framed building structures: Current knowledge and future prospects. Eng. Struct. 2020, 206, 110061. [Google Scholar] [CrossRef]
  8. Jiang, J.; Zhang, Q.; Li, L.; Chen, W.; Ye, J.; Li, G.-Q. Review on Quantitative Measures of Robustness for Building Structures Against Disproportionate Collapse. Int. J. High-Rise Build. 2020, 9, 127–154. [Google Scholar] [CrossRef]
  9. Pei, Q.; Wu, C.; Cheng, Z.; Ding, Y.; Guo, H. The Seismic Performance of New Self-Centering Beam-Column Joints of Conventional Island Main Buildings in Nuclear Power Plants. Materials 2022, 15, 1704. [Google Scholar] [CrossRef]
  10. Qin, W.; Zhang, Z.; Xi, Z. Towards enhancing the anti-progressive collapse performance of concrete beam-column structures via ECC and BFRP: Experiments and mechanisms. Eng. Struct. 2023, 292, 116558. [Google Scholar] [CrossRef]
  11. Xu, Z.; Huang, Y. Finite element analysis of progressive collapse resistance of precast concrete frame beam-column substructures with UHPC connections. J. Build. Eng. 2024, 82, 108338. [Google Scholar] [CrossRef]
  12. Qiao, H.; Chen, Y.; Wang, J.; Chen, C. Experimental study on beam-to-column connections with reduced beam section against progressive collapse. J. Constr. Steel Res. 2020, 175, 106358. [Google Scholar] [CrossRef]
  13. Zhong, W.; Meng, B.; Hao, J. Performance of different stiffness connections against progressive collapse. J. Constr. Steel Res. 2017, 135, 162–175. [Google Scholar] [CrossRef]
  14. Yuan, J.; Liu, K.; Wang, S.; Tan, L.; Kang, S.-B. Experimental and numerical investigations on progressive collapse resistance of planar reinforced concrete frames with different storeys. Structures 2025, 74, 108489. [Google Scholar] [CrossRef]
  15. Kiakojouri, F.; De Biagi, V. Catenary mechanism in steel columns under extreme lateral loading: A basis for building progressive collapse analysis. Dev. Built Environ. 2024, 20, 100556. [Google Scholar] [CrossRef]
  16. Jin, L.; Zhang, X.; Zhang, R.; Du, X. Effect of impact location on the dynamic response of concrete columns reinforced with GFRP bars having various slenderness ratios: A numerical study. Structures 2024, 69, 107571. [Google Scholar] [CrossRef]
  17. Gao, S.; Yang, J.; Kang, S.B.; Li, F.; Shi, X. Experimental and numerical studies on deformation performance of square concrete-filled steel tubular columns under repeated lateral impacts. Eng. Struct. 2024, 308, 117909. [Google Scholar] [CrossRef]
  18. Sun, M.J.; Chen, H.; Yi, F.; Ding, Y.B.; Zhou, Y.; He, Q.F.; Zhang, W.-X.; Yi, W.-J. Experimental and numerical study on influence of impact mass and velocity on failure mode of RC columns under lateral impact. Eng. Struct. 2024, 314, 118416. [Google Scholar] [CrossRef]
  19. Huo, J.; Zhang, J.; Liu, Y.; Fu, F. Dynamic Behaviour and Catenary Action of Axially-restrained Steel Beam Under Impact Loading. Structures 2017, 11, 84–96. [Google Scholar] [CrossRef]
  20. Pham, T.M.; Hao, H. Plastic hinges and inertia forces in RC beams under impact loads. Int. J. Impact Eng. 2017, 103, 1–11. [Google Scholar] [CrossRef]
  21. Yin, Z.H.; Jia, P.C.; Li, R.W.; Wu, H. Simplified analytical model for dynamic behaviors of RC member under low-velocity impact. Structures 2025, 77, 109125. [Google Scholar] [CrossRef]
  22. Chen, Y.; Huo, J.; Chen, W.; Hao, H.; Elghazouli, A.Y. Experimental and numerical assessment of welded steel beam-column connections under impact loading. J. Constr. Steel Res. 2020, 175, 106368. [Google Scholar] [CrossRef]
  23. Wang, H.; Huo, J.; Elchalakani, M.; Liu, Y.; Zhang, S. Dynamic performance of retrofitted steel beam-column connections subjected to impact loadings. J. Constr. Steel Res. 2021, 183, 106732. [Google Scholar] [CrossRef]
  24. D’Antimo, M.; Latour, M.; Demonceau, J.F. Drop-weight impact tests on free from damage beam to column connections. J. Constr. Steel Res. 2022, 192, 107215. [Google Scholar] [CrossRef]
  25. Kukla, D.; Kozlowski, A.; Miller, B.; Ziaja, D.; Wojcik-Grzaba, I.; Gubernat, S. Experimental study of innovative steel beam-to-column joint under impact loading to mitigate progressive collapse. J. Build. Eng. 2025, 102, 112018. [Google Scholar] [CrossRef]
  26. Kang, H.; Kim, J. Progressive Collapse of Steel Moment Frames Subjected to Vehicle Impact. J. Perform. Constr. Facil. 2015, 29, 04014172. [Google Scholar] [CrossRef]
  27. Xiang, S.; He, Y.; Zhou, X. Performance assessment of steel parking structure columns subjected to frontal collision based on reduced vehicular models. Eng. Struct. 2022, 265, 114517. [Google Scholar] [CrossRef]
  28. Liu, H.; Fan, X.; Tian, S.; Deng, X. Dynamic response of buildings under debris flow impact. J. Mt. Sci. 2024, 21, 1581–1597. [Google Scholar] [CrossRef]
  29. Stephen, D.; Lam, D.; Forth, J.; Ye, J.; Tsavdaridis, K.D. An evaluation of modelling approaches and column removal time on progressive collapse of building. J. Constr. Steel Res. 2019, 153, 243–253. [Google Scholar] [CrossRef]
  30. Ke, C.; Li, X.; Jiang, J. Dynamic Response Analysis of RC Frame against Progressive Collapse Based on Orthogonal Test. Appl. Sci. Basel 2023, 13, 4317. [Google Scholar] [CrossRef]
  31. ABAQUS/CAE Computer Software, v 2023; Dassault Systémes, Inc.: Providence, RI, USA, 2022.
  32. PKPM 2021 Structural Design Software, v 2.1.3.1; China Academy of Building Research: Beijing, China, 2024.
  33. GB 50017-2017; Code for Design of Steel Structures. Ministry of Housing and Urban-Rural Development of the People’s Republic of China: Beijing, China; Architecture & Building Press: Beijing, China, 2017.
  34. GB 50009-2012; Load Code for the Design of Building Structures. Ministry of Housing and Urban-Rural Development of the People’s Republic of China: Beijing, China; Architecture & Building Press: Beijing, China, 2012.
  35. CECS 392:2021; Code for Anti-Collapse Design of Building Structures. China Engineering Construction Standardization Association: Beijing, China; China Planning Press: Beijing, China, 2021.
  36. Scholl, N.; Minuth-Hadi, F.; Thiele, K. Modelling the strain rate dependent hardening of constructional steel using semi-empirical models. J. Constr. Steel Res. 2018, 145, 414–424. [Google Scholar] [CrossRef]
  37. Lin, L.; Zhi, X.; Fan, F.; Meng, S.; Su, J. Determination of Parameters of Johnson-Cook Models of Q235B Steel. J. Vib. Shock 2014, 33, 153–158+172. [Google Scholar] [CrossRef]
  38. Johnson, G.R.; Cook, W.H. Fracture characteristics of three metals subjected to various strains, strain rates, temperatures and pressures. Eng. Fract. Mech. 1985, 21, 31–48. [Google Scholar] [CrossRef]
  39. Xiao, X.; Wang, Y. The Difference Between the Built-in Johnson-Cook Fracture Criterion in ABAQUS Finite Element Program and the Original Criterion as well as a Comparative Analysis. J. Nanyang Inst. Technol. 2018, 10, 38–42. [Google Scholar]
  40. Zhou, T.; Li, W.; Guan, Y.; Bai, L. Damage Analysis of Steel Frames under Cyclic Load Based on Stress Triaxiality. Eng. Mech. 2014, 31, 146–155. [Google Scholar]
  41. Javidan, M.M.; Kang, H.; Isobe, D.; Kim, J. Computationally efficient framework for probabilistic collapse analysis of structures under extreme actions. Eng. Struct. 2018, 172, 440–452. [Google Scholar] [CrossRef]
  42. UFC 4—023-03; United States Department of Defense (DoD). Structures to Resist Progressive Collapse. Department of Defense: Washington, DC, USA, 2005.
  43. Izzuddin, B. A simplified model for axially restrained beams subject to extreme loading. Int. J. Steel Struct. 2005, 5, 421–429. [Google Scholar]
  44. Qiao, H.; Lu, C.; Wei, J.; Chen, Y. Progressive Collapse Analysis for Steel-Braced Frames Considering Vierendeel Action. J. Perform. Constr. Facil. 2020, 34, 04020069. [Google Scholar] [CrossRef]
Figure 1. Parametric details of 3-story space steel frame.
Buildings 15 01888 g001
Figure 2. Flowchart of model solving.
Buildings 15 01888 g002
Figure 3. Hourglass energy as a proportion of internal energy.
Buildings 15 01888 g003
Figure 4. Finite element modeling of steel beams under impact.
Buildings 15 01888 g004
Figure 5. Comparison of test and simulation.
Buildings 15 01888 g005
Figure 6. Naming of steel frame beams and columns.
Buildings 15 01888 g006
Figure 7. Joint numbering in the velocity direction.
Buildings 15 01888 g007
Figure 8. Displacement–time curve of Z3A1.
Buildings 15 01888 g008
Figure 9. Comparison of Z1B1-1 and Z1B1-2 horizontal displacement.
Buildings 15 01888 g009
Figure 10. Column deformation for different impact masses.
Buildings 15 01888 g010
Figure 11. Deformation diagram of the joints.
Buildings 15 01888 g011
Figure 12. Horizontal displacement–time curve of the second layer joint.
Buildings 15 01888 g012
Figure 13. Horizontal displacement–time curve of the third layer joint.
Buildings 15 01888 g013
Figure 14. Damage cloud diagram of the overall steel frame.
Buildings 15 01888 g014
Figure 15. Damage cloud diagram of the impacted column.
Buildings 15 01888 g015
Figure 16. Damage factor cloud diagram at the location of maximum damage.
Buildings 15 01888 g016
Figure 17. Schematic diagram of rotation angle.
Buildings 15 01888 g017
Figure 18. Overall deformation of M6V40Z1B1.
Buildings 15 01888 g018
Figure 19. Overall deformation of M6V40Z1C1.
Buildings 15 01888 g019
Figure 20. Time curves of beam rotation angle under impact parameter M6V40.
Buildings 15 01888 g020
Table 1. Frame beam and column section dimensions.
Square Steel Pipe Column Section (mm)H-Beam Section (mm)
F400 × 400 × 12H400 × 200 × 8 × 13
Table 2. J-C model parameters for Q235B steel.
A (MPa)B (MPa)CnmTm (K)Tr (K)Reference Strain Rate
244.8899.70.03910.940.75717952930.000833
Table 3. J-C fracture criterion parameters in ABAQUS.
D1D2D3D4D5
−43.40844.6080.0160.01456.619
Table 4. Sensitivity analysis of mesh size.
Mesh Size (mm)Impact Displacement (mm)Vertical Displacement (mm)
201375.4566.3
301381.4595.6
401381.6595.6
Table 5. Residual displacements of steel frames with different parameters.
Parameter
Combination
Impact Residual Displacement (mm)Vertical Residual Displacement
(mm)
1-1 (mm)1-2 (mm)1-3 (mm)1-4 (mm)
M6V40Z3A11384.10−595.59206.21171.86158.05157.37
M6V40Z1B11376.53−639.9199.3946.8644.3144.02
M6V40Z4A11385.93−672.78200.74168.58155.20154.89
M6V40Z1C11380.21−700.50100.2745.8343.2442.41
M6V30Z3A11011.64−350.37133.11118.40109.14108.34
M6V30Z1B11008.31−369.5559.4941.6432.0631.07
M6V30Z4A11015.22−381.19132.52112.99105.18104.42
M6V30Z1C11009.21−408.5159.6937.9228.9727.84
M3V30Z3A1642.94−160.4471.465.5361.5160.81
M3V30Z1B1639.54−165.4529.0422.5617.9516.90
M3V30Z4A1643.77−166.4869.2663.5058.9458.28
M3V30Z1C1638.74−176.4427.3619.5815.5214.63
M3V20Z3A1327.29−53.5147.8544.8643.1442.42
M3V20Z1B1329.77−53.9519.3116.0012.7512.43
M3V20Z4A1329.76−53.9750.4046.3144.8344.17
M3V20Z1C1324.52−53.7119.5015.0513.2512.19
Table 6. Ductility and rotation limit of DoD2005.
MemberDuctilityRotation
Steel beam106
Plate206
Welded beam flange or cover plate___1.5
Disclaimer/Publisher’s Note: The statements, opinions and data contained in all publications are solely those of the individual author(s) and contributor(s) and not of MDPI and/or the editor(s). MDPI and/or the editor(s) disclaim responsibility for any injury to people or property resulting from any ideas, methods, instructions or products referred to in the content.

