1. Introduction
Concrete structures play a vital role in modern infrastructure, including bridges, high-rise buildings, and hydraulic engineering. Recent disasters, such as the 2023 Türkiye earthquakes, particularly in regions like Adıyaman, Kahramanmaraş, and Gölbaşı, have revealed severe damage in reinforced concrete (RC) structures due to internal degradation of the concrete. These events highlight the critical importance of early and accurate detection of internal defects in concrete for structural health monitoring and safety assurance. Internal defects in concrete are typically the result of long-term physical, chemical, and mechanical deterioration processes. Key causes include freeze–thaw cycles, carbonation, alkali–aggregate reactions, chloride-induced corrosion, poor construction practices, and overloading. These processes lead to microcracking, delamination, and internal void formation, which, in turn, compromise the structural integrity and durability of concrete. In particular, in aging infrastructure and seismic-prone regions, such defects may remain invisible on the surface, but can evolve into critical failure points. Concrete, being a heterogeneous, porous, and anisotropic material, poses substantial challenges for internal inspection. Conventional methods, such as visual inspection or coring, are invasive and insufficient to detect deeply embedded defects such as voids, cracks, and delamination. Non-destructive testing (NDT) methods have thus become a primary approach for concrete evaluation, offering safe and reliable diagnostic tools. Techniques such as infrared thermal imaging [
1], ground-penetrating radar [
2], acoustic emission [
3,
4,
5], impact echo [
6,
7,
8], and various ultrasonic methods [
9,
10] are extensively employed. Among them, ultrasonic testing stands out due to its high penetration depth, low cost, and ease of use. However, traditional ultrasonic imaging techniques are limited by high attenuation, scattering effects, and a low signal-to-noise ratio (SNR), resulting in poor imaging contrast and insufficient resolution for internal defect visualization [
11].
To address these limitations, the synthetic aperture focusing technique (SAFT) has been increasingly applied in ultrasonic imaging of concrete. The SAFT enhances lateral resolution without enlarging the transducer aperture by simulating a larger aperture through multiple signal acquisitions and time-delay summation [
12,
13,
14]. To calculate real-time wave velocities for concrete defect imaging, Bittner, J.A. et al. [
15] proposed a new method, which complements the ensemble-based synthetic aperture focusing technique. By processing raw data from ultrasonic devices like array imagers using the SAFT in conjunction with the multilayer delay summation method, Lin et al. [
16] further improved ultrasonic imaging of layered concrete by processing ultrasonic array data with SAFT combined with the multilayer delay summation method. Choi et al. [
17] utilized the MIRA instrument, which is based on a synthetic aperture focusing imaging algorithm, for defect detection in concrete pavements, bridge piers, runways, and other applications. They accurately detected reinforcement defects and delamination within concrete structures using MIRA. Moreover, Khazanovichh et al. [
18] discussed noise reduction in a linear array ultrasound system through extended reconstruction. Their approach aimed to mitigate the effects of finite aperture, improving imaging quality. Overall, these studies highlight the advancements and effectiveness of the SAFT in various applications, contributing to enhanced imaging resolution, accurate defect detection, and noise reduction in concrete structures.
The SAFT enables bi-directional dynamic focusing in both emission and reception, greatly enhancing lateral resolution and detection precision. However, the traditional SAFT of reducing the sideband through amplitude variation sacrifices resolution and fails to sufficiently improve contrast. To overcome these limitations, Matrone et al. [
19] proposed and adapted the Delay Multiply and Sum (DMAS) nonlinear beam-forming algorithm for B-type image formation using the SAFT. The original beam-former was initially introduced by Lim et al. [
20] for microwave image reconstruction in breast cancer detection. Matrone et al. [
21,
22,
23] proposed an enhanced version of the DMAS algorithm, known as the Filtered-DMAS (F-DMAS) beam-forming algorithm, to overcome the limitations of Delay-And-Sum (DAS) beam-forming in ultrasound imaging. The computational simplicity of DAS often results in poor imaging quality, whereas DMAS provides improved image quality with higher contrast, narrower main lobes, and reduced side lobes compared to DAS [
24]. Beam-forming is a crucial aspect of the ultrasound imaging process, and current research in ultrasound imaging algorithms focuses on optimizing beam-forming to improve image quality. Although most prior research on DMAS has not been applied to the SAFT, Matrone et al. [
25] conducted a preliminary study using the classical SAFT with F-DMAS beam-forming to assess structural damage. It should be noted that DMAS demands more computational time due to its use of complex operations, including square root functions and multiplication [
26,
27]. However, instructions optimized for the architecture are necessary to simplify these operations effectively [
28]. Combining the DMAS approach with SAFT-based ultrasound imaging effectively tackles the inherent signal attenuation in focused imaging modes, improving contrast at all depths and further enhancing SAFT image quality. Although DMAS has demonstrated excellent performance in photoacoustic and medical ultrasound imaging, its application in concrete defect detection—especially in combination with the SAFT—remains underexplored.
Additionally, recent research has emphasized the importance of correlating concrete strength properties obtained via destructive and non-destructive methods. These correlations help to estimate in situ strength and identify degradation trends, supporting more accurate life prediction and maintenance planning [
29,
30,
31,
32]. Nevertheless, comprehensive strategies that combine imaging accuracy with structural property analysis are still lacking.
Given these gaps, this study proposes an improved SAFT-based imaging method enhanced by the DMAS algorithm to achieve better contrast and resolution in detecting internal defects in concrete. The method is validated through finite element simulations and laboratory experiments on precast concrete specimens with known artificial defects. This work aims to demonstrate the feasibility and advantages of the DMAS-enhanced SAFT in practical NDT applications for concrete structures.
2. Materials and Methods
2.1. Synthetic Aperture Focusing Technique (SAFT)
The SAFT primarily works on the principle of synthesizing inputs from multiple transducers. It uses an array of transducers positioned across the target area. The signals from these transducers are compiled into a numerical matrix that covers the entire detection area. These signals are then collectively processed to simulate the effect of a large-aperture transducer, resulting in the imaging output.
To implement the SAFT, the following procedure is used instead. Each single transducer element in the active aperture is used in turn to transmit pulse signals, and the backscattered echo signals are received by all elements; this process is repeated for each transducer in the aperture. If
N transducers are considered, let
i (
i = 1…
N) denote the transmitting element, and let
j (
j = 1…
N) denote the receiving element; then, the
i-th transmission element emits a set of collected radio frequency (RF) signals, which can be expressed as follows:
where each column
of the matrix represents the RF signal received by element
j when element
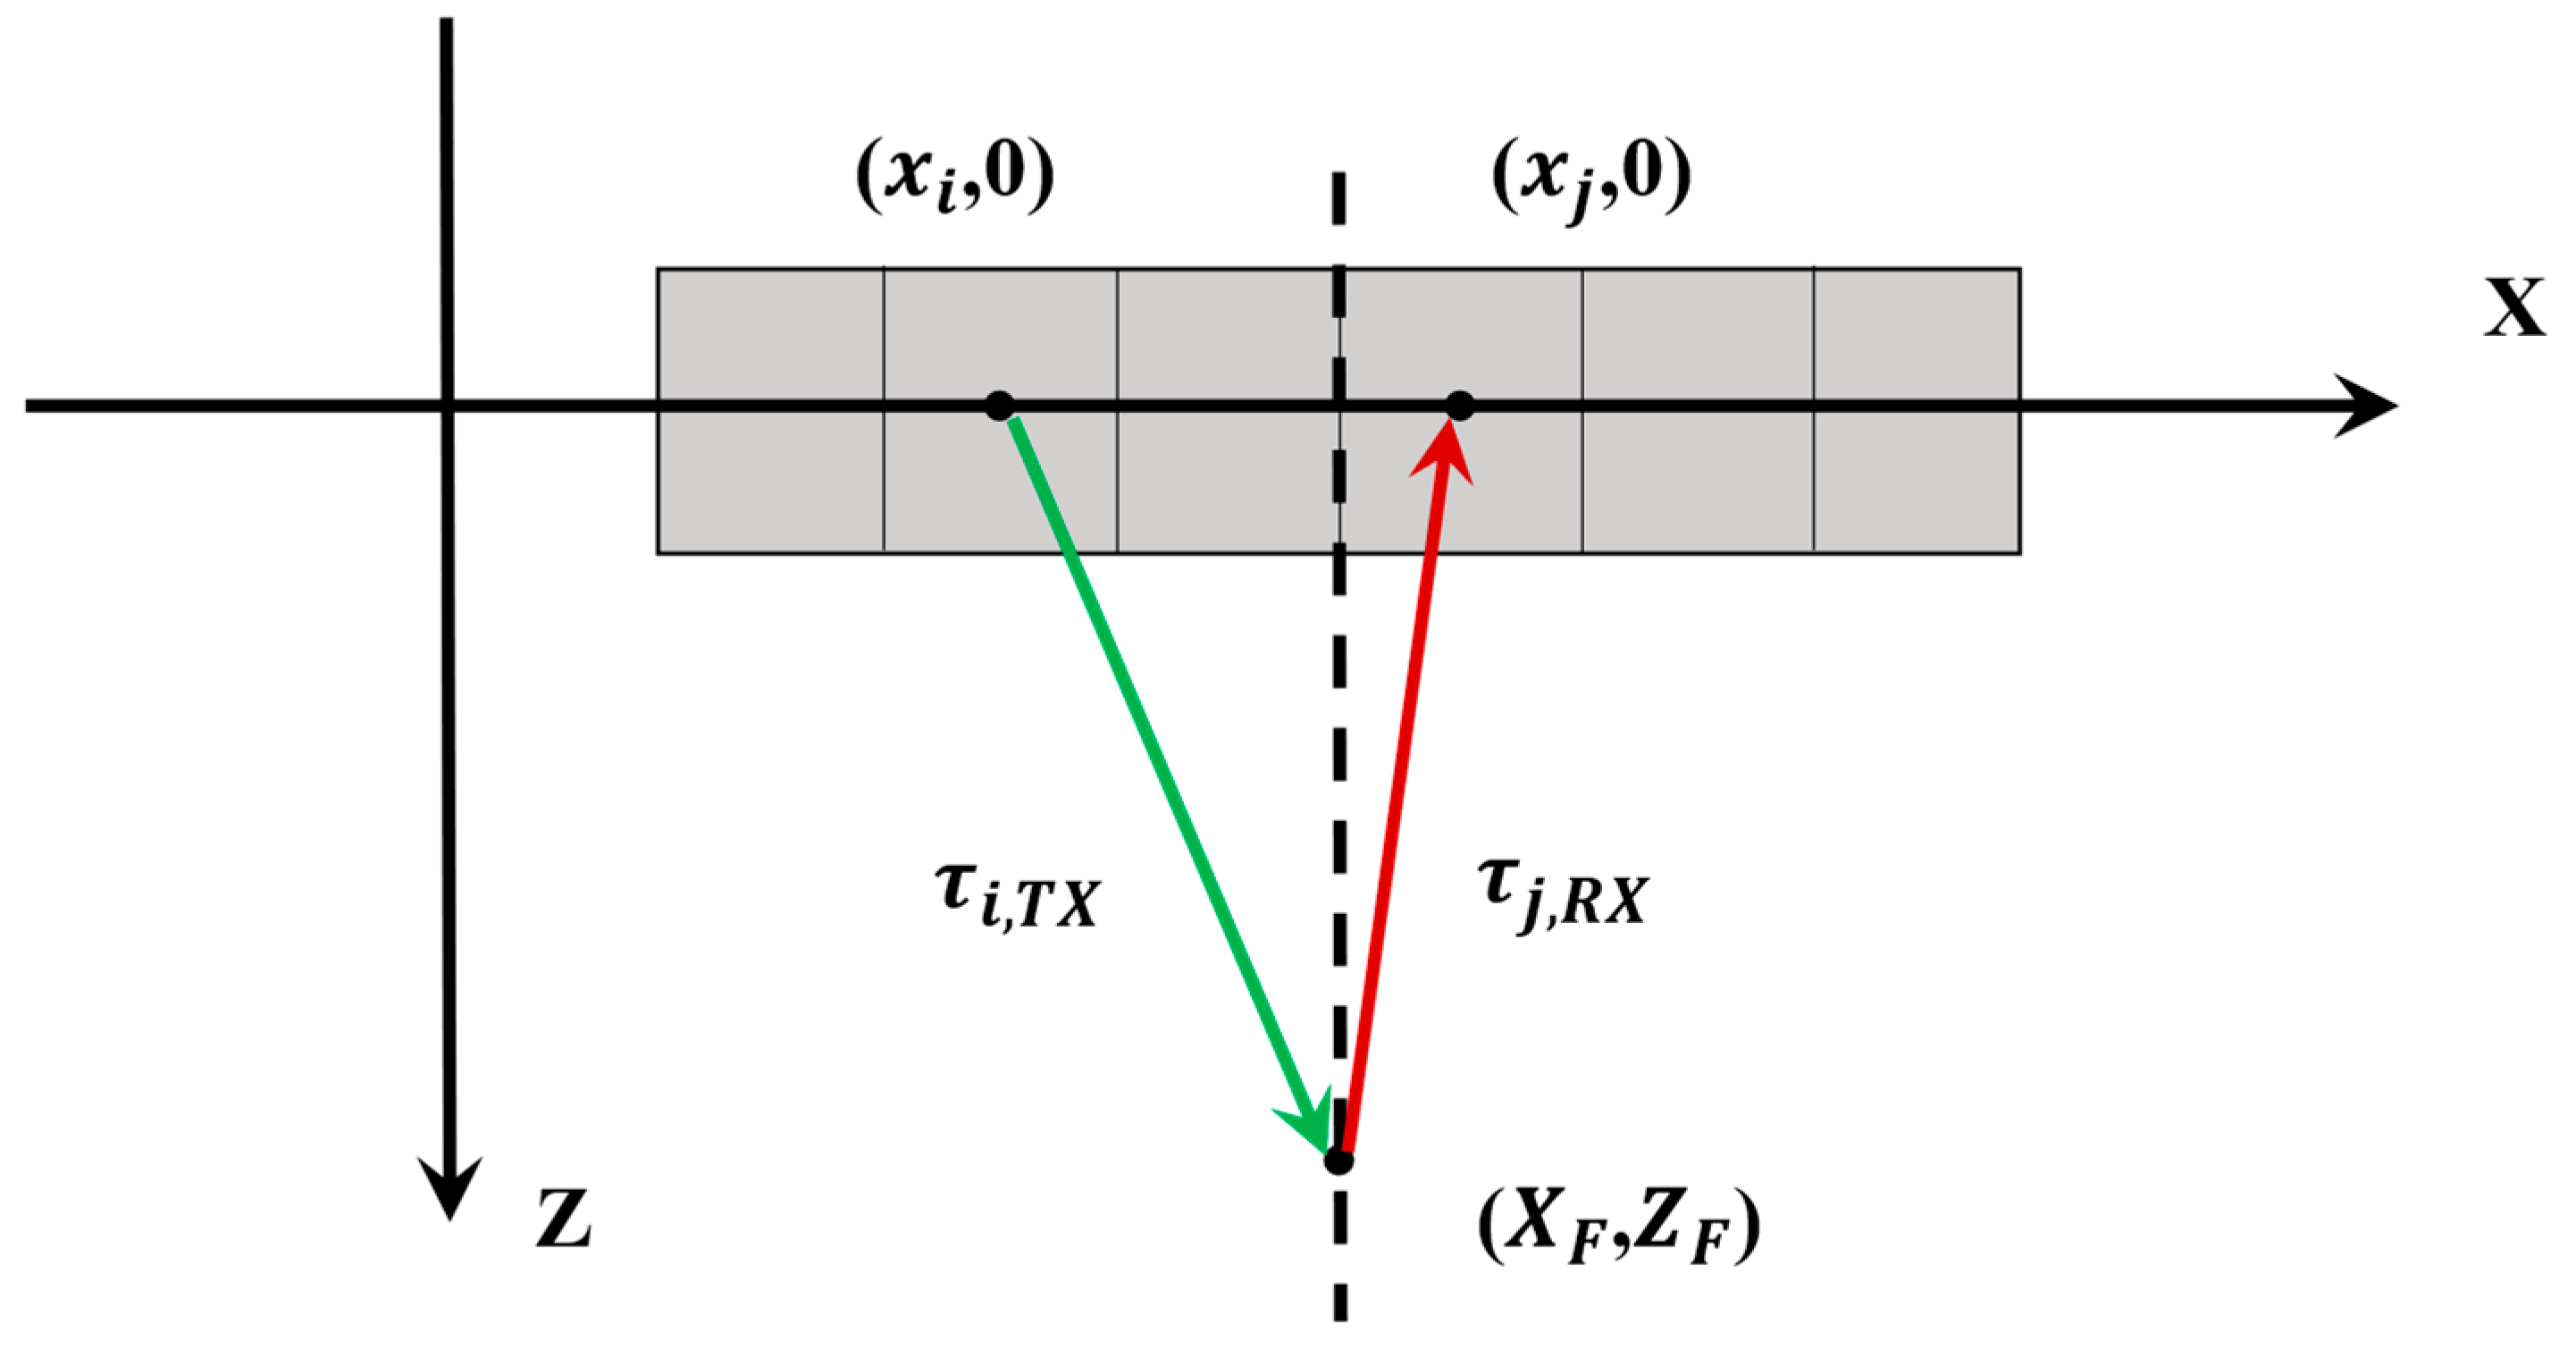
i transmits. To realign these signals, the delays
are calculated by considering the bi-directional distance from transmitting element
i to the focus and back to each receiving element
j (
Figure 1), as follows:
where the coordinates of the transmitting element are (
,
= 0), those of the receiving element are (
,
= 0), and
and
are the distance from the target point to the excitation sensor and to the receiving sensor, as well as the sending and receiving delays of elements
i and
j, respectively. The new set
of focused signals is given by the following:
where
is the repeated transmit–receive sequence for each
i-th element in the aperture. The
N realigned signal sets
are summed together as follows:
For each j-th receiver in the aperture, we obtain a single signal . In the case of SAFE, the signals S(t) derived as in (6) are used for image formation by implementing the specified beam-forming algorithm. For DMAS, we apply the processing steps outlined in the following section.
2.2. Optimization of Signal Matrix
The shallow response of the boundary and the surface during focusing produces a certain amount of noise signal in the imaging results. To overcome this effect, the simulation model is created with the sensor arrays uniformly arranged along the midline of the upper surface of the plate to construct an infinite boundary. For equally spaced sensor arrays, higher radiated energy at the center of detection is induced, i.e., the disadvantage of small-aperture detection, and to solve this problem, the following reconstruction formula is proposed. First, the SAFT calculation formula is as follows:
Focusing near the boundary and surface can introduce noise into the imaging results. To mitigate this, a simulation model with a uniformly distributed transducer array along the plate’s upper midline simulates an infinite boundary. This configuration, however, leads to concentrated energy at the detection center, due to the small-aperture effect. To address this issue, a new reconstruction formula is suggested. The SAFT calculation begins as follows:
where
is the original signal amplitude, N is the number of signals involved in the synthesis, and
is the magnitude of the target point in different A-scan signals.
and
are the distance from the target point to the excitation sensor
i and the receiving sensor
j, respectively, and
c is the propagation speed of waves in the concrete specimen blocks.
For any point
in the detection area, its echo amplitude at a certain moment is calculated by the following equation:
where
is the signal collected when the
i-th sensor is combined with the
j-th sensor, and
is the signal propagation time for that target point.
where
is the reconstructed signal amplitude.
The SAFT eliminates the need for complex control mechanisms within the transmission channel. This approach facilitates a more streamlined hardware design, as it employs beam-forming techniques during both the transmission and reflection phases. Furthermore, when integrated with advanced algorithms such as DMAS, this method has the potential to significantly enhance its contrast resolution capabilities.
In any case, the SAFT approach does not require multiple and separate controls of the transmission channel. Instead, it allows a simpler hardware architecture, since beam-forming focusing is performed in transmission and reflection, especially if used in combination with a beam-forming algorithm like DMAS, which is expected to improve its performance in terms of contrast resolution.
2.3. Delay Multiply and Sum Beam-Forming
After signal focusing and delay processing, the DMAS algorithm achieves beam-forming through the following steps [
8]. Firstly, the realigned RF signal
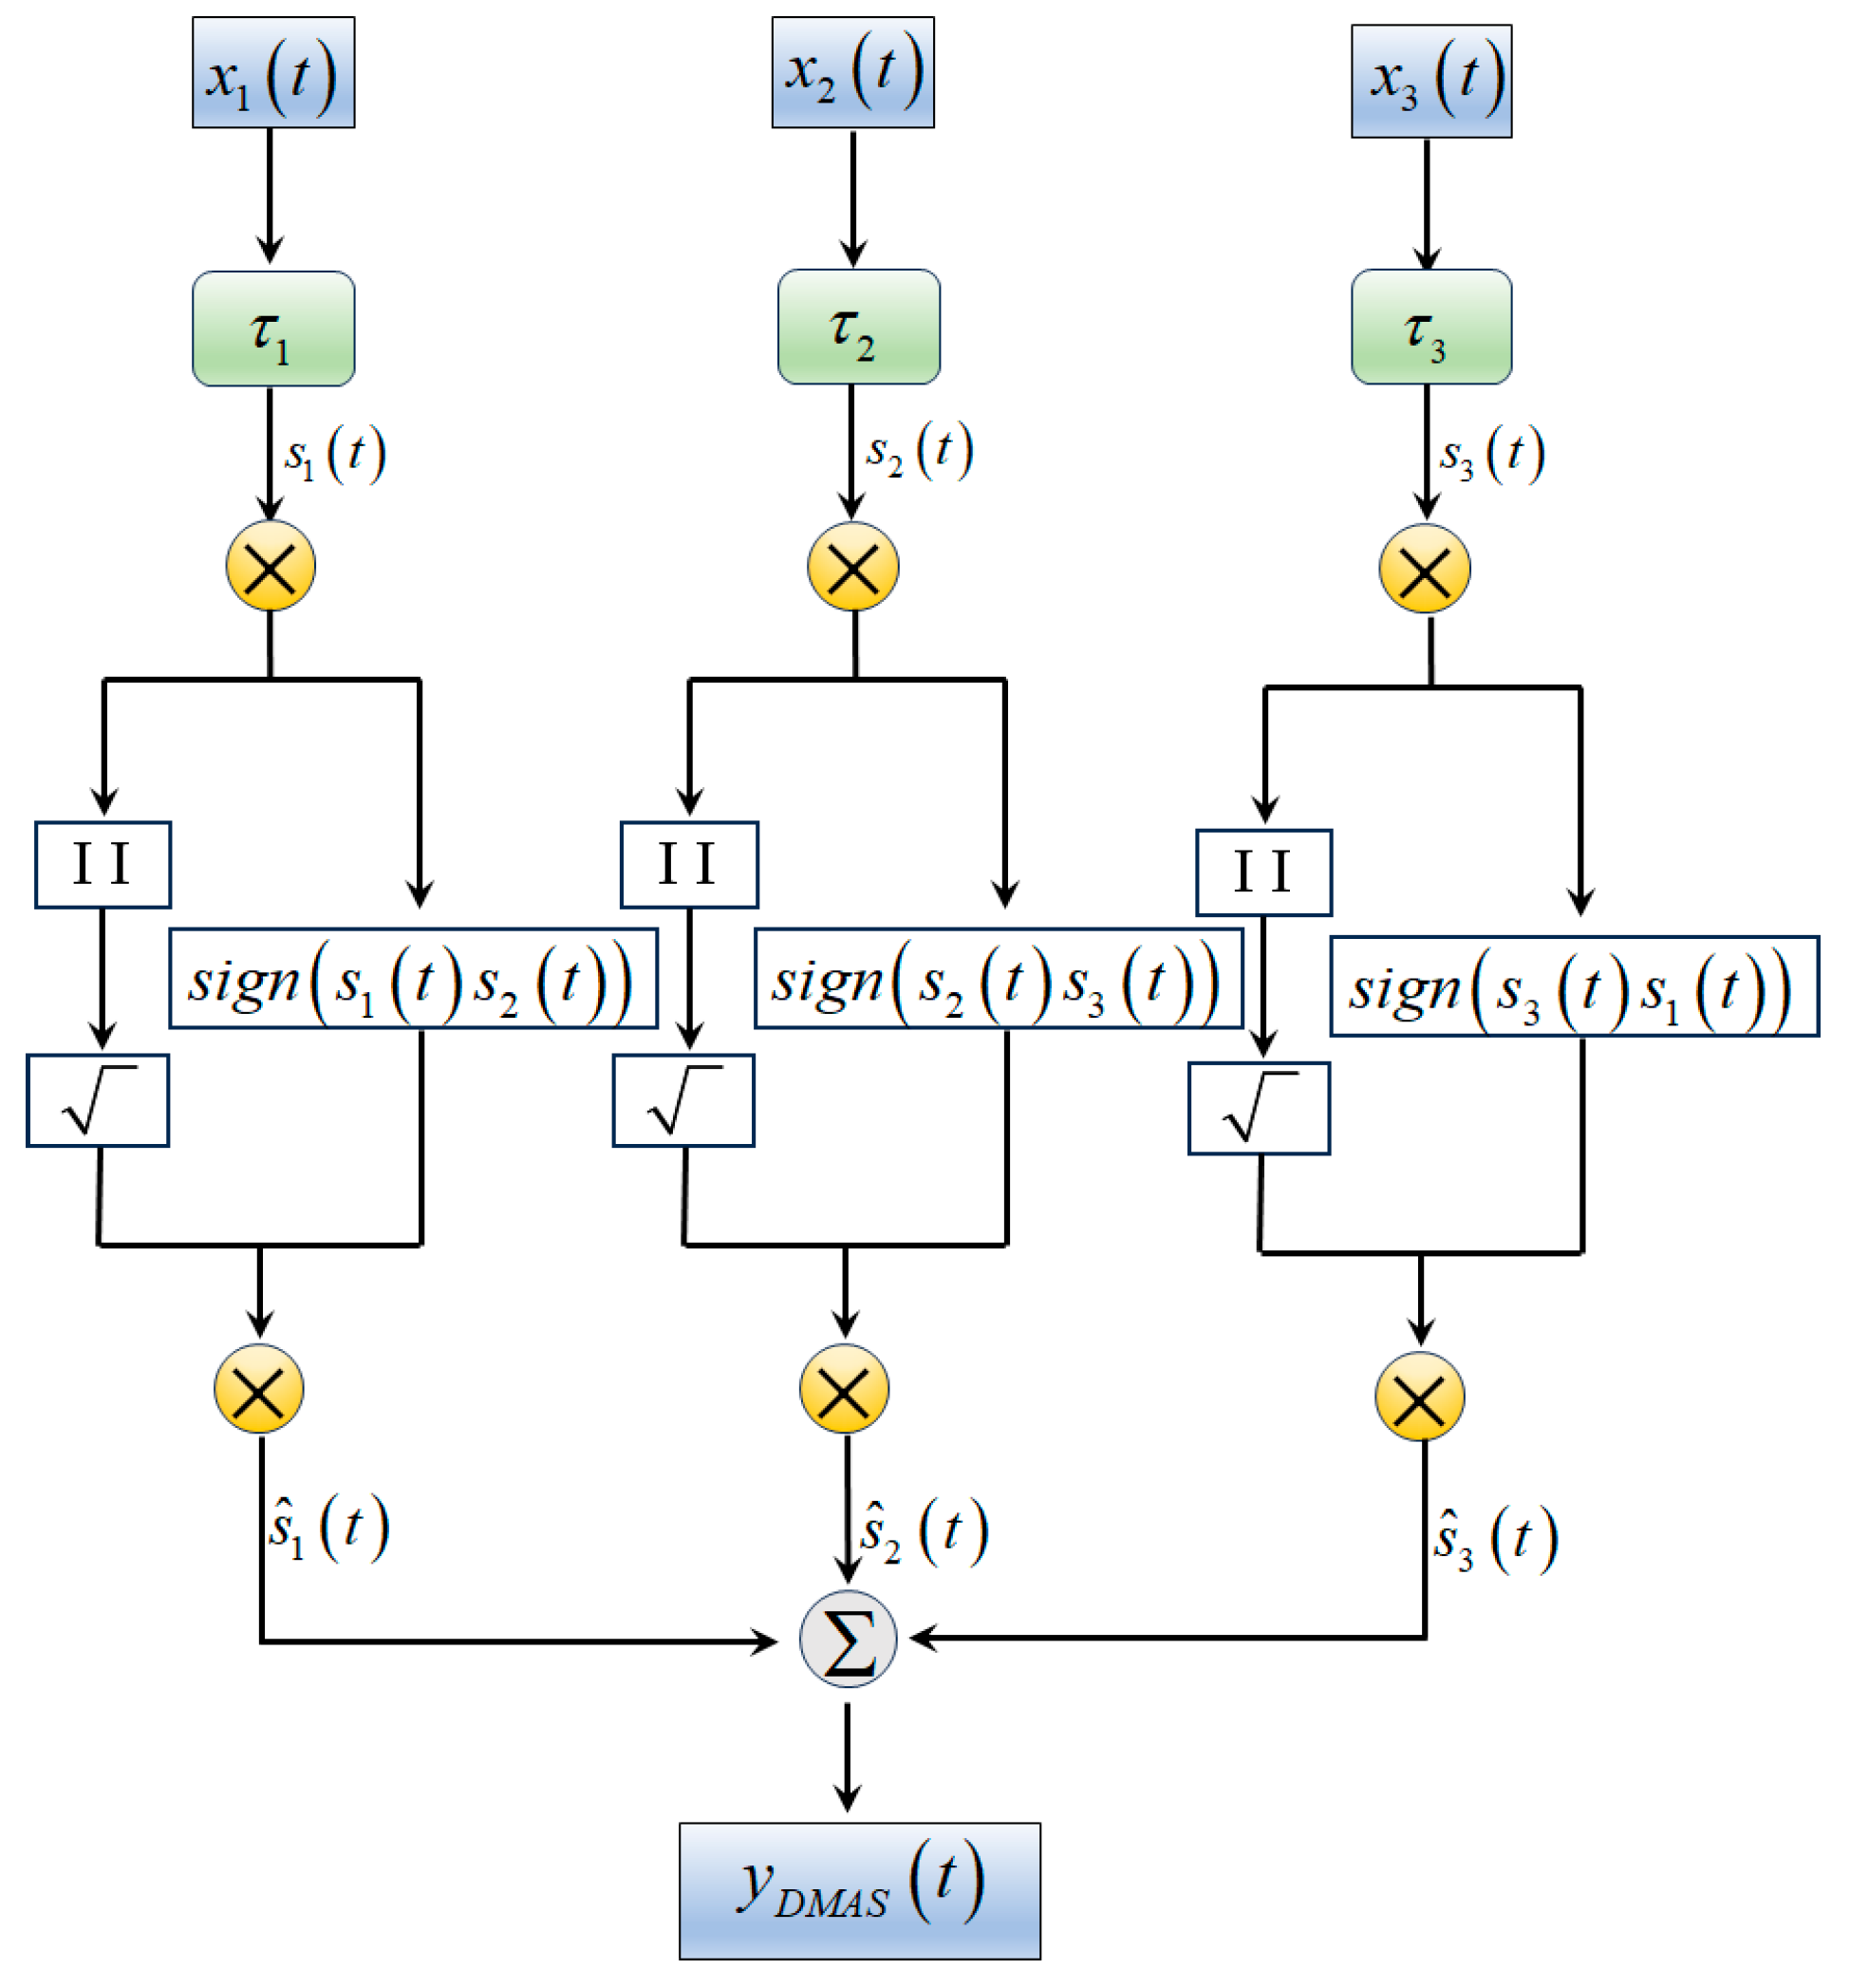
is processed by the sign square root to generate a set of equivalent RF signals. Then, the spatial correlation of the signal is enhanced by cross-multiplication and accumulation operations.
After the signal focus/delay phase, the following procedure is used to implement DMAS [
8]. First, the signed square root is applied to the realigned RF signal
, and then combined coupling, multiplication, and summing are performed. In practice, it is like calculating a new set of ‘equivalent RF signals’ whose amplification has been rescaled before entering the multiplication phase.
Hence, the DMAS beam-formed signal is given by the following:
In reference [
9], this operation is similar to interpreting the aperture spatial auto-correlation, with the exception that it utilizes a new set of RF signals (12) in the calculations. It excludes the consideration of auto-products where n equals m and employs each signal pair only once (i.e.,
and not
). Additionally, the multiplication stage alters the frequency content of the output signal
. The procedure for implementing DMAS is outlined as depicted in
Figure 2, which illustrates the DMAS beam-forming process.
In reference [
9], this operation is equivalent to the aperture spatial auto-correlation being interpreted, except for the fact that the new set of RF signals (12) is employed in the calculation, the auto products (n = m) are not considered, and each signal couple is used only once (i.e.,
and not
). As the multiplication stage also changes the frequency content of the output signal
, the following procedure is used to implement DMAS, as shown in
Figure 2 in a DMAS beam-forming schematic.
This method achieves improved lateral resolution by effectively utilizing a broader aperture and doubling the central frequency. The use of cross-correlation in this process contributes to reduced side lobes and enhanced contrast resolution. Additionally, this approach enhances the suppression of uncorrelated noise.
To create the desired B-mode images, the focusing and beam-forming procedures are applied repeatedly for each scan line. Following this, the image lines undergo demodulation using the Hilbert transform. Each image is then normalized based on its maximum value, subjected to logarithmic compression, interpolated for smoothness, and prepared for display.
The described operation allows several advantages to be realized compared to the SAFT before the combination:
- (1)
The images have a higher lateral resolution, since it is as if a wider aperture has been employed (the auto-correlation has 2N-1 coefficients) and the central frequency has doubled;
- (2)
The side lobes are lowered thanks to the cross-correlation (i.e., couple and multiply) stage, which produces a higher contrast resolution, and the DMAS improves the performance of the SAFT by reducing the side lobes and raster lobes, still retaining a near-row main lobe; as a result, the image shows higher sharpness and contrast.
- (3)
For the same reason, uncorrelated noise is rejected better.
To generate the desired B-mode images, the focusing and beam-forming (i.e., DMAS) processing steps are repeated for each scan line, and then the image lines are demodulated by applying the Hilbert transform. Each image is normalized to its maximum value, logarithmically compressed, interpolated, and finally displayed.
3. Simulation Model and Imaging Results
3.1. Determination of Materials and Basic Parameters
The model in this paper was built using finite element software to solve for the A-scan signals obtained with multiple sensor combinations and stored. The acquired signal numerical matrix was substituted into the prepared algorithm of the SAFT reconstruction combined with DMAS, and finally, the concrete defect imaging results were obtained.
Table 1 presents the material parameters used in both the simulation and experiments. The density and elastic modulus values were selected based on typical ranges reported in the literature and calibrated using preliminary ultrasonic pulse velocity tests. A 500 kHz double crystal probe was selected for the probe, which is capable of sending and receiving; the specimen size was 240 mm × 300 mm × 100 mm; the selected defect diameters were 10 mm and 20 mm; and the defect property was air.
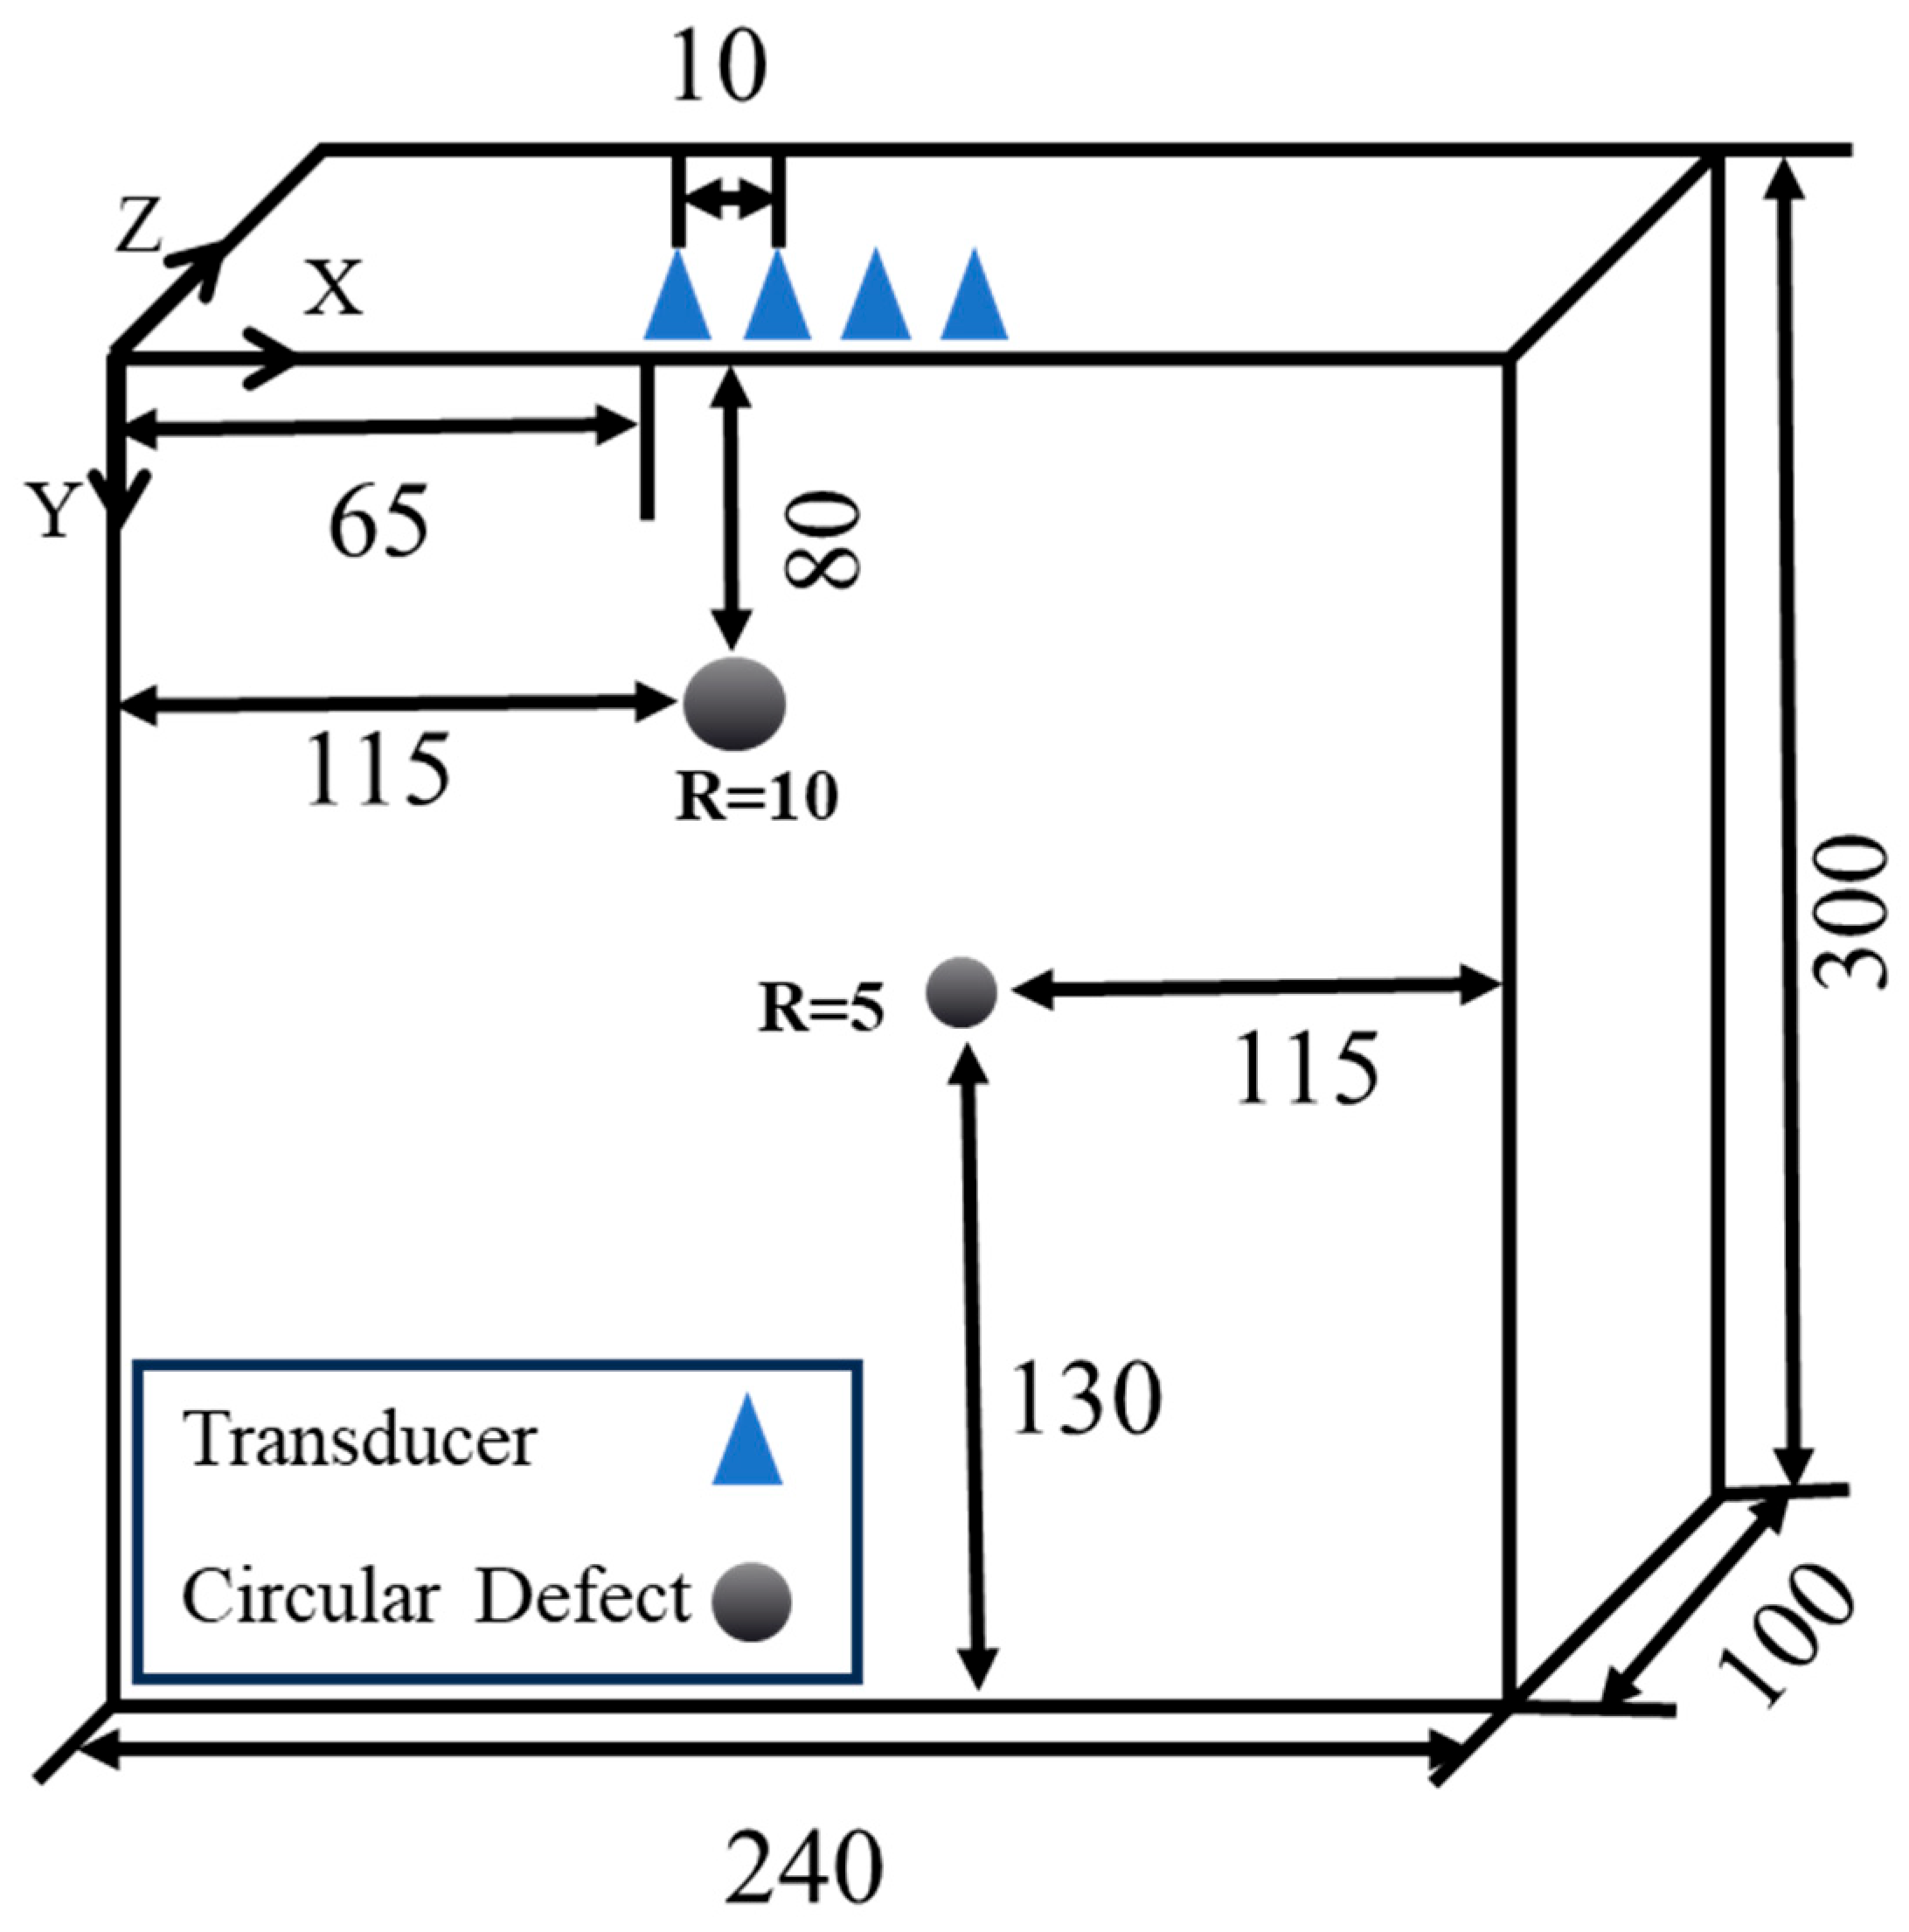
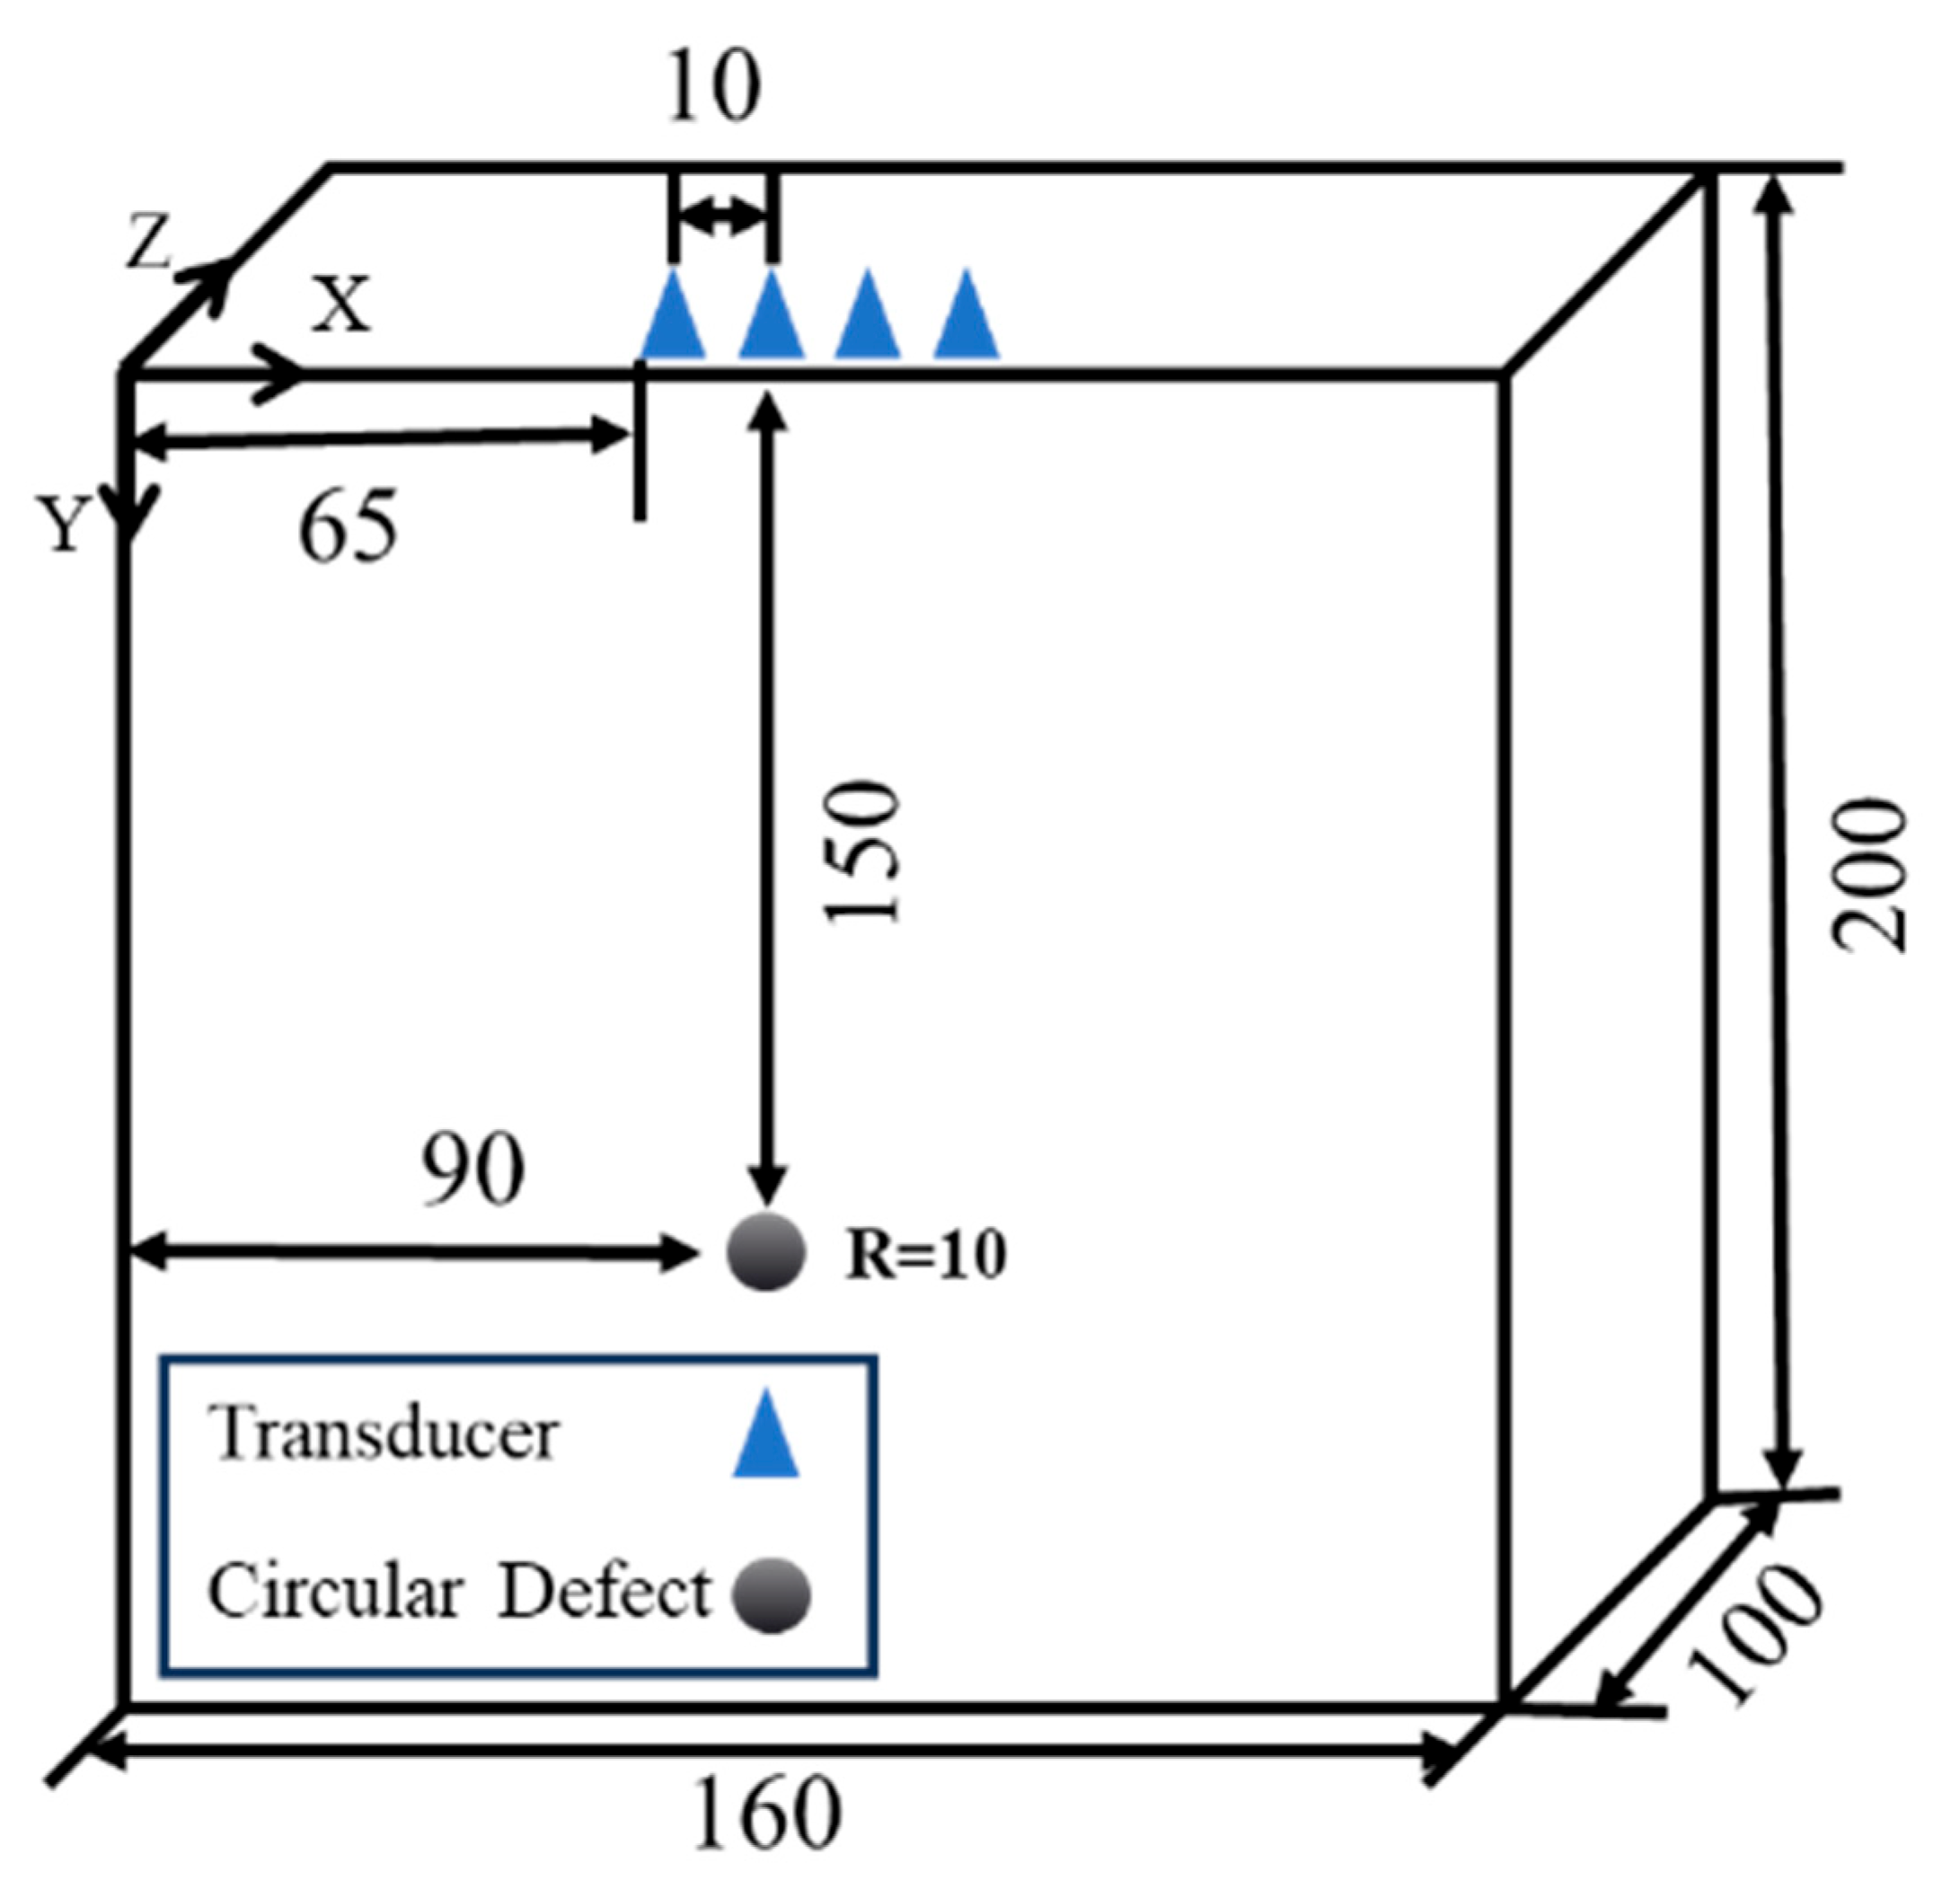
3.2. Sensors and Defect Arrangement
A sensor was arranged every 10 mm along the center line of the upper surface of the concrete specimen, with a total of four used, in the simulation process, and the location of their arrangement was for a linear point set. In order to ensure that the detection signal inside the detection area would be received before the echo signal acquisition deadline, and that the signal outside the area would not collected as much as possible, the sensors at both ends of the structure were 65 mm away from the left and right boundaries, which met the requirement of the signal inside the detection area not being disturbed by the side boundaries, i.e., an infinite boundary was constructed. In order to highlight the response at the defect, the same defect was added at a symmetrical position along the scan line, and the signal amplitude at the defect position was increased compared to other positions in the detection area. The defect arrangement is shown in
Figure 3 and
Figure 4, and the defect in Experiment 1 was arranged at a distance of 100 mm from the sensor scan line. In Experiment 2, defect 1 was arranged at 80 mm from the sensor and defect 2 was arranged at 170 mm from the sensor. These two experiments were designed to evaluate the algorithm’s performance across different depths and reflect the typical range of defect sizes encountered in engineering concrete structures.
3.3. Analysis of Finite Element Simulation Results
A detection area of 60 mm × 200 mm was set, an excitation signal was used, and four groups of 12 defective concrete specimen A-scan data were obtained. The signal with the greatest amplitude was the straight-through wave response. The arrival time of the 12 through-wave signals was collected, and the wave velocity of the ultrasonic wave in Experiment 1 was calculated to be about 3100.25 m/s in combination with the least-squares method, while that of the ultrasonic wave in Experiment 2 was about 3040.4 m/s. This also verified the feasibility and accuracy of ultrasonic wave velocity prediction based on the least-squares method.
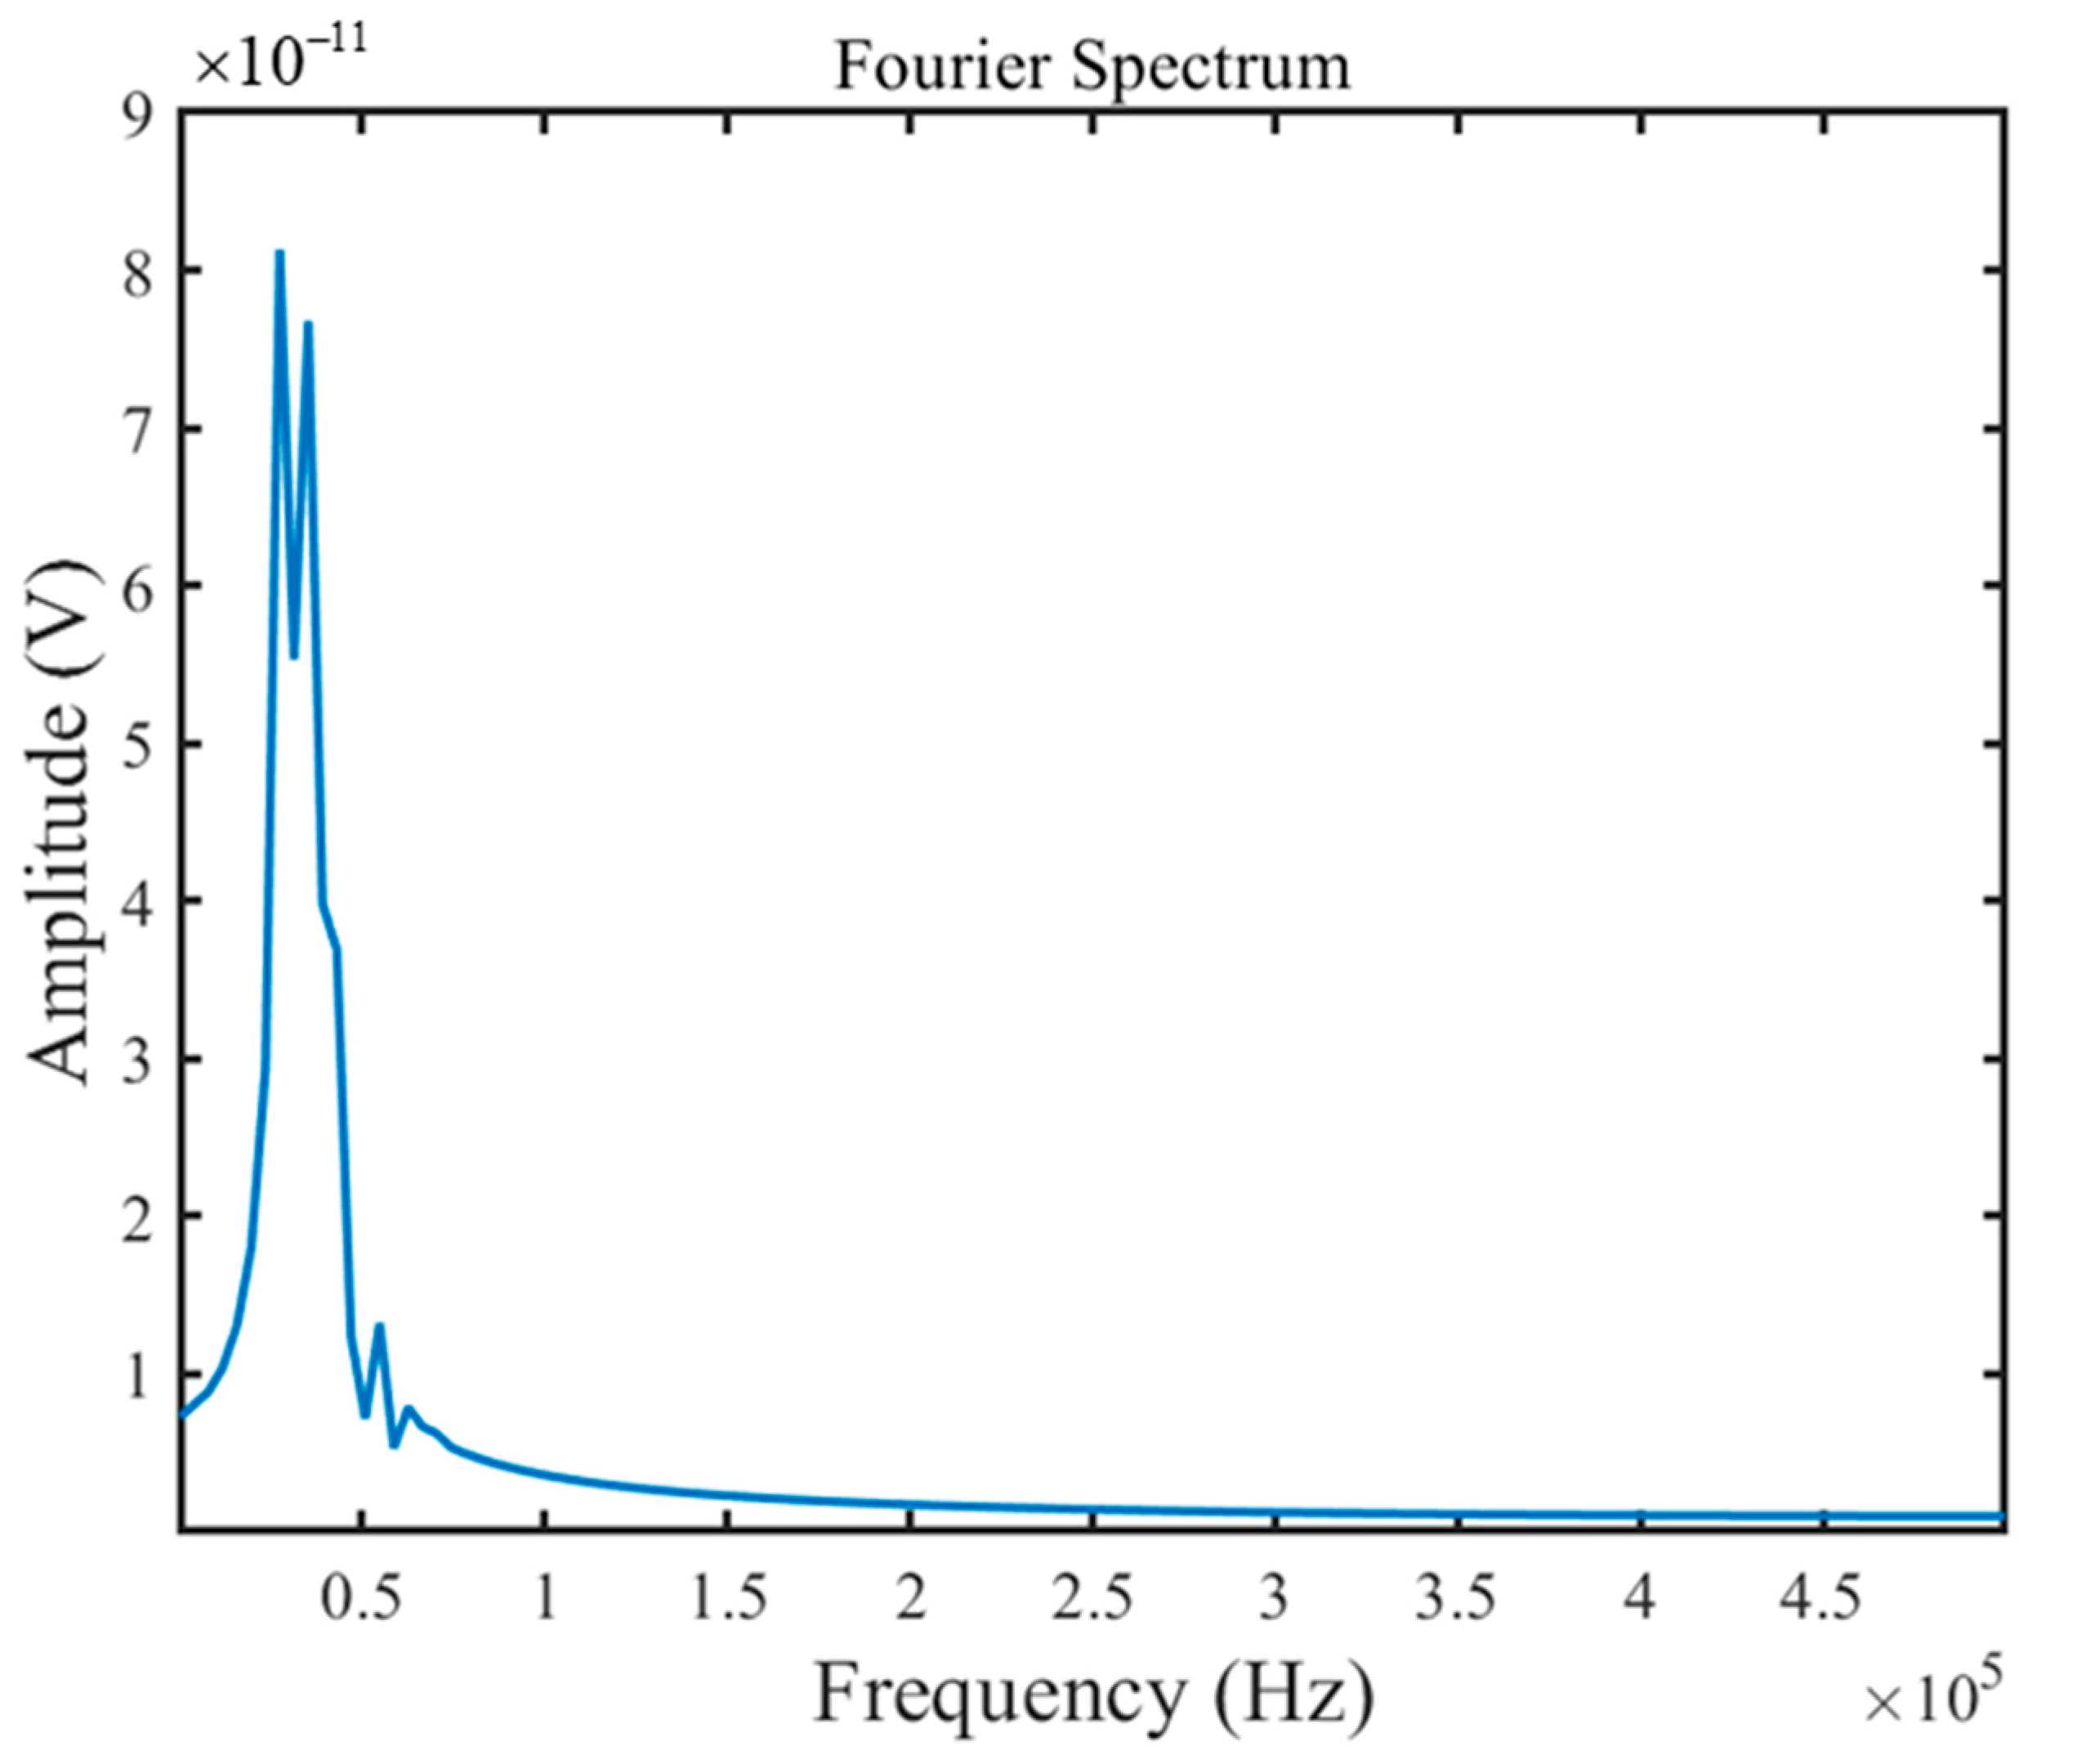
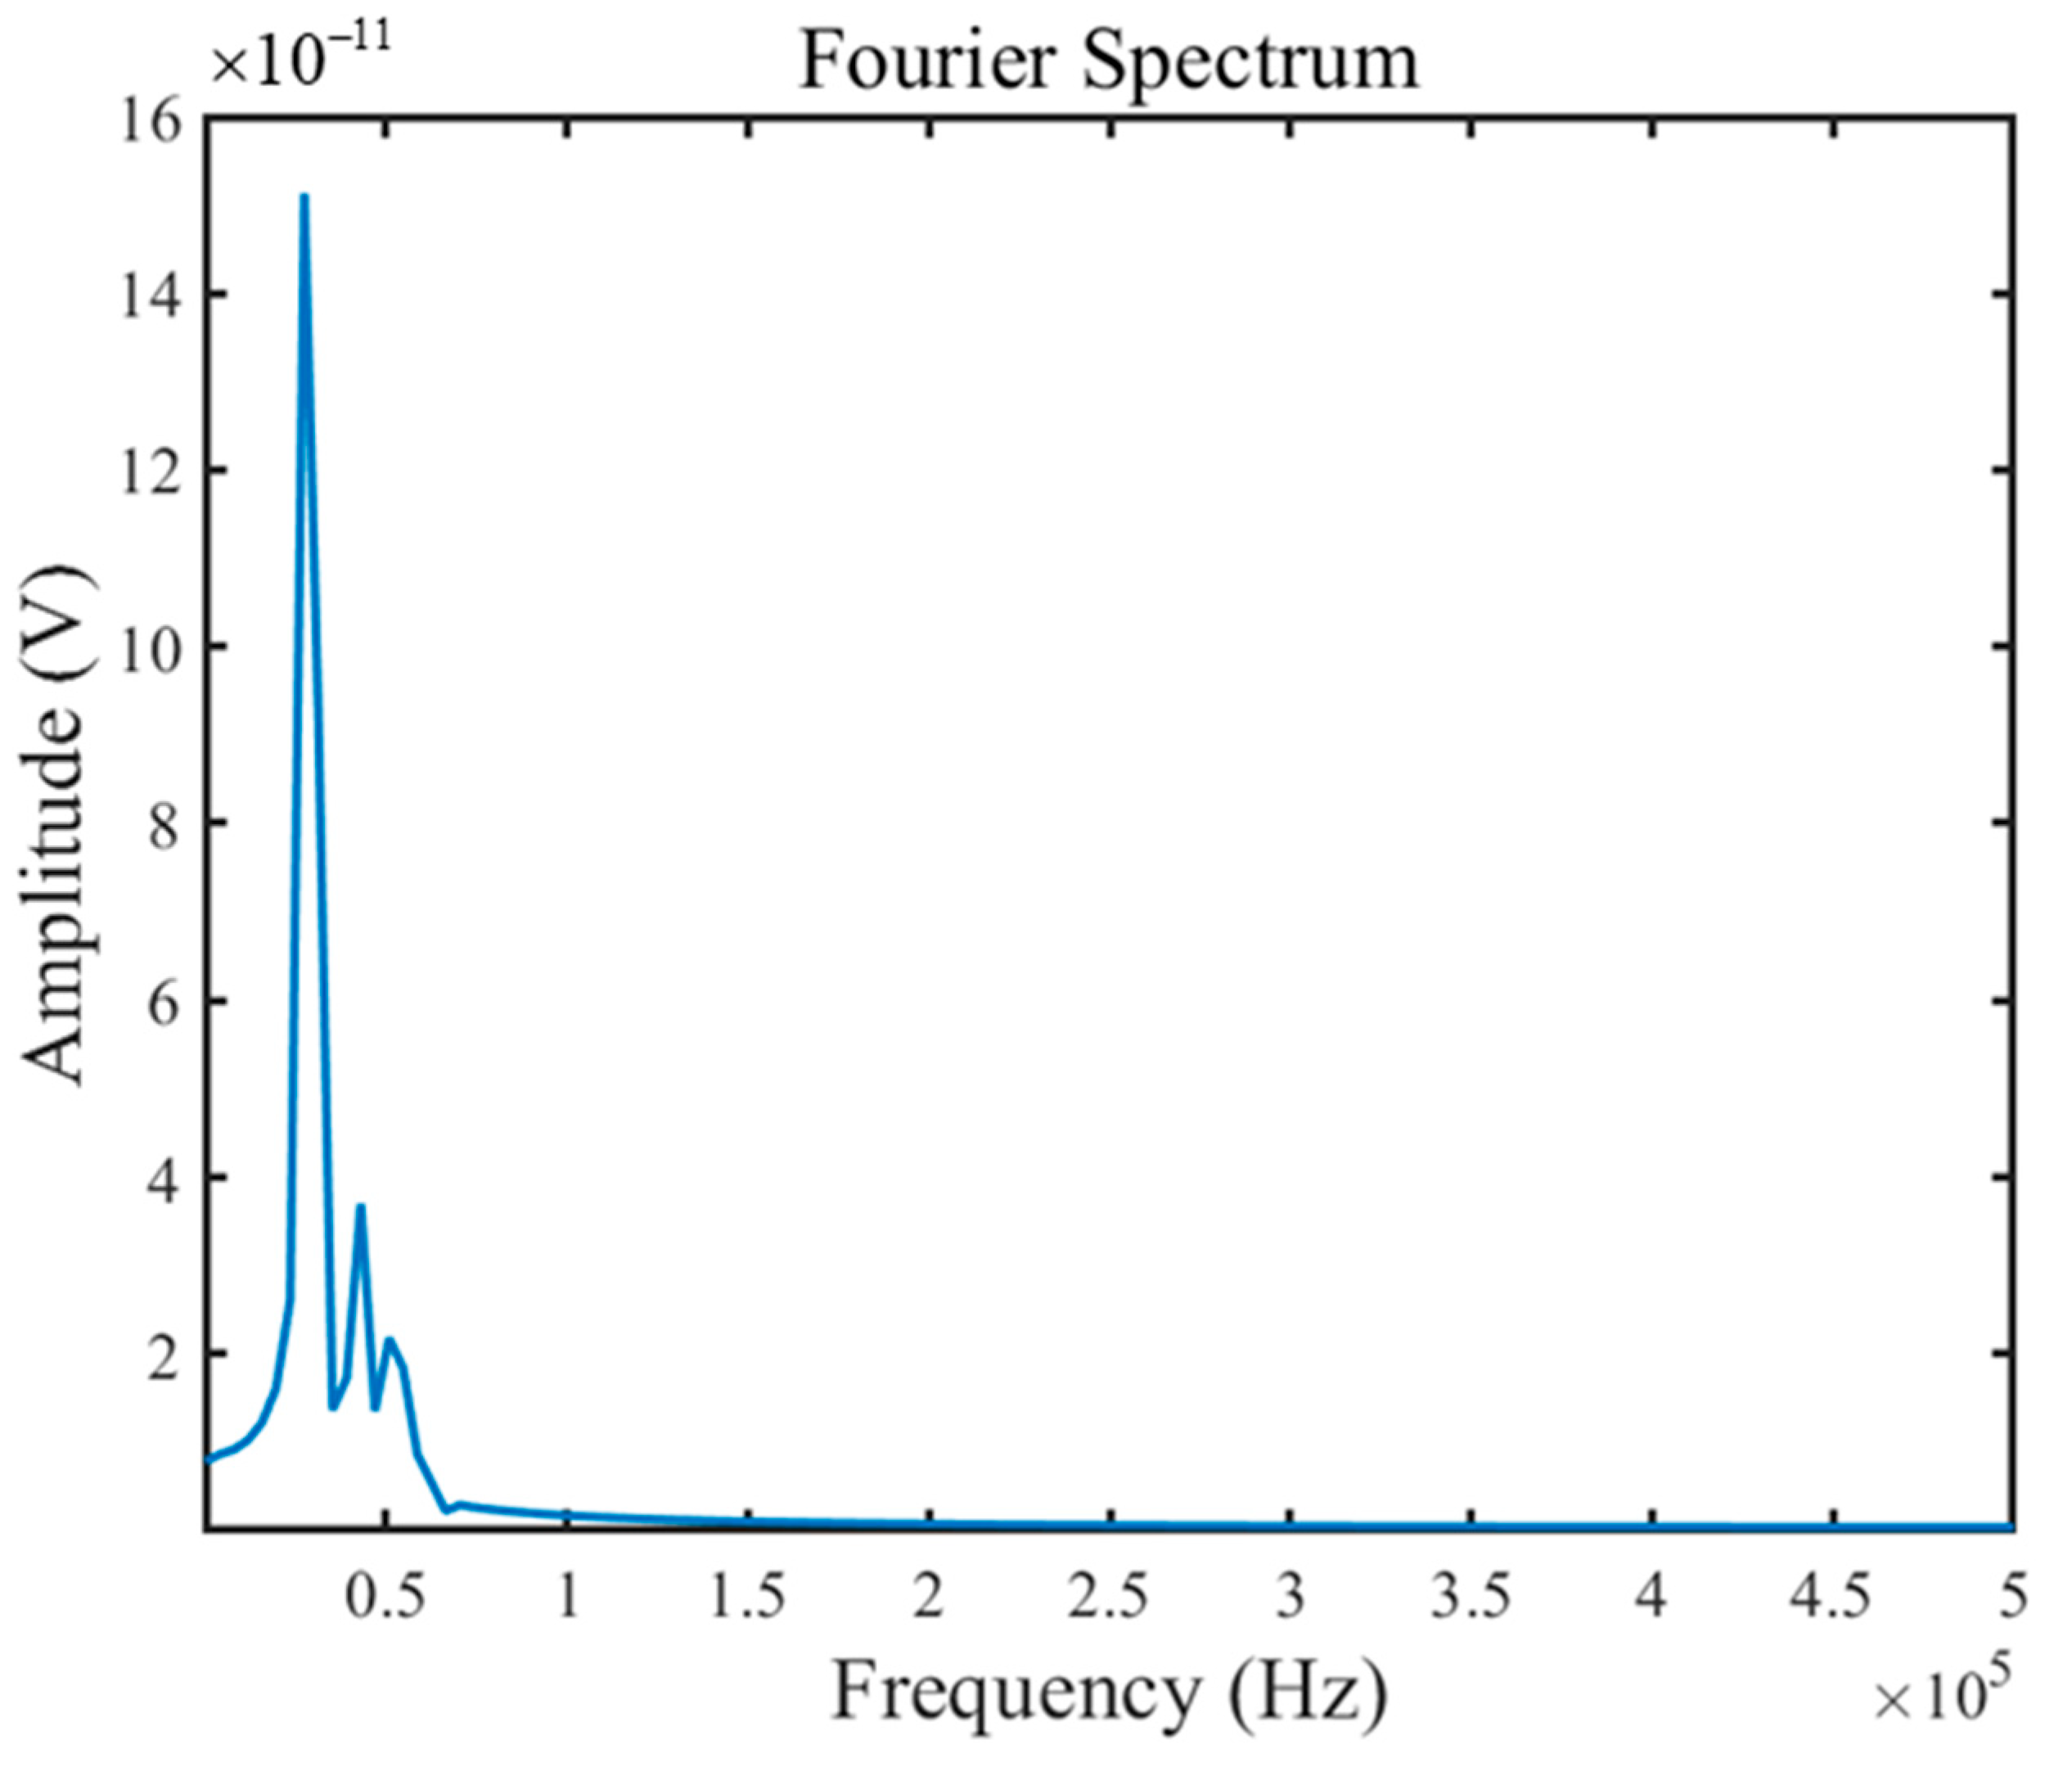
It was difficult to extract the data of the defective signal by analyzing the amplitude situation of the signal alone. After removing the straight-through wave response, the Fourier transform was used for the first signal in Experiment 1 and Experiment 2, and the frequency domain distribution of the defect response was obtained, as shown in
Figure 5 and
Figure 6. It can be seen that the frequency of the defect echo signal is concentrated within 50 Hz. Accordingly, a suitable elliptic filter was used for further extraction of the defect signal.
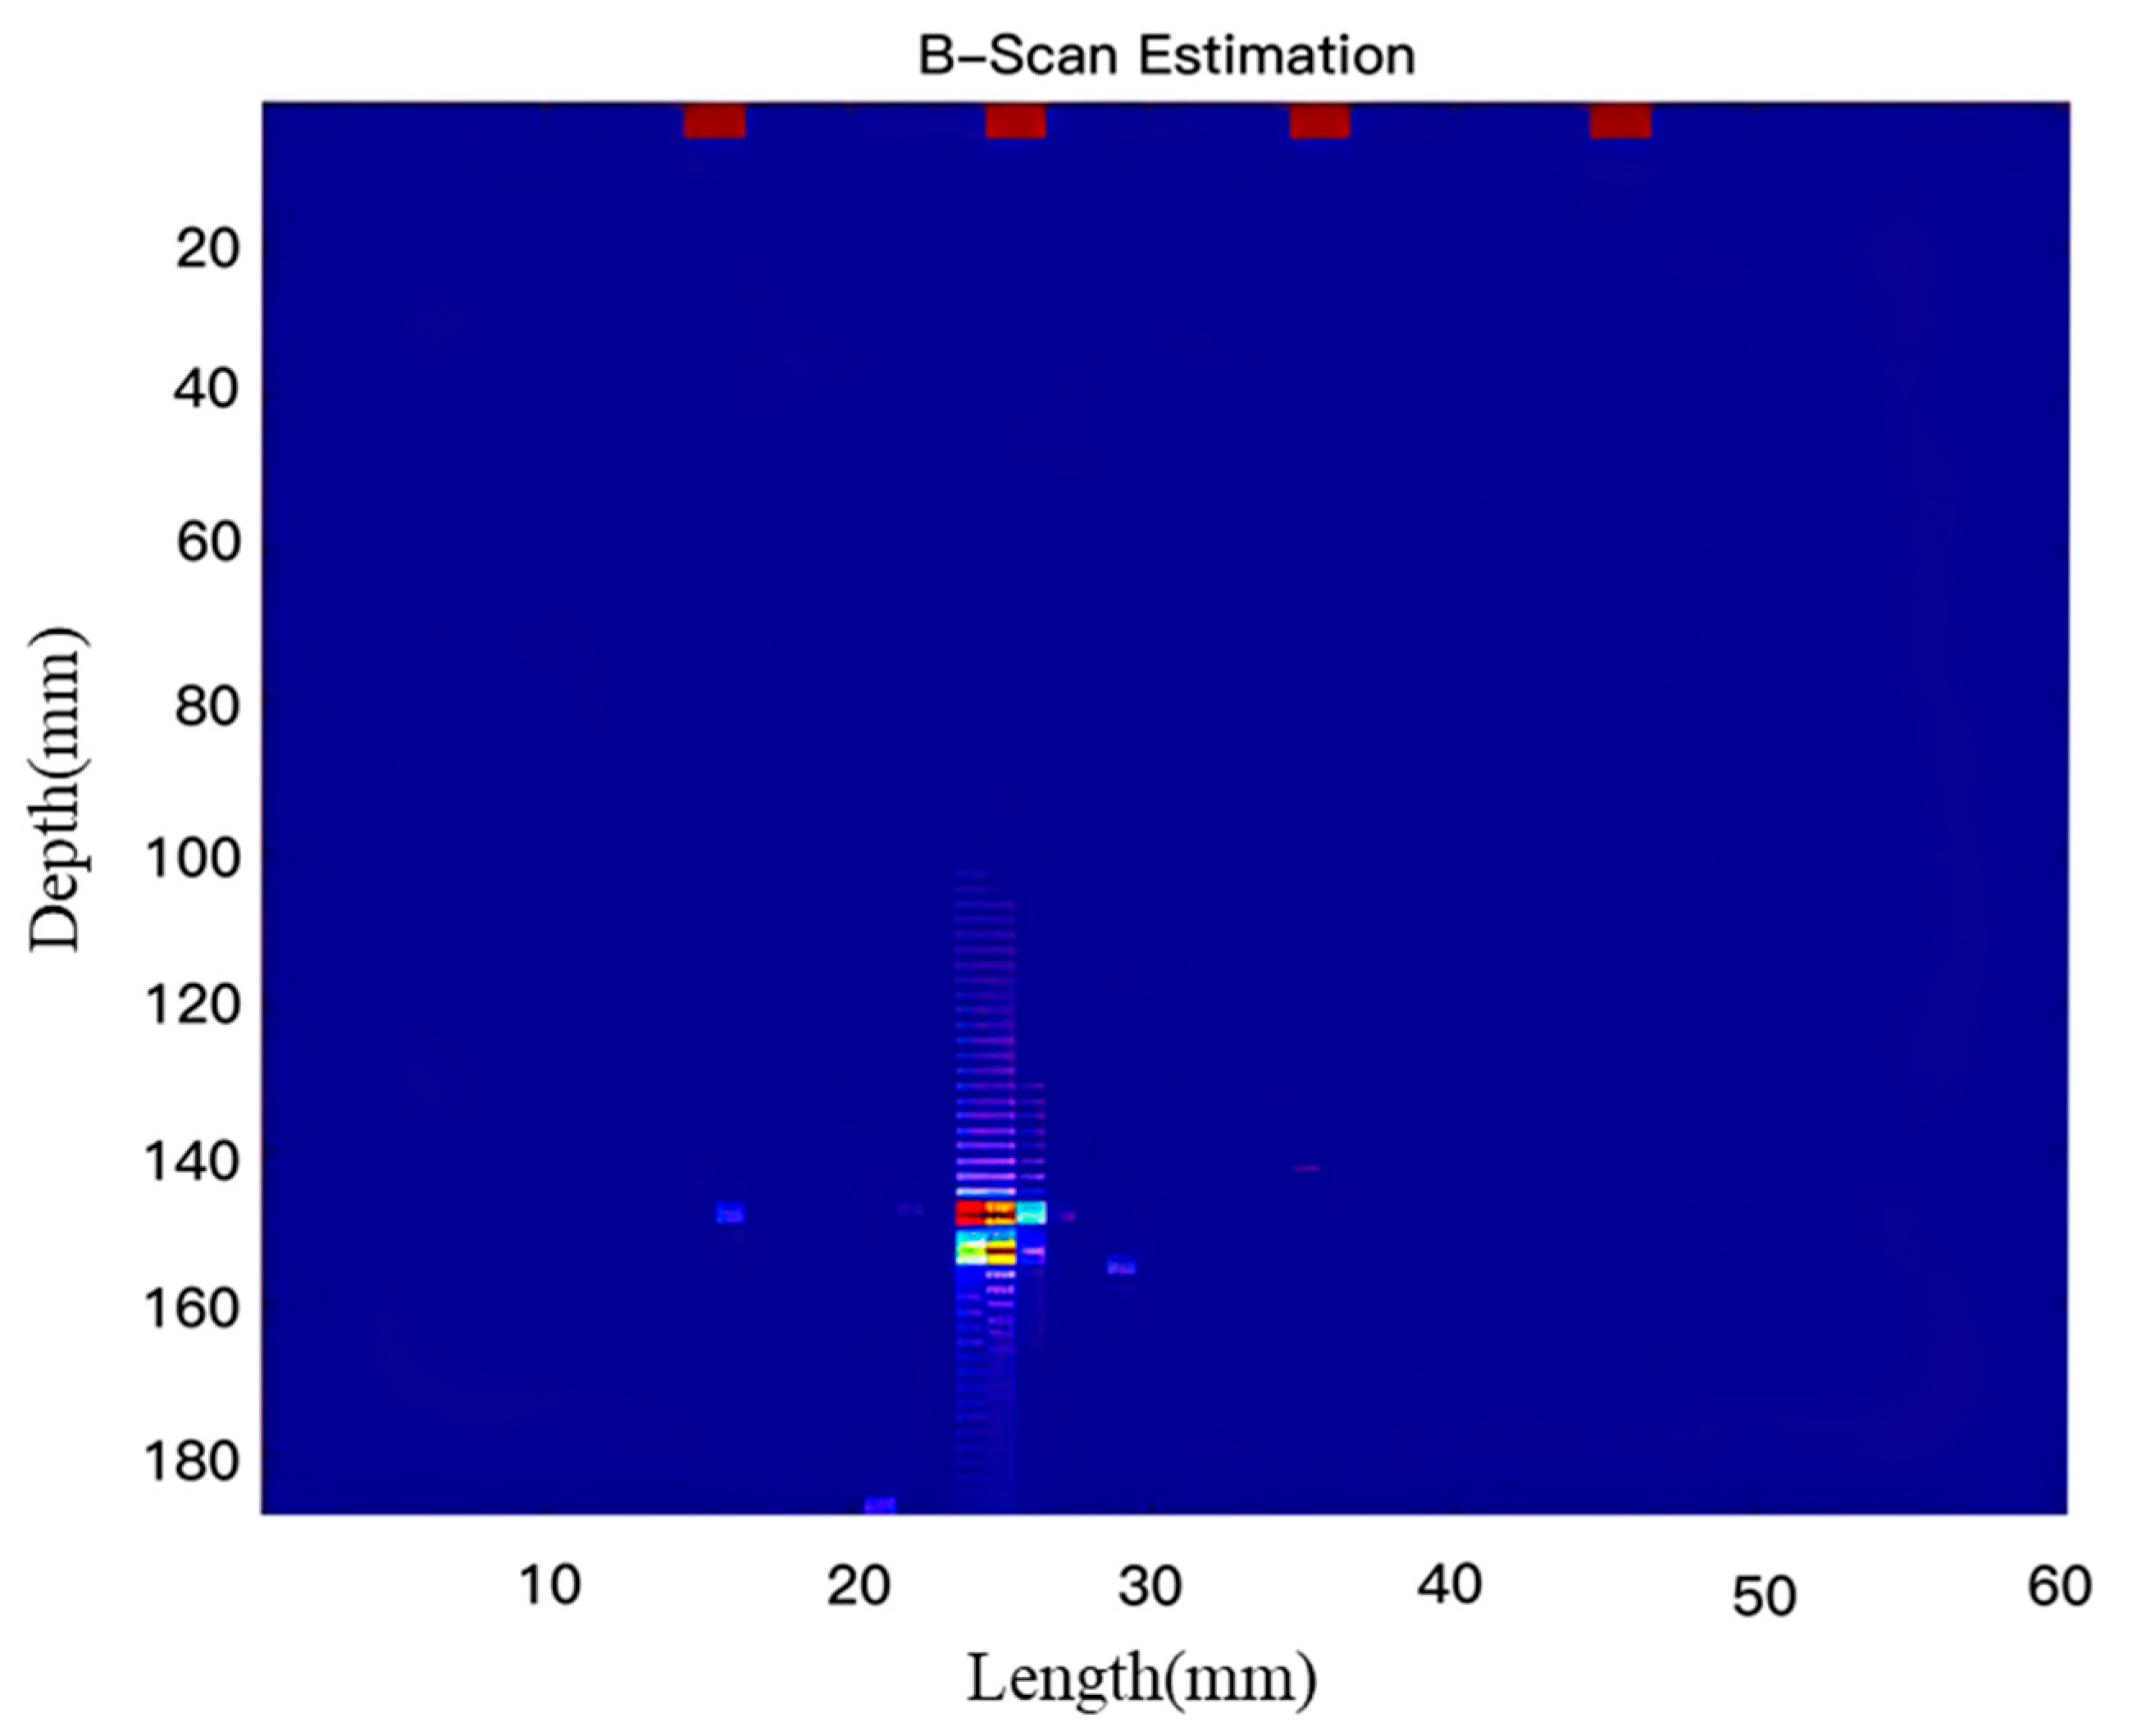
Twelve single signals were obtained and improved to obtain a numerical matrix of only defective signals, while the numerical matrix for the sensor distribution was calculated, and all data were run in turn by substituting them into the compatible synthetic aperture focusing algorithm. The imaging results were obtained by performing an RGB display for each cell, according to the different signal amplitude magnitudes in the detection area. The imaging results for Experiment 1 and Experiment 2 are shown in
Figure 7 and
Figure 8. The top dark-red squares in the figure are the sensor arrays, and this imaging only shows the results for the local area on the midline side of the concrete specimen.
As seen from the imaging results, the vertical distance between the energy enhancement and the scanning array in the scanned image of defective concrete specimen B in Experiment 1 is close to 100 mm, and the vertical distance between the energy enhancement and the scanning array in the scanned image of defective concrete specimen B in Experiment 2 is close to 80 mm and 170 mm. However, the recognition of defects in the transverse dimension is relatively low, which we guess is due to the fact that the size of the synthetic aperture is still small compared to the defect size, and this problem will be the focus of our subsequent research. In summary, finite element simulation using the synthetic aperture focusing technique and DMAS beam-forming for imaging defects in concrete specimens is feasible, and has a good defect recognition effect.
3.4. Comparison with SAFT Imaging Results
To determine whether the imaging results were improved after the DMAS-enhanced SAFT was incorporated, a model (Experiment 3) was specially set up to verify its necessity. As shown in
Figure 9, in order to avoid the reflection effect of the wave on the upper boundary, a distance of 1 mm from the upper end-face was taken as the position of the linear array of the sensor. The detection range was a 60 mm × 200 mm rectangular area. The defect depth was 150 mm. Considering that if the defect was too large, it would block the underlying signal, and if it was too small, diffraction would occur, the defect diameter was selected to be 10 mm.
Figure 10 shows the images of circular air defects obtained by imaging solely using the SAFT (synthetic aperture focusing technique). The red spot areas in the figure represent the locations of the detected defects. Moreover, the positions of these spots in the figure are basically consistent with the actual depth and lateral positions, allowing for a relatively clear observation of the accurate depth and location of the defects in the concrete structure.
Shown in
Figure 11 is the imaging result obtained after combining the SAFT technology with DMAS. At this time, the detected defect positions are consistent with the actual ones. Compared with using only the SAFT, after DMAS processing, there is no background noise, the contrast is strong, more specific defect positions can be obtained from the image, and the imaging accuracy is also improved. This is because the SAFT actually uses the echo signals detected on the surface of the test block for imaging. These echo signals are generated when the excited ultrasonic waves are scattered or reflected at the concrete defects. Part of the sound waves are diffracted after encountering circular cavity defects, and will be scattered at the bottom of the defects. After DMAS processing, the irrelevant echo signals are filtered out, and the spatial auto-correlation is enhanced, thus obtaining more specific imaging results.
The spot area looks darker under DMAS, and the boundary of the shallower spot area is clearer. Compared with the case of the SAFT, the speckle pattern is finer; this effect can be expected, because the main leaf of the DMAS spot pattern is narrower. In general, the SAFT image looks a little darker because the contribution of the side lobes is reduced, and the presence of the side lobes is important in the SAFT image. For similar reasons, in the DMAS image, the signal-to-noise ratio of the received signal is very low in the area with high depth, so many dark areas appear in the background spots where the clutter is suppressed by DMAS. This averaging improves the image quality, especially in the area with high depth. Compared with the synthetic aperture technique, the imaging contrast is improved by about 40% after DMAS processing.
4. Experiment Design
4.1. Experimental Materials
Experiments were conducted to validate the effectiveness of the proposed DMAS-enhanced SAFT algorithm under controlled and realistic conditions. Three concrete specimens were fabricated, each representing a combination of strength grade, defect type, and defect depth. The experiments included two main phases: (1) specimen preparation and embedded defect setup; and (2) ultrasonic testing using a full-matrix transducer configuration. The parameters were selected to reflect common conditions in reinforced concrete structures, and to allow for a comparative evaluation of imaging performance under varied scenarios.
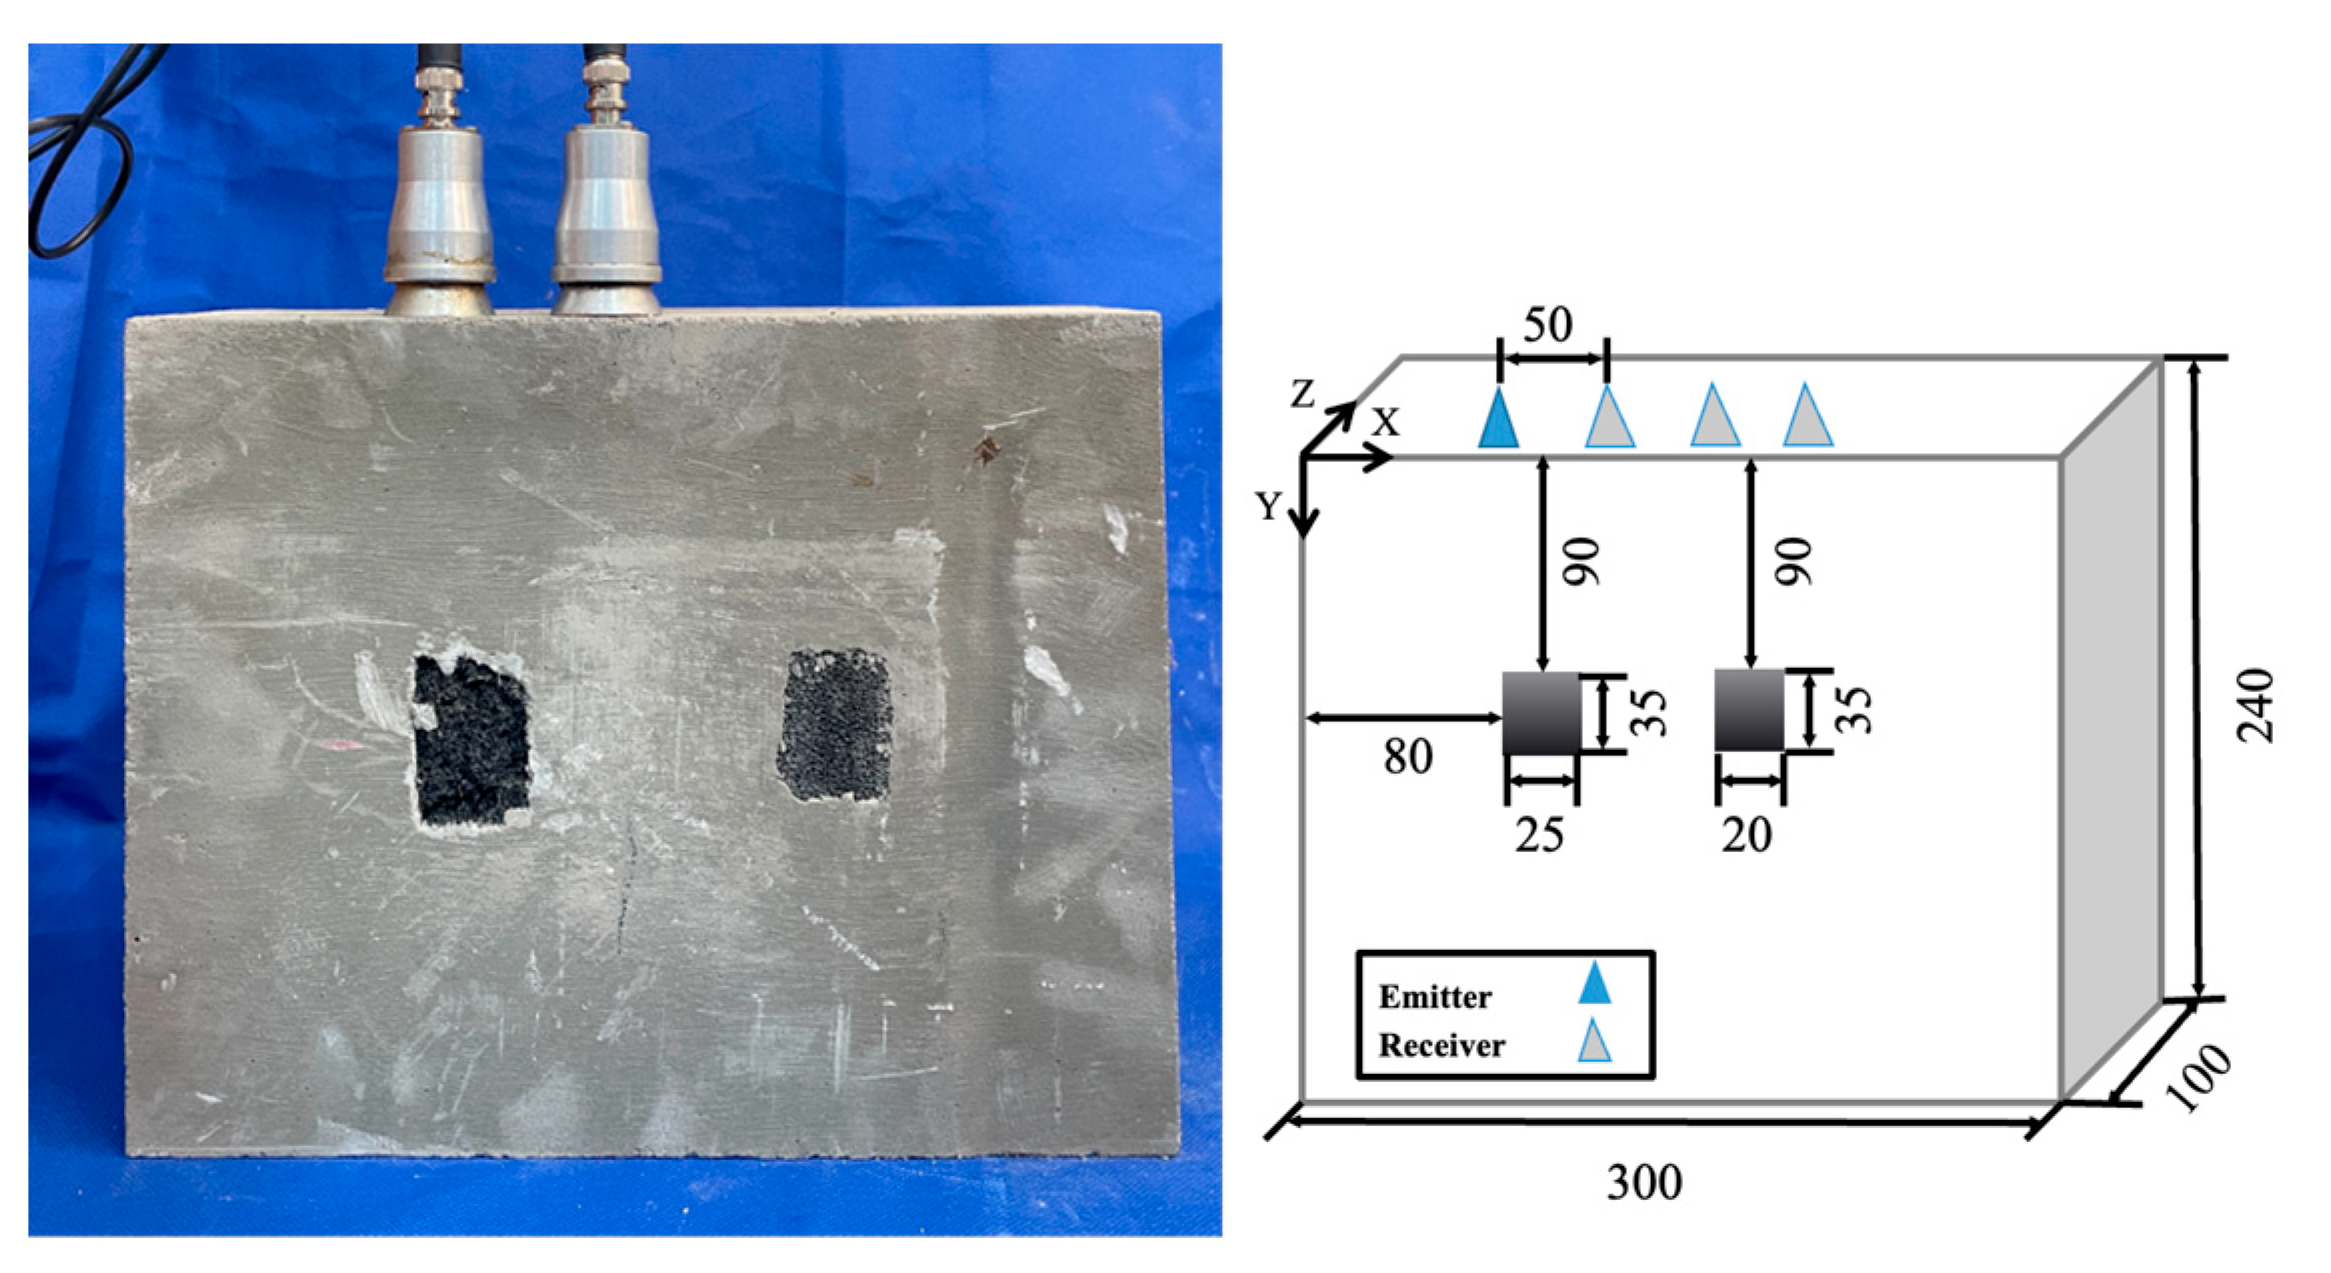
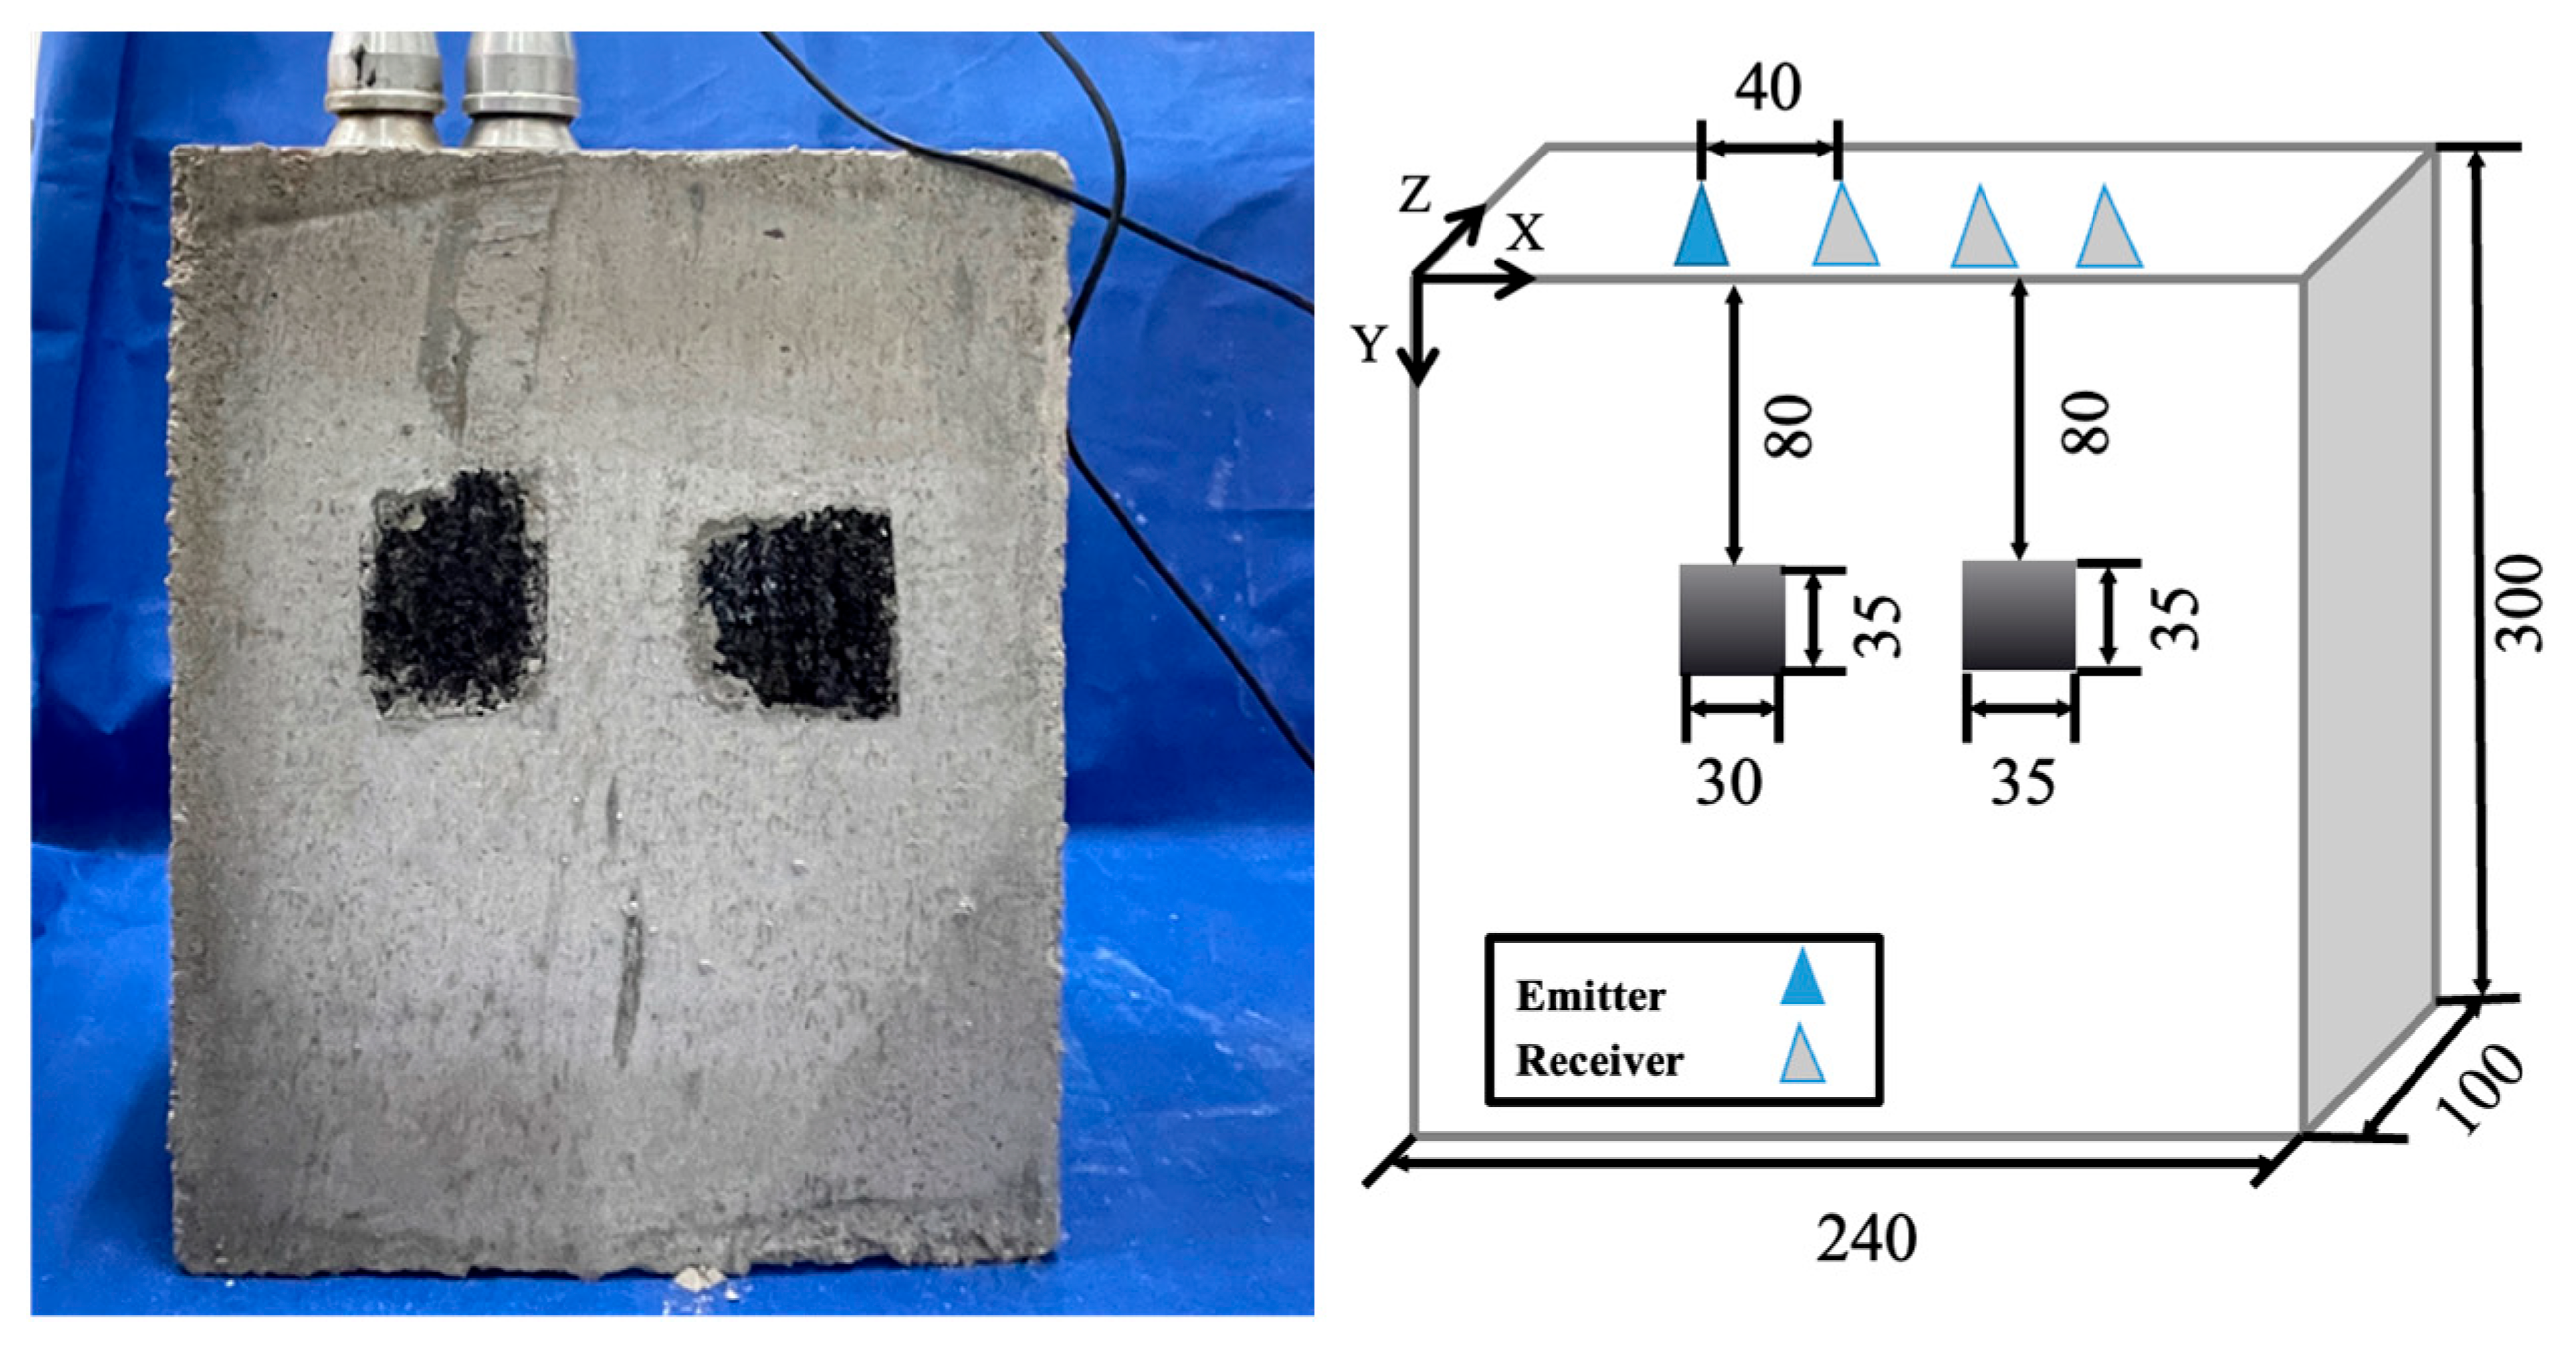
In this test, one rectangular concrete test block of strength C45, with dimensions of 300 mm × 240 mm × 100 mm, was made with ordinary silicate cement, water, gravel as coarse aggregate, and yellow sand as fine aggregate as raw materials, in the ratio of cement:stone:sand:water = 1.00:0.50:1.00:0.34, and two prefabricated foam blocks with a cross-sectional area size of 45 mm × 30 mm were included. The test block size and placement were as shown in
Figure 12.
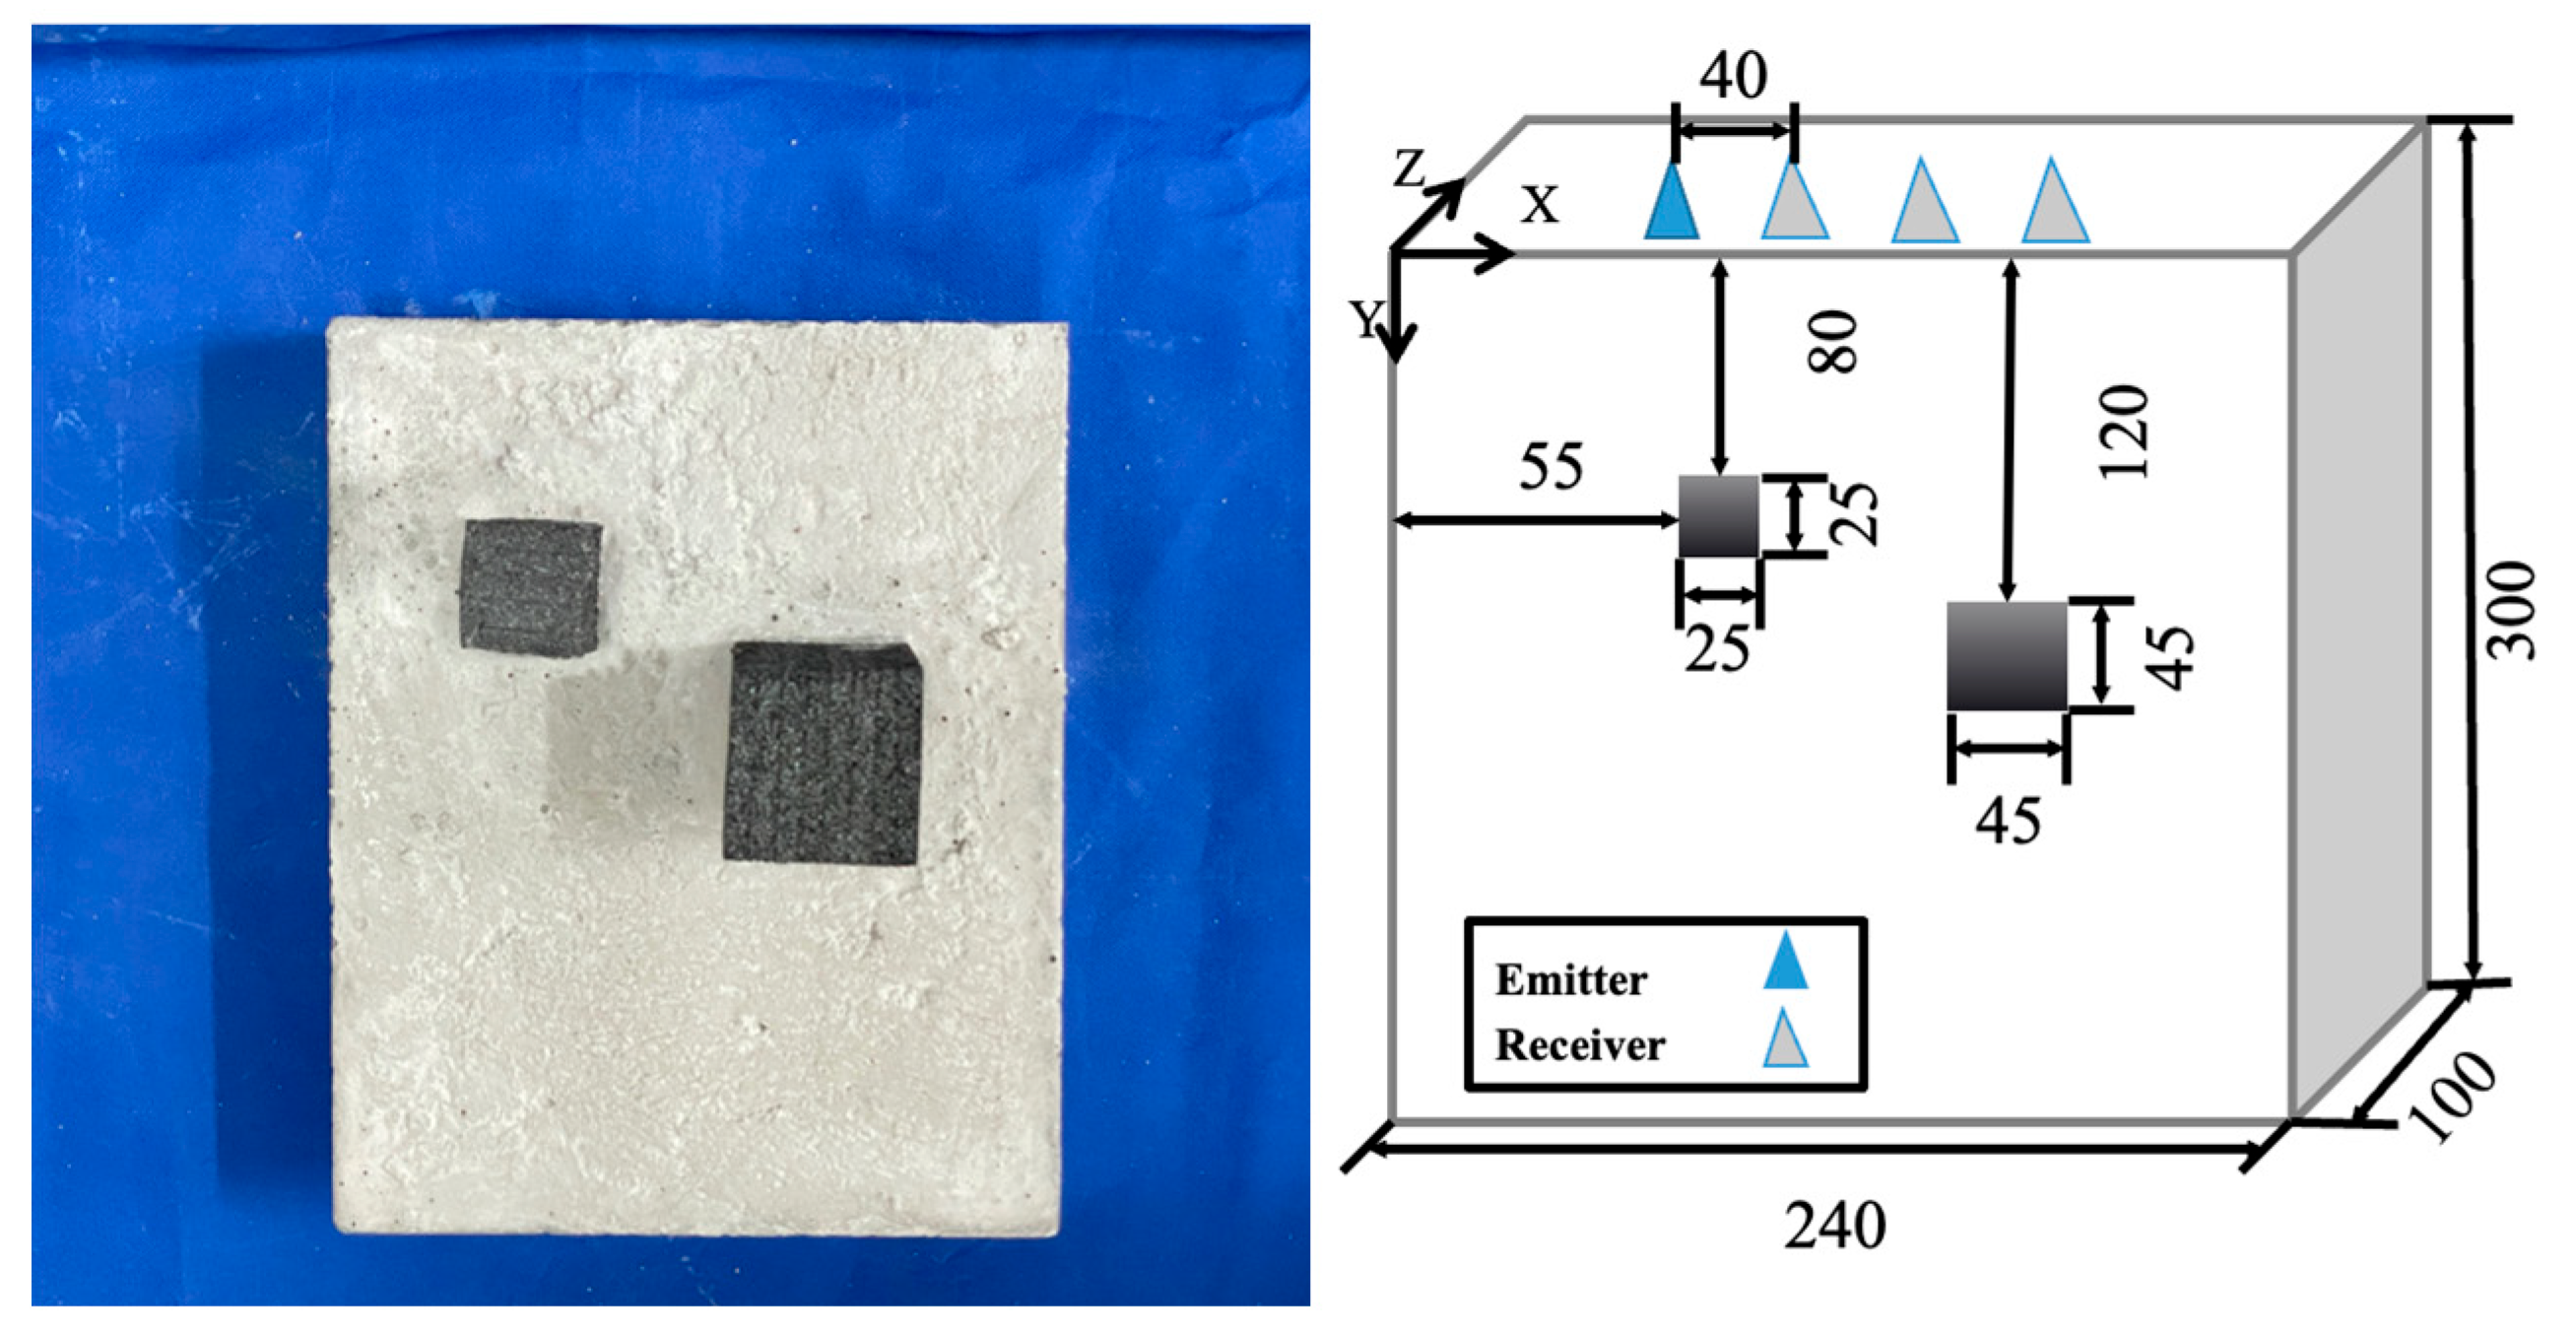
Two more concrete test blocks, test block b and test block c, were made with ordinary silicate cement, water, and yellow sand as fine aggregate as raw materials in a ratio of cement:sand:water = 1.00:3.00:0.40. They had a strength of C30 and rectangular dimensions of 300 mm × 240 mm × 100 mm. They each contained two prefabricated foam blocks with a cross-sectional area of 45 mm × 30 mm long. The size and placement of the test blocks are shown in
Figure 13 and
Figure 14. Two specimen types were used: high-strength C45 concrete and medium-strength C30 concrete, mixed with standard proportions of Portland cement, sand, gravel, and water. The mixing ratios and curing conditions followed the national standard GB/T 50081-2019.
The selection of three specimens in this study was based on coverage of multiple influencing factors, including concrete strength grades (C30 and C45), defect types (size), and defect depths (80 mm to 120 mm). These parameters were chosen to represent a typical range of conditions encountered in practical concrete structures. While the sample size is limited, the combination of controlled variables, repeated scanning, and full-matrix data acquisition ensures that the results are sufficiently representative for evaluating the proposed imaging method. Further large-scale studies can be pursued in future work to generalize the findings.
4.2. Experimental Procedures
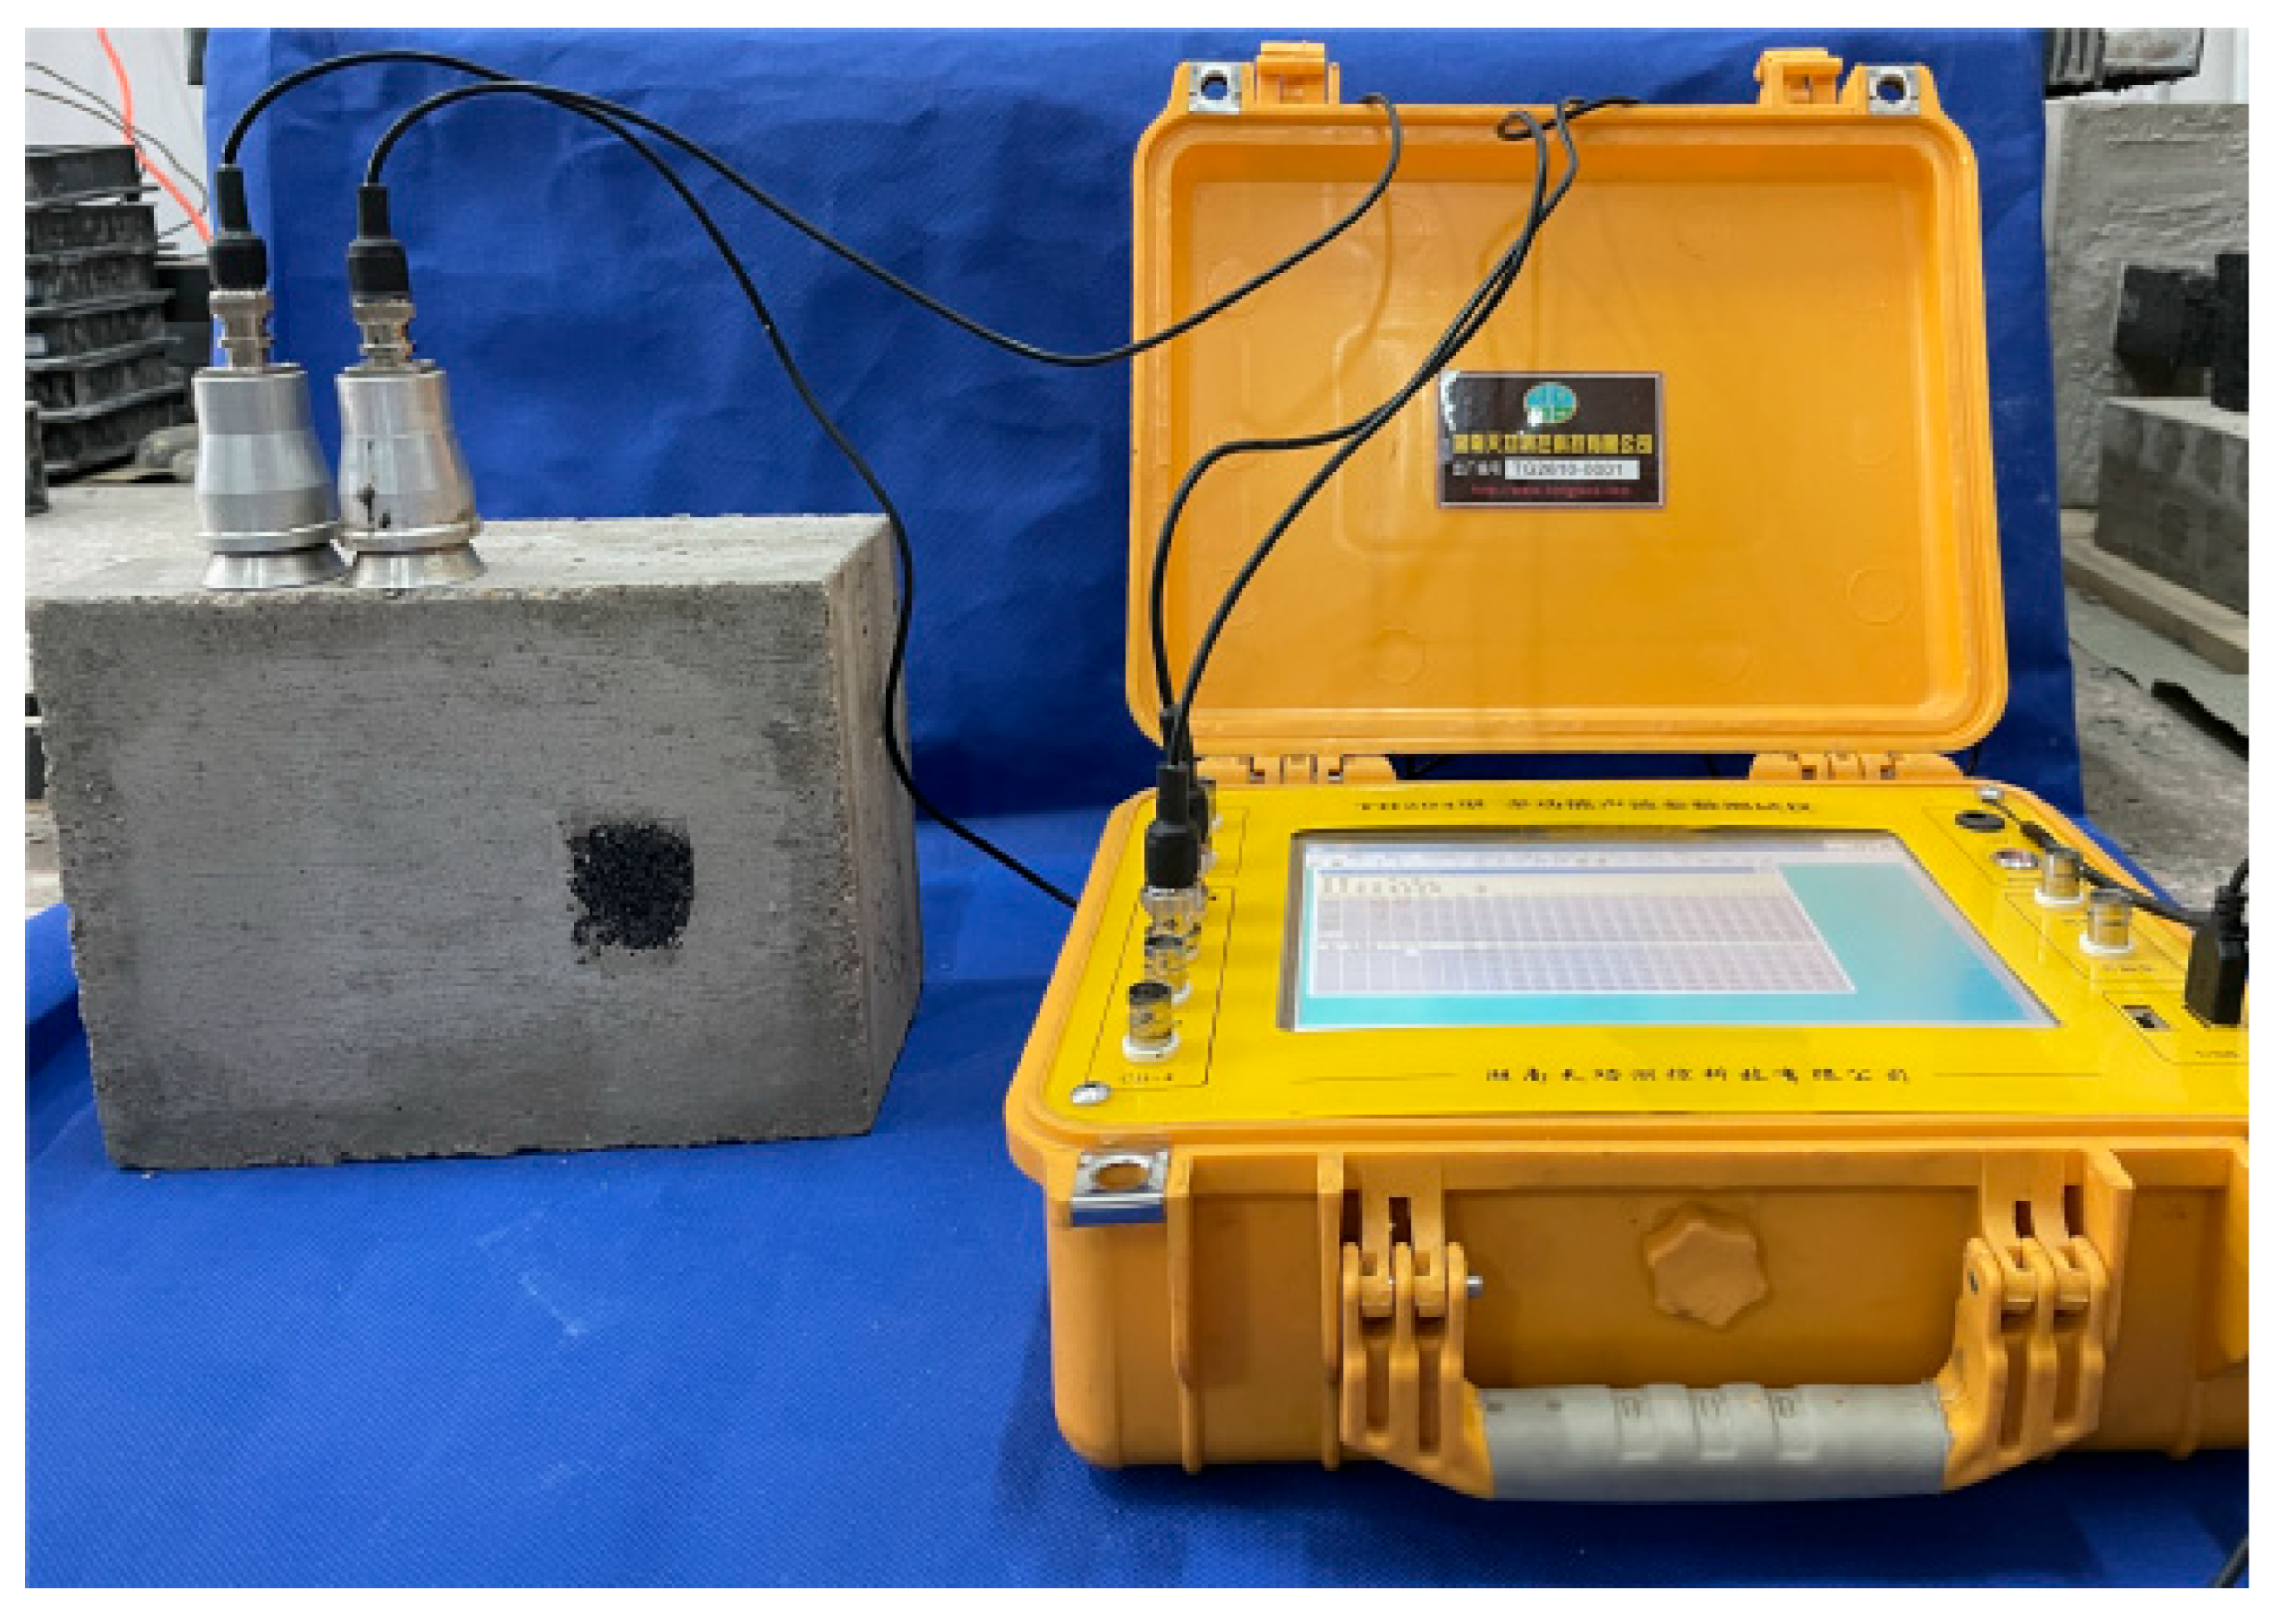
The ultrasonic pulse method was carried out using a TH204 multi-functional acoustic parameter tester, referring to CECS 21:2000 ‘Ultrasonic method of detecting concrete defects technical regulations’ for the implementation of the standard of the ultrasonic method of measuring uncompacted areas and voids. The ultrasonic flat-side method was adopted in this test, a 50 kHz probe was selected for testing, and the testing was carried out point by point in the direction from left to right, according to the layout in the figure. The points in doubt were retested several times to reduce the chance of errors. The actual test diagram is shown in
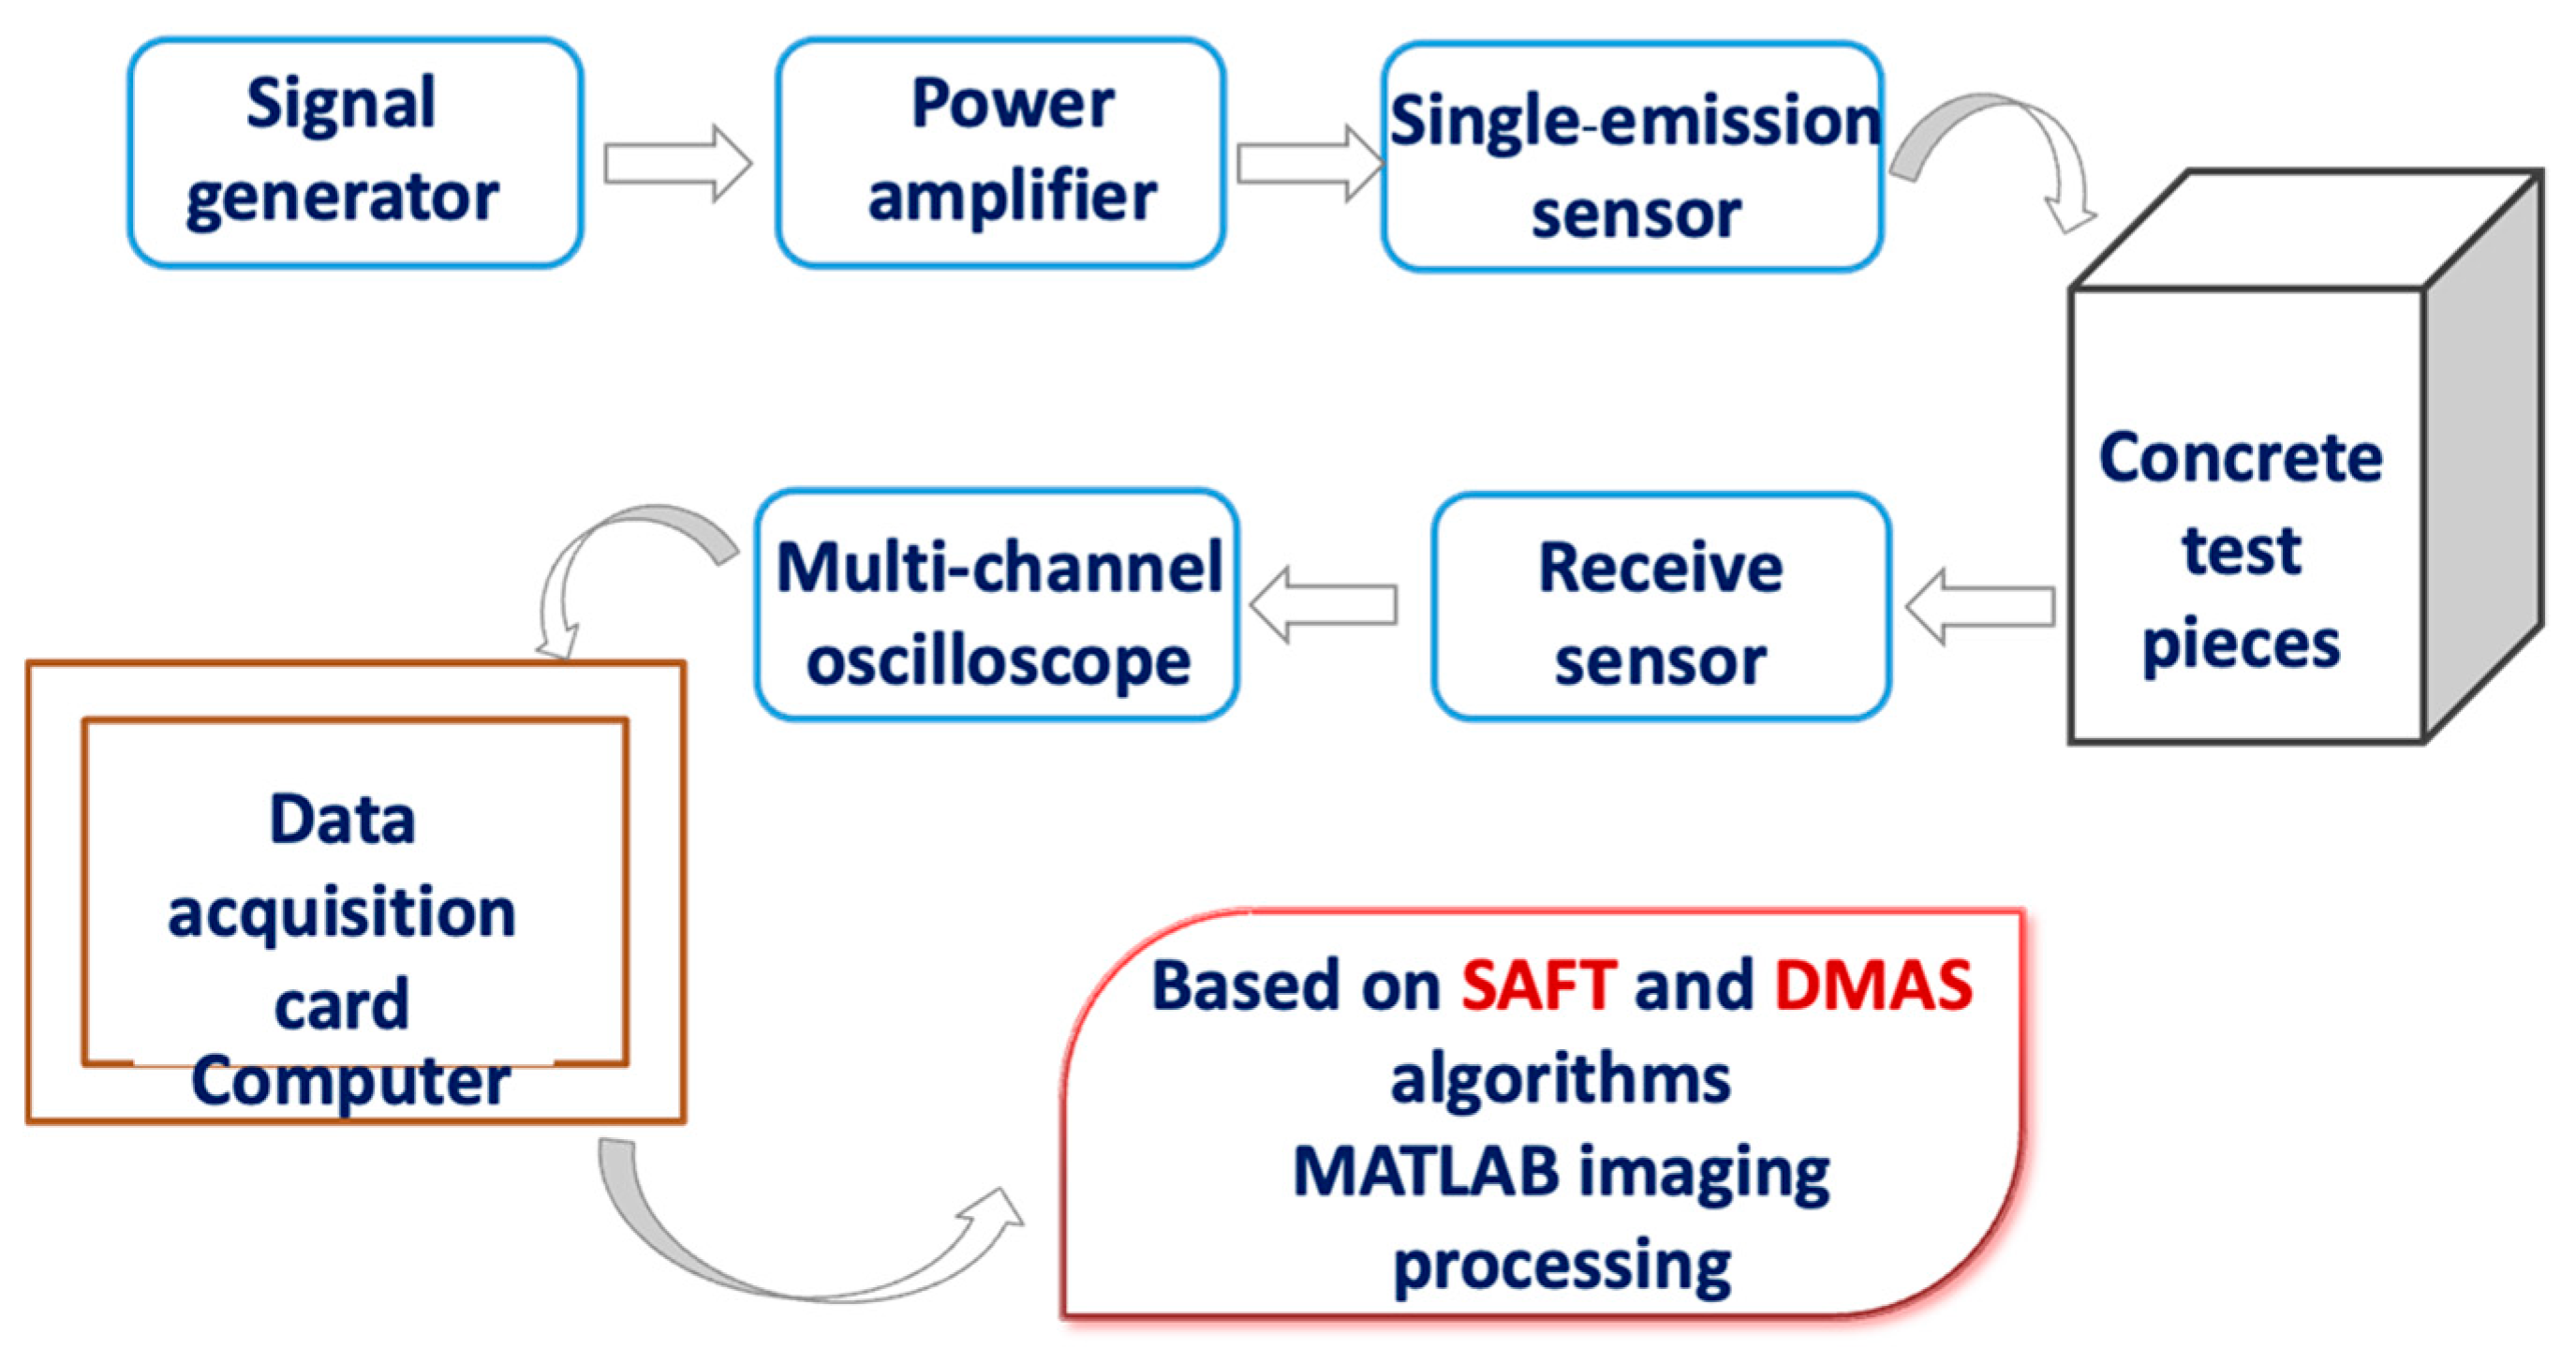
Figure 15. Vaseline was used as the coupling agent during the test, which was applied evenly. The block diagram of the test system is shown in
Figure 16.
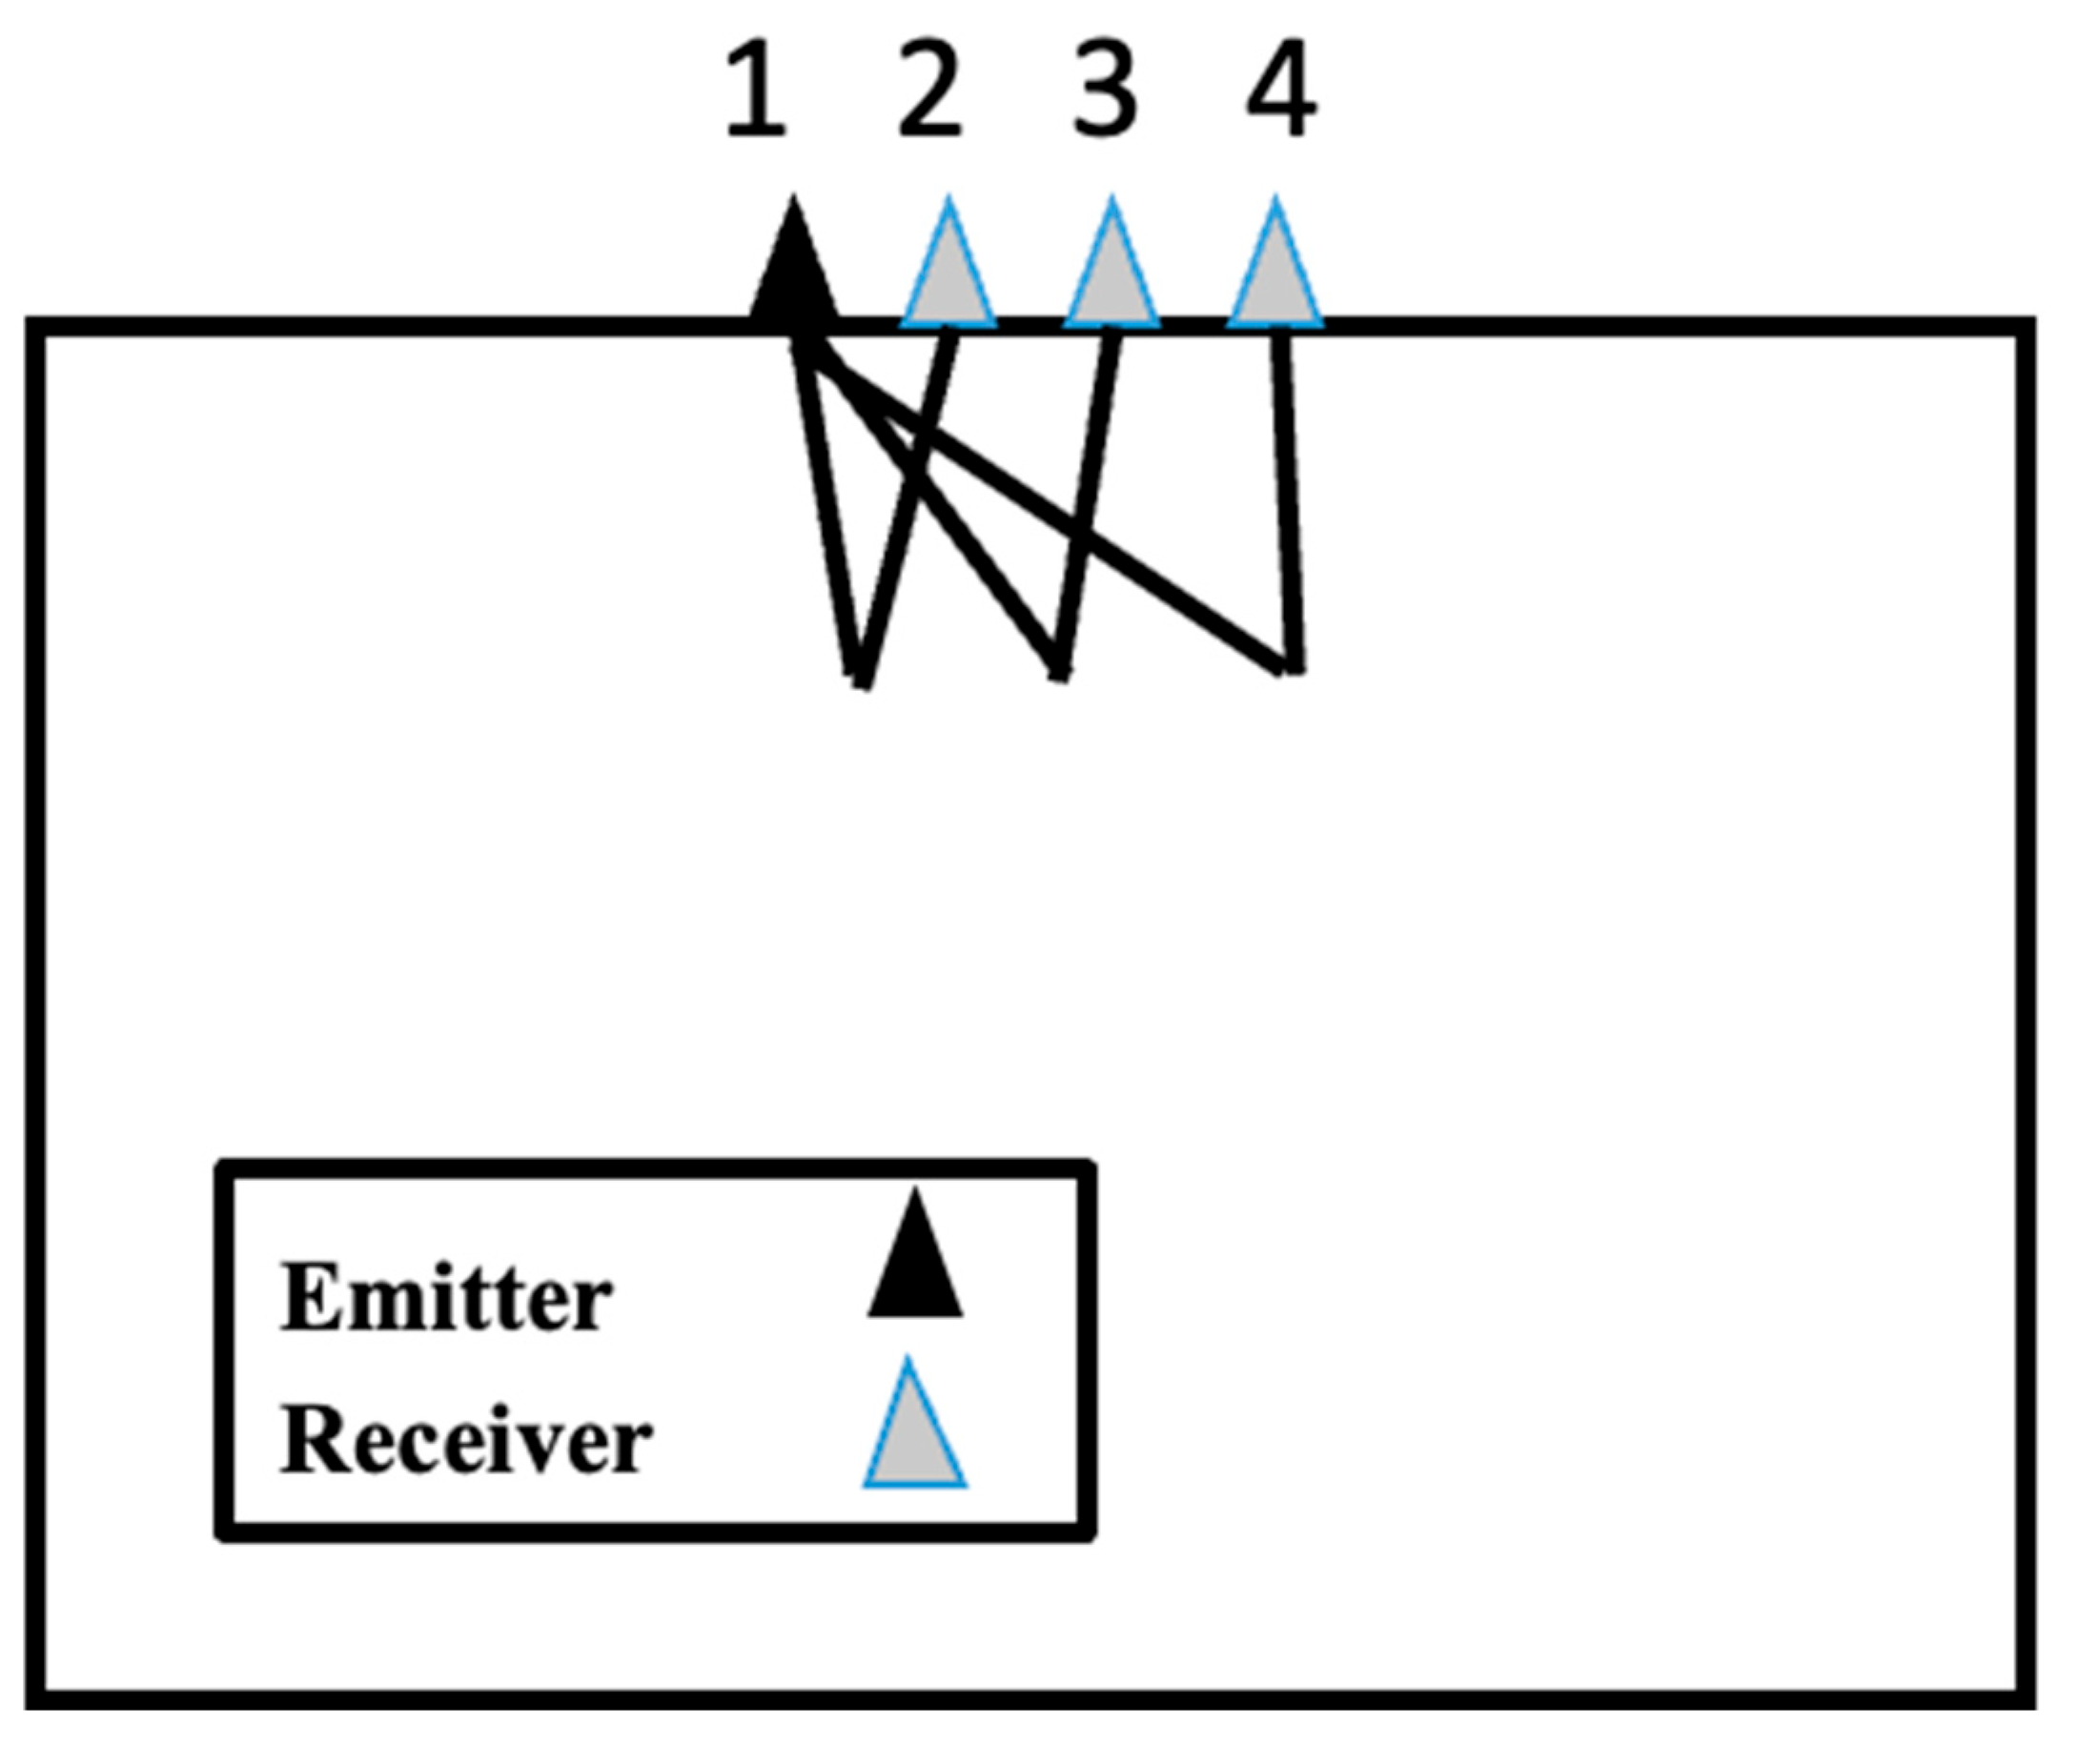
In the following example, the signals were grouped as shown in
Figure 17; in the first group, the first sensor was set as the signal-excitation device, and in the second, as the signal-receiving device. After receiving the signal after ultrasonic excitation, the signal-receiving device was moved, keeping the same probe spacing, to the subsequent third and fourth positions to receive the signal, so that the ultrasonic excitation group received a total of three echo signals; the second group set the second position at the sensor for the signal excitation device; the first and third to fourth position allowed the signal receiving device to receive a total of three signals; and so on. A total of 4 × 3 single signals were received.
The testing equipment was the TH204 multifunctional acoustic parameter tester manufactured by Hunan Tian Gong Measurement and Control Technology Co., Ltd. The instrument was placed above the 200 mm × 100 mm side with a probe to achieve coupling, and the probe frequency was set to 50 kHz to excite the ultrasonic transverse wave signal to detect the internal structure of the concrete.
4.3. Analysis of Imaging Test Results
Synthetic aperture focusing imaging method detection results in cross-sectional images presented in the form of B-scan images, and the results are more intuitive.
The actual thickness of the concrete specimens was 100 mm. For concrete specimens containing foam defects,
Figure 18a–c represents the images obtained with DMAS and the SAFT by implementing a pure receiving signal with synthetic aperture focusing.
The 12 channels in the 4 × 3 ultrasonic array emit transverse ultrasonic signals one by one from left to right, and generate ultrasonic echoes when the transverse signals encounter the preset defects at the internal depth of 90 mm. They store each echo signal generated at the defect location through the receiving probe, and perform time-delayed superposition and summation of the echo signals at the defect location through synthetic aperture focusing imaging technology.
As expected, in the first case (
Figure 18a), the image intensity decreases at a depth away from the emission focus (i.e., z = 85 mm). The reflection image of the prefabricated foam defect can be found at a depth of 90 mm, with an error of 5 mm between the depth position and the actual position (90 mm).
By comparing the results of the latter two inspection images, it is assumed that this loss was caused by large signal loss due to the influence of coarse aggregates in the material of the test block.
The red area in the image is similar to the rectangular shape, which is the strongest point of the defect signal once the signal focus process is complete, and does not produce a reflection image of the bottom interface at other depths.
For the concrete specimen b containing foam defects, as shown in
Figure 18b, the reflection image of the prefabricated foam defects can be clearly found at a depth of 80 mm, and the depth position corresponds to the actual position (80 mm). For the concrete specimen b containing foam defects, as shown in
Figure 18c, the reflection image of the prefabricated foam defects can be clearly found at a depth of 80 mm and at a depth of 120 mm, and the depth position corresponds to the actual position (80 mm and 120 mm).
In the case of synthetic aperture focusing, the peak intensity of the images is more uniform at all depths (
Figure 18a–c). Also, in the case of DMAS, a higher contrast resolution can always be observed (
Figure 18a–c), as the speckle pattern appears more defined.
The results show that the signal amplitude at the defect increases after DMAS processing based on synthetic aperture focusing, and the signal is focused at the maximum amplitude, which can effectively determine the depth location of the defect. However, the recognition of defects in lateral dimensions is low, which is guessed to be due to the elimination of repetitive, spatially irrelevant signals after DMAS processing. At the same time, the imaging performance of the proposed method was found to be affected by variations in material properties and test conditions. For instance, specimens with higher compressive strength (C45) exhibited slightly better signal transmission and clearer defect boundaries compared to C30 specimens, likely due to lower porosity and a more homogeneous microstructure. In addition, deeper defects (e.g., at 170 mm) showed reduced clarity due to increased attenuation and scattering. Sensor positioning also played a role—sensors placed too close to specimen edges were more prone to capturing side reflections, which can degrade image quality. In summary, the use of the synthetic aperture focusing technique and DMAS beam-forming method is feasible for imaging defects in concrete and has a good defect recognition effect.
5. Conclusions
In this paper, DMAS beam-forming and synthetic aperture focusing techniques were applied to detect and image microporous defects in concrete specimens. In addition, the wave velocity of ultrasonic wave propagation in defective concrete was obtained using the least-squares method. Based on the known velocity, the synthetic aperture focusing technique was used to realize the defect imaging of concrete in an aggregate manner. The synthetic aperture focusing technique is easy to operate, i.e., multiple single transducers are synthesized into a large-size ultrasonic detection array, which has the advantage of avoiding the disadvantage of large-aperture transducers with large divergence angles and high signal noise, and compensating for the shortage of a single small-aperture transducer with low energy for receiving defect signals, which ensures a high imaging resolution and signal-to-noise ratio overall. In fact, it is because of the higher sensitivity of the spatial cross-correlation function to noise that DMAS can be used to suppress unwanted spurious waves better.
The algorithm was validated through both finite element simulations and laboratory experiments involving three types of concrete specimens. The key findings include the following:
- (1)
The method achieves significant improvements in image contrast and clarity, with consistent accuracy in identifying defect depths.
- (2)
The DMAS beam-forming effectively reduces side lobes, enhancing the visibility of defects even in noisy environments.
- (3)
Quantitative analysis showed up to 40% contrast gain and a defect positioning error within ±5 mm.
In conclusion, it can be shown that DMAS beam-forming has the potential to make the SAFT an attractive technique, and this approach has been shown to be feasible by the results of concrete internal defect imaging, the good adaptability of DMAS beam-forming, and synthetic aperture focusing techniques for concrete quality inspection. The great potential of this technique in the field of non-destructive testing is shown.
6. Discussion
The experimental and simulation results demonstrate that the integration of the DMAS algorithm with the SAFT significantly improves the quality of ultrasonic imaging in concrete. Compared to the traditional SAFT, the DMAS-enhanced approach yields approximately 40% higher image contrast, better noise suppression, and more accurate defect localization.
Although the DMAS-enhanced SAFT algorithm significantly improves image quality and defect recognition, several limitations remain. First, the lateral resolution is still constrained by the limited aperture size and number of transducers, which may affect the accuracy of detecting small or closely spaced defects. Second, the DMAS algorithm increases computational complexity due to its nonlinear operations, which may limit real-time applications unless accelerated by parallel computing or specialized hardware. Third, the method’s effectiveness under highly heterogeneous or moisture-rich concrete environments has not been fully tested. Finally, only 2D imaging was conducted in this study; future research should explore 3D reconstruction for more comprehensive evaluation.
Despite these limitations, the integration of DMAS into the SAFT framework presents clear scientific and engineering advantages:
- (1)
It introduces nonlinear spatial correlation into concrete imaging, which has rarely been applied in this context before.
- (2)
It bridges the gap between high-resolution medical ultrasound algorithms and large-scale civil engineering imaging.
- (3)
It lays the foundation for future AI-assisted interpretation, given the improved signal quality.


