Article

Influencing Factors of BIM Application Benefits in Construction Projects Based on SEM

1
School of Civil Engineering and Architecture, Wuhan Institute of Technology, Wuhan 430073, China
2
School of Resources and Safety Engineering, Wuhan Institute of Technology, Wuhan 430073, China
3
Hubei Jiefengcheng Construction Engineering Co., Ltd., Wuhan 430010, China
*
Authors to whom correspondence should be addressed.
Buildings 2025, 15(11), 1875; https://doi.org/10.3390/buildings15111875
Submission received: 9 May 2025 / Revised: 23 May 2025 / Accepted: 27 May 2025 / Published: 29 May 2025
(This article belongs to the Section Construction Management, and Computers & Digitization)

Abstract

Facing the challenges of high complexity in Building Information Modeling (BIM) technology application and insufficient realization of its benefits, this study identifies key influencing factors of BIM effectiveness through the literature analysis and multi-case research. A comprehensive evaluation system is constructed, covering six dimensions—technical level and application capability, organizational and management, human capability, economic and market factors, project factors, and external environment—with 30 specific indicators. Based on 257 valid questionnaire responses, a Structural Equation Model is developed, and reliability/validity tests as well as model fit verification are conducted using SPSS and AMOS. The findings reveal that human capability factors (weight: 0.182) serve as the core driver for realizing BIM value. Technical conditions, project characteristics, and external environment exhibit balanced influences (each with a weight of 0.164), while economic market (weight: 0.167) and organizational management (weight: 0.159) require collaborative optimization to enhance synergy. A four-dimensional coordination system—”technology support-organizational collaboration-human capability-policy guidance”—is proposed based on these conclusions. Practical application demonstrates that this system improves BIM implementation efficiency by 23% and reduces project rework rates by 40%, providing quantifiable implementation pathways for construction enterprises to optimize resource allocation and advance digital transformation. The research aims to offer theoretical guidance and technical support for promoting the digital evolution of the construction industry.

1. Introduction

Building Information Modeling (BIM) offers significant advantages in construction projects through its visualization, simulation, and collaborative capabilities [1]. When effectively applied, BIM can enhance project outcomes in terms of schedule, cost, quality, and safety [2]. However, its practical application remains limited due to implementation complexity and project variability [3]. To address this limitation, this study aims to analyze the BIM, accurately identify its key influencing factors, and propose targeted countermeasures. To this end, it employs Structural Equation Modeling (SEM) to analyze data, examines the model with empirical data, and adjusts unreasonable assumptions based on validation results [4]. These efforts help enterprises enhance the benefits of BIM application and promote its broader adoption in construction projects [5].
In recent years, researchers have increasingly explored the factors affecting the value of BIM applications in construction projects. Mei [1] identified a disconnect between theoretical research and practical implementation of BIM, noting a lack of real-world cases for functions such as enhancing inter-organizational trust and supporting performance management. This gap is largely attributed to a narrow research focus and limited collaboration and knowledge sharing among enterprises. Shen [2] identified issues such as limited application depth, insufficient research on BIM’s benefits, and a significant theory–practice gap, attributing these issues to the complexity of BIM technology and the heterogeneity of construction projects. Li [4] emphasized that inconsistent standards and the lack of top-level design hinder BIM promotion and proposed a standardized framework integrating strategic planning with grassroots practices. Shen Ling [5] argued that delayed local government subsidies and cost pressures on small and medium-sized enterprises (SMEs) limit the realization of BIM benefits. Li [6] further highlighted that limited collaboration and talent shortages in supporting systems exacerbate application uncertainty. Ahn et al. [7] noted that the industry’s slow adoption of new technologies and incomplete BIM component libraries as key barriers to BIM promotion and model development. Han et al. [8] reported that poor data interoperability among BIM (Autodesk Revit, ArchiCAD, Tekla Structures) software hinders the direct use of design models during construction. Chen et al. [9] indicated that unclear responsibility divisions between design and construction teams delay information transfer and cost increases. Fan et al. [10] observed that complex BIM models often perform poorly on mobile or low-end devices, reducing on-site application efficiency.
Despite its theoretical potential, the practical application of BIM technology remains constrained in both implementation depth and market penetration. Statistical analysis reveals that during 2019–2023, full-process BIM implementation was utilized in merely 32% of large-scale domestic construction projects, while usage rates plunged below 15% in small-to-medium projects. This discrepancy primarily stems from excessive coordination costs and technical compatibility complexities in BIM adoption across different project scales [11]. This study conducted online interviews and questionnaire surveys with project managers, BIM engineers, and owner representatives to examine real cases within the province. The data provide key findings. Project A (commercial complex) experienced a 15% increase in rework and a 23-day schedule delay due to the BIM model not being updated in sync with construction progress. The main issues were poor information transmission and a lack of model-schedule integration mechanisms. Project B (tertiary hospital expansion) suffered from 23 instances of pipeline conflicts, resulting in direct losses of CNY 850,000, because the BIM team and the construction unit did not establish a change synchronization mechanism, and the contract lacked clearly defined responsibilities. Project C (subway station) saw a 12% increase in equipment installation errors due to delays in delivering the design model. The root cause was inconsistent data formats. Project D (small- to medium-sized residential development) relied solely on two-dimensional drawings for construction due to the lack of a BIM team and government subsidies, leading to wall positioning errors and an 18% rework rate. Project E (large-scale infrastructure) faced compatibility issues between BIM software and the construction platform’s data interface, requiring 13 days to rebuild the model and resulting in an additional indirect cost of CNY 450,000.
This study advances beyond traditional single-dimensional analytical frameworks by integrating literature analysis with expert interviews, systematically identifying six core dimensions—technical proficiency, organizational management, human capital, economic drivers, project variables, and external influences—comprising 30 secondary indicators to construct a comprehensive BIM benefit assessment matrix. By employing structural equation modeling (SEM), the research deconstructs the interaction pathways among multi-dimensional variables and validates findings through a case study of the Wuhan highway engineering project. Implementing the Obeya collaborative framework and adhering to ISO 19650 international standards [11], the program emphasizes Industry Foundation Classes (IFC) standardization and data interoperability as key components. This systematic approach achieves three critical objectives: (1) facilitating effective data exchange among stakeholders through unified standards; (2) optimizing BIM workflows through process reengineering; and (3) establishing talent development mechanisms and tiered subsidy policies. By proposing an interaction model of BIM benefit influencing factors, this study constructs a four-dimensional synergy framework of “technical support, organizational collaboration, human capability, and policy guidance”, aiming to provide a path reference for the digital transformation of the construction industry. Meanwhile, it offers a quantitative basis for governments to optimize BIM promotion policies and enterprises to formulate technical investment decisions.

2. Identifying Influencing Factors of BIM Application Benefits

Based on the analysis of the literature and case studies, this paper categorizes the factors influencing BIM application benefits into six main groups: technical level and application capability, organizational management, human capability, economic and market factors, project characteristics, and external factors. For modeling purposes, each indicator is coded using the initials of its Chinese name. For instance, the first-level indicator “technical level and application capability” is coded as “JS”. Table 1 presents more details about categorizing key determinants of BIM application benefits.

3. Data Collection and Analysis

3.1. Questionnaire Design and Analysis

To gain a more comprehensive understanding of BIM usage in China, the study distinguishes is necessary varying demands, perceptions, and understandings of BIM among different BIM users [1]. To ensure data reliability, it selected construction units, design institutes, contractors, and consulting firms as the main survey targets. The design of questions in the questionnaire integrates existing theoretical research with the current status of China’s construction industry. The initial content of the questions was developed through group discussions, then refined based on feedback from academic advisors and department professors regarding wording and expression, before finalizing all items. The survey adopts a 5-point Likert scale, where respondents are asked to rate the extent to which listed factors impact BIM application benefits based on their professional expertise and practical experience. Scores range from 1 to 5: 1 = “Extremely unimportant”; 2 = “Unimportant”; 3 = “Neutral”; 4 = “Important”; 5 = “Extremely important”. Respondents evaluate each item according to key assessment dimensions [10]. A total of 347 questionnaires were distributed, with 293 valid samples recovered, resulting in an overall response rate of 84.4%. After eliminating invalid data, 257 valid responses were retained, resulting in a valid recovery rate of 74.1% and 87.7% based on the total and actual responses, respectively.

3.2. Reliability and Validity Test

This study checked the reliability of the data samples using SPSS 24.0. As shown in Table 2, the Cronbach’s alpha coefficients for all dimensions exceed 0.6, with an overall coefficient of 0.936, indicating high internal consistency and strong reliability of the questionnaire.
As shown in Table 3, the KMO value is 0.928, which exceeds the minimum threshold of 0.5, confirming the sampling adequacy. In addition, this value is statistically significant at the 5% level, indicating a considerable correlation between the factors.
As shown in Table 4, principal component analysis extracted six factors with eigenvalues greater than 1, accounting for 66.834% of the total variance. This exceeds the 50% threshold, indicating that the selected factors are representative and confirming the structural validity of the model [6].

4. Establishment and Evaluation of the SEM Model

4.1. Model Construction

This study utilized the AMOS 22.0 statistical modeling platform to perform confirmatory factor analysis. The process included three stages: parameter estimation, model validation, and model optimization. After three rounds of iterative refinement, it constructed an SEM to identify the influencing factors of BIM application benefits, as shown in Figure 1.
Table 5 represents the results of checking the fitting degree of the model. Based on the results, the revised model met most standard evaluation criteria. In Structural Equation Modeling, “Marginal” refers to a situation where the actual value of a fit index is close to but has not fully met the pre-set ideal standard, being in a critical fit state. For example, the GFI in the table has an actual value of 0.898, slightly below the benchmark of 0.90, and is therefore labeled “Marginal”. This indicates that while the model’s fitting performance on this index has not fully met the standard, it does not deviate significantly either, falling into a transitional state between “good fit” and “poor fit” [6]. It is important to note that marginal acceptability of a single index does not necessarily render the model completely invalid; a comprehensive evaluation is required by integrating other fit indices. In this model, CMIN/df, CFI, RMSEA, IFI, and TLI all meet the fit criteria. Among them, CMIN/df, CFI, and RMSEA serve as core evaluation indices [2], whose excellent performance fully demonstrates that the overall fitting effect of this model is ideal and will not significantly affect the reliability and validity of the model.
As shown in Table 6, the AVE (Average Variance Extracted) values for all six latent variables are greater than 0.5, and their CR (Composite Reliability) values all exceed 0.7. This indicates that the data in this analysis exhibit good convergent validity.

4.2. Indicator Weight Analysis

The SEM quantifies the relationships among latent variables through path coefficients, which reflect the strength of each indicator’s influence on the benefit evaluation system. Higher absolute values indicate greater significance [6]. Table 7 shows the interpretation standards for path coefficients.
Regarding Figure 1, all residuals are positive in the second-order confirmatory factor analysis model. The path coefficients of the six first-level latent variables all exceed 0.6, indicating a significant impact on application benefits. These variables should therefore be incorporated into the performance evaluation process.
Equation (1) represents the design of the index weight calculation formula.
W ( F m ) = R ( F m ) m = 1 n = 7 R ( F m ) , m = 1 , 2 , 3 , 4 , 5 , 6 , 7
where Fm represents the mth latent variable and R(Fm) is the path coefficient of the mth latent variable. W(Fm) represents the weight of the mth latent variable and W(Tmk) indicates the weight of the observed variable. Based on the path coefficients, the weight coefficients of each indicator are determined [6]. Table 8 provides the weights of each indicator.
W ( T mk ) = R ( T m k ) m = 1 k = 1 n = 7 R ( T m k ) , m , k = 1 , 2 , 3 , 4 , 5 , 6 , 7
where Tmk represents the kth observed variable under the latent variable Fm; R(TMmk) denotes path coefficient of the corresponding observed variable.
W m k = W ( F m ) × W ( T m k )
where Wmk is the final weight of the observed variable.

Multidimensional Analysis of Factors Affecting BIM Application Benefits

Human capability is the primary driver of effective BIM application (weight: 0.182). However, real-world projects frequently face challenges such as limited technical proficiency, weak collaboration, and low user engagement. Among them, employee technical skills and staffing levels (RY1) have the greatest influence (weight: 0.062), directly affecting BIM implementation efficiency. For example, in Project D, the absence of an in-house BIM team and reliance on outsourcing led to a significant disconnect between construction activities and the BIM model. Cross-departmental collaboration ability (RY2) also carries substantial weight (0.061); inadequate collaboration exacerbates information silos. For instance, in Project C, delays in the transfer of design and construction information led to a 12% increase in installation errors. User enthusiasm (RY3), with a weight of 0.059, affects tool utilization. In Project B, only 40% of the staff used BIM software, resulting in 23 pipe and cable clashes. The root causes of these issues include an inadequate training system. For example, most companies focus only on software operations while neglecting interdisciplinary cooperation. In addition, unclear promotion paths for BIM technicians caused a talent loss rate exceeding 20%, as evidenced by a provincial design institute that lost 12 core staff members over three years. Another cause is the absence of incentive mechanisms, as many firms fail to incorporate BIM applications into performance assessments. For example, in Project A, the BIM model was used only for approval purposes and was not updated during construction. Human capability severely restricts the full realization of BIM’s value.
Economic and market factors weigh 0.167 in influencing BIM application effectiveness. The core issues include high initial investment, misjudgment of benefits, and insufficient market-driven incentives. Cost–benefit analysis (JJ3) carries the highest weight (0.035), as companies rely heavily on return-on-investment calculations. For example, in Project A, the lack of thorough cost–benefit analysis led to BIM hardware and software investments exceeding the budget by 45%. Market competition pressure (JJ4), with a weight of 0.033, reflects how industry competition drives technology adoption. Contract terms (JJ5), weighed at 0.034 (with a weight of 0.034), are critical for ensuring a fair distribution of interests. In Project B, the absence of BIM responsibility clauses in the contract led to unclear accountability and disputes. These issues stem from a long investment return cycle—BIM requires ongoing investment while benefits emerge slowly, particularly straining SMEs financially. In addition, market awareness is lacking—some developers misunderstand BIM’s value. For example, in Project D, the developer viewed BIM as “just a 3D visualization tool” and refused to allocate additional funds. Policy incentives are also limited. Although some regions provide subsidies, their coverage and intensity are insufficient. Survey results indicate that only 34% of SMEs have received BIM-specific support. These economic and market challenges form major barriers to the broader adoption of BIM technology.
Technical level and application capability, external factors, and project factors each exert an equal influence on the effectiveness of BIM application, with a weight of 0.164. These impacts highlight the synergistic spillover effects of technological tools, project characteristics, and the external environment—no single factor can independently drive BIM performance. Within the dimension of technical level and application capability, the weights of the secondary indicators are evenly distributed (ranging from 0.022 to 0.024), underscoring the necessity of a holistic optimization of technical tools, rather than reliance on any single aspect. Technical conditions, such as software functionality (JS1) and hardware performance (JS2), directly affect the effectiveness of BIM applications. However, to realize their full potential, these tools must be integrated with personnel capabilities. The relatively low weights of technological innovation (JS4) and the degree of BIM integration (JS5) suggest that the current level of technology is relatively mature and no longer a primary bottleneck. Mei [1] revealed that insufficient software functionality and poor hardware compatibility are key obstacles to the implementation of BIM technology, and that a holistic approach is needed to reduce practical application barriers. Moreover, Li [4] emphasized that the consistency and sharing capacity of BIM data directly affect the efficiency of project collaboration, highlighting the need to promote the sharing, in-depth development, and effective utilization of information resources. Among external factors, the most influential element affecting the benefits of BIM application is the completeness of corresponding BIM standards and specifications, with a weight coefficient of 0.034. Furthermore, Ma [19] found that outdated industry standards are a major obstacle to the widespread adoption of BIM. Currently, users are more concerned about whether relevant standards and regulations in policies and laws can offer practical and feasible guidance for real-world applications. Among project factors, the indicator with the highest weight is project scale and complexity (XM1), with a weight coefficient of 0.056. This suggests that large-scale and complex projects require more efficient BIM technology support. The second-highest weight, equal to 0.055, is project schedule management (XM2), indicating that effective project timeline management can ensure the smooth implementation and achievement of BIM outcomes at all project stages.
The influence of organizational and managerial factors on BIM effectiveness is relatively low, with a weight of only 0.159, revealing the widespread lack of cross-departmental collaboration mechanisms. The traditional segmented management model of “design–construction–operation” is seriously misaligned with the collaborative demands of BIM’s full lifecycle. In Project A, the failure to synchronize design changes with the construction team led to a 15% increase in rework caused by MEP pipeline conflicts. In Project B, a lack of clearly defined BIM model responsibilities in the contract resulted in a 15-day delay due to model disputes between the design and construction teams. The root causes of these issues include vague responsibilities, the absence of detailed contractual clauses assigning BIM duties, and the limited institutional constraints for cross-department collaboration. Additionally, the absence of standardized BIM collaboration workflows results in an overreliance on manual communication. For instance, Project C experienced an 18% deviation in construction schedule due to delayed model updates, stemming from the lack of a mechanism linking BIM and schedule progress.

5. Case Verification

5.1. Impact Levels of the Factors

Project Overview: This study focuses on a highway project in Wuhan, with a total route length of 14.1 km, a construction and installation cost of CNY 2.25 billion, and a construction period of 42 months. The project scope encompasses the following key components: three interchange hubs; two toll stations; 34 bridges (including elevated and river-crossing structures); 60 culverts and underpass channels. The project traverses three subdistricts and 30 villages, involving the occupation of numerous houses, cemeteries, farmlands, fishponds, and utility poles, thus requiring extensive land acquisition, demolition, and relocation. The average haul distance is long, with high demand and challenges in soil allocation and long-distance coordination. The route intersects multiple heavily trafficked roads, creating significant traffic diversion challenges. Due to the route’s length and large workforce, centralized management proved impractical, impacting material control, quality, safety, and labor oversight. To address these issues, the company adopted BIM technology, achieving notable success.
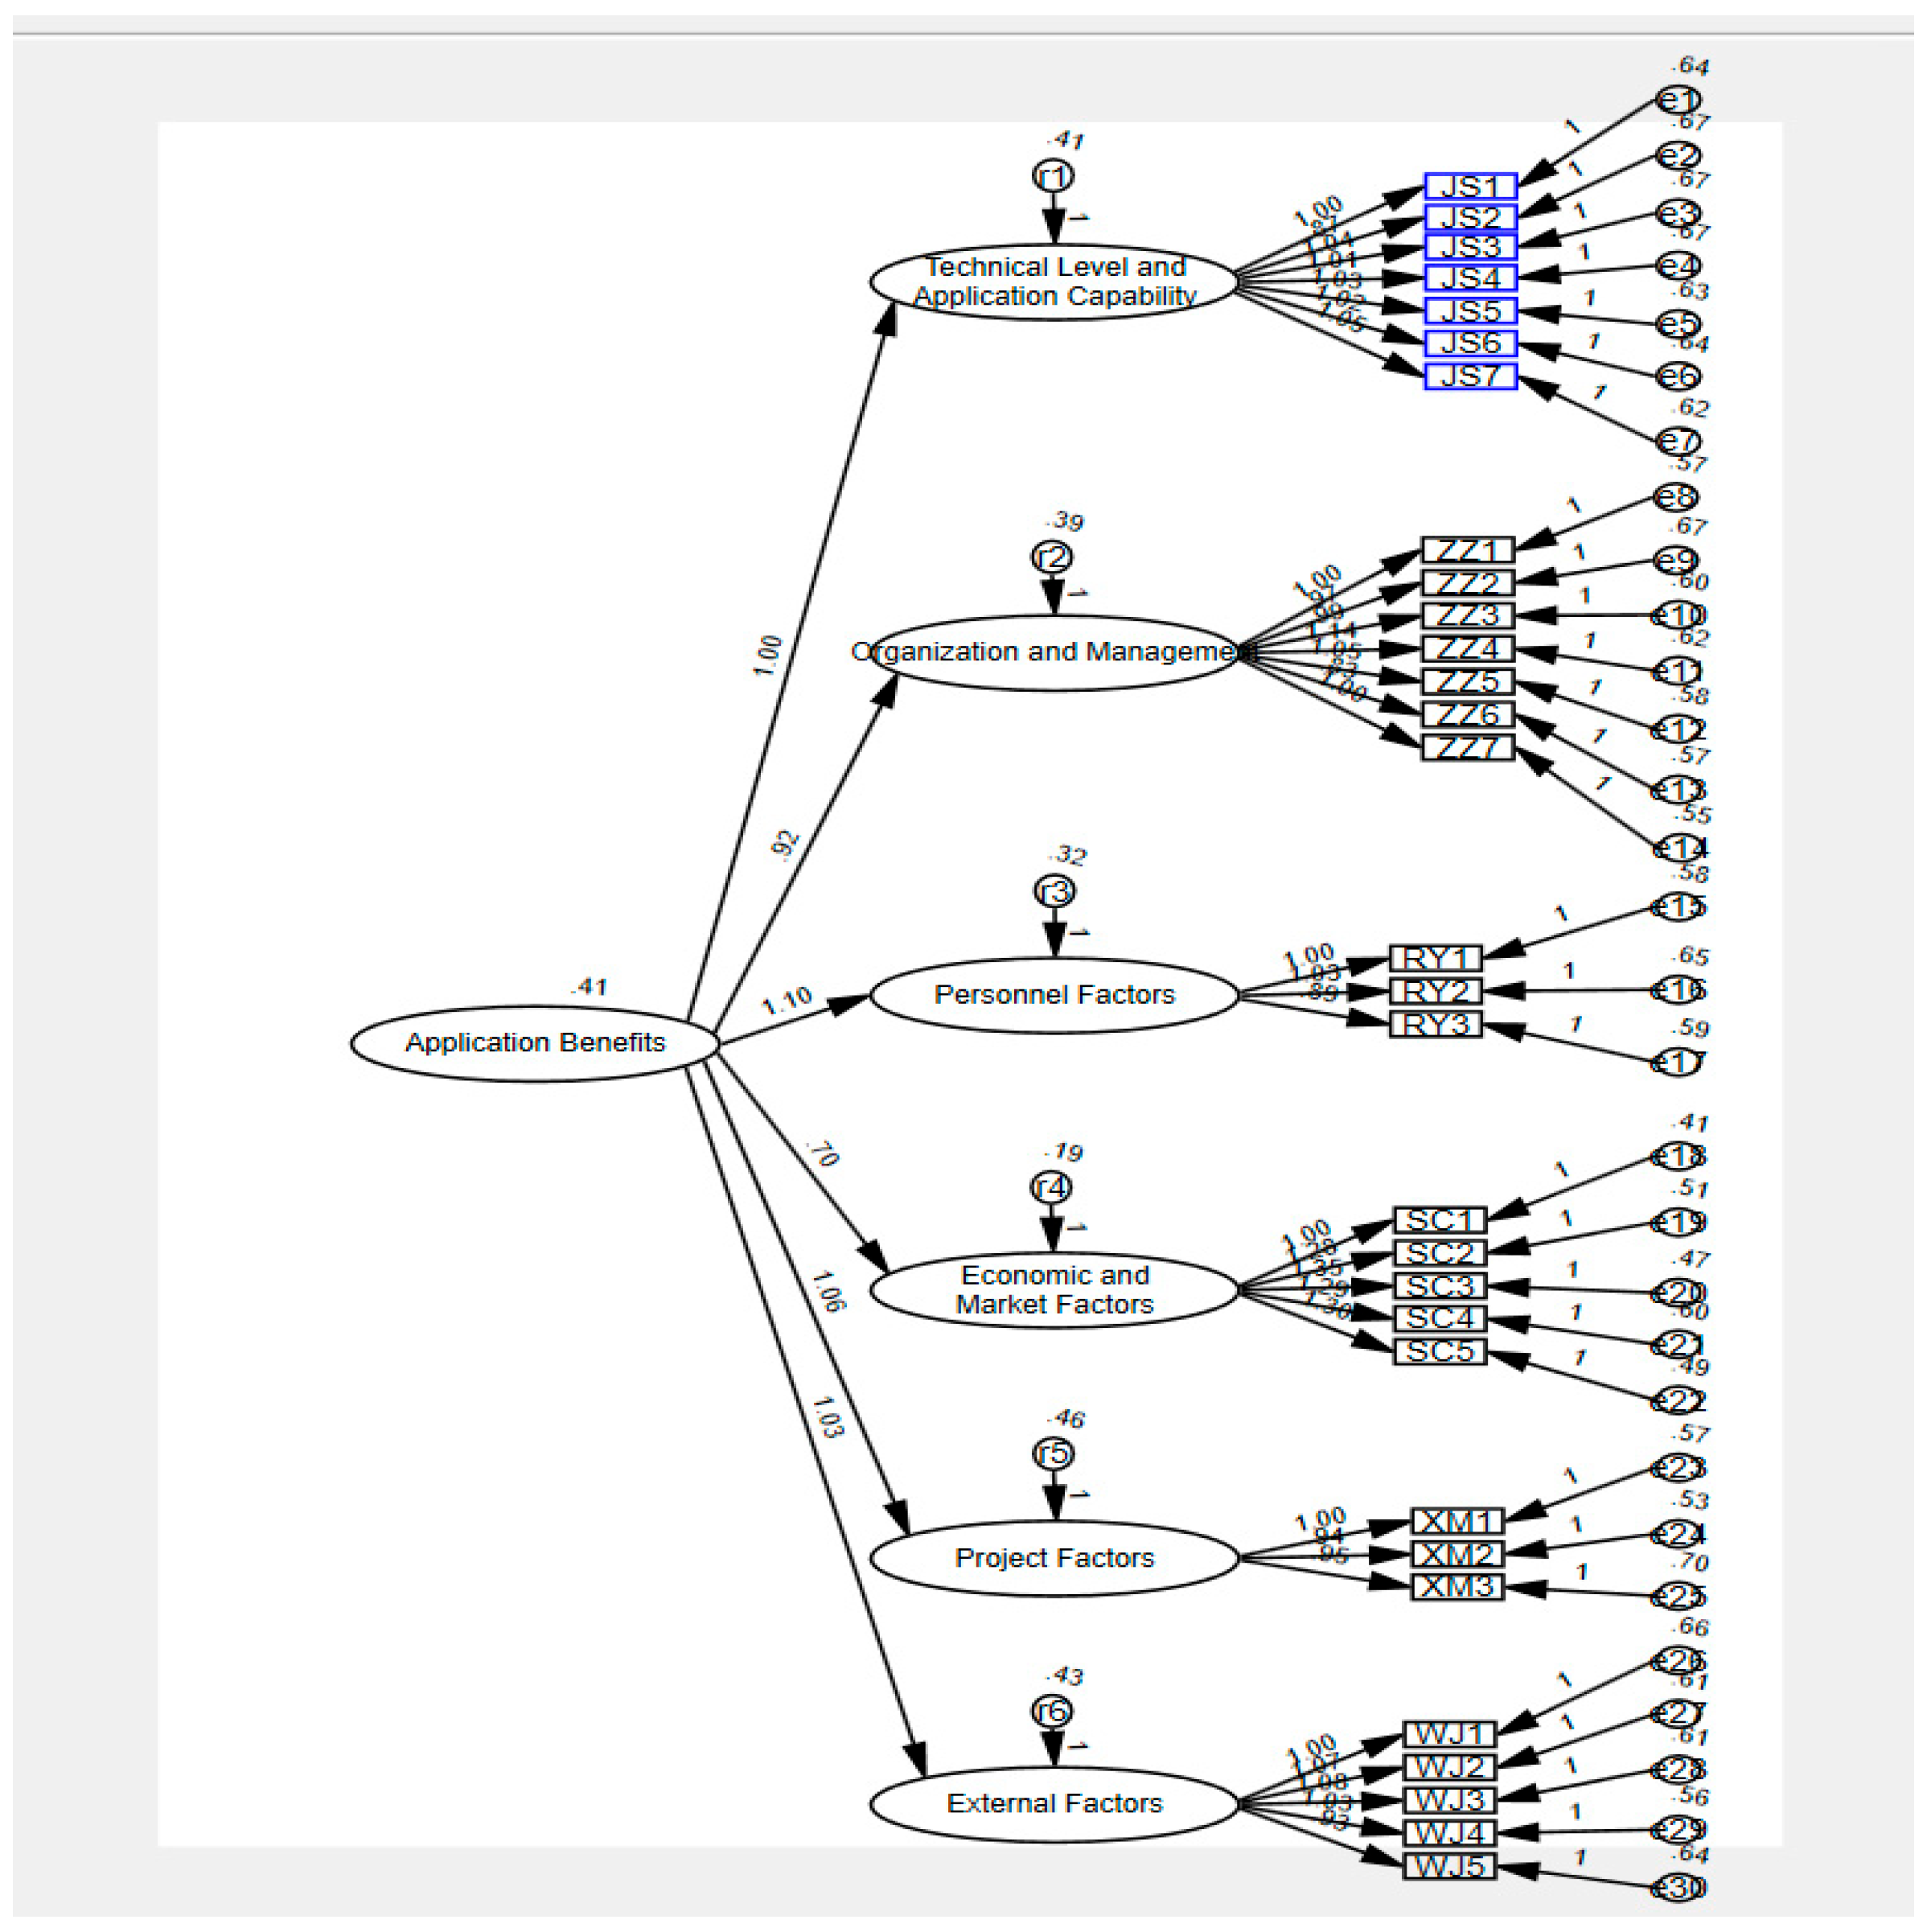
To quantitatively assess the influence of key factors on BIM application effectiveness in this project, we conducted a systematic evaluation through multi-stakeholder surveys. A panel of 15 BIM practitioners spanning three organizational tiers—parent company headquarters, regional branches, and project departments—participated in rating critical indicators. These participants included both direct implementers and strategic decision-makers involved in BIM deployment. The evaluation framework was structured as follows: ratings were aggregated using mean scores (see Table 9) to minimize individual bias and implemented validity checks through Cronbach’s Alpha (0.847) to ensure rating consistency.
Observed variables (Mij): Specific evaluation metrics were scored on a standardized scale, where Mij represents the measured value of the j-th observed variable under the i-th latent factor.
Latent variables (Yk): Derived composite indices (k = 1~6) aggregating related observed variables.
Y1= 0.024 × M11 + 0.022 × M12 + 0.024 × M13 + 0.023 × M14 + 0.024 × M15 + 0.024M16 + 0.024 × M17
Y2= 0.023M21 + 0.022M22 + 0.023M23 + 0.024M24 + 0.023M25 + 0.021M26 + 0.023M27
Y3= 0.062M31 + 0.061M32 + 0.059M33
Y4= 0.032M41 + 0.034M42 + 0.035M43 + 0.033M44 + 0.034M45
Y5 = 0.056M51 + 0.055M52 + 0.052M53
Y6 = 0.032M61 + 0.033M62 + 0.034M63 + 0.034M64 + 0.031M65
As illustrated in Table 10, the highest-scored influential factor is enthusiasm of technical personnel in using BIM (4.37), while the lowest-rated aspects are completeness of BIM component library and data management capacity. The latent variable weight ranking demonstrates human capability (0.182) > economic and market factors (0.167) > project factors (0.164), technical level and application capability (0.164), external factors (0.164) >organization and management (0.159). The latent variable final score ranking demonstrates: human capability (16.675) > economic and market factors (14.11) > project factors (13.32) > technical level and application capability (13.3) > organization and management (13.155) > external factors (12.95). The final score ranking shows consistency except external factors descending to the last position, suggesting their relatively minor impact on BIM benefits realization in the case study.
According to the ratings, human capability remains the primary challenge in corporate BIM adoption. The three indicators with the highest scores: technical ability and number of staff, cross-departmental collaboration ability, and enthusiasm of technical personnel in using BIM, indicate that strengthening talent development can enhance BIM application benefits. Enterprises should optimize BIM technology implementation and cultivate a highly professional talent team [27]. The top priority is to establish a standardized BIM technical qualification certification system, promote deep collaboration between universities and enterprises, and focus on cultivating composite talents. In higher education, it is essential to reconstruct the curriculum framework for the Building Information Modeling major, creating a laddered curriculum system that progresses from basic to advanced levels to solidify students’ knowledge foundation. For incumbent personnel, stratified and categorized BIM application capability enhancement programs should be implemented. Differentiated training plans should be developed based on the distinct needs of technical sequences and management positions, along with standardized job competency training modules. A management system of “training-assessment-certification” should be established to ensure the effective implementation of training outcomes. Meanwhile, a scientific and reasonable quantitative evaluation mechanism for BIM technology application results should be constructed, incorporating project-level BIM application performance into the professional rank evaluation indicators for technical personnel, and setting up special technical innovation reward funds to motivate technical staff to continuously improve their professional capabilities, forming a long-term incentive mechanism that closely links technical competence with career development.
The second-highest score was attributed to economic and market factors. This is because in the early stages of BIM technology implementation, enterprises need to invest heavily in software/hardware procurement, infrastructure development, and personnel training, with a long return cycle. Therefore, its value can only be realized through integration into actual projects. Governments should establish special subsidies to reduce software/hardware procurement costs for small and medium-sized enterprises. Industry associations should promote the construction of BIM application case libraries and compile the Guidelines for BIM Application Cost–Benefit Assessment to provide enterprises with quantitative decision-making tools and enhance industry awareness of BIM technology’s value.
Among project factors, project scale and complexity received the highest score, indicating that larger and more complex projects yield greater BIM application benefits. Therefore, referring to the international standard ISO 19650, an integrated “design-construction-operation and maintenance” data chain should be established, along with the BIM Technology Applicability Grading Standards and Owner’s BIM Decision Guide to guide model accuracy classification, standardize change processes, subdivide complex projects, and promote deep integration of BIM with project characteristics.
In the technical level and application capability, software functionality, hardware performance, and network infrastructure received the highest scores, indicating that current BIM software fragmentation and insufficient hardware compatibility severely restrict BIM adoption. Enterprises should prioritize IFC (Industry Foundation Classes) standardization and data integration to facilitate effective data interaction among all construction project stakeholders based on unified data standards, enabling cross-business applications. They should support lossless conversion of models from multiple software platforms (e.g., Revit, Tekla), establish logical binding between graphical data and project technical parameters through IFC specifications to address design-construction data fragmentation, achieve real-time data synchronization across the design-construction-operation and maintenance lifecycle, support multi-terminal access, and implement intelligent conflict management. This includes optimizing schedule conflict detection based on the Line of Balance (LOB) method, identifying resource allocation conflicts through 4D simulation, and using AI algorithms (e.g., rule-based expert systems, anomaly detection, semantic segmentation) to automatically locate spatial collisions and recommend solutions.
Although organization and management factors ranked lower in scores, their ratings are close to those of project factors and technical level and application capability, warranting attention to strengthen and improve organizational management mechanisms. The core of BIM application lies in collaboration, requiring enterprises to break traditional organizational structures and build BIM-based collaboration frameworks. Based on the Obeya collaboration model, a visual management and strategic planning framework should be established, bringing stakeholders together in a dedicated space to promote cross-functional collaboration, communication, and transparency, enhancing open communication and information sharing among team members to improve decision-making capabilities. Under this model, owners, designers, constructors, and operation/maintenance parties jointly define BIM objectives and delivery standards, while appointing BIM coordination officers to handle cross-departmental dispute arbitration and process supervision. Built on mutual trust and respect among participants, BIM reduces intellectual property dispute risks through complete data transparency, clarifies responsibilities, minimizes legal conflicts, safeguards stakeholder interests, improves project efficiency, and enhances collaboration transparency and trust.

5.2. Analysis of Influencing Factors of BIM Application Benefits

In response to the above issues and analysis, the enterprise has achieved remarkable results through BIM technology implementation, with specific analysis as follows:
(1)
Human Capability
The project collaborated with the China Construction Industry Association to require all BIM technicians to participate in a three-level certification program, covering theoretical knowledge and practical operations. The final certification pass rate for technicians reached an impressive 90%. This initiative yielded significant outcomes: the model error rate plummeted from an initial 20% to 5%, construction conflicts decreased by 40%, and rework costs were reduced by approximately CNY 1.6 million. Modeling engineers underwent intensive “Revit + Navisworks” training, while project managers deeply studied BIM application processes and developed cross-departmental collaboration plans (as illustrated). The case utilized BIM + VR for construction safety simulations to identify high-risk processes (e.g., deep foundation pit operations, high-altitude hoisting), formulating protective plans in advance, which reduced monthly quality and safety hazards by an average of 3.6 cases. It achieved full lifecycle linkage of schedule, cost, and quality by integrating indicators such as safety accident rate and hidden danger rectification timeliness into BIM performance evaluations, automatically marking risk zones (e.g., missing edge protection) through models to realize a “simulation-early warning-rectification” management cycle. Thanks to these efforts, the project won the enterprise’s “BIM Innovation Award” and the “Longtu Cup”, eliminated model update delays, increased software utilization from 40% to 95%, and awarded corresponding performance incentives to BIM team members. Through systematic promotion of BIM technical qualification certification, university-enterprise collaboration, stratified training, and quantitative incentives, the project successfully transitioned from technical bottlenecks to high-efficiency collaboration. These results demonstrate that personnel capabilities directly determine the depth of BIM application, not only shortening the construction period by approximately 10%, achieving a 100% quality and safety rectification rate, and saving CNY 5 million in costs but also formulating project-level BIM implementation plans and modeling specifications for roads and bridges, providing valuable experience for wide-scale BIM promotion.
(2)
Economic and Market Factors
Economic and market factors focus on economic decision-making and market environment-driven BIM applications, with the core lying in balancing technical investment and benefit output, where cost–benefit analysis is crucial for enterprise decision-making. The project initially faced challenges such as high BIM software/hardware procurement costs and difficulty in quantifying technical application benefits, hindering BIM promotion while traditional construction methods remained dominant. Later, government special subsidies facilitated efficient BIM implementation, reducing initial investment by 20% and averaging a 5-month decrease in design change rates. Through the Building Information Modeling (BIM) framework, we achieve precise quantification of component quantities, successfully avoiding material negative variance losses of 5000 metric tons. Leveraging BIM 5D technology for dynamic cost monitoring, we integrate construction schedules with architectural models to enable real-time cost tracking and analysis, proactively mitigating cost escalations caused by construction delays or design changes. By simulating construction schemes, we optimize material allocation and labor management, systematically reducing project costs. During the design phase, embedded cost simulation analysis ensures all schemes remain within budgetary limits. Precise monitoring of contract management and payment processes safeguards the secure and rational use of funds through digital platforms. Our full lifecycle cost control system, supported by real-time data updates, eliminates information lag and inaccuracies, assisting managers in scientifically formulating cost budgets and management plans. It enables automated prediction of cost deviations, risk early warning, and preventive measures. A visual cost management dashboard provides data-driven support for project team decision-making, with our overspending alert mechanism achieving a 92% accuracy rate. Combined with government subsidies reducing initial investment by 20%, the project ultimately achieved a total cost savings of 14.2% and a 10% profit margin increase.
From a full lifecycle perspective, after delivering the as-built model, the project generated a digital operation and maintenance manual in compliance with ISO 19650 standards, which require embedding equipment maintenance manuals and warranty information. By handing over high-precision BIM models containing geometric information, attribute parameters, and construction process records to the operation and maintenance team during the handover phase, the project improved mechanical and electrical system fault diagnosis efficiency by 43%, achieved a 98% asset data handover integrity rate, and reduced operation and maintenance costs by 23% (20% above the industry average). The project also established a three-level KPI quantitative management system, relying on BIM 5D to track real-time total cost savings of 14.2%, a 20% reduction in rework, and a 10% schedule shortening. It optimized resource allocation through data early warning and earned value analysis and linked KPI completion with performance, forming a “data collection-decision optimization-assessment incentive” model. This model not only achieved project-level cost savings of CNY 5 million and an average monthly reduction of 3.6 quality and safety hazards but also set a replicable example for “policy-industry-enterprise” collaborative BIM promotion.
(3)
Technical Proficiency and Application Capability
The project’s technical proficiency and application capability were realized through collision detection technology integration and digital twin collaboration. Based on Line of Balance (LOB) for optimized schedule conflict detection and 4D simulation for identifying resource allocation conflicts, the project used AI algorithms to automatically locate and recommend solutions for three core issues: hard collisions (structural-pipeline conflicts), soft collisions (insufficient operating space), and temporal collisions (process crossover conflicts). This automatically identified 23 pipeline conflicts, 40 space deficiencies, and 15 days of process overlap risks, directly reducing rework losses by CNY 850,000. Meanwhile, using BIM models as a foundation, the project constructed digital twins by integrating GIS and 3D laser scanning. During construction, 4D simulation optimized traffic guidance plans, saving CNY 127,000 in costs, while civil3D calculations reduced earthwork hauling distance by 3 km and shortened the monthly schedule by 3 days. During operation and maintenance, integrated sensors continuously monitor subgrade settlement and bridge vibration data, expected to reduce long-term maintenance costs by 23%, validating the efficiency-enhancing role of technical tools.
(4)
External Factors
The project strictly adheres to ISO 19650 standards, establishing cross-organizational BIM execution plans to standardize model delivery depth and information management processes at each stage. Using classified coding for unified data standards, it reduced relocation obstacle coordinate errors to ±0.1 m, advanced the schedule by 7 days, and ensured data security through permission matrices, intercepting 12 unauthorized access attempts. Relying on government “digital transformation subsidies for the construction industry” and tax relief policies, it expanded the BIM team and deepened technical applications. A standardized dispute resolution mechanism established under these standards clarified model liability in contracts, shortening dispute resolution cycles to 5 days. Integrating BIM + GIS technology improved mobile model loading speed by 40%, demonstrating the enabling power of technological innovation environments. Through the synergistic effect of multiple external factors, the project achieved a 98% model acceptance rate and a 23% improvement in implementation efficiency, verifying that standard leadership, policy-driven initiatives, and technological innovation serve as foundational support and dynamic engines for BIM implementation.
(5)
Project Factors
Facing challenges such as a long route (14.1 km), complex relocations (involving 30 villages), and large engineering volume (2.8 million cubic meters of earthwork), the project achieved precise obstacle positioning through BIM + GIS integrated modeling, resolving 23 pipeline conflicts in advance and reducing demolition and reconstruction costs by CNY 1.2 million. It also optimized earthwork allocation and high-risk engineering plans using 4D construction simulation. For the 42-month long-cycle management needs, it built a “design-construction-operation and maintenance” data chain centered on IFC standardization and data integration, real-time schedule monitoring via BIM 5D, and a 60% improvement in response efficiency to critical process delay risks, ultimately shortening the construction period by 10%. Focusing on owner cost control and team collaboration needs, it deepened design models to LOD350 to improve demolition evaluation accuracy, developed cross-software data conversion plugins for real-time collaboration, and increased prefabricated component efficiency for construction teams by 30%.
(6)
Organization and Management Factors
The project adopted the Obeya collaboration model to establish a three-level organizational structure for group control, branch company supervision/planning, and project implementation to enforce BIM application management, creating a cross-departmental centralized office mechanism where owners, designers, and constructors jointly defined BIM objectives. For example, a subgrade filling change dispute at K7 + 500 was resolved within 1 day through centralized discussion, an 85% efficiency improvement over traditional processes. Referencing the Common Data Environment (CDE) framework, it integrated full lifecycle data from design, construction, and operation/maintenance to support real-time access and version control for multiple participants. Design models directly drove construction material, reducing steel waste from 4% to 1.5%, while owners monitored cost variances in real-time through the platform and optimized mix ratios to save CNY 800,000. By incorporating organizational and management factor indicators, the project detailed model creation responsibility matrices in contracts with supporting default penalty clauses, boosting model compliance rates and reducing schedule deviation rates from 18% to 5%. Despite lower weighting, the adoption of mature collaboration models, standardized data management frameworks, and strengthened accountability systems improved overall team efficiency by 15%, validating that organizational management is indispensable for reducing collaboration losses and unlocking BIM benefits.

6. Conclusions

The study identifies personnel-related factors as the primary driver of BIM technology’s value realization, with their influence significantly surpassing other factors. Specifically, gaps in employees’ technical skills, interdepartmental collaboration abilities, and willingness to adopt BIM result in issues such as delayed model updates, information silos, and underutilization of tools. In addition, economic and market-related issues—such as misperceptions about cost-effectiveness, insufficient policy incentives, and intense market competition—complicate the adoption of BIM, especially for SMEs. To address these challenges, this paper proposes a system combining “technology support, organizational collaboration, human capability, policy guidance” to transition BIM from a technical tool to a vehicle for value creation. This system is centered on IFC standardization and data interoperability enhancement, and this approach establishes a unified data framework to facilitate seamless information exchange among all construction project stakeholders while streamlining BIM implementation workflows, the establishment of standardized talent training mechanisms, and the implementation of tiered subsidy policies.
Although this study presents a relatively comprehensive system of influencing factors, it has two main limitations. First, the data samples are predominantly from medium and large enterprises, limiting the insights into the challenges faced by SMEs in applying BIM. Second, the research does not deeply examine the differential impacts across regions and project types. To address these research gaps, future studies could incorporate case tracking and longitudinal data to explore the dynamic evolution of BIM applications. Additionally, investigating the potential role of emerging technologies, such as blockchain, in BIM collaborative management could provide valuable insights.

Author Contributions

C.Z. proposed innovation points, conducted the data collection and analysis, and wrote the manuscript. W.D. guided and modified the manuscript. W.S. provided research platforms and research funds. Y.D. provided the case information. All authors have read and agreed to the published version of the manuscript.

Funding

This research was funded by the Research Project of Hubei Provincial Department of Housing and Urban-Rural Development, Hubei Provincial Science and Technology Planning Project (Project No. 20222198).

Institutional Review Board Statement

Not applicable.

Informed Consent Statement

Informed consent was obtained from all authors participating in the study.

Data Availability Statement

The original contributions presented in this study are included in the article. Further inquiries can be directed to the corresponding authors.

Acknowledgments

We extend our heartfelt gratitude to our instructors for their invaluable guidance and constructive suggestions throughout the development of this thesis. We also express sincere appreciation to the experts who generously provided valuable data, insightful information, and thought-provoking comments during our research process. Special thanks are due to the research project supported by the Hubei Provincial Department of Housing and Urban-Rural Development, which provided essential financial support for this work.

Conflicts of Interest

Author You Du is from company Hubei Jiefengcheng Construction Engineering Co., Ltd., Wuhan. The remaining authors declare that the research was conducted in the absence of any commercial or finaical relationships that could be construed as a potential conflicts of interests.

References

  1. Mei, T.; Mu, C.; Jiang, X. Study on the Application Value of BIM in Construction Projects Based on Social Network Analysis (SNA). J. Eng. Manag. 2023, 37, 113–117. [Google Scholar]
  2. Shen, W. Evaluation Study on Influencing Factors of BIM Application Benefits in Construction Projects Based on Structural Equation Modeling (SEM); Beijing University of Civil Engineering and Architecture: Beijing, China, 2019. [Google Scholar]
  3. Wang, Y.; Zhu, L.; Wu, P. Impact of BIM Technology on Construction Project Management Based on Structural Equation Modeling (SEM). Eng. Constr. 2025, 57, 68–75. [Google Scholar]
  4. Li, F.; Lu, D.; Guan, G. Top-Level Design of BIM Application Standards for Construction Units Based on Structural Equation Modeling (SEM). Pract. Theory Math. 2019, 49, 88–96. [Google Scholar]
  5. Shen, L.; Song, J.; Qian, J. Key Influencing Factors and Countermeasures for BIM Application Benefits Based on DEMATEL Method. J. Civ. Eng. Manag. 2018, 35, 45–51. [Google Scholar]
  6. Li, M.; Lai, J.; Chen, Q. Risk Assessment of BIM Technology Application Based on Structural Equation Modeling (SEM). J. Chongqing Univ. Technol. (Nat. Sci.) 2018, 32, 206–212. [Google Scholar]
  7. Ahn, S.; Kim, T.; Park, Y.J.; Kim, J.-M. Improving effectiveness of safety training at construction worksite using 3D BIM simulation. Adv. Civ. Eng. 2020, 2020, 2473138. [Google Scholar] [CrossRef]
  8. Han, Y.; Diao, Y.; Yin, Z.; Jin, R.; Kangwa, J.; Ebohon, O.J. Immersive technology-driven investigations on influence factors of cognitive load incurred in construction site hazard recognition, analysis and decision making. Adv. Eng. Inform. 2021, 48, 101298. [Google Scholar] [CrossRef]
  9. Chen, H.; Hou, L.; Zhang, G.K.; Moon, S. Development of BIM, IoT and AR/VR technologies for fire safety and upskilling. Autom. Constr. 2021, 125, 103631. [Google Scholar] [CrossRef]
  10. Fan, W.; Zhou, J.; Zhou, J.; Liu, D.; Shen, W.; Gao, J. Safety management system prototype/framework of deep foundation pit based on BIM and IoT. Adv. Civ. Eng. 2021, 2021, 5539796. [Google Scholar] [CrossRef]
  11. Qiao, J.B.; Zhu, J.; Xu, Z.H.; Han, B. Research on systematic management and application of ISO 19650–1.2. Archit. Technol. 2025, 56, 243–246. [Google Scholar] [CrossRef]
  12. Elsayegh, A.; El-adaway, I.H. Holistic study and analysis of factors affecting collaborative planning in construction. J. Constr. Eng. Manag. 2021, 147, 04021023. [Google Scholar] [CrossRef]
  13. Zhang, J.; Huang, J.; Su, T. Analysis of the Application Value of BIM in the Design of Large Public Construction Projects. Build. Sci. 2019, 35, 45–50. [Google Scholar]
  14. Bidhendi, A.; Arbabi, H.; Mahoud, M. Perceived effect of using BIM for improving construction safety. Asian J. Civ. Eng. 2022, 23, 695–706. [Google Scholar] [CrossRef]
  15. Dou, Y.; Bo, Q. Characteristics and dynamics of BIM adoption in China: Social network analysis. J. Constr. Eng. Manag. 2022, 148, 04022025. [Google Scholar] [CrossRef]
  16. Zhang, C.; He, K.; Zhang, W.; Jin, T.; Ao, Y. Game evolution analysis of BIM application willingness of prefabricated construction parties. Eng. Constr. Archit. Manag. 2024, 32, 3132–3165. [Google Scholar] [CrossRef]
  17. Fan, Z. Analysis of the Application Value of BIM in Engineering Management During the Construction Phase. Fujian Build. Mater. 2021, 8, 104–106. [Google Scholar]
  18. Li, C. Study on the Maturity Evaluation of BIM Capability for Construction General Contractors Based on SEM and Matter-Element Analysis; Shandong Jianzhu University: Jinan, China, 2020. [Google Scholar]
  19. Ma, S. Research on Barriers to BIM Application in China’s Construction Industry Based on Structural Equation Modeling (SEM); Zhongyuan University of Technology: Zhengzhou, China, 2021. [Google Scholar]
  20. Hosseini, O.; Maghrebi, M. Risk of fire emergency evacuation in complex construction sites: Integration of 4D-BIM, social force modeling, and fire quantitative risk assessment. Adv. Eng. Inform. 2021, 50, 101378. [Google Scholar] [CrossRef]
  21. Al-Ashmori, Y.Y.; Othman, I.; Rahmawati, Y.; Amran, Y.H.M.; Sabah, S.H.A.; Darda, A.; Mikić, M. BIM benefits and its influence on the BIM implementation in Malaysia. Ain Shams Eng. J. 2020, 11, 1013–1019. [Google Scholar] [CrossRef]
  22. Deng, J.; Li, X.; Rao, J. Research on Influencing Factors and Driving Path of BIM Application in Construction Projects Based on the SD Model in China. Buildings 2023, 13, 2794. [Google Scholar] [CrossRef]
  23. Li, L.; Yang, Z.; Zhang, X.; Song, P. The Application Value of BIM in Engineering Management During the Construction Phase. Build. Technol. 2016, 47, 698–700. [Google Scholar]
  24. Shirowzhan, S.; Sepasgozar, S.M.E.; Edwards, D.J.; Li, H.; Wang, C. BIM compatibility and its differentiation with interoperability challenges as an innovation factor. Autom. Constr. 2020, 112, 103086. [Google Scholar] [CrossRef]
  25. Ba, S.; Rewan, T.; Qi, X. Factors Influencing the Willingness to Participate in the Personal Pension System—Based on Structural Equation Modeling. Soc. Secur. Stud. 2024, 1, 3–17. [Google Scholar]
  26. Davtalab, O.; Kazemian, A.; Khoshnevis, B. Perspectives on a BIM-integrated software platform for robotic construction through Contour Crafting. Autom. Constr. 2018, 89, 13–23. [Google Scholar] [CrossRef]
  27. Won, J.; Lee, G. How to tell if a BIM project is successful: A goal-driven approach. Autom. Constr. 2016, 69, 34–43. [Google Scholar] [CrossRef]
Figure 1. Second-order confirmatory factor analysis model.
Buildings 15 01875 g001
Table 1. Classification of influencing factors of BIM application benefits.
Latent VariableObserved VariableReferences
Technical Level and Application Capability (JS)Software functionality (JS1)[1,3]
Hardware performance and network (JS2)[2,12]
Technical proficiency (JS3)[4,6]
Technological innovation (JS4)[5,13]
Degree of BIM integrated application (JS5)[3]
Completeness of BIM component library (JS6)[3]
Data management capability (JS7)[5,11]
Organization and Management (ZZ)Project management efficiency (ZZ1)[5]
Level of collaborative work (ZZ2)[9,14]
Degree of BIM-based organizational structure (ZZ3)[10]
Trust and sharing awareness among participants (ZZ4)[8,10]
Leadership and support (ZZ5)[15,16]
Staff training and technical support (ZZ6)[15]
BIM application planning and schemes (ZZ7)[7]
Human Capability (RY)Technical ability and number of staff (RY1)[7,8]
Cross-departmental collaboration ability (RY2)[9,17]
Enthusiasm of technical personnel in using BIM (RY3)[18]
Economic and Market Factors (JJ)Demand for BIM and benefit validation (JJ1)[18,19]
Understanding of BIM application benefits and difficulties (JJ2)[19]
Cost–benefit analysis (JJ3)[19]
Market competition pressure (JJ4)[9,20]
Contract terms (JJ5)[18]
Project Factors (XM)Project scale and complexity (XM1)[19]
Project schedule management (XM2)[13,19]
Project team and owner requirements (XM3)[9,18]
External Factors (WJ)Relevant policies (WJ1)[21,22]
Technological development and innovation (WJ2)[23]
Completeness of BIM-related standards and specifications (WJ3)[24]
BIM project dispute resolution mechanism (WJ4)[6,25]
Social recognition of BIM (WJ5)[7,26]
Table 2. Reliability test results.
Latent VariableNumber of Observed IndicatorsCronbach’s AlphaOverall Cronbach’s Alpha
Technical Level and Application Capability70.8990.936
Organization and Management70.896
Human Capability30.792
Economic and Market Factors50.857
Project Factors30.810
External Factors50.878
Table 3. KMO and Bartlett’s Test.
CategoryValue
KMO Measure of Sampling Adequacy0.928
Bartlett’s Test of SphericityApprox. Chi-Square4096.382
Degrees of Freedom435
Significance Level (Sig.)0.000
Table 4. Total variance explained.
Total Variance Explained
Initial EigenvaluesExtraction Sums of Squared Loading
ComponentTotal% of VarianceCumulative%Total% of VarianceCumulative%
110.60135.33735.33710.60135.33735.337
22.4628.20843.5442.4628.20843.544
32.3187.72651.2702.3187.72651.270
42.0136.71057.9802.0136.71057.980
51.3454.48362.4631.3454.48362.463
61.1603.86666.3291.1603.86666.329
Table 5. Model fit evaluation.
Fit IndexCMN/dfGFINFICFIRMSEAIFITLI
Standard<2>0.90>0.90>0.90<0.05>0.90>0.90
Actual Value1.1840.8980.890.9810.0270.9810.979
Evaluation OutcomePassMarginalMarginalPassPassPassPass
Table 6. Table of factor loading coefficients.
Latent VariableObserved VariableUnstandardized Factor LoadingStandard ErrorC.R. (t-Value)pStandardized Factor LoadingAVECR
JS1.000 0.7050.5150.864
ZZ0.9200.1287.195***0.684
RY1.1040.1467.550***0.781
SC0.6980.0997.059***0.716
XM1.0600.1467.254***0.707
WJ1.0250.1417.295***0.707
Technical Level and Application CapabilityJS11.000 0.7510.5590.899
JS20.8700.07911.037***0.693
JS31.0420.08612.133***0.756
JS41.0080.08511.920***0.744
JS51.0280.08412.232***0.762
JS61.0180.08412.114***0.755
JS71.0520.08512.409***0.772
Organization and ManagementZZ11.000 0.7520.5510.896
ZZ20.9680.08511.368***0.713
ZZ30.9850.08311.817***0.739
ZZ41.1380.09112.515***0.779
ZZ51.0510.08612.286***0.766
ZZ60.8330.07610.930***0.688
ZZ70.9960.08212.122***0.757
Human capabilityRY11.000 0.7650.5610.793
RY21.0350.09510.876***0.758
RY30.8870.08510.491***0.723
Economic and Market FactorsSC11.000 0.698
SC21.2780.12010.660***0.7450.5480.858
SC31.3480.12211.038***0.776
SC41.2930.12510.346***0.7210.5900.812
SC51.3000.12010.814***0.758
Project FactorsXM11.000 0.787
XM20.9410.08211.489***0.779
XM30.9510.08611.023***0.737
External FactorsWJ11.000 0.753
WJ21.0670.08612.411***0.7850.5930.879
WJ31.0830.08712.483***0.789
WJ41.0280.08312.449***0.787
WJ50.9290.08011.555***0.733
“***” indicates that the p value is significant.
Table 7. Path coefficient evaluation criteria.
Path Coefficient RangeInfluence LevelConsideration Necessity
<0.60MinorOptional
0.60–0.65ModerateRecommended
0.66–0.70SignificantNecessary
0.71–0.75CriticalEssential
>0.75ParamountMandatory
Table 8. Weight coefficients of indicators at each level.
W(Fm)W(Tmk)W(Fm) × W(Tmk)Wmk
Technical Level and Application Capability (0.164)JS1 (0.144)0.164 × 0.1440.024
JS2 (0.132)0.164 × 0.1320.022
JS3 (0.144)0.164 × 0.1440.024
JS4 (0.142)0.164 × 0.1420.023
JS5 (0.146)0.164 × 0.1460.024
JS6 (0.144)0.164 × 0.1440.024
JS7 (0.148)0.164 × 0.1480.024
Organization and Management (0.159)ZZ1 (0.145)0.159 × 0.1450.023
ZZ2 (0.137)0.159 × 0.1370.022
ZZ3 (0.142)0.159 × 0.1420.023
ZZ4 (0.150)0.159 × 0.1500.024
ZZ5 (0.147)0.159 × 0.1470.023
ZZ6 (0.132)0.159 × 0.1320.021
ZZ7 (0.146)0.159 × 0.1460.023
Human Capability (0.182)RY1 (0.341)0.182 × 0.3410.062
RY2 (0.337)0.182 × 0.3370.061
RY3 (0.322)0.182 × 0.3220.059
Economic and Market Factors (0.167)JJ1 (0.189)0.167 × 0.1890.032
JJ2 (0.201)0.167 × 0.2010.034
JJ3 (0.210)0.167 × 0.2100.035
JJ4 (0.195)0.167 × 0.1950.033
JJ5 (0.205)0.167 × 0.2050.034
Project Factors (0.164)XM1 (0.342)0.164 × 0.3420.056
XM2 (0.338)0.164 × 0.3380.055
XM3 (0.320)0.164 × 0.3200.052
External Factors (0.164)WJ1 (0.196)0.164 × 0.1960.032
WJ2 (0.204)0.164 × 0.2040.033
WJ3 (0.205)0.164 × 0.2050.034
WJ4 (0.205)0.164 × 0.2050.034
WJ5 (0.191)0.164 × 0.1910.031
Table 9. Evaluation and Scoring of Influencing Factors on BIM Application Benefits.
Latent VariableObserved VariableReferences
Technical Level and Application Capability (JS)Software functionality (JS1)85
Hardware performance and network (JS2)90
Technical proficiency (JS3)80
Technological innovation (JS4)80
Degree of BIM integrated application (JS5)80
Completeness of BIM component library (JS6)75
Data management capability (JS7)75
Organization and Management (ZZ)Project management efficiency (ZZ1)80
Level of collaborative work (ZZ2)85
Degree of BIM-based organizational structure (ZZ3)85
Trust and sharing awareness among participants (ZZ4)80
Leadership and support (ZZ5)80
Staff training and technical support (ZZ6)90
BIM application planning and schemes (ZZ7)80
Human Capability (RY)Technical ability and number of staff (RY1)90
Cross-departmental collaboration ability (RY2)90
Enthusiasm of technical personnel in using BIM (RY3)95
Economic and Market Factors (JJ)Demand for BIM and benefit validation (JJ1)90
Understanding of BIM application benefits and difficulties (JJ2)85
Cost–benefit analysis (JJ3)85
Market competition pressure (JJ4)75
Contract terms (JJ5)85
Project Factors (XM)Project scale and complexity (XM1)85
Project schedule management (XM2)80
Project team and owner requirements (XM3)80
External Factors (WJ)Relevant policies (WJ1)85
Technological development and innovation (WJ2)80
Completeness of BIM-related standards and specifications (WJ3)85
BIM project dispute resolution mechanism (WJ4)80
Social recognition of BIM (WJ5)85
Table 10. Final score of each indicator.
Latent VariableFinal Score (Yk)Observed VariableWmkFinal Score (Mij)
Technical Level and Application Capability (JS)13.3Software functionality (JS1)0.0242.04
Hardware performance and network (JS2)0.0221.98
Technical proficiency (JS3)0.0241.92
Technological innovation (JS4)0.0231.84
Degree of BIM integrated application (JS5)0.0241.92
Completeness of BIM component library (JS6)0.0241.8
Data management capability (JS7)0.0241.8
Organization and Management (ZZ)13.155Project management efficiency (ZZ1)0.0231.84
Level of collaborative work (ZZ2)0.0221.87
Degree of BIM-based organizational structure (ZZ3)0.0231.955
Trust and sharing awareness among participants (ZZ4)0.0241.92
Leadership and support (ZZ5)0.0231.84
Staff training and technical support (ZZ6)0.0211.89
BIM application planning and schemes (ZZ7)0.0231.84
Human Capability (RY)46.675Technical ability and number of staff (RY1)0.0625.58
Cross-departmental collaboration ability (RY2)0.0615.49
Enthusiasm of technical personnel in using BIM (RY3)0.0595.605
Economic and Market Factors (JJ)14.11Demand for BIM and benefit validation (JJ1)0.0322.88
Understanding of BIM application benefits and difficulties (JJ2)0.0342.89
Cost–benefit analysis (JJ3)0.0352.975
Market competition pressure (JJ4)0.0332.475
Contract terms (JJ5)0.0342.89
Project Factors (XM)13.32Project scale and complexity (XM1)0.0564.76
Project schedule management (XM2)0.0554.4
Project team and owner requirements (XM3)0.0524.16
External Factors (WJ)12.95Relevant policies (WJ1)0.0322.72
Technological development and innovation (WJ2)0.0332.64
Completeness of BIM-related standards and specifications (WJ3)0.0342.89
BIM project dispute resolution mechanism (WJ4)0.0342.72
Social recognition of BIM (WJ5)0.0211.98
Disclaimer/Publisher’s Note: The statements, opinions and data contained in all publications are solely those of the individual author(s) and contributor(s) and not of MDPI and/or the editor(s). MDPI and/or the editor(s) disclaim responsibility for any injury to people or property resulting from any ideas, methods, instructions or products referred to in the content.

