Abstract
Bridges play a key and controlling role in transportation systems. Steel bridges are favored for their high strength, good seismic performance, and convenient construction. As important node connectors of steel bridges, high-strength bolts are extremely susceptible to damage such as corrosion and loosening. Therefore, accurate identification of bolt loosening is crucial. First, a new type of adhesive piezoelectric sensor is designed and prepared using PMN-PT piezoelectric single-crystal materials. The PMN-PT sensor and polyvinylidene fluoride (PVDF) sensor are subjected to steel plate fixed frequency load and swept frequency load tests to test the performance of the two sensors. Then, a steel plate component connected by high-strength bolts is designed. By applying exciter square wave load to the structure, the vibration response characteristics of the structure are analyzed to identify the loosening of the bolts. In addition, a piezoelectric smart washer sensor is designed to make up for the shortcomings of the adhesive piezoelectric sensor, and the effectiveness of the piezoelectric smart washer sensor is verified. Finally, a bolt loosening index is proposed to quantitatively evaluate the looseness of the bolt. The results show that the sensitivity of the PMN-PT sensor is 21 times that of the PVDF sensor. Compared with the peak stress change, the natural frequency change is used to identify the bolt loosening more effectively. Piezoelectric smart washer sensor and bolt loosening indicator can be used for bolt loosening identification.
1. Introduction
In recent decades, with the acceleration of urbanization and the development of transportation in China, bridge construction has also made great progress. Among these, steel structure bridges occupy an important position with their high strength, low deadweight, strong earthquake resistance, high construction efficiency, and recyclability. In steel structures, bolt connections are related to the safety of the entire steel bridge. However, due to the large loads borne by steel bridges during construction and operation and the complex natural environment, bolts are very likely to loosen and be damaged, which may lead to catastrophic consequences, cause huge economic losses, and threaten people’s lives and property. Therefore, it is of great significance to develop accurate and efficient bolt loosening damage identification technology.
Currently, the identification methods of bolt loosening include conventional detection methods, acoustic emission detection technology, ultrasonic detection methods, piezoresistive impedance method, etc., [1,2,3,4,5]. Conventional detection methods include the visual detection method and the knock echo method, etc. These methods not only cost a lot of manpower but are also easily affected by subjective factors, resulting in low measurement accuracy. Acoustic emission detection technology and ultrasonic detection methods usually require large and expensive equipment and are highly dependent on personal expertise [6,7]. In actual engineering, due to many factors such as the geometric structure and geographical environment of civil engineering structures, their application is also very limited. The piezoresistive impedance method is a real-time monitoring technology for structural health, which has the advantages of simple measurement, reasonable price, and easy installation. It has been widely used in civil engineering monitoring [8,9,10]. Its principle is to use the piezoelectric properties of piezoelectric materials to stimulate the piezoelectric effect by applying high-frequency electrical excitation. In this process, the piezoelectric sensors and actuators installed on the surface of the structure play a key role. They can detect the changes in sensor electrical impedance caused by damage, thereby realizing real-time monitoring of the health of the structure [11,12]. In the application of piezoelectric impedance technology, piezoelectric elements can act as actuators to convert electrical signals into mechanical stress, and as sensors to convert mechanical vibrations fed back by the structure into electrical signals. These electrical signals are analyzed to identify the location of the damage and evaluate the integrity of the structure. However, while sensors made of traditional piezoelectric materials have mature applications in many fields, they are limited by the piezoelectric properties of the materials, and the sensors have poor capture effects on vibration signals and are prone to losing information in the signals. PMN-PT (lead magnesium titanium niobate) is relatively rare in the fields of civil engineering and structural health monitoring [13,14]. PMN-PT single crystals have excellent piezoelectric properties, which are greatly improved compared with traditional piezoelectric materials such as PZT and PVDF [15,16,17,18,19,20,21,22]. However, in the field of civil engineering structural health monitoring, the material is extremely susceptible to damage and failure due to the mechanical properties of the material and the various complex load conditions and harsh natural environment faced by civil engineering structures. This material has not been well applied.
In structural monitoring systems, identification based on structural vibration information is a common method. Vibration information can be further divided into three major categories: time domain information, frequency domain information, and modal domain information. Over the years, methods for damage identification based on these three types of information have been developed and applied maturely, among which the method of analyzing modal domain information has developed the best. In practical engineering applications, if the modal parameters of the structure can be obtained and the accuracy of the obtained parameters can be verified, these parameters can be used to identify structural damage [23,24]. Modal parameters include natural frequency, structural stiffness, modal vibration shape, and modal strain energy. Many scholars have conducted extensive research on modal parameter damage identification technology. For example, from the research of Seyedpoor [25], we can conclude that structural damage will lead to a decrease in the stiffness of the structure. Based on this, identifying structural damage is also a good direction. However, many scholars have found through research that structural stiffness can only better reflect damage when the structural damage mutation is severe, and is very insensitive when the damage is minor. Pandey [26] and West [27] both studied the use of modal vibration shapes to identify damage. Although they can both identify damage, their accuracy is not as good as using the natural frequency of the structure. Sarawu [28] summarized the early methods of using natural frequency to identify structural damage, pointing out that it is not affected by the measurement position and has high accuracy, but the effect of judging the damage position is poor; Wang Xin et al. [29] combined the change of structural natural frequency with static deformation to accurately identify the location and degree of single crack damage. In the field of bolt loosening damage identification, some scholars identify bolt loosening damage based on vibration signals. Eraliev et al. [30] proposed a vibration-based artificial intelligence algorithm to achieve early detection and identification of bolt loosening. WD Zhu et al. [31] developed a vibration-based damage detection method that uses the change of structural natural frequency to detect the location and degree of damage in the structure. This method is particularly suitable for space truss structures, including detecting damage types such as loose bolt connections. It can be seen that the identification of bolt loosening damage based on vibration signals is feasible.
Therefore, in view of the above situation, this paper intends to design and prepare a sensor based on PMN-PT piezoelectric single crystal material to make up for the shortcomings of ordinary piezoelectric sensors that have weak signals and are easily interfered with, resulting in large errors. This paper uses this sensor combined with vibration signals to study the identification of bolt loosening damage, and improves the accuracy and efficiency of civil engineering structural health monitoring.
This paper designs a bonded piezoelectric sensor based on PMN-PT piezoelectric single crystal through a research method that combines theoretical analysis, experimental exploration and simulation, and conducts bolt loosening damage identification experiments and simulations based on PMN-PT sensors. An improved scheme for piezoelectric smart washer sensors is proposed, and bolt loosening damage identification indicators are established. The structural framework of this paper is shown in Figure 1.
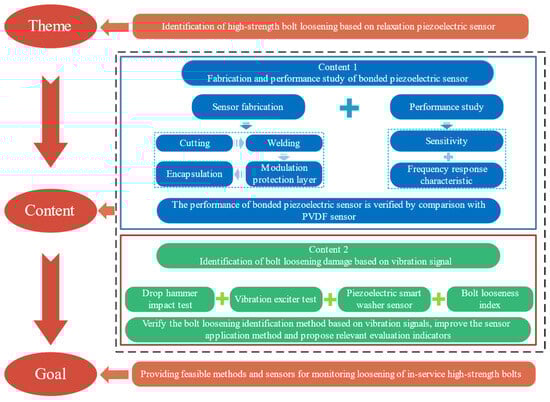
Figure 1.
The frame structure of this study.
2. PMN-PT Sensing Mechanism of Piezoelectric Materials
The core of piezoelectric sensors lies in piezoelectric elements made of piezoelectric materials, which realize the conversion of mechanical energy into electrical energy through the piezoelectric effect [32,33]. The piezoelectric effect can be divided into positive and inverse piezoelectric effects. The positive piezoelectric effect is the conversion of mechanical energy into electrical energy, and the inverse piezoelectric effect is the conversion of electrical energy into mechanical energy. Based on the positive piezoelectric effect, the working mechanism of piezoelectric sensors for structural stress monitoring and identification can be described by the first-order piezoelectric equation [34].
The first-order piezoelectric equation refers to the piezoelectric element being mechanically free and electrically short-circuited, T = U = 0. With stress σ and electric field strength E as independent variables and strain ε and electric displacement D as dependent variables, the corresponding piezoelectric equation is obtained as follows:
In the formula, Cλu, djλ, and μij are the sensor’s flexibility coefficient, piezoelectric strain constant, and dielectric constant, respectively. The piezoelectric strain constant describes the intrinsic relationship between external mechanical stress and charge displacement. It is often used to calculate key indicators such as the material’s charge output, voltage output, and charge sensitivity. The i and j in the subscripts represent the polarization direction of the piezoelectric material and the direction of the external mechanical stress, respectively [35]. Figure 2 shows the coordinate system of the piezoelectric material with a polarization direction of 3, with the x-axis, y-axis, and z-axis directions marked as 1, 2, and 3, respectively. According to the piezoelectric material’s different external forces and deformation directions, the piezoelectric constant can be represented by d31, d32, and d33. For example, the longitudinal piezoelectric coefficient d33 represents the strain response coefficient of the piezoelectric material in the polarization direction. In addition, the dielectric constant, also known as the relative dielectric constant, reflects the proportional relationship between the internal polarization intensity and the external electric field intensity of the piezoelectric material when subjected to an external electric field. The dielectric constant reflects the piezoelectric material’s ability to respond to electric fields and substantially impacts the piezoelectric element’s operating frequency range.
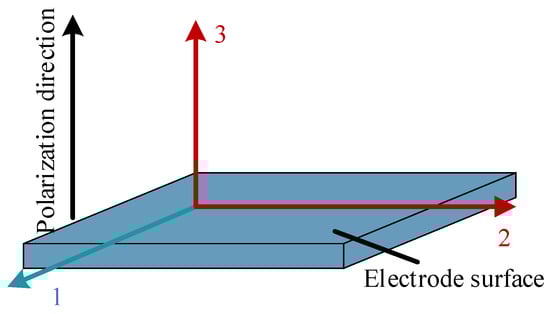
Figure 2.
Piezoelectric material coordinate system diagram.
3. Design and Performance Analysis of PMN-PT Sensor
3.1. PMN-PT Sensor
To ensure that the homemade PMN-PT sensor can accurately respond to changes in structural stress and that reliable measurement results can be obtained in practical applications, a sensitivity test on the homemade PMN-PT piezoelectric sensor is necessary. Sensitivity refers to the ratio of the change in the sensor output voltage to the corresponding stress change, which can measure the sensor’s ability to respond to applied stress. The experiment selected the main materials of 500 × 60 × 8 mm Q345 high-performance steel plate, PMN-PT sensor, and PVDF sensor. The piezoelectric sensitive element of the PMN-PT sensor is the relaxor ferroelectric single crystal PMN-PT, which is cut into 5 × 5 × 0.5 mm, as shown in Figure 3a. The processed PMN-PT single crystal is welded to the wire. Then, the epoxy resin AB glue is modulated according to the volume ratio of A:B = 2.5:1, and then it is used to encapsulate the sensor to increase the stability of the wire connection and the waterproofness of the sensor. Then, it is placed in a cool and dry place for more than 24 h before demolding. The prepared sensor is shown in Figure 3b. Some performance parameters of the two sensors and their installation diagrams are shown in Table 1 and Figure 4.
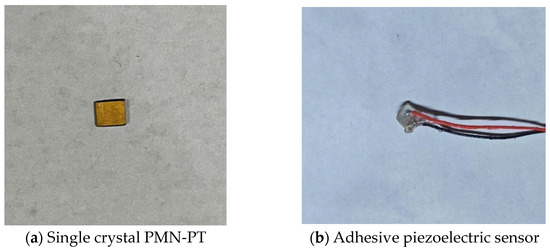
Figure 3.
Sensor diagram.

Table 1.
Sensor performance parameters.
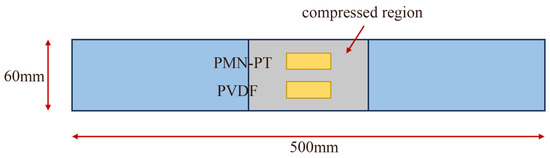
Figure 4.
Sensor layout diagram.
3.2. Performance Test
3.2.1. Test Preparation
The construction of the test platform is shown in Figure 5. The loading device uses an E45.695 electronic universal testing machine to apply cyclic loads to the steel plate. The load command is controlled by the MTS function. The load signal is collected and stored in the computer through the sensor in the pressure head of the testing machine. The sensor signal is amplified by the charge amplifier and input into the data acquisition system for collection. Figure 5a,b shows the test platform’s theoretical structures and actual picture of the test platform.
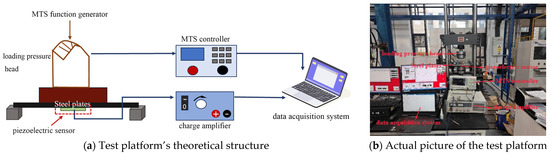
Figure 5.
Sensitivity test platform.
3.2.2. Response to Sinusoidal Excitations
First, the steel plate was preloaded with 1 kN, and the formal loading started for 3 s. Then, a positive load with a frequency of 1 Hz and an amplitude of 1 kN was applied for 10 s.
Test result analysis:
After loading is completed, the corresponding data are extracted from the data acquisition system for analysis. Figure 6 shows the time history curve obtained by denoising the data collected by the piezoelectric sensor through MATLAB R2020b.
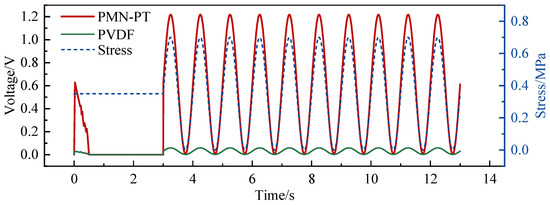
Figure 6.
Input load and voltage-stress time history curve.
As can be seen from Figure 6, during the 1 Hz sinusoidal dynamic load loading, the sensor’s voltage output is stable, and there is no phase difference. In the formal loading stage, the piezoelectric sensor’s voltage response signal curve corresponds well to the waveform of the structural stress curve, and the test results are highly accurate.
The sensitivity of the two sensors is further calculated. According to the definition of the sensitivity of the piezoelectric sensor as the ratio of the change in the output voltage to the change in the stress value, the voltage generated by the two sensors is linearly fitted with the stress signal at the corresponding time. The slope of the straight line is the sensor sensitivity. The fitting result is shown in Figure 7. The sensitivity of the PMN-PT piezoelectric sensor is 1.734 V/MPa, and the linear fitting R2 is 0.985; the sensitivity of the PVDF piezoelectric sensor is 0.081 V/MPa, and R2 is 0.981. It can be seen that the sensitivity of PMN-PT is much higher than that of PVDF, and the response effect to stress is better.
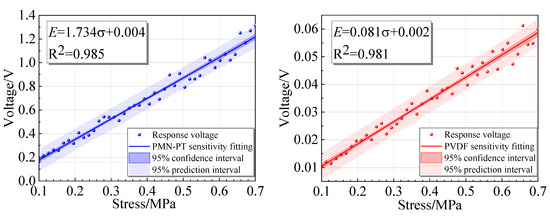
Figure 7.
Sensitivity fitting.
3.3. Frequency Response Characteristics Test
The frequency response characteristic test is crucial for evaluating the performance of piezoelectric sensors under different frequency forces and ensuring their applicability and reliability. The sensor’s frequency response range refers to the frequency range with no phase difference, and the sensitivity is stable when it is working. The wider the frequency response range, the wider the environmental range in which the sensor can be applied in actual engineering.
The following test was also carried out using the device described in Section 3.1. Considering that the monitoring frequency range of the bridge structure is usually within 1000 Hz, the frequency range of the swept frequency signal used in the test is 0–1000 Hz. Before the test, the steel plate component was preloaded with 0.5 kN for 3 s; then, the formal loading began, applying a swept frequency sine wave load with an amplitude of 0.5 kN for 10 s. The voltage response signals generated by the two sensors were collected using DH-5922 N and then converted into frequency domain signals through Fourier transform, as shown in Figure 8. The test results show that the voltage response curve of the piezoelectric sensor is consistent with the changing trend of the structural stress curve, indicating that the piezoelectric sensor can respond well to the changes in internal stress of the structure. At the same time, the response voltage of the PMN-PT sensor is much higher than the response voltage of the PVDF sensor, proving that the PMN-PT sensor has a better response effect on stress.
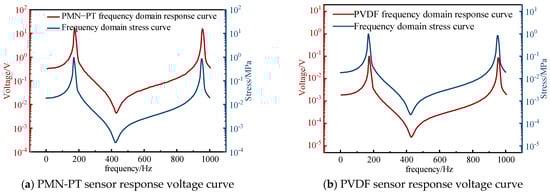
Figure 8.
Sensor frequency sweep response voltage.
In structural health monitoring, the sensor will be subjected to loads of different frequencies. At this time, the stability of the sensor sensitivity is particularly important. This paper fits the frequency sweep results of the structural stress amplitude and the sensor output voltage amplitude to obtain the piezoelectric sensor’s sensitivity curve in the frequency domain, as shown in Figure 9.
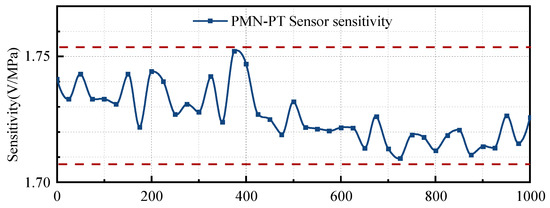
Figure 9.
Sweep frequency sensitivity curve.
The figure shows that within the frequency range of 0–1000 Hz, the sensitivity stability of the sensor is good, and its sensitivity range is between 1.719 and 1.752 V/MPa, with a maximum error of only 1.910%. Although the output signals of both sensors can reflect the natural frequency of the structure, the response voltage of the PVDF sensor is too small and does not have good anti-interference ability. In the actual application of structural health monitoring, there are various interference signals, so it is not suitable for measuring the structure’s natural frequency. On the other hand, the response voltage of the PMN-PT sensor is large in value and has strong anti-interference ability. It can be used to measure the structure’s natural frequency, laying the foundation for the loosening damage identification of bolts based on vibration signals in the following text.
4. Bolt Loosening Damage Identification Based on Vibration Signals
The performance of the PMN-PT sensor was tested in the previous chapter. This chapter designed experiments to study the relationship between the structure’s peak stress, natural frequency, and bolt preload. Select indicators that can be used to identify bolt loosening. Then, finite element simulation is used to simulate different working conditions to calculate the structure. Compare and analyze the simulation and test results to verify the accuracy of identifying bolt loosening damage using relevant indicators. Finally, the application form of the sensor was improved, and relevant damage indicators were proposed to evaluate the degree of bolt loosening damage.
4.1. Bolt Loosening Damage Identification Test Based on PMN-PT Sensor
4.1.1. Experimental Design
The test uses the dynamic signal acquisition instrument DH-5922N to accurately measure the signal generated by the sensor, as shown in Figure 10a; the SA-PA010 power amplifier is selected to drive the exciter as a high-power vibration source for vibration testing and vibration measurement, as shown in Figure 10b; the bolts are M16 large hexagonal high-strength bolts with a nominal diameter of 16 mm and a length of 60 mm, as shown in Figure 10c.
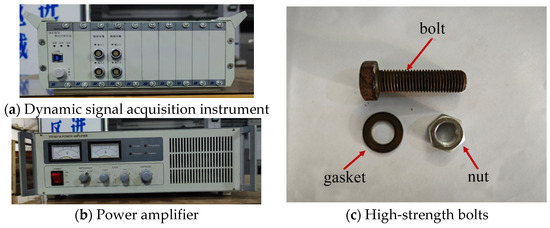
Figure 10.
Test equipment and materials.
This test is based on the actual material selection of steel structure bridges. Q345 steel plates are selected and matched with M16-grade large hexagonal high-strength bolts. According to the requirements of the “Code for design, construction, and acceptance of high strength bolting for steel structure” (JGJ82-2011) [36], the diameter of the M16 bolt is 16 mm, the allowable deviation is ±0.43 mm, the diameter of the bolt hole is 17.5 mm, and the allowable deviation is +0.43 mm. The distance from the center of the bolt hole to the edge of the component is a maximum of 4 times the bolt hole diameter and a minimum of 1.5 times the bolt hole diameter. The specimen parameters are shown in Figure 11.
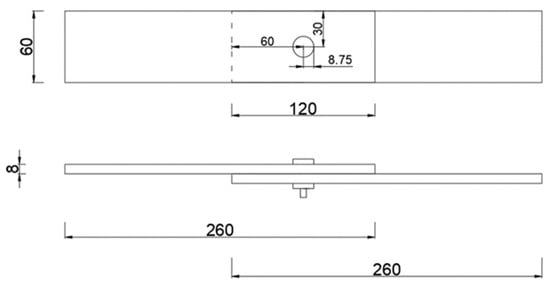
Figure 11.
Schematic diagram of specimen geometry.
4.1.2. Vibration Test of the Exciter
The test equipment includes an exciter, SA-PA010 power amplifier (Wuxi Shiao Technology Co., Ltd. from Jiangsu Province, China), and DH-5922N dynamic signal acquisition instrument (Jiangsu Donghua Testing Technology Co., Ltd. from Jiangsu Province, China). The connection of the steel plate specimen is the same as the previous drop hammer impact test, as shown in Figure 12b. The two steel plates are connected by high-strength bolts and fixed by a clamp. The PMN-PT sensor is attached to the upper surface of the nut connected to the charge amplifier and finally connected to the DH-5922D dynamic signal acquisition instrument. The schematic diagram of the test platform is shown in Figure 12a.
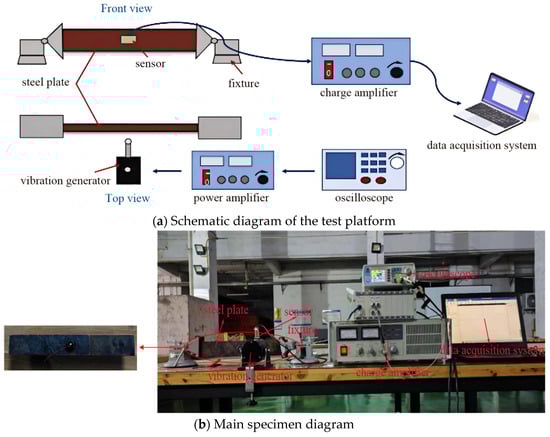
Figure 12.
Construction of vibration test platform for exciter.
According to the test platform schematic diagram, connect the vibration test-related instruments, including sensors, acquisition instruments, charge amplifiers, etc., as shown in Figure 12b, and use a wrench to apply bolt preload to the structure. After the sensor signal is stable, use the exciter to apply continuous low-frequency excitation to the structure, collect the response voltage of the PMN-PT sensor, and record the corresponding bolt preload; use a torque wrench to continuously increase the preload, and repeat the previous experimental steps until the preload is loaded to 10,000 N; in the test, the exciter applies a square wave load with an excitation amplitude of 10 N and a frequency of 2 Hz, and its time history curve is shown in Figure 13a. Use the Donghua DHDAS dynamic acquisition system to collect the sensor’s response voltage signal, perform a fast Fourier transform on the voltage signal, and output the signal as a frequency domain signal, as shown in Figure 13b. Analysis of the frequency domain diagram shows that the frequency corresponding to the spectrum diagram’s peak voltage is the structure’s natural frequency. This method can determine the structure’s natural frequency under different bolt preloads.
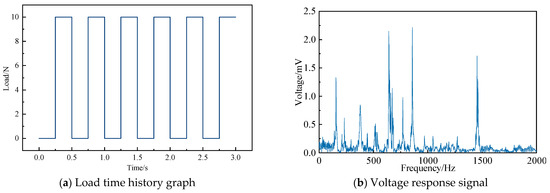
Figure 13.
Load time history and frequency domain diagram.
Due to the many test conditions, the spectrum diagram at the 1st order peak when the bolt preload is 100 N, 500 N, and 1000 N is extracted, as shown in Figure 14. Analysis shows that the 1st order peak of the spectrum diagram appears between 100 Hz and 300 Hz and gradually shifts to the right as the bolt preload increases, and the amplitude of the corresponding response voltage also increases accordingly.
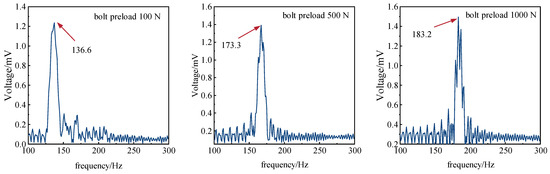
Figure 14.
Signal spectrum of the 1st order peak under different preload forces.
Considering that there are too many frequency spectra, not all are listed due to the article’s length. Further observation of the 1st to 6th order peaks of the frequency spectra can obtain the natural frequency of each order of the steel plate component under different preloads. After multiple measurements, the average value of the obtained results is taken. The natural frequencies of the structure under different bolt preloads are summarized in Table 2. To facilitate the analysis of the correlation between each order of natural frequency and bolt preload, the relationship between the bolt preload and the natural frequency of the 1st to 6th order natural frequencies is plotted as shown in Figure 15.
Table 2.
Natural frequency under different preloads.
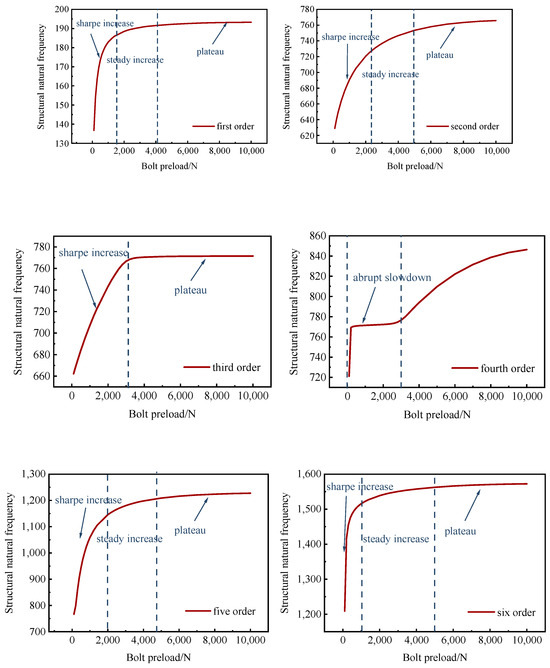
Figure 15.
Variation of 1st to 6th order natural frequency under different preload forces.
The figure shows that the natural frequencies from the 1st to the 6th order increase with the increase in bolt preload; however, the rate of change for the six natural frequencies is not the same. This is because in the structure with bolted connections, the sensitivity of different order natural frequencies to bolt preload may vary, depending on the dynamic characteristics of the structure, including mass distribution, stiffness distribution, and boundary conditions. Additionally, it can be observed that, except for the 4th order natural frequency, which has two inflection points in its variation curve, the other natural frequencies have only one inflection point each. This is due to the fact that different order natural frequencies correspond to different vibration modes. The 4th order mode may be more complex than the other modes, involving more structural components and more intricate vibration patterns, resulting in a more complicated response to bolt preload, which may include multiple inflection points. However, this specific case does not significantly impact the study presented in this paper. By observing the variation curves of the remaining natural frequencies, a clear relationship between natural frequency and preload can still be observed: when the bolt preload reaches around 5000 N, the growth of the 1st, 2nd, 3rd, 5th, and 6th order natural frequencies gradually stabilizes. Analysis reveals that as the bolt preload increases from 0 to 5000 N, the bolt transitions from a completely slack state to a taut state, causing the change in structural stiffness to diminish. Therefore, with higher preload, the change in structural natural frequency becomes less sensitive. By utilizing the evolution relationship between the structural natural frequencies and bolt preload, it is possible to perform a reverse analysis to determine the size of the bolt preload based on the structural natural frequencies. The critical preload for the bolt is defined as 5000 N; when the bolt preload is less than 5000 N, it begins to show noticeable loosening, and the structural natural frequency decreases rapidly. Thus, by measuring the changes in structural natural frequency, the identification of bolt loosening damage can be effectively achieved.
4.2. Finite Element Simulation
To more fully prove the correctness of the content in Section 4.1, we will use ANSYS Workbench2020 R2 software to simulate the test and then compare and analyze it with the experimental results.
4.2.1. Model Establishment
The model was established using ANSYS Workbench software. The geometry of the components consists of two steel plates measuring 260 mm × 60 mm × 8 mm, connected by bolts, as shown in Figure 16. Since the various parts are not a single entity, the model needs to be set up as an assembly, where the connections between the nuts and the plates are treated with consistent boundary conditions to ensure a tight connection between the plates and the nuts, facilitating convergence in the model calculations. The materials for each part of the model are then defined, and fixed constraints are applied to both ends of the model. A small elastic film element is placed between the two steel plates and elastically connected to the upper and lower steel plates. The changes in bolt preload are simulated by varying the Young’s modulus of the film element. Due to the simplicity of the structure in this section, a predefined free tetrahedral mesh is used to discretize the model, followed by a structural modal analysis.
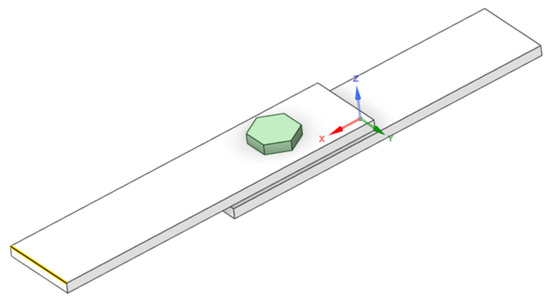
Figure 16.
Schematic diagram of component geometry.
4.2.2. Finite Element Analysis Results
The simulation using ANSYS Workbench is conducted to calculate the natural frequency values of the structure under different bolt preload conditions and to compare these results with the experimental findings discussed earlier. After completing the model calculations, due to the numerous mode shapes, and the fact that this section does not focus on a detailed analysis of the mode shapes, we extract the first six mode shapes under one specific preload, as shown in Figure 17. From the figure, it can be seen that the 3rd and 4th order mode shapes exhibit tangential deformations, while the other four modes show normal deformations.
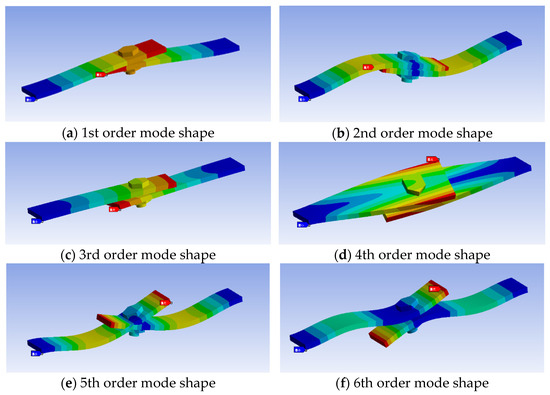
Figure 17.
Structural characteristic frequency mode.
The first six natural frequencies of the model structure under different preloads are summarized in Table 3. The simulation results show that the structure’s natural frequency increases with the increase of bolt preload. When the bolt preload increases from 100 N to 5000 N, the increase of the 1st to 6th order natural frequencies is 40.570%, 19.760%, 16.450%, 12.290%, 57.660%, and 29.250%, respectively; when the bolt preload increases from 5000 N to 10,000 N, the increase of the 1st to 6th order natural frequencies is 0.560%, 1.650%, 0.060%, 4.520%, 1.520%, and 0.620%, respectively. This result is consistent with the law obtained from the experiment: the structure’s natural frequency will increase sharply from 0 to 5000 N and will increase slowly after 5000 N until it stabilizes.
Table 3.
The natural frequency of the simulation model under different preloads.
4.3. Piezoelectric Smart Washer Sensor
4.3.1. Design and Preparation of Piezoelectric Smart Washer Sensor
The adhesive sensor is located on the structure’s surface, is easily damaged, and cannot be reused after being pasted. Therefore, to make up for the shortcomings of the adhesive sensor and ensure the integrity of the bolt structure itself, this paper proposes to embed a homemade PMN-PT piezoelectric sensor in the bolt’s auxiliary component washer to make an intelligent washer sensor. The design diagram is shown in Figure 18a. The production process is as follows: insert an open washer between two complete washers and overlap them together, place the sensor at the opening position of the middle layer washer, fill the gap with epoxy resin, and then use superglue to bond the three washers into a whole. The actual picture of the piezoelectric intelligent washer sensor is shown in Figure 18b.
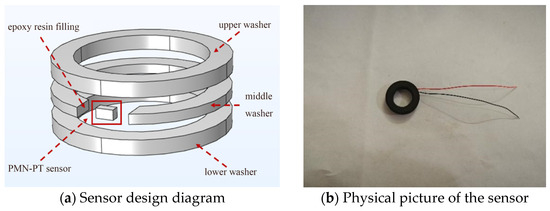
Figure 18.
Piezoelectric smart washer sensor.
4.3.2. Testing of Piezoelectric Smart Gasket Sensor
To evaluate the effect of piezoelectric smart gasket sensors in practical applications, the same test equipment and test specimens were used to perform further vibration tests. The structure’s natural frequency was measured again and compared with the test results in Section 4.1.2 to determine whether the smart gasket affects the measurement of the natural frequency of the test specimen structure.
In the test, the bolt preload was changed from 0 to 10,000 N, and the structure’s 1st, 2nd, and 3rd order natural frequencies were extracted, as shown in Table 4.
Table 4.
Structural natural frequency table.
By subtracting and comparing the test data of this test with the test data measured in Section 4.1.2, the error distribution of the structural natural frequency is obtained, and the error distribution diagrams of the 1st, 2nd, and 3rd order natural frequencies are plotted as shown in Figure 19.
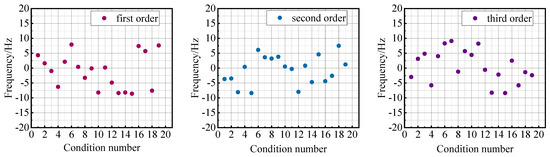
Figure 19.
Frequency error distribution.
As can be seen from the figure, the maximum error of the first-order natural frequency measured by the sensor is 8.6 Hz, the maximum error of the second-order natural frequency is 8.4 Hz, and the maximum error of the third-order natural frequency is 9.1 Hz, among which the maximum relative error is 4.500% in the first order. The smart gasket has almost no effect on the measurement of the structural natural frequency, which verifies the effectiveness of the piezoelectric smart gasket sensor in practical applications.
4.3.3. Establishment of Bolt Loosening Damage Index
Although the previous section used the natural frequency to identify whether the bolts were loose, it did not perform quantitative processing. This section proposes a looseness index based on the previous test and simulation results to evaluate the looseness of the bolts.
Let K be the bolt looseness index; K = 0 when the bolt is fully tightened, K = 100 when the bolt is completely loose, and the larger the K value, the looser the bolt. Let fi be the frequency difference between the i-th order natural frequency of the bolt when it is fully tightened (fxi) and when it is completely loose fmi), and the bolt looseness index is assigned to each order of natural frequency by weighted distribution to obtain the evaluation coefficient αi of each order, which satisfies the following formula:
Assuming the measured i-th order natural frequency of the structure is fci, the calculation formula of the bolt loosening index is proposed as follows:
To further evaluate the correctness of the loose damage index, this paper verifies it with the data of the exciter vibration test in Section 4.1.2. According to the change characteristics of the first six natural frequencies of the steel plate components in the test results, the 1st, 2nd, 5th, and 6th natural frequencies with relatively stable frequency conversion rates are taken to calculate the bolt loosening index. Considering that the minimum bolt preload applied in the test is 100 N, it is defined as completely loose when it is 100 N. The evaluation coefficient is calculated according to Formulas (3) and (4), and the experimental data in Table 4 are substituted to obtain the following results:
Taking the data when the bolt preload is 7000 N as an example, substitute this into Formula (5) to calculate the bolt loosening index. The calculation result is K = 1.62. The bolt loosening index K under all working conditions is further calculated, as shown in Table 5. The calculation results in the table show that as the bolt preload decreases, the bolt loosening index increases, indicating that the loosening index K can effectively represent the degree of bolt loosening.
Table 5.
Calculation results of bolt loosening index K.
The two are fitted to further explore the correlation between the loose index K and the bolt preload, and the results are shown in Figure 20. From the fitting results, the bolt preload and the loose index satisfy the exponential decay relationship, and the goodness of fit is as high as 0.97, indicating that there is a good correlation between the loose index K and the bolt preload.
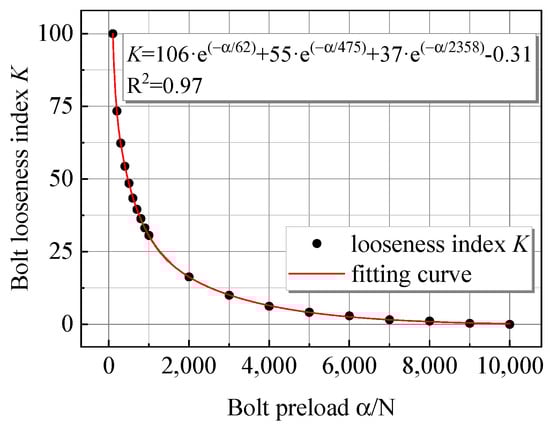
Figure 20.
Fitting relationship between bolt loosening index and bolt preload.
Therefore, in the actual use of bolts in the aforementioned structure, two adhesive sensors, as previously fabricated, can be installed at both ends. A voltage can be applied to one of the sensors to exert a known external excitation on the bolt structure, and the vibration information is then obtained from the other sensor. By using this information, the 1st, 2nd, 5th, and 6th order natural frequencies of the structure can be calculated, and the corresponding K values can be determined based on the proposed K formula. By observing the size of the K value, the specific state of bolt loosening or damage can be reflected.
In the specific application of determining whether a bolt has become loose, the K value of the bolt in a normal working condition needs to be obtained first as a baseline. Then, through multiple measurements and statistical analysis, a reasonable threshold range can be established. If the detected K value exceeds this range, it can be concluded that the bolt may be experiencing loosening or damage. To monitor the status changes of the bolts in real-time, an online monitoring system can be used to periodically collect vibration data and calculate the K values. By comparing the current K value with the trend of the baseline value, potential loosening damage can be detected promptly, and corresponding maintenance measures can be taken.
5. Conclusions
Given the shortcomings of the current high-strength bolt loosening damage identification method and the problem that traditional piezoelectric sensors cannot effectively measure structural modal parameters, this paper introduces the damage identification method based on natural frequency into the research of bolt loosening damage identification. Through the research method of combining theoretical analysis, experimental exploration, and simulation, a bonded piezoelectric sensor based on PMN-PT piezoelectric single crystal is designed. The bolt loosening damage identification test and simulation are carried out with it. An improvement scheme of piezoelectric intelligent washer sensors is proposed, and a bolt loosening damage identification index is constructed. Based on the above work, the following main conclusions are obtained:
- (1)
- The PMN-PT sensor was compared with the PVDF sensor. The test showed that the sensitivity of the PMN-PT sensor was 21 times that of the PVDF sensor, and its response to structural vibration changes was more reliable.
- (2)
- Through the bolt loosening damage identification test and simulation based on PMN-PT piezoelectric sensor, it is proved that the correlation between the stress peak and the bolt preload is weak (the stress peak increase on the steel plate is 0.025%, and the stress peak increase on the upper surface of the nut is only 0.014%), so the stress peak index is not suitable for the identification of the bolt tightening degree. Through experiments and simulations, it was found that with the increase of bolt preload, the structure’s natural frequency increased significantly, proving the effectiveness of natural frequency in bolt loosening damage identification.
- (3)
- The experimental results of the piezoelectric smart gasket sensor and the traditional adhesive sensor were compared through the exciter vibration test, showing that the maximum error between the two was 4.5%, indicating that the smart gasket sensor had almost no effect on the measured structural natural frequency. Then, based on the change law of the structural natural frequency, a bolt loosening index was proposed to evaluate the degree of bolt loosening damage. The test data were substituted into the bolt loosening index calculated by the actual preload for fitting, and it was found that the two had a good correlation and satisfied the exponential decay model. The goodness of fit was 0.97, which proved the availability of the bolt loosening index.
Author Contributions
R.F.: methodology, conceptualization, validation, writing—original draft. C.W.: methodology, software, writing—original draft. Y.Z.: methodology, writing—original draft. Z.P.: data curation, supervision, writing—review and editing. H.L.: resources, supervision, validation. All authors have read and agreed to the published version of the manuscript.
Funding
The authors would like to acknowledge the financial support given by Chongqing Natural Science Foundation of China (Grant Nos. cstc2021jcyj-msxmX1168 and cstb2022nscq-msx1655), the State Key Laboratory of Structural Dynamics of Bridge Engineering and Key Laboratory of Bridge Structure Seismic Technology for Transportation Industry Open Fund (Grant Nos. 202205 and 202105), and the Open Fund of State Key Laboratory of the Mountain Bridge and Tunnel Engineering (Grant Nos. SKLBT-ZD2102 and SKLBT-19-007).
Data Availability Statement
The original contributions presented in the study are included in the article, further inquiries can be directed to the corresponding author.
Conflicts of Interest
The authors declare that they have no known competing financial interest or personal relationships that could have appeared to influence the work reported in this paper.
References
- Dai, D.; He, Q. Structure damage localization with ultrasonic guided waves based on a time–frequency method. Signal Process. 2014, 96 Pt A, 21–28. [Google Scholar] [CrossRef]
- Cawley, P.; Adams, R.D. The mechanics of the coin-tap method of non-destructive testing. J. Sound Vib. 1988, 122, 299–316. [Google Scholar] [CrossRef]
- Garcia, M.; Jairo, A. A Novel Ultrasonic Method to Quantify Bolt Tension. Master’s Thesis, University of South Florda, Tampa, FL, USA, 2012. [Google Scholar]
- Liang, C.; Sun, F.P.; Rogers, C.A. Coupled electro-mechanical analysis of adaptive material system: Determination of the actuator power consumption and system energy transfer. J. Intell. Mater. Syst. Struct. 1994, 5, 12–20. [Google Scholar] [CrossRef]
- Ritdumrongkul, S.; Abe, M.; Fujino, Y.; Miyashita, T. Quantitative health monitoring of bolted joints using a piezoceramic actuator sensor. Smart Mater. Struct. 2003, 13, 20. [Google Scholar] [CrossRef]
- Song, G.; Gu, H.; Mo, Y.L.; Hsu, T.T.; Dhonde, H. Concrete structural health monitoring using embedded piezoceramic transducers. Smart Mater. Struct. 2007, 16, 959. [Google Scholar] [CrossRef]
- Liu, Y.F.; Fan, J.S.; Nie, J.G.; Kong, S.Y.; Qi, Y. Review and prospect of digital-image-based crack detection of structure surface. China Civ. Eng. J. 2021, 54, 79–98. [Google Scholar]
- Zhao, Y.; Liu, Y.; Li, Y.; Hao, Q. Development and application of resistance strain force sensors. Sensors 2020, 20, 5826. [Google Scholar] [CrossRef]
- Oh, B.K.; Lee, J.H.; Choi, S.W.; Park, H.S.; Kim, Y.S. Estimation method of strain distribution for safety monitoring of multi-span steel beam using FBG sensor. J. Korea Inst. Struct. Maint. Insp. 2014, 18, 138–1349. [Google Scholar]
- Mishra, M.; Lourenço, P.B.; Ramana, G.V. Structural health monitoring of civil engineering structures by using the internet of things: A review. J. Build. Eng. 2022, 48, 103954. [Google Scholar] [CrossRef]
- Wang, C.S.; Wu, F.; Chang, F.K. Structural health monitoring from fiber-reinforced composites to steel-reinforced concrete. Smart Mater. Struct. 2001, 10, 548. [Google Scholar] [CrossRef]
- Park, G.; Cudney, H.; Inman, D. Feasibility of using impedance-based damage assessment for pipeline structures. Earthq. Eng. Struct. Dyn. 2001, 30, 1463–1474. [Google Scholar] [CrossRef]
- Sivasuriyan, A.; Vijayan, D.S.; Górski, W.; Wodzyński, Ł.; Vaverková, M.D.; Koda, E. Practical Implementation of Structural Health Monitoring in Multi-Story Buildings. Buildings 2021, 11, 263. [Google Scholar] [CrossRef]
- He, Z.; Li, W.; Salehi, H.; Zhang, H.; Zhou, H.; Jiao, P. Integrated structural health monitoring in bridge engineering. Autom. Constr. 2022, 136, 104168. [Google Scholar] [CrossRef]
- Bernard, J. Piezoelectric Transducers Using Lead Titanate and Lead Zirconate. U.S. Patent 2,708,244, 10 May 1955. [Google Scholar]
- Dai, X.; DiGiovanni, A.; Viehland, D. Dielectric properties of tetragonal lanthanum modified lead zirconate titanate ceramics. J. Appl. Phys. 1993, 74, 3399–3405. [Google Scholar] [CrossRef]
- Bratschun, W.R.; Cook, R.L. Dielectric Properties of Solid Solutions of Sodium Niobate-Lead Zirconate and Sodium Niobate-Lead Titanate. J. Am. Ceram. Soc. 1961, 44, 136–140. [Google Scholar] [CrossRef]
- Baxter, P.; Hellicar, N.J. Electrical Properties of Lead-Barium Niobates and Associated Materials. J. Am. Ceram. Soc. 1960, 43, 578–583. [Google Scholar] [CrossRef]
- Zhang, X.L.; Chen, Z.X.; Cross, L.E.; Schulze, W.A. Dielectric and piezoelectric properties of modified lead titanate zirconate ceramics from 4.2 to 300 K. J. Mater. Sci. 1983, 18, 968–972. [Google Scholar] [CrossRef]
- Kawai, H. The piezoelectricity of poly (vinylidene fluoride). Jpn. J. Appl. Phys. 1969, 8, 975. [Google Scholar] [CrossRef]
- Smolenskii, G.A.; Agranovskaya, A.I. Dielectric polarization of complicated composites. Sov. Phys.-Solid State 1960, 1, 1429–1432. [Google Scholar]
- Bokov, V.A.; Mylnikova, I.E. Ferroelectric properties of monocrystals of new perovskite compounds. Sov. Phys.-Solid State 1961, 2, 2428–2432. [Google Scholar]
- Cornwell, P.; Doebling, S.W.; Farrar, C.R. Application of the strain energy damage detection method to plate-like structures. J. Sound Vib. 1999, 224, 359–374. [Google Scholar] [CrossRef]
- Shi, Z.Y.; Law, S.S.; Zhang, L.M. Structural damage localization from modal strain energy change. J. Sound Vib. 1998, 218, 825–844. [Google Scholar] [CrossRef]
- Seyedpoor, S.M. A two stage method for structural damage detection using a modal strain energy based index and particle swarm optimization. Int. J. Non-Linear Mech. 2012, 47, 1–8. [Google Scholar] [CrossRef]
- Pandey, A.K.; Biswas, M.; Samman, M.M. Damage detection from changes in curvature mode shapes. J. Sound Vib. 1991, 145, 321–332. [Google Scholar] [CrossRef]
- West, W.M. Illustration of the Use of Modal Assurance Criterion to Detect Structural Changes in an Orbiter Test Specimen; NASA Technical Reports Server (NTRS): Hampton, VA, USA, 1986. [Google Scholar]
- Salawu, O.S. Detection of structural damage through changes in frequency: A review. Eng. Struct. 1997, 19, 718–723. [Google Scholar] [CrossRef]
- Wang, X.; Hu, N.; Fukunaga, H.; Yao, Z.H. Structural damage identification using static test data and changes in frequencies. Eng. Struct. 2001, 23, 610–621. [Google Scholar] [CrossRef]
- Eraliev, O.; Lee, K.H.; Lee, C.H. Vibration-based loosening detection of a multi-bolt structure using machine learning algorithms. Sensors 2022, 22, 1210. [Google Scholar] [CrossRef]
- Zhu, W.D.; He, K. Detection of damage in space frame structures with L-shaped beams and bolted joints using changes in natural frequencies. J. Vib. Acoust. 2013, 135, 051001. [Google Scholar] [CrossRef]
- Curie, J.; Curie, P. Développement par compression de l’électricité polaire dans les cristaux hémièdres à faces inclinées. Bull. Minéral. 1880, 3, 90–93. [Google Scholar] [CrossRef]
- Mason, W.P. Piezoelectricity, its history and applications. J. Acoust. Soc. Am. 1981, 70, 1561–1566. [Google Scholar] [CrossRef]
- Zhao, X.; Li, H. Health monitoring of reinforced concrete frame-shear wall using piezoceramic transducer. J. Vib. Shock 2006, 25, 82–84. [Google Scholar]
- Holterman, J.; Groen, W.A. An Introduction to Piezoelectric Materials and Applications; Stichting Applied Piezo: Apeldoorn, The Netherlands, 2013. [Google Scholar]
- JGJ82-2011; Code for Design, Construction and Acceptance of High-Strength Bolt Connections in Steel Structures. Architecture & Building Press: Beijing, China, 2011.
Disclaimer/Publisher’s Note: The statements, opinions and data contained in all publications are solely those of the individual author(s) and contributor(s) and not of MDPI and/or the editor(s). MDPI and/or the editor(s) disclaim responsibility for any injury to people or property resulting from any ideas, methods, instructions or products referred to in the content. |
© 2025 by the authors. Licensee MDPI, Basel, Switzerland. This article is an open access article distributed under the terms and conditions of the Creative Commons Attribution (CC BY) license (https://creativecommons.org/licenses/by/4.0/).