Article

Polycyclic Aromatic Hydrocarbons (PAHs) in Household Dusts: Distribution, Sources, and Health Risk Assessment from Rural Areas in Chiang Mai Province, Thailand

by
Teetawat Santijitpakdee
1,
Surat Hongsibsong
2,
Kongsak Boonyapranai
1,
Kanokwan Kulprachakarn
2,
Wason Parklak
1,
Sakaewan Ounjaijean
2 and
Sawaeng Kawichai
1,*
1
Research Center for Non-Infectious Diseases and Environmental Health, Research Institute for Health Sciences, Chiang Mai University, Chiang Mai 50200, Thailand
2
School of Health Sciences Research, Research Institute for Health Sciences (RIHES), Chiang Mai University, Chiang Mai 50200, Thailand
*
Author to whom correspondence should be addressed.
Buildings 2025, 15(11), 1855; https://doi.org/10.3390/buildings15111855
Submission received: 9 April 2025 / Revised: 13 May 2025 / Accepted: 26 May 2025 / Published: 28 May 2025
(This article belongs to the Special Issue Indoor Air Quality in Buildings)

Abstract

The present study investigated the concentrations, sources, and potential health risk assessment of polycyclic aromatic hydrocarbons (PAHs) in house dust from residences in Samoeng District, Chiang Mai Province, Thailand. Samples of house dust from 48 households were analyzed for 16 PAHs. The total concentrations of PAHs (ΣPAHs) ranged between 270.1 to 45,386.8 ng g−1, with a mean of 3942.4 ± 8175.1 ng g−1. Pyrene (Pyr), benzo(k)fluoranthene (BkF), and indeno(1,2,3-cd)pyrene (IcdP) were the predominant compounds. Diagnostic ratios and principal component analysis (PCA) showed wood and the burning of biomass as the predominant sources. Evaluations of incremental lifetime cancer risk (ILCR) showed higher risks, especially for children (average ILCR = 6.57 × 10⁻³), with dermal contact as the main exposed pathway. Risks exceeded acceptable criteria (10−6 to 10−4), suggesting serious public health problems. The results highlight the significance of pollution mitigation measures, such as reducing the use of biomass combustion and improving indoor air quality, for protecting vulnerable populations in rural regions. The research conducted presents important insights into the environmental health impacts of PAHs in residences and shows the importance of public health procedures that can reduce exposure.

1. Introduction

Polycyclic Aromatic Hydrocarbons (PAHs) are semi-volatile, lipophilic organic chemicals that consist of at least two bound aromatic rings with various structures. They exhibit various functions, such as thermal resistance, photosensitivity, and corrosion resistance. These compounds are found in the environment, originating from both natural and anthropogenic sources, and are detectable in air, soil, and water. House dust contains various components, including heavy elements, synthetic organic compounds, and PAHs [1,2,3,4]. The prevalent PAHs in house dust generally consist of three to four rings that are referred to as light PAHs, such as Phenanthrene (Phe), Pyrene (Pyr), Benzo(a)anthracene (BaA), and Chrysene (Chr), which significantly influence the total PAHs concentrations. In addition, PAHs with five to six rings are referred to as heavy PAHs, such as Benzo(k)fluoranthene (BkF) and Benzo(a)pyrene (BaP). These heavy PAHs contribute significantly to the risk of cancer associated with exposure to household dust [2,5]. PAHs represent significant risks to health due to their carcinogenic and mutagenic characteristics [6,7]. Studies have shown that PAHs present in indoor environments come from various sources, including cooking, smoking, combustion processes, and traffic emissions [8,9,10]. The concentration of PAHs in house dust varies widely across different regions and locations. For instance, in Bushehr city, the highest levels were found in school classrooms. Meanwhile, laboratories had the lowest concentrations [11], and Universities in Wuhan, China, found that the average of Σ16PAHs in libraries was 5.06 µg g−1 while the average of Σ16PAHs in dormitories was 5.19 µg g−1 [8].
Moreover, previous studies revealed that Shanxi had the highest levels of the national average concentration of Σ16PAHs in indoor dust in China, at 25.69 µg g−1 [12]. In Croatia, PAH concentrations vary from 92.9 ng g−1 to 1504 ng g−1, with four-ring compounds, Flu and Pyr, especially prevalent [13]. Exposure to PAHs in house dust is primarily via ingestion and skin contact, with children at greater risk than adults due to their behaviors and higher intake rates [14]. Studies on health risks show that, in general, the level of PAHs in household dust is within reasonable ranges that lower cancer risk. However, regions that contain higher PAHs provide an increased risk. The ILCR model can evaluate the potential for cancer risk caused by PAHs throughout several routes of exposure, including ingestion, contact with skin, and inhalation [15]. For example, in Shanxi, China and Niger Delta, Nigeria, cancer risk levels via ingestion for children are high [12,16]. In contrast, a study in Masjed Soleyman, Khuzestan, Iran, found that the risks to health connected with inhalation and prolonged contact with PAHs seemed insignificant [17]. Although the risks posed by PAHs in house dust are low, continuous monitoring and improving indoor air quality are essential to reducing exposure, especially for vulnerable populations like children.
As mentioned earlier, PAHs in house dust predominantly derive from pyrogenic and petrogenic sources, both indoors and outdoors, including coal combustion, smoking, cooking, natural gas combustion, and traffic emissions, which are significant contributors in both residential and kitchen environments [18,19]. The variability in the sources highlights the complexity of PAH pollution in indoor dust. Employed for identifying the sources of PAH in different situations, Principal Component Analysis (PCA) and diagnostic ratios are effective multivariate statistical techniques that can manipulate complex patterns in PAH data. Previous studies have applied PCA and diagnostic ratios to determine the primary sources of PAH pollution in different locations, such as Beijing and Tianjin, China, and Lucknow, India, which revealed a variety of sources of contamination [20,21]. Additionally, they have been employed to identify sources of PAHs in the atmosphere surrounding manufacturing areas. They specify traffic pyrolysis, heavy oil combustion, fugitive dust, and petroleum combustion as main contributors [22,23]. The combination of PCA and diagnostic ratios improves the accuracy and reliability of PAH source identification, as seen in studies focused on marine ecosystems and coastal regions [24,25]. Researchers can use these techniques to determine pollution control measures in various environmental settings and to support decision-making processes for protecting and restoring the environment. However, this study emphasizes the Samoeng District in Chiang Mai Province, providing valuable knowledge and insights important to rural areas and biomass-dependent people in Southeast Asia. This study differs from prior research that mostly investigates urban or industrial environments, where PAH sources are primarily associated with fossil fuel combustion and emissions from vehicles. Exposure conditions of rural households, of which about 80% are dependent on fuelwood as their primary energy source, are highlighted.
It is understood that this is the initial investigation on the concentrations of PAHs in household dust, and establishing the health risks to humans in these environments. Thus, the purpose of the present investigations is: (i) to establish the concentration of PAHs in household dust from the area of Samoeng District, Chiang Mai Province; (ii) to investigate PAH sources of emission sources using diagnostic ratios and PCA evaluation; and (iii) to evaluate the potential cancer risk associated with PAH exposure via ingestion and dermal contact using the ILCR model. This information will be useful in the development of enhancing the standard of residential conditions and managing risks.

2. Materials and Methods
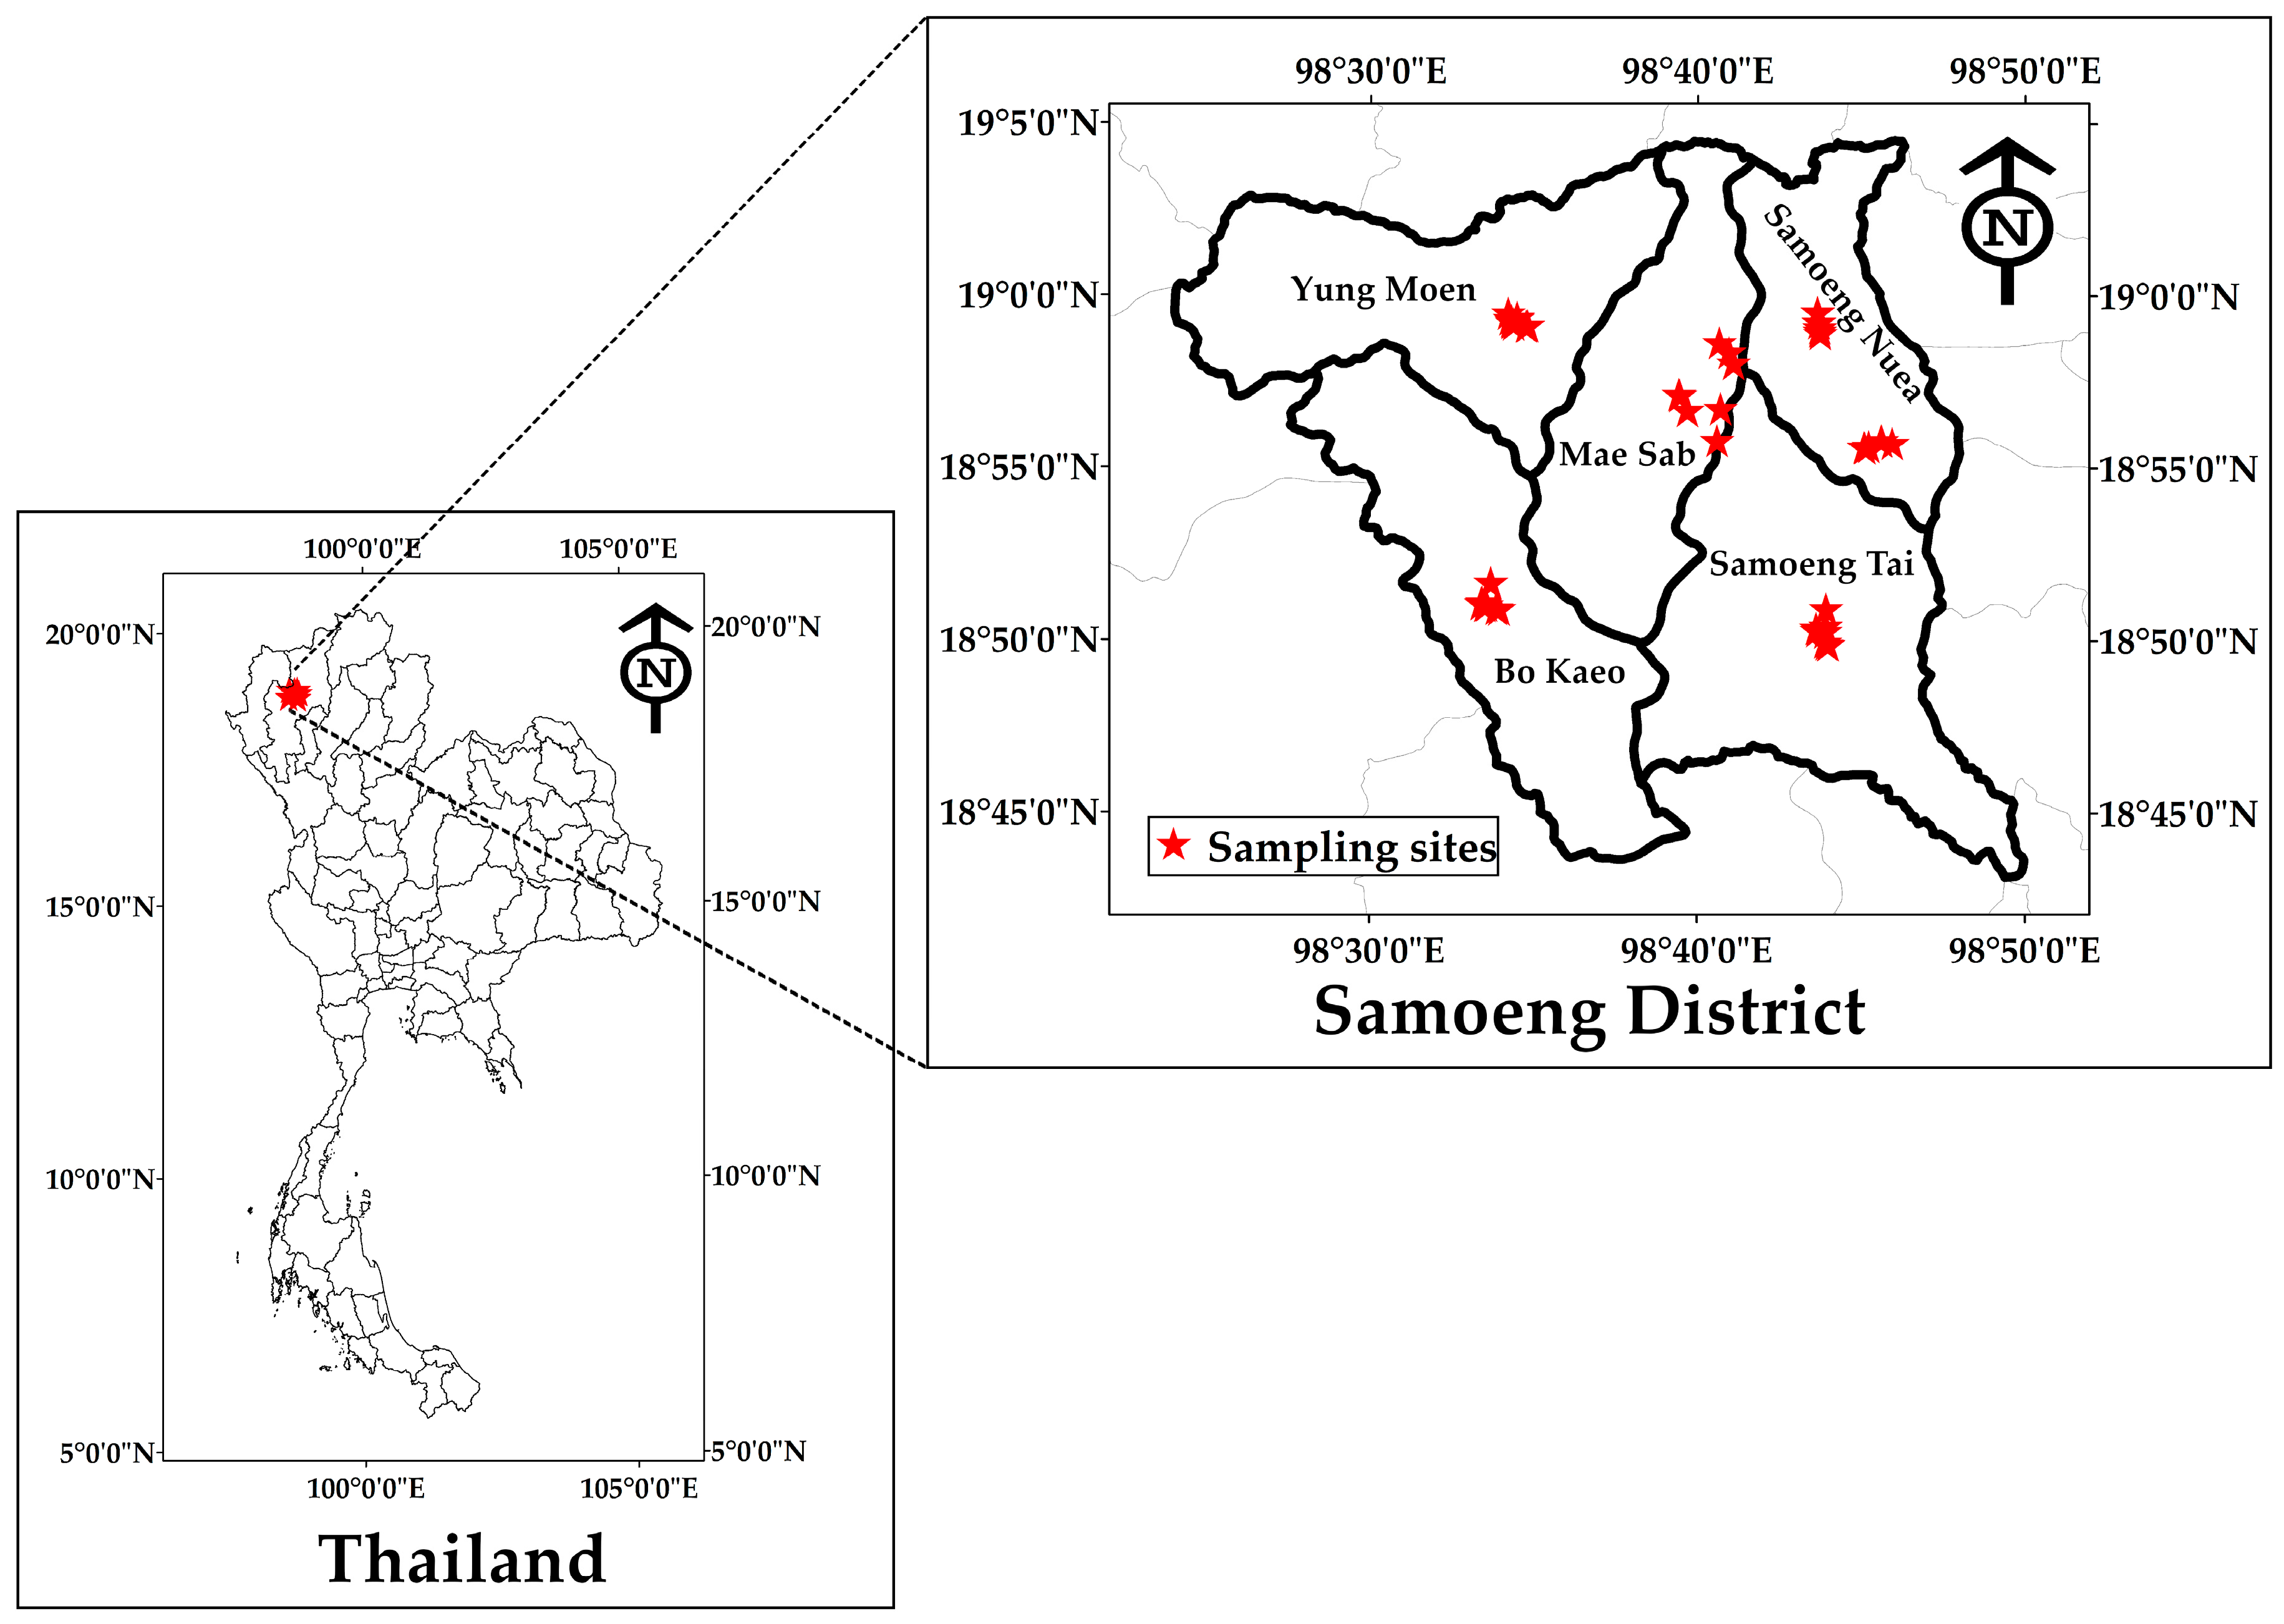
2.1. Sampling Sites

In the current study, dust samples from houses were collected from a total of 48 households in Samoeng District, Chiang Mai Province, Thailand. Located about 50 km to the west of Chiang Mai City, the latitude and longitude coordinates of this location are 18°56′13.74″ N, 98°36′37.67″ E. Additionally, it has an elevation of 460 m above sea level. The area in this study is 1002 square km and consists of five sub-districts. Mountains and forested areas, including a large amount of agricultural land, surround approximately 80% of the area. The study consisted of the geographical mapping of potential house locations, followed by informing the house owners regarding the study and inviting them to participate after obtaining their informed consent. The Human Experimentation Committee (HEC), Research Institute for Health Sciences, approved this study (study code: Project No. 24/65, approval date: 19 January 2023). Figure 1 illustrates the study sites’ locations. Household dust samples were obtained by polyethylene brushing them into an air-tight polyethylene bag and then sealing them. To prevent contamination, each brush went through ultrasonic cleaning with water for a duration of 5 min, followed by three rinses with deionized water before being dried, and finally, they were allowed to air dry. The dust samples from the household were collected inside the building at a height of at least half a meter above the ground’s surface. Samples were taken from surface areas such as chairs, tables, shelves, and door frame covers where the sampler had been placed. To obtain a dust sample, we gathered multiple samples. For example, we collected dust samplers from various locations within a residence, such as the bedroom, living room, and dining room, where the household members typically spend their time, and combined them into a single sample. Following the process of homogenization of the dust samples using the 63 µm sieve, household dust samples were then wrapped in foil containing aluminum to prevent potential damage caused by exposure to sunlight. Following that, the samples were packed, labeled, and kept at a temperature of 2–4 °C before they were ready for analysis. From the observations, most households in this region use fuelwood as their main source of fuel, which can be used in several types of indoor stoves.

2.2. Sample Analysis

We analyzed the house dust sample for 16 PAHs after sieving, using a modified method from previous studies [26]. Firstly, we used an ultrasonic bath to extract 0.02 g of the filtered dust sample in 10 mL of dichloromethane. This process was conducted for ten min, repeated three times, at a controlled temperature of 10 °C. The solutions have been future purified using a PTFE syringe filter (0.45 µm, 20 mm, Whatman, Cytiva, Marlborough, MA, USA) and evaporated at 35 °C in a rotary evaporator (BUCHI Labortechnik AG, Flawil, Switzerland). This process produced an analysis volume that was around 0.5 mL. We added 20 µL of a 2 mg/L solution of Acenaphthene-d10 and 20 µL of a 5 mg/L solution of Pyrylene-d12 (Dr. Ehrenstorfer, LGC, Augsburg, Germany) as an internal standard. These encompassed internal standards. The solvent mixture was employed for dissolving the obtained solution, which had a volume of 1 mL. Using a gas chromatograph equipped with a mass selective detector (GC–MS, Agilent 7890A, Agilent Technologies, Inc., Santa Clara, CA, USA; HP–MS, column 30 m × 0.25 mm i.d, 0.25 μm film thickness), the measurement of polycyclic aromatic hydrocarbons (PAHs) was carried out. The selected ion monitoring (SIM) mode was utilized at 70 electron volts (Ev), and helium was used as the carrier gas. The temperature of the injector has been set at 270 °C. A 1 µL injection volume was employed in pulsed splitless mode at a constant flow rate of 1.0 mL/min. The heating program for the column oven was set up to start at 75 °C (which is maintained for 0.5 min) and then increased to 150 °C at a rate of 20 °C/min. The temperature immediately increased from 150 °C to 290 °C at a rate of 10 °C/min. Finally, the temperature was held at 310 °C for 3 min. The working conditions employed were modified from the prior study [26]. The following sixteen PAHs were investigated, all of which are included in the priority pollutants list established by the US EPA: Naphthalene (Nap), Acenaphthylene (Acy), Acenaphthene (Ace), Fluorene (Flu), Phenanthrene (Phe), Anthracene (Ant), Fluoranthene (Fln), Chrysene (Chry), Pyrene (Pyr), Benzo (a)anthracene (BaA), Benzo(b)fluoranthene (BbF), Benzo(k)fluoranthene (BkF), Benzo(a)pyrene (BaP), Indeno(1,2,3-cd)pyrene (IcdP), Dibenz(ah)anthracene (DahA), and Benzo(ghi)perylene (BghiP). Moreover, the limits of detection (LOD) and limits of quantification (LOQ) of 16 PAHs have been determined by calculating the lowest concentration of the standard with 3 and 10 times their standard deviations from the mean. The LOD and LOQ values for the target compounds were found to vary from 0.17 to 0.97 ng g−1 and 0.58 to 3.25 ng g−1, respectively. For the quality assurance and quality control (QA/QC) assessments, we conducted a recovery procedure using the spiking method, employing the standard solution EPA 610 PAH mix. This included generating a concentrated sample of the PAH compounds under study and doing further analysis following the previously presented method. The average recovery of all PAH spiking samples varied from 65.2% (DahA) to 115.6% (Chry).

2.3. PAHs Sources Identification

Due to its relative simplicity in each application, the diagnostic ratio method is frequently utilized for identifying the source of PAHs [27,28]. Several diagnostic ratios were used in determining possible sources of emissions, including Ant/(Ant + Phe), Flu/(Flu + Pyr), BaA/(BaA + Chr), IcdP/(IcdP + BghiP) [29,30,31]. This study identifies the probable sources of PAHs in household dust using the proportions of Ant/(Ant + Phe) and BaA/(BaA + Chr) [32,33,34]. Additionally, PCA has been used to convert vast data sets into lower-dimensional representations using bilinear decomposition. The aim of PCA was to identify a collection of statistically independent components that represent the whole variability in the original dataset. PCA analysis was conducted on the concentration of PAHs in the household dust samples from different areas, using varimax rotation in SPSS 24.0 software. This study was carried out to investigate the potential sources of PAHs in household dust [8,35].

2.4. Health Risk Assessment

PAHs can enter the human body through three main pathways: ingestion, inhalation, and dermal contact. We have evaluated the toxicity of specific PAHs in the house dust samples using the toxic equivalency factor (TEF). The TEF values for different PAH compounds differ from BaP due to their distinct carcinogenic potencies; the TEF value of BaP is established at 1. Regarding such PAHs, BaP serves as an indicator to determine the cancer-causing risk related to PAH exposure [36,37]. The present investigation by Nisbet and LaGoy [37] employed the following equations to determine the toxic equivalent quotient (TEQ) for each sample:
TEQ BaP = i n = 1 PAH i × TEF i
PAH represents the concentration of individual polycyclic aromatic hydrocarbons, while TEFi denotes the toxic equivalent factor, as illustrated in Table 1 [36]. This study established the incremental lifetime cancer risk (ILCR) following the US–EPA standard method for evaluating the exposure risk associated with environmental PAHs. Additionally, the lifetime carcinogenic risk value of PAHs in atmospheric dustfall includes ingestion, dermal contact, and inhalation [5,15]. An ILCR value of below 10−6 is considered insignificant. Values ranging from 10−6 and 10−4 are regarded as potentially carcinogenic for human exposure, while the ILCR values exceeding 10−4 signify a significant carcinogenic risk to human health that requires immediate attention and intervention. The ILCR is determined by Equations (2)–(4) [8,15].
ILCR ing = CS × CSF ing × BW 70 3 × IR ing × EF × ED BW × AT × PEF
ILCR inh = CS × CSF inh × BW 70 3 × IR inh × EF × ED BW × AT × PEF
ILCR derm = CS × CSF derm × BW 70 3 × SA × AF × ABS × EF × ED BW × AT × 10 6
CS (μg kg−1) represents the sum of converted PAH concentrations derived from the toxic equivalents of BaP, employing the TEF provided in Table 1 [38]. The carcinogenic slope factor (CSF) for BaP is expressed in (mg kg−1 day−1)−1. The CSF values for oral ingestion (CSFIngestion), inhalation (CSFInhalation), and dermal contact (Sederma) are 7.3, 25, and 3.85 (mg kg−1 day−1)−1, respectively, based on the cancer-causing potential of BaP [39]. BW refers to body weight measurement in kilogram (kg), IRIngestion refers to the dust intake rate (mg day−1), while IRInhalation denotes the inhalation rate expressed in m3 day−1. EF indicates the exposure frequency quantified in days per year, and ED represents the exposure duration (years). AT means the average life span (year), and SA is the dermal surface exposure (cm2). AF is the dermal adherence factor measured in mg per cm−2 per h−1. ABS represents the dermal adsorption fraction, while PEF indicates the particle emission factor (m3 kg−1). Additionally, the values of the parameters used for calculating the risk assessment of PAHs for children and adults through each of these three pathways are presented in Table 1.
Table 1. Parameters used for lifetime carcinogenic risk assessment (ILCR).
Exposure VariableUnitChildrenAdultReference
Dust ingestion rate (IR ingestion)mg day−1200100[40]
Exposure frequency (EF)day year−1180180[41]
Exposure duration (ED)year624[40]
CSF ingestionmg kg−1 day−17.37.3[39]
CSF inhalationmg kg−1 day−13.853.85[39]
CSF dermalmg kg−1 day−12525[39]
Body weight (BW)kg1561.5[40]
Average life span (AT)day25502550[42]
Particle emission factor (PEF)m3 kg−11.36 × 1091.36 × 109[43]
Dermal exposure area (SA)cm2 day−128005700[43]
Skin adherence factor (AF)mg cm−10.20.07[43]
Dermal absorption fraction (ABS)Unitless0.130.13[43]

2.5. Statistical Analysis

The study evaluated data on PAH concentrations. The mass spectrometry method was utilized for data analysis, employing peak areas for determining PAHs. Prior to the analysis, the normality test was performed using IBM SPSS 24.0 (SPSS Inc., Chicago, IL, USA), having a significant threshold set at 0.05. PCA and Factor Analysis were utilized to identify the major sources of PAH distribution in household dust within the Samoeng District of Chiang Mai Province.

3. Results and Discussion

3.1. PAHs Concentrations

The concentrations of 16 PAH compounds in house dust samples from 48 households in the Samoeng District are shown in Table 2. The total concentration of PAHs (ΣPAHs) ranged from 270.1 to 45,386.8 ng g−1, with a mean of 3942.4 ng g−1 and a high standard deviation (±8175.1 ng g−1), indicating strong variability and the potential presence of outliers among the samples. This wide variation shows the variety in levels of contaminants among different samples. Levels of ΣPAHs have been found in rural Nigeria (ranging from 92.9 to 1504 ng g1) and in rural Shanxi, China, with an average of approximately 25,690 ng g1. These PAHs are associated with biomass burning and industrial emissions [12,16]. The PAH profile in our investigation indicated the highest concentrations of Pyr (1042.2 ng g1) and B(k)F (1040.3 ng g1), followed by IcdP (938.6 ng g1) and BghiP (932.2 ng g1). This pattern diverges slightly from the Saudi Arabian study, which identified Phe as the predominant PAH (average 1590 ng g1) [44]. In our study, Phe was detected at a moderate level (320.1 ng g1), indicating potential variations in emissions sources between the two regions. The dominant PAHs in the house dust samples include lighter PAHs with 3–4 rings, such as Pyr and Phe, followed by heavier PAHs (5–6 rings), including BaP, which has been identified as a carcinogen. These compounds originated primarily from incomplete combustion processes and are often associated with regular home activities such as cooking and using biomass burning [45]. Similarly, rural studies in South Asia have reported ΣPAHs levels up to 40,000 ng g1 due to a likewise reliance on solid fuels. Moreover, research conducted by Mosallaei et al. in Iran reported that an average ΣPAHs of 159.8 ± 104.71 ng g1, which is lower than the concentration observed in the present study [9]. In contrast, a study conducted in Kuwait indicated a lower average ΣPAHs concentration of 1112 ng g−1 when compared with the current study. These differences indicate the significant influence of human activity in specific areas on PAH concentrations. For instance, those from urban–industrial areas are produced by petroleum emissions, mostly from gasoline-powered vehicles [46]. The range of PAH concentrations investigated in the present study aligns with findings from other research conducted in various regions. Our results correspond with noteworthy trends found in household dust samples from urban areas, where PAH concentrations usually indicate local emission sources and anthropogenic activities [8,13]. In this study, the concentration of PAHs was found to be lower than those reported in Wuhan (245 to 13,400, 261 to 10,570 ng g1) [8] and Hernan (636.27 to 25,448.62 ng g1, mean 4097.73 ng g1) [47]. In Northern California, median concentrations of PAHs in residential dust samples varied between 10 to 190 ng g1, with regional variability contributing approximately 1–9% to the total variance. Intraregional variations were affected by factors including smoking behaviors and the year of residence creation [48,49].
Figure 2 presents the concentrations of individual PAHs. The colors of the boxplot represent the quantity of aromatic rings: grey for two rings, yellow for three rings, blue for four rings, orange for five rings, and purple for six rings. Pyr demonstrated the highest mean concentration among individual components at 1042.2 ng g1, followed closely by B(k)F at 1040.3 ng g1 and IcdP at 938.6 ng g1. The elevated concentrations suggest a substantial contribution from combustion-related sources, as these compounds are typically associated with the incomplete combustion of organic matter [34]. PAHs that have a high ring weight are predominantly found in the solid phase of particulate matter [50,51]. The presence of low molecular weight (LMW) PAHs (2–3 rings, including naphthalene, acenaphthylene, acenaphthene) and high molecular weight (HMW) PAHs (4–6 rings, such as Fln, Pyr, BaP) implies various emission sources. LMW PAHs are often associated with volatilization from common household products, such as mothballs and certain cleaning agents. In contrast, HMW PAHs typically originate from incomplete combustion processes, including cooking activity, consistent with the findings from previous studies [52,53,54]. Our study identified Fln and Pyr as the predominant four-ring PAHs, primarily originating from combustion-related sources such as biomass burning, wood stove cooking, and open waste disposal fires—activities particularly common in rural areas [52,54]. The chemical and physical characteristics of indoor dust significantly contribute to higher PAH concentrations indoors compared to outdoor environments, as these properties help shield PAHs from degradation processes such as photolysis and weathering, which are more prevalent outdoors [55]. These findings highlight the diverse distribution patterns and potential health risks associated with PAHs in indoor environments across the studied region. The presence of evaluating concentrations of certain carcinogenic PAHs, including BaP and DahA, underscores the need for further investigation into their sources and the development of effective mitigation strategies to reduce indoor human exposure.

3.2. Sources Identification of PAHs

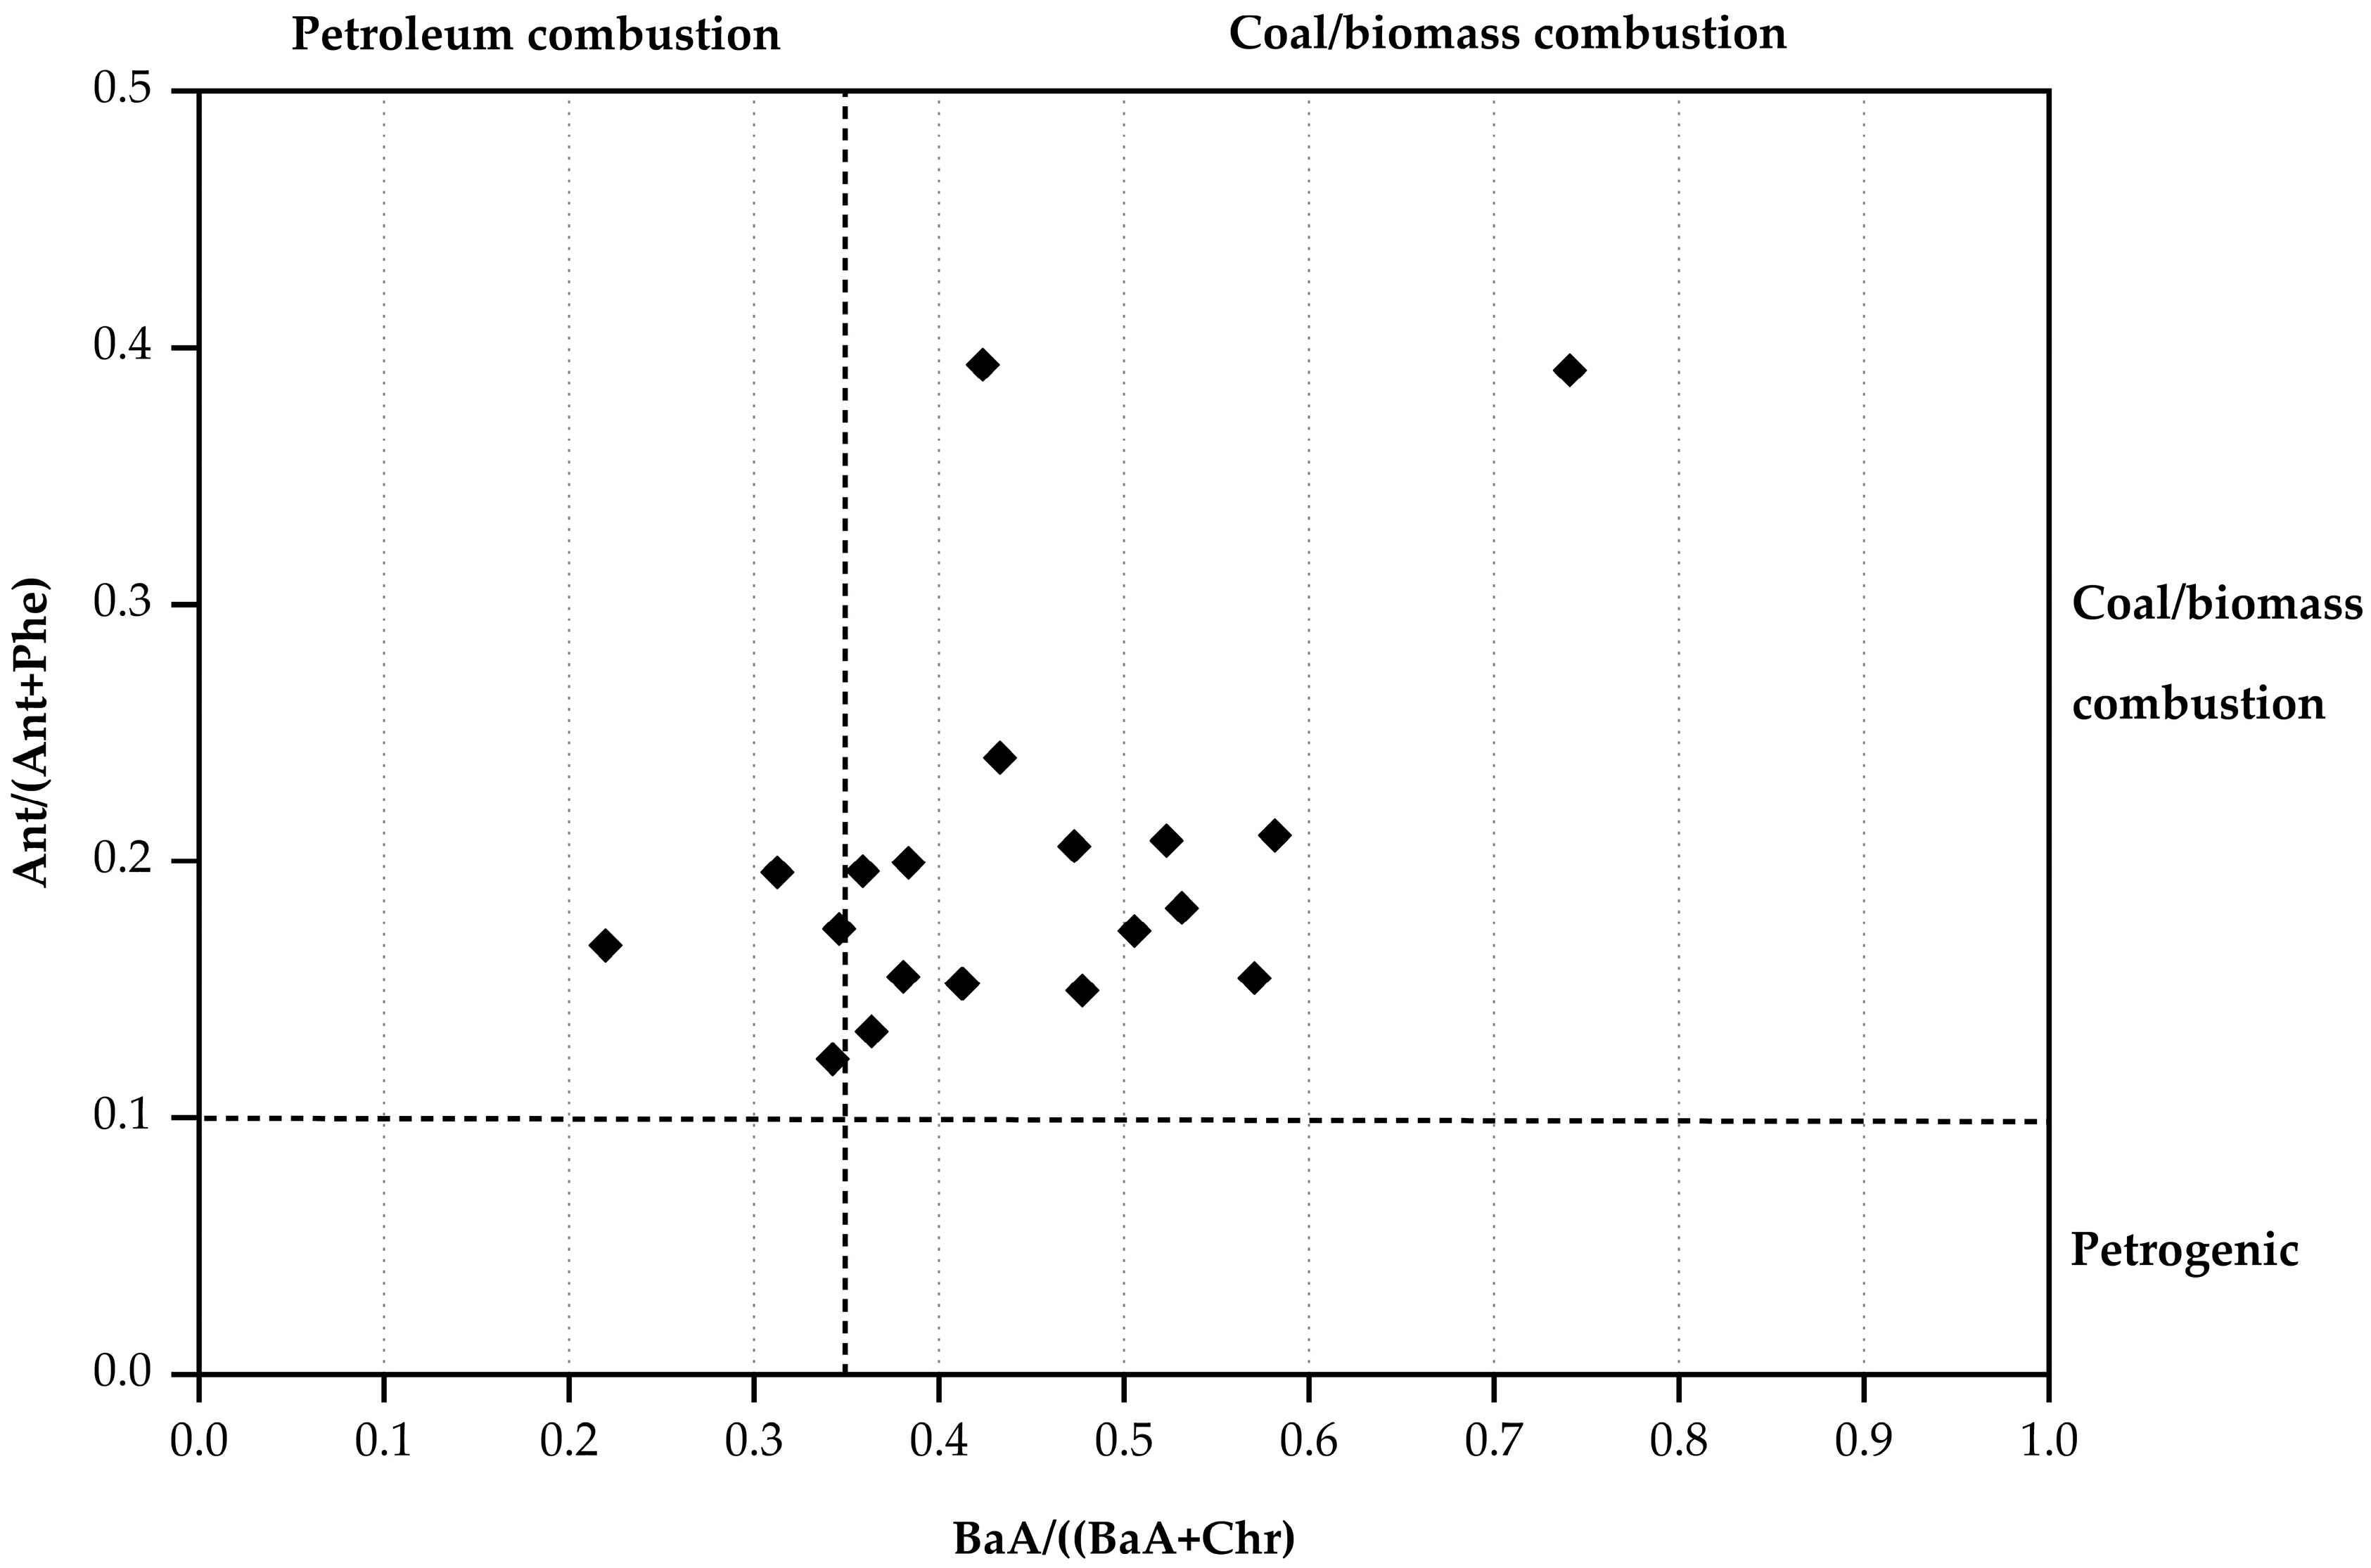
3.2.1. Diagnostic Ratio for PAHs

The diagnostic ratio of Ant/(Ant + Phe) and BaA/(BaA + Chr) was employed to identify the sources of PAHs in household dust samples, as illustrated in Figure 3. This ratio is typically utilized to differentiate between pyrogenic and petrogenic sources of PAHs [50,56]. This study found that the Ant/(Ant + Phe) values were higher than 0.10, with values ranging from 0.12 to 1.00, with a mean of 0.24. The ratios were also higher than 0.10. The data distribution indicates that most of the samples are located in the upper right of the quadrant, suggesting that the combustion of coal and biomass is the dominant source of PAHs [34,56]. A small number of locations overlap in the ‘petrogenic’ category, suggesting potential impacts from unburned petroleum sources. The mean values for BaA/(BaA + Chr) exceeded 0.35 in our study, signifying that both coal combustion and biomass burning contributed to PAHs in the Samoeng District of Chiang Mai Province throughout the study period [32,33]. Likewise, research conducted in China indicates that BaA/(BaA + Chr) values exceeding 0.2 confirm that combustion is the source of PAHs in households [57]. On the other hand, the results presented by Yunker et al. [31], which employed a similar diagnostic ratio method, revealed a distinct petrogenic signature, suggesting that petroleum-related activities constitute the primary source of PAHs. The PAH profile in this study area is predominantly influenced by combustion processes, especially those associated with biomass and wood combustion.

3.2.2. Principal Component Analysis (PCA)

Table 3 illustrates findings from PCA analysis to determine the sources of the PAHs identified in household dust samples and the relationships between them. The statistical analysis revealed three main components with eigenvalues exceeding 1, accounting for 97.96% of the total variance. The primary component (PC1), which demonstrates 47.61% of the variance, represented biomass combustion, evidenced by dominant loadings of Fla, Pyr, and BghiP—markers of wood stove emissions—and displayed important positive loadings for many HMW PAHs, such as Phe (0.767), Ant (0.852), Fla (0.965), Pyr (0.941), Chr (0.740), BbF (0.783), IcdP (0.746), and BghiP (0.897). The combustion of these molecules is mainly associated with markers of coal combustion [58] and wood burning [59]. Moreover, the high loading of BbF indicates an important influence from residential coal burning. The elevated levels of these PAHs on PC1 confirm a contribution from a pyrogenic source, supporting our earlier results from diagnostic ratio analysis.
In addition, PC2 includes four significant positive loadings, including Acy (0.721), BaP (0.926), BkF (0.701), and BaA (0.902). These loadings represent 32.22% of the variance. The elevated BaP (carcinogenic 5-ring PAH) and DahA suggest mixed contributions from diesel engines (common in agricultural machinery) and heavy oil combustion. Moreover, the significant correlation between vehicle emissions and BkF is known as a tracer of diesel exhaust [60]. Therefore, PC2 serves as an indicator of traffic-related emissions. The third component (PC3), accounting for 18.12% of the total variance, is characterized by high loadings of Nap and Flu. The dominance of 2–3 ring PAHs (Nap, Flu) indicates volatilization from unburned fuels, consistent with kerosene/fuelwood storage practices.
Previous studies have identified these PAH compounds as markers of coke oven emissions [61], suggesting that PC3 is associated with petroleum combustion sources. The diverse PAH profiles observed in household dust highlight the presence of multiple potential pollution sources, emphasizing the importance of employing accurate source apportionment techniques. Notably, the PCA results are consistent with findings from diagnostic ratio analysis, both confirming the contribution of various PAH sources to household dust.

3.3. Health Risk Assessment of PAHs in House Dust

This study calculated the ILCR to evaluate the possible cancer risk for two different age groups, as shown in Table 4. Children aged 1 to 6 years and adults aged 19 to 67 years are exposed to PAHs obtained in their homes. The analysis of ILCR linked to PAHs in household dust reveals significant differences in exposure patterns between children and adults. The average total ILCR for children aged 1–6 years was determined to be 6.57 × 10⁻³, with minimum and maximum values of 2.64 × 10⁻⁵ and 6.07 × 10⁻², respectively. This differs for adults (19–67 years), where the average total ILCR was 5.57 × 10⁻³, with minimum and maximum values of 2.24 × 10⁻⁵ and 5.14 × 10⁻², respectively. The results indicate that while the average cancer risk is comparable across age groups, children have slightly elevated risk levels, increasing concerns due to their developmental risk. The results for both groups in the present investigation seemed similar but exceeded those of previous studies [42,62]. The ILCR data indicate that dermal contact represents the most important exposure pathway for the two groups, with a mean value of 3.64 × 10⁻³ and 3.56 × 10⁻³, respectively. Not only has dermal exposure been identified by several authors, but dermal contact has also been identified as the main route through which humans are exposed to PAHs [13,46]. Ingestion is recognized as the second most significant pathway, with children displaying a mean of 2.92 × 10⁻³, in contrast to 2.00 × 10⁻³ for adults. The increased ingestion-related risk in children likely follows from their hand-to-mouth behaviors and the longer periods of time they spend close to floor surfaces [19]. Moreover, due to their lower body weight, it is suggested that children’s intake of PAHs exceeds that of adults (mg kg−1 body weight). The carcinogenic risk for adults was comparable to that of children. The risk of inhalation of pathways is low and can be disregarded.
Furthermore, the average total ILCR was 6.57 × 10⁻³ for children and 5.57 × 10⁻³ for adults, both exceeding the acceptable risk range of 10−6 to 10−4. This finding indicates that residents in the study area might be exposed to significant health risks due to exposure to PAHs in household dust in Samoeng District, Chiang Mai Province, who were exposed to an important risk of indoor dust PAH exposure, indicating potential public health concerns [62]. These findings align with the increased risk of cancer associated with PAH exposure in Tianjin and Guizhou, China [19,39]. However, the maximum overall ILCR values found (6.07 × 10⁻² for children and 5.14 × 10⁻² for adults) are concerning, as they suggest that some households may encounter cancer risk levels exceeding 10,000 times the established safety threshold. Such elevated risk values are comparable with findings from areas with heavy industrial activity and high traffic density [54,63]. The ILCR values obtained in this study correlate with those found in highly polluted rural areas of cities, but are beyond the values reported in rural and suburban areas [55]. The increased cancer risks shown in this study may be related to geographical variables, such as agricultural burning procedures, limited emission regulations, and common domestic cooking methods in the region [28].
Table 5 illustrates the impact of local energy procedures and socioeconomic factors on PAH concentrations and associated health risks. In Samoeng, the utilization of biomass for cooking and heating leads to elevated PAH exposure, particularly among children, whose ILCR levels significantly exceed those reported in most research conducted worldwide. As such, a study conducted in 2023 reported lifetime cancer risks (LCR) of 5.31 × 10⁻⁴ for adults and 9.05 × 10⁻⁴ for children associated with heavy metals [64]. The PAH ILCR values (6.57 × 10⁻³ for children) are significantly higher, indicating that PAHs in the present studies have higher carcinogenic risks compared to heavy metals in these households.
Additionally, the reported increased cancer risks in this study have significant implications for the health policies and activities across this area. Regarding the prevalence of the dermal route, interventions designed to reduce skin contact with contaminated dust, including promoting frequent cleaning, handwashing, as well as suitable clothes, may significantly decrease exposure risks. The elevated risks encountered by children highlight the necessity for focused interventions in settings where children frequently interact, including homes, schools, and daycare facilities. Interventions might involve more effective cleaning protocols, education on reducing PAH sources, and improved ventilation systems. However, the three significant distinctive characteristics of this work are in a rural, biomass-dependent area of northern Thailand. It is the first study opportunity to look at PAHs in household dust as well as related health risks, therefore filling the gap in knowledge in areas where most houses use fuelwood for energy. For source identification, the study combines diagnostic ratios with PCA, therefore presenting a more precise and effective apportionment of PAH sources than single-method methods. With children being the most vulnerable group, the thorough health risk assessment emphasizes that dermal contact is the main exposure path and determines cancer risk by age group and exposure pathway. These developments have significant consequences for rural communities’ focused public health promotions and management of environmental health.

4. Conclusions

Our study, conducted in Samoeng District, Chiang Mai Province, investigated the presence of PAHs in indoor dust, identified their sources, and assessed health risk implications. The statistics indicate that higher levels of PAHs are mostly produced by the combustion of wood and biomass, which represent a significant risk to the general population, particularly to children, compared to adults. The ILCR evaluation indicates that dermal exposure poses a significant health risk, surpassing established public health safety thresholds. These findings emphasize the need for interventions that promote improved indoor air quality through the implementation of environmental policies and enhanced public awareness, along with a decrease in biomass burning. The diagnostic ratios and PCA confirmed that combustion was the most significant source of PAH. These strategies are essential for environmental monitoring and remediation, as they efficiently and reasonably detect contamination sources. The result demonstrates the importance of employing these strategies to improve primary prevention.

Author Contributions

Conceptualization, S.K. and S.O.; methodology, S.K.; formal analysis, S.K. and T.S.; investigation, K.B. and W.P.; resources, S.K.; data curation, S.K. and T.S.; writing—original draft preparation, S.K., S.H., K.K., K.B., W.P., S.O. and T.S.; writing—review and editing, S.K., S.H., K.K., K.B., W.P., S.O. and T.S.; visualization, S.K.; project administration, S.O.; funding acquisition, S.O. and S.K. All authors have read and agreed to the published version of the manuscript.

Funding

This research was funded by the Fundamental Fund 2024 by Chiang Mai University.

Data Availability Statement

The data that supports the findings of this study are available from the corresponding author upon reasonable request.

Acknowledgments

The authors express gratitude to the Research Institute for Health Sciences, Chiang Mai University, Chiang Mai, Thailand, for facilitating sample analysis.

Conflicts of Interest

The authors declare no conflicts of interest.

References

  1. Offor, C.; Nduka, J. Appraisal of polycyclic aromatic hydrocarbons (PAHs) in indoor dust of Eastern Nigeria and its implications in the COVID-19 years. J. Hazard. Mater. Adv. 2024, 14, 100424. [Google Scholar] [CrossRef]
  2. Lawal, A.T. Polycyclic aromatic hydrocarbons. A review. Cogent. Environ. Sci. 2017, 3, 1339841. [Google Scholar] [CrossRef]
  3. Rasmussen, P.; Kubwabo, C.; Gardner, H.; Levesque, C.; Beauchemin, S. Relationships between house characteristics and exposures to metal(loid)s and synthetic organic contaminants evaluated using settled indoor dust. Int. J. Environ. Res. Public Health 2022, 19, 10329. [Google Scholar] [CrossRef] [PubMed]
  4. Abdel-Shafy, H.I.; Mansour, M.S.M. A review on polycyclic aromatic hydrocarbons: Source, environmental impact, effect on human health and remediation. Egypt. J. Pet. 2016, 25, 107–123. [Google Scholar] [CrossRef]
  5. Ali, N. Polycyclic aromatic hydrocarbons (PAHs) in indoor air and dust samples of different Saudi microenvironments; health and carcinogenic risk assessment for the general population. Sci. Total Environ. 2019, 696, 133995. [Google Scholar] [CrossRef]
  6. Maciejczyk, M.; Golder, K.; Janoszka, B.; Gierat, B.; Muzyka, R. Mutagenic and carcinogenic polycyclic aromatic hydrocarbons (PAHs) in food—Occurrence, human health effects, and assessment methods of exposure. Environ. Med. 2023, 26, 8–15. [Google Scholar] [CrossRef]
  7. Mallah, M.A.; Changxing, L.; Mallah, M.A.; Noreen, S.; Liu, Y.; Saeed, M.; Xi, H.; Ahmed, B.; Feng, F.; Mirjat, A.A.; et al. Polycyclic aromatic hydrocarbon and its effects on human health: An overeview. Chemosphere 2022, 296, 133948. [Google Scholar] [CrossRef]
  8. Liu, Y.; Mao, Y.; Xu, J.; Chen, W.; Hu, T.P.; Xu, C.; Liu, W.; Qu, C.; Chen, W.; Zhang, J.; et al. Health risks associated with polycyclic aromatic hydrocarbons (PAHs) in dustfall collected from universities in Wuhan, China. Atmosphere 2022, 13, 1707. [Google Scholar] [CrossRef]
  9. Mosallaei, S.; Hashemi, H.; Hoseini, M.; Dehghani, M.; Naz, A. Polycyclic aromatic hydrocarbons (PAHs) in household dust: The association between PAHs, cancer risk and sick building syndrome. Build. Environ. 2023, 229, 109966. [Google Scholar] [CrossRef]
  10. Liu, Y.; Zhu, L.; Shen, X. Polycyclic aromatic hydrocarbons (PAHs) in indoor and outdoor air of Hangzhou, China. Environ. Sci. Technol. 2001, 35, 840–844. [Google Scholar] [CrossRef]
  11. Arfaeinia, L.; Tabatabaie, T.; Miri, M.; Arfaeinia, H. Bioaccessibility-based monitoring and risk assessment of indoor dust-bound PAHs collected from housing and public buildings: Effect of influencing factors. Environ. Res. 2021, 204, 112039. [Google Scholar] [CrossRef]
  12. Wang, X.Q.; Li, X.; Yang, Y.Y.; Fan, L.; Han, X.; Li, L.; Liu, H.; Ge, T.X.; Su, L.Q.; Wang, X.; et al. Source, characterization of indoor dust PAHs and the health risk on Chinese children. Curr. Med. Sci. 2021, 41, 199–210. [Google Scholar] [CrossRef] [PubMed]
  13. Jakovljević, I.; Dvoršćak, M.; Jagić, K.; Klinčić, D. Polycyclic aromatic hydrocarbons in indoor dust in Croatia: Levels, sources, and human health risks. Int. J. Environ. Res. Public Health 2022, 19, 11848. [Google Scholar] [CrossRef] [PubMed]
  14. Li, C.; Bai, L.; He, Z.; Wang, Y. Health risk assessment of heavy metals and poly-aromatic hydrocarbons in particulate matter adsorbed by indoor air purifiers. Indoor Built Environ. 2022, 31, 1594–1612. [Google Scholar] [CrossRef]
  15. Grmasha, R.A.; Al-Sareji, O.J.; Salman, J.M.; Hashim, K.S. Polycyclic aromatic hydrocarbons (PAHs) in urban street dust within three land-uses of Babylon governorate, Iraq: Distribution, sources, and health risk assessment. J. King Saud Univ. Eng. Sci. 2022, 34, 231–239. [Google Scholar] [CrossRef]
  16. Iwegbue, C.M.A.; Iteku-Atata, E.O.C.; Odali, E.W.; Egobueze, F.E.; Tesi, G.O.; Nwajei, G.E.; Martincigh, B.S. Distribution, sources and health risks of polycyclic aromatic hydrocarbons (PAHs) in household dusts from rural, semi-urban and urban areas in the Niger Delta, Nigeria. Expo Health 2019, 11, 209–225. [Google Scholar] [CrossRef]
  17. Geravand, P.; Goudarzi, G.; Ahmadi, M. Polycyclic aromatic hydrocarbons (PAHs) in urban street dust in Masjed Soleyman, Khuzestan, Iran: Sources and health risk assessment. Int. J. Environ. Anal. Chem. 2022, 104, 4341–4351. [Google Scholar] [CrossRef]
  18. Dalvand, N.; Sobhanardakani, S.; Sadr, M.; Cheraghi, M.; Lorestani, B. Concentrations, source apportionment and health risk assessment of polycyclic aromatic hydrocarbons (PAHs) in household dust samples, the case of city of Khorramabad, Iran. Polycycl. Aromat. Compd. 2023, 44, 3043–3060. [Google Scholar] [CrossRef]
  19. Yang, Q.; Chen, H.; Li, B. Polycyclic aromatic hydrocarbons (PAHs) in indoor dusts of Guizhou, southwest of China: Status, sources and potential human health risk. PLoS ONE 2015, 10, e0118141. [Google Scholar] [CrossRef]
  20. Shukla, S.; Khan, R.; Bhattacharya, P.; Devanesan, S.; AlSalhi, M.S. Concentration, source apportionment and potential carcinogenic risks of polycyclic aromatic hydrocarbons (PAHs) in roadside soils. Chemosphere 2022, 292, 133413. [Google Scholar] [CrossRef]
  21. Zhang, H.; Huang, Q.; Han, P.; Zhang, Z.; Shengtao, J.; Yang, W. Source identification and toxicity apportionment of polycyclic aromatic hydrocarbons in surface soils in Beijing and Tianjin using a PMF-TEQ method. PLoS ONE 2022, 17, e0268615. [Google Scholar] [CrossRef] [PubMed]
  22. Sankar, T.; Kumar, A.; Kumar Mahto, D.; Das, K.; Narayan, P.; Fukate Jain, M.; Awachat, P.; Padghan, D.; Mohammad, F.; Al-Lohedan, H.; et al. The health risk and source assessment of polycyclic aromatic hydrocarbons (PAHs) in the soil of industrial cities in India. Toxics 2023, 11, 515. [Google Scholar] [CrossRef] [PubMed]
  23. Vega, E.; Lopez-Veneroni, D.; Ramírez Hernández, O.; Chow, J.; Watson, J. Particle-bound PAHs and chemical composition, sources and health risk of PM2.5 in a highly industrialized area. Aerosol Air Qual. Res. 2021, 21, 210047. [Google Scholar] [CrossRef]
  24. Mali, M.; Ragone, R.; Dell’Anna, M.; Romanazzi, G.; Damiani, L.; Mastrorilli, P. Improved identification of pollution source attribution by using PAH ratios combined with multivariate statistics. Sci. Rep. 2022, 12, 19298. [Google Scholar] [CrossRef]
  25. Sakizadeh, M. Spatial distribution and source identification together with environmental health risk assessment of PAHs along the coastal zones of the USA. Environ. Geochem. Health 2020, 42, 3333–3350. [Google Scholar] [CrossRef]
  26. Kawichai, S.; Prapamontol, T.; Chantara, S.; Kanyanee, T. Seasonal variation and sources estimation of PM2.5- bound PAHs from the ambient air of Chiang Mai City: An All-year-round Study in 2017. Chiang Mai J. Sci. 2020, 47, 958–972. [Google Scholar]
  27. Yang, B.; Zhou, L.; Xue, N.; Li, F.; Li, Y.; Vogt, R.D.; Cong, X.; Yan, Y.; Liu, B. Source apportionment of polycyclic aromatic hydrocarbons in soils of Huanghuai Plain, China: Comparison of three receptor models. Sci. Total Environ. 2013, 443, 31–39. [Google Scholar] [CrossRef]
  28. Long, Y.; Dai, T.; Wu, Q. Sources and distribution of polycyclic aromatic hydrocarbons in street dust from the Chang-Zhu-Tan Region, Hunan, China. Environ. Monit. Assess. 2013, 185, 1377–1390. [Google Scholar] [CrossRef]
  29. Shen, M.; Liu, G.; Yin, H.; Zhou, L. Distribution, sources and health risk of PAHs in urban air-conditioning dust from Hefei, East China. Ecotoxicol. Environ. Saf. 2020, 194, 110442. [Google Scholar] [CrossRef]
  30. Tobiszewski, M.; Namieśnik, J. PAH diagnostic ratios for the identification of pollution emission sources. Environ. Pollut. 2012, 162, 110–119. [Google Scholar] [CrossRef]
  31. Yunker, M.; Vingarzan, R.; Mitchell, R.; Goyette, D.; Strachan, S. PAHs in the fraser river basin: A critical appraisal of PAH ratios as indicators of PAH source and composition. Org. Geochem. 2002, 33, 489–515. [Google Scholar] [CrossRef]
  32. Davis, E.; Walker, T.R.; Adams, M.; Willis, R.; Norris, G.A.; Henry, R.C. Source apportionment of polycyclic aromatic hydrocarbons (PAHs) in small craft harbor (SCH) surficial sediments in Nova Scotia, Canada. Sci. Total Environ. 2019, 691, 528–537. [Google Scholar] [CrossRef] [PubMed]
  33. Lloyd, J.; Lu, K.; Liu, Z. Investigating concentrations and sources of polycyclic aromatic hydrocarbons in South and Central Texas bays and estuaries along the Gulf of Mexico, USA. Front. Mar. Sci. 2024, 11, 1456717. [Google Scholar] [CrossRef]
  34. Ravindra, K.; Sokhi, R.; Van Grieken, R. Atmospheric polycyclic aromatic hydrocarbons: Source attribution, emission factors and regulation. Atmos. Environ. 2008, 42, 2895–2921. [Google Scholar] [CrossRef]
  35. Wu, Y.; Zhang, N.; Wang, Y.; Ren, Y.; Yuan, Z.; Li, N. Concentrations of polycyclic aromatic hydrocarbons in street dust from bus stops in Qingyang city: Estimates of lifetime cancer risk and sources of exposure for daily commuters in Northwest China. Environ. Pollut. 2020, 266 Pt 2, 115222. [Google Scholar] [CrossRef]
  36. Manoli, E.; Kouras, A.; Karagkiozidou, O.; Argyropoulos, G.; Voutsa, D.; Samara, C. Polycyclic aromatic hydrocarbons (PAHs) at traffic and urban background sites of northern Greece: Source apportionment of ambient PAH levels and PAH-induced lung cancer risk. Environ. Sci. Pollut. Res. Int. 2016, 23, 3556–3568. [Google Scholar] [CrossRef]
  37. Nisbet, I.C.T.; LaGoy, P.K. Toxic equivalency factors (TEFs) for polycyclic aromatic hydrocarbons (PAHs). Regul. Toxicol. Pharmacol. 1992, 16, 290–300. [Google Scholar] [CrossRef]
  38. Petry, T.; Schmid, P.; Schlatter, C. The use of toxic equivalency factors in assessing occupational and environmental health risk associated with exposure to airborne mixtures of polycyclic aromatic hydrocarbons (PAHs). Chemosphere 1996, 32, 639–648. [Google Scholar] [CrossRef]
  39. Hu, Y.; Bai, Z.; Zhang, L.; Wang, X.; Zhang, L.; Yu, Q.; Zhu, T. Health risk assessment for traffic policemen exposed to polycyclic aromatic hydrocarbons (PAHs) in Tianjin, China. Sci. Total Environ. 2007, 382, 240–250. [Google Scholar] [CrossRef]
  40. Yang, W.; Lang, Y.; Li, G. Cancer risk of polycyclic aromatic hydrocarbons (PAHs) in the soils from Jiaozhou Bay wetland. Chemosphere 2014, 112, 289–295. [Google Scholar] [CrossRef]
  41. Wei, Y.; Han, I.K.; Hu, M.; Shao, M.; Zhang, J.J.; Tang, X. Personal exposure to particulate PAHs and anthraquinone and oxidative DNA damages in humans. Chemosphere 2010, 81, 1280–1285. [Google Scholar] [CrossRef] [PubMed]
  42. Wang, W.; Huang, M.J.; Kang, Y.; Wang, H.S.; Leung, A.O.; Cheung, K.C.; Wong, M.H. Polycyclic aromatic hydrocarbons (PAHs) in urban surface dust of Guangzhou, China: Status, sources and human health risk assessment. Sci. Total Environ. 2011, 409, 4519–4527. [Google Scholar] [CrossRef] [PubMed]
  43. U.S. EPA. Supplemental Guidance for Developing Soil Screening Levels for Superfund Sites; EPA: Washington, DC, USA, 2001; pp. 93552–93554.
  44. Alamri, S.H.; Ali, N.; Ali Albar, H.M.S.; Rashid, M.I.; Rajeh, N.; Ali Qutub, M.M.; Malarvannan, G. Polycyclic aromatic hydrocarbons in indoor dust collected during the COVID-19 pandemic lockdown in Saudi Arabia: Status, sources and human health risks. Int. J. Environ. Res. Public Health 2021, 18, 2743. [Google Scholar] [CrossRef]
  45. Xiao, Y.; Tong, F.; Kuang, Y.; Chen, B. Distribution and source apportionment of polycyclic aromatic hydrocarbons (PAHs) in forest soils from urban to rural areas in the Pearl River Delta of Southern China. Int. J. Environ. Res. Public Health 2014, 11, 2642–2656. [Google Scholar] [CrossRef]
  46. Al-Harbi, M.; Alhajri, I.; Whalen, J.K. Health risks associated with the polycyclic aromatic hydrocarbons in indoor dust collected from houses in Kuwait. Environ. Pollut. 2020, 266, 115054. [Google Scholar] [CrossRef] [PubMed]
  47. Ge, S.; Jiao, Z.; Gao, C.; Zaib, M.; Ruan, X.; Wang, Y. Potential health risks for long-term stays in underground parking garages: Implications of polycyclic aromatic hydrocarbons in surface dust. Indoor Air 2024, 2024, 5527710. [Google Scholar] [CrossRef]
  48. Whitehead, T.P.; Metayer, C.; Petreas, M.; Does, M.; Buffler, P.A.; Rappaport, S.M. Polycyclic aromatic hydrocarbons in residential dust: Sources of variability. Environ. Health Perspect. 2013, 121, 543–550. [Google Scholar] [CrossRef]
  49. Whitehead, T.; Metayer, C.; Gunier, R.B.; Ward, M.H.; Nishioka, M.G.; Buffler, P.; Rappaport, S.M. Determinants of polycyclic aromatic hydrocarbon levels in house dust. J. Expo. Sci. Environ. Epidemiol. 2011, 21, 123–132. [Google Scholar] [CrossRef]
  50. Wu, D.; Chen, L.; Ma, Z.; Zhou, D.; Fu, L.; Liu, M.; Zhang, T.; Yang, J.; Zhen, Q. Source analysis and health risk assessment of polycyclic aromatic hydrocarbon (PAHs) in total suspended particulate matter (TSP) from Bengbu, China. Sci. Rep. 2024, 14, 5080. [Google Scholar] [CrossRef]
  51. Yang, L.; Zhang, X.; Xing, W.; Zhou, Q.; Zhang, L.; Wu, Q.; Zhou, Z.; Chen, R.; Toriba, A.; Hayakawa, K.; et al. Yearly variation in characteristics and health risk of polycyclic aromatic hydrocarbons and nitro-PAHs in urban shanghai from 2010–2018. J. Environ. Sci. 2021, 99, 72–79. [Google Scholar] [CrossRef]
  52. Hasan, G.M.M.; Rinky, F.; Das, A.; Ahmed, K.; Sikdar, K. Assessment of polycyclic aromatic hydrocarbon (PAH) levels and health risks in kitchen dust from wood, kerosene, and gas cooking systems in Cumilla, Bangladesh. J. Hazard Mater. Adv. 2024, 15, 100457. [Google Scholar] [CrossRef]
  53. Živančev, J.; Antić, I.; Buljovčić, M.; Đurišić-Mladenović, N. A case study on the occurrence of polycyclic aromatic hydrocarbons in indoor dust of Serbian households: Distribution, source apportionment and health risk assessment. Chemosphere 2022, 295, 133856. [Google Scholar] [CrossRef]
  54. Iwegbue, C.M.A. Polycyclic Aromatic Hydrocarbons Profile of Kitchen Dusts. Bull. Environ. Contam. Toxicol. 2011, 86, 298–301. [Google Scholar] [CrossRef] [PubMed]
  55. Wang, Z.; Wang, S.; Nie, J.; Wang, Y.; Liu, Y. Assessment of polycyclic aromatic hydrocarbons in indoor dust from varying categories of rooms in Changchun city, northeast China. Environ. Geochem. Health 2017, 39, 15–27. [Google Scholar] [CrossRef]
  56. Chao, S.; Jianwei, L.; Yanjiao, C.; Cao, H.; Zhang, A. Implications of seasonal control of PM2.5-bound PAHs: An integrated approach for source apportionment, source region identification and health risk assessment. Environ. Pollut. 2018, 247, 685–695. [Google Scholar] [CrossRef]
  57. Liu, B.; Yu, X.; Lv, L.; Dong, W.; Chen, L.; Wu, W.; Yu, Y.A. nationwide survey of polycyclic aromatic hydrocarbons (PAHs) in household dust in China: Spatial distribution, sources, and health risk assessment. Environ. Geochem. Health 2023, 45, 4979–4993. [Google Scholar] [CrossRef]
  58. Harrison, R.M.; Smith, D.J.T.; Luhana, L. Source apportionment of atmospheric polycyclic aromatic hydrocarbons collected from an urban location in Birmingham, U.K. Environ. Sci. Technol. 1996, 30, 825–832. [Google Scholar] [CrossRef]
  59. Cao, H.; Chao, S.; Qiao, L.; Jiang, Y.; Zeng, X.; Fan, X. Urbanization-related changes in soil PAHs and potential health risks of emission sources in a township in Southern Jiangsu, China. Sci. Total Environ. 2017, 575, 692–700. [Google Scholar] [CrossRef]
  60. Teixeira, E.C.; Mattiuzi, C.D.; Agudelo-Castañeda, D.M.; Garcia Kde, O.; Wiegand, F. Polycyclic aromatic hydrocarbons study in atmospheric fine and coarse particles using diagnostic ratios and receptor model in urban/industrial region. Environ. Monit. Assess. 2013, 185, 9587–9602. [Google Scholar] [CrossRef]
  61. Kwon, H.O.; Choi, S.D. Polycyclic aromatic hydrocarbons (PAHs) in soils from a multi-industrial city, South Korea. Sci. Total Environ. 2014, 470–471, 1494–1501. [Google Scholar] [CrossRef]
  62. Asimina, S.; Dasopoulou, M.; Bairachtari, K.; Karavoltsos, S.; Sakellari, K.; Maggos, T. Contamination and potential risk assessment of polycyclic aromatic hydrocarbons (PAHs) and heavy metals in house settled dust collected from residences of young children. Appl. Sci. 2021, 11, 1479. [Google Scholar] [CrossRef]
  63. Wang, J.; Zhang, X.; Ling, W.; Liu, R.; Liu, J.; Kang, F.; Gao, Y. Contamination and health risk assessment of PAHs in soils and crops in industrial areas of the Yangtze River Delta region, China. Chemosphere 2017, 168, 976–987. [Google Scholar] [CrossRef] [PubMed]
  64. Somsunun, K.; Prapamontol, T.; Kuanpan, T.; Santijitpakdee, T.; Kohsuwan, K.; Jeytawan, N.; Thongjan, N. Health risk assessment of heavy metals in indoor household dust in urban and rural areas of Chiang Mai and Lamphun province, Thailand. Toxics 2023, 11, 1018. [Google Scholar] [CrossRef] [PubMed]
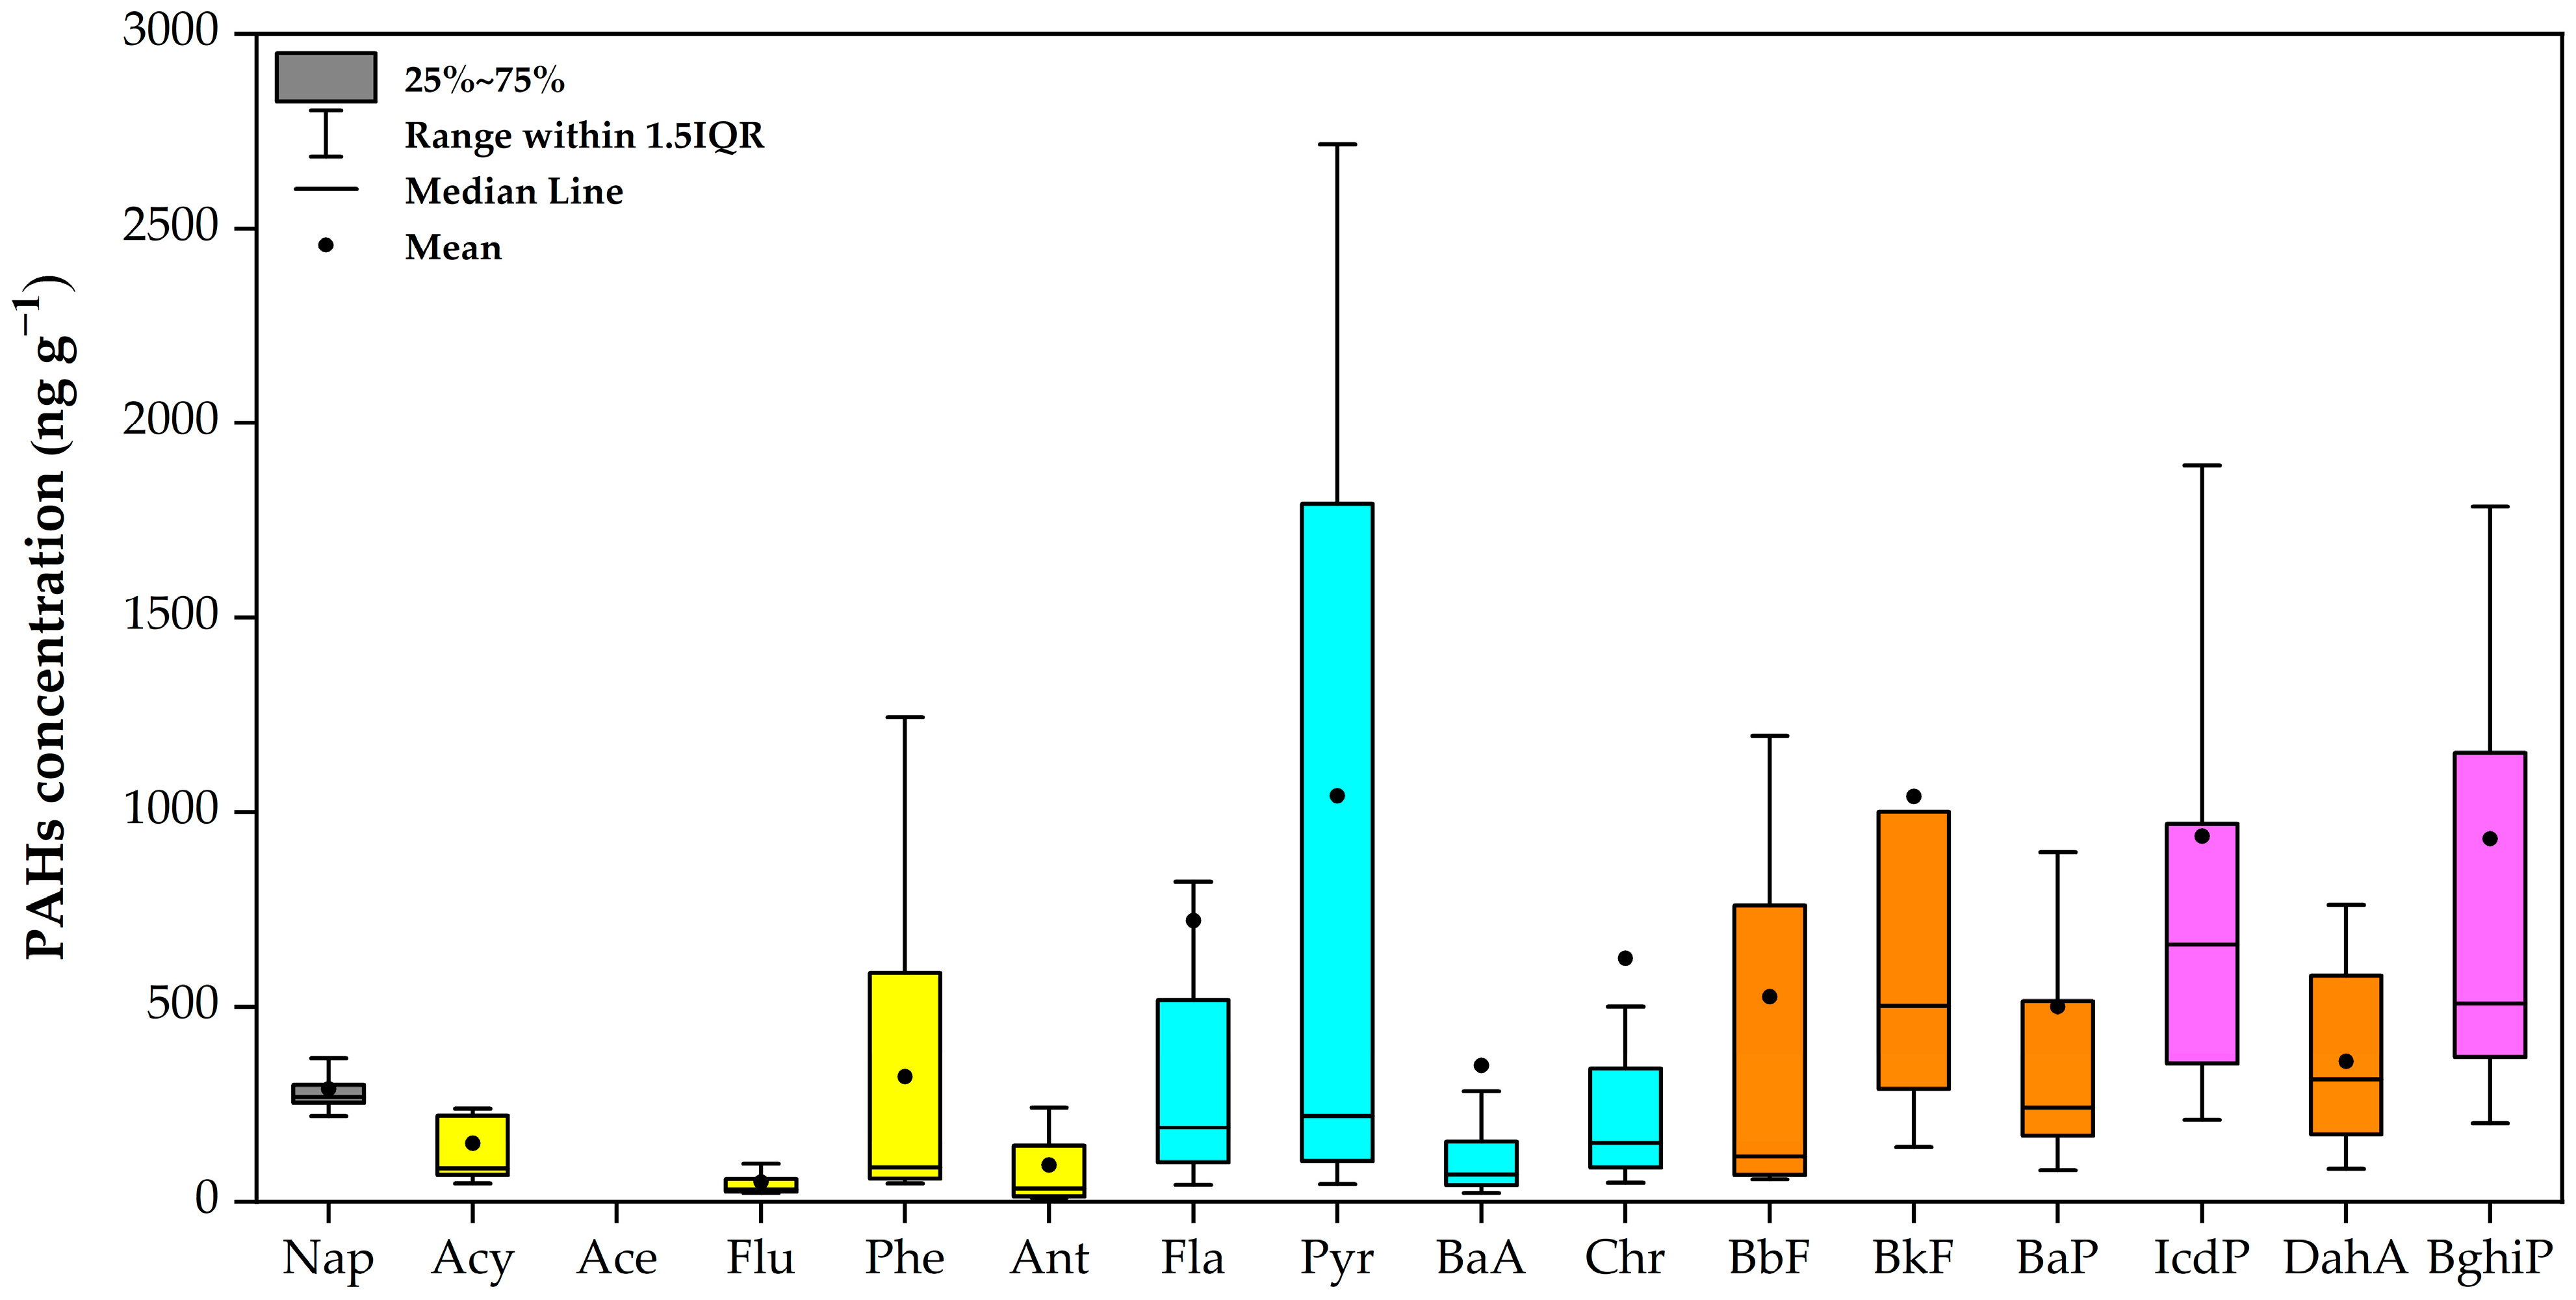
Figure 1. Map of sampling sites at Samoeng District, Chiang Mai Province.
Buildings 15 01855 g001
Figure 2. Concentrations of PAHs in house dust at Samoeng District, Chiang Mai Province.
Buildings 15 01855 g002
Figure 3. A scatter plot of diagnostic ratios between Ant/(Ant + Phe) and BaA/(BaA + Chr).
Buildings 15 01855 g003
Table 2. The mean concentration (ng g−1) of PAHs in house dust in Samoeng District, Chiang Mai Province.
PAHs CompoundsAbbreviationTEFMeanMinimumMaximumS.D.
NaphthaleneNap0.001288.7219.3666.470.5
AcenaphthyleneAcy0.001149.046.4540.3144.6
AcenaphtheneAce0.001N.D.N.D.N.D.N.D.
FluoreneFlu0.00150.822.0164.340.5
PhenanthrenePhe0.001320.146.01706.0441.9
AnthraceneAnt0.01093.310.0393.4115.7
FluorantheneFla0.001721.942.95996.51310.6
PyrenePyr0.0011042.244.46966.91736.2
Benzo (a) anthraceneBaA0.100349.022.15123.5977.0
ChryseneChr0.010624.548.05471.41220.5
Benzo (b) fluorantheneBbF0.100525.957.23355.5791.9
Benzo (k) fluorantheneBkF0.1001040.3139.43891.41285.3
Benzo (a) pyreneBaP1.000500.380.53685.4775.3
Indenol (1,2,3-cd) pyreneIcdP0.100938.6210.95099.31102.4
Dibenz (a,h) anthraceneDahA1.000359.183.0762.0227.5
Benzo (g,h,i) peryleneBghiP0.010932.2201.64646.31100.2
∑PAHs 3942.4270.145,386.88175.1
N.D. = not detectable.
Table 3. Identification of PAHs in house dust using PCA.
PAHsPC1PC2PC3
Nap−0.0010.3400.940
Acy0.4140.7210.544
Flu0.5020.1080.856
Phe0.7670.3170.442
Ant0.8520.3770.286
Fla0.9650.2600.043
Pyr0.9410.3070.138
BaA0.3440.9020.252
Chr0.7400.6430.151
BbF0.7830.5590.229
BkF0.6550.7010.279
BaP0.2560.9260.275
IcdP0.7460.5350.383
DahA0.6710.7290.010
BghiP0.8970.2770.262
Eigenvalues11.9271.6121.154
% of variance47.61232.22418.12
cumulative (%)47.61279.83697.956
Factor loading values of >0.700 are shown in bold.
Table 4. Exposure to PAHs in household dust through different exposure pathways.
ILCRChildrenAdult
Exposure Pathways (ILCR)Exposure Pathways (ILCR)
IngestionDermalInhalationTotalIngestionDermalInhalationTotal
Min.1.17 × 10−51.46 × 10⁻⁵ 2.28 × 10−52.64 × 10−58.06 × 10−61.43 × 10−56.25 × 10−102.24 × 10−5
Max.2.72 × 10−23.37 × 10−25.24 × 10−76.07 × 10−21.85 × 10−23.29 × 10−21.44 × 10−65.14 × 10⁻²
Mean2.92 × 10−33.64 × 10−35.67 × 10−86.57 × 10−32.00 × 10−33.56 × 10−31.55 × 10−75.57 × 10⁻³
S.D.5.42 × 10−36.76 × 10−31.05 × 10−71.22 × 10−23.72 × 10−36.60 × 10−32.88 × 10−71.03 × 10⁻²
Table 5. Comparisons of health risk levels in household dust from different studies.
Study LocationReferencesPopulation GroupMean ILCR or LCRAcceptable Risk Range
Chiang Mai, ThailandThis studyChildren6.57 × 10−310−6 to 10−4
Adults5.57 × 10−3
Chiang Mai—Lamphun, Thailand[64]Children9.05 × 10−410−6 to 10−4
Adults5.31 × 10−4
Lahore, Pakistan[24]Children8.80 × 10−3 (winter)
9.16 × 10⁻³ (summer)
10−6 to 10−4
Adults1.33 × 10−2 (winter)
1.38 × 10⁻² (summer)
Guizhou, China[19]Children3.08–6.14 × 10−610−6 to 10−4
Adults2.97–5.92 × 10⁻⁶
Croatia[13]Children2.18 × 10−710−6 to 10−4
Adults2.64 ×10−7
Saudi Arabia[44]Children1.00 ×10−410−6 to 10−4
Adults1.00 ×10−4
Iran (Khorramabad)[18]Children2.07 ×10−410−6 to 10−4
Adults1.83 ×10−4
Disclaimer/Publisher’s Note: The statements, opinions and data contained in all publications are solely those of the individual author(s) and contributor(s) and not of MDPI and/or the editor(s). MDPI and/or the editor(s) disclaim responsibility for any injury to people or property resulting from any ideas, methods, instructions or products referred to in the content.

