Article

Assessment of Indoor Air Quality in Primary School Classrooms: A Case Study in Mbuji Mayi and Lubumbashi, Democratic Republic of Congo

by
Jean Paul Kapuya Bulaba Nyembwe
1,2,3,*,
Junior Florent Mbwisi Takizala
2,
Serge Kalonji Muangala
2,
Olivier Kayembe Nyembwe
3,
John Omomoluwa Ogundiran
1 and
Manuel Gameiro da Silva
1,*
1
Department of Mechanical Engineering, ADAI, University of Coimbra, Pólo II, Rua Luís Reis Santos, 3030-788 Coimbra, Portugal
2
School of Architecture, Planning, and Design, University of New Horizons, Route Kasapa 2465, Lubumbashi 2000, Democratic Republic of the Congo
3
Department of Civil Engineering, University Officiel of Mbuji-Mayi, Av Kalonji 27, Mbuji-Mayi, Democratic Republic of Congo
*
Authors to whom correspondence should be addressed.
Buildings 2025, 15(5), 730; https://doi.org/10.3390/buildings15050730
Submission received: 29 January 2025 / Revised: 19 February 2025 / Accepted: 22 February 2025 / Published: 24 February 2025
(This article belongs to the Special Issue Indoor Air Quality in Buildings)

Abstract

This study assesses indoor air quality (IAQ) in two schools in the Democratic Republic of Congo (DRC), contributing scientific data for a developing tropic such as the DRC marked by the absence of sufficient study on the indoor environmental quality (IEQ) in school buildings. Over ten weeks, we monitored IEQ parameters in two schools, considering their unique geographical and environmental settings. Using a calibrated IEQ multiprobe and particle counters, we measured the CO2 levels, temperature, relative humidity, and particulate matter (PM). Our data analysis, which included ANOVA and correlation assessments, revealed a concerning trend. We found that the CO2 and PM concentrations in the classroom were significantly high, often exceeding recommended safety thresholds. The current natural ventilation systems were found to be inadequate, particularly in managing CO2 concentrations and PM levels influenced by proximity to industrial activities. Our study recommends that schools in similar settings adopt mechanical ventilation systems with high-efficiency particulate air (HEPA) filters to improve IAQ. We also recommend regular monitoring and dynamic air quality adjustment based on real-time data to ensure the effectiveness of implemented interventions. Furthermore, we propose that future studies focus on a broader range of environmental conditions and include many schools and educational buildings to enhance the generalisability of the findings. Long-term health outcomes and the cost-effectiveness of different ventilation strategies should also be explored to develop adapted, sustainable interventions for improving student well-being and performance in schools globally.

1. Introduction

Indoor air quality (IAQ) studies have been rarely conducted in African schools, yet the COVID-19 pandemic underscores their importance. There have been several studies on IAQ in school buildings and how to improve the indoor climate (IC). This is important as studies have shown the negative impacts of poor IC on students in terms of health, performance, and comfort [1,2,3]. School buildings are designed for educational purposes, where students converge for extended learning. Next to residential homes, the school building ranks as the second most crucial indoor space for students [4] and it is essential to study and evaluate the indoor environment of school buildings and their likely impact on the students [5,6]. These concerns are even more pronounced in developing regions like the Democratic Republic of the Congo (DRC), where rapid geometric population growth, urbanisation, and industrial activities such as mining and commerce impact environmental conditions. Moreover, owing to the reports of a paucity of scientific studies on IEQ in developing tropics, the novelty of this IEQ field survey of school buildings is reinforced by the need to bridge study gaps in the region [7]. Additionally, to the best of the authors’ knowledge, the current objective to survey IC in classrooms of schools in the DRC serves as a pilot study regarding the IC status quo that vulnerable groups such as young students and teachers are exposed to. Notably, existential risk for DRC hospitals has been reported to be linked to poor IEQ regulations, ambient pollution, poor infrastructure, and socio-economic peculiarities [8], which are not limited to hospitals but are typical of many institutions in the DRC, including schools. Hence, the current study scope of assessing the IC of classrooms also considers occupant demography and density, including the risk of prolonged exposure hours for students and school workers.
In the case of growing children, many of whom are still developing their immune systems, there is a risk of health vulnerabilities due to poor air pollution [9]. Poor IAQ can lead to chronic health effects affecting young children who are particularly vulnerable to respiratory problems [10,11,12,13]. High exposure to carbon dioxide (CO2) and particulate matter (PM) can impact lung function and asthma, directly affecting a child’s health and performance in school. Studies have shown that high CO2 levels, often due to inadequate ventilation, can cause Sick Building Syndrome (SBS), which can affect students’ health and learning performance [14,15]. Other studies revealed that even short-term exposure to PM negatively impacts the respiratory health of young children, and long-term exposure to finer particles, PM2.5, presents more severe risks than PM10 [16,17]. PM2.5, which are fine particles, can penetrate the lungs and enter the bloodstream, potentially causing long-term health issues such as cardiovascular diseases, lung cancer, and respiratory diseases to occupants [18,19,20]. However, the COVID-19 pandemic has served as a stark reminder of the importance of IAQ in schools, with concerns about virus transmission through airborne particles [21]. Improving the IAQ in school environments is essential to ensure students’ well-being and performance. Several studies have investigated the IAQ in residential and commercial buildings [7], but fewer studies focused on school buildings near mining industrial zones in tropical African countries [7,22,23]. In the DRC, the proximity of schools to industrial activities poses unique challenges for maintaining good IAQ. Mining operations release pollutants in many regions, including heavy metals, nitrogen oxides, and PM, which can infiltrate nearby buildings. These pollutants primarily happen in naturally ventilated buildings and, in the context of poor IAQ, can affect students’ and staff’s breathing [23]. Schools and hospitals near mining can have poor IAQ due to outdoor air pollution. In a previous review study about indoor climate studies in the tropics, the authors were not able to identify any scientific research on critical indoor spaces, such as hospital and school buildings in the DRC [7], where outdoor pollution from the nearby mining industry affects citizens [24,25]. As part of the authors’ ongoing research campaigns for IEQ assessment in developing tropics [7,8,26], the current study focuses on school buildings in the DRC situated in pollution-prone ambient environments coupled with inherent indoor climate risks associated with a high occupancy tendency in classrooms, poor ventilation settings, and inadequate building designs. Mining operations release pollutants in many regions of the DRC, including the current study region, contributing to these existential risks for exposed students and staff in schools, hospitals, homes, and other indoor spaces in the context of poor IAQ.
Moreover, considering the recent reports on the adverse effects of climate change and extreme temperatures in the tropics [27], the indoor relative humidity (RH) and temperature (T) parameters are also critical factors to investigate since outdoor conditions extend to indoor spaces. Inadequate RH and T (°C) levels may influence IAQ by promoting mould growth, leading to allergic reactions and respiratory issues [23]. Moreover, high temperatures can exacerbate the effects of other pollutants. Maintaining optimal humidity (30–60%) and temperature (20–24 °C) is vital to ensuring a healthy indoor environment [28]. However, achieving these conditions can be challenging in tropical climates like the DRC, where seasonal variations and a lack of climate control infrastructure exist. Studies in tropical countries such as Nigeria and Malaysia have shown that high humidity and temperature levels can significantly affect IAQ and comfort [29,30]. Other studies in Indonesia found that NV could reduce CO2 levels, but it was less effective in managing PM concentrations in areas with heavy traffic and industrial activity [31,32]. This variability underscores the importance of understanding local environmental conditions when designing school ventilation strategies. Studies have revealed that industrial emissions can impact IAQ, but few have focused on the specific contexts of schools in developing countries, like the DRC [7,33]. Research in tropical regions like Ghana and Brazil has shown that local industrial activities can drastically affect IAQ, leading to health issues among schoolchildren [34,35]. Therefore, the current study serves as a veritable pilot study for the DRC, focusing on examining IAQ in two DRC schools near industrial areas. It uses objective assessments to survey IAQ parameters, including the implications of the ventilation status quo in the selected study schools.

2. Materials and Methods

2.1. Case Study Schools

This IAQ study was conducted in two distinct school classroom buildings in different tropical climate zones, including unique geographical and environmental settings. This study concentrated on primary schools in the DRC, primarily targeting classrooms for children aged nine to ten. The first classroom, designated S1, is at the Age d’Or School in Lubumbashi. It is a new building that was completed in 2014. The school is located about 7 kilometres from the Rwashi Copper Mine and near a main road with heavy traffic, factors that may negatively affect air quality.
It accommodates 57 students on a total surface area of 139.5 m2. It has three south-facing windows with a total area of 9 m2, designed to maximise natural airflow from the prevalent southern winds. The second classroom, S2, is at Miba School, which was established in 1987 in the commercial hub of Mbuji Mayi, about 1320 kilometres from Lubumbashi. It accommodates 45 students in a surface area of 130.5 m2. Also, it has three windows on one side, facing the east, with a total area of 6.75 m2. Moreover, S1 and S2 rely on natural ventilation (NV). Figure 1 shows the internal and external aspects of both the S1 and S2 classrooms.
Figure 2 represents the layout of two primary school buildings, S1 (Age d’Or) and S2 (Miba School), along with their surrounding environments. S1 is located near a residential zone, with its ventilation influenced by a south-to-north wind direction. The main road separates the school from an industrial zone 7 km away, contributing to air pollution. S2, on the other hand, is positioned near a commercial zone, with wind flowing from the east. Given that both schools rely on natural ventilation through multiple windows, their proximity to roads and external pollution sources affects IAQ. The sketch highlights the key environmental factors influencing these classrooms’ air quality and ventilation conditions.

2.2. Data Acquisition

The field measurements were conducted for ten weeks in S1 and S2 during the dry season, from June to August 2022. The IC survey was conducted during classroom lectures with full occupancy. A calibrated indoor environmental quality (IEQ) multiprobe device connected to a laptop via USB for efficient data acquisition and visualisation was used for the IC measurements [36]. The IEQ multiprobe was calibrated using a Bruel & Kjaer 1212; the results are shown in Table 1. However, the T, RH, and CO2 levels were measured using the IEQ multiprobe device equipped with an infrared CO2 sensor, which continuously monitored CO2 concentrations by capturing data at regular intervals throughout the day. The IEQ multiprobe measures operative temperature and computes an index for volatile organic compounds (VOCs), as indicated by [37], which uses a similar IEQ device. Moreover, a TROTEC PC200 particle counter was used to measure the indoor and outdoor PM2.5 and PM10 concentrations. The TROTEC PC200 and the multiprobe were mounted at a height of 1.2 m to align with the typical breathing zone of the children, as recommended by ISO 77730 [38], ensuring accurate reflections of the air quality experienced by the students and minimising disturbances from student activities; the device was positioned approximately 2 m from the window and the nearest student desk. The continuous monitoring setup allowed for real-time data acquisition and a comprehensive overview of the IAQ during the class occupation period. The detailed analysis of the PM and CO2 oscillations concerning classroom activities and occupancy levels offered valuable insights into the effectiveness of the existing ventilation strategies and highlighted areas for potential improvement to ensure a healthy learning environment. The details of the monitoring equipment are presented in Table 1.

2.3. Ventilation Rates

Optimising airflow in crowded classrooms is vital for reducing airborne contaminants; however, fully opening windows for cross-ventilation and window and door management can decrease the CO2 and airborne particles. The average CO2 concentrations in the classrooms (S1 and S2) were a basis for estimating the ACH. Using the CO2 emission rates outlined in ASTM D6245 [39], where the rates are 0.00285 L/s for children and 0.0052 L/s for adults, adjusted for typical age groups and an activity level of 1.2 metabolic equivalents (METs) [40], the airflow rates (in L/s) were computed based on the ACH. This calculation involved determining the ventilation rate required per occupant (Q), the total fresh air flow rate (Qt), and the air exchange rate (λV) using two different formulas: formula one for adults and formula 2 for children.
Q a = E a C i C o
Q c = E c C i C o
where
Ea and Ec are the emission rates of CO2 for adults and children, respectively (L/s);
Ci is the indoor CO2 concentration (ppm);
Co is the outdoor CO2 concentration (ppm).
The total fresh air flow rate is determined using the following equation:
Q t = Q a × n a + Q c × n c
where
Qa is the ventilation rate per adult (L/s);
Qc is the ventilation rate per child (L/s);
na is the number of adults in the classroom;
nc is the number of children in the school.
Several factors were meticulously considered to determine the total fresh air flow rate in classrooms S1 and S2, including the number of occupants, the room volume, and the size of openings, as detailed in Table 2. The air exchange rate (λV) was calculated using the following equation:
λ v = Q v
where
λV is the air exchange rate (h⁻1);
Q is the ventilation flow rate (m3/h);
V is the volume of the room (m3).

2.4. Data Analysis

The ANOVA was used to analyse the correlation between indoor environmental quality (IEQ) and outdoor environmental quality (OEQ) parameters, thereby examining how changes in external environmental factors, such as PM2.5 and PM10 levels, influence indoor environments. This analysis helps determine the strength of relationships between IAQ parameters and corresponding outdoor conditions in school classrooms, providing insights into the impact of external pollutants on indoor air quality and informing necessary interventions.

3. Results

For the S1 and S2 classrooms, the objective assessment results of the IC parameters are summarised as the mean and SD over ten days.
Table 2 provides a detailed overview of the various IC parameters, including the CO2 concentration, T, RH, PM10, and PM2.5. During the study period, these mean and SD values provide comprehensive insights into the indoor environmental conditions in each classroom, highlighting areas for potential ventilation and air quality improvement. Table 2 displays the mean and SD for each IC parameter’s ten-week summary values. The CO2 concentrations in S1 peaked at 9459 ppm, averaging 1224 ± 567.4 ppm, while the temperature reached up to 28.56 °C, with an average of 23.98 ± 1.63 °C. The relative humidity in S1 peaked at 69.64%, averaging 56.08 ± 6.59%, and the particulate matter levels (PM10 and PM2.5) hit maximums of 636 μg/m3 and 224 μg/m3, respectively, with averages of 578 ± 4.93 μg/m3 and 166 ± 4.93 μg/m3. Conversely, S2 displayed slightly improved air quality, with CO2 peaking at 6764 ppm and averaging 1039 ± 562.5 ppm. The temperature in S2 peaked at 25.38 °C, averaging cooler at 20.93 ± 1.62 °C, and the relative humidity reached a maximum of 72.85%, with an average of 57.04 ± 7.05%. The particulate levels in S2 also rose, with PM10 peaking at 727 μg/m3, averaging 580 ± 44.84 μg/m3, and PM2.5 reaching 357 μg/m3, with an average of 210 ± 44.84 μg/m3.
Table 3 shows the weekly mean and standard deviation for the CO2 and T levels in the S1 and S2 classrooms. Most of the classrooms had acceptable levels of CO2 and T, but the PM levels were higher than the WHO recommendation. The preliminary assessments revealed that most classrooms investigated were within acceptable CO2, RH, and T levels. However, none of the IC parameters met the safety and comfort standards set by EN 16798-1, indicating existing gaps and potential risks to the well-being and comfort of students and teachers. Additionally, this study concluded that the IAQ in most S1 and S2 classrooms was inadequate, as evidenced by the mean CO2 concentration levels recorded. The average environmental values of the IC parameters measured over the 10-week monitoring period in each classroom are presented in Table 3.

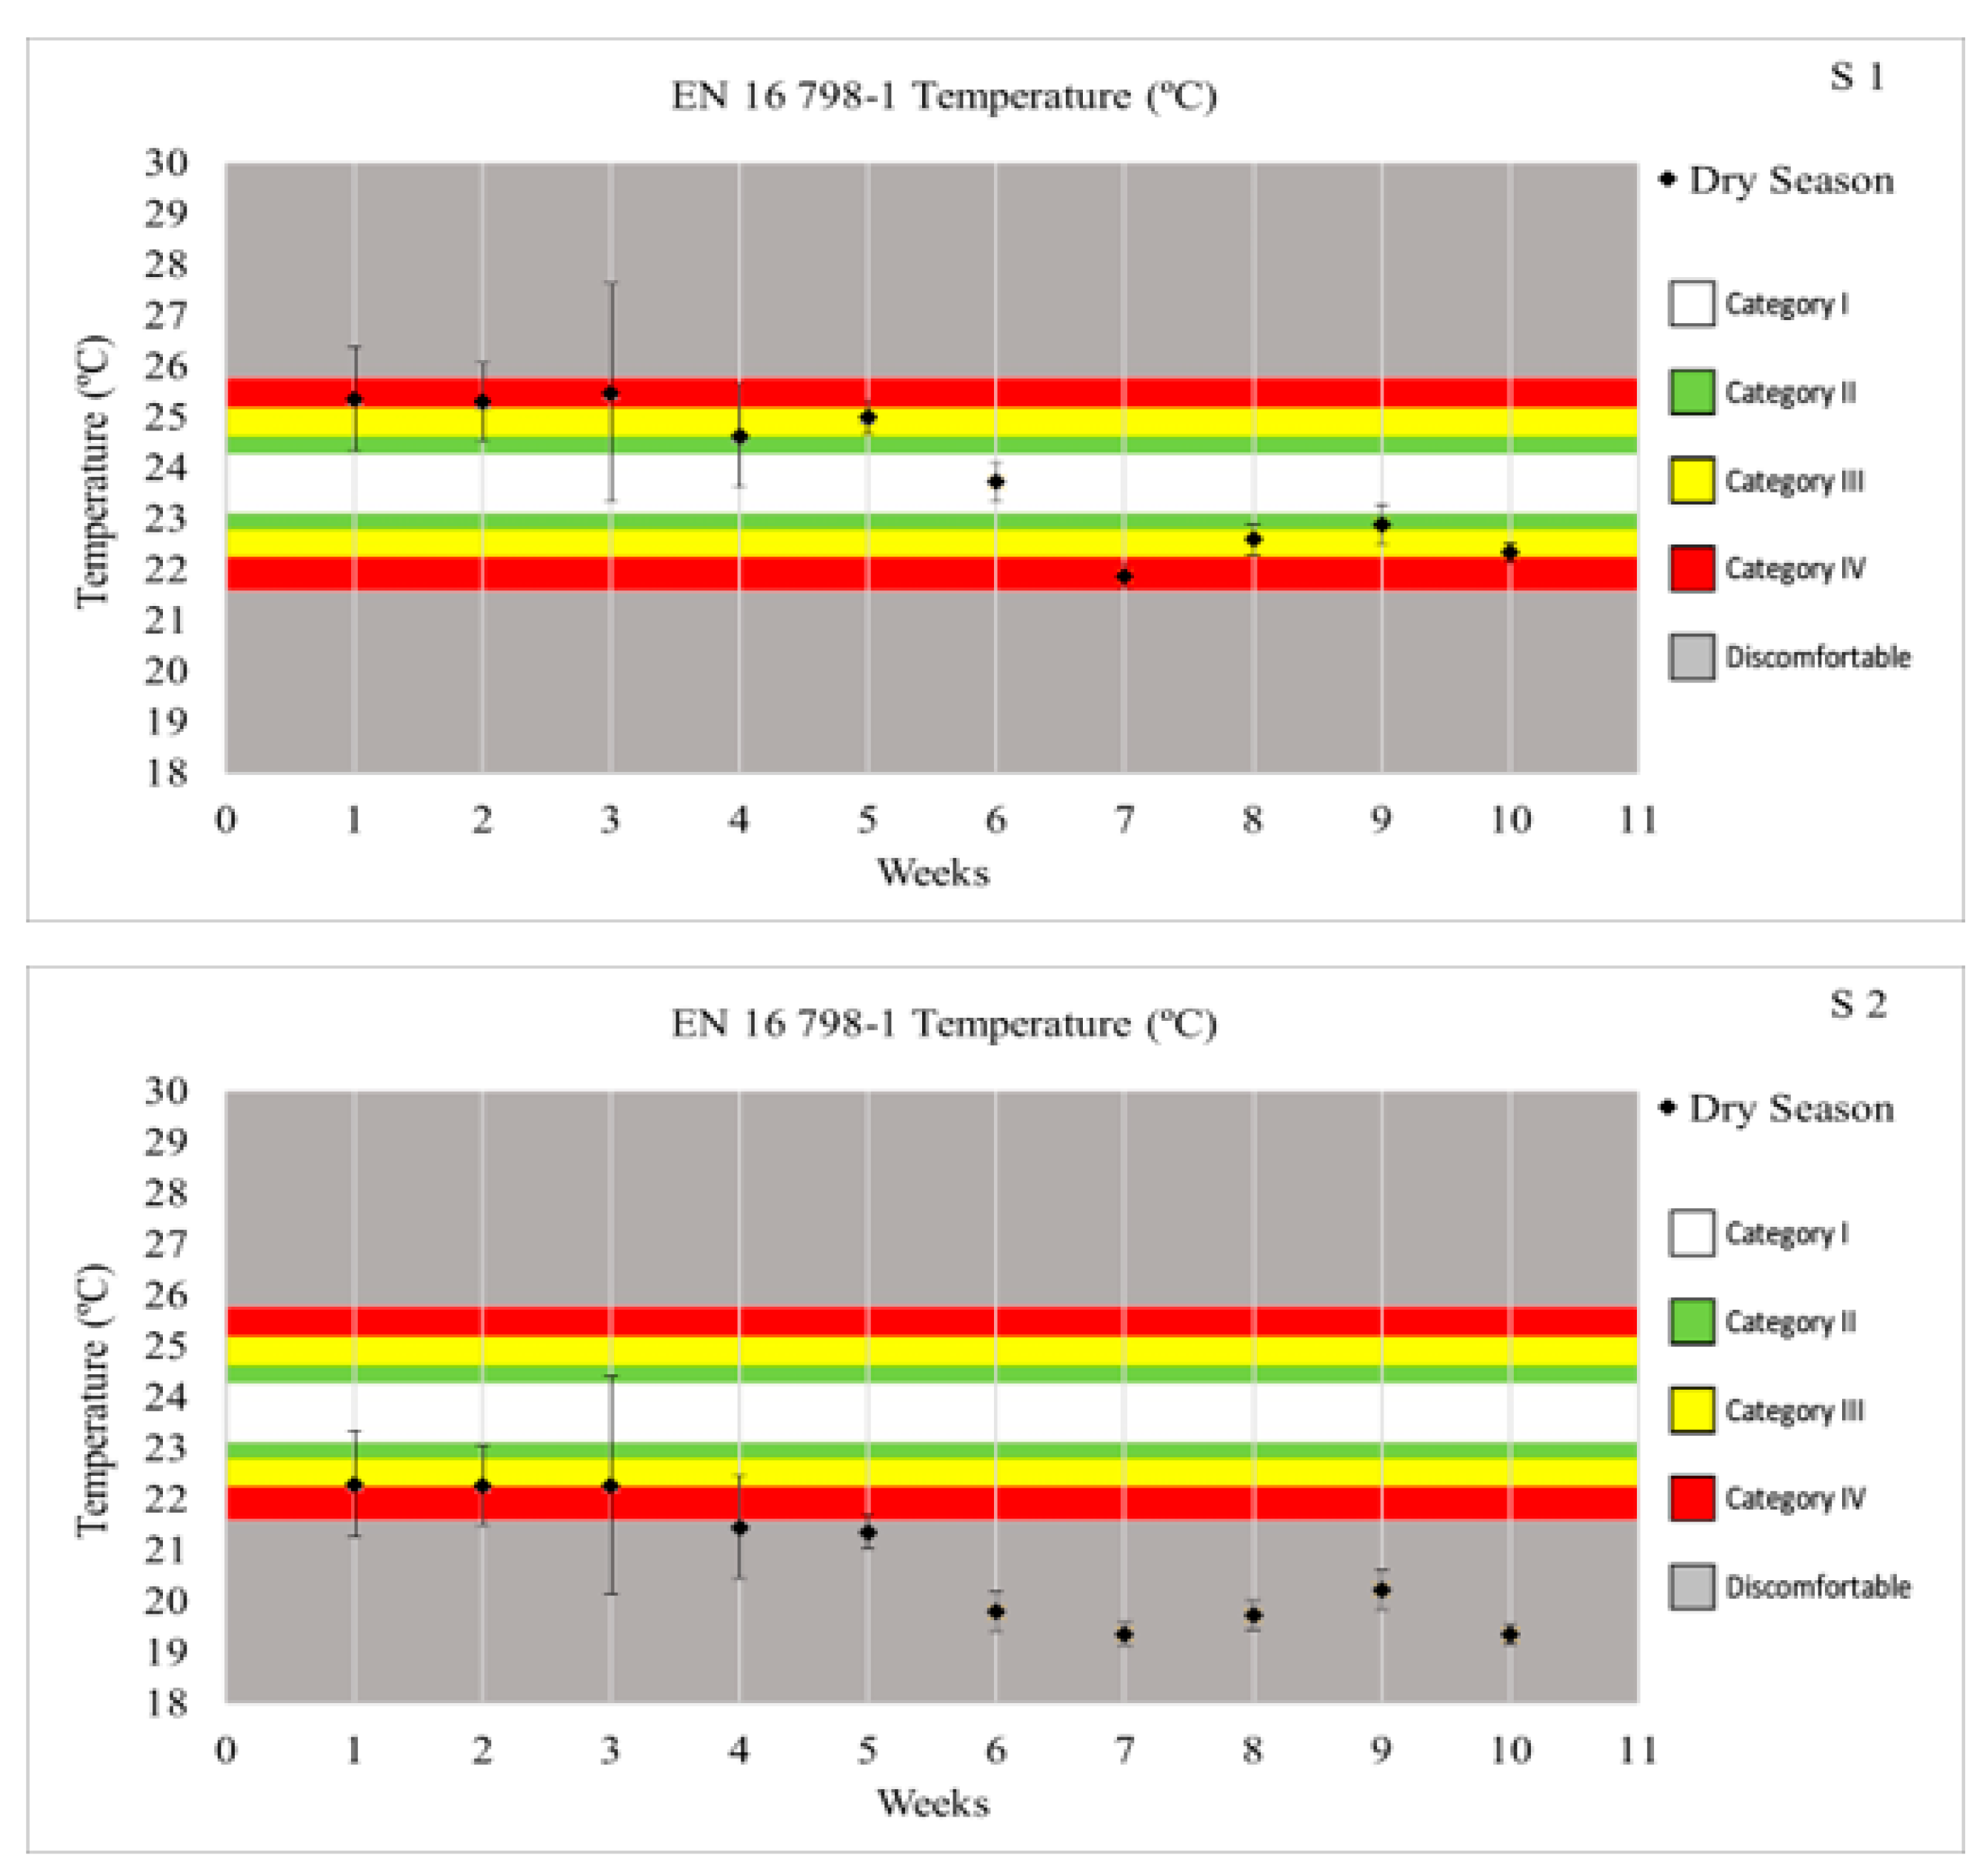
3.1. Indoor Thermal Conditions

The results of the 10-week temperature monitoring are shown in Figure 3. Figure 3 shows the mean and SD of the T recorded over ten weeks in S1 and S2, following the scale categories according to the EN 16798-1 standards [41]. Specifically, Figure 3 shows the temperature categorisation for the dry season, defining a comfort range from 21 °C to 28 °C for sedentary activities during the cooling season, which serves as the boundary for four distinct comfort categories. In S1, the mean temperature (T) consistently fell within categories I to IV, indicating that the classroom environments were maintained within a comfortable range. In contrast, in S2, the mean T was in category IV for three weeks and within the discomfort category for seven weeks. This shows that during the dry season, students and teachers in S2 may experience significant discomfort due to the low temperatures in the classroom. Consequently, this could impact on the overall learning and teaching experience, potentially leading to decreased productivity and increased health issues among students and staff. Maintaining such consistent temperatures is underscored by research from Seppänen et al. [42] and Mendell et al. [35] that link adequate and stable thermal conditions to reduced discomfort and enhanced cognitive performance in educational settings.
Figure 4 shows the mean and SD values of the RH (%) for all the evaluated periods in S1 and S2. Indoor RH can be a critical factor influencing IAQ and thermal comfort. The preliminary assessment of the CO2 levels indicated inadequate ventilation in the classrooms. According to EN 16798-1, maintaining RH within the range of 35% to 65% is considered suitable for classroom comfort for categories I and II. However, keeping the RH above 40% is recommended to reduce the infectivity of aerosolised viruses [43,44]. Although the mean RH values for S1 and S2 mostly fell in category I, these findings align with established research linking RH levels to occupant health and comfort. Studies by Wargocki et al. and Mendell et al. show that maintaining an RH range of 40% to 60% is essential for fostering a healthy and productive indoor environment [45,46]. Adequate RH levels can mitigate pathogens, curtail the spread of airborne pathogens, and enhance comfort in crowded classrooms. Additionally, Frontczak et al. [47] highlight the significance of sustaining appropriate RH levels in educational settings, noting that deviations from the recommended range can adversely impact cognitive functions and overall well-being.

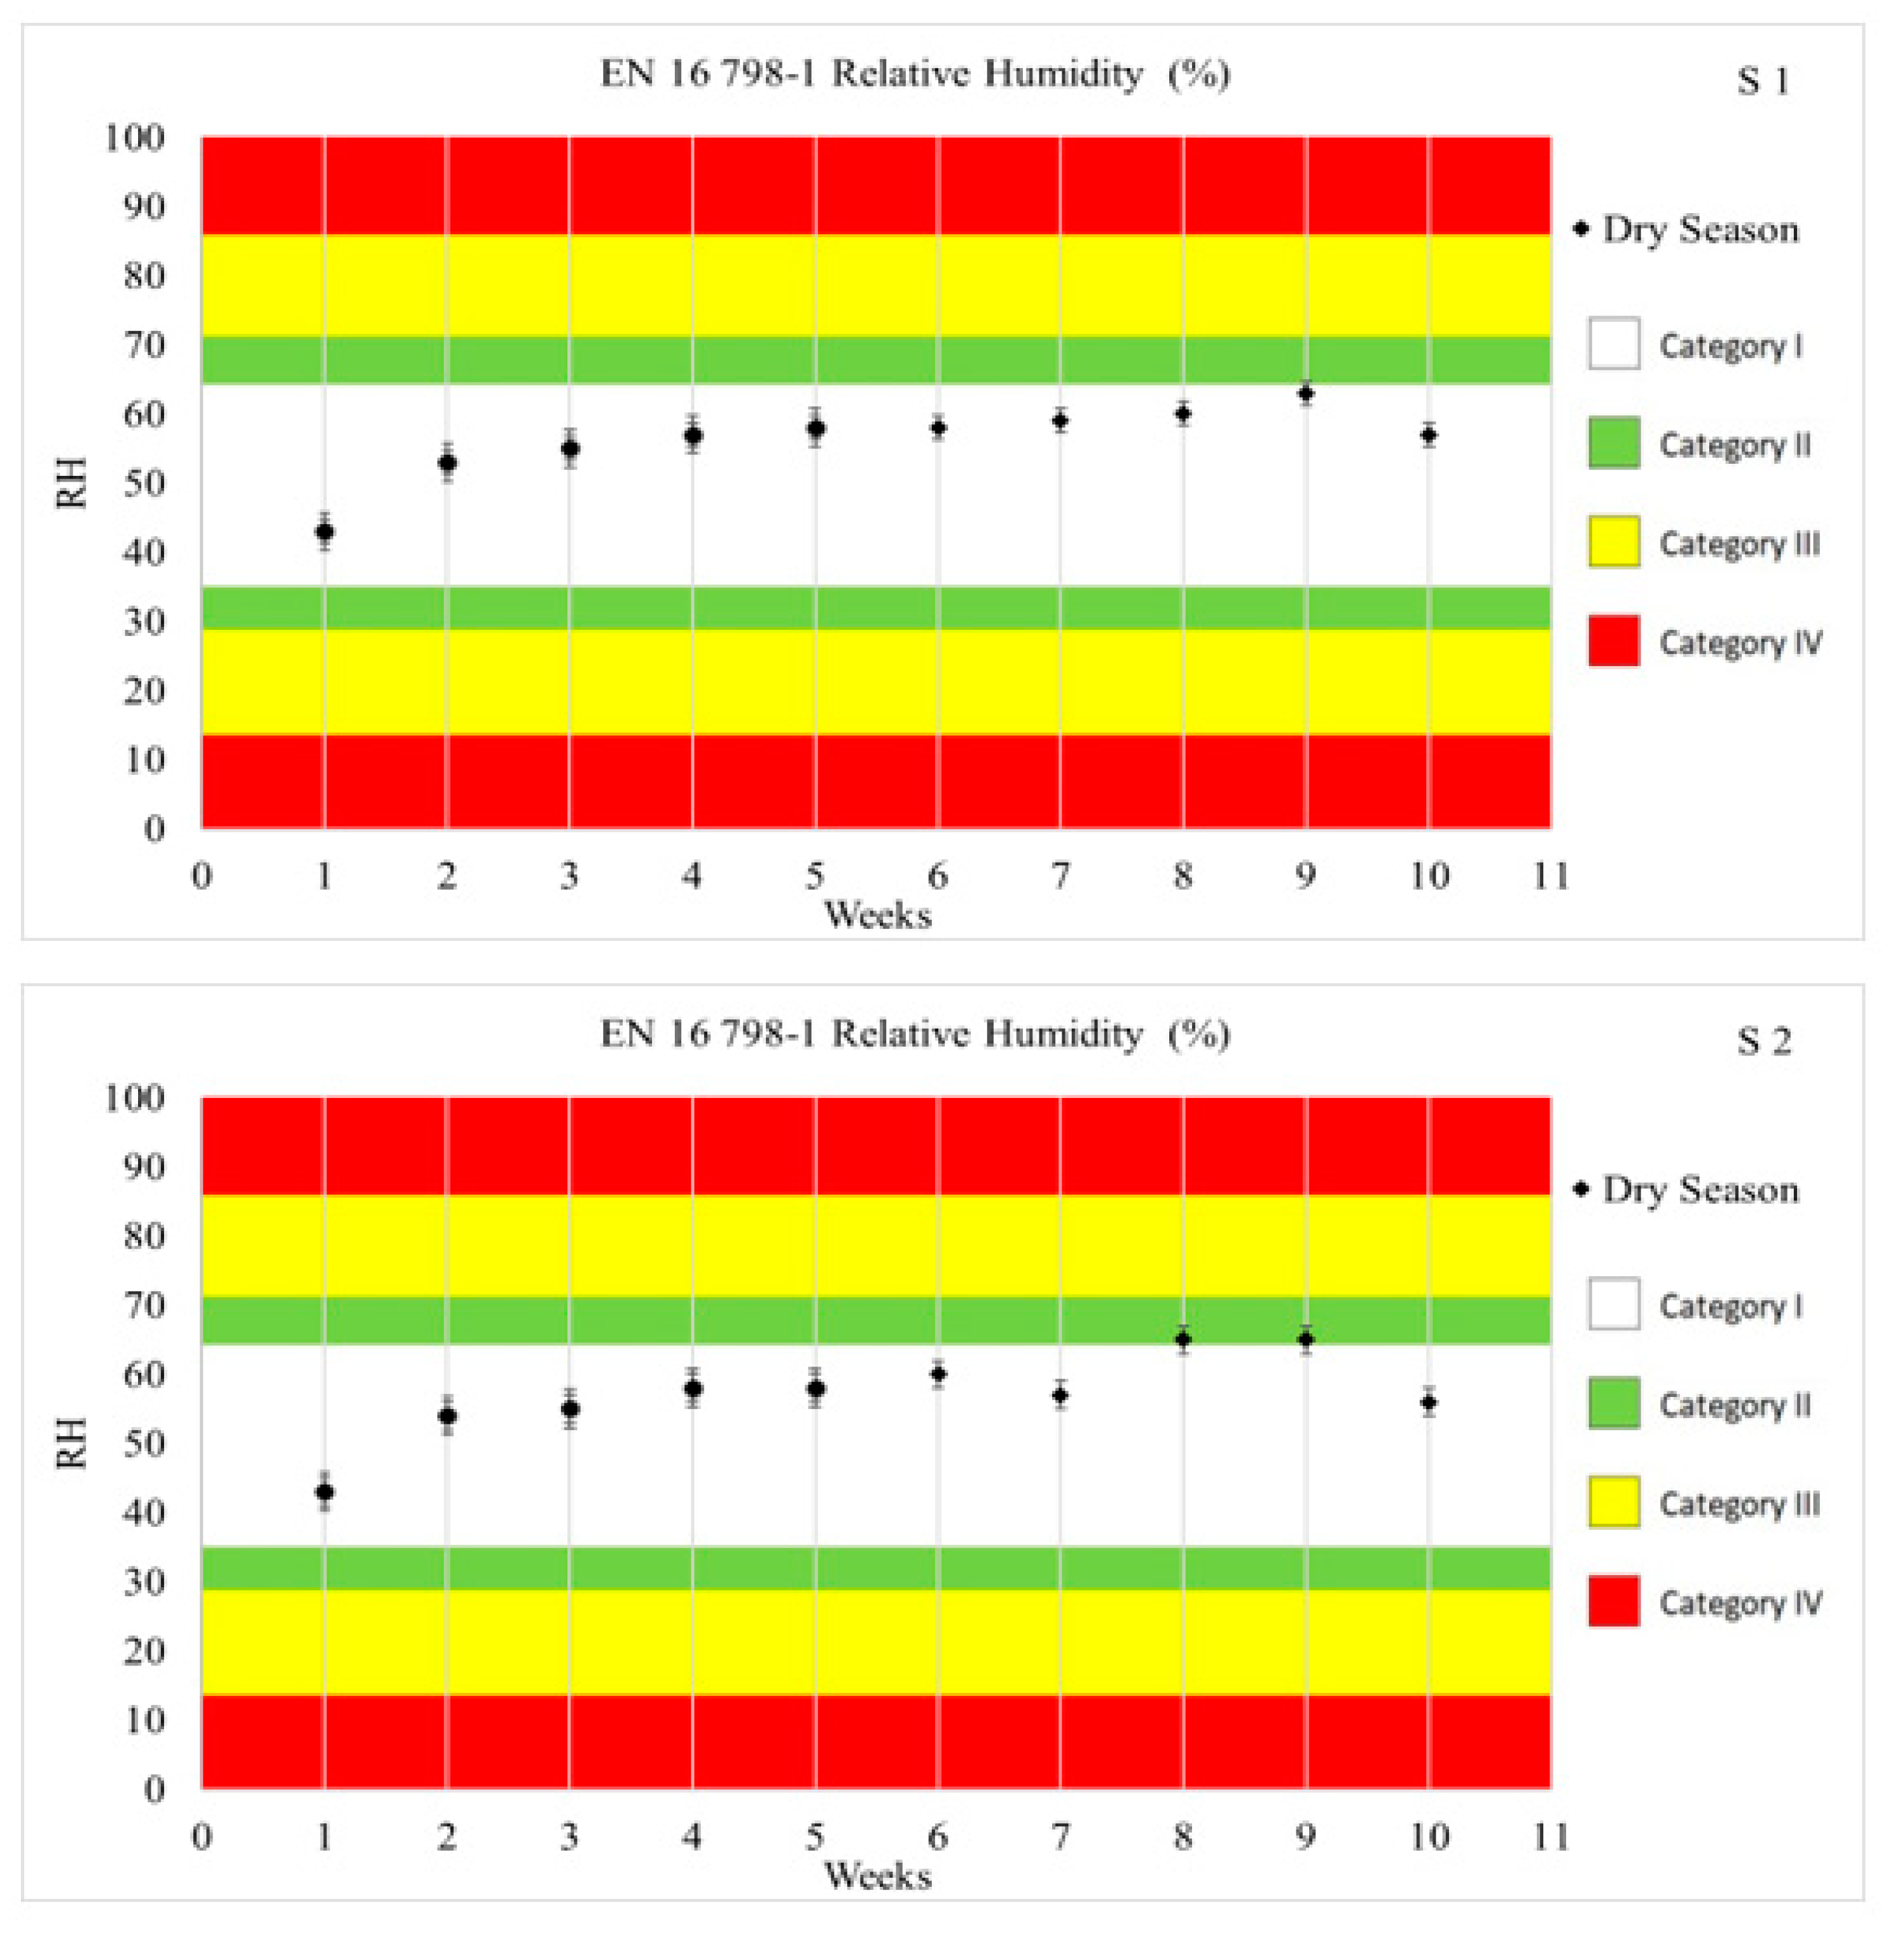
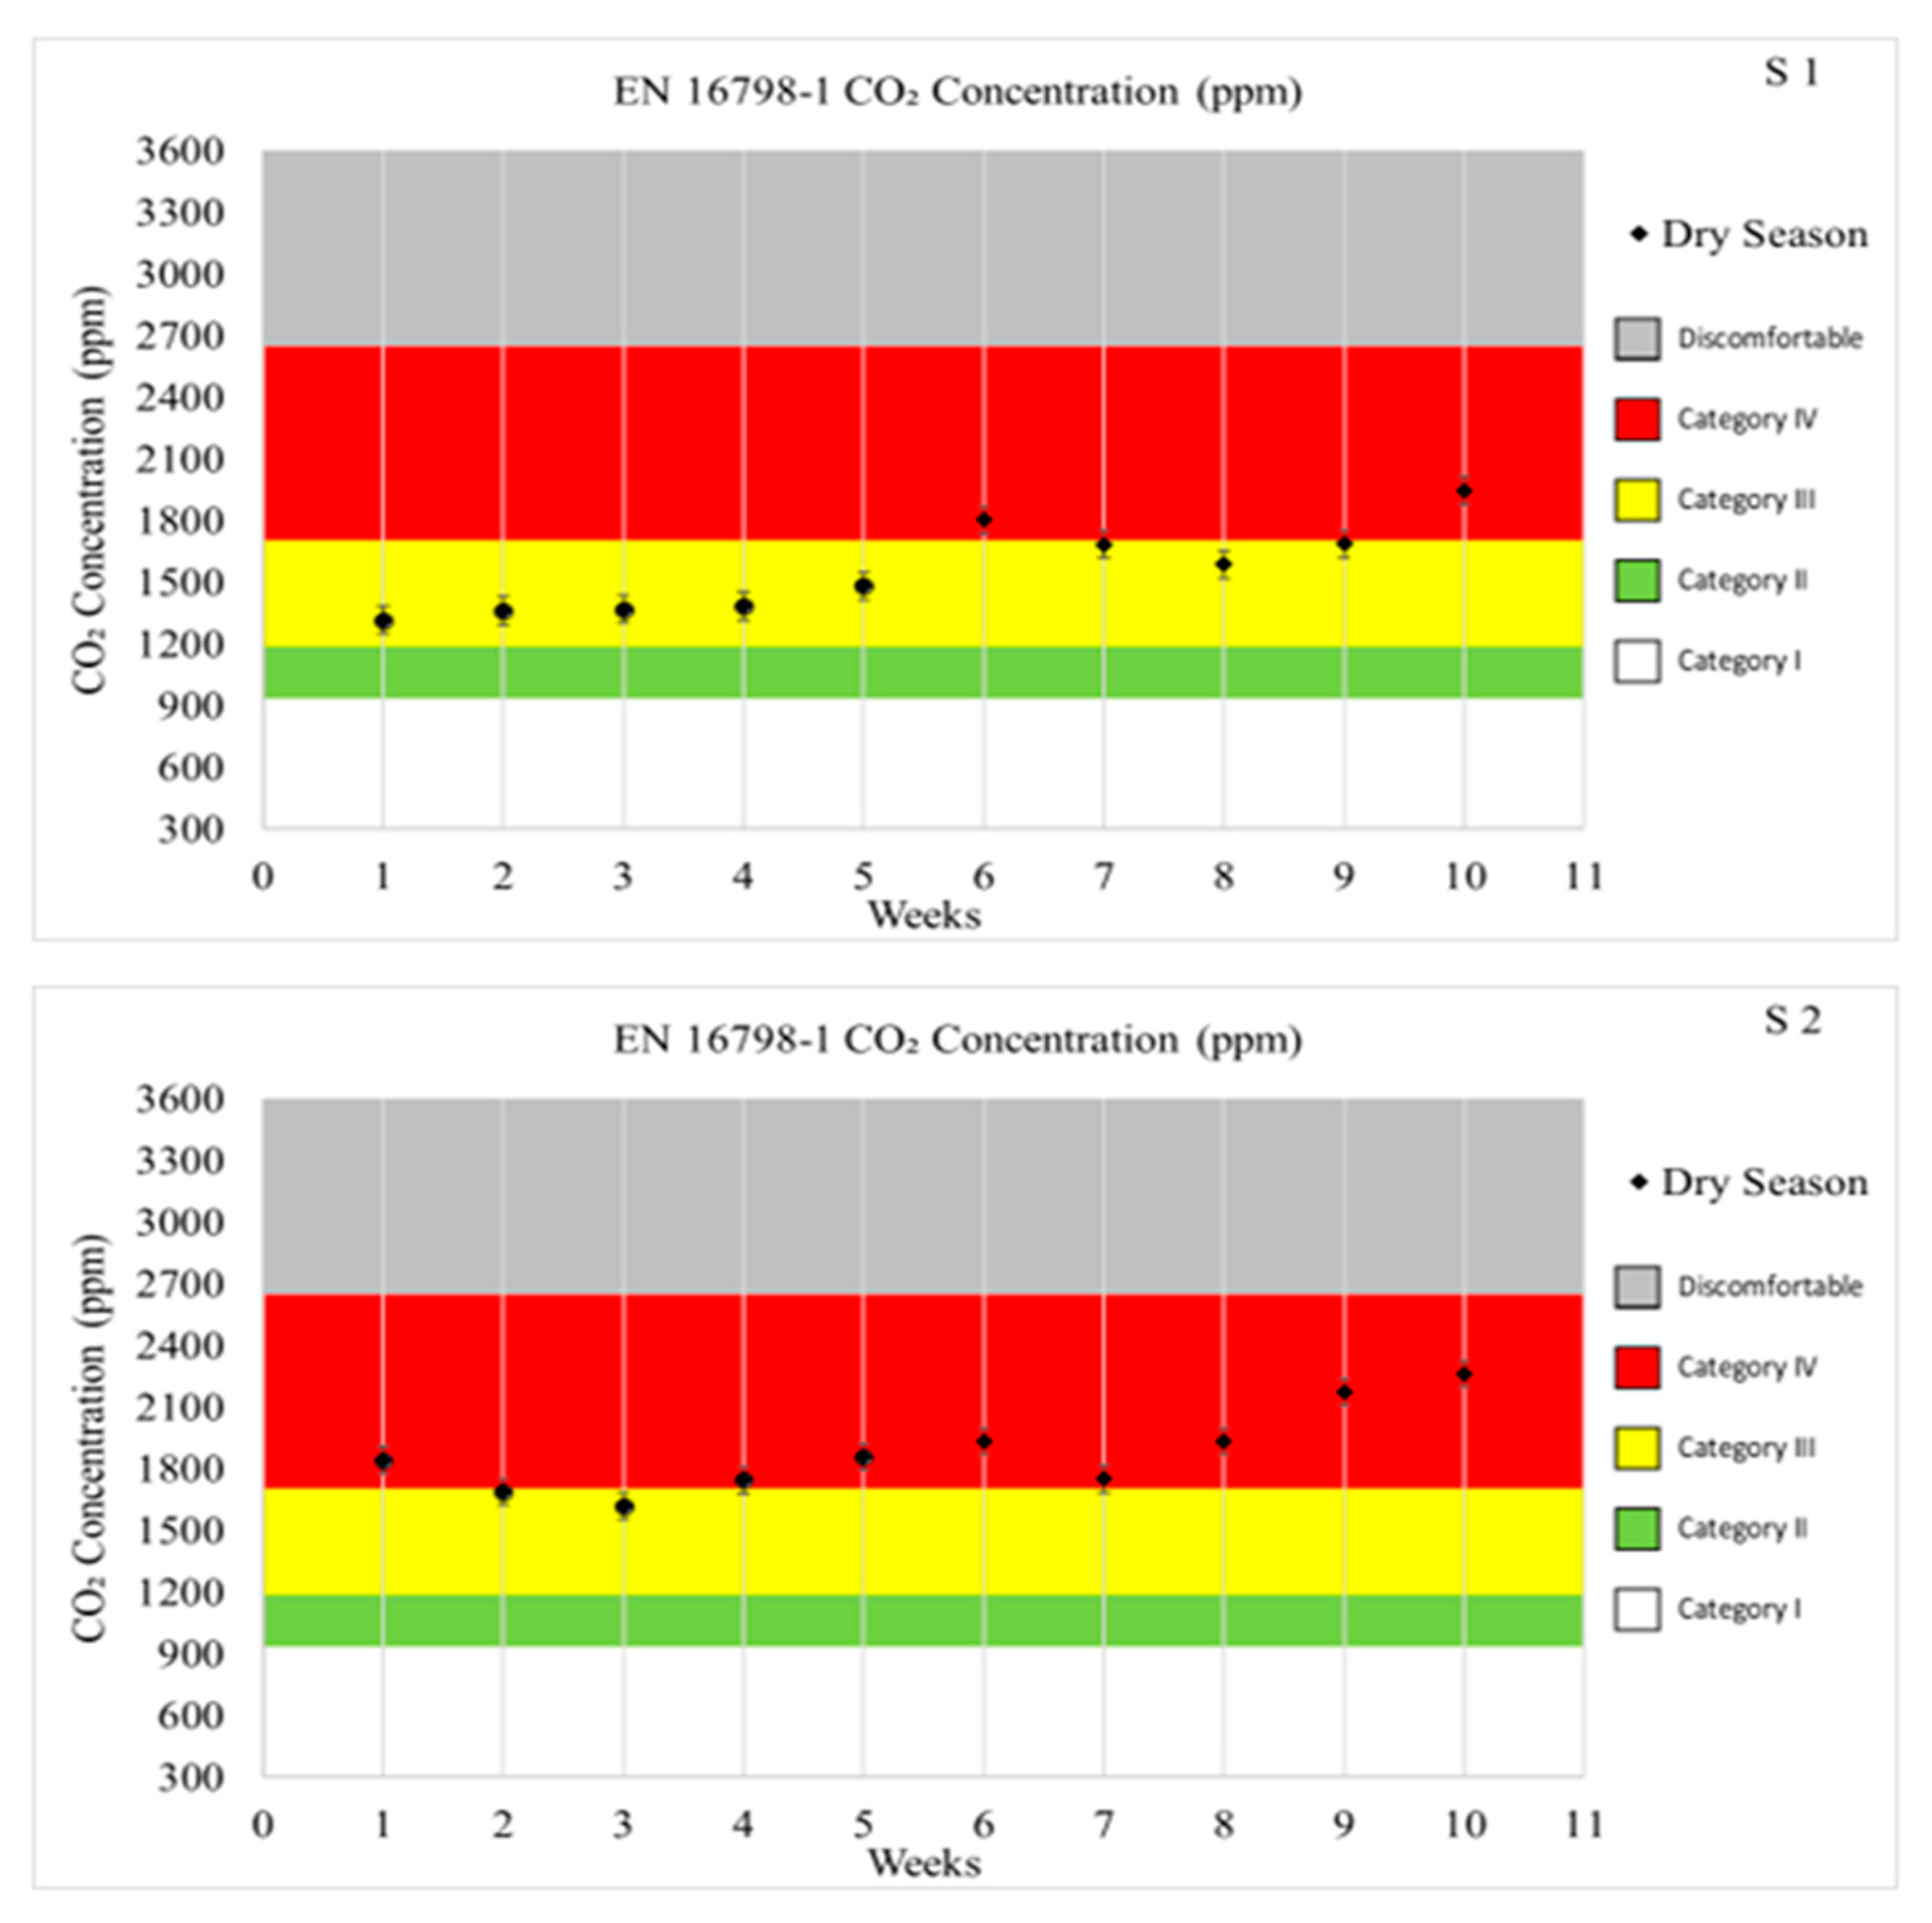
3.2. Air Quality Parameters

Figure 5 shows the 10-week mean and SD values of the CO2 concentrations in classrooms S1 and S2 during the dry season. The CO2 level is displayed, and the differences in weeks when the CO2 levels were higher in the classrooms are highlighted.
Figure 5 shows that the mean CO2 concentration in S1 was at 1848 ppm, placing it in category IV of the EN16798-1 standards, with values within the acceptable category II range for two days and in category IV for the remaining eight days. In contrast, S2 showed a lower mean of 1116 ppm, primarily within category III, except for one day when it reached category IV. Notably, the mean CO2 levels in all the classrooms did not exceed the threshold of 3000 ppm, beyond which symptoms like fatigue, headaches, and reduced concentration can arise. These preliminary assessments suggest that gaps still exist in maintaining optimal CO2 levels, emphasising the importance of regular monitoring and effective ventilation strategies. Studies from Seppänen et al. and Wargocki et al. revealed that high CO2 concentrations decrease cognitive function and productivity and may induce respiratory issues [48,49]. Additionally, studies by Mendell et al. and Sundell et al. highlight the crucial role of maintaining optimal IAQ for enhancing well-being and cognitive performance in educational environments [43,50].

3.3. Calculation of Ventilation Rates

Table 4 shows the analyses of the ventilation parameters in S1 and S2. Classroom S1, with a volume of 459 m3 and a large window of 9 m2, accommodates 57 children. Despite its larger size and window area, S1 offers a lower per-person ventilation rate of 0.033 L/s per person (including children and teachers), achieving a total fresh air flow rate of 1.85 L/s with an ACH of 0.145. Conversely, S2, which has a smaller classroom volume of 423 m3 and a window area of 6.75 m2 for 45 children, ensures a higher per-person ventilation rate of 0.046 L/s per person and provides a total fresh air flow rate of 2.10 L/s with an ACH of 0.179.
This analysis reveals that despite S1’s larger window and classroom size, S2 maintains better ventilation efficiency. That highlights the importance of mechanical ventilation systems in maintaining IAQ over mere structural dimensions. Moreover, this study’s findings contrast with the ventilation rates observed in naturally ventilated classrooms in Taiwan, as documented by Laiman et al. [51], which typically do not meet the enhanced performance seen here. Furthermore, compared to the minimum standard of 5 L/s per person recommended by ANSI/ASHRAE Standard 62.1 for classroom environments [52], this study reveals a higher average ventilation rate of 7.8 L/s per student in most classrooms, excluding S1. Classroom S2 meets and exceeds the minimum requirement set by ASHRAE Standard 62.1 with starting ventilation rates of 6.8 L/s, indicating that all the classrooms assessed are below the standard to ensure adequate ventilation. However, these findings highlight that ventilation systems are inadequate for superior air quality in educational settings.

3.4. Correlation on Indoor Climate Parameters

Table 5 and Table 6 show the correlation between indoor and outdoor climate parameters in the S1 and S2 school classrooms, highlighting how outdoor conditions affect the indoor environment.
Table 5 presents the correlations between the IEQ and OEQ parameters at Age d’Or School, highlighting the relationship between outdoor pollution and indoor air quality. A moderate correlation (0.609) between indoor and outdoor PM2.5 indicates that pollutants from nearby industrial activities infiltrate classrooms through natural ventilation, which lacks filtration. This suggests that industrial processes and vehicular traffic emissions contribute to indoor particulate matter, posing health risks to students and staff. Additionally, PM2.5 was measured as part of PM10, leading to a perfect correlation (1.000) between indoor PM2.5 and indoor PM10, confirming that fine particulates accumulate indoors. These pollutants, linked to respiratory and cardiovascular issues, underscore the strong influence of outdoor pollution on indoor air quality in schools near industrial zones. A high correlation (0.899) between indoor CO2 and temperature suggests poor ventilation, which could be exacerbated by crowded classrooms and worsened by limited window openings to reduce noise from traffic and nearby industries. This restriction increases CO2 buildup, affecting students’ cognitive function. Moreover, the negative correlation (−0.136) between indoor RH and outdoor PM10 indicates that while humidity may help reduce particulates, industrial pollution remains a significant concern.
Table 6 shows the correlation between the IEQ and OEQ parameters at Miba School S2. A negative correlation was found between indoor CO2 and temperature (−0.384), suggesting that higher temperatures might decrease CO2 levels due to improved ventilation. An accurate correlation exists between indoor and outdoor PM10 levels (1.000), indicating a direct PM transfer from outdoors to indoors. Strong positive correlations are also observed between indoor PM2.5 and outdoor PM2.5 (0.560), as well as between indoor temperature and both outdoor PM2.5 (0.599) and PM10 (0.599), highlighting that outdoor particulate levels rise alongside increases in indoor temperature. The relationship between indoor humidity and outdoor PM is similarly strong for PM2.5 (0.548) and PM10 (0.548), suggesting weather-related increases in moisture and particulates. However, this result reveals the interactions between environmental conditions and IAQ, emphasising the importance of improving IC in schools where children are vulnerable to poor IAQ.

4. Discussion

Figure 3 and Figure 4 reveal that, despite the cold outdoor conditions necessitating closed windows, the indoor temperatures in classroom S1 remained comfortable. A stable and comfortable environment likely contributed to better concentration, reduced stress, and enhanced overall performance for students and teachers. In contrast, classroom S2 experienced temperature fluctuations between category IV and the discomfort category, leading to decreased focus, increased fatigue, and overall discomfort. Such conditions may negatively impact student engagement and academic performance, making it challenging for teachers to maintain discipline and deliver effective instruction. Meanwhile, the RH often exceeded the optimal 30–60% range, posing risks for mould growth and impacting student health and concentration [46]. Falling outside this range, RH can increase the spread of airborne viruses, exacerbate respiratory issues, and cause discomfort due to dry or overly humid conditions [44]. These conditions underline the importance of effective HVAC systems that manage temperature and humidity, particularly in crowded classrooms where NV options are limited due to weather constraints [42,46,52,53,54].
Table 3 and Figure 5 show that classrooms in S1 and S2 rely solely on NV, but the windows are often partially closed, especially in the mornings, to limit dust intrusion and noise from nearby mining activities. This restricted airflow leads to the accumulation of CO2, often exceeding 1000 ppm, which is the threshold for optimal IAQ according to EN 16798-1 standards.
The positioning of windows and doors also played a significant role. Opening windows in classrooms near industrial and high-traffic areas increased exposure to outdoor PM pollution, reducing the potential benefits of natural airflow. This highlights a ventilation dilemma: increasing airflow by the influx of outdoor air can lower CO2 levels but also introduce harmful pollutants. The data show that the CO2 concentration in S1 and S2 consistently exceeded the 1000 ppm safety threshold set by the EN 16798-1 standards, mainly because the windows remained closed due to cold outdoor conditions and high student density in spaces relying on natural ventilation. This high CO2 concentration can negatively impact student and teacher health, performance, and productivity. These findings align with Rejc et al. and St-Jean et al. [55,56], who observed similar issues in crowded classrooms.
Additionally, Ghen et al. highlighted the harmful effects of a high CO2 concentration on cognitive functions, potentially reducing student performance [57]. Given the excessive CO2 concentration in these classrooms, installing a mechanical ventilation system is recommended to ensure consistent and adequate air exchange, as underscored by Mendell and Heath [43]. Furthermore, CO2 monitors should be implemented, as advocated by Shendell et al. [53], which would allow for real-time adjustments to the ventilation to improve the IAQ in the classrooms, enhance learning, and safeguard children’s health in classrooms where NV alone is inadequate.
Table 5 and Table 6 show that the correlation between indoor and outdoor PM2.5 concentrations was 0.609 (Table 5), indicating a moderate relationship but suggesting that other factors, such as classroom activities, ventilation conditions, and occupant density, play a significant role in indoor pollutant accumulation. The PM10 (in) and PM10 (out) correlation was notably higher, reinforcing that coarser particles from mining and road traffic sources are more likely to enter classrooms through natural ventilation, especially when the windows are open. This finding aligns with previous research showing that fine particulate matter (PM2.5) can be trapped indoors due to building envelope characteristics, while PM10 more easily infiltrates through open windows and doors. The proximity of schools to industrial areas further amplifies the risk of poor IAQ, particularly in schools relying solely on NV without air filtration systems. Additionally, seasonal variations, wind direction, and humidity may influence the transport of fine particulates from industrial and high-traffic zones into the classrooms. These results highlight the trade-off between ventilation and exposure to pollutants, emphasising the need for mechanical ventilation systems with HEPA filtration in classrooms located in high-pollution environments.
Moreover, the measurements survey reveals severe PM pollution in classrooms S1 and S2, with maximum concentrations of PM10 and PM2.5 exceeding the WHO [58] and South African guidelines [59]. These high levels are likely worsened by the schools’ proximity to local traffic and mining operations, which generate dust and heavy metal pollutants. Table 4 and Table 5 show strong correlations between indoor and outdoor PM levels, highlighting the impact of external mining activities on IAQ. However, PM concentration impacts students’ health, increasing their risk of respiratory and cardiovascular diseases. Students spend more of their time in the classroom. However, the finding in this study aligns with the findings of Nkosi et al. on the relation between increased indoor PM levels and the infiltration of outdoor pollutants from industrial zones [23].
In contrast, S2 in a commercial district showed a correlation influenced by urban traffic emissions, which Kalisa et al. found to worsen respiratory problems and delay lung development in children [31]. However, the correlation of the PM10 in S1 and S2 was due to indoor and outdoor mining activity, which is a big concern for children and teachers in these schools. As stated by Wargocki et al., exposure to long- or short-term pollution can affect health, impact academic performance, and increase absenteeism [15]. Further studies from Taiwan report that high indoor PM concentrations during school hours were notably higher due to soil tracked in from industrial and traffic emissions nearby and from classroom activities [60]. High activity in crowded classrooms often leads to the generation of indoor particles [61,62]. Adjusting ventilation timing can reduce pollutant levels in schools near high road traffic [63]. The importance of maintaining air quality standards in schools to protect children’s health is underscored by additional research on how indoor PM levels are influenced by air infiltration, occupancy, and activities [64,65,66]. These findings emphasise the urgent need for effective interventions to safeguard children’s health in school environments.
Table 4 reveals that the ACH in classrooms S1 and S2 is insufficient for the high number of students they accommodate, recording low rates of 0.145 and 0.179, respectively. These inadequate ventilation rates can lead to poor air quality, resulting in buildup of carbon dioxide and other pollutants. For students, this can translate into an increased risk of respiratory issues, such as asthma and allergies, headaches, and fatigue. Poor air quality can also impair cognitive function, making it difficult for students to concentrate, process information, and stay engaged in lessons. Over time, these factors can decrease academic performance and overall well-being.
Furthermore, teachers may find it challenging to maintain an optimal teaching environment, potentially leading to increased absenteeism and lower productivity. The findings align with Sadrizadeh et al.’s findings that inadequate ventilation can impact students’ attention and learning outcomes [67]. However, reducing occupancy can reduce the CO2 concentration when natural airflow is limited. These findings, including those of the current study, highlight that mechanical ventilation is suitable for maintaining good air quality. They emphasise that reducing classroom density can improve air quality. In this study, natural ventilation cannot enhance the IAQ due to outdoor pollution; therefore, integrating mechanical ventilation systems can improve the indoor air.

4.1. Ventilation Interventions

Inadequate ventilation and high CO2 levels have been identified as significant contributors to health symptoms, necessitating improvements in IAQ. Initial considerations to increase supply airflow were dismissed due to potential downsides, such as reduced indoor temperatures, increased energy consumption, and drafts. An alternative approach involves refurbishing NV systems for both supply and exhaust. However, this method is not commonly used in the DRC; it can be costly and poses risks associated with outdoor air pollution. They proposed integrating mechanical ventilation systems equipped with high-efficiency particulate air (HEPA) filters to mitigate these concerns and capture fine particulates from mining operations, thereby significantly enhancing air purity. Additionally, a non-destructive strategy of reducing the number of students was developed to maintain NV while decreasing the user load, allowing for higher ventilation rates, and keeping CO2 at safe levels. Despite these improvements, replacing natural systems with mechanical supply and exhaust ventilation is expensive and requires significant DRC implementation and maintenance expertise.
Moreover, there is a risk of pollutants such as PM infiltrating through leaks, complicating the balance of ventilation in less airtight structures. Installing air purification systems could lower both indoor and outdoor particulate levels. Although installing these systems is relatively straightforward, potentially in unoccupied spaces like attics and basements, the high cost and operational complexity challenge the overall effectiveness. However, reducing the number of occupants is a more feasible solution to lower CO2 levels within safe thresholds. For instance, reducing the number of students in the classroom could consistently maintain CO2 concentrations below 1300 ppm. This method would be less costly and easier to maintain than the comprehensive ventilation system. However, this strategy might not align with municipal efficiency goals, as it could lead to underutilised spaces and necessitate relocating many students.
Additionally, the actual activity levels of the occupants could still influence CO2 measurements in the classrooms, indicating a need for dynamic solutions that adapt to real-time conditions. The factors of high occupancy tendencies impact the ventilation parameters. In addition, the absence of adapted local IEQ regulations to ensure safe indoors continues to plague many sub-Saharan countries [68], including the DRC [26].

4.2. Limitations

This study on IAQ in primary school classrooms in Mbuji Mayi and Lubumbashi is limited by several factors. The sample size is small and restricted to two schools, which may not reflect broader regional conditions in building types and management practices. This study was confined to the dry season and natural ventilation scenarios, limiting its applicability to other seasonal conditions or mechanical ventilation systems. Furthermore, the 10-week monitoring period may not capture the full variability in the IAQ influenced by fluctuating occupancy and external environmental changes. The absence of subjective health assessments and perceptions of air quality from students and teachers restricts understanding of the direct impact of IAQ on health and cognitive function. The TROTEC PC200 particle counter, which lacks precision for scientific studies and uses an unclear conversion algorithm, may have skewed our PM measurements. Future studies would consider a more extensive sample, different environmental conditions, continued monitoring, and the integration of subjective health data to enhance the comprehensiveness and applicability of the findings. However, future studies will conduct seasonal monitoring in more schools across varied regions and evaluate the health of children and teachers against the impact of indoor air quality.

5. Conclusions

This study assessed indoor air quality in Mbuji Mayi and Lubumbashi, DRC primary school classrooms. The findings highlight critical air quality challenges, with CO2 concentrations reaching 9459 ppm and PM10 levels peaking at 727 µg/m3, exceeding international safety standards. The findings suggest inadequate ventilation and proximity to industrial and traffic pollution sources contribute to these elevated levels. The quantitative analysis indicates that natural ventilation alone is insufficient to mitigate these risks, as classrooms recorded an ACH of only 0.145 in S1 and 0.179 in S2, which is well below the ASHRAE-recommended minimum of 5 L/s per person. The correlation between indoor and outdoor PM levels further confirms the infiltration of pollutants, emphasising the need for filtration-based solutions. Based on these findings, we recommend adopting mechanical ventilation systems equipped with HEPA filters to improve air exchange and reduce airborne particulate concentrations. Implementing real-time air quality monitoring systems can further support dynamic adjustments to IAQ management. Future studies should explore seasonal variations in IAQ, broader school samples, and the long-term health implications of poor IAQ on students and teachers. Overall, this study highlights the pressing need for policy interventions and investment in sustainable IAQ improvements in educational settings in developing regions. A healthier indoor environment will improve student health, cognitive performance, and academic outcomes.

Author Contributions

Conceptualisation, J.P.K.B.N.; methodology, J.P.K.B.N.; software, J.P.K.B.N. and M.G.d.S.; validation, J.P.K.B.N., O.K.N., J.F.M.T. and J.O.O.; formal analysis, J.P.K.B.N.; investigation, J.P.K.B.N.; resources, M.G.d.S.; data curation, J.P.K.B.N.; writing—original draft preparation, J.P.K.B.N.; writing—review and editing, J.F.M.T., S.K.M., O.K.N. and J.O.O.; visualisation, J.P.K.B.N. and S.K.M.; supervision, M.G.d.S.; project administration, M.G.d.S.; funding acquisition, M.G.d.S. All authors have read and agreed to the published version of the manuscript.

Funding

J.P.K.B.N. has a grant (Ref: UIDB/50022/2020) (DOI: 54499/UIDB/50022/2020), sponsored by the Association for the Development of Industrial Aerodynamics (ADAI). This project was carried out with the support of the LA/P/0079/2020 project, DOI: 10.54499/LA/P/0079/2020 (https://doi.org/10.54499/LA/P/0079/2020), within the Associate Laboratory of Energy, Transports, and Aerospace (LAETA). J.O.O has a grant, Ref: UI/BD/152067/2021, sponsored by the Fundação para a Ciência e a Tecnologia (FCT)—IUDB/50022/2020 and IUDP/50022/2020 within the Associate Laboratory of Energy, Transports, and Aerospace (LAETA) project; LA/P/0079/2020 and DOI: 10.54499/LA/P/0079/2020 (https://doi.org/10.54499/LA/P/0079/2020, accessed on 10 May 2024).

Data Availability Statement

The data are unavailable due to privacy.

Acknowledgments

The author is grateful for the Association for the Development of Industrial Aerodynamics funding (UIDB/50022/2020) (DOI: 54499/UIDB/50022/2020); the Associate Laboratory of Energy, Transports, and Aerospace funding, LA/P/0079/2020 and DOI: 10.54499/LA/P/0079/2020 (https://doi.org/10.54499/LA/P/0079/2020); and the Foundation for Science and Technology’s support through funding UIDB/04625/2020 from the research unit CERIS (DOI: 10.54499/UIDB/04625/2020).

Conflicts of Interest

The authors declare no conflicts of interest.

References

  1. Haverinen-Shaughnessy, U.; Turunen, M.; Metsämuuronen, J.; Palonen, J.; Putus, T.; Kurnitski, J.; Shaughnessy, R. Sixth Grade Pupils’ Health and Performance and Indoor Environmental Quality in Finnish School Buildings. Br. J. Educ. Res. 2012, 2, 42–58. Available online: www.julkari.fi (accessed on 14 April 2023).
  2. Turunen, M.; Toyinbo, O.; Putus, T.; Nevalainen, A.; Shaughnessy, R.; Haverinen-Shaughnessy, U. Indoor environmental quality in school buildings, and the health and wellbeing of students. Int. J. Hyg. Environ. Health 2014, 217, 733–739. [Google Scholar] [CrossRef] [PubMed]
  3. Pereira, L.D.; Lamas, F.B.; da Silva, M.G. Improving energy use in schools: From IEQ towards energy-efficient planning—Method and in-field application to two case studies. Energy Effic. 2019, 12, 1253–1277. [Google Scholar] [CrossRef]
  4. Bakó-Biró, Z.; Clements-Croome, D.J.; Kochhar, N.; Awbi, H.B.; Williams, M.J. Ventilation rates in schools and pupils’ performance. Build. Environ. 2012, 48, 215–223. [Google Scholar] [CrossRef]
  5. Lama, S.; Fu, C.; Lee, A. Indoor Air Quality (IAQ) Evaluation of Higher Education Learning Environments. J. Smart Build. Constr. Technol. 2022, 4, 1–14. [Google Scholar] [CrossRef]
  6. Cincinelli, A.; Martellini, T. Indoor air quality and health. Int. J. Environ. Res. Public Health 2017, 14, 1286. [Google Scholar] [CrossRef]
  7. Nyembwe, J.P.K.B.; Ogundiran, J.O.; Chenari, B.; Simões, N.A.V.; da Silva, M.G. The Indoor Climate of Hospitals in Tropical Countries: A Systematic Review. Energies 2023, 16, 3513. [Google Scholar] [CrossRef]
  8. Nyembwe, J.-P.K.B.; Ogundiran, J.O.; da Silva, M.G.; Simões, N.A.V.A.V. Evaluation of Noise Level in Intensive Care Units of Hospitals and Noise Mitigation Strategies. Case Study: Democratic Republic of Congo. Buildings 2023, 13, 278. [Google Scholar] [CrossRef]
  9. Avigo, D.; Godoi, A.F.L.; Janissek, P.R.; Makarovska, Y.; Krata, A.; Potgieter-Vermaak, S.; Alfoldy, B.; Van Grieken, R.; Godoi, R.H.M. Particulate matter analysis at elementary schools in Curitiba, Brazil. Anal. Bioanal. Chem. 2008, 391, 1459–1468. [Google Scholar] [CrossRef] [PubMed]
  10. Nandasena, S. Indoor air pollution and respiratory health of children in the developing world. World J. Clin. Pediatr. 2013, 2, 6–15. [Google Scholar] [CrossRef] [PubMed]
  11. Makri, A.; Stilianakis, N.I. Vulnerability to air pollution health effects. Int. J. Hyg. Environ. Health 2008, 211, 326–336. [Google Scholar] [CrossRef] [PubMed]
  12. Fsadni, P.; Bezzina, F.; Fsadni, C.; Montefort, S. Impact of school air quality on children’s respiratory health. Indian J. Occup. Environ. Med. 2018, 22, 156–162. [Google Scholar] [CrossRef]
  13. Le, H.H.; Ngo, H.K.; Hieu, L.S.; Sly, P.D.; Phung, D.; Le An, P.; Vinh, N.N.; Dang, T.N.; Thuong, D.T.H.; Thanh, H.N.; et al. Indoor air pollution is associated with respiratory symptoms in children in urban Vietnam. Sci. Total. Environ. 2024, 917, 170556. [Google Scholar] [CrossRef] [PubMed]
  14. Wyon, D.P.; Wargocki, P. How Indoor Environment Affects Performance. Thought 2013, 3, 6. Available online: www.ashrae.org (accessed on 14 April 2024).
  15. Wargocki, P.; Porras-Salazar, J.A.; Contreras-Espinoza, S.; Bahnfleth, W. The relationships between classroom air quality and children’s performance in school. Build. Environ. 2020, 173, 106749. [Google Scholar] [CrossRef]
  16. Liu, H.Y.; Dunea, D.; Iordache, S.; Pohoata, A. A review of airborne particulate matter effects on young children’s respiratory symptoms and diseases. Atmosphere 2018, 9, 150. [Google Scholar] [CrossRef]
  17. Wang, X.; Xu, Z.; Su, H.; Ho, H.C.; Song, Y.; Zheng, H.; Hossain, M.Z.; Khan, A.; Bogale, D.; Zhang, H.; et al. Ambient particulate matter (PM1, PM2.5, PM10) and childhood pneumonia: The smaller particle, the greater short-term impact? Sci. Total. Environ. 2021, 772, 145509. [Google Scholar] [CrossRef] [PubMed]
  18. Shu, Y.; Zhu, L.; Yuan, F.; Kong, X.; Huang, T.; Cai, Y.-D. Analysis of the relationship between PM2. 5 and lung cancer based on protein-protein interactions. Comb. Chem. High Throughput Screen. 2016, 19, 100–108. [Google Scholar] [CrossRef]
  19. Jin, X.-T.; Chen, M.-L.; Li, R.-J.; An, Q.; Song, L.; Zhao, Y.; Xiao, H.; Cheng, L.; Li, Z.-Y. Progression and inflammation of human myeloid leukemia induced by ambient PM2.5 exposure. Arch. Toxicol. 2016, 90, 1929–1938. [Google Scholar] [CrossRef]
  20. Xing, Y.-F.; Xu, Y.-H.; Shi, M.-H.; Lian, Y.-X. The impact of PM2.5 on the human respiratory system. J. Thorac. Dis. 2016, 8, E69. [Google Scholar] [PubMed]
  21. Dubey, A.; Kotnala, G.; Mandal, T.K.; Sonkar, S.C.; Singh, V.K.; Guru, S.A.; Bansal, A.; Irungbam, M.; Husain, F.; Goswami, B.; et al. Evidence of the presence of SARS-CoV-2 virus in atmospheric air and surfaces of a dedicated COVID hospital. J. Med. Virol. 2021, 93, 5339–5349. [Google Scholar] [CrossRef]
  22. Kalisa, E.; Clark, M.L.; Ntakirutimana, T.; Amani, M.; Volckens, J. Exposure to indoor and outdoor air pollution in schools in Africa: Current status, knowledge gaps, and a call to action. Heliyon 2023, 9, e18450. [Google Scholar] [CrossRef] [PubMed]
  23. Nkosi, V.; Wichmann, J.; Voyi, K. Indoor and outdoor PM10 levels at schools located near mine dumps in Gauteng and North West Provinces, South Africa. BMC Public Health 2017, 17, 42. [Google Scholar] [CrossRef] [PubMed]
  24. Muimba-Kankolongo, A.; Nkulu, C.B.L.; Mwitwa, J.; Kampemba, F.M.; Nabuyanda, M.M. Impacts of Trace Metals Pollution of Water, Food Crops, and Ambient Air on Population Health in Zambia and the DR Congo. J. Environ. Public Health 2022, 2022, 4515115. [Google Scholar] [CrossRef] [PubMed]
  25. Banza, C.L.N.; Nawrot, T.S.; Haufroid, V.; Decrée, S.; De Putter, T.; Smolders, E.; Kabyla, B.I.; Luboya, O.N.; Ilunga, A.N.; Mutombo, A.M.; et al. High human exposure to cobalt and other metals in Katanga, a mining area of the Democratic Republic of Congo. Environ. Res. 2009, 109, 745–752. [Google Scholar] [CrossRef] [PubMed]
  26. Nyembwe, J.-P.K.B.; Munanga, J.K.; Simões, N.; da Silva, M.G. Ventilation Strategies to Mitigate Air Pollution Impact on Hospital Professionals in Intensive Care Units in the Democratic Republic of Congo. Buildings 2024, 14, 1996. [Google Scholar] [CrossRef]
  27. Ogundiran, J.O.; Nyembwe, J.-P.K.B.; Ogundiran, J.; Ribeiro, A.S.N.; da Silva, M.G. A Systematic Review of Indoor Environmental Quality in Passenger Transport Vehicles of Tropical and Subtropical Regions. Atmosphere 2025, 16, 140. [Google Scholar] [CrossRef]
  28. prEN 16798-1:2015; Indoor Environmental Input Parameters for Design and Assessment of Energy Performance of Buildings Addressing Indoor Air Quality, Thermal Environment, Lighting and Acoustics. European Standards Committee: Bruxelles, Belgium, 2015.
  29. Toyinbo, O. Indoor Environmental Quality, Pupil’s Health and Academic Performance. Ph.D. Thesis, University of Eastern Finland, Kuopio, Finland, 2017. [Google Scholar] [CrossRef]
  30. Mahbob, N.S.; Kamaruzzaman, S.N.; Salleh, N.; Sulaiman, R. A correlation studies of indoor environmental quality (IEQ) towards productive workplace. In Proceedings of the 2nd International Conference on Environmental Science and Technology (ICEST 2011), Singapore, 26–28 February 2011; Volume 6, pp. 434–438. [Google Scholar]
  31. Kalisa, E.; Kuuire, V.; Adams, M. Children’s exposure to indoor and outdoor black carbon and particulate matter air pollution at school in Rwanda, Central-East Africa. Environ. Adv. 2023, 11, 100334. [Google Scholar] [CrossRef]
  32. Olufemi, A.C.; Mji, A.; Mukhola, M.S. Health risks of exposure to air pollutants among students in schools in the vicinities of coal mines. Energy Explor. Exploit. 2019, 37, 1638–1656. [Google Scholar] [CrossRef]
  33. Nyembwe, J.-P.K.B.; M’zimbes, S.C.; Albino, N.; Simões, V.; Da Silva, M.G. Evaluation of Indoor Air and Natural Ventilation Complexity in Hospital Wards in the Democratic Republic of Congo (DRC). Proceedings of RoomVent 2024—The 17th RoomVent Conference, Stockholm, Sweden, 22 April 2024; Paper 552. pp. 1–8. Available online: https://invitepeople.com/public/events/fe41371a0b/pages/ed19d3ae89 (accessed on 27 April 2024).
  34. Godoi, R.H.; Godoi, A.F.; Junior, S.J.G.; Paralovo, S.L.; Borillo, G.C.; Barbosa, C.G.G.; Arantes, M.G.; Charello, R.C.; Filho, N.A.R.; Grassi, M.T.; et al. Healthy environment—Indoor air quality of Brazilian elementary schools nearby petrochemical industry. Sci. Total Environ. 2013, 463–464, 639–646. [Google Scholar] [CrossRef] [PubMed]
  35. Amoatey, P.; Omidvarborna, H.; Baawain, M.S.; Al-Mamun, A. Indoor air pollution and exposure assessment of the gulf cooperation council countries: A critical review. Environ. Int. 2018, 121, 491–506. [Google Scholar] [CrossRef]
  36. Manuel, G.d.S. Assessing and Communicating Indoor Environmental Quality; REHVA: Ixelles, Belgium, 2019. [Google Scholar]
  37. Ogundiran, J.O.; Nyembwe, J.P.K.B.; Ribeiro, A.S.N.; da Silva, M.G. A Field Survey on Indoor Climate in Land Transport Cabins of Buses and Trains. Atmosphere 2024, 15, 589. [Google Scholar] [CrossRef]
  38. ISO 7730; Ergonomics of the Thermal Environment: Analytical Determination and Interpretation of Thermal Comfort Using Calculation of the PMV and PPD Indices and Local Thermal Comfort Criteria. ISO: Geneva, Switzerland, 2005.
  39. ASTM D6245-18; Standard Guide for Using Indoor Carbon Dioxide Concentrations to Evaluate Indoor Air Quality and Ventilation. ASTM: West Conshohocken, PA, USA, 2018.
  40. Carlos, M. Spreadsheets for the Calculation of Thermal Comfort Indices pmv and ppd. 2015. Available online: https://www.researchgate.net/publication/255971260_SPREADSHEETS_FOR_THE_CALCULATION_OF_THERMAL_COMFORT_INDICES_PMV_AND_PPD (accessed on 25 October 2023).
  41. EN 16798-1; Energy Performance of Buildings-Part 1: Indoor Environmental Input Parameters for Design and Assessment of Energy Performance of Building Addressing Indoor Air Quality, Thermal Environment, Lighting and Acoustics-Module M1-6. European Standards Organizations: Brussels, Belgium, 2019. Available online: http://drafts.bsigroup.com/ (accessed on 14 April 2024).
  42. Seppänen, O. The effect of ventilation on health and other human responses. In Building Ventilation; Routledge: Abingdon, UK, 2006; pp. 265–282. [Google Scholar]
  43. Mendell, M.J.; Heath, G.A. Do Indoor Pollutants and Thermal Conditions in Schools Influence Student Performance? A Critical Review of the Literature. Indoor Air 2005, 15, 27–52. [Google Scholar] [CrossRef]
  44. Noti, J.D.; Blachere, F.M.; McMillen, C.M.; Lindsley, W.G.; Kashon, M.L.; Slaughter, D.R.; Beezhold, D.H. High humidity leads to loss of infectious influenza virus from simulated coughs. PLoS ONE 2013, 8, e57485. [Google Scholar] [CrossRef]
  45. Wargocki, P.; Wyon, D.P.; Fanger, O. Productivity is affected by the air quality in offices. Proc. Healthy Build. 2000, 1, 635–640. [Google Scholar]
  46. Mendell, M.J.; Eliseeva, E.A.; Davies, M.M.; Spears, M.; Lobscheid, A.; Fisk, W.J.; Apte, M.G. Association of classroom ventilation with reduced illness absence: A prospective study in California elementary schools. Indoor Air 2013, 23, 515–528. [Google Scholar] [CrossRef] [PubMed]
  47. Frontczak, M.; Schiavon, S.; Goins, J.; Arens, E.; Zhang, H.; Wargocki, P. Quantitative relationships between occupant satisfaction and satisfaction aspects of indoor environmental quality and building design. Indoor Air 2012, 22, 119–131. [Google Scholar] [CrossRef] [PubMed]
  48. Seppanen, O.; William, F.; Mark, M. Association of ventilation rates and CO2 concentrations with health and other responses in commercial and institutional buildings. Indoor Air 1999, 9, 226–252. [Google Scholar] [CrossRef] [PubMed]
  49. Wargocki, P. Productivity and Health Effects of high Indoor Air Quality; Elsevier: Amsterdam, The Netherlands, 2011; pp. 688–693. [Google Scholar]
  50. Sundell, J. On the history of indoor air quality and health. Indoor Air 2004, 14 (Suppl. 7), 51–58. Available online: https://pubmed.ncbi.nlm.nih.gov/15330772/ (accessed on 14 April 2023). [CrossRef] [PubMed]
  51. Laiman, R.; He, C.; Mazaheri, M.; Clifford, S.; Salimi, F.; Crilley, L.R.; Mokhtar, M.A.M.; Morawska, L. Characteristics of ultrafine particle sources and deposition rates in primary school classrooms. Atmos. Environ. 2014, 94, 28–35. [Google Scholar] [CrossRef]
  52. ASHRAE 62.1; Ventilation for Acceptable Indoor Air Quality. ASHRAE: Peachtree Corners, GA, USA, 2019.
  53. Shendell, D.G.; Prill, R.; Fisk, W.J.; Apte, M.G.; Blake, D.; Faulkner, D. Associations between classroom CO2 concentrations and student attendance in Washington and Idaho. Indoor Air 2004, 14, 333–341. [Google Scholar] [CrossRef]
  54. Sundell, J.; Levin, H.; Nazaroff, W.W.; Cain, W.S.; Fisk, W.J.; Grimsrud, D.T.; Gyntelberg, F.; Li, Y.; Persily, A.K.; Pickering, A.C.; et al. Ventilation rates and health: Multidisciplinary review of the scientific literature. Indoor Air 2011, 21, 191–204. [Google Scholar] [CrossRef]
  55. Rejc, T.; Kukec, A.; Bizjak, M.; GodičTorkar, K. Microbiological and chemical quality of indoor air in kindergartens in Slovenia. Int. J. Environ. Health Res. 2020, 30, 49–62. [Google Scholar] [CrossRef] [PubMed]
  56. St-Jean, M.; St-Amand, A.; Gilbert, N.L.; Soto, J.C.; Guay, M.; Davis, K.; Gyorkos, T.W. Indoor air quality in Montréal area day-care centres, Canada. Environ. Res. 2012, 118, 1–7. [Google Scholar] [CrossRef] [PubMed]
  57. Chen, D.; Huebner, G.; Bagkeris, E.; Ucci, M.; Mumovic, D. Effects of short-term exposure to moderate pure carbon dioxide levels on cognitive performance, health symptoms and perceived indoor environment quality. Build. Environ. 2023, 245, 110967. [Google Scholar] [CrossRef]
  58. WHO. WHO Global Air Quality Guidelines: Particulate Matter (PM2.5 and PM10), Ozone, Nitrogen Dioxide, Sulfur Dioxide and Carbon Monoxide; WHO: Geneva, Switzerland, 2021. [Google Scholar]
  59. SANS 1929:2005; Guideline for the Management of Domestic Indoor Air Quality: A Guide for Environmental Health Practitioners in South Africa. South African Bureau of Standards: Pretoria, South Africa, 2019.
  60. Jung, C.C.; Huang, C.Y.; Su, H.J.; Chen, N.T.; Yeh, C.L. Impact of agricultural activity on PM2.5 and its compositions in elementary schools near corn and rice farms. Sci. Total Environ. 2024, 906, 167496. [Google Scholar] [CrossRef] [PubMed]
  61. Korhonen, A.; Relvas, H.; Miranda, A.I.; Ferreira, J.; Lopes, D.; Rafael, S.; Almeida, S.M.; Faria, T.; Martins, V.; Canha, N.; et al. Analysis of spatial factors, time-activity and infiltration on outdoor generated PM2.5 exposures of school children in five European cities. Sci. Total Environ. 2021, 785, 147111. [Google Scholar] [CrossRef]
  62. Canha, N.; Martinho, M.; Silva, M.A.; Almeida, S.M.; Pegas, P.; Alves, C.; Pio, C.; Trancoso, M.A.; Sousa, R.; Mouro, F.; et al. Indoor air quality in primary schools. Int. J. Environ. Pollut. 2012, 50, 396–410. [Google Scholar] [CrossRef]
  63. Meo, S.A.; Salih, M.A.; Al-Hussain, F.; Alkhalifah, J.M.; Meo, A.S.; Akram, A. Environmental pollutants PM2.5, PM10, carbon monoxide (CO), nitrogen dioxide (NO2), sulfur dioxide (SO2), and ozone (O3) impair human cognitive functions. Eur. Rev. Med. Pharmacol. Sci. 2024, 28, 789–796. [Google Scholar]
  64. Gao, J.; Wargocki, P.; Wang, Y. Indoor Air Quality and Thermal Environment in Classrooms with Different Ventilation Systems. REHVA J. 2014, 51, 10–14. [Google Scholar]
  65. Son, Y.S. A review on indoor and outdoor factors affecting the level of particulate matter in classrooms of elementary schools. J. Build. Eng. 2023, 75, 106957. [Google Scholar] [CrossRef]
  66. Sung, H.J.; Kim, S.H.; Kim, H. Analysis of Building Retrofit, Ventilation, and Filtration Measures for Indoor Air Quality in a Real School Context: A Case Study in Korea. Buildings 2023, 13, 1033. [Google Scholar] [CrossRef]
  67. Sadrizadeh, S.; Yao, R.; Yuan, F.; Awbi, H.; Bahnfleth, W.; Bi, Y.; Cao, G.; Croitoru, C.; de Dear, R.; Haghighat, F.; et al. Indoor air quality and health in schools: A critical review for developing the roadmap for the future school environment. J. Build. Eng. 2022, 57, 104908. [Google Scholar] [CrossRef]
  68. Ogundiran, J.O.; Nyembwe, J.-P.K.B.; Ribeiro, A.S.N.; da Silva, M.G. Indoor Environmental Quality Assessment of Train Cabins and Passenger Waiting Areas: A Case Study of Nigeria. Sustainability 2023, 15, 16533. [Google Scholar] [CrossRef]
Figure 1. The interior and exterior facades of the schools in Age d’Or (S1: A-1 and A-2) and Miba (S2: B-1 and B-2).
Buildings 15 00730 g001
Figure 2. The wind propagation and relevant ambient parameters of the school building geography.
Buildings 15 00730 g002
Figure 3. The mean and SD values of the operative temperature in S1 and S2 schools.
Buildings 15 00730 g003
Figure 4. Ten-week indoor RH (%) in S1 and S2 schools.
Buildings 15 00730 g004
Figure 5. The mean and SD values of the CO2 concentration in schools S1 and S2.
Buildings 15 00730 g005
Table 1. Monitoring equipment parameters.
EquipmentCalibrationResolution SettingsDevice Range
IEQ multiprobe
device
Coverage factor (2), Probability (95%), T (±0.2 °C), CO2 (±35 ppm), RH (±1%)Probe, sampling interval (5 s), data logging via USB connection to a computerCO2 (ppm), operative temperature (°C), RH, Pa, VOCs, Illuminance
TROTEC PC220 1 μg/m3PM2.5/PM10, 0 to 2000 μg/m3
Table 2. All the mean and SD values of the IC parameters in the S1 and S2 schools.
Children Avg. AgeS1S2
9–10maxminMeanSDmaxminMeanSD
CO2 (ppm)94598221224567.467646021039562.5
T(°C)28.5619.7523.981.6325.3816.6920.931.62
RH (%)69.6429.7856.086.5972.8530.3857.047.05
PM10 (μg/m3) in6365715784.9372749958044.84
PM2.5 μg/m3) in2241591664.9335712921044.84
PM10 (μg/m3) out7274995804.995351067024.15
PM2.5 μg/m3) out3571292104.965621337324.15
Table 3. The ten-week mean and SD values of the IC parameters in the S1 and S2 schools.
S1 S2
WeekTSDRHSDCO2SDTSDRHSDCO2SD
125.350.6432.21315351.522.290.7432.11843353.4
225.290.8534.41361324.022.261.4543.61686319.8
325.470.8556.61368345.322.271.0556.11620592.8
424.620.9574.61384360.721.440.9584.71744409.9
524.990.9582.91483636.321.350.8583.71859626.2
623.710.8583.11803334.718.790.5602.21933241.1
721.871.0593.81683432.219.301.0573.01750513.3
822.581.0604.51586755.419.700.7655.11935765.2
922.881.1634.51687826.020.520.8655.12174405.9
1022.320.7575.01946569.118.340.6565.72260327.2
Table 4. The ventilation rate in the S1 and S2 classrooms.
SchoolClassroom Volume (m3)Number of ChildrenTotal Fresh Air Flow Rate (L/s)Ventilation Rate (L/s per Person)Airflow Rate per Hour (m3/h)Air Change Rate per Hour (ACH)
S1459571.850.0330.06660.145
S2423452.100.0460.07560.179
Table 5. Correlation between indoor and outdoor conditions in S1.
CO2 (in)T (in)RH (in)PM2.5 (in)PM2.5 (out)PM 10 (in)PM10 (out)
CO2 (in)1.000
T (in)0.8991.000
RH (in)−0.064−0.3441.000
PM2.5 (in)0.4400.4170.1081.000
PM2.5 (out)0.5400.590−0.1150.6091.000
PM10 (in)0.4400.4170.1081.0000.5091.000
PM10 (out)0.4450.504−0.1360.6130.6990.4131.000
Table 6. Correlation between indoor and outdoor conditions in S2.
CO2 (in)T (in)RH (in)PM2.5 (in)PM2.5 (out)PM10 (in)PM10 (out)
CO2 (in)1.000
T (in)−0.3841.000
RH (in)0.3050.2501.000
PM2.5 (in)0.0660.2900.3411.000
PM2.5 (out)−0.2220.5990.5480.5601.000
PM10 (in)0.0660.2900.3411.0000.4601.000
PM10 (out)−0.2220.5990.5480.3601.0000.3601.000
Disclaimer/Publisher’s Note: The statements, opinions and data contained in all publications are solely those of the individual author(s) and contributor(s) and not of MDPI and/or the editor(s). MDPI and/or the editor(s) disclaim responsibility for any injury to people or property resulting from any ideas, methods, instructions or products referred to in the content.

