Article

A Novel Performance Evaluation Framework for Sponge City Construction

1
The Open University of Shaanxi, No. 41, Guobei Street, Xi’an 710119, China
2
School of Infrastructure Engineering, Nanchang University, No. 999 Xuefu Avenue, Nanchang 330047, China
*
Author to whom correspondence should be addressed.
Buildings 2025, 15(11), 1814; https://doi.org/10.3390/buildings15111814
Submission received: 1 March 2025 / Revised: 6 May 2025 / Accepted: 21 May 2025 / Published: 25 May 2025
(This article belongs to the Special Issue Advances in Life Cycle Management of Buildings)

Abstract

As sponge city construction is gradually promoted globally, it is very important to construct a scientific and reasonable performance evaluation framework. This paper establishes an indicator system with 5 primary indicators and 15 secondary indicators, calculates subjective weights by fuzzy hierarchical analysis, determines objective weights by a projection tracing model, calculates comprehensive weights of indicators by combining game theory, and finally determines the city’s evaluation level based on the interval-counting multi-objective gray target decision-making model. Eleven typical sponge cities were selected for the case study analysis, which verified that the research framework of this paper can effectively deal with complex data and the reliability of the evaluation results, providing new ideas for the evaluation of sponge city construction performance. It also helps city managers to optimize the construction plan and resource allocation in a timely manner, thus enhancing the comprehensive benefits of the city and providing a scientific basis for the long-term development of sponge cities.

1. Introduction

Cities are growing rapidly, but they are also facing a number of water-related dilemmas, including frequent flooding, declining water environment quality, and insufficient water supply [1]. In the face of these complex challenges, the traditional urban drainage equipment and its water control methods can no longer cope; thus, the concept of sponge city construction was born, and has attracted widespread attention worldwide [2].
The concept of sponge city construction is to simulate natural hydrological conditions by constructing green roofs, rain gardens, and other ecological measures to realize the accumulation and purification of rainwater [3]. Alleviating the pressure of urban flooding is the core objective of sponge cities, which can effectively improve the utilization of water resources and the ecological environment by ensuring drainage safety and improving the water environment, making the coordinated symbiosis between urban and natural systems possible [4]. In the process of building sponge cities, how to conduct the selection of building materials should not be ignored. Not only does it have an impact on the cost, performance, and longevity of the facility, but it also has an impact on the ecological environment and sustainable development of the city. Wang [5] et al. explored the effect of microfiber modification on stiffness degradation by applying different cyclic loading. The results showed that microfibers effectively retarded the stiffness degradation and improved the resistance to cyclic loading. Applying this material to the infrastructure of sponge city construction greatly improves its durability and also reduces the maintenance cost, which contributes to the stable operation of urban construction. Ma [6] et al. investigated the effects of the silicate modulus, alkali content, and modification method on the properties of recycled brick powder-based mass polymer (AABG). The results showed that an increase in the silicate modulus and alkali content facilitates the dissolution of inert components in recycled brick powder to form a cementitious product, which further optimizes the structure and properties of AABG. AABG materials are applied to permeable paving and rainwater-harvesting facilities in sponge city construction, which helps to improve the infiltration and storage of rainwater. However, how to conduct a scientific and accurate evaluation of construction performance is an urgent issue to be addressed [7]. On the one hand, a reasonable performance evaluation can visually reflect whether the construction project meets the standard and accurately identify the problems in the construction process; on the other hand, based on the evaluation results, managers can make better construction decisions to ensure the sustainable development of sponge city construction [8]. However, the actual evaluation of sponge city construction faces the following challenges: some indicator data are difficult to obtain, for example, soil quality improvement indicator data need to be tested for porosity and permeability, which is complicated and costly, and accuracy is difficult to ensure, and the evaluation results are affected. The existing indicator system has not formed a unified standard, and the evaluation results lack comparability. The traditional evaluation model cannot deal well with incomplete decision-making information and fuzzy indicator values, which makes it difficult to accurately reflect the complexity of urban construction performance and is prone to decision-making bias.
There is extensive research in the academic community on the construction of sponge cities. For example, Ji et al. [9] constructed a seven-aspect indicator system for land use, ecological environmental protection, development capacity, building construction, supporting facilities, behavioral activities, and urban design, and summarized the specific indicators. Shah et al. [10] found the potential to reduce disasters such as floods, droughts, and landslides by implementing natural solutions in different regions of Europe. Zahmatkesh et al. [11] investigated the effectiveness of using low-impact development (LID) measures to address the impacts of climate variability on urban stormwater in New York City. Stormwater runoff and LID control measures were simulated for historical precipitation and future precipitation scenarios through the U.S. EPA’s Stormwater Management Model (SWMM5). Liang et al. [12] can effectively improve the hydrological response of urban watersheds by reducing the directly connected impervious area. By increasing the permeable area, the total amount of runoff and peak flow during the rainy season can be significantly cut down, and the water level at flood-prone points can be reduced, which can help to alleviate the problem of urban flooding and also improve the urban water environment. Zhao et al. [13] innovatively adopted the AHP-TOPSIS method, comprehensively considering the economic costs, ecological benefits, and environmental adaptability to construct an indicator system, selecting indicators from multiple levels and assigning weights. Wang et al. [14] innovatively constructed an evaluation model based on energy analysis to solve the problem of the unified measurement of multiple factors, comprehensively considering indicators such as ecosystem services, construction costs, runoff regulation, and pollution reduction. Liang et al. [15] constructed 10 key indicators, including disaster resilience, flood volume, flood duration, hydraulic performance index, annual runoff control, rainwater utilization, pollution control, social acceptability, greenhouse gas emissions, and cost. The Stormwater Management Model (SWMM) was used to simulate rainfall runoff to calculate these indicators, the improved analytic hierarchy process (AHP) was adopted to determine the weights, and the Technique for Order Preference by Similarity to an Ideal Solution (TOPSIS) was used for ranking. Yu et al. [16] established a comprehensive indicator system consisting of 12 indicators, including disaster reduction, economic, environmental, and social benefits, in order to evaluate the synergistic effects of five different green infrastructure (GI) measures as the existing evaluation indicator system cannot fully consider the comprehensive impact of sponge city construction. This system was applied to a case study in Jinan. Qi et al. [3] designed a simulated rainfall testing device to study the permeability and water storage performance of recycled brick aggregates used as permeable paving materials in sponge cities, considering the damage caused by urbanization to rainwater circulation. Yao et al. [17] quantified the runoff reduction effect of rainwater management measures under different rainfall levels in response to the pressure brought by climate change and urbanization on water supply and drainage systems, as well as the problem of rainwater management in sponge cities, and conducted a one-dimensional visualization analysis of urban waterlogging risk. The optimal cost–benefit plan was determined based on lifecycle cost, the analytic hierarchy process, and regret decision theory. Leng et al. [8] proposed a comprehensive evaluation framework for the compliance of water quantity and quality control objectives in constructing sponge cities through the coupling of green–gray–blue systems. By coupling rainfall runoff and river system models, multiple indicators of land and river quality can be quantitatively simulated and evaluated, and the multi-criteria decision-making method was used to rank the design schemes to determine the optimal solution for sponge city construction. Zhao et al. [18] focused on permeable materials in sponge city construction and prepared epoxy resin permeable bricks using different particle sizes of scrubbing sand and baking sand at room temperature. Considering the balance between mechanical properties and permeability, they determined the optimal preparation vibration time and conducted multiple tests on various samples. Yang et al. [19] addressed the issue of existing urban green space soil (UGSS) being unable to meet the needs of sponge city construction due to compaction and decreased permeability over time. They conducted wet–dry cycle tests on a new type of new urban green space soil (NUGSS) and studied the changes in its permeability rate, water-holding capacity, organic matter content, and salt content over time. Qian et al. [20] developed a comprehensive evaluation system to address the issue of lacking quantitative evaluation methods for the environmental, economic, and social benefits of low-impact development (LID) practices in sponge city construction. The SWMM and AHP were used to quantify the benefits of different combinations of LID units, and the performance of five LID design schemes for a sports center project in Guangxi was analyzed. Jing et al. [21] focused on the construction of sponge city neighborhoods. Considering the lack of a comprehensive quantitative evaluation system for existing GI and taking Liang Nong Siming Lake as an example, they used the analytic hierarchy process to construct a key performance indicator framework that includes environmental, economic, and socio-cultural criteria. They identified 15 key performance indicators and clarified their weights. Li et al. [22] constructed a resilience assessment system for sponge cities, incorporating engineering, environmental, and social indicators. They quantified resilience through the gray relational analysis method and established a multi-objective optimization model to balance the configuration of gray and green infrastructure. Zhao et al. [23] pointed out that an effective evaluation system for sponge city construction is crucial for project assessment. However, existing systems face challenges in indicator selection and weight allocation. They constructed a scientific evaluation indicator system and determined its weights through a literature review and statistical analysis. Su et al. [24] constructed evaluation indicators for sponge cities, including aquatic ecosystems, socio-economic systems, and institutional mechanisms, based on the urgent and chronic water-related pressures faced by cities. They used a fuzzy multi-criteria method with importance and satisfaction as the framework.
The existing research has laid out a theoretical and practical foundation for the construction of sponge cities, and we can see that relevant achievements are quite abundant. Ji et al. [9] constructed a management and control index system, providing a comprehensive reference for sponge city construction indicators and standardizing various indicators in the construction process. Zhao et al. [13] applied the AHP-TOPSIS method. By using the AHP to hierarchize complex problems, the determination of index weights became more logical, and then combined with the TOPSIS method to screen out better solutions. Wang et al. [14] established an evaluation model based on energy analysis, solving the problem of the unified measurement of multiple factors and enabling comprehensive consideration of indicators such as ecosystem services and construction costs. However, these methods have obvious drawbacks. The selection of indicators in some studies is limited. Some studies only focus on a few hydrological indicators such as the runoff control rate, ignoring the comprehensive impacts of sponge city construction on various aspects such as the social economy and ecological environment, resulting in evaluation results that cannot fully reflect the actual effects of construction projects. In terms of weight determination, subjective weighting methods such as the AHP can reflect expert experience, but are greatly influenced by the subjective factors of experts. Different judgments of experts may lead to significant differences in weights, reducing the objectivity and reliability of the evaluation results. While objective weighting methods such as the principal component analysis method determine weights based on data characteristics, they may overlook crucial but difficult-to-quantify factors such as policy factors and social acceptance. Therefore, building a novel and comprehensive performance evaluation framework for sponge city construction has important theoretical and practical significance.
In response to this current situation, the performance evaluation framework for sponge city construction constructed in this paper has been improved from multiple dimensions. In terms of indicator selection, it fully takes into account the comprehensive impacts of sponge city construction on various aspects such as social economy and ecological environment. Indicators like the increment of land value and the application rate of new sponge technologies are incorporated to construct an indicator system covering five dimensions, namely ecological environment improvement, water resources management, water disaster prevention, social and economic benefits, as well as technological and management innovation, which comprehensively reflects the performance of sponge city construction. In terms of weight determination, the fuzzy analytic hierarchy process (FAHP) is used for the subjective assignment of weights. The projection pursuit model optimized by the differential creative search algorithm is combined to determine the objective weights, and then the game theory method is applied to calculate the combined weights. This approach not only reflects the experience of experts, but is also based on the characteristics of the data, and also takes into account key factors that are difficult to quantify, such as policy factors and social acceptance, making the evaluation results more objective and reliable.

2. Establishment of Performance Evaluation Index System for Sponge City Construction

To accurately identify these factors, a sponge city construction performance indicator system consisting of 5 primary indicators and 15 secondary indicators was constructed through literature research and expert interviews. The specific establishment process is shown in Figure 1.
Academic databases such as Web of Science and CNKI were utilized. Keywords such as “performance evaluation of sponge city construction”, “indicator system of sponge city”, and “influencing factors of sponge city construction” were used to search for relevant academic papers, research reports, policy documents, and so on. When conducting the retrieval, the publication time of the literature is limited to the last 10 years to ensure that the obtained information is timely. At the same time, the empirical research literature is preferentially screened to guarantee the reliability of the research. In addition, representative cases of sponge city construction at home and abroad are collected, which can specifically include the literature on project planning, monitoring data, and effect evaluation. Then, the collected literature is read and analyzed to extract the indicators related to performance evaluation. It can focus on the specific indicators of ecological environment improvement, water resource management, water disaster defense, social and economic benefits, as well as technological and management innovation mentioned in the literature. The literature closely related to the research objectives is screened out, and then the indicators in the literature are categorized and organized according to ecology, resources, disasters, socio-economics, technology management, etc., and the indicator library is initially constructed. When categorizing and organizing the literature, text analysis software such as Nvivo 2020 is used to extract keywords and topic classifications to improve the accuracy of indicator summarization. Indicators are also de-emphasized and optimized to ensure that each indicator is clearly defined and to avoid duplication of indicators. Comparative analysis of the definitions and calculation methods of similar indicators in the different literature in relation to the objectives of this study is used to harmonize the indicators.
A total of 20 experts in the field of sponge city construction were invited to this study, including urban planning, environmental science, civil engineering, and other related fields of specialization, of which 8 are university professors, 5 are researchers, 4 are urban construction managers, and 3 are technicians, which ensures the diversity of experts, and at the same time, based on their rich practical experience, they can provide valuable opinions. In conjunction with the indicator system of this paper, questions were designed for the five first-level indicators: ecological environment, water resources management, water disaster defense, socio-economic benefits, and technological and management innovation. The experts were asked about their views on the important indicators for each aspect, as well as whether there were any indicators that are not mentioned in the literature but are crucial in actual construction. Questions were designed in terms of the operability and quantifiability of the indicators, as well as the difficulty of data acquisition. This was to understand the experts’ opinions on the feasibility of different indicators in practical applications. The transcripts of the interviews were organized and frequency analysis methods were applied to count the frequency of experts’ references to each indicator, and quantify and analyze the experts’ opinions. The experts’ consensus and disagreements on the indicators in various aspects were summarized. Key consideration was given to incorporating the indicators generally recognized by experts into the indicator system. The causes of indicators with disagreements were further analyzed, and a comprehensive judgment was made in combination with the results of our literature research. Based on the experts’ opinions, the initially constructed indicator library was further refined and optimized to ensure that the indicator system could comprehensively and accurately reflect the performance of sponge city construction, as shown in Table 1.
(1)
Biodiversity enhancement: Statistics on changes in the number of species and species richness in urban wetlands, green spaces, and other areas with sponge facilities, such as the number of bird species increasing, the proportion of native plant species increasing, etc., as a measure of the effect of sponge city construction on the optimization of the biohabitat environment. Existing studies mostly focus on indicators of hydrology and water quality, and pay insufficient attention to biodiversity enhancement, an important indicator reflecting the ecological benefits of sponge city construction. This paper, however, incorporates it into the index system, which can more comprehensively assess the positive impact of sponge city construction on the ecosystem and provide a more scientific basis for urban ecological protection.
(2)
Soil quality improvement: It mainly consists of testing the degree of improvement of soil porosity, infiltration coefficient, acidity and alkalinity, and other indicators. Good sponge facilities can effectively improve the soil structure and enhance the soil’s ability to store water and retain fertilizer. However, when previous studies obtained data on soil quality improvement indicators, the accuracy of the indicator data could not be ensured due to the complexity and high cost of testing. Therefore, the present study first researched the relevant data extensively and then invited experts to screen the data based on a large amount of relevant data on soil quality improvement indicators, which effectively ensured the reliability of the data on this indicator.
(3)
Microclimate regulation capability: Able to reflect changes in localized temperature, humidity, wind speed, and other meteorological changes in the city. For example, sponge facilities such as green roofs or large green areas can effectively mitigate the urban heat island effect and regulate the local microclimate in urban construction [36].
(4)
Rainwater resource reserve: the actual rainwater collection volume of rainwater collection facilities such as rain barrels and cisterns can measure the ability of sponge cities in rainwater collection and storage.
(5)
Proportion of comprehensive utilization of water resources: calculate the total water consumption of rainwater and recycled water collected in the city, including the proportion of irrigation and industrial water, which can reflect the level of comprehensive utilization of water resources in sponge cities.
(6)
Rainwater utilization green space rate: the ratio of the area of green space involved in the rainwater collection process, infiltration effect, purification function, etc., to the total area of sponge city construction land. The value of this indicator is easily affected by the differences in the level of regional economic development and construction conditions, and can reflect the importance of urban green space investment in rainwater management.
(7)
Rainstorm flood mitigation: sponge city construction measures to alleviate the implementation of flooding effects can be assessed by the flooded area during heavy rainfall to reduce the degree of shrinkage, the depth of the reduced value, and shorten the amount of time.
(8)
Enhancement of flood storage capacity: For the assessment of flood-prone areas, flood flow parameters and water storage volume data are the key to measuring the sponge city’s flood storage capacity. The enhancement of this indicator can effectively alleviate the harm of flooding to the city, and is an important indicator to measure the effectiveness of sponge city construction to deal with flooding.
(9)
Drainage system pressure relief: Monitoring of water level fluctuations and flow rate changes inside drains during stormy weather conditions, calculating hydraulic load of the drainage system; and then assessing the effectiveness of the sponge facilities to withstand the pressure. Examples show that the index can be improved to effectively reduce the risk of failure of the drainage system by evaluating the relief effect of sponge facilities on drainage system pressure; and reducing the maintenance cost and failure risk of the drainage system.
(10)
Land value appreciation: the potential economic value brought to sponge city construction by changes in land prices and real estate markets in the sponge city construction area.
(11)
Industrial development promotion: refers to the development of industries related to sponge city construction such as environmental protection, green building, sponge facilities, etc. This indicator can reflect that urban construction has a promoting effect on local economic development.
(12)
Public health protection: assessing the impact of sponge city construction on public health by counting changes in the incidence of water-related diseases in the city, such as those caused by exposure to sewage.
(13)
Application rate of new sponge technologies: statistics on new technologies in sponge city construction, such as the application of new permeable materials and intelligent sponge facility management systems, as a percentage of total sponge facility construction, can measure the degree of technological innovation in urban construction.
(14)
Intelligent management level of sponge facilities: it can measure the degree of intelligence of the city’s monitoring, control, and management of sponge facilities, such as the degree of perfection of the real-time monitoring of sponge facilities’ operation status with sensors.
(15)
Management policy innovation and implementation effect: the policies related to sponge city construction are analyzed, such as the innovation points of incentive policies and the actual implementation effect, including the coverage, implementation strength, and guiding role of the policies.

3. Performance Evaluation Model for Sponge City Construction

3.1. Subjective Weight Assignment Based on the Fuzzy Analytic Hierarchy Process

The fuzzy analytic hierarchy process (FAHP) is a combination of qualitative and quantitative methods, which views a complex problem as a bottom-up hierarchical recursive system and endows it with fuzzy mathematical features, making the analysis results more scientific and reasonable [37]. In the performance evaluation of sponge city construction, as it involves indicators of multiple dimensions and the importance between indicators is difficult to determine directly, the FAHP can effectively quantify the experience and judgment of experts and provide a reliable basis for subsequent weight calculation and evaluation. Different from the existing studies that rely solely on experts’ experience to assign subjective weights, the FAHP can quantify the relative importance among indicators more precisely by establishing a fuzzy complementary judgment matrix and comparing the hierarchical factors two by two. Moreover, in the process of calculating the relative importance of factors, the weight vector, and conducting a consistency test, scientific mathematical methods are applied to determine subjective weights that are more scientific and reasonable.

3.1.1. Establishing a Fuzzy Complementary Judgment Matrix

In constructing a fuzzy complementary judgment matrix, A , based on the importance of each indicator in the evaluation index system, and setting the elements as a i j , the matrix equation is as follows [37]:
A = a i j i , j = 1,2 , , n .
To quantitatively describe the relative importance of any two elements, the range of relative importance scale values is specified as 0.1~0.9, and all values are to one decimal place. The relative importance scale values are shown in Table 2.
We can compare the hierarchical factors pairwise to obtain a fuzzy complementary matrix:
A = a 11 a 12 a 1 n a 21 a 22 a 2 n a n 1 a n 2 a n n .
The consistency of fuzzy judgment matrices reflects the consistency of people’s thinking, and the “pairwise comparison” here is the process of expert assignment.

3.1.2. Relative Importance of Calculation Factors

We can sum the rows of the fuzzy matrix to obtain its row sum, a i ; that is [37]
a i = k = 1 n   a i k i = 1,2 , , n .
Thus, the fuzzy consistent matrix, B , is calculated; that is [37]
B = b i j ,   b i j = a i a j 2 n 1 + 0.5 .

3.1.3. Calculating Weight Vector

To unify the calculation standards, the weights of the indicators are normalized according to different levels, and the sorting vectors W i of each level are obtained; that is [37]
W i = 1 n n 1 2 j = 1 n   b i j 1 ,
W Z i j = j = 1 n   W i × w j i .
In Equation (6), W Z i j represents the various weights of the index difference with respect to the target layer; W i represents the relative weight of the i -th indicator to the target layer; and w j i represents the relative weight of the j -th indicator with respect to the i -th indicator.

3.1.4. Consistency Check

To determine whether the calculated weight values are reasonable, a consistency check should also be carried out. The compatibility indices of matrices A and B should be calculated; that is [37]
I A , B = 1 n 2 i = 1 n   j = 1 n   a i j + b i j 1 .
When the compatibility index is less than 0.1, the consistency test is considered to be passed.

3.2. Objective Weight Assignment Based on Projection Pursuit Model

Compared with the existing evaluation models, the projection tracing model can effectively deal with high-dimensional nonlinear data. In the performance evaluation of sponge city construction, it involves a lot of complex indicator data, and it is difficult for the traditional model to explore the potential information behind the data. By projecting high-dimensional data to low-dimensional space, the projection tracing model reduces the amount of data processing, and at the same time utilizes the optimal projection vectors and projection values to quantitatively analyze the structural characteristics of the data, more accurately reflecting the complexity of the performance of sponge city construction, and providing a more objective basis for evaluation. The specific construction steps are as follows [38]:
Step 1: Normalizing the data
We suppose the sample set of each evaluation index value is x * ( i , j ) i = 1,2 , , n ; j = 1,2 , , p } , where x * ( i , j ) represents the value of the j -th indicator of the i -th sample, and n and p denote the number of samples and the number of indicators, respectively. To eliminate the dimensions of each evaluation index value and unify the variation range of each evaluation index value, and considering that the numerical values of the evaluation indicators selected in this paper have a positive correlation, the following equation is used to process the data [38]:
x i , j = x * i , j x m i n j x m a x j x m i n j .
Step 2: Constructing the index function, Q ( a )
The projection pursuit model transforms the p-dimensional data, { x ( i , j ) | j = 1,2 , , p } , into one-dimensional projection values, Z ( i ) , with the projection direction, a = ( a ( 1 ) , a ( 2 ) , a ( 3 ) , , a ( p ) ) [38].
Z i = j = 1 p   a j x i , j           i = 1 , 2 , , n .
When constructing the projection index values, the projection value, Z ( i ) , should satisfy the condition that the local projection points are as dense as possible, while the overall projection point clusters are as scattered as possible. Therefore, the projection index function can be expressed as [38]
Q a = S z D z .
where S z is the standard deviation of Z ( i ) , and D z is the local density of Z ( i ) ; that is [38]
S z = i = 1 n   Z ( i ) E ( Z ) 2 n 1 ,
D Z = i = 1 n   j = 1 n   R r i , j μ R r i , j ,
where E ( Z ) is the average value of the sequence Z ( i ) | i = 1,2 , , n , and R is the window radius of the local density. Its selection should ensure that the average number of projection points contained within the window is neither too small nor increases as n increases; r ( i , j ) is the distance between samples, and r ( i , j ) = Z ( i ) Z ( j ) ; μ ( t ) is a unit step function. When t 0 , its value is 1; when t < 0 , its value is 0.
Step 3: Optimizing the projection index function
When the values of each evaluation index are determined, the projection index function, Q ( a ) , will only change with variation in the projection direction, a . Therefore, the optimal projection direction can be estimated by solving the maximization problem of the projection index function [38]:
Maximizing the objective function:
m a x Q a = S z D z .
Constraint conditions:
s . t . i = 1 n   a 2 j = 1 .
Step 4: Solving the objective function based on the DCS algorithm
DCS is a groundbreaking optimization algorithm that has revolutionized traditional decision-making systems in complex environments. This approach involves an iterative cycle of divergent and convergent thinking; in this study, the convergent thinking strategy is adopted [39]. Compared with the traditional PSO and GA, the DCS algorithm has significant advantages in dealing with the optimization problem of the projection tracing model. PSO relies on collaborative search by sharing information between particles, which is prone to falling into the local optimum in the complex and high-dimensional data space, resulting in stagnation of the search and making it difficult to find the global optimal solution; GA simulates the optimization of the natural selection and genetic mechanism, but when dealing with the projection tracing model, the crossover and mutation operations may destroy the potential structure of the data, affecting the optimization effect, which affects the optimization effect.
(1) In a DCS, the optimization process starts with a set of candidate solutions, x , that are randomly generated between the upper bound, U B , and the lower bound, L B , of the optimization problem [39]:
x i , d = L B d + U ( 0 , 1 ) × ( U B d L B d )
where U ( 0 , 1 ) represents the uniform distribution on the interval (0,1); L B d and U B d , respectively, denote the lower bound and the upper bound of the d -th dimension specified by the optimization problem; and x i , d represents the element at the d-th position of x i .
(2) Differentiated Knowledge Acquisition (DKA)
The effect of the DKA process on each individual x i can be implemented using the following equation [39]:
j r a n d = r a n d i n t 1 , D ,
v i , d = v i , d f U 0 , 1 η i , t   o r   d = j r a n d x i , d o t h e r w i s e ,
where v i , d is the element at the d -th position (dimension) of the trial member, and x i , d represents the element of X i at the d -th position in X . U 0 , 1 represents the uniform distribution over the interval 0 , 1 . η i , t is the QKR of the individual at the t -th iteration; j r a n d is an integer randomly selected from 1 to D , and it is generated once for each i .
(3) Convergent thinking
The equation for this strategy is as follows [39]:
v i , d = w × x b e s t , d + λ t × x r 2 , d x i , d + w i , t ( x r 1 , d x i , d ) ,
λ t = 0.1 + 0.518 × ( 1 N F E t N F E m a x ) ,
where N F E t represents the number of current function evaluations at time t , and N F E m a x represents the maximum number of function evaluations. x b e s t , d is the d -th element of the best-performing individual in the current iteration. w represents the cognitive weight of the best-performing individual, with a default value of 1. w i , t is the value of the w -coefficient of the individual at the t -th iteration. x r 1 , d is the d -th position of an individual randomly selected from [ 1,2 , , N P ] , and X r 1 X i X b e s t represents three different individuals. λ t is the computational damping coefficient at the t -th iteration; x r 2 , d is the d -th position of an individual randomly selected from { n g s + 1 , , N P } .
Taking Equation (13) as the fitness function of the DCS, the optimal solution, a * , is obtained from Equations (15)–(19). Subsequently, the objective weight vector, T = T 1 , T 2 , , T n , is obtained by squaring each element of a * , thus obtaining the objective weight vector. With the help of this strategy, the DCS algorithm continuously adjusts the projection direction during the optimization of the projection pursuit model, increases the value of the projection index function, and finds a better projection direction. It can accurately reflect the characteristics of the performance data of sponge city construction and provide a reliable basis for determining objective weights.

3.3. Calculation of Combined Weights Using the Game Theory Method

(1) Linearly combining the subjective and objective weights [40].
W * = α 1 W 1 T + α 2 W 2 T ,
where w * is the combined weight, and α 1 and α 2 represent the linear combination coefficients of the fuzzy analytic hierarchy process and the projection pursuit algorithm, respectively. Both α 1 and α 2 are greater than 0.
(2) Based on game theory, we can optimize the linear combination coefficients [40]:
m i n w * w 2 k ,
where k = 1 , 2 .
(3) According to the matrix differentiation principle, we can perform a first-order derivative transformation on Equations (20) and (21) [40]:
W 1 W 1 T W 1 W 2 T W 2 W 1 T W 2 W 2 T a 1 a 2 = W 1 W 1 T W 2 W 2 T .
Thus, the coefficients α 1 and α 2 can be solved.
(4) We can now calculate the optimal comprehensive weight, normalizing α 1 and α 2 to obtain the optimal combination coefficients, β 1 * and β 2 * , and substituting them into Equation (20) to obtain the optimal combined weight, W * .

3.4. Multi-Objective Gray Target Decision-Making Model Based on Interval Numbers

The traditional gray target model has limitations in dealing with data with incomplete decision-making information and vague and uncertain indicator values, making it difficult to accurately assess the performance of sponge city construction. The interval number multi-objective gray target decision-making model in this paper, according to the interval number multi-objective decision-making problem, constructs three types of target effect calculation functions for the benefit-type target, cost-type target, and moderate-type target of interval numbers, which can fully reflect the degree of closeness or deviation between the effect sample value and the maximum effect sample value. And through a certain method of calculating weights, the importance of each indicator in the multi-objective decision-making is weighted, effectively overcoming the subjectivity of experts in weighting the indicators [41]. In the performance evaluation of sponge city construction, since there is often uncertainty in the actual data, the model can better deal with this fuzzy information, more accurately assess the performance level of sponge city construction, and provide city managers with a more informative basis for decision-making.

3.4.1. Multi-Objective Gray Target Model for Interval Numbers from a Sponge City Performance Evaluation Scheme

An optimal decision-making problem for a scheme can be described as consisting of a scheme set, A = { a 1 , a 2 , , a n } ; a counter-measure set, B = { b 1 , b 2 , , b m } ; a weight vector, w = { w 1 , w 2 , , w k | i = 1 k   w i = 1 , w i [ 0 , 1 ] } , corresponding to the counter-measures; and a situation set, S = { s i j = ( a i , b j ) | a i A , b j B } and related functions. Due to incomplete decision-making information, the situation set may vary within a certain interval, and there may be multiple cases of weight information.
According to the principles we have applied to constructing an evaluation index system for sponge city schemes, n scheme evaluation indicators are designed. This study considers the problem wherein decision-making information is in the form of interval numbers, constructs index information for interval numbers, and standardizes the interval numbers.
Letting x k j ~ = [ x k 1 j , x k 2 j ] ( j = 1,2 , , s ; k = 1,2 , , n ) be the original interval data of the k -th indicator of the j -th scheme in the sample set and y k j ~ = [ y k 1 j , y k 2 j ] be the corresponding interval numbers after standardization, the standardization equation is as follows [41]:
(1) When the indicator is a benefit-type indicator, the larger the indicator value, the better.
y k 1 j = x k 1 j j = 1 s   x k 2 j , y k 2 j = x k 2 j j = 1 s   x k 1 j .
(2) When the indicator is a cost-type indicator, where the smaller the indicator value, the better, we first use the equation ( x k 1 j ) = m a x 1 j s   x k 1 j x k 1 j + m i n 1 j s   x k 1 j . This equation transforms the cost-type indicator into a positively oriented indicator through translation processing, retaining the linearity of the original data to the greatest extent.
y k 1 j = x k 1 j j = 1 s   x k 2 j , y k 2 j = x k 2 j j = 1 s   x k 1 j .
(3) When the indicator is a moderate-type indicator, the closer the target effect is to a certain moderate value, A , the better. A x and A + x are the lower-limit effect critical value and the upper-limit effect critical value, respectively.
When x k 1 j + x k 2 j 2 [ A x , A ] , it is called
y k j ~ = x k 1 j + x k 2 j 2 A + x x .
When x k 1 j + x k 2 j 2 [ A , A + x ] , it is called
y k j ~ = x k 1 j + x k 2 j 2 + A x x .

3.4.2. Calculation of the Scheme Target-Center Distance Measure

We then process the scheme situation set information in the form of interval numbers, select the positive and negative target centers, and calculate the target-center distance measure.
Letting y k + ~ = [ y k 1 + , y k 2 + ] , where y k + ~ is the positive target-center interval value of indicator k after standardization, y k ~ = [ y k 1 , y k 2 ] , and y k ~ is the negative target-center interval value of indicator k after standardization, as noted in [41]
y k 1 + = m a x 1 j s   y k 1 j , y k 2 + = m a x 1 j s   y k 2 j ,
y k 1 = m i n 1 j s   y k 1 j , y k 2 = m i n 1 j s   y k 2 j .
For the k -th indicator of the j -th decision-making object, the distance from the positive target-center interval value, y k + ~ , is d k ( y k + ~ , y k j ~ ) , abbreviated as d k j + . The distance from the negative target-center interval value, y k ~ , of the k -th indicator in the j -th decision-making object is d k ( y k ~ , y k j ~ ) , abbreviated as d k j . The equations are as follows [41]:
d k j + = 1 2 y k 1 + y k 1 j 2 + y k 2 + y k 2 j 2 1 2 ,
d k j = 1 2 y k 1 y k 1 j 2 + y k 2 y k 2 j 2 1 2 .
The larger the comprehensive target-center distance, d k j , combining the positive and negative target-center distances, the better the j -th decision-making object is. The calculation equation for d k j is as follows [41]:
d k j = d k j d k j + + d k j .
Finally, we can calculate the comprehensive measure of the scheme to be evaluated according to Equation (32). The equation is as follows [41]:
r j = k = 1 n   w k * d k j .

3.5. Implementation Method for the Model Proposed in This Study

The main construction of this model mainly involves four aspects: (1) calculating the subjective weight based on the fuzzy analytic hierarchy process (FAHP); (2) calculating the objective weight of each index using the projection pursuit model optimized by the differentiated creative search algorithm; (3) combining the weights based on the idea of game theory; and (4) constructing the gray target decision-making matrix using the multi-objective gray target decision-making model based on interval numbers, calculating the interval values of the positive and negative target centers, and determining the distances from the positive and negative target centers and the comprehensive distance from the target center. Then, we can calculate the comprehensive measure of each sample in combination with the comprehensive weight and finally determine the evaluation grade. The flow chart of the model evaluation is shown in Figure 2.

4. Case Study

4.1. Determining the Weights of the Indicators

4.1.1. FAHP Subjective Weight Assignment

The subjective weights of the sponge city construction indicators are calculated using the FAHP, as shown below.
(1) According to the FAHP calculation steps mentioned above, ten experts in the field of sponge city construction were invited to participate, including professors and researchers in majors such as urban planning, environmental science, and hydraulic engineering, as well as engineering and technical personnel with rich practical experience. The 0.1–0.9 five-scale method was adopted to conduct pairwise comparisons between the improvement of the ecological environment, A 1 ; water resource management, A 2 ; water disaster prevention, A 3 ; social and economic benefits, A 4 ; and technology and management innovation, A 5 , in the criterion layer, as well as the decision-making layer (the corresponding secondary indicators under each criterion layer). Importance scores were obtained, and a fuzzy complementary matrix was constructed.
Taking the criterion layer as an example, matrix A was constructed based on the experts’ scores. When comparing the improvement of the ecological environment, A 1 , with the water resource management, A 2 , the experts considered A 1 slightly more important than A 2 , and it scored 0.55. Following this logic, the complete matrix A was constructed, as shown in Table 3. Similarly, the fuzzy complementary matrices, B , C , D , E , and F , of the decision-making layer relative to the criterion layer were constructed. Based on the principle that the FAHP transforms qualitative judgments into quantitative values, the subsequent series of calculation steps, such as constructing a fuzzy consistency matrix and calculating weights, can quantify the subjective judgments of experts on the relative importance of each indicator, so as to determine the subjective weights of each indicator. This process fully embodies the advantages of the FAHP in dealing with complex decision-making problems and effectively integrating expert experience into the weight determination process.
(2) Construction of fuzzy consistency matrix, R i j
The fuzzy complementary matrices A , B , C , D , E , and F were summed row by row, and those of each layer, R A , R B , R C , R D , R E , and R F , were constructed, respectively.
R A = 0.5000   0.5156   0.5077   0.4925   0.5238 0.4844   0.5000   0.4921   0.4769   0.5082 0.4923   0.5079   0.5000   0.4848   0.5313 0.5075   0.5231   0.5151   0.5000   0.50000 0.4762   0.4918   0.4839   0.4688   0.5000     R B = 0.5000 0.5854 0.5581 0.4146 0.5000 0.4722 0.4419 0.5278 0.5000
R C = 0.5000 0.4458 0.5000 0.5542 0.5000 0.5542 0.5000 0.4458 0.5000     R D = 0.5000 0.5529 0.5732 0.4471 0.5000 0.5205 0.4268 0.4795 0.5000
R E = 0.5000 0.4639 0.4592 0.5360 0.5000 0.4952 0.5408 0.5048 0.5000     R F = 0.5000 0.5412 0.5679 0.4588 0.5000 0.5270 0.4321 0.4729 0.5000
(3) Calculating the subjective weight
The fuzzy consistency matrices R A , R B , R C , R D , R E , and R F were summed row by row, and the weights were calculated. The calculation results are as follows:
ω A = 0.2063 0.1937 0.2000 0.2125 0.1875     ω B = 0.4000 0.2833 0.3167     ω c = 0.3083 0.3834 0.3083
ω D = 0.3916 0.3167 0.2917     ω E = 0.3000 0.3467 0.3533     ω F = 0.3833 0.3250 0.2917
According to the calculation results of the weights of each layer above, ω B , ω c   ω D , ω E , and ω F were multiplied by the corresponding weights, ω A , of the criterion layer, the weights of each factor in the decision-making layer. The calculation results are shown in Table 4. The magnitude of the subjective weights was highly related to the subjective scores.
W 1   =   ( 0.0825 ,   0.0584 ,   0.0653 ,   0.0597 ,   0.0743 ,   0.0597 ,   0.0783 ,   0.0633 ,   0.0583 ,   0.0638 ,   0.0737 ,   0.0751 ,   0.0719 ,   0.0609 ,   0.0547 ) T

4.1.2. Objective Weight Assignment of Projection Pursuit Model

According to Equations (13)–(19), the optimal projection direction was calculated using Matlab2016a, and a * = (0.2872, 0.2416, 0.2555, 0.2443, 0.2726, 0.2443, 0.2798, 0.2516, 0.2415, 0.2526, 0.2715, 0.2740, 0.2681, 0.2468, 0.2339). The values of each element in the optimal projection vector were squared, and the calculation results for the weights of the 15 secondary indicators were obtained, as shown in Table 5. The weights of the primary indicators were obtained by summing up the weights of the secondary indicators subordinate to each primary indicator. The weights of the primary indicators are represented by a radar chart [42], and the calculation results are shown in Figure 3. In the performance evaluation of sponge city construction, the projection tracing model utilizes the principle of projecting high-dimensional data to low dimensions to extract key information, and deals with multi-indicator data. By finding the best projection direction, it allows the projected data to maximize the original data characteristics, and then objectively determines the weights of each indicator based on the projection results. This way of determining the weights based on the data’s own characteristics eliminates the interference of subjective factors. It demonstrates the scientific and reliable nature of the projection tracing model in objective evaluation.

4.1.3. Multi-Objective Gray Target Decision-Making Based on Interval Numbers

After determining the indicator weights, the interval number gray target decision-making model was used to determine the performance evaluation level of sponge city construction. The model is based on the principle of dealing with interval numbers and fuzzy information, first standardizing the data in the form of interval numbers of indicators, then calculating positive and negative bull’s-eye interval values, the bull’s-eye distance, etc., and at the same time combining the weights of each indicator to finally arrive at the comprehensive measurement and evaluation grade. This process takes advantage of the model’s ability to deal with uncertain data, making the evaluation of sponge city construction performance more accurate and providing more reasonable evaluation results for the case study. Firstly, the actual data of the various indicators were collected. Then, based on the characteristics of the data and the nature of the indicators, the data were transformed into interval numbers to construct a decision-making matrix. Given that different indicators had diverse impacts on the evaluation results, it was necessary to determine the comprehensive weight, W * , through the weighted-sum method of game theory, based on the obtained subjective weight, W 1 , and objective weight, W 2 . This aligned the weight more with the actual situation and accurately reflected the importance of each indicator.
By calculating the weight coefficients, α 1 and α 2 , through Equations (20)–(22) with the subjective weight, W 1 , obtained from the fuzzy analytic hierarchy process and the objective weight, W 2 , obtained from the projection pursuit algorithm, the optimal weight coefficients β 1 * = 0.2266 and β 2 * = 0.7734 were obtained after normalization. Then, substituting them into Equation (20), the optimal combined weight, W * , based on game theory was finally obtained. The calculation results are shown in Table 6.

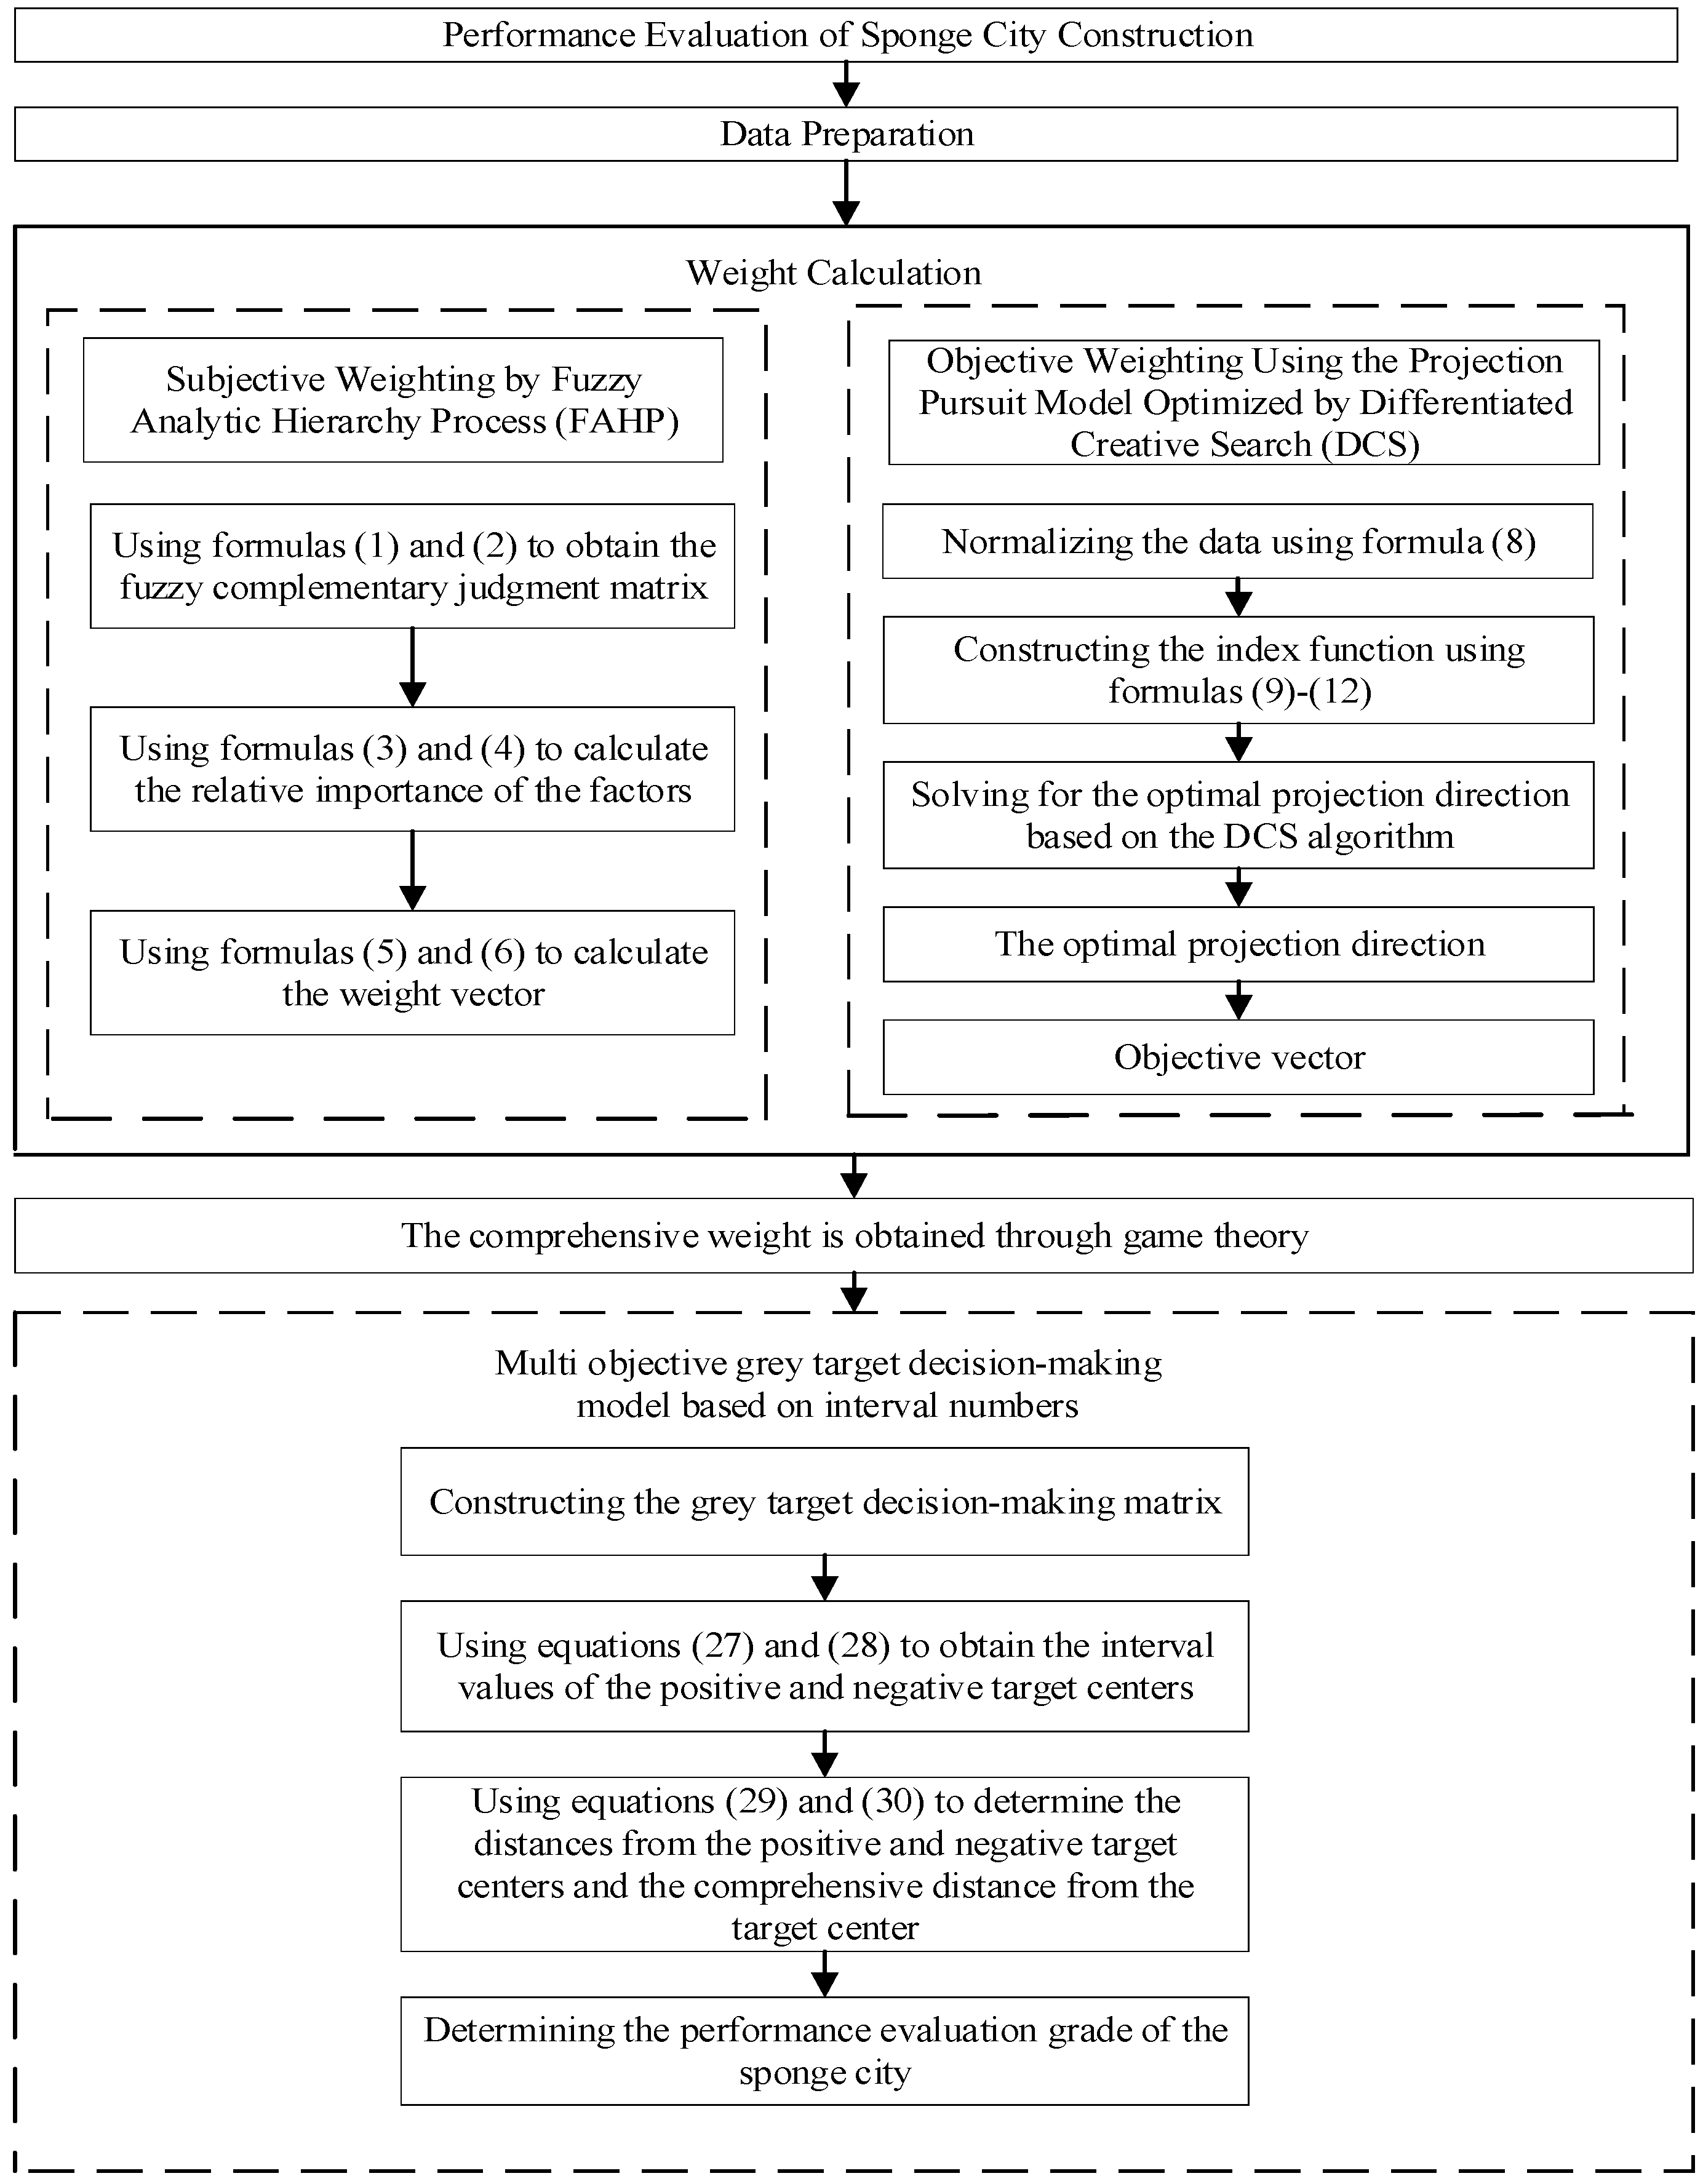
4.2. Calculating the Evaluation Level

(1) By analyzing the construction performance of China’s domestic sponge cities in recent years, selecting 11 sponge cities with distinct construction effects, Xixian City’s Xixian New District, Urumqi City’s sponge city, Pingliang City’s sponge city, Xining City’s sponge city, Lanzhou City’s sponge city, Golmud City’s sponge city, Yan’an City’s sponge city, Weinan City’s sponge city, Xinjiang Nova City’s sponge city, Qingyang City’s sponge city, and Tianshui City’s sponge city, and establishing an interval gray target model decision matrix. In view of the sponge city construction performance evaluation index system containing mostly qualitative indicators, by inviting 30 experts in the field of urban construction, according to the constructed index system, the scoring range for the 11 sponge city evaluation scoring is (0, 1), as shown in Table 7.
(2) Specific information on the 11 sponge cities is as follows:
Xi’an Xixian New District, located in the Guanzhong Plain, solves waterlogging through rain gardens, ecological wetlands, and permeable paving, and combines those elements with the ecological restoration of the Weihe River to enhance storage capacity. Urumqi, located in the arid zone, uses roof water harvesting, underground cisterns, and artificial wetlands as the core to alleviate water shortages, as well as to prevent wind and stabilize sand. Pingliang, located on the Loess Plateau, uses terraced rainwater retention ponds and vegetated buffer strips to manage soil erosion and improve soil water retention. Xining, in view of the cold and arid climate of the plateau, constructs sunken green space and a snow water collection system to alleviate the pressure of spring flooding. Lanzhou, along the Yellow River layout, combines permeable paving, storage pools, river ecological slope, flood control, and pollution synergistic management. Geermu promotes water-saving drip irrigation green space and saline–alkali land improvement technology in the Qaidam Basin to optimize the use of rainwater resources. Yan’an controls soil erosion in loess hilly areas with silt dams and ecological slopes, and repairs vegetation to nourish water sources. Weinan has constructed floodplains and intelligent drainage systems to deal with the Wei River floods, synchronized with the restoration of wetland ecology. Xinxing City in Xinjiang has adopted permeable materials and intelligent monitoring to optimize water resource allocation in arid areas. Qingyang manages ecologically fragile areas through ditch-head protection and terrace water storage, and synergizes oilfield groundwater protection. Tianshui relies on mountainous terrain to create stepped rain gardens and ecological filters to mitigate the threat of flash floods. Each region is adapting to local conditions, highlighting the synergy of “seepage, stagnation, storage, purification, utilization and drainage”, and promoting the harmonious development of water.
(3) The sponge city is divided into five grades, generating programs I–V, corresponding to “excellent”, “good”, “medium”, “poor ”, and “poor”; each grade is divided into the following ranges: [0.8, 1), [0.6, 0.8), [0.4, 0.6), [0.2, 0.4), and [0, 0.2]. The evaluation indexes of each program are taken as the middle value of the corresponding grade, and the data of each index of 11 sponge cities are sequentially put into the to-be-determined columns of Table 8 as the 6th program, and the comprehensive measurement calculation is carried out to arrive at the evaluation results of each city.
(4) Determine the positive and negative bull’s-eye interval values of indicators
Taking Tianshui city as an example, its indicator data were put into the pending columns of Table 8, according to the decision matrix and Equations (27) and (28), and the positive and negative bull’s-eye interval values were obtained of Tianshui city indicators, y k + ~ = [ y k 1 + , y k 2 + ] and y k ~ = [ y k 1 , y k 2 ] ( k = 1 , 2 , 3   15 ) . The results are shown in Table 9.
(5) Determining the positive and negative bull’s-eye distances of the indicators and the comprehensive bull’s-eye distance
Taking Tianshui city as an example, Equations (29) and (30) were used to calculate the distance, d k 1 + , between the interval value of each secondary indicator in sample 1 and the positive bull’s-eye interval value, y k + ~ , and the distance, d k 1 , between the interval value of each secondary indicator in sample 1 and the negative bull’s-eye interval value, y k ~ . Subsequently, Equation (31) was used to obtain the comprehensive bull’s-eye distance of each secondary indicator; the results are summarized in Table 10. The same calculation method was applied to other samples.
According to Equation (32), r I = k = 1 n   w k * * d k j = W 1 * d 1 1 + W 2 * d 2 1 + + W 15 * d 15 1 = 0.952 ,   r I I = k = 1 n   w k * * d k j = W 1 * d 1 1 + W 2 * d 2 1 + + W 15 * d 15 1 = 0.952 , r I I I = k = 1 n   w k * * d k j = W 1 * d 1 1 + W 2 * d 2 1 + + W 15 * d 15 1 = 0.952 , r I V = k = 1 n   w k * * d k j = W 1 * d 1 1 + W 2 * d 2 1 + + W 15 * d 15 1 = 0.952 ,   r V = k = 1 n   w k * * d k j = W 1 * d 1 1 + W 2 * d 2 1 + + W 15 * d 15 1 = 0.952 ,   r 1 = k = 1 n   w k * * d k j = W 1 * d 1 1 + W 2 * d 2 1 + + W 15 * d 15 1 = 0.652 .
The results of the calculation of the comprehensive measure of the sponge city in TSW and the pre-determined five evaluation scenarios were ranked, as shown in Table 11 below.
According to Equation (32), r 2 = k = 1 n   w k * * d k j = W 1 * d 1 1 + W 2 * d 2 1 + + W 15 * d 15 1 = 0.39 . The calculation results of the comprehensive measure of the sponge city in Urumqi and the pre-determined five evaluation schemes were ranked, as shown in Table 12 below.
According to Equation (32), r 3 = k = 1 n   w k * * d k j = W 1 * d 1 1 + W 2 * d 2 1 + + W 15 * d 15 1 = 0.48 . The calculation results of the comprehensive measure of the sponge city in Pingliang City and the pre-determined five evaluation schemes were ranked, as shown in Table 13 below.
According to Equation (32), r 4 = k = 1 n   w k * * d k j = W 1 * d 1 1 + W 2 * d 2 1 + + W 15 * d 15 1 = 0.781 . The calculation results of the comprehensive measure of the sponge city in Xining City and the pre-determined five evaluation schemes were ranked, as shown in Table 14 below.
According to Equation (32), r 5 = k = 1 n   w k * * d k j = W 1 * d 1 1 + W 2 * d 2 1 + + W 15 * d 15 1 = 0.48 .
The calculation results of the comprehensive measure of the sponge city in Lanzhou City and the pre-determined five evaluation schemes were ranked, as shown in Table 15 below.
According to Equation (32), r 6 = k = 1 n   w k * * d k j = W 1 * d 1 1 + W 2 * d 2 1 + + W 15 * d 15 1 = 0.42 .
The results of the calculation of the comprehensive measure of the sponge city in Golmud and the pre-determined five evaluation programs were ranked, as shown in Table 16 below.
According to Equation (32), r 7 = k = 1 n   w k * * d k j = W 1 * d 1 1 + W 2 * d 2 1 + + W 15 * d 15 1 = 0.396 . The calculation results of the comprehensive measure of the sponge city in Yan’an City and the pre-determined five evaluation schemes were ranked, as shown in Table 17 below.
According to Equation (32), r 8 = k = 1 n   w k * * d k j = W 1 * d 1 1 + W 2 * d 2 1 + + W 15 * d 15 1 = 0.42 .
The results of the calculation of the comprehensive measure of the sponge city in Weinan City and the pre-determined five evaluation scenarios were ranked, as shown in Table 18 below.
According to Equation (32), r 9 = k = 1 n   w k * * d k j = W 1 * d 1 1 + W 2 * d 2 1 + + W 15 * d 15 1 = 0.648 . The results of the calculation of the sponge city composite measure for Nova City and the pre-determined five evaluation scenarios were ranked, as shown in Table 19 below.
According to Equation (32), r 10 = k = 1 n   w k * * d k j = W 1 * d 1 1 + W 2 * d 2 1 + + W 15 * d 15 1 = 0.156 . The calculation results of the comprehensive measure of the sponge city in Qingyang City and the pre-determined five evaluation schemes were ranked, as shown in Table 20 below.
According to Equation (32), r 11 = k = 1 n   w k * * d k j = W 1 * d 1 1 + W 2 * d 2 1 + + W 15 * d 15 1 = 0.845 . The calculation results of the comprehensive measure of Xi’an Xixian sponge city and the pre-determined five evaluation schemes were ranked, as shown in Table 21 below.
The results of the above calculations show that Tianshui City, with a sponge city comprehensive measurement of 0.652, is located between programs II and III, so the evaluation results of the sponge city construction project are “good”. Similarly, the Urumqi City and Yan’an sponge city evaluation results are “poor”, the Pingliang City, Lanzhou, Golmud, and Weinan sponge city evaluation results are “medium”, the Xining City and Xinjiang Nova City sponge city evaluation results are “good”, the Qingyang City sponge city evaluation results are “poor”, and the Xi’an City, Xixian New District sponge city evaluation results are ”excellent”.

4.3. Analysis of Evaluation Results

This study constructs a comprehensive performance evaluation framework to evaluate sponge city construction projects and combines cases to derive the evaluation results of each sponge city construction project to provide reference for other sponge city development.
Water resource management and ecological improvement are very important in the Tier 1 indicators. In terms of water resource management, a higher proportion of integrated water resource utilization and rainwater resource reserves indicates that the city is efficient in collecting, storing, and utilizing rainwater, reducing dependence on traditional water resources. In terms of ecological environment improvement, the increase in biodiversity and microclimate regulation capacity indicates that sponge city facilities effectively optimize the habitat of organisms and mitigate the urban heat island effect. At the level of secondary indicators, the improvement of biodiversity reflects the city’s focus on ecological protection and the provision of suitable habitats for organisms through the construction of green roofs, rain gardens, and other facilities. The high level of storm waterlogging mitigation indicates that the city’s drainage system and sponge facilities work well in synergy, effectively reducing waterlogging and ensuring urban safety. However, the low score on the rate of green space for rainwater use indicates that further optimization is still needed in the integration of rainwater resource use and green space construction.
Comprehensive measurements were calculated and graded for the 11 sponge cities, and the results show that Xi’an Xixian New District is excellent, and Xinxing City and Xining City are good, indicating that they have significant results in ecological environment improvement, water resource management, and technological innovation. For example, Xi’an Xixian New Area synchronized rain gardens with the ecological restoration of the Wei River, which enhanced biodiversity and mitigated flooding from heavy rains, deeply integrating ecology and engineering construction. Qingyang City, on the other hand, was rated as poor and Yan’an City as worse, mainly due to poor soil erosion management, low socio-economic benefits, and urban construction that did not coordinate well with industrial development. Geographically, the Urumqi and Golmud regions have arid climates and high rates of integrated water resource utilization, but poor microclimate regulation. Pingliang and Yan’an are located on the Loess Plateau, with deficiencies in floodwater storage and soil water retention; water storage and ecological slope protection measures must be strengthened.
Significant differences emerge across cities on each indicator. Some cities have not performed well in terms of socio-economic benefits, with low indicators of land value appreciation and industrial development promotion, indicating that the process of urban construction has not driven the development of the local economy, which may be related to factors such as the small scale of construction and imperfect industrial policies. In terms of technology and management innovation, some cities have a better technology application rate and management policy innovation, which greatly enhance the construction effect. In conclusion, sponge city construction projects have achieved certain effects, but there are still some limitations. From the previous research results, the evaluation of sponge city construction projects only focuses on some specific aspects, which cannot be used to measure the overall performance of the project. In this paper, the DCS algorithm is used to optimize the projection tracing model to determine the objective weights, and the evaluation results are more in line with the reality, and the indicators are specifically analyzed to find out the problems in the construction process in time. For example, the biodiversity enhancement indicator is high, reflecting the city’s focus on ecological protection; the low score of the rainwater utilization rate indicates that the city has problems in the utilization of rainwater resources, and the city managers should increase the investment in rainwater utilization in future construction to promote the high-quality development of sponge city construction.

5. Discussion

This paper constructs a more comprehensive performance evaluation framework for sponge city construction with a more comprehensive index system. Previous studies always consider only a single domain index, which is too one-sided. This study has five dimensions, namely, ecological environment improvement, water resource management, water disaster defense, socio-economic benefits, and technology and management innovation, which can accurately identify the strengths and weaknesses in urban construction programs. For example, the indicator of biodiversity enhancement intuitively reflects the impact of sponge city construction on the ecosystem, which is conducive to guiding the city to strengthen ecological protection, while the indicator of land value appreciation allows managers to fully understand the economic potential that urban construction brings to related industries, so as to rationally allocate resources.
In terms of research methodology, this study combines the subjective judgment of the FAHP and the objective data of the projection tracing model when calculating the weights of indicators, and optimizes them with the help of game theory. When the FAHP is used alone, it is more subjective and may lead to weight bias; although the projection tracing model is based on the objective law of data, the indexes are difficult to quantify, and the combined weighting method makes up for these shortcomings. The AHP subjective assignment in the AHP-TOPSIS method is greatly influenced by the subjective factors of experts, and this study comprehensively considered the experience of experts and the key factors that are difficult to quantify, so as to make the evaluation results more reliable. Taking the biodiversity enhancement indicator as an example, the subjective weight is 0.0825, the objective weight is 0.0656, and the combined weight is 0.0694, which combines expert experience and data characteristics to more accurately reflect the importance of the indicator.
In terms of evaluation modeling, the traditional AHP-TOPSIS method may not accurately reflect the actual situation for fuzzy or uncertain data. In this paper, the gray target model based on the number of intervals is used to construct benefit-type and cost-type indicators, which can effectively deal with the interval characteristics of the indicator data and take into account the deviation in the sample value of the effect from the maximum sample value of the effect. In the case study, the model successfully determines that the Xi’an Xixian project is “excellent”, while it may be “good” under the AHP-TOPSIS method, which may be due to the fact that the indicator system of the AHP-TOPSIS method does not fully take into account the city’s outstanding performance in technological innovation, resulting in the evaluation of the city’s performance in technological innovation. The reason may be that the indicator system of the AHP-TOPSIS method does not fully consider the outstanding performance of the city in technological innovation, which leads to the low evaluation grade. Compared with the traditional model, this research method can more accurately portray the complexity of sponge city construction performance and provide a reliable decision-making basis for city managers.
However, this study also has certain limitations, and it is difficult to obtain data for some indicators. For example, soil quality improvement indicators need to detect soil porosity and permeability, which is complicated and costly, and may lead to bias in the sample data, affecting the accuracy of the evaluation results. In the evaluation model, the determination of positive and negative bull’s-eye interval values for indicators and the division of evaluation levels are subjectively influenced, which reduces the comparability of the evaluation results between cities. In addition, due to time and resource constraints, the types of sponge city construction projects covered in this study are not enough, and the universality will be affected to some extent. Based on the results of city evaluation, for cities with better ecological environment improvement, more resources will be invested in the field of social and economic benefits and technological innovation; policy makers can introduce relevant industrial policies to encourage the development of related industries, enhance the value of land, and drive the local economy; for cities with a low rate of rainwater-utilized green space, formulate some standard specifications for rainwater-utilized green space, increase permeable paving and green roofs, enhance the rainwater collection and utilization efficiency, and promote the integration of urban construction and rainwater utilization green space; urban planners should rationally plan the type and scale of sponge facilities based on the functional positioning and natural conditions of different regions.

6. Conclusions

This study constructed an indicator system containing 5 primary indicators and 15 secondary indicators, including indicators such as land value appreciation, application rate of new sponge technology, etc., which can comprehensively reflect the comprehensive benefits of the project and provide strong support for the evaluation of sponge city construction. Meanwhile, the FAHP, projection tracing model optimized by the differentiated creative search algorithm, and multi-objective gray target decision-making model based on the number of intervals are adopted to ensure the reliability of the evaluation results. Finally, 11 sponge cities are specifically analyzed by the interval number gray target decision-making model, and the results are as follows: Xixian New District of Xi’an City is “excellent”; Tianshui City, Xining City, and Xinxing City of Xinjiang City are “good”; Pingliang City, Lanzhou City, Golmud City, and Weinan City are “medium”; Urumqi and Yan’an are “poor”; and Qingyang is “poor”. According to the evaluation results, we found that the city has obvious results in water resource management and ecological environment improvement, such as biodiversity enhancement and storm waterlogging mitigation indicators, but there is an obvious shortage in the rainwater utilization of green space rate, which helps to optimize the construction plan and resource allocation promptly, and promotes the high-quality and sustainable development of sponge cities.
However, there are some shortcomings in this study. It is difficult to obtain data for some indicators, which affects the accuracy of the evaluation results; determining the positive and negative bull’s-eye interval values of the indicators and the evaluation level is subjectively influenced, and the evaluation results are comparable among cities; and the study fails to cover all types of sponge cities, and the adaptability is insufficient. In the future, the following aspects can be improved: optimize the indicator system by selecting the indicators with easy-to-access data; introduce machine learning in the evaluation model to reduce the subjective influence and improve the accuracy of the evaluation; and expand the scope of the case study to improve and enhance the adaptability of the evaluation framework, so as to provide stronger support for the construction of sponge cities.

Author Contributions

Conceptualization, L.L. and L.Y.; methodology, L.L.; software, L.L and L.Y.; validation, L.L., L.Y. and W.J.; formal analysis, L.L. and L.Y.; investigation, L.L. and W.J.; resources, L.L. and W.J.; data curation, L.L. and L.Y.; writing—original draft preparation, L.L. and W.J.; writing—review and editing, L.L. and L.Y.; visualization, L.L. and L.Y.; supervision, L.L.; project administration, L.L.; funding acquisition, L.L. and L.Y. All authors have read and agreed to the published version of the manuscript.

Funding

This research was funded by the General Special Scientific Research Program of Shaanxi Provincial Department of Education in 2022 (Natural Science Project), grant number 22JK0290.

Data Availability Statement

The data used to support the findings of this study are available from the corresponding author or first author upon request.

Conflicts of Interest

The authors declare no conflicts of interest.

References

  1. Deng, Y.M.; Deng, J.; Zhang, C. Sponge City and Water Environment Planning and Construction in Jibu District in Changde City. Sustainability 2023, 15, 444. [Google Scholar] [CrossRef]
  2. Wang, J.; Xue, F.; Jing, R.Y.; Lu, Q.H.; Huang, Y.L.; Sun, X.; Zhu, W.B. Regenerating Sponge City to Sponge Watershed through an Innovative Framework for Urban Water Resilience. Sustainability 2021, 13, 5358. [Google Scholar] [CrossRef]
  3. Qi, B.W.; Xu, P.L.; Wu, C.Z. Analysis of the Infiltration and Water Storage Performance of Recycled Brick Mix Aggregates in Sponge City Construction. Water 2023, 15, 363. [Google Scholar] [CrossRef]
  4. Zhou, W.Z.; Wang, Y.F.; Wang, X.; Gao, P.; Lin, C.Y. The Economic Value of Water Ecology in Sponge City Construction Based on a Ternary Interactive System. Int. J. Environ. Res. Public Health 2022, 19, 15844. [Google Scholar] [CrossRef]
  5. Wang, C.; Liu, J.; Lu, B.; Zhang, Y.; Ma, Z. Stiffness degradation and mechanical behavior of microfiber-modified high-toughness recycled aggregate concrete under constant load cycling. Eng. Fract. Mech. 2024, 312, 110608. [Google Scholar] [CrossRef]
  6. Ma, Z.; Wang, B.; Zhang, Z.; Zhang, Y.; Wang, C. New insights into the effects of silicate modulus, alkali content and modification on multi-properties of recycled brick powder-based geopolymer. J. Build. Eng. 2024, 97, 110989. [Google Scholar] [CrossRef]
  7. Wang, Y.T.; Liu, Z.; Wang, G.Q.; Xue, W.C. Cellular automata based framework for evaluating mitigation strategies of sponge city. Sci. Total Environ. 2021, 796, 148991. [Google Scholar] [CrossRef]
  8. Leng, L.Y.; Mao, X.H.; Jia, H.F.; Xu, T.; Chen, A.S.; Yin, D.K.; Fu, G.T. Performance assessment of coupled green-grey-blue systems for Sponge City construction. Sci. Total Environ. 2020, 728, 138608. [Google Scholar] [CrossRef]
  9. Ji, M.C.; Bai, X. Construction of the sponge city regulatory detailed planning index system based on the SWMM model. Environ. Technol. Innov. 2021, 23, 101645. [Google Scholar] [CrossRef]
  10. Shah, M.A.R.; Xu, J.; Carisi, F.; De Paola, F.; Di Sabatino, S.; Domeneghetti, A.; Gerundo, C.; Gonzalez-Ollauri, A.; Nadim, F.; Petruccelli, N.; et al. Quantifying the effects of nature-based solutions in reducing risks from hydrometeorological hazards: Examples from Europe. Int. J. Disaster Risk Reduct. 2023, 93, 103771. [Google Scholar] [CrossRef]
  11. Zahmatkesh, Z.; Burian, S.J.; Karamouz, M.; Tavakol-Davani, H.; Goharian, E. Low-Impact Development Practices to Mitigate Climate Change Effects on Urban Stormwater Runoff: Case Study of New York City. J. Irrig. Drain. Eng. 2015, 141, 04014043. [Google Scholar] [CrossRef]
  12. Liang, C.; Zhang, X.; Xia, J.; Xu, J.; She, D. The Effect of Sponge City Construction for Reducing Directly Connected Impervious Areas on Hydrological Responses at the Urban Catchment Scale. Water 2020, 12, 1163. [Google Scholar] [CrossRef]
  13. Zhao, Z.J.; Chen, J.; Han, S.L.; Ding, L.; Zhao, X.Q.; Liu, X.M.; Deng, H. A Study on Plant Selection for Low-Carbon Rain Gardens Based on an AHP-TOPSIS Model. Sustainability 2024, 16, 2097. [Google Scholar] [CrossRef]
  14. Wang, N.; Li, H.P.; Zhang, J.L.; Deng, J.X.; She, L. Research on Sustainable Evaluation Model of Sponge City Based on Emergy Analysis. Water 2023, 15, 32. [Google Scholar] [CrossRef]
  15. Liang, C.M.; Zhang, X.; Xu, J.; Pan, G.Y.; Wang, Y. An integrated framework to select resilient and sustainable sponge city design schemes for robust decision making. Ecol. Indic. 2020, 119, 106810. [Google Scholar] [CrossRef]
  16. Yu, Q.; Li, N.; Wang, J.; Wang, S. Comprehensive Performance Assessment for Sponge City Construction: A Case Study. Water 2023, 15, 4039. [Google Scholar] [CrossRef]
  17. Yao, Y.; Hu, C.; Liu, C.; Yang, F.; Ma, B.; Wu, Q.; Li, X.; Soomro, S.E.H. Comprehensive performance evaluation of stormwater management measures for sponge city construction: A case study in Gui’an New District, China. J. Flood Risk Manag. 2022, 15, e12834. [Google Scholar] [CrossRef]
  18. Zhao, B.; Du, Y.; Ren, L.; Wang, J. Preparation and performance of epoxy resin permeable bricks for sponge city construction. J. Appl. Polym. Sci. 2020, 137, 49008. [Google Scholar] [CrossRef]
  19. Yang, P.; Zhao, Z.-X.; Li, Z.-C.; Wang, Y.-H. Experimental study on long-term performance of new urban green space soil for sponge city construction. J. Urban For. Urban Green. 2021, 58, 126906. [Google Scholar] [CrossRef]
  20. Qian, L.; Feng, W.; Yang, Y.; Zhengce, H.; Mantao, L.; Yuntao, G. Comprehensive Performance Evaluation of LID Practices for the Sponge City Construction: A Case Study in Guangxi, China. J. Environ. Manag. 2021, 231, 10–20. [Google Scholar]
  21. Sun, J.; Cheshmehzangi, A.; Wang, S. Green Infrastructure Practice and a Sustainability Key Performance Indicators Framework for Neighbourhood-Level Construction of Sponge City Programme. J. Environ. Prot. 2020, 11, 82–109. [Google Scholar] [CrossRef]
  22. Li, J.; Jiang, Y.; Zhai, M.; Gao, J.; Yao, Y.; Li, Y. Construction and application of sponge city resilience evaluation system: A case study in Xi’an, China. Environ. Sci. Pollut. Res. 2023, 30, 62051–62066. [Google Scholar] [CrossRef] [PubMed]
  23. Zhao, Z.-T.; Cheng, H.-M.; Wang, S.; Liu, H.-Y.; Song, Z.-M.; Zhou, J.-H.; Pang, J.-W.; Bai, S.-W.; Yang, S.-S.; Ding, J.; et al. SCC-UEFAS, an urban-ecological-feature based assessment system for sponge city construction. Environ. Sci. Ecotechnol. 2022, 12, 100188. [Google Scholar] [CrossRef]
  24. Chang, H.S.; Su, Q. Research on constructing sponge city indicator and decision evaluation model with fuzzy multiple criteria method. Water Environ. Res. A Res. Publ. Water Environ. Fed. 2020, 92, 1910–1921. [Google Scholar] [CrossRef] [PubMed]
  25. Thu Thuy, N.; Huu Hao, N.; Guo, W.; Wang, X.C. A new model framework for sponge city implementation: Emerging challenges and future developments. J. Environ. Manag. 2020, 253, 109689. [Google Scholar] [CrossRef]
  26. Ma, Y.; Jiang, Y. Ecosystem-based adaptation to address urbanization and climate change challenges: The case of China’s sponge city initiative. Clim. Policy 2023, 23, 268–284. [Google Scholar] [CrossRef]
  27. Wang, J.; Zhou, X.; Wang, S.; Chen, L.; Shen, Z. Simulation and Comprehensive Evaluation of the Multidimensional Environmental Benefits of Sponge Cities. Water 2023, 15, 2590. [Google Scholar] [CrossRef]
  28. Koester, S.; Hadler, G.; Opitz, L.; Thoms, A. Using Stormwater in a Sponge City as a New Wing of Urban Water Supply-A Case Study. Water 2023, 15, 1893. [Google Scholar] [CrossRef]
  29. He, B.-J.; Zhu, J.; Zhao, D.-X.; Gou, Z.-H.; Qi, J.-D.; Wang, J. Co-benefits approach: Opportunities for implementing sponge city and urban heat island mitigation. Land Use Policy 2019, 86, 147–157. [Google Scholar] [CrossRef]
  30. Li, S.; Wang, Z.; Wu, X.; Zeng, Z.; Shen, P.; Lai, C. A novel spatial optimization approach for the cost-effectiveness improvement of LID practices based on SWMM-FTC. J. Environ. Manag. 2022, 307, 114574. [Google Scholar] [CrossRef]
  31. Zheng, Z.; Zhang, X.; Qiao, W.; Zhao, R. Emergency Response to Urban Flooding: An Assessment of Mitigation Performance and Cost-Effectiveness in Sponge City Construction. Water Resour. Manag. 2025, 39, 1993–2007. [Google Scholar] [CrossRef]
  32. Li, C.; Zhang, Y.; Wang, C.; Shen, R.; Gisen, J.I.A.; Mu, J. Stormwater and flood simulation of sponge city and LID mitigation benefit assessment. Environ. Sci. Pollut. Res. 2023. online ahead of print. [Google Scholar] [CrossRef]
  33. Hou, X.; Guo, H.; Wang, F.; Li, M.; Xue, X.; Liu, X.; Zeng, S. Is the sponge city construction sufficiently adaptable for the future stormwater management under climate change? J. Hydrol. 2020, 588, 125055. [Google Scholar] [CrossRef]
  34. Jia, H.; Wang, Z.; Zhen, X.; Clar, M.; Yu, S.L. China’s Sponge City construction: A discussion on technical approaches. Front. Environ. Sci. Eng. 2017, 11, 18. [Google Scholar] [CrossRef]
  35. Zareba, A.; Krzeminska, A.; Adynkiewicz-Piragas, M.; Widawski, K.; van der Horst, D.; Grijalva, F.; Monreal, R. Water Oriented City-A ‘5 Scales’ System of Blue and Green Infrastructure in Sponge Cities Supporting the Retention of the Urban Fabric. Water 2022, 14, 4070. [Google Scholar] [CrossRef]
  36. Yang, J.; Kumar, D.I.M.; Pyrgou, A.; Chong, A.; Santamouris, M.; Kolokotsa, D.; Lee, S.E. Green and cool roofs’ urban heat island mitigation potential in tropical climate. Sol. Energy 2018, 173, 597–609. [Google Scholar] [CrossRef]
  37. Deng, M.M. Evaluation method for groundwater pollution treatment process based on fuzzy analytic hierarchy process. Int. J. Environ. Technol. Manag. 2024, 27, 444–460. [Google Scholar] [CrossRef]
  38. Zhuo, P.S.; Wen, S.J.; Zhang, Q.; Luo, J.L.; Jia, L. Construction Safety Risk Assessment Based on the Projection Pursuit Model. J. Nonlinear Convex Anal. 2023, 24, 1629–1639. [Google Scholar]
  39. Duankhan, P.; Sunat, K.; Chiewchanwattana, S.; Nasa-ngium, P. The Differentiated Creative Search (DCS): Leveraging differentiated knowledge-acquisition and creative realism to address complex optimization problems. Expert Syst. Appl. 2024, 252, 123734. [Google Scholar] [CrossRef]
  40. Feng, Y.K.; Lang, K.; Zhang, Y.J.; Xing, S.W. Optimal Selection Model for Life Emergency Rescue Ship Based on Game Theory and VIKOR Method. In Proceedings of the 6th International Conference on Electromechanical Control Technology and Transportation (ICECTT), Chongqing, China, 14–16 May 2021. [Google Scholar]
  41. Huang, B.; Miao, J.J.; Li, Q.S. A Vetoed Multi-objective Grey Target Decision Model with Application in Supplier Choice. J. Grey Syst. 2022, 34, 15–27. [Google Scholar]
  42. Tang, T.N.; Wang, S.; Wang, Z.Y.; Chen, Y.X.; Wen, Y. Data-Driven Comprehensive Evaluation Model Based on the Radar Chart for the Operating State of XLPE Cables. In Proceedings of the 4th Asia Energy and Electrical Engineering Symposium (AEEES), Chengdu, China, 25–28 March 2022; IEEE: Piscataway, NJ, USA; pp. 644–649. [Google Scholar]
Figure 1. Flow chart of indicator establishment.
Buildings 15 01814 g001
Figure 2. Flow chart of the performance evaluation model for sponge city construction.
Buildings 15 01814 g002
Figure 3. Objective weights of the primary indicators.
Buildings 15 01814 g003
Table 1. Performance indicator system for sponge city construction.
Primary IndicatorsSecondary IndicatorsReferences
Improvement   of   ecological   environment ,   A 1 Biodiversity   enhancement ,   A 11 [25,26,27]
Soil   quality   improvement ,   A 12 [25,26,27]
Microclimate   regulation   capability ,   A 13 [25,26,27]
Water   resource   management ,   A 2 Rainwater   resource   reserve ,   A 21 [27,28,29]
Proportion   of   comprehensive   utilization   of   water   resources ,   A 22 [27,28,29]
Rainwater   utilization   green   space   ratio ,   A 23 [27,28,29]
Water   disaster   prevention ,   A 3 Reduction   degree   of   rainstorm   waterlogging ,   A 31 [30,31,32]
Enhanced   flood   regulation   and   storage   capacity ,   A 32 [30,31,32]
Drainage   system   pressure   relief ,   A 33 [30,31,32]
Social   and   economic   benefits ,   A 4 Land   value   appreciation ,   A 41 [25,33,34]
Industrial   development   promotion ,   A 42 [25,33,34]
Public   health   protection ,   A 43 [25,33,34]
Technology   and   management   innovation ,   A 5 Application   rate   of   new   sponge   technology ,   A 51 [16,35]
Intelligent   management   of   sponge   facilities ,   A 52 [16,35]
Management   policy   innovation   and   implementation   effectiveness ,   A 53 [16,35]
Table 2. Relative importance scale values.
ScaleDefinition
0.5 a i   is   equally   as   important   as   a j
0.6 a i   is   slightly   more   important   than   a j
0.7 a i   is   significantly   more   important   than   a j
0.8 a i   is   remarkably   more   important   than   a j
0.9 a i   is   extremely   more   important   than   a j
0.1, 0.2, 0.3, 0.4 If   the   importance   of   element   i   to   element   j   is   f i j ,   then   the   importance   of   element   j   to   element   i   is   f j i = 1 f i j
Table 3. Fuzzy complementary matrix A .
Fuzzy Complementary Matrix A 1 A 2 A 3 A 4 A 5
A 1 0.50.550.5250.4750.575
A 2 0.450.50.4750.4250.525
A 3 0.4750.5250.50.450.55
A 4 0.5250.5750.550.50.6
A 5 0.4250.4750.450.40.5
Table 4. Subjective weights of secondary indicators.
Secondary Indicators Weight   W 1
Biodiversity   enhancement ,   A 11 0.0825
Soil   quality   improvement ,   A 12 0.0584
Microclimate   regulation   capability ,   A 13 0.0653
Rainwater   resource   reserve ,   A 21 0.0597
Proportion   of   comprehensive   utilization   of   water   resources ,   A 22 0.0743
Rainwater   utilization   green   space   ratio ,   A 23 0.0597
Reduction   degree   of   rainstorm   waterlogging ,   A 31 0.0783
Enhanced   flood   regulation   and   storage   capacity ,   A 32 0.0633
Drainage   system   pressure   relief ,   A 33 0.0583
Land   value   appreciation ,   A 41 0.0638
Promoting   industrial   development ,   A 42 0.0737
Public   health   protection ,   A 43 0.0751
Application   rate   of   new   sponge   technology ,   A 51 0.0719
Intelligent   management   of   sponge   facilities ,   A 52 0.0609
Management   policy   innovation   and   implementation   effectiveness ,   A 53 0.0547
Table 5. Objective weights of secondary indicators.
Secondary Indicators Weight   W 2
Biodiversity   enhancement ,   A 11 0.0656
Soil   quality   improvement ,   A 12 0.0593
Microclimate   regulation   capability ,   A 13 0.0802
Rainwater   resource   reserve ,   A 21 0.0749
Proportion   of   comprehensive   utilization   of   water   resources ,   A 22 0.0865
Rainwater   utilization   green   space   ratio ,   A 23 0.0497
Reduction   degree   of   rainstorm   waterlogging ,   A 31 0.0779
Enhanced   flood   regulation   and   storage   capacity ,   A 32 0.0521
Drainage   system   pressure   relief ,   A 33 0.0522
Land   value   appreciation ,   A 41 0.0615
Promoting   industrial   development ,   A 42 0.0568
Public   health   protection ,   A 43 0.083
Application   rate   of   new   sponge   technology ,   A 51 0.0678
Intelligent   management   of   sponge   facilities ,   A 52 0.0569
Management   policy   innovation   and   implementation   effectiveness ,   A 53 0.0756
Table 6. Subjective–objective weights and combined weight values of each indicator.
IndicatorsWeights of FAHPIndicatorsSubjective Indicator WeightsObjective WeightsGame Theory-Integrated Weights
A 1 0.2063 A 11 0.08250.06560.0694
A 12 0.05840.05930.0591
A 13 0.06530.08020.0768
A 2 0.1937 A 21 0.05970.07490.0715
A 22 0.07430.08650.0837
A 23 0.05970.04970.0520
A 3 0.2000 A 31 0.07830.07790.0780
A 32 0.06330.05210.0546
A 33 0.05830.05220.0536
A 4 0.2125 A 41 0.06380.06150.0620
A 42 0.07370.05680.0606
A 43 0.07510.0830.0751
A 5 0.1875 A 51 0.07190.06780.0687
A 52 0.06090.05690.0578
A 53 0.05470.07560.0771
Table 7. Data table for each sponge city indicator.
IndexTianshuiUrumqiPingliangXiningLanzhouGolmud
A 11 (0.82, 0.92)(0.84, 0.94)(0.91, 1.0)(0.81, 0.91)(0.92, 0.97)(0.83, 0.93)
A 12 (0.78, 0.88)(0.86, 0.96)(0.87, 0.97)(0.79, 0.89)(0.74, 0.84)(0.91, 0.96)
A 13 (0.66, 0.76)(0.72, 0.82)(0.61, 0.71)(0.76, 0.86)(0.63, 0.73)(0.71, 0.81)
A 21 (0.62, 0.72)(0.67, 0.77)(0.73, 0.83)(0.64, 0.74)(0.71, 0.81)(0.61, 0.71)
A 22 (0.44, 0.54)(0.52, 0.62)(0.42, 0.52)(0.56, 0.66)(0.43, 0.53)(0.51, 0.61)
A 23 (0.41, 0.51)(0.47, 0.57)(0.53, 0.63)(0.43, 0.53)(0.51, 0.61)(0.42, 0.52)
A 31 (0.26, 0.36)(0.32, 0.42)(0.21, 0.31)(0.34, 0.44)(0.23, 0.33)(0.31, 0.41)
A 32 (0.22, 0.32)(0.27, 0.37)(0.33, 0.43)(0.24, 0.34)(0.31, 0.41)(0.22, 0.32)
A 33 (0.06, 0.16)(0.12, 0.22)(0.01, 0.11)(0.14, 0.24)(0.03, 0.13)(0.11, 0.21)
A 41 (0.02, 0.12)(0.07, 0.17)(0.13, 0.23)(0.04, 0.14)(0.11, 0.21)(0.02, 0.12)
A 42 (0.71, 0.81)(0.62, 0.72)(0.51, 0.61)(0.61, 0.71)(0.56, 0.66)(0.61, 0.71)
A 43 (0.67, 0.77)(0.57, 0.67)(0.63, 0.73)(0.72, 0.82)(0.66, 0.76)(0.71, 0.81)
A 51 (0.81, 0.91)(0.76, 0.86)(0.82, 0.92)(0.74, 0.84)(0.91, 1.0)(0.86, 0.96)
A 52 (0.21, 0.31)(0.32, 0.42)(0.27, 0.37)(0.31, 0.41)(0.22, 0.32)(0.36, 0.46)
A 53 (0.01, 0.11)(0.12, 0.22)(0.06, 0.16)(0.03, 0.13)(0.11, 0.21)(0.07, 0.17)
IndexYan’anWeinanNovaQingyangWestern Hamlet-
A 11 (0.86, 0.96)(0.93, 1.0)(0.85, 0.95)(0.87, 0.97)(0.81, 0.93)-
A 12 (0.77, 0.87)(0.81, 0.91)(0.84, 0.94)(0.73, 0.83)(0.78, 0.89)-
A 13 (0.67, 0.77)(0.73, 0.83)(0.62, 0.72)(0.75, 0.85)(0.69, 0.79)-
A 21 (0.72, 0.82)(0.66, 0.76)(0.68, 0.78)(0.63, 0.73)(0.63, 0.74)-
A 22 (0.47, 0.57)(0.53, 0.63)(0.41, 0.51)(0.55, 0.65)(0.45, 0.54)-
A 23 (0.52, 0.62)(0.46, 0.56)(0.48, 0.58)(0.44, 0.54)(0.43, 0.52)-
A 31 (0.27, 0.37)(0.33, 0.43)(0.21, 0.31)(0.35, 0.45)(0.28, 0.35)-
A 32 (0.32, 0.42)(0.26, 0.36)(0.28, 0.38)(0.31, 0.41)(0.23, 0.30)-
A 33 (0.07, 0.17)(0.13, 0.23)(0.02, 0.12)(0.16, 0.26)(0.08, 0.14)-
A 41 (0.12, 0.22)(0.05, 0.15)(0.08, 0.18)(0.10, 0.20)(0.13, 0.23)-
A 42 (0.42, 0.52)(0.57, 0.67)(0.53, 0.63)(0.63, 0.73)(0.71, 0.81)-
A 43 (0.62, 0.72)(0.61, 0.71)(0.56, 0.66)(0.73, 0.83)(0.73, 083)-
A 51 (0.92, 0.97)(0.83, 0.93)(0.77, 0.87)(0.93, 1.0)(0.93, 1.0)-
A 52 (0.23, 0.33)(0.24, 0.34)(0.33, 0.43)(0.28, 0.38)(0.36, 0.46)-
A 53 (0.13, 0.23)(0.02, 0.12)(0.14, 0.24)(0.04, 0.14)(0.14, 0.24)-
Table 8. Evaluation program data table.
Indicators/ProgramsProgram IProgram IIProgram IIIProgram IVProgram VPending
A 11 (0.85, 0.95)(0.63, 0.75)(0.42, 0.55)(0.22, 0.36)(0.05, 0.15)-
A 12 (0.82, 0.92)(0.60, 0.73)(0.45, 0.58)(0.24, 0.38)(0.04, 0.20)-
A 13 (0.86, 0.96)(0.68, 0.78)(0.47, 0.57)(0.27, 0.31)(0.08, 0.18)-
A 21 (0.82, 0.92)(0.63, 0.73)(0.48, 0.54)(0.26, 0.34)(0.04, 0.15)-
A 22 (0.83, 0.97)(0.69, 0.78)(0.43, 0.52)(0.21, 0.39)(0.09, 0.13)-
A 23 (0.81, 0.93)(0.65, 0.80)(0.48, 0.51)(0.24, 0.37)(0.03, 0.16)-
A 31 (0.85, 0.95)(0.67, 0.77)(0.47, 0.59)(0.23, 0.34)(0.07, 0.17)-
A 32 (0.85, 0.96)(0.67, 0.79)(0.43, 0.60)(0.24, 0.32)(0.01, 0.15)-
A 33 (0.88, 0.90)(0.64, 0.73)(0.40, 0.58)(0.22, 0.35)(0.10, 0.14)-
A 41 (0.89, 0.93)(0.65, 0.77)(0.42, 0.57)(0.26, 0.33)(0.07, 0.16)-
A 42 (0.86, 0.96)(0.62, 0.72)(0.46, 0.59)(0.28, 0.38)(0.04, 0.12)-
A 43 (0.85, 0.95)(0.66, 0.76)(0.48, 0.54)(0.30, 0.36)(0.09, 0.11)-
A 51 (0.87, 1.0)(0.62, 0.73)(0.49, 0.53)(0.28, 0.35)(0.06, 0.13)-
A 52 (0.83, 0.96)(0.69, 0.73)(0.47, 0.50)(0.27, 0.37)(0.08, 0.14)-
A 53 (0.84, 0.98)(0.65, 0.72)(0.48, 0.58)(0.29, 0.40)(0.03, 0.19)-
Table 9. Positive and negative bull’s-eye interval values of each secondary indicator.
IndicatorsPositive Bull’s-Eye Interval Value,  y k + ~ Negative Bull’s-Eye Interval Value,  y k ~
A 11 [0.93, 1.00][0.81, 0.92]
A 12 [0.91, 0.97][0.73, 0.84]
A 13 [0.76, 0.86][0.61, 0.71]
A 21 [0.73, 0.83][0.61, 0.71]
A 22 [0.56, 0.66][0.41, 0.51]
A 23 [0.53, 0.63][0.10, 0.51]
A 31 [0.35, 0.45][0.23, 0.31]
A 32 [0.33, 0.43][0.22, 0.32]
A 33 [0.16, 0.26][0.01, 0.11]
A 41 [0.13, 0.23][0.02, 0.12]
A 42 [0.71, 0.81][0.42, 0.81]
A 43 [0.73, 0.83][0.56, 0.83]
A 51 [0.93, 1.00][0.74, 1.00]
A 52 [0.36, 0.46][0.21, 0.46]
A 53 [0.14, 0.24][0.01, 0.24]
Table 10. Positive and negative bull’s-eye distances and comprehensive bull’s-eye distances of the object to be evaluated.
Indicators d k j + d k j d k j
A 11 5.0970.710.93
A 12 4.6310.000.68
A 13 7.146.250.47
A 21 5.2619.610.79
A 22 4.3414.140.77
A 23 4.762.140.31
A 31 5.7911.040.66
A 32 4.3131.620.88
A 33 4.909.280.65
A 41 5.0050.000.91
A 42 31.622.280.07
A 43 14.144.860.26
A 51 4.316.060.58
A 52 3.705.000.57
A 53 5.006.770.58
Table 11. Sorting table based on interval number gray target models.
Evaluation ProgramIntegrated MeasurementArrange in Order
Program I0.9521
Program II0.7832
Tianshui0.6523
Program III0.4344
Program IV0.2695
Program V0.1556
Table 12. Sorting table based on interval number gray target models.
Evaluation ProgramIntegrated MeasurementArrange in Order
Program I0.9521
Program II0.7832
Program III0.4343
Urumqi0.3904
Program IV0.2695
Program V0.1556
Table 13. Sorting table based on interval number gray target models.
Evaluation ProgramIntegrated MeasurementArrange in Order
Program I0.9521
Program II0.7832
Pingliang0.4803
Program III0.4344
Program IV0.2695
Program V0.1556
Table 14. Sorting table based on interval number gray target models.
Evaluation ProgramIntegrated MeasurementArrange in Order
Program I0.9521
Program II0.7832
Xining0.7813
Program III0.4344
Program IV0.2695
Program V0.1556
Table 15. Sorting table based on interval number gray target models.
Evaluation ProgramIntegrated MeasurementArrange in Order
Program I0.9521
Program II0.7832
Lanzhou0.4803
Program III0.4344
Program IV0.2695
Program V0.1556
Table 16. Sorting table based on interval number gray target models.
Evaluation ProgramIntegrated MeasurementArrange in Order
Program I0.9521
Program II0.7832
Program III0.4343
Golmud0.4204
Program IV0.2695
Program V0.1556
Table 17. Sorting table based on interval number gray target models.
Evaluation ProgramIntegrated MeasurementArrange in Order
Program I0.9521
Program II0.7832
Program III0.4343
Yan’an0.3964
Program IV0.2695
Program V0.1556
Table 18. Sorting table based on interval number gray target models.
Evaluation ProgramIntegrated MeasurementArrange in Order
Program I0.9521
Program II0.7832
Program III0.4343
Weinan0.4204
Program IV0.2695
Program V0.1556
Table 19. Sorting table based on interval number gray target models.
Evaluation ProgramIntegrated MeasurementArrange in Order
Program I0.9521
Program II0.7832
Nova0.6483
Program III0.4344
Program IV0.2695
Program V0.1556
Table 20. Sorting table based on interval number gray target models.
Evaluation ProgramIntegrated MeasurementArrange in Order
Program I0.9521
Program II0.7832
Program III0.4343
Program IV0.2694
Qingyang0.1565
Program V0.1556
Table 21. Sorting table based on interval number gray target models.
Evaluation ProgramIntegrated MeasurementArrange in Order
Program I0.9521
Western Hamlet0.8452
Program II0.7833
Program III0.4344
Program IV0.2695
Program V0.1556
Disclaimer/Publisher’s Note: The statements, opinions and data contained in all publications are solely those of the individual author(s) and contributor(s) and not of MDPI and/or the editor(s). MDPI and/or the editor(s) disclaim responsibility for any injury to people or property resulting from any ideas, methods, instructions or products referred to in the content.

