Article

Research on Rheological Behavior and Strength Characteristics of Cement-Based Grouting Materials

by
Xuewei Liu
1,2,
Hao Qu
1,2,
Bin Liu
1,
Yuan Zhou
1,
Jinlan Li
2,*,
Wei Deng
1,2 and
Weilong Tao
1,2
1
State Key Laboratory of Geomechanics and Geotechnical Engineering Safety, Institute of Rock and Soil Mechanics, Chinese Academy of Sciences, Wuhan 430071, China
2
School of Civil Engineering, Architecture and Environment, Hubei University of Technology, Wuhan 430068, China
*
Author to whom correspondence should be addressed.
Buildings 2025, 15(11), 1796; https://doi.org/10.3390/buildings15111796
Submission received: 3 April 2025 / Revised: 15 May 2025 / Accepted: 22 May 2025 / Published: 23 May 2025
(This article belongs to the Special Issue Trends and Prospects in Cementitious Material)

Abstract

:
The mechanical properties of grouting materials and their cured grouts significantly impact the reinforcement effectiveness in deep coal mine roadways. This study employed shear rheology tests of slurry, structural tests, NMR (nuclear magnetic resonance), and uniaxial compression tests to comparatively analyze the mechanical characteristics of a composite cement-based grouting material (HGC), ordinary Portland cement (OPC), and sulfated aluminum cement (SAC) slurry and their cured grouts. The HGC (High-performance Grouting Composite) slurry is formulated with 15.75% sulfated aluminum cement (SAC), 54.25% ordinary Portland cement (OPC), 10% fly ash, and 20% mineral powder, achieving a water/cement ratio of 0.26. The results indicate that HGC slurry more closely follows power-law flow characteristics, while OPC and SAC slurries fit better with the Bingham model. The structural recovery time for HGC slurry after high-strain disturbances is 52 s, significantly lower than the 312 s for OPC and 121 s for SAC, indicating that HGC can quickly produce hydration products that re-bond the flocculated structure. NMR T2 spectra show that HGC cured grouts have the lowest porosity, predominantly featuring inter-nanopores, whereas OPC and SAC have more super-nanopores. Uniaxial compression tests show that the uniaxial compressive strength of HGC, SAC, and OPC samples at various curing ages gradually decreases. Compared to traditional cementitious materials, HGC exhibits a rapid increase in uniaxial compressive strength within the first seven days, with an increase rate of approximately 77.97%. Finally, the relationship between micropore distribution and strength is analyzed, and the micro-mechanisms underlying the strength differences of different grouting materials are discussed. This study aids in developing a comparative analysis system of mechanical properties for deep surrounding rock grouting materials, providing a reference for selecting grouting materials for various engineering fractured rock masses.

1. Introduction

The presence of numerous discontinuous joints within underground rock masses leads to structural discontinuity and inhomogeneity, adversely affecting mechanical properties and overall surrounding rock stability [1]. Grouting technology, widely employed in underground engineering applications including tunnels, subways, and roadways, enhances structural safety by injecting grouts into fractures to form integrated rock–grout composites [2,3].
While grouting equipment and technologies have advanced significantly, theoretical and material research progress remains comparatively limited [4]. Current coal mine roadway grouting primarily utilizes ordinary Portland cement and sulfoaluminate cement. Recent material development studies include the following: Li et al. [5] comparing slag–fly ash (SF)-, graphene oxide (GO)-, and nano-silica sol (NS)-modified grouts, finding that NS grouts possessed the lowest density with optimal flowability, GO grouts showed superior stability under reduced injection pressure, and SF grouts exhibited minimal bleeding. Zhang et al. [6] investigated ultrafine sulfoaluminate systems with anhydrite + quicklime versus clinker formulations, demonstrating that quicklime accelerates setting via ettringite/aluminum hydroxide formation while hydration product density governs strength. Zhang et al. [7] developed ultrafine siliceous self-stressing grouts, enhancing grout–rock interfacial bonding through homogeneous crystal distribution. Our team [8] proposed deep coal stratum-adapted low-water/cement-ratio expansive cement grouts via systematic experimentation. Current grouting materials for deep mines primarily include chemical/cement-based types with context-dependent advantages, necessitating comprehensive evaluation of fluid phase parameters (bleeding, thixotropy, and flowability) and cured phase characteristics (pore structure and compressive strength) [9,10].
Grout rheology research focuses on yield stress, time-dependent viscosity, and flow indices. Yu et al. [11] developed hybrid grouts combining micronized fly ash, nano-CaCO3, ultrafine cement, and water reducers, showing that fly ash enhances flowability while nano-CaCO3 improves strength, with viscosity evolution exhibiting stabilization/growth phases. Liu et al. [12] demonstrated that pyrophyllite/PVA/fly ash-modified grouts follow power-law bleeding reduction. Zhang et al. [13] revealed that ultrafine cement fineness decreases water/cement ratio sensitivity while improving stability despite reduced flowability. Liu et al. [14] systematically proved ultrafine cement’s injectability superiority over conventional cement. Jun et al. [15] identified silica fume’s role in controlling SAC paste expansion. Xu et al. [16] characterized viscosity-dependent grout penetration in fractured aquifers, while Zhang et al. [17] developed testing platforms, showing that modified grouts enhance hard–soft interface consolidation though efficacy decreases in weak strata. Zhang et al. [18] investigated silicate modulus (Ms.) and water/cement ratio effects on alkali-activated slag concrete rheology. Li et al. [19] studied nano-SiO2’s rheological impacts on cement paste structural build-up.
Mechanical performance studies include the following: Yang [20] combined NMR/MIP to analyze white cement mortar pore evolution, validating Kozeny–Carman permeability models while highlighting NMR’s drying artifact avoidance. Li et al. [21], Liang et al. [22], and Zhou et al. [23] demonstrated that curing age exponentially suppresses crack propagation via energy dissipation modulation, with w/c and water reducers critically influencing densification. Zhao et al. [24] quantified mortar property variations under mix designs, while Wang et al. [25] developed epoxy-modified repair materials. Liu et al. [26] employed triaxial unloading tests to decode energy evolution in cement grouts.
Existing studies confirm that low-w/c expansive cement grouts adapt well to deep high-stress environments through slag/fly ash-enhanced fluidity, silica fume-controlled expansion, and quicklime-accelerated setting. However, current research predominantly examines isolated performance metrics, lacking systematic rheological mechanical correlations and microstructural mechanical relationships, particularly regarding pore architecture impacts. Critical knowledge gaps remain in thixotropic recovery during flow transitions and time-dependent viscosity evolution under dynamic injection.
This study systematically investigates our research group’s cement-based composite grout alongside conventional OPC and SAC through shear rheology, structural performance, NMR, and uniaxial compression tests. This work establishes a comparative framework for evaluating grout mechanical properties in fractured rock masses, providing material selection references for diverse geological grouting applications.

2. Methods and Materials
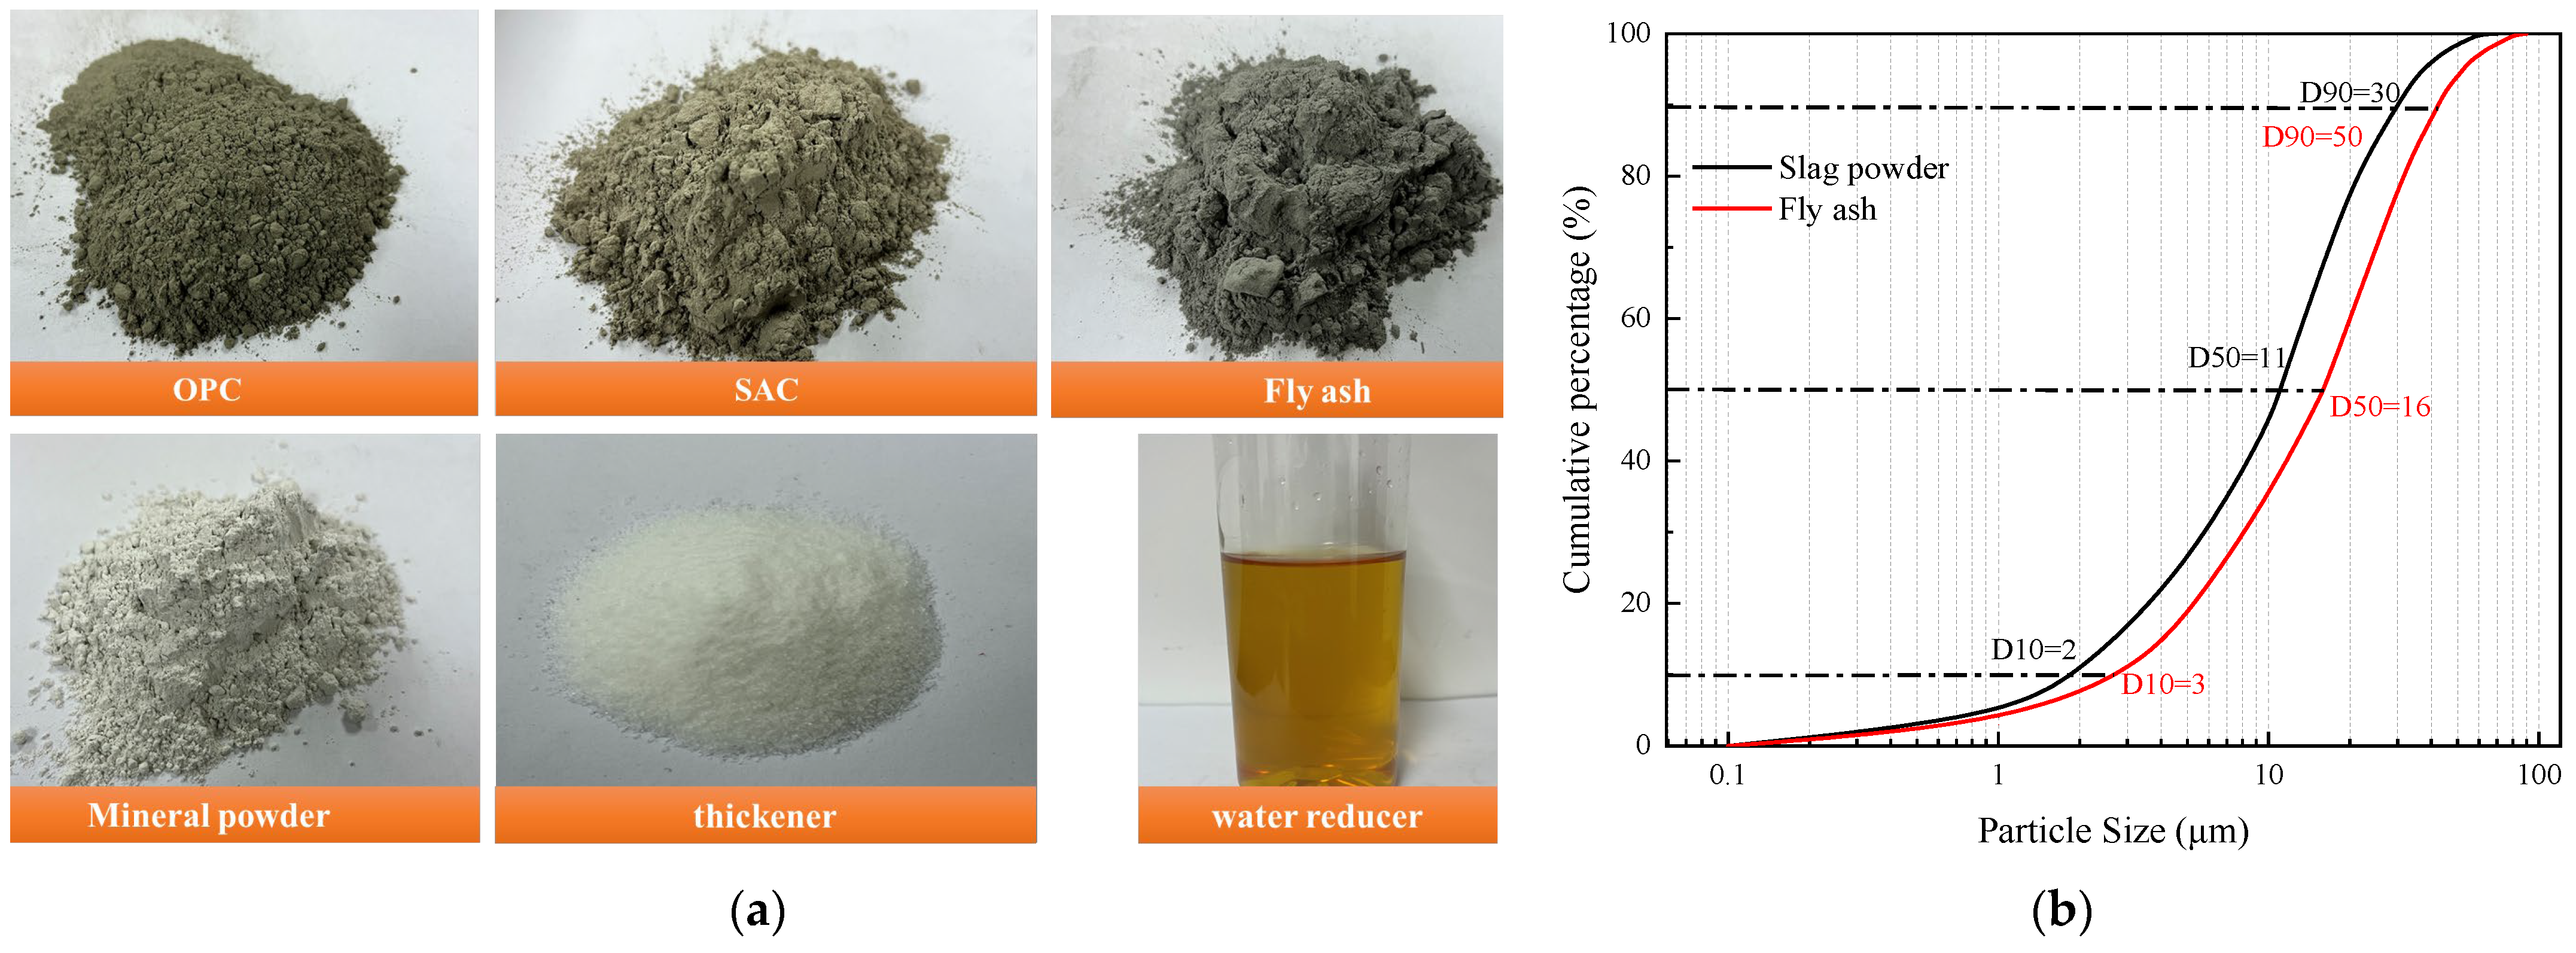
2.1. Test Material

The composite grout (HGC) is composed of ordinary Portland cement (OPC), sulfated aluminum cement (SAC), fly ash, mineral powder, water reducer, and thickener (Figure 1). For comparative analysis of physico-mechanical properties, control groups were established using neat pastes of traditional OPC and SAC. The material composition of HGC is detailed in Table 1.
(1)
Ordinary Portland cement (OPC)
Ordinary Portland cement is characterized by fast setting and hardening speed, high early strength, and a dense cement stone after hardening; the disadvantage is that the cement stone contains a large amount of calcium hydroxide and hydrated calcium aluminate, which is susceptible to corrosion by acids and salts. This paper selects the standard 42.5 ordinary silicate cement; the main performance indicators and chemical composition are shown in Table 2 and Table 3.
(2)
Sulfated aluminum cement (SAC)
SAC contains fast-hydration-reaction substances, which means that the advantages of SAC are high early strength, continuous growth of strength in the later period, and fast setting time. The test used grade 42.5 SAC; the main performance indicators and chemical composition are shown in Table 2 and Table 3.
(3)
Fly ash
Fly ash is able to react chemically with alkalis or sulfate under the action of water to form stable compounds with a cementing effect, and fly ash incorporated into concrete can increase the strength of concrete and improve the durability and other properties of concrete [27]. The chemical compositions and main performance indexes are shown in Table 3 and Table 4.
(4)
Mineral powder
Mineral powder can improve or enhance the comprehensive performance of concrete, increase the compactness and strength of concrete, promote the formation of cement hydration products, and improve the durability of concrete [28]. The chemical compositions and main performance indexes are shown in Table 3 and Table 4.

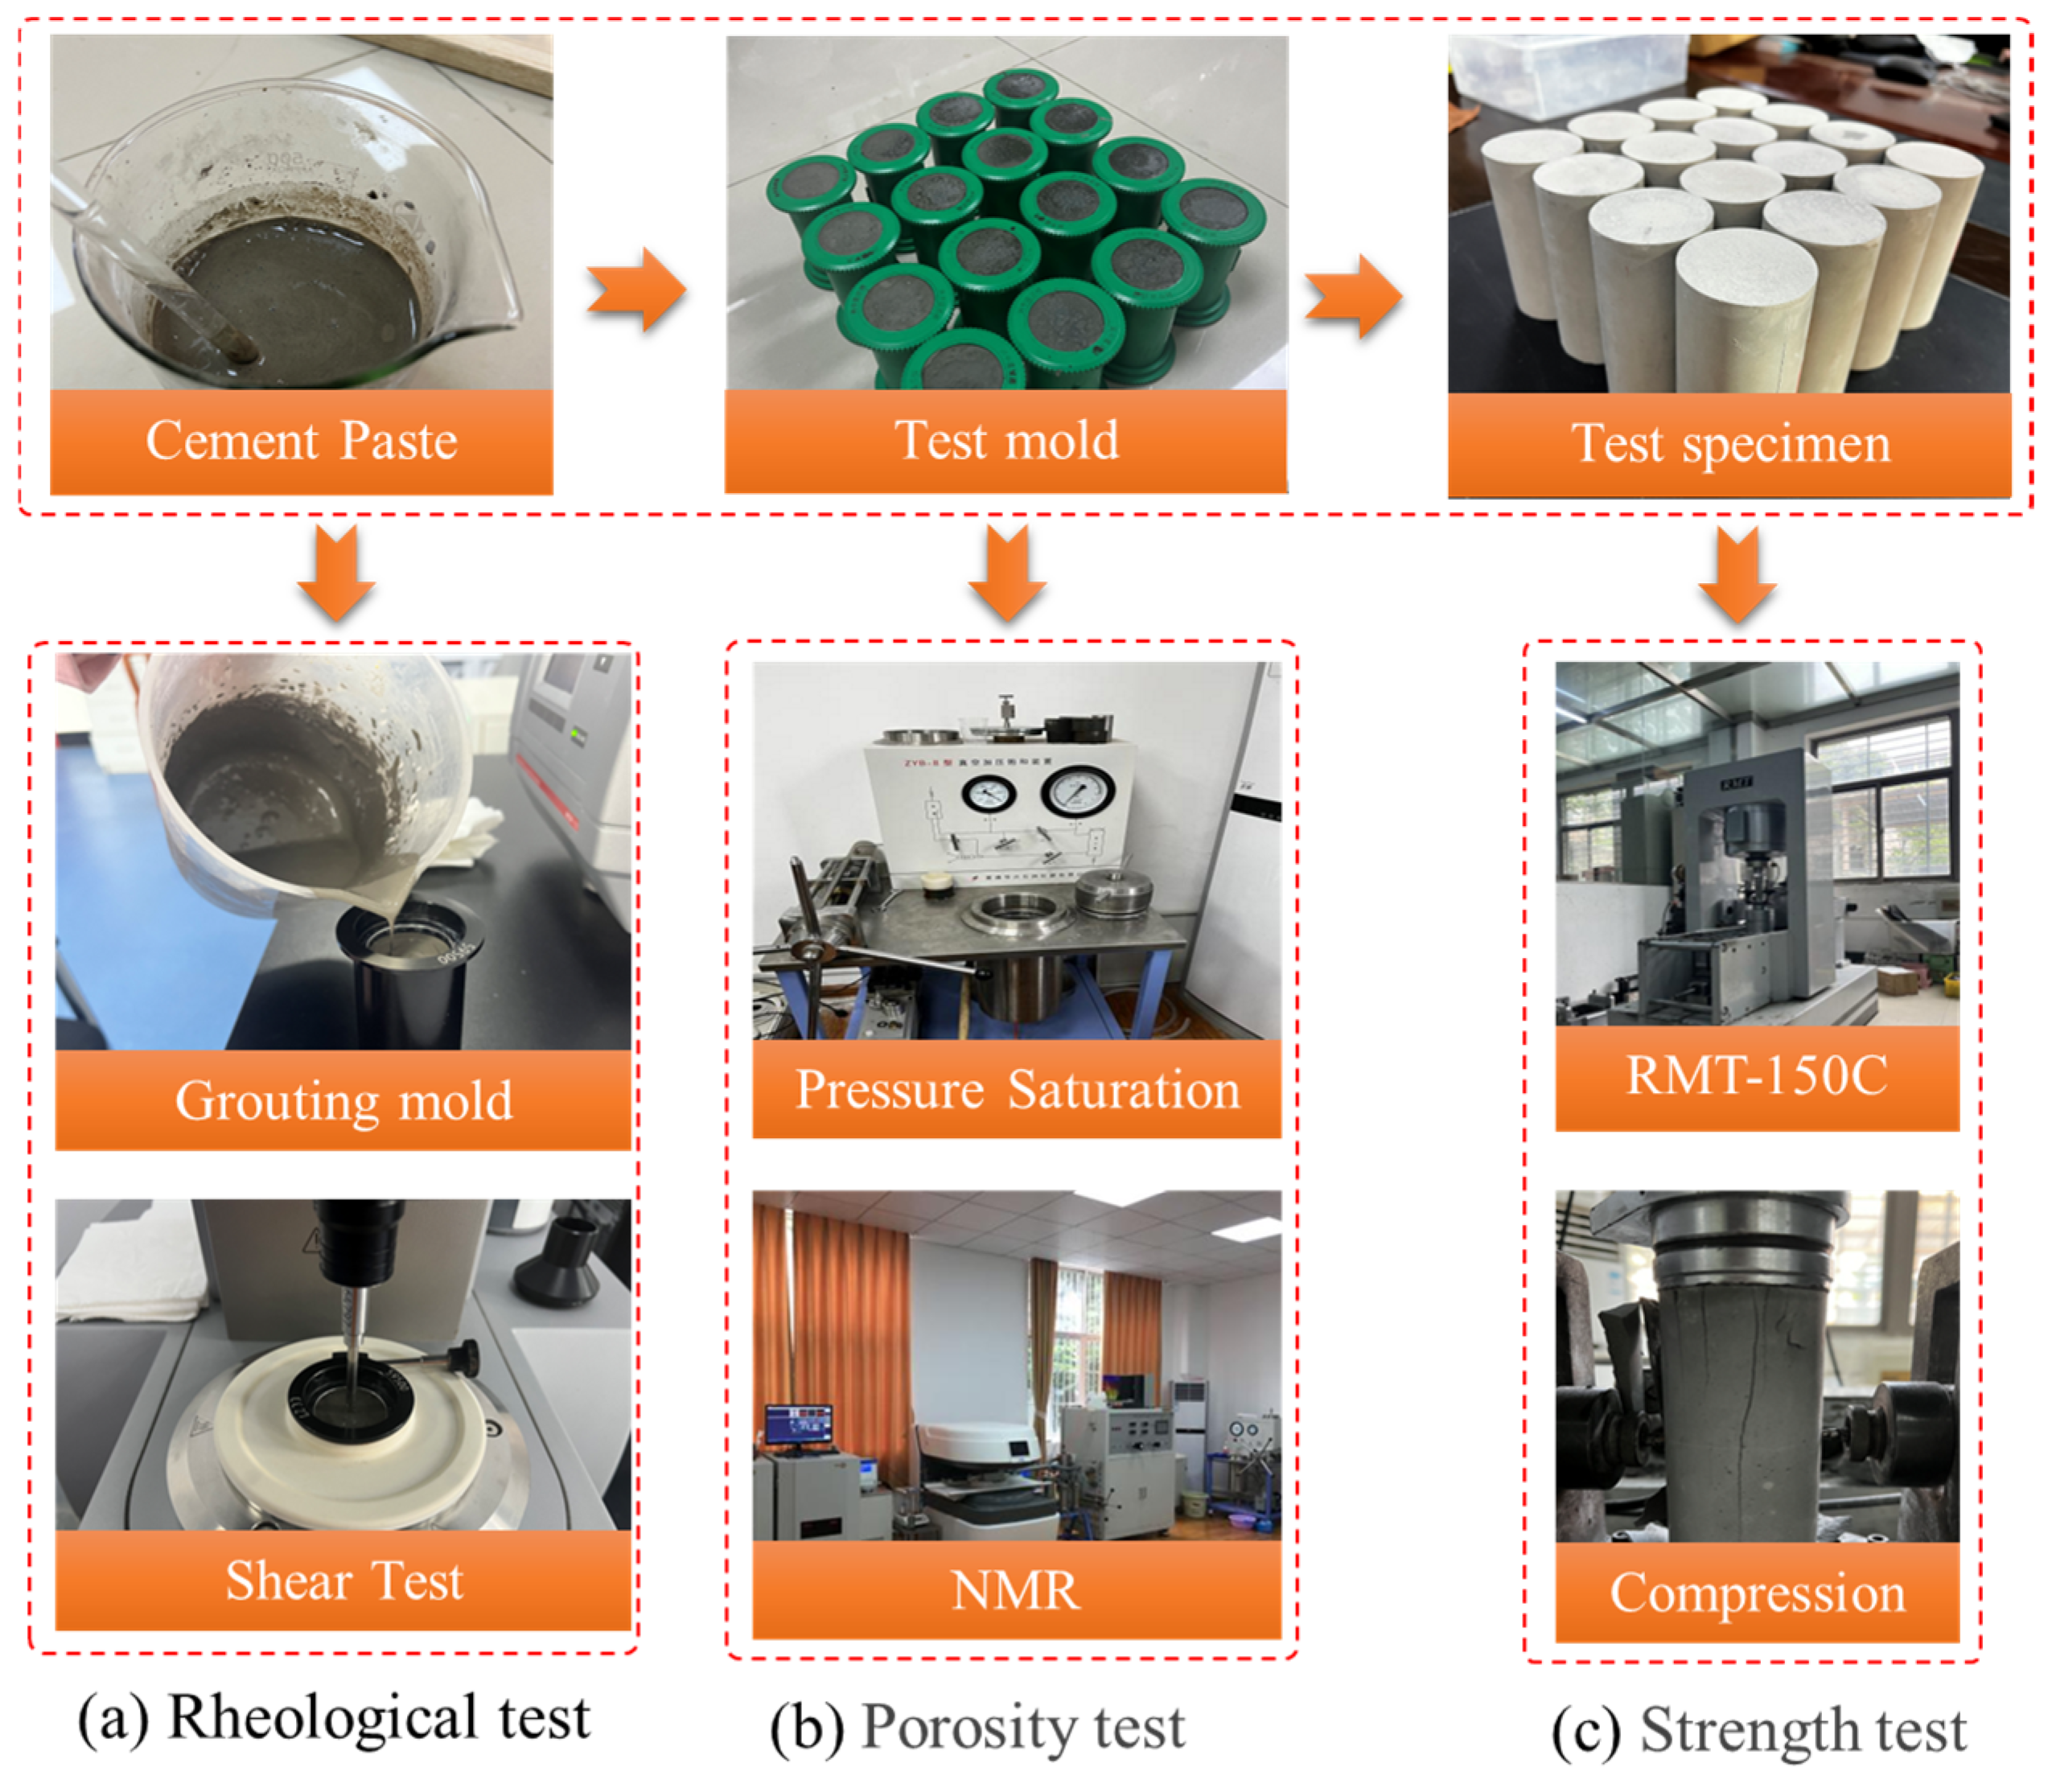
2.2. Specimen Preparation and Test Program

For different experimental protocols, two specimen configurations were employed: Rheological and structural performance tests utilized fresh cement grout specimens. Nuclear magnetic resonance (NMR) and mechanical strength tests employed standard cylindrical cured grouts (Φ50 × 100 mm).
All specimens were prepared using three cementitious systems: HGC (w/c = 0.26), OPC (w/c = 0.6), or SAC: (w/c = 0.6). The experimental workflow is illustrated in Figure 2.
The oscillatory shear testing of grouts comprises small-amplitude oscillatory shear (SAOS) and large-amplitude oscillatory shear (LAOS) measurements. Oscillatory shear refers to the process of applying sinusoidal oscillatory strain to the grout while measuring its stress response. When the applied strain amplitude is within the linear viscoelastic region, the test is termed SAOS. As one of the most fundamental rheological characterization methods, SAOS produces a sinusoidal stress response where the complex modulus remains independent of strain amplitude. Conversely, when the strain amplitude extends into the nonlinear regime, the test is classified as LAOS, characterized by distorted, non-sinusoidal stress waveforms and strain-dependent complex moduli. Its stress changes are no longer sinusoidal oscillations; the stress changes are distorted and the complex modulus changes with the applied strain amplitude.
In SAOS, the shear strain ε and the shear rate γ are as follows:
ε ( t ) = ε 0 sin ω t ,
γ ( t ) = ε 0 ω cos ω t ,
σ ( t ) = σ 0 sin ( ω t + δ ) ,
ε 0 : strain amplitude; ω : oscillation frequency. σ 0 : stress amplitude; δ : Phase angle. For purely elastic solids, the phase angle is 0°; for purely viscous liquids, it is 90°; and for viscoelastic materials, it ranges between 0 and 90°. Thus, the shear stress can be transformed into the following:
σ ( t ) = σ 0 ( sin ω t · cos δ + sin δ · cos δ ω t ) ,
SAOS characterizes fluid properties using the storage modulus ( G ) and loss modulus ( G ), with the specific expressions as follows:
σ ( t ) ε 0 = G sin ω t + G cos ω t ) ,
G = σ 0 cos δ ε 0 ,
G = σ 0 sin δ ε 0 ,
When G exceeds G , the material displays elastic solid-like behavior with reduced viscous characteristics, indicating preserved microstructure and progressive structural stabilization. When G surpasses G , the grout behaves as a viscoelastic liquid. The G G crossover point marks a structural transformation—as the frequency ω increases beyond this point where G becomes dominant again, it signals partial or complete structural collapse, reflecting a transition from viscoelastic solid to liquid properties.
Amplitude sweep tests on HGC, SAC, and OPC grouts showed linear viscoelastic regions between 0.2% and 0.8% strain; therefore, SAOS testing was performed at γ = 0.5% strain amplitude.
The oscillatory shear tests, including rheological characterization and structural evaluation, were conducted using an MCR102 rotational rheometer (Anton Paar (Shanghai) Commercial Co., Ltd., Graz, Austria, Figure 2a), comprising a testing unit, thermostatic water bath, and air compressor. For rheological tests, a steady-shear-rate sweep protocol was applied: pre-shearing at 200 s−1 for 30 s to eliminate thixotropic history, followed by a 30 s rest period and a linear shear rate ramp from 0 to 200 s−1 over 200 s. Structural tests involved small-amplitude oscillatory shear (SAOS) and thixotropy evaluation: the SAOS test protocol initiates with a 30 s pre-shearing phase at 200 s−1 and 30 s of standing time, followed by oscillation at 10 rad/s. The thixotropy evaluation employed a three-interval oscillatory protocol with a constant angular frequency (ω = 5.5 rad/s) but varying strain amplitudes and durations: (1) Interval 1: γ = 0.2% ε 0 for 90 s; (2) Interval 2: γ = 100% ε 0 for 90 s; and (3) Interval 3: γ = 0.2% ε 0 for 280 s. In addition, different slurries were tested for structural recoverability at different moments, respectively.
The pore distribution characteristics measured by nuclear magnetic resonance (NMR) [29] are based on the interaction between hydrogen protons in the pore fluid and radiofrequency pulses emitted by an external magnetic field, which excite the hydrogen protons in the sample fluid, which are then detected by an external coil. Since the energy release rate of magnetized hydrogen protons is proportional to their quantity, the differences in these signals can be used to derive their correlation with the transverse relaxation time T2 distribution pattern.
The NMR T2 spectrum reflects the pore size distribution in the specimen. Shorter T2 values (left-shifted peaks) indicate smaller pores with restricted fluid movement (faster relaxation), showing a dense microporous structure. Longer T2 values (right-shifted peaks) represent larger pores with greater fluid mobility (slower relaxation). A continuous T2 spectrum reveals the pore size distribution and connectivity. Pore fluids exhibit three relaxation types: bulk, surface, and diffusion relaxation, with total T2 relaxation time expressed as follows:
1 T 2 = 1 T S + 1 T D + 1 T B ,
T2: total transverse relaxation time (ms); TS: surface relaxation time (ms); TD: diffusion relaxation time (ms); and TB: free relaxation time (ms).
1 T S = ρ 2 S V p o r e ,
ρ 2 : surface transverse relaxivity, a material-specific parameter dependent on the sample type. S/V: the ratio of pore surface area to fluid volume.
The pore structure characterization was performed using a ZYB-II vacuum pressurized saturation system (Nantong Huaxing Petroleum Instrument Co., Ltd., Nantong, China) and a Macro MR12-150H-I nuclear magnetic resonance (NMR) analyzer (Suzhou Niumag Analytical Instrument Corporation, Suzhou, China, Figure 2b). The NMR system operates with a radiofrequency pulse range of 1–30 MHz, a maximum sampling bandwidth of 2000 kHz, and a magnetic induction strength of 0.52 T. Standard cylindrical cement grout specimens (50 mm diameter × 100 mm height), cured for 28 days, were first saturated in the vacuum-pressurized chamber for 24 h to ensure full pore filling, Then, the specimen was placed in an NMR test apparatus for pore testing.
Uniaxial compression tests were conducted using a multifunctional rock mechanics testing system (RMT-150C, Figure 2c) developed by the Institute of Rock and Soil Mechanics, Chinese Academy of Sciences (Wuhan, China), to evaluate the mechanical properties of HGC, SAC, and OPC grout specimens at curing ages of 1 d, 7 d, and 28 d. The displacement-controlled loading protocol was applied at a constant rate of 0.002 mm/s

3. Rheological Characterization of Cement Slurries
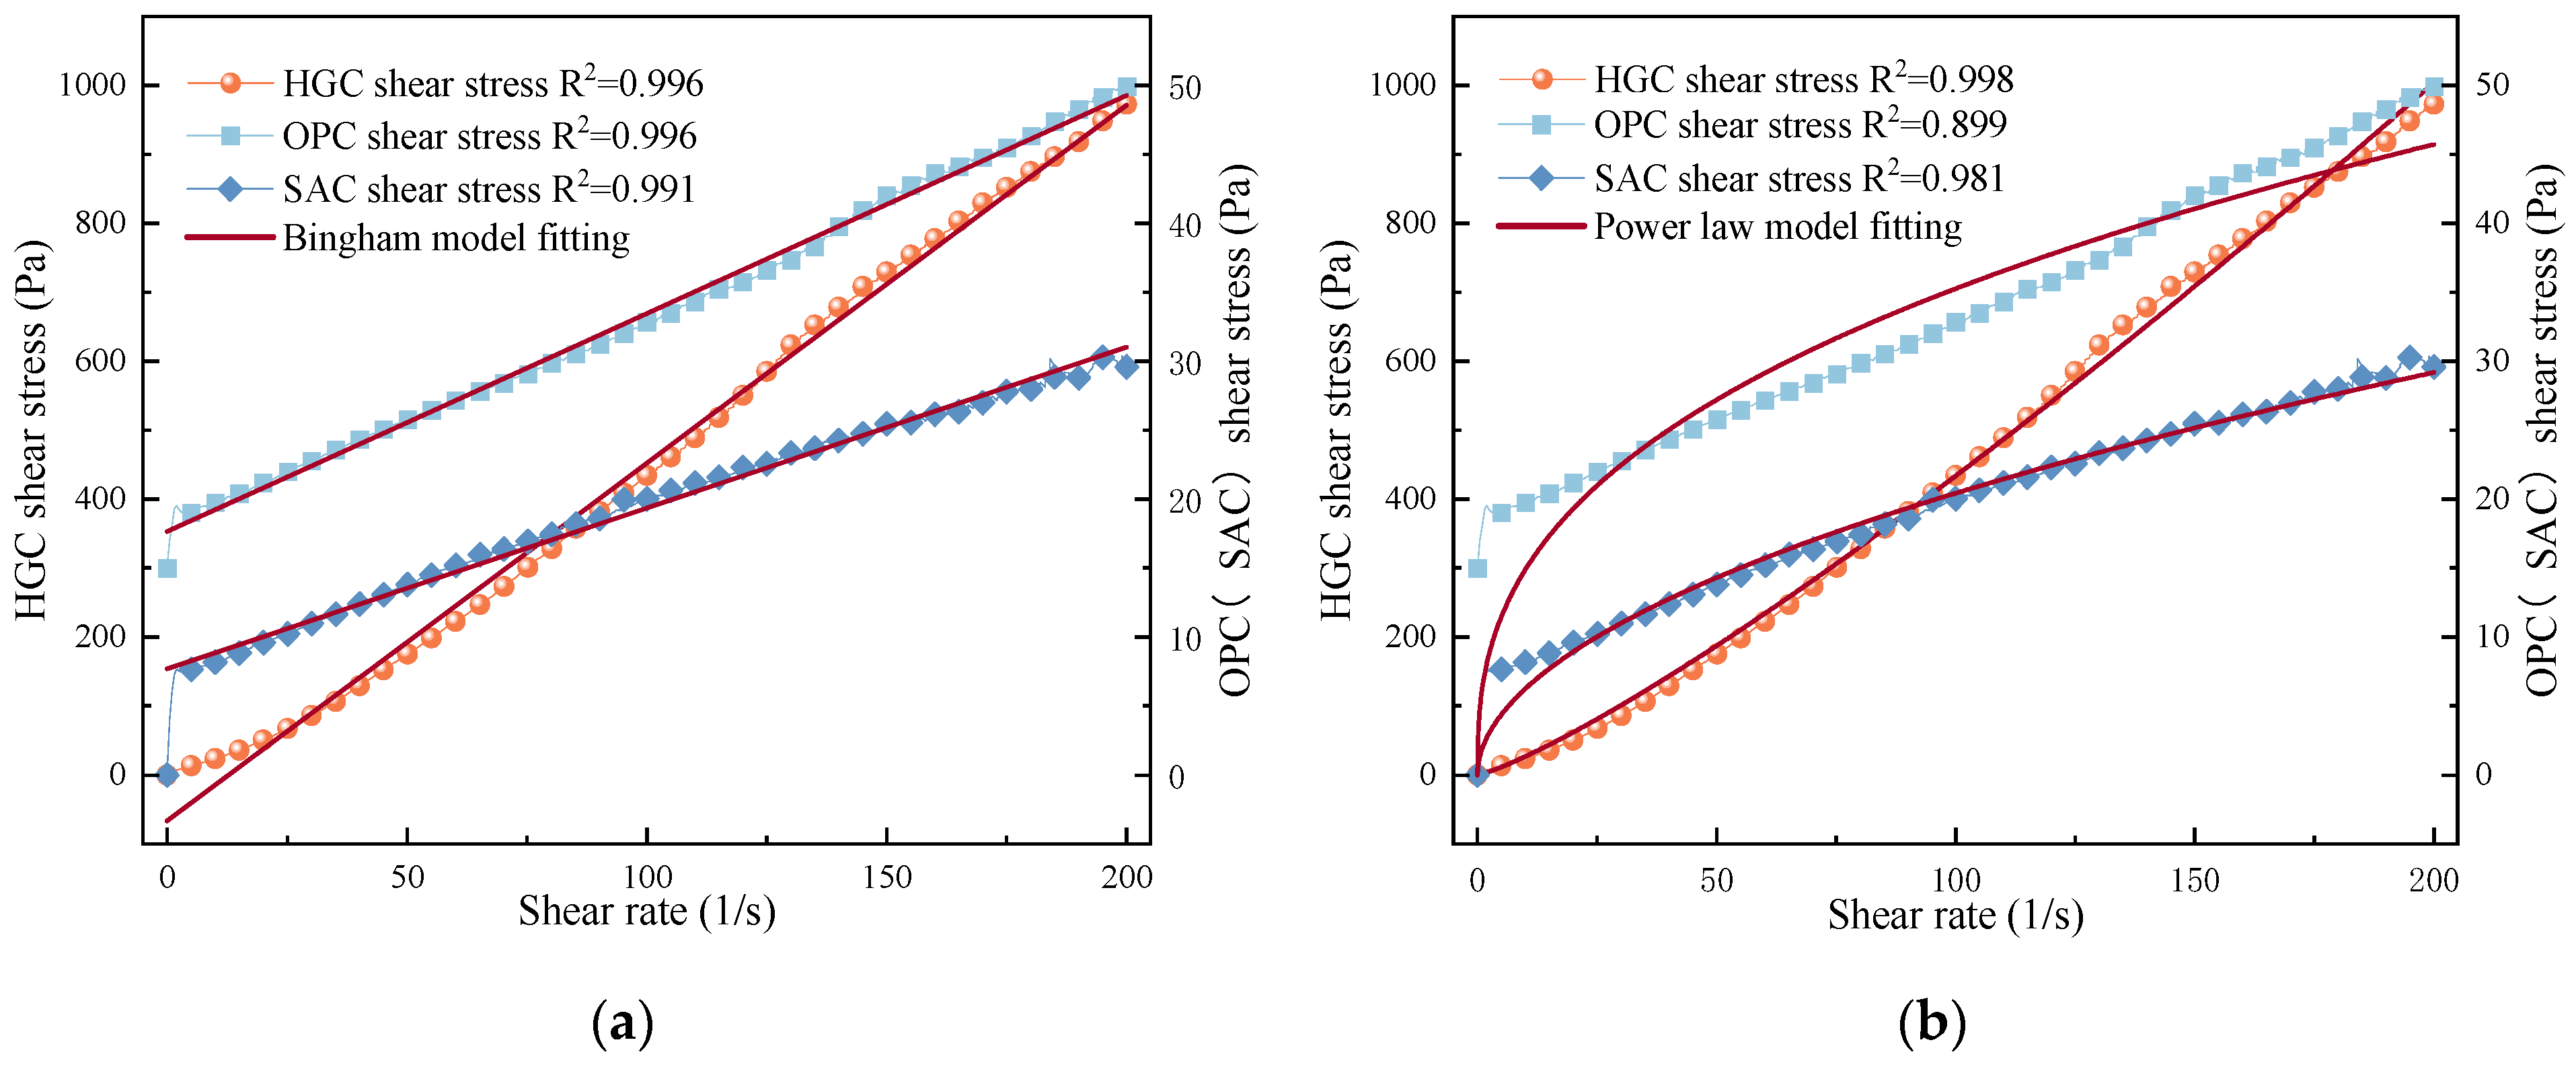
3.1. Rheology Test

Figure 3 displays variable shear rate test results, showing consistent shear stress growth with increasing shear rates for all three cement grouts. The HGC grout attains maximum shear stress around 1000 Pa, markedly surpassing the 30–50 Pa range of OPC and SAC grouts. This improvement mainly originates from HGC’s reduced water/cement ratio (0.26), enhancing viscosity, along with its 0.05% thickener that boosts both yield stress and plastic viscosity [30]. Simultaneously, the polycarboxylate water reducer breaks down flocculated structures within the grout, decreasing interparticle friction and consequently reducing apparent viscosity [31].
The HGC grout’s shear stress increases gradually at 0–50 s−1 shear rates, due to its low water/cement ratio (0.26) and resultant high viscosity. At low shear rates, its strong flocculated network structure dominates, requiring greater energy input to initiate flow. When shear rates exceed 50 s−1, however, the shear stress displays linear growth, indicating that particle intermolecular interactions are overcome and there is a transition to Newtonian fluid behavior, where shear stress becomes proportional to shear rate.
The OPC grout demonstrates a linear shear stress increase, while the SAC grout shows rapid stress growth at 0–80 s−1 followed by slower progression beyond 80 s−1. Throughout shearing, OPC grout maintains consistently higher shear stress values than SAC grout. Under identical shear rate conditions, OPC grout’s shear stress exceeds that of SAC grout by approximately 40.5%.
The rheological characterization of cement grouts employed two classical empirical models (Equations (10) and (12)) for experimental data fitting. The coefficient of determination (R2) served as the evaluation metric, with higher values denoting superior model fitting accuracy. Existing studies indicate that Newtonian models effectively characterize cement grouts with water/cement ratios exceeding 1.0, featuring rheological curves passing through the origin. In contrast, Bingham fluids display linear non-origin-intersecting rheological profiles, while power-law fluids exhibit origin-passing nonlinear curves. The mathematical expressions for these models are as follows:
This is example 1 of the Bingham model:
τ = k · γ + τ 0 ,
This is example 2 of the power law:
τ = μ p · γ n ,
τ : shear stress; γ 0 : shear rate; μ : dynamic viscosity; τ 0 : yield strength; μ p : plastic viscosity; and n : flow behavior index characterizing shear-thinning or shear-thickening properties of power-law fluids. The greater the deviation of n from 1, the stronger the non-Newtonian behavior. k : the consistency coefficient represents a viscosity-related parameter derived from power-law model fitting, though it is not equivalent to conventional viscosity. The larger the k value, the more viscous the grouts.
The rheological data of HGC, OPC, and SAC grouts across varying shear rates were modeled using Bingham and power-law formulations, with fitting curves illustrated in Figure 3. Key findings reveal the following: (1) For HGC grout at 0–50 s−1, the power-law model demonstrates superior fitting accuracy over the Bingham model. (2) Within 50–200 s−1, power-law modeling effectively describes HGC and SAC grout behavior, whereas the Bingham model better captures OPC grout’s rheological response.
Rheological analysis of HGC, OPC, and SAC grouts using Bingham (Equation (10)) and power-law (Equation (11)) models yielded the fitting results in Table 5. The Bingham model achieved R2 values of 0.996 (HGC), 0.996 (OPC), and 0.991 (SAC), while the power-law model attained 0.998 (HGC), 0.899 (OPC), and 0.981 (SAC). Comparative evaluation reveals that the Bingham model provides better fits for OPC and SAC grouts, whereas the power-law model proves superior for HGC grout. Notably, HGC displays the highest Bingham k value (viscosity parameter) among the three grouts. In power-law analysis, OPC grout shows the largest deviation of flow index n from unity (n = 1), reflecting stronger non-Newtonian characteristics, contrasted with HGC’s minimal deviation, indicating weaker non-Newtonian behavior but greater shear rate dependency.
The rapid hydration of OPC generates AFm phases and C-S-H gel, which create rigid network structures. In SAC systems, the accelerated formation of hydration products (e.g., AFt) enhances interparticle connectivity through crystalline bridging. Under high-shear conditions, these hydration-derived networks experience progressive disruption, resulting in viscosity reduction, although requiring substantial yield stress to initiate structural breakdown. Conversely, HGC’s high-content inert components (mineral powder and fly ash) limit hydration reactivity, inhibiting continuous framework formation. Its flow behavior arises from optimized particle packing mechanics where spherical fly ash particles minimize intergranular friction, aligning with power-law model predictions without measurable yield stress. At elevated shear rates, intensified particle collisions induce transient structural rearrangements, exhibiting distinct shear-thickening behavior.

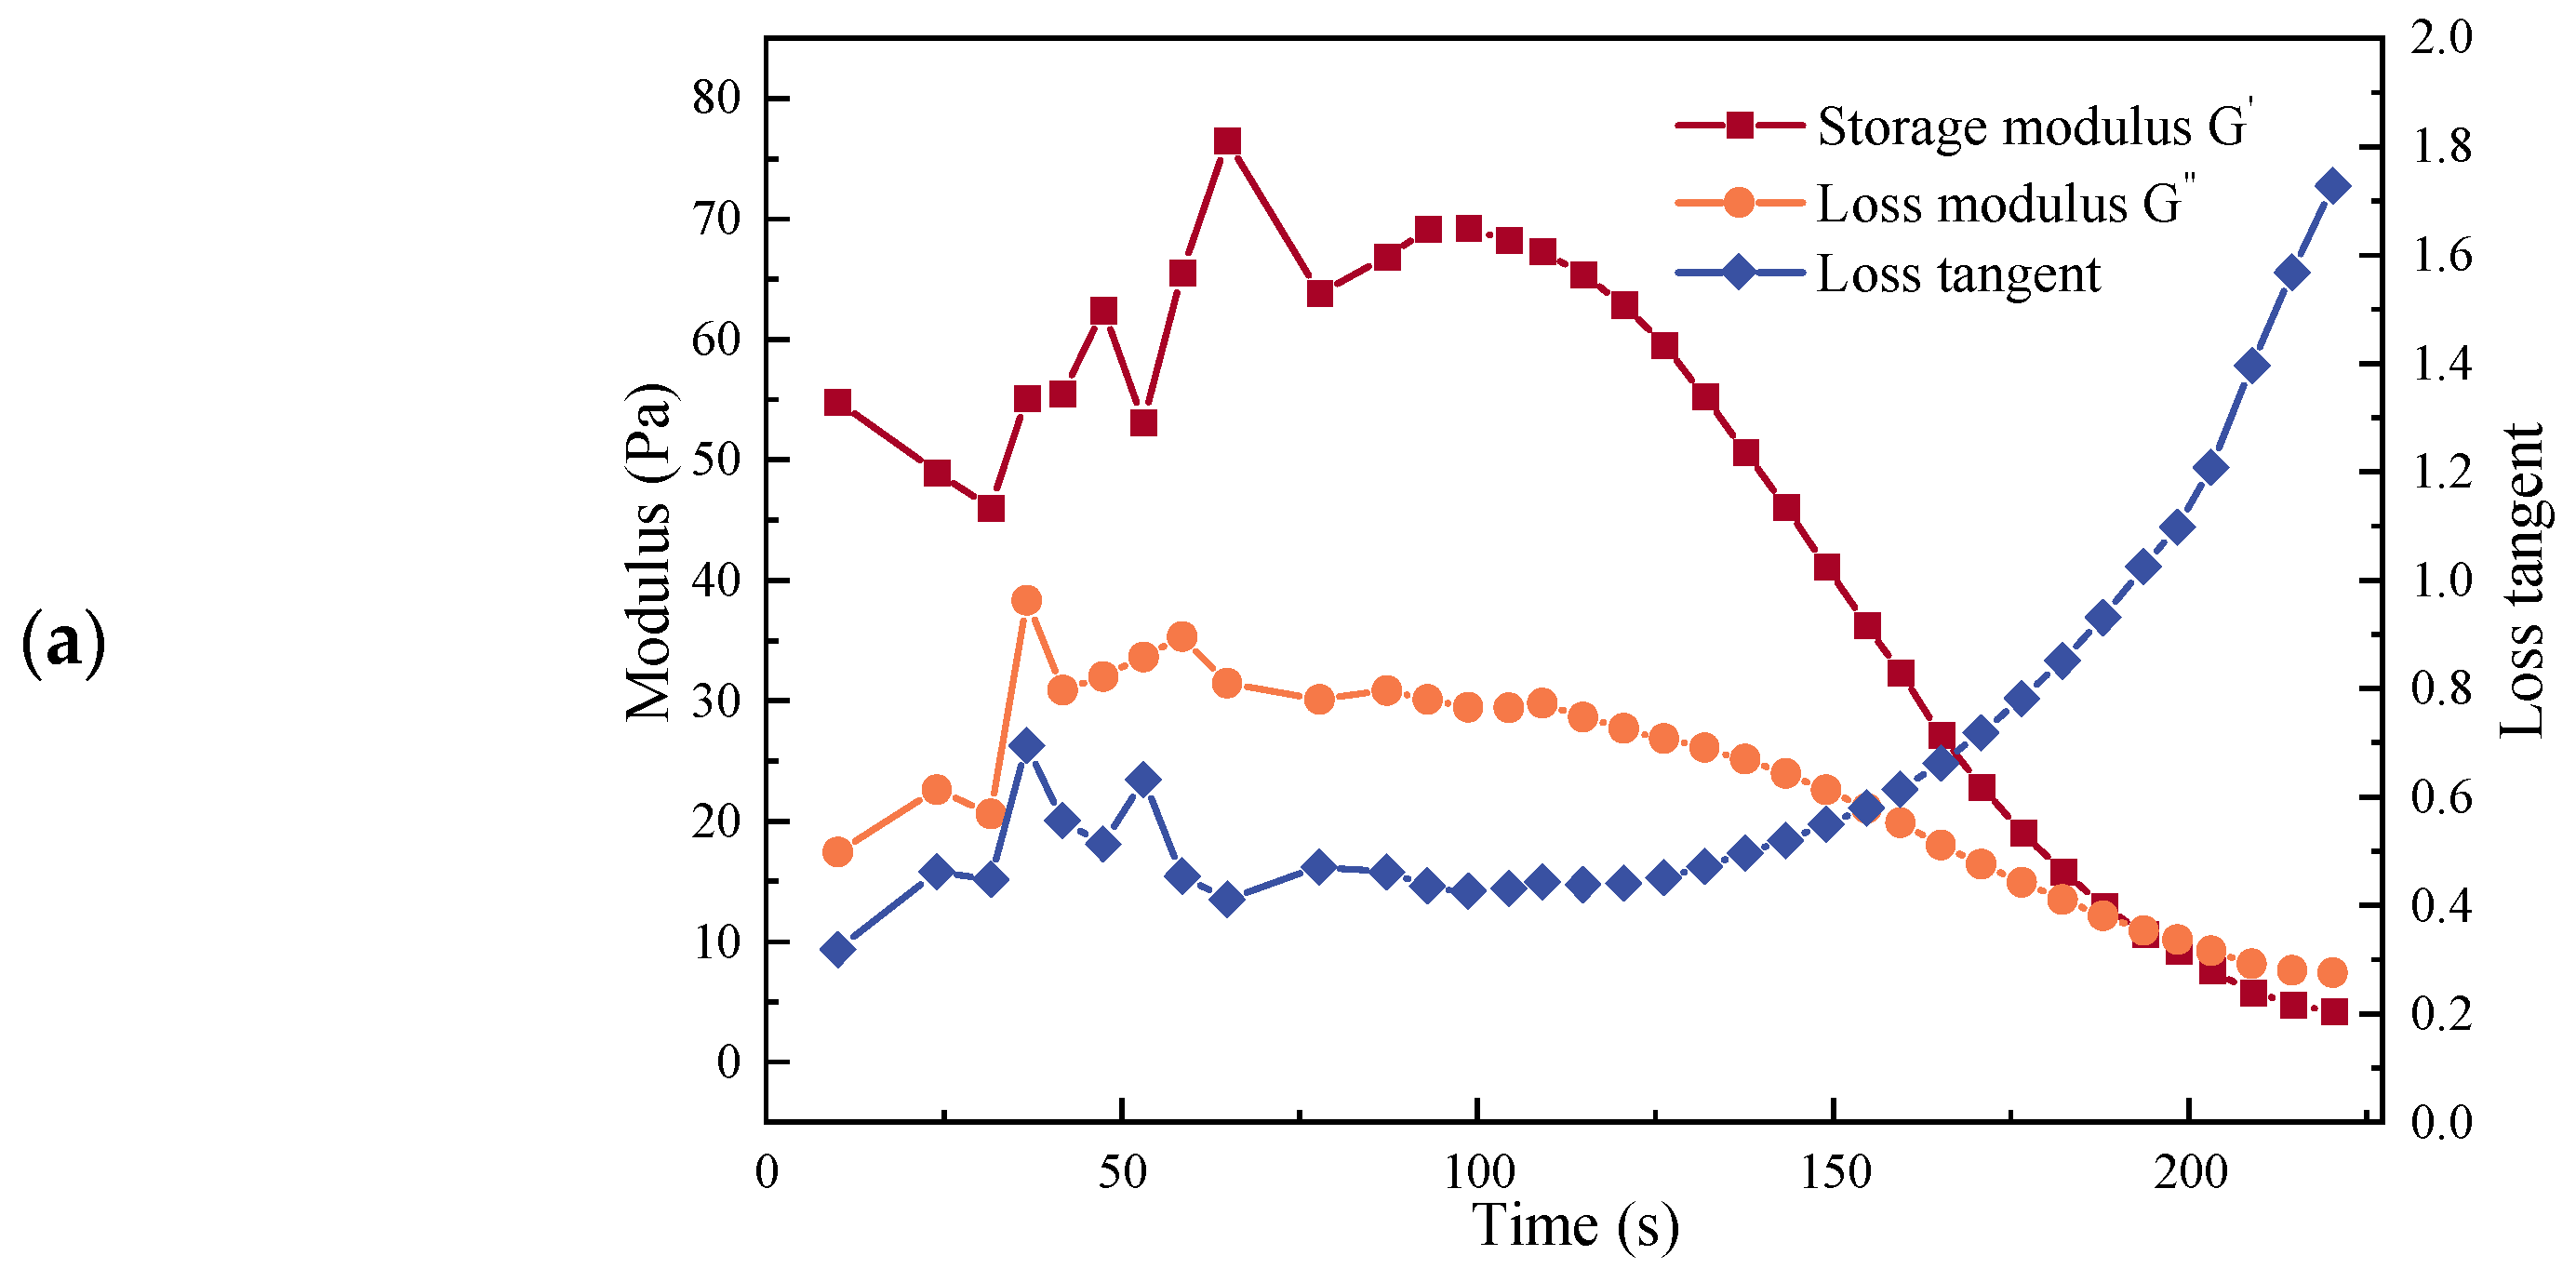
3.2. Structural Test

Figure 4 presents the SAOS test results for the grouts. As shown in Figure 4, the HGC grout exhibits G > G during the 0–190 s period, indicating viscoelastic solid/gel-like behavior. After 65 s, both G and G gradually decrease with time. When the time exceeds 190 s, the relationship reverses ( G < G ), marking the transition from a viscoelastic solid to viscoelastic liquid state.
Comparative rheological analysis reveals distinct yielding characteristics: OPC grout shows minimal ( G G ) differences pre-yielding, reflecting compromised viscoelastic stability and lower energy dissipation thresholds for structural breakdown, facilitating earlier yielding. Conversely, SAC grout displays delayed yielding at 354 s (markedly later than OPC’s 112 s), accompanied by unique storage modulus ( G ) evolution—an initial growth phase (0–180 s) followed by progressive decline preceding the yield point. This modulus transition mechanism extends the yielding duration while enhancing grout system structural integrity through crystalline reinforcement pathways.
Furthermore, all three grouts exhibit a stabilized storage modulus ( G ) and loss modulus ( G ) post-yield, transitioning from a viscoelastic solid state to a viscoelastic liquid state before reaching equilibrium in the nonlinear viscoelastic regime. Compared to OPC grout, HGC demonstrates a significantly prolonged yield time with consistently higher G than G prior to yielding, indicating superior structural stability. During initial oscillatory testing, both HGC and SAC show increasing G and G over time. However, as a rapid-setting, early-strength grout, SAC develops stronger interparticle connectivity than HGC during the initial stage, resulting in better early-age integrity.
The thixotropy testing of grouts reflects their structural recovery characteristics during the complete process from stability to disturbance-induced failure and re-stabilization, as occurs in practical engineering scenarios such as roadway grouting under rock mass creep or mining-induced disturbances. As shown in Figure 5, all three grouts exhibit a gradually increasing storage modulus ( G ) and loss modulus ( G ) during the low-strain phase, with G > G indicating viscoelastic solid behavior within the linear elastic strain region. This demonstrates progressive strengthening of the internal grout structure over time, marking the transition from a gel state to solidification. During the high-strain phase, both G and G decrease rapidly under large-strain shear, reflecting breakdown of the flocculated structure and a transition to a viscoelastic liquid state. Upon strain reduction, G and G rebound quickly, with the system transitioning from a viscoelastic liquid ( G < G ) back to a viscoelastic solid ( G > G ) within a short duration, indicating re-gelation. The continued modulus increase signifies structural recovery toward a new equilibrium state through enhanced particle bonding and agglomeration.
Structural recovery analysis following high-strain shear (Figure 5 and Table 6) revealed significant variations among grout types: HGC exhibited the fastest structural recovery (52 s), while OPC required substantially longer recovery (315 s) due to lower particle concentration and wider interparticle spacing. This structural configuration demands extended hydration product formation to rebuild flocculated networks. Notably, SAC achieved faster recovery (121 s) than OPC despite an identical water-/cement ratio (0.6), attributed to accelerated hydration kinetics enabling rapid generation of network-reforming hydration products.

4. Mechanical Properties of Cured Grouts

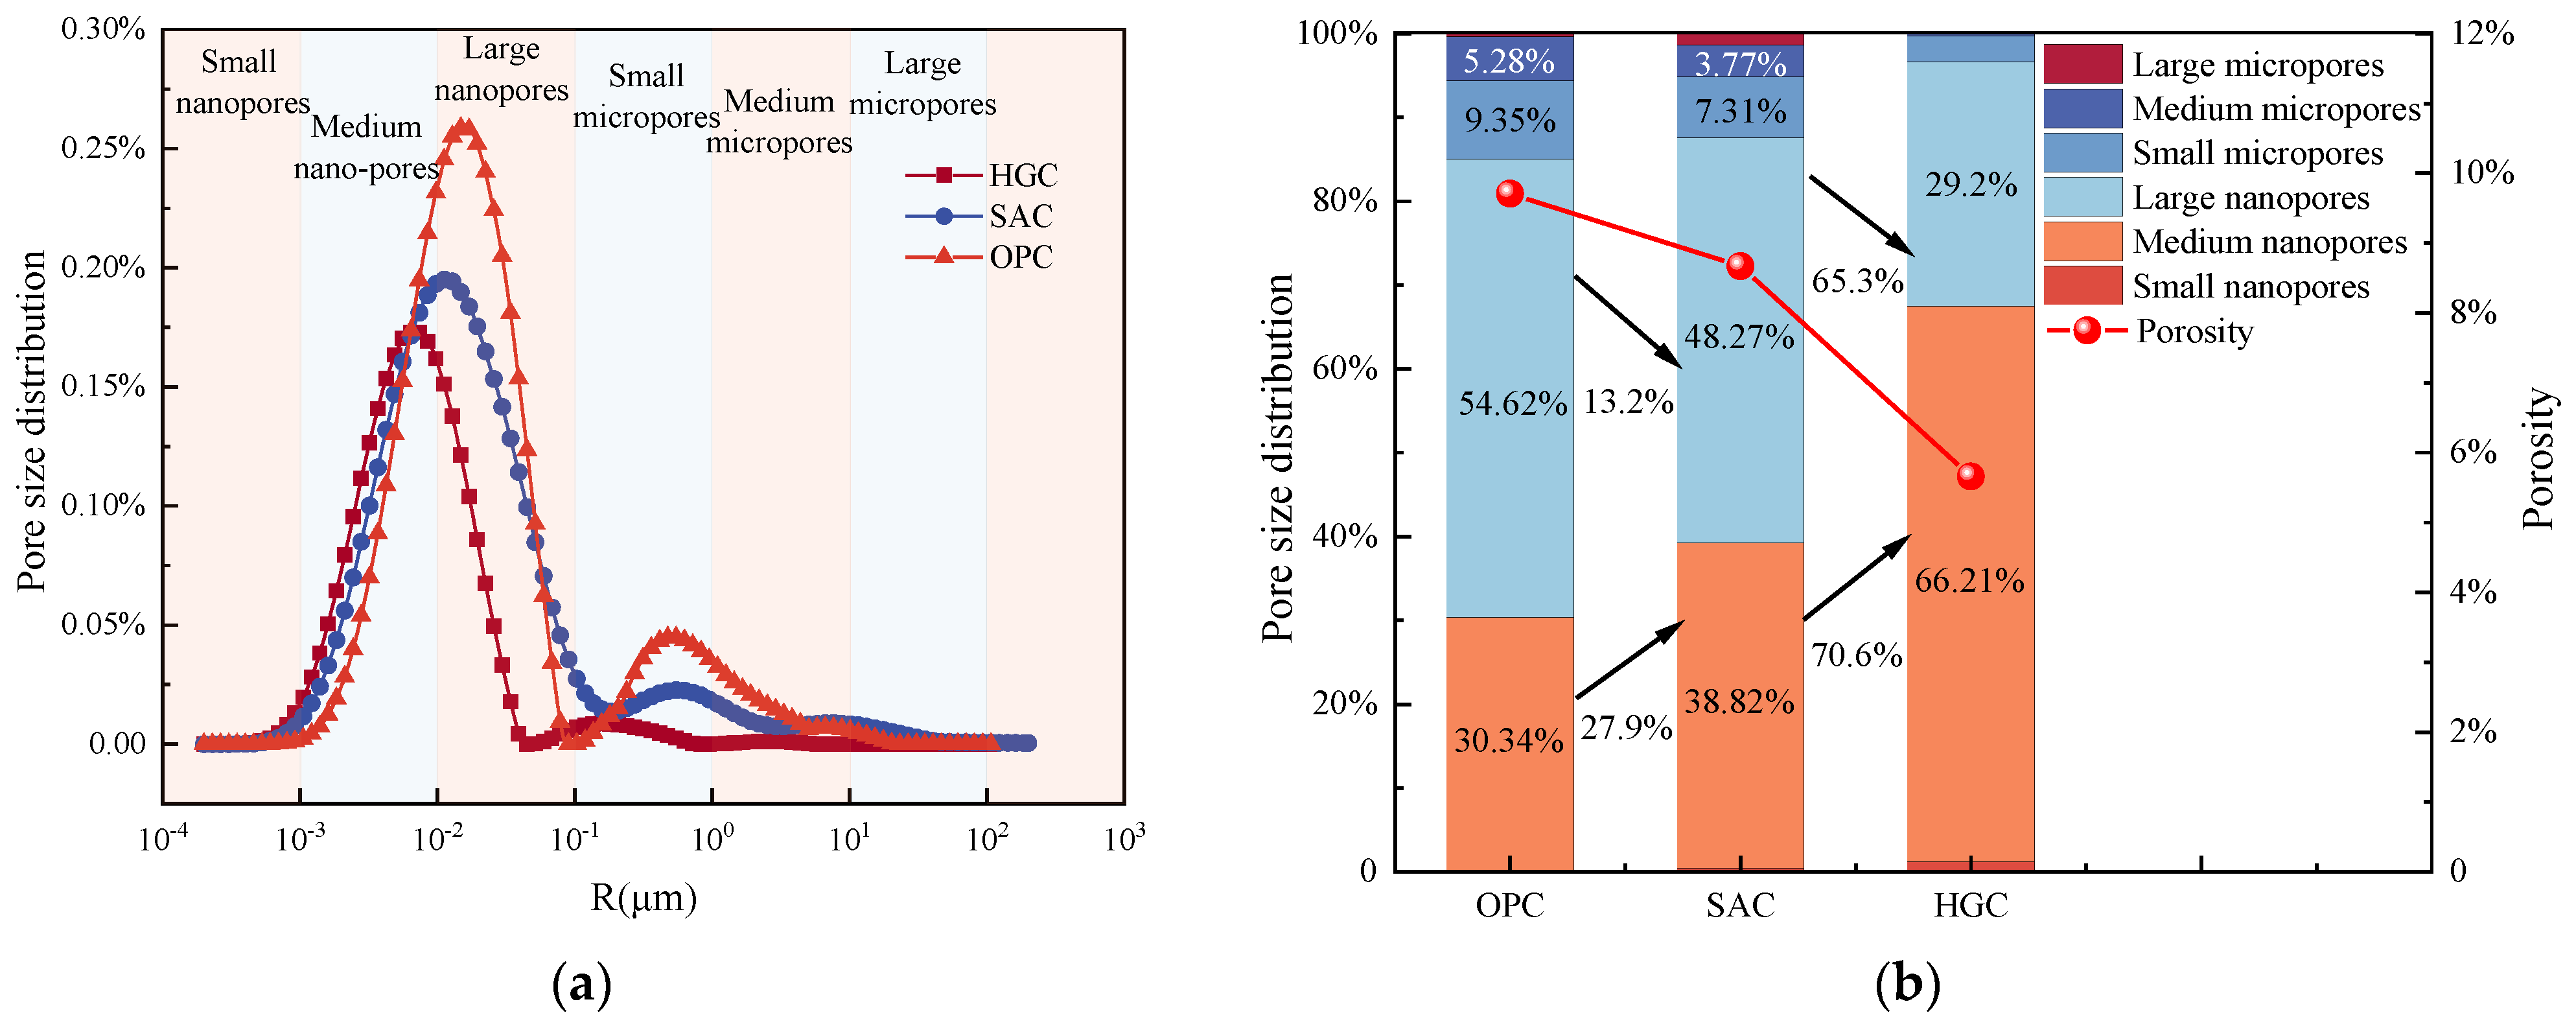
4.1. Pore Distribution Characteristics

NMR results indicate that the HGC sample possesses 5.66% porosity, markedly lower than SAC (8.66%) and OPC (9.71%) samples, confirming HGC grout’s capability to form cured grout with reduced porosity relative to conventional cement grouts.
Figure 6 displays the T2 spectrum distribution of tested samples, where all cement stone specimens exhibit two characteristic peaks within the documented 0.01–1000 ms relaxation range [32]. The primary peak (0.1–5 ms) shows the maximum signal intensity, confirming micropore dominance, while the secondary peak (10–1000 ms) indicates limited macropore distribution. Figure 6 shows progressive rightward spectral peak shifts with intensified signals for HGC, SAC, and OPC samples, indicating gradual pore size enlargement. Quantified peak area proportions in Figure 6b reveal HGC’s dominant first peak (94.86%), substantially exceeding SAC (89.59%) and OPC (85.02%), confirming its superior fine pore concentration.
The HGC sample demonstrates lower spectral peak amplitudes than SAC and OPC counterparts. Given the direct correlation between peak area and pore volume, these NMR T2 spectra results verify HGC’s reduced internal porosity versus SAC/OPC. Subsequent pore size distribution analysis of cured grouts will apply established pore classification criteria for detailed characterization.
Currently, there are multiple classification standards for rock pore sizes [19,20], while the categorization criteria for pore size distribution in cured grouts remain inconsistent. Reference [33] proposed a pore size classification standard that aligns with the International System of Units (SI) and standardized terminology. This study adopts this classification system for detailed pore size analysis. Based on the aforementioned classification criteria and NMR test results, the pore size distribution curves were plotted, and further transformed into cumulative percentage histograms. Figure 7 displays the proportional distribution of pore sizes, with only categories exceeding 1% of total porosity being represented for clarity.
Figure 7a shows the pore size distributions of cured grout samples divided into two categories: nanopores and micropores. Three dominant subclasses emerge—medium nanopores (10–50 nm), large nanopores (50–100 nm), and small micropores (100–500 nm)—with most pores concentrated between 1 nm and 10 μm. HGC and SAC samples exhibit predominant medium nanopore distributions, contrasting with OPC’s large nanopore concentration.
Figure 7b quantifies pore size distributions, showing HGC cured grout contains 66.21% nanopores—118.2% and 70.6% higher than OPC and SAC, respectively. OPC exhibits the largest proportions of large nanopores and small micropores, followed by SAC, while HGC shows minimal content (65.3% fewer large nanopores than SAC). Consequently, HGC demonstrates optimal porosity characteristics with finer pore structures predominantly comprising medium nanopores and limited small nanopores. The mechanism originates from HGC’s fine fly ash/mineral powder additives that fill cement interparticle voids, optimize gradation, and reduce initial porosity. Fly ash chemically consumes CH from C3S/C2S hydration, forming denser C-S-H gel. Mineral powder’s rough surface enhances mechanical interlocking while its ultrafine angular particles improve compactness [34]. SAC’s early ettringite (AFt) formation with acicular crystals fills initial pores, refining pore structures and inhibiting defect formation. OPC’s dominant C-S-H gel occupies micropores, synergizing with ettringite to create interpenetrated microstructures that reduce pore dimensions. Water reducers adsorb on cement particles, disrupting flocculation via electrostatic/steric effects to release trapped water and minimize evaporation-induced porosity. Thickeners ensure uniform water distribution, promoting localized hydration and nanopore formation through C-S-H interaction. However, OPC/SAC hydration processes retain dispersed cement particles via water-binding effects, limiting continuous framework development and reducing pore filling efficiency, ultimately increasing porosity [35].

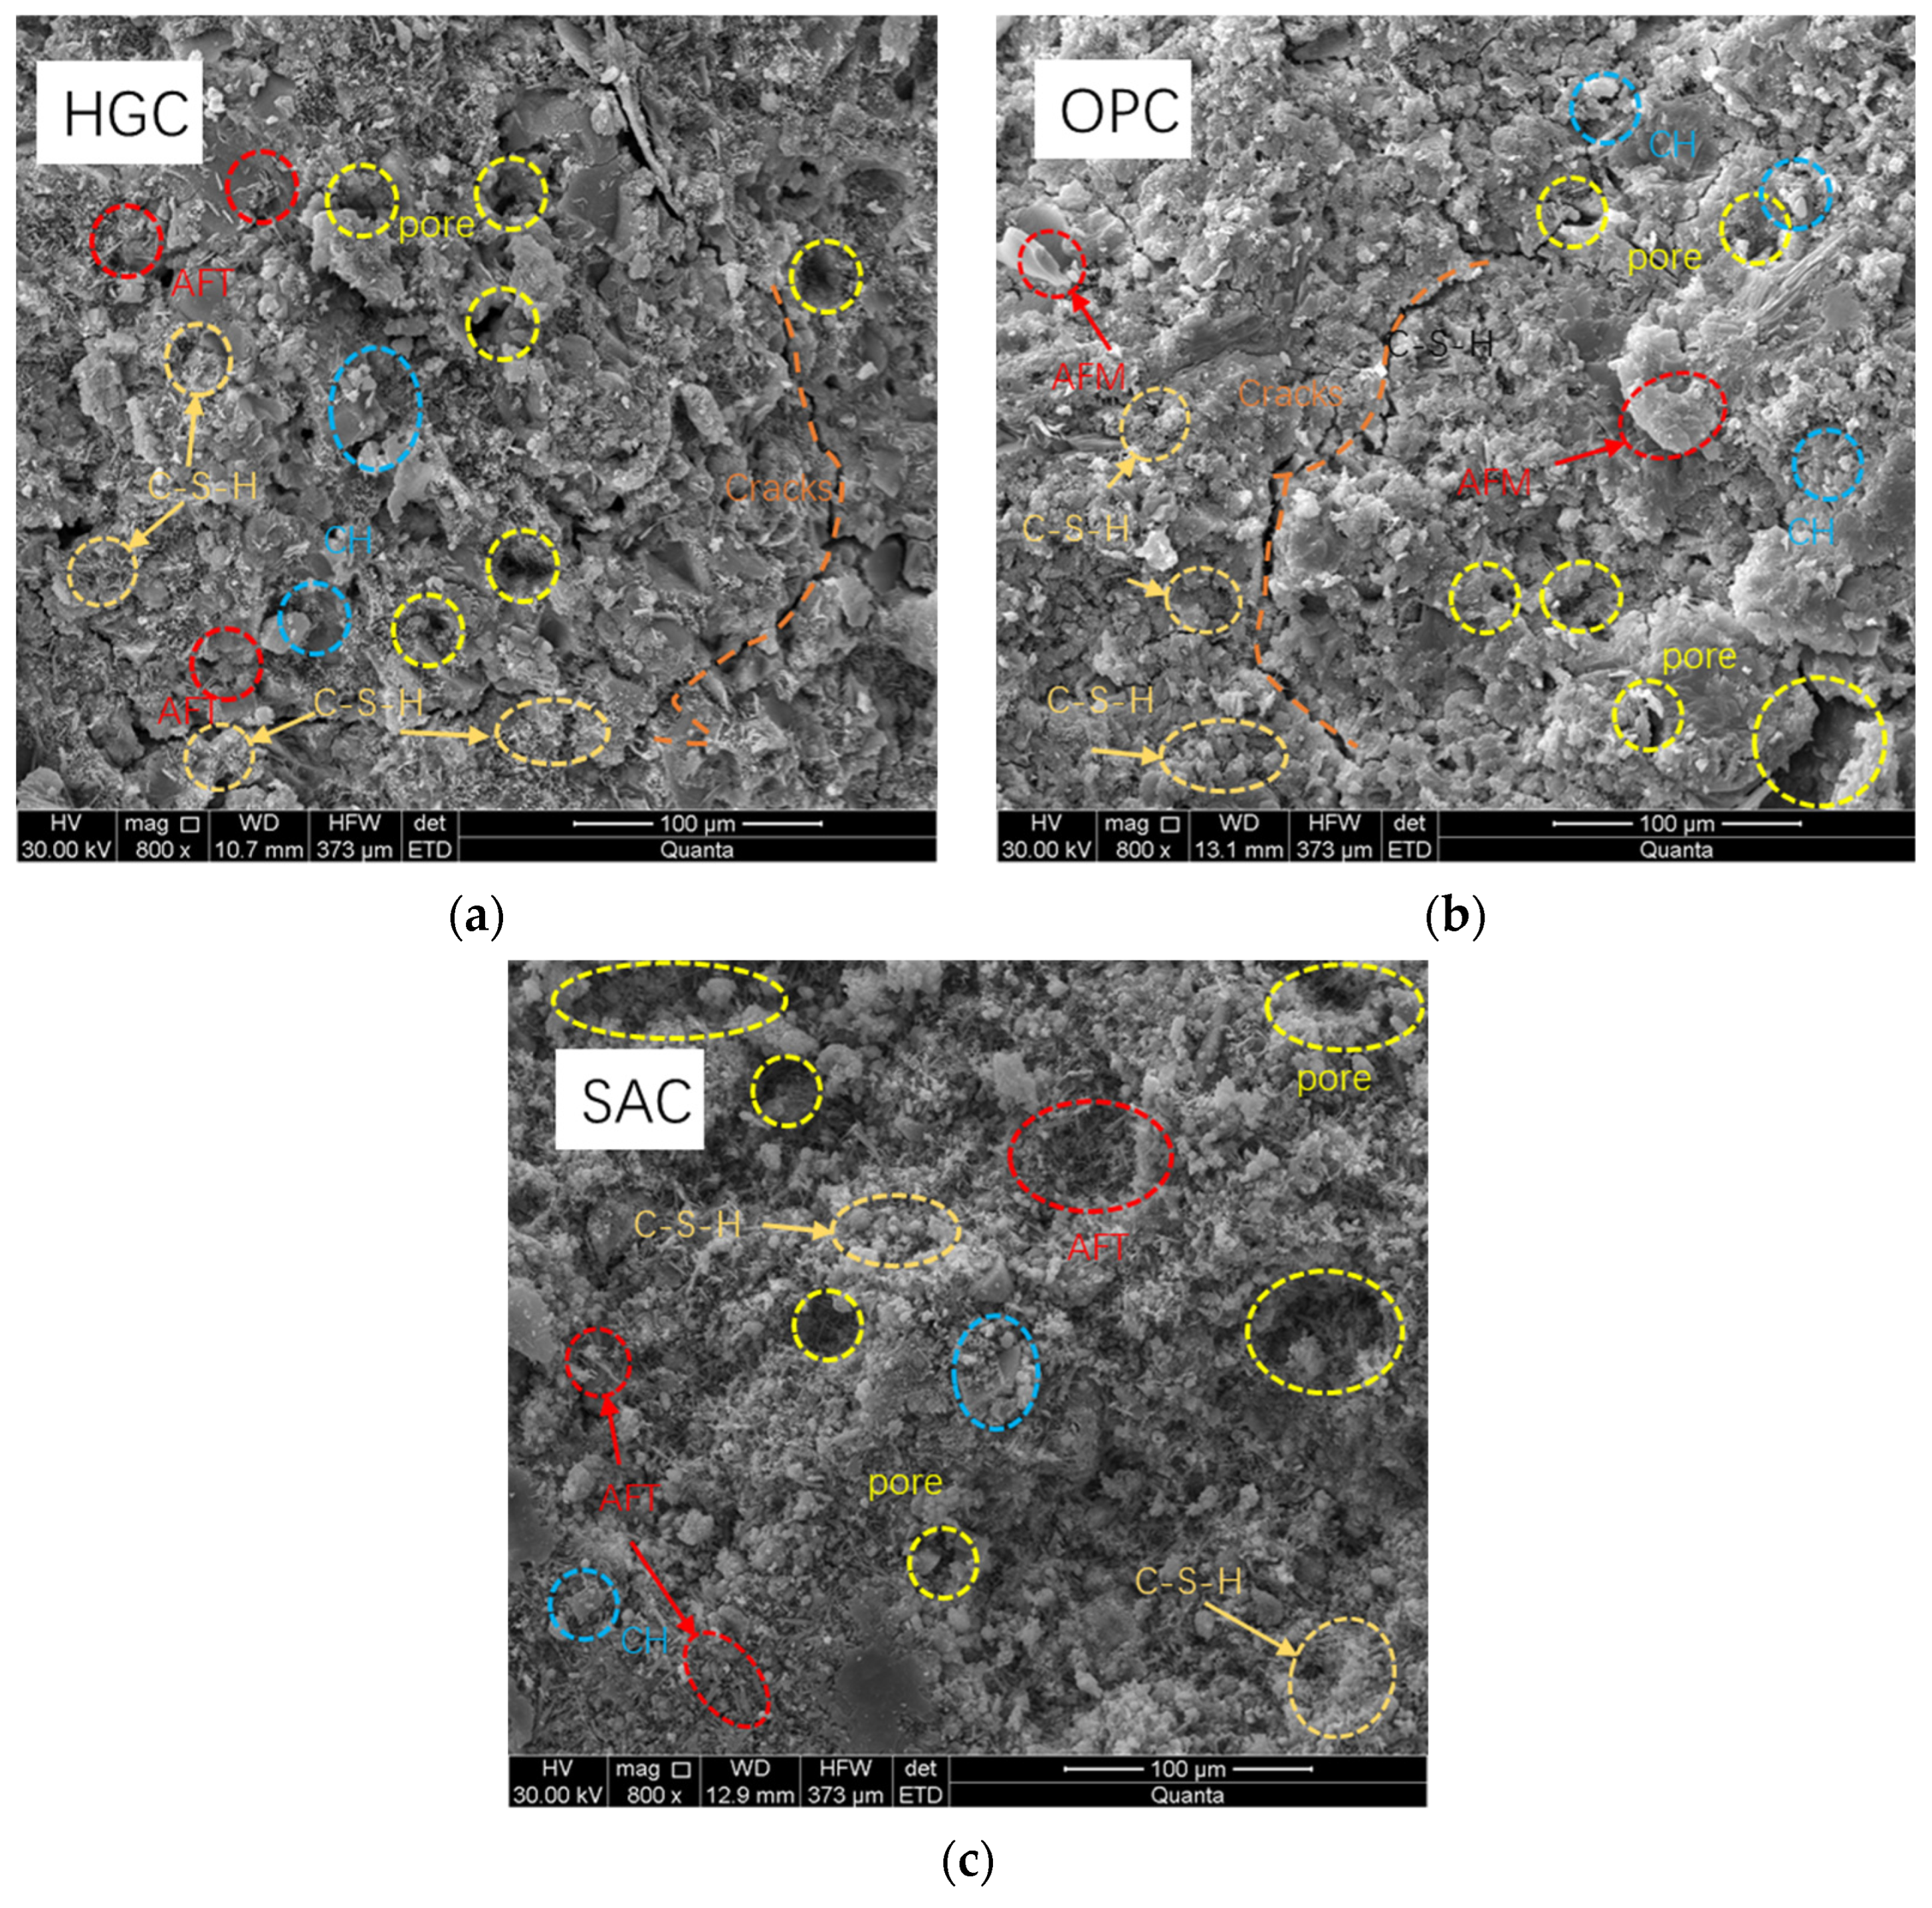
4.2. Microstructural Characterization of Cured Grouts

SEM analysis at 800× magnification (Figure 8) reveals distinct microstructural features: HGC exhibits abundant short-needle AFt hydration products combined with dense C-S-H gel that effectively fills internal voids, producing minimal macropores and abundant micropores with superior compactness. OPC displays notable cracks and laminated Ca(OH)2 crystals that interconnect with macropores, creating structural looseness. SAC demonstrates inadequate C-S-H encapsulation of bulky AFt clusters and Ca(OH)2 laminations, resulting in extensive large-pore networks.
The HGC specimen demonstrates superior compactness and homogeneity through effective C-S-H gel pore filling; the OPC specimen exhibits a loose structure with visible cracks and macropores; and the SAC specimen contains multiple internal pores and insufficient density due to inadequate C-S-H encapsulation of hydration products.

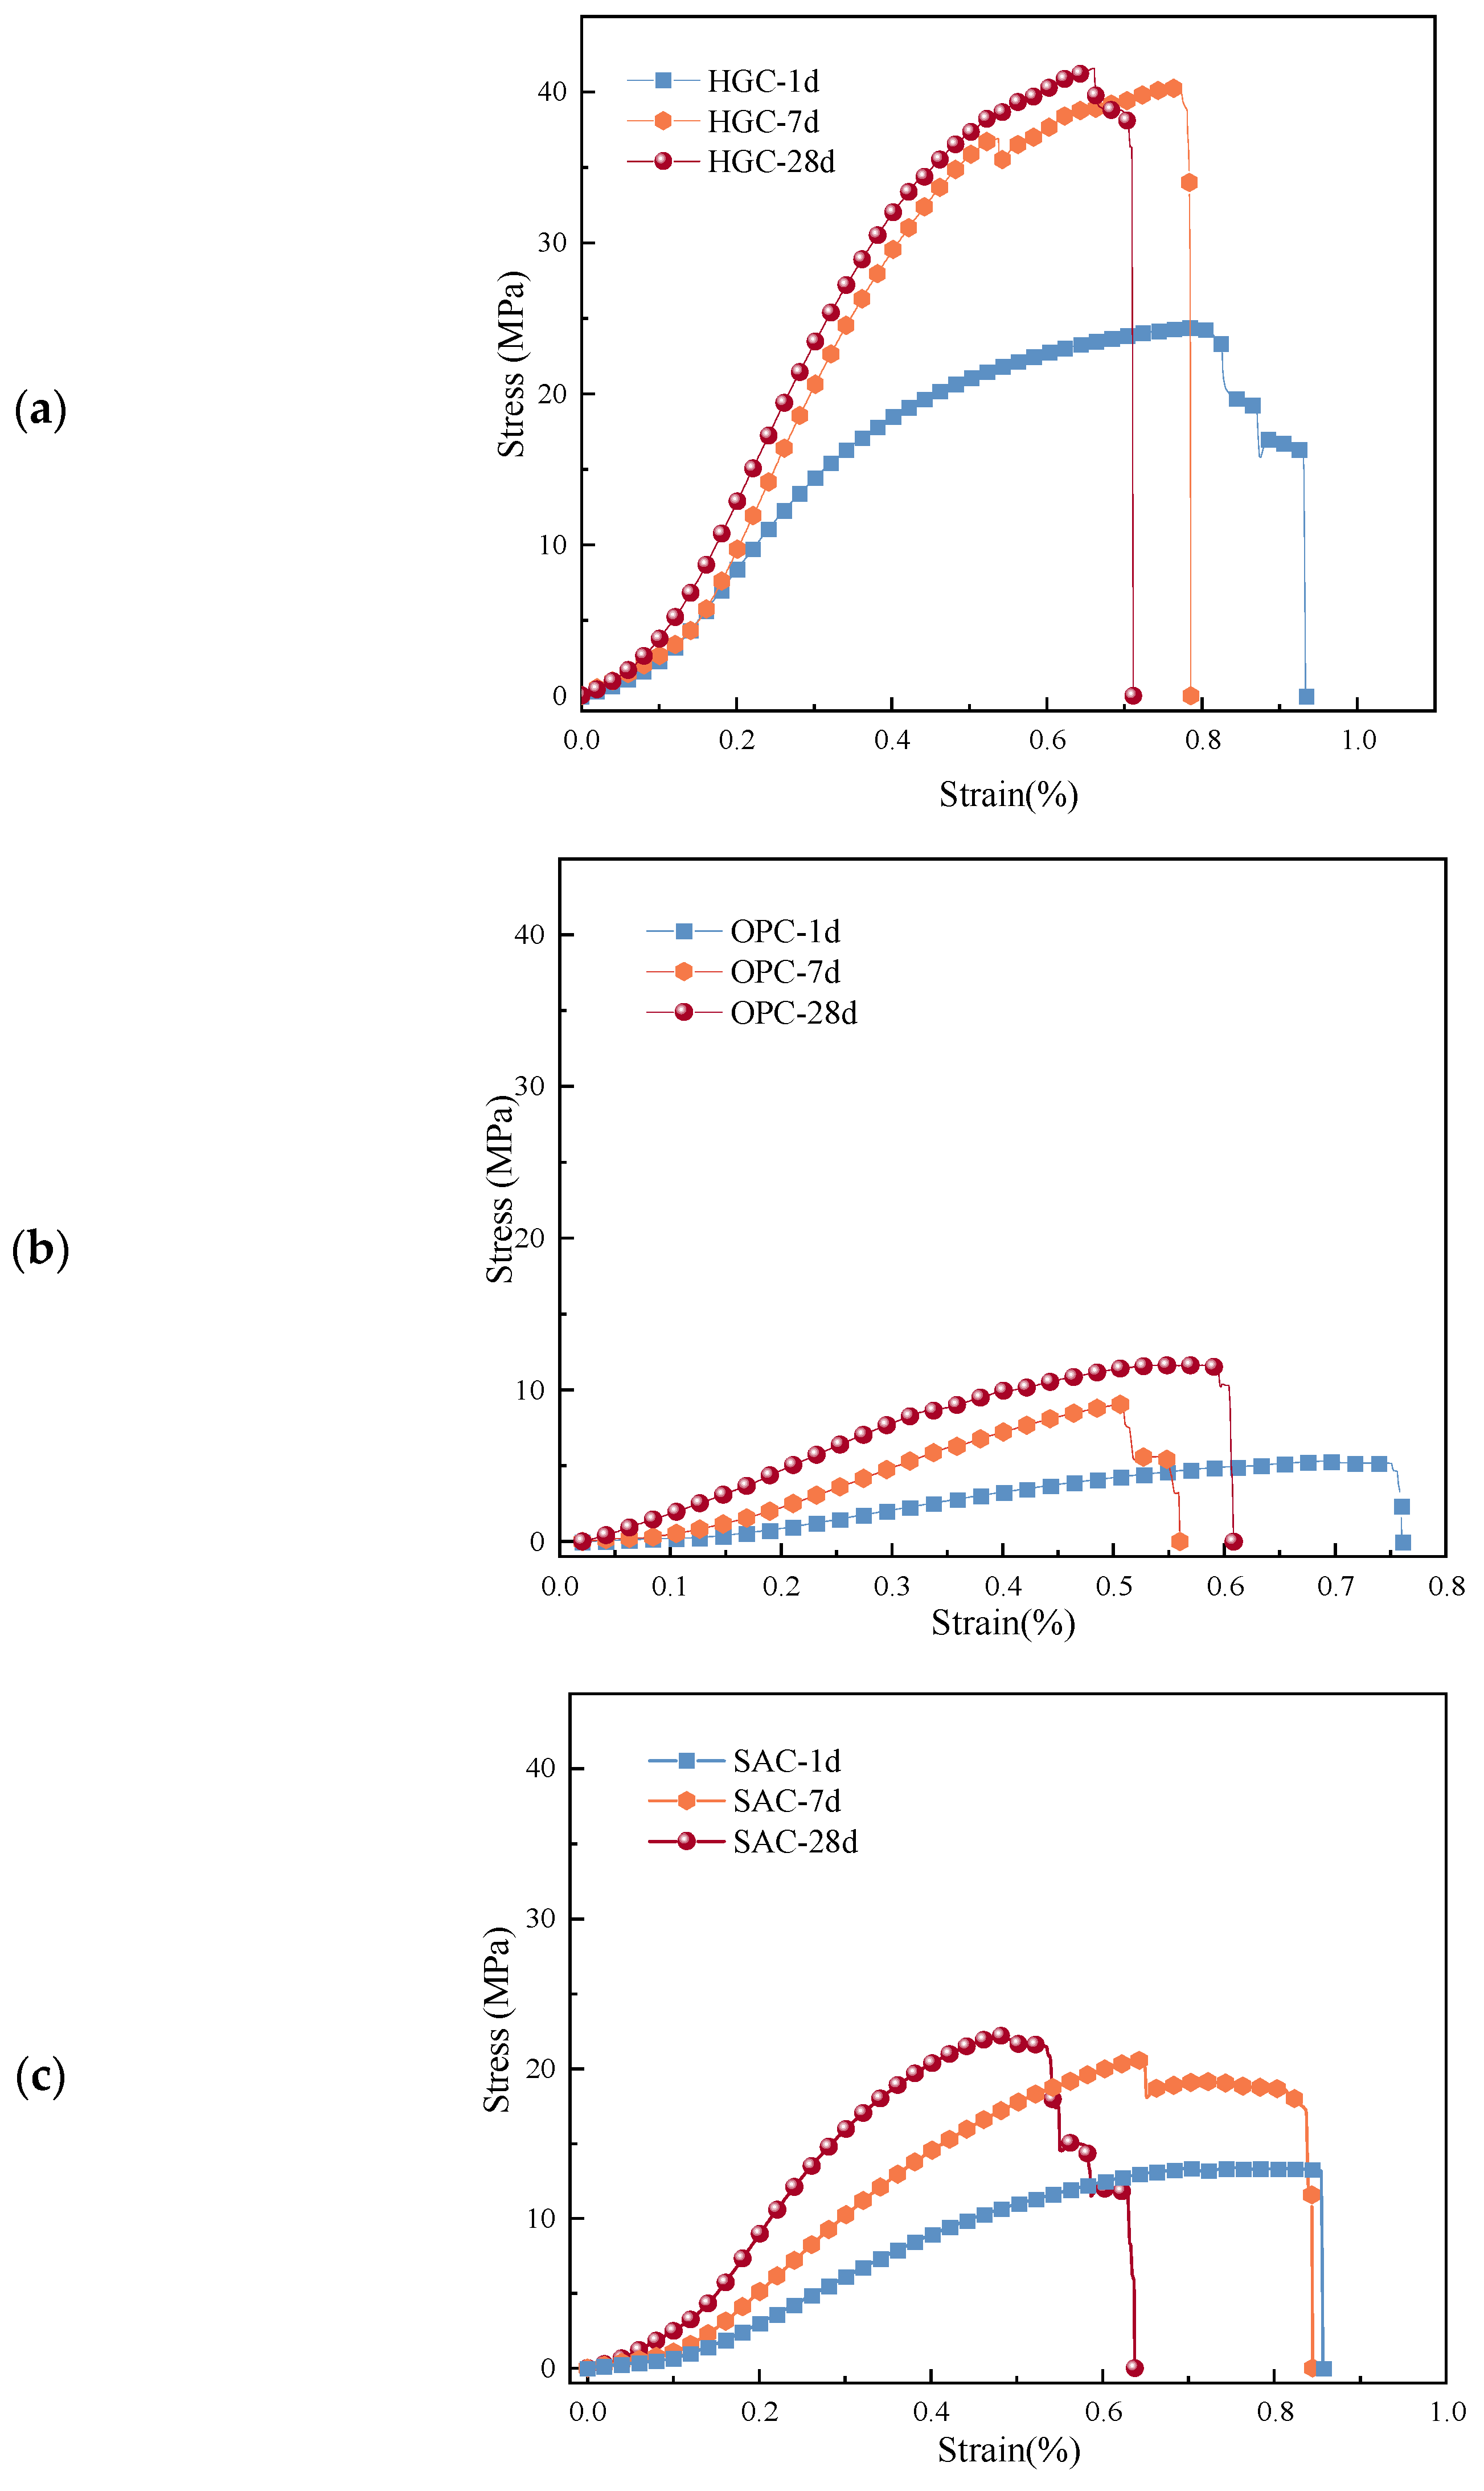
4.3. Strength and Failure Characteristics

Figure 9 displays stress–strain curves of grouted specimens at 1-day, 7-day, and 28-day curing stages. All specimens demonstrate three characteristic deformation phases: pore compaction, elastic deformation-to-crack initiation, and crack propagation-to-failure. Early-age specimens (1-day) exhibit lower strength due to incomplete hardening and unstable microstructures, showing slower stress development during compaction and diminished peak characteristics. Compared to 1-day and 7-day specimens, 28-day samples display accelerated stress development with shortened pore compaction phases. Notably, HGC and SAC grouts maintain residual post-peak stress without abrupt failure, demonstrating progressive fracture behavior under sustained loading.
Figure 10 illustrates uniaxial compressive strength (UCS) relationships derived from Figure 9 stress–strain data. HGC grout achieves UCS values of 24.28 MPa (1-day) and 41.57 MPa (28-day), surpassing OPC and SAC counterparts. SAC demonstrates superior early-stage strength growth (81.06%, 1–7 days), while OPC shows higher late-stage development (28.51%, 7–28 days), exceeding HGC (25.13%) and SAC (20.43%). HGC exhibits 77.97% early-stage growth (3.09% below SAC) with moderated late-stage progression. These findings confirm HGC’s dual advantage: superior ultimate strength and accelerated 7-day strength development compared to conventional cementitious grouts.
Figure 11 illustrates failure modes of cement specimens across curing periods. Early-age specimens (1-day, Figure 11a) display vertical splitting failure across all grout types, featuring upper compaction with subsequent top-down main crack propagation. HGC and OPC grouts develop multiple fine cracks during failure, contrasting with SAC’s brittle splitting failure accompanied by severe integrity loss.
Intermediate-cured specimens (7-day, Figure 11b) exhibit lateral deformation-dominated failure with extensive surface spalling. HGC samples show upper-region crack concentration while preserving lower-section integrity, whereas OPC fails through large penetrating cracks. SAC demonstrates combined failure mechanisms: upper spalling and mid-height penetrating cracks synergistically cause structural collapse.
Figure 11c shows distinct failure modes for 28-day cured specimens: HGC exhibits vertical compression failure with localized upper-section lateral deformation and absent penetrating cracks; OPC demonstrates typical brittle splitting failure through mid-specimen penetrating cracks causing severe fragmentation; and SAC maintains intermediate-stage failure patterns dominated by lateral deformation.
Comparative analysis reveals HGC’s consistent vertical compression failure across all curing stages, maintaining structural integrity without post-peak fragmentation or dynamic fracture, indicating superior ductility. Conversely, 28-day OPC undergoes complete brittle fragmentation, while HGC’s disintegration resistance demonstrates enhanced safety performance versus conventional cement grouts.

5. Discussion

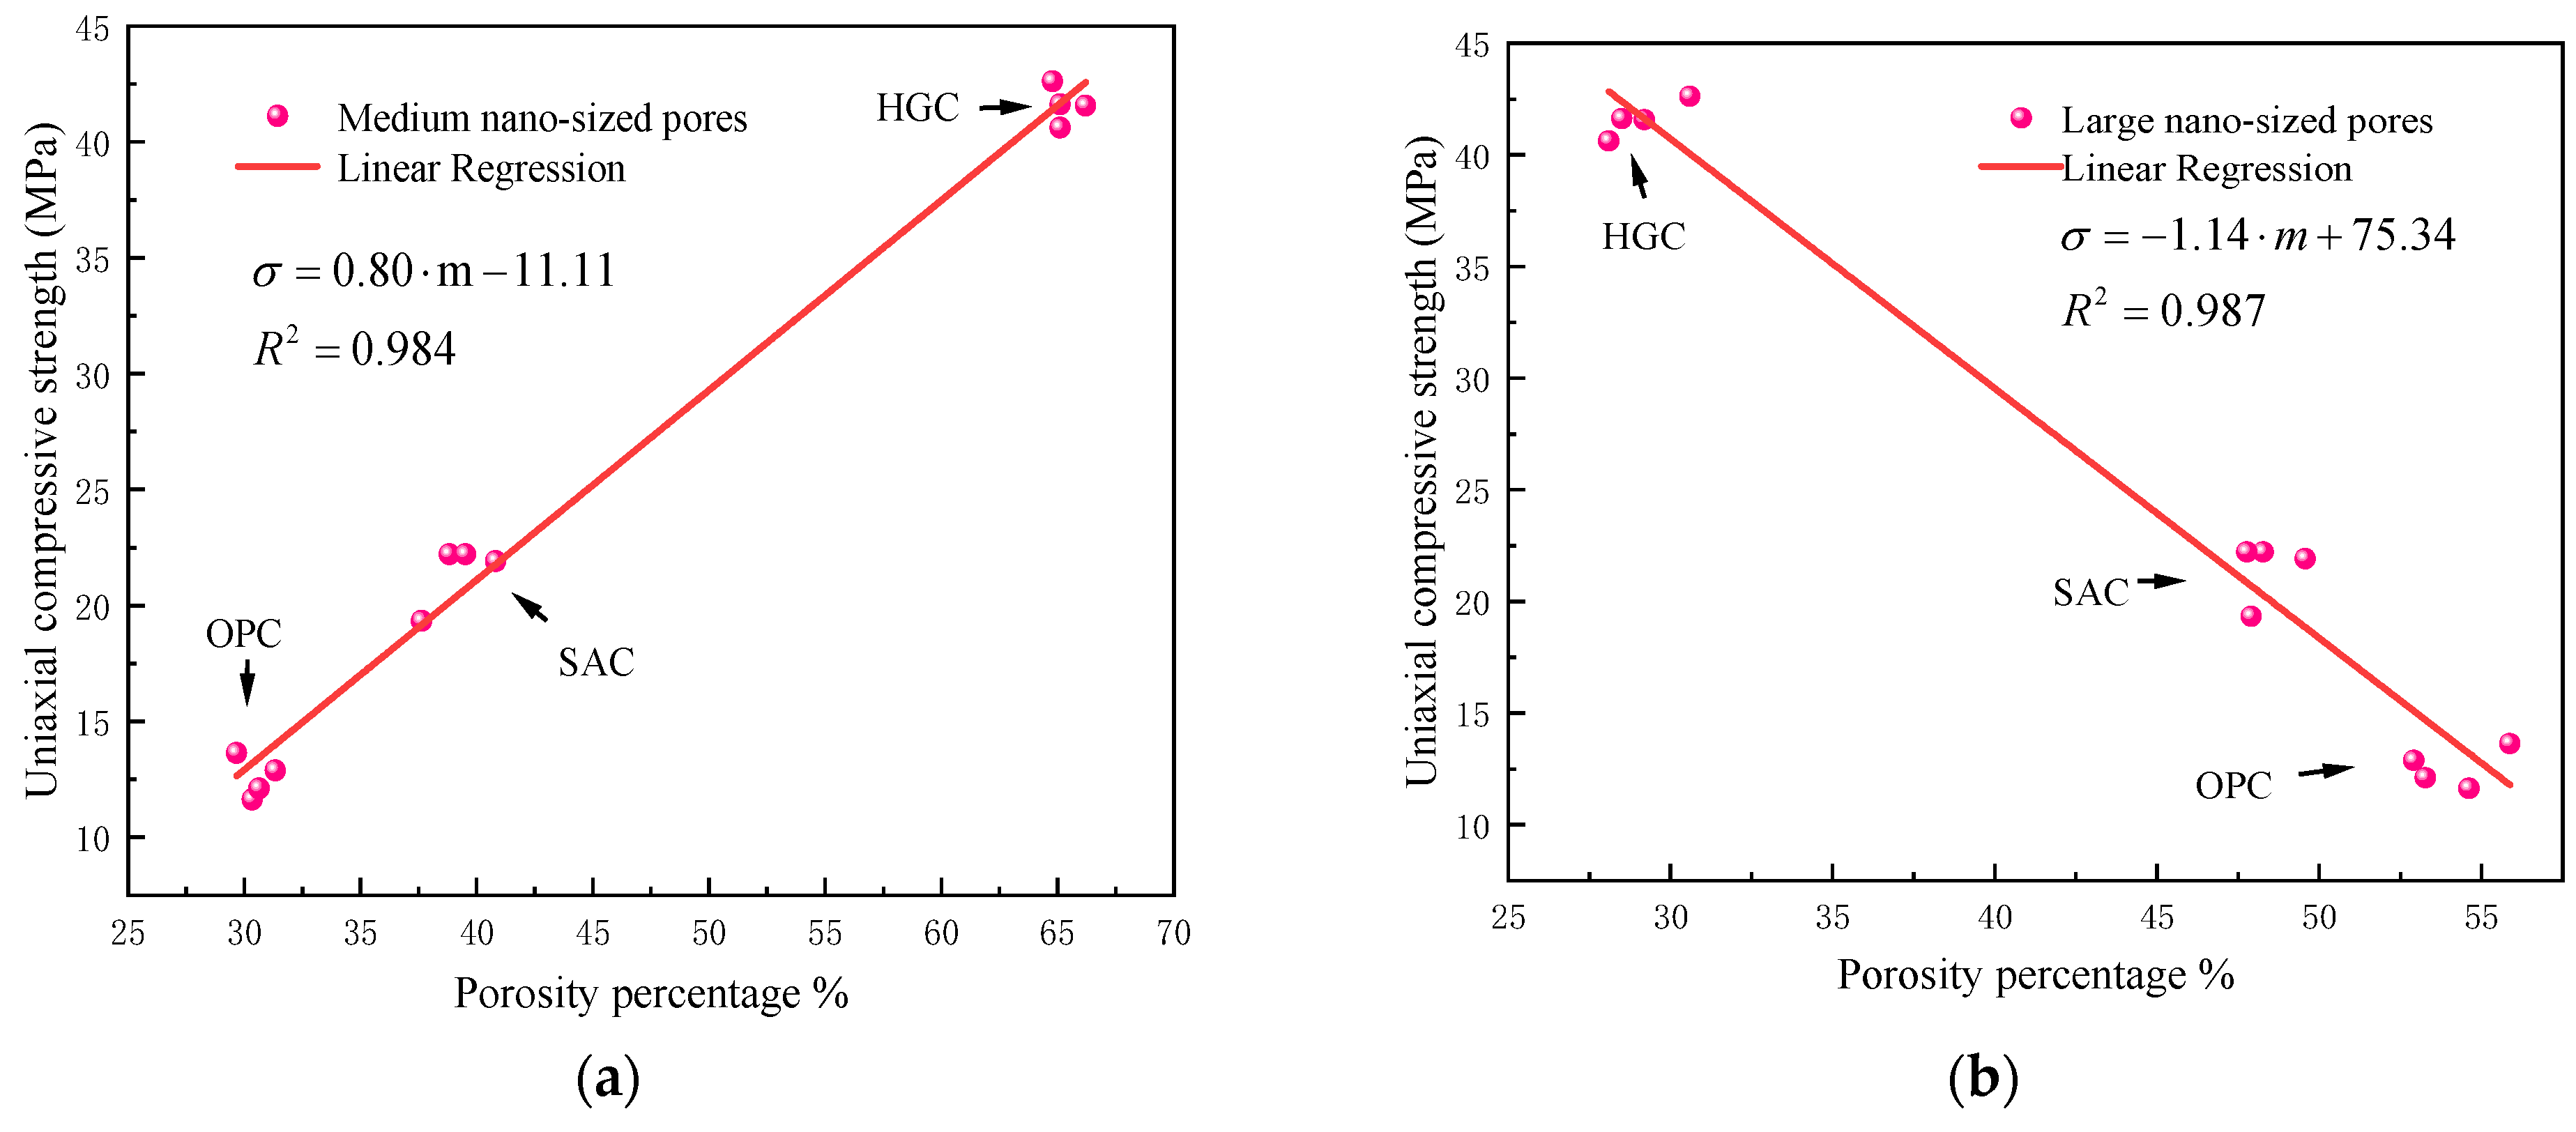
5.1. Pore Structure and Mechanical Properties

The 28-day uniaxial compressive strength (UCS) correlation analysis with NMR-derived pore size distribution focused on four critical pore categories: medium nanopores (10–50 nm), large nanopores (50–100 nm), small micropores (100–500 nm), and medium micropores (500–1000 nm), excluding minor small nanopores (<10 nm) and large micropores (>1000 nm), which collectively accounted for <3.5% total porosity. Experimental data established quantitative relationships between these dominant pore ratios and UCS values, as systematically presented in Figure 12.
Linear fitting was performed on the data in Figure 12, yielding the following fitting equations:
σ c = 0.80 m 11.11         R 2 = 0.984   Medium   nano-pores σ c = 1.14 m + 75.34   R 2 = 0.987   Large   nano-sized   pores σ c = 4.72 m + 56.22   R 2 = 0.998   Small   micron-sized   pores σ c = 5.92 m + 43.58   R 2 = 0.996   Medium   micron-sized   pores ,
σ c : uniaxial compressive strength (MPa); m : pore proportion (%).
Figure 12 and Equation (12) demonstrate distinct correlations between uniaxial compressive strength (UCS) and pore size distributions. UCS increases proportionally with medium nanopore content (slope = 0.8) while inversely correlating with large nanopores (slope = −1.14), small micropores (slope = −4.72), and medium micropores (slope = −5.92), revealing medium micropores’ dominant weakening effect. These experimental results validate the inverse porosity–strength relationship, particularly highlighting larger pores’ cumulative UCS degradation. This aligns with Liu et al. [36], confirming macropores’ positive correlation with large nanopores and negative association with medium nanopores.
The medium nanopores (1–10 nm) exhibit excellent size matching with C-S-H gel particles (typically around 5 nm), providing ideal filling spaces for the gel. During cement hydration, the continuously generated C-S-H gel progressively fills the medium nanopores, leading to gradual pore filling and densification. This optimizes the microstructure of the cement paste by shifting larger pores to smaller sizes and reducing the volume of strength-impairing large pores. When the cement specimen is subjected to external forces, medium nanopores can disperse stress, alter the stress transmission path within the cement paste, prevent localized stress concentration, and inhibit crack propagation, thereby enhancing the overall strength of the cement paste [37]. In this study, the HGC grout specimens exhibit higher strength due to their characteristic pore structure—containing higher proportions of medium nanopores and lower proportions of large nano-sized pores, resulting in lower microporosity.

5.2. Additives and Mechanical Properties

High-performance cementitious grout (HGC) demonstrates significant microstructural and mechanical advantages through synergistic chemical admixture effects: Thickeners form hydrogen bonds between hydroxyl groups on molecular chains and cement/aggregate surfaces, guiding ordered particle arrangement to reduce agglomeration and macropores while promoting nano-scale pore formation. This mechanism enhances paste–aggregate interfacial bonding, improving material compactness and strength [37]. Water reducers improve grout performance via dual actions: (1) adsorbing on cement particles to increase specific surface area, disrupting flocculated structures through electrostatic repulsion and steric hindrance to release trapped water; (2) forming adsorption films that reduce interparticle friction and enhance lubrication. These mechanisms collectively minimize evaporation-induced porosity while improving fluidity and injectability. Hydration product analysis reveals that systems without water reducers develop loose networks of columnar ettringite (AFt) and flocculent C-S-H gel, whereas systems with water reducers produce rod-like AFt and denser C-S-H gel that effectively fills AFt framework gaps. Progressive hydration further fills microstructural voids, forming homogeneous dense matrices [3]. HGC achieves superior peak strength and early-age strength compared to OPC and SAC. Specifically, the 1-day strength of HGC is 4.6 times that of OPC and 1.8 times that of SAC. The 28-day strength of HGC is 3.6 times that of OPC and 1.9 times that of SAC. HGC demonstrates exceptional suitability for grouting in deep high-stress environments due to its enhanced mechanical performance. Additionally, HGC contains 30% mineral powder+ fly ash, reducing cement consumption.

6. Conclusions

This study conducted comparative analyses of rheological properties and hardened performance between a novel composite cement grout (HGC) and traditional OPC and SAC grouts through shear rheological tests, structural tests, NMR analysis, and uniaxial compression experiments. The main conclusions are as follows:
(1)
The rheological test results demonstrate that the HGC grout exhibits higher shear stress and better conformity with the power-law model, whereas the OPC and SAC grouts display more pronounced Bingham characteristics. Thixotropy tests reveal that the HGC grout has a structural recovery time of 52 s after high-strain disturbance, significantly shorter than that of OPC (312 s) and SAC (121 s) grouts. During the construction of deep underground tunnels, HGC can rapidly seal fractures induced by blasting vibrations or rock mass deformation, thereby preventing further loosening of the surrounding rock. When injected into fractures under high pressure, it promptly reorganizes its gel network to effectively fill rock fragmentation zones. Notably, HGC contains a substantial amount of supplementary cementitious materials that enable continuous C-S-H gel formation, allowing for dynamic repair of microcracks caused by mechanical disturbances.
(2)
The NMR tests revealed that the porosities of HGC, SAC, and OPC cured grouts were 5.66%, 8.66%, and 9.71%, respectively. The HGC specimens exhibited a significantly higher proportion (94.86%) of the first peak in the T2 spectrum compared to SAC and OPC specimens. Pore size distribution analysis demonstrated that the HGC cured grouts were predominantly composed of medium nanopores, while OPC and SAC contained primarily large nano-sized pores.
(3)
The uniaxial compression tests demonstrated that the UCS of HGC, SAC, and OPC specimens exhibited a gradual decreasing trend across different curing ages. Compared with conventional cementitious materials, HGC showed faster UCS development during the initial 7 days, with a growth rate of approximately 77.97%. Regarding failure modes, both HGC and SAC specimens primarily failed through vertical splitting fractures while maintaining good post-peak integrity, whereas OPC specimens displayed typical brittle fragmentation failure characteristics.
(4)
For different specimens, the uniaxial compressive strength increases with the proportion of medium nanopores, while decreasing with increasing proportions of large nano-sized pores, small micropores, and medium micron-sized pores. The HGC grout contains additives with finer particles that form better gradation with the cementitious matrix, establishing a stable skeletal structure. This microstructure contributes significantly to enhancing both the structural stability and mechanical strength of the material.

Author Contributions

X.L.: validation, formal analysis, data curation & writing—review and editing. H.Q.: formal analysis, data curation, writing—original draft preparation & visualization. B.L.: supervision, project administration & funding acquisition. Y.Z.: formal analysis & data curation. J.L.: writing—review and editing. W.D.: conceptualization, methodology, software, validation, investigation, resources & writing—original draft preparation. W.T.: investigation & Writing—original draft preparation. All authors have read and agreed to the published version of the manuscript.

Funding

This study is supported by the National Natural Science Foundation of China [U22A20234], Hubei Province key research and development project [2023BCB121], and Wuhan innovation supporting projects [2023020201010079].

Data Availability Statement

The original contributions presented in this study are included in the article. Further inquiries can be directed to the corresponding author.

Conflicts of Interest

The authors declare no conflict of interest.

References

  1. Xiao, T.; Yu, Z.; Li, H.; Xu, L. Study on slurry diffusion law of grouting reinforcement for fractured surrounding rock in deep roadway. J. Henan Polytech. Univ. (Nat. Sci.) 2024, 43, 16–24. [Google Scholar]
  2. Ye, F.; Wang, B.; Han, X.; Liang, X.; Ying, K.-C.; Liang, X.-M. Review of Shield Tunnel Backfill Grouting Tests and Its Diffusion Mechanisml. China J. Highw. Transp. 2020, 33, 92–104. [Google Scholar] [CrossRef]
  3. Zhang, M.; Wang, P.; Yang, T.; Liu, X.; Wu, C. Effect of polycarboxylic acid water reducer on sulphoaluminate cement based grouting material. Coal Sci. Technol. 2025, 53, 348–361. [Google Scholar]
  4. Kang, H. Seventy years development and prospects of strata control technologies for coal mine roadways in China. Chin. J. Rock Mech. Eng. 2021, 40, 1–30. [Google Scholar]
  5. Li, L.; Wang, Y.; Mu, W.; Wang, X.; Wei, J.; Li, X. Grouting characteristics of cement-based materials added multitype additives considering the time-varying rheology. Constr. Build. Mater. 2025, 472, 140914. [Google Scholar] [CrossRef]
  6. Zhang, J.; Guan, X.; Li, H.; Liu, X. Performance and hydration study of ultra-fine sulfoaluminate cement-based double liquidgrouting material. Constr. Build. Mater. 2017, 132, 262–270. [Google Scholar] [CrossRef]
  7. Zhang, J.; Li, Y.; Zhao, W.; Bai, Y.; Han, G.; Xu, J.; He, J.; Liu, L.; Ren, Z. Test and application of self-stress slurry reinforcement for fractured rockmasses with different strength. J. China Coal Soc. 2023, 48, 3347–3359. [Google Scholar]
  8. Liu, X.; Wang, S.; Liu, B.; Liu, Q.; Zhou, Y.; Chen, J.; Luo, J. Cement-based grouting material development and prediction of material properties using PSO-RBF machine learning. Constr. Build. Mater. 2024, 417, 135328. [Google Scholar] [CrossRef]
  9. Li, Z.; Du, M.; Meng, X.; Wang, Q. Development of low—cost grouting material and its modification test. Coal Eng. 2018, 50, 108–111. [Google Scholar]
  10. Guo, D.; Tan, J.; Xiao, Z.; Zhang, Y. Study on the optimum proportion and grouting effect of superfine cement slurry. J. Henan Polytech. Univ. (Nat. Sci.) 2017, 36, 1–8+34. [Google Scholar]
  11. Yu, W.; Zhou, M.; Wan, X.; Guan, Q. Experimental study on physical properties of superfine cement grouting material. Front. Mater. 2022, 9, 1056135. [Google Scholar] [CrossRef]
  12. Liu, H.; Li, X.; Li, Y.; Zhang, S.; Chen, P.; Wu, Y.; Fan, Z.; Tang, C. Research on performance of new type cement slurry for water shutoff in coal mine roadway. Saf. Coal Mines 2021, 52, 57–63. [Google Scholar]
  13. Zhang, R.; Xu, B.; Yin, S.; Li, S.; Chang, Y.; Lian, H.; Cao, M. Quantitative experimental study on time-varying characteristics of bleeding of cement-based grouting materials. Coal Geol. Explor. 2022, 50, 153–161. [Google Scholar]
  14. Liu, J.; Wang, R.; Meng, Q.; Chen, L.; Wang, J.; Liu, J. Research Progress on Production Technology, Properties and Engineering Application of Superfine Cement. Bull. Chin. Ceram. Soc. 2023, 42, 1519–1528. [Google Scholar]
  15. Jun, Y.; Kim, J.H.; Kim, T. Hydration of Calcium Sulfoaluminate-Based Binder Incorporating Red Mud and Silica Fume. Appl. Sci. 2019, 9, 2270. [Google Scholar] [CrossRef]
  16. Xu, Y.; Zhang, E.; Zhao, L.; Shen, X.; Li, Z. Study on the law of influence by slurry viscosity on the fractured aquifer grouting and diffusion. J. Min. Sci. Technol. 2021, 6, 71–81. [Google Scholar]
  17. Zhang, E.; Shen, X.; Miao, W.; Ma, Z.; Tian, Y. Experimental study on the influence of grouting diffusion in fissure aquifer at the top Ordovician limestone. J. China Coal Soc. 2021, 46, 3536–3549. [Google Scholar]
  18. Zhang, J.; Liu, Y.; Zhu, J.; Liu, J.; Ma, Y.; Zhai, S.; Sun, Y. Investigation on the Flow and Thixotropic Properties of Alkali-Activated Concrete. Buildings 2024, 14, 4085. [Google Scholar] [CrossRef]
  19. Li, Q.; Fan, Y.; Shah, S.P. Rheological Properties and Structural Build-Up of Cement Based Materials with Addition of Nanoparticles: A Review. Buildings 2022, 12, 2219. [Google Scholar] [CrossRef]
  20. Yang, Z.; Zhou, C. Pore Structure of Water-Saturated Cement Mortars by Low-Field Nuclear Magnetic Resonance. J. Chin. Ceram. Soc. 2022, 50, 1391–1400. [Google Scholar]
  21. Li, B.; Ma, Q.; Zhang, F. Influence Mechanism Analysis of Ultrafine Ground Granulated Blast Furnace Slag and Silica Fume on Properties of Cement-Based Grouting Material. Bull. Chin. Ceram. Soc. 2022, 41, 4342–4352. [Google Scholar]
  22. Liang, H.; Qiao, J.; Lu, Y.; Wang, J.; Zhou, C. Relationships between Compressive Strength of Cement Mortars and Pore Structure Characteristics at Water-Saturation. J. Chin. Ceram. Soc. 2025, 53, 304–312. [Google Scholar] [CrossRef]
  23. Zhao, K.; Zhu, S.; Zhou, K.; Li, Q.; Gu, S.; Xie, Z. Mechanical Properties of Tantalum Niobium Tailings Cemented Concrete Under Different Proportions and Concentration. J. Basic Sci. Eng. 2020, 28, 833–842. [Google Scholar]
  24. Zhao, C.; Jiao, H.; Zhou, B.; Liu, F.; Zhang, F.; Luo, Y.; Yuan, J. Research on Mechanical Properties of Cement Emulsified Asphalt Mortar Under the Influence of Water-to-Cement Ratios and Water-Reducing Agent. Buildings 2025, 15, 22. [Google Scholar] [CrossRef]
  25. Wang, F.; Zhang, Y.; Song, X.; Liu, L.; Sun, X.; Sun, P. Influence of Self-Emulsifying Waterborne Epoxy Resin with Novel Hardeners on Pore Structure and Permeability of Cement-Based Materials. Buildings 2025, 15, 997. [Google Scholar] [CrossRef]
  26. Liu, B.; Zhu, L.; Liu, X.; Liu, Q.; Fan, Y.; Yao, W.; Deng, W. Energy evolution and damage deformation behavior of cemented broken coal specimen under triaxial compression condition. Energy 2024, 130, 133203. [Google Scholar] [CrossRef]
  27. Wu, Y.; Jiang, L.; Zhang, X.; Wang, Y. Study on impact resistance and impermeability of high-volume fly ash recycled aggregate concrete after exposure to high temperature. J. Build. Struct. 2022, 43, 124–133. [Google Scholar]
  28. Yang, S.; Dong, X.; Zhao, X.; Lu, J.-X.; Cui, H.; Poon, C.S. High value-added utilization of waste glass powder and steel slag for a novel zero-clinker cement: Coactivation mechanism and environmental impact. Constr. Build. Mater. 2025, 474, 141032. [Google Scholar] [CrossRef]
  29. Li, W.; Yin, J.; Wang, J.; Yang, H.; Kong, X. Principles and Applications of Low-Field Nuclear Magnetic Resonance in Cementitious Materials. J. Chin. Ceram. Soc. 2022, 50, 2992–3008. [Google Scholar]
  30. Feng, K. Effect of Thickening Agents on the Rheological Properties of Cement-Based Materials and Its Mechanism. Master’s Thesis, Central South University, Changsha, China, 2023. [Google Scholar]
  31. Cheng, C. Influences of Water Reducers with Different Anchoring Groups on Properties of Fresh Cement Pastes: Rheology and Temperature Sensitivity. Master’s Thesis, Beijing Jiaotong University, Beijing, China, 2020. [Google Scholar]
  32. Lawrence, M.A.; David, R.C. Characterization and Analysis of Porosity and Pore Structures. Rev. Mineral. Geochem. 2015, 80, 61–164. [Google Scholar]
  33. Yao, W.; She, A.; Yang, P. 1H-Nmr Relaxation and State Evolvement of Evaporable Water in Cement Pastes. J. Chin. Ceram. Soc. 2009, 37, 1602–1606. [Google Scholar]
  34. Costa, H.N.D.; Cabral, A.E.B.; Nogueira, R.E.F.Q. Alkali-activated pastes by Basic Oxygen Furnace slag and fly ash: Mechanical and microstructural analysis. Case Stud. Constr. Mater. 2025, 22, e04128. [Google Scholar] [CrossRef]
  35. Yang, P. Research on Permeation Grouting Reinforcement Effect of Water-Rich Sand Based on Bleeding Effect of Cement Grout. Master’s Thesis, Shandong University, Jinan, China, 2020. [Google Scholar]
  36. Liu, X.; Wang, S.; Liu, B.; Chen, J.; Liu, Q.; Luo, J. Effect of Microstructure on Changes to the Pore Structure and Mechanical Properties of Limestone under Acidic Groundwater Corrosion. Int. J. Geomech. 2023, 23, 04023212. [Google Scholar] [CrossRef]
  37. Xu, Z.; Mei, J.; Wang, Z.; Liao, Y.; Liao, G.; Li, H. Effect of Nano C-S-H on Hydration of Mineral powder-Cement System. Bull. Chin. Ceram. Soc. 2022, 41, 13–19. [Google Scholar] [CrossRef]
Figure 1. Raw materials and additives. (a) Morphology of materials; (b) particle size cumulative curve.
Buildings 15 01796 g001
Figure 2. Experimental flow chart.
Buildings 15 01796 g002
Figure 3. Shear strength–rate results and fitted curves. (a) Bingham model fitting results; (b) power-law model fitting results.
Buildings 15 01796 g003
Figure 4. Small−oscillation test results. (a) HGC cement; (b) OPC; and (c) SAC.
Buildings 15 01796 g004aBuildings 15 01796 g004b
Figure 5. Thixotropy test results. (a) HGC cement paste; (b) OPC paste; (c) SAC paste.
Buildings 15 01796 g005
Figure 6. NMR T2 relaxation distributions and spectral area ratios for different materials. (a) T2 distribution; (b) relative area percentage of each spectral peak.
Buildings 15 01796 g006
Figure 7. NMR pore size distribution curves and laws. (a) Pore size distribution; (b) pore size distribution pattern.
Buildings 15 01796 g007
Figure 8. Microstructure of the different specimens. (a) HGC; (b) OPC; and (c) SAC.
Buildings 15 01796 g008
Figure 9. Stress–strain curves for different samples. (a) HGC cured grout; (b) OPC cured grout; and (c) SAC cured grout.
Buildings 15 01796 g009
Figure 10. Uniaxial compressive strengths for different cements.
Buildings 15 01796 g010
Figure 11. Final failure patterns for specimens with different curing times. (a) 1 d; (b) 7 d; and (c) 28 d.
Buildings 15 01796 g011aBuildings 15 01796 g011b
Figure 12. Relationship between UCS and pore size proportion. (a) Medium nano-sized pores; (b) large nano-sized pores; (c) small micron-sized pores; and (d) medium micron-sized pores.
Buildings 15 01796 g012aBuildings 15 01796 g012b
Table 1. Material composition.
Material CompositionOPCSACFly AshMineral Powder
HGC54.25%15.75%10%20%
OPC100%000
SAC0100%00
Table 2. Main performance index of cement.
Performance IndexDensities (g/m3)Specific Surface Area (m2·kg−1)StabilitySolidification Time (min)Compressive Strength (MPa)Flexural Strength (MPa)
InitialFinal1 d3 d28 d1 d3 d28 d
OPC3.01358Qualified17223427.238.651.35.57.628.85
SAC2.85542Qualified131935.243.348.66.77.48.6
Table 3. Chemical composition of experimental materials.
MaterialsSiO2F2O3Al2O3CaOMgOSO3TiO2Loss
HGC27.65%3.12%15.41%41.85%4.13%4.14%0.50%3.20%
OPC24.99%4.03%10.03%51.42%3.71%2.51%03.31%
SAC9.29%2.02%23.28%41.91%2.98%14.76%1.28%4.48%
Fly ash54.94%2.52%32.4%2.63%0.81%0.83%3.01%2.86%
Mineral powder35.68%1.81%15.32%35.44%7.83%1.86%02.06%
Table 4. Main performance index.
Performance IndexSpecific Surface Area (m2·kg−1)Water Demand Ratio %Densities (g/m3)Particle Size (μm)
D10D50D90
Fly ash420932.4231650
Mineral powder465753.1221130
Table 5. Fitting equation table.
MaterialsBingham ModelPower Law Model
HGC τ = 5.19 · γ 66.73 τ = 1.64 · γ 1.21
OPC τ = 0.16 · γ + 17.64 τ = 6.28 · γ 0.37
SAC τ = 0.12 · γ + 7.70 τ = 1.91 · γ 0.51
Table 6. Recovery time table.
MaterialsRecovery Time (s)
HGC52
OPC315
SAC121
Disclaimer/Publisher’s Note: The statements, opinions and data contained in all publications are solely those of the individual author(s) and contributor(s) and not of MDPI and/or the editor(s). MDPI and/or the editor(s) disclaim responsibility for any injury to people or property resulting from any ideas, methods, instructions or products referred to in the content.

