Article

Coordinated Spatio-Temporal Operation of Wind–Solar–Storage-Powered Data Centers Considering Building Thermal Inertia

1
Energy Internet Key Laboratory of Shanxi Province, School of Electrical and Power Engineering, Taiyuan University of Technology, Taiyuan 030024, China
2
Shanxi Energy Internet Engineering Research Center, Taiyuan 030024, China
3
Shanxi Energy Internet Research Institute, Taiyuan 030024, China
4
State Grid Shandong Electric Power Research Institute, Jinan 250002, China
*
Author to whom correspondence should be addressed.
Buildings 2025, 15(11), 1782; https://doi.org/10.3390/buildings15111782
Submission received: 18 April 2025 / Revised: 12 May 2025 / Accepted: 20 May 2025 / Published: 23 May 2025
(This article belongs to the Section Building Energy, Physics, Environment, and Systems)

Abstract

In the context of the booming digital economy, the energy consumption of data centers (DC) is experiencing exponential growth, and achieving green transformation has become a crucial issue. This paper presents a coordinated spatio-temporal operation of wind–solar–storage-powered DCs considering building thermal inertia. Firstly, based on users’ differentiated needs, the spatio-temporal flexibility of data loads is deeply explored to lower DC’s operation costs through load shifting. Secondly, a DC mathematical model considering building thermal inertia is established, revealing the quantitative relationship among air-conditioning power, data load rate, and building parameters. Finally, a coordinated spatio-temporal operation of wind–solar–storage-powered DCs considering building thermal inertia is proposed to promote renewable energy consumption and realize the green transformation of DC. The case study results show that the proposed strategy reduces the DC operation cost by 37.92% and significantly increases the renewable energy-consumption ratio.

1. Introduction

With the full arrival of the digital economy, global DC energy consumption has shown an exponential rise. According to the International Energy Agency (IEA), DCs already account for 2.5% of the world’s total electricity consumption in 2022 and are growing at an average annual rate of more than 15% [1]. The problem of high energy consumption in DC is becoming more and more serious, and how to achieve green and low-carbon transformation through multi-dimensional synergistic optimization has become the core proposition for the sustainable development of DC.
Numerous scholars have conducted research on energy management in DC. Empirical studies reveal that information technology (IT) equipment contributes significantly to DC energy profiles, representing nearly half of aggregate power consumption [2], which is primarily utilized for computing and task processing. Consequently, it is imperative to explore methods to enhance energy efficiency by leveraging the regulatory potential of the load, both temporally and spatially. Reference [3] exploited spatial regulation of energy usage in DC so that geographically distributed multiple DCs can dynamically share physical resources. Reference [4] exploited the temporal regulation of energy usage in DC to reduce the total energy cost of DC operators. Reference [5] exploited the spatial and temporal regulation of energy use in DC and proposed a coupled DC load modeling approach that considered multiple regulation methods to facilitate demand response in DC.
At the same time, about 37% of the energy consumption of the DCs comes from the air-conditioning system [2], which leads to a certain lag in the indoor temperature change due to the good cooling storage capacity of the materials constituting the DC envelope [6]. Therefore, DC building energy use will show certain energy storage characteristics and flexibility. By fully exploiting the building thermal inertia of the DC, the economic flexibility of DC operation can be significantly improved. Reference [7] has demonstrated that the energy consumption of air-conditioning systems can be reduced by adjusting the operating parameters based on the thermal inertia of the DC building. Reference [8] has employed thermal inertia to regulate indoor temperature fluctuations in DC, thereby facilitating energy savings. While the aforementioned studies have made significant contributions, the present research primarily focuses on management optimization, neglecting to leverage synergies with renewable energy and energy storage (ES). This hinders the realization of a green and low-carbon transition through multi-dimensional synergies.
In the context of the global emphasis on sustainable development, the role of renewable energy sources, such as solar and wind, in transforming the energy structure is paramount due to their clean and inexhaustible characteristics [9]. ES has been identified as a pivotal solution to meet the challenges of the intermittency and volatility of renewable energy generation, enabling the flexible storage and deployment of energy [10]. In the context of DC, a synergistic approach entails the integration of wind, solar, and ES with the energy management of DC, thereby facilitating the establishment of an efficient and low-carbon energy supply system [11]. Through a systematic planning process, solar and wind are integrated with the DC, enabling the direct provision of green power. Conversely, ES ensures the stability of the power supply by storing power when there is an excess of renewable energy generation and releasing power [12]. Through the DC and WF, PV and ES’ coupling synergy can realize the dynamic balance of energy supply and demand and multi-energy complementary optimization, significantly enhancing the local consumption rate of renewable energy and system energy efficiency level. Reference [13] used ES to reduce the energy consumption of DCs and improve the operating economy. Reference [14] proposed the use of a water–wind–solar complementary power generation system, which effectively reduces the cost of electricity in DCs. Reference [15] considered the integration of co-located solar power and battery storage to improve renewable energy utilization for DC operations. However, research on the synergistic integration of renewable energy systems with building thermal inertia and spatio-temporal load regulation in DCs remains underdeveloped. Existing studies have largely treated these elements in isolation, neglecting their combined potential to enhance energy flexibility.
As demonstrated in the preceding analysis, this paper puts forward a coordinated spatio-temporal operation strategy of wind–solar–storage-powered DCs considering building thermal inertia, with the following main contributions:
(1)
Based on the differentiated needs of users, the spatio-temporal flexibility of data loads is deeply explored, which enables DC to reduce the operation cost by leveling and transferring the data loads;
(2)
Considering the building thermal inertia of the DC, a mathematical model of the DC taking into account the building thermal inertia is established, and the quantitative mathematical relationship between air-conditioning power, data load rate, and building parameters is given;
(3)
We propose a coordinated spatio-temporal operation of wind–solar–storage-powered DCs considering building thermal inertia, which improves the consumption of renewable energy and realizes the green transformation.

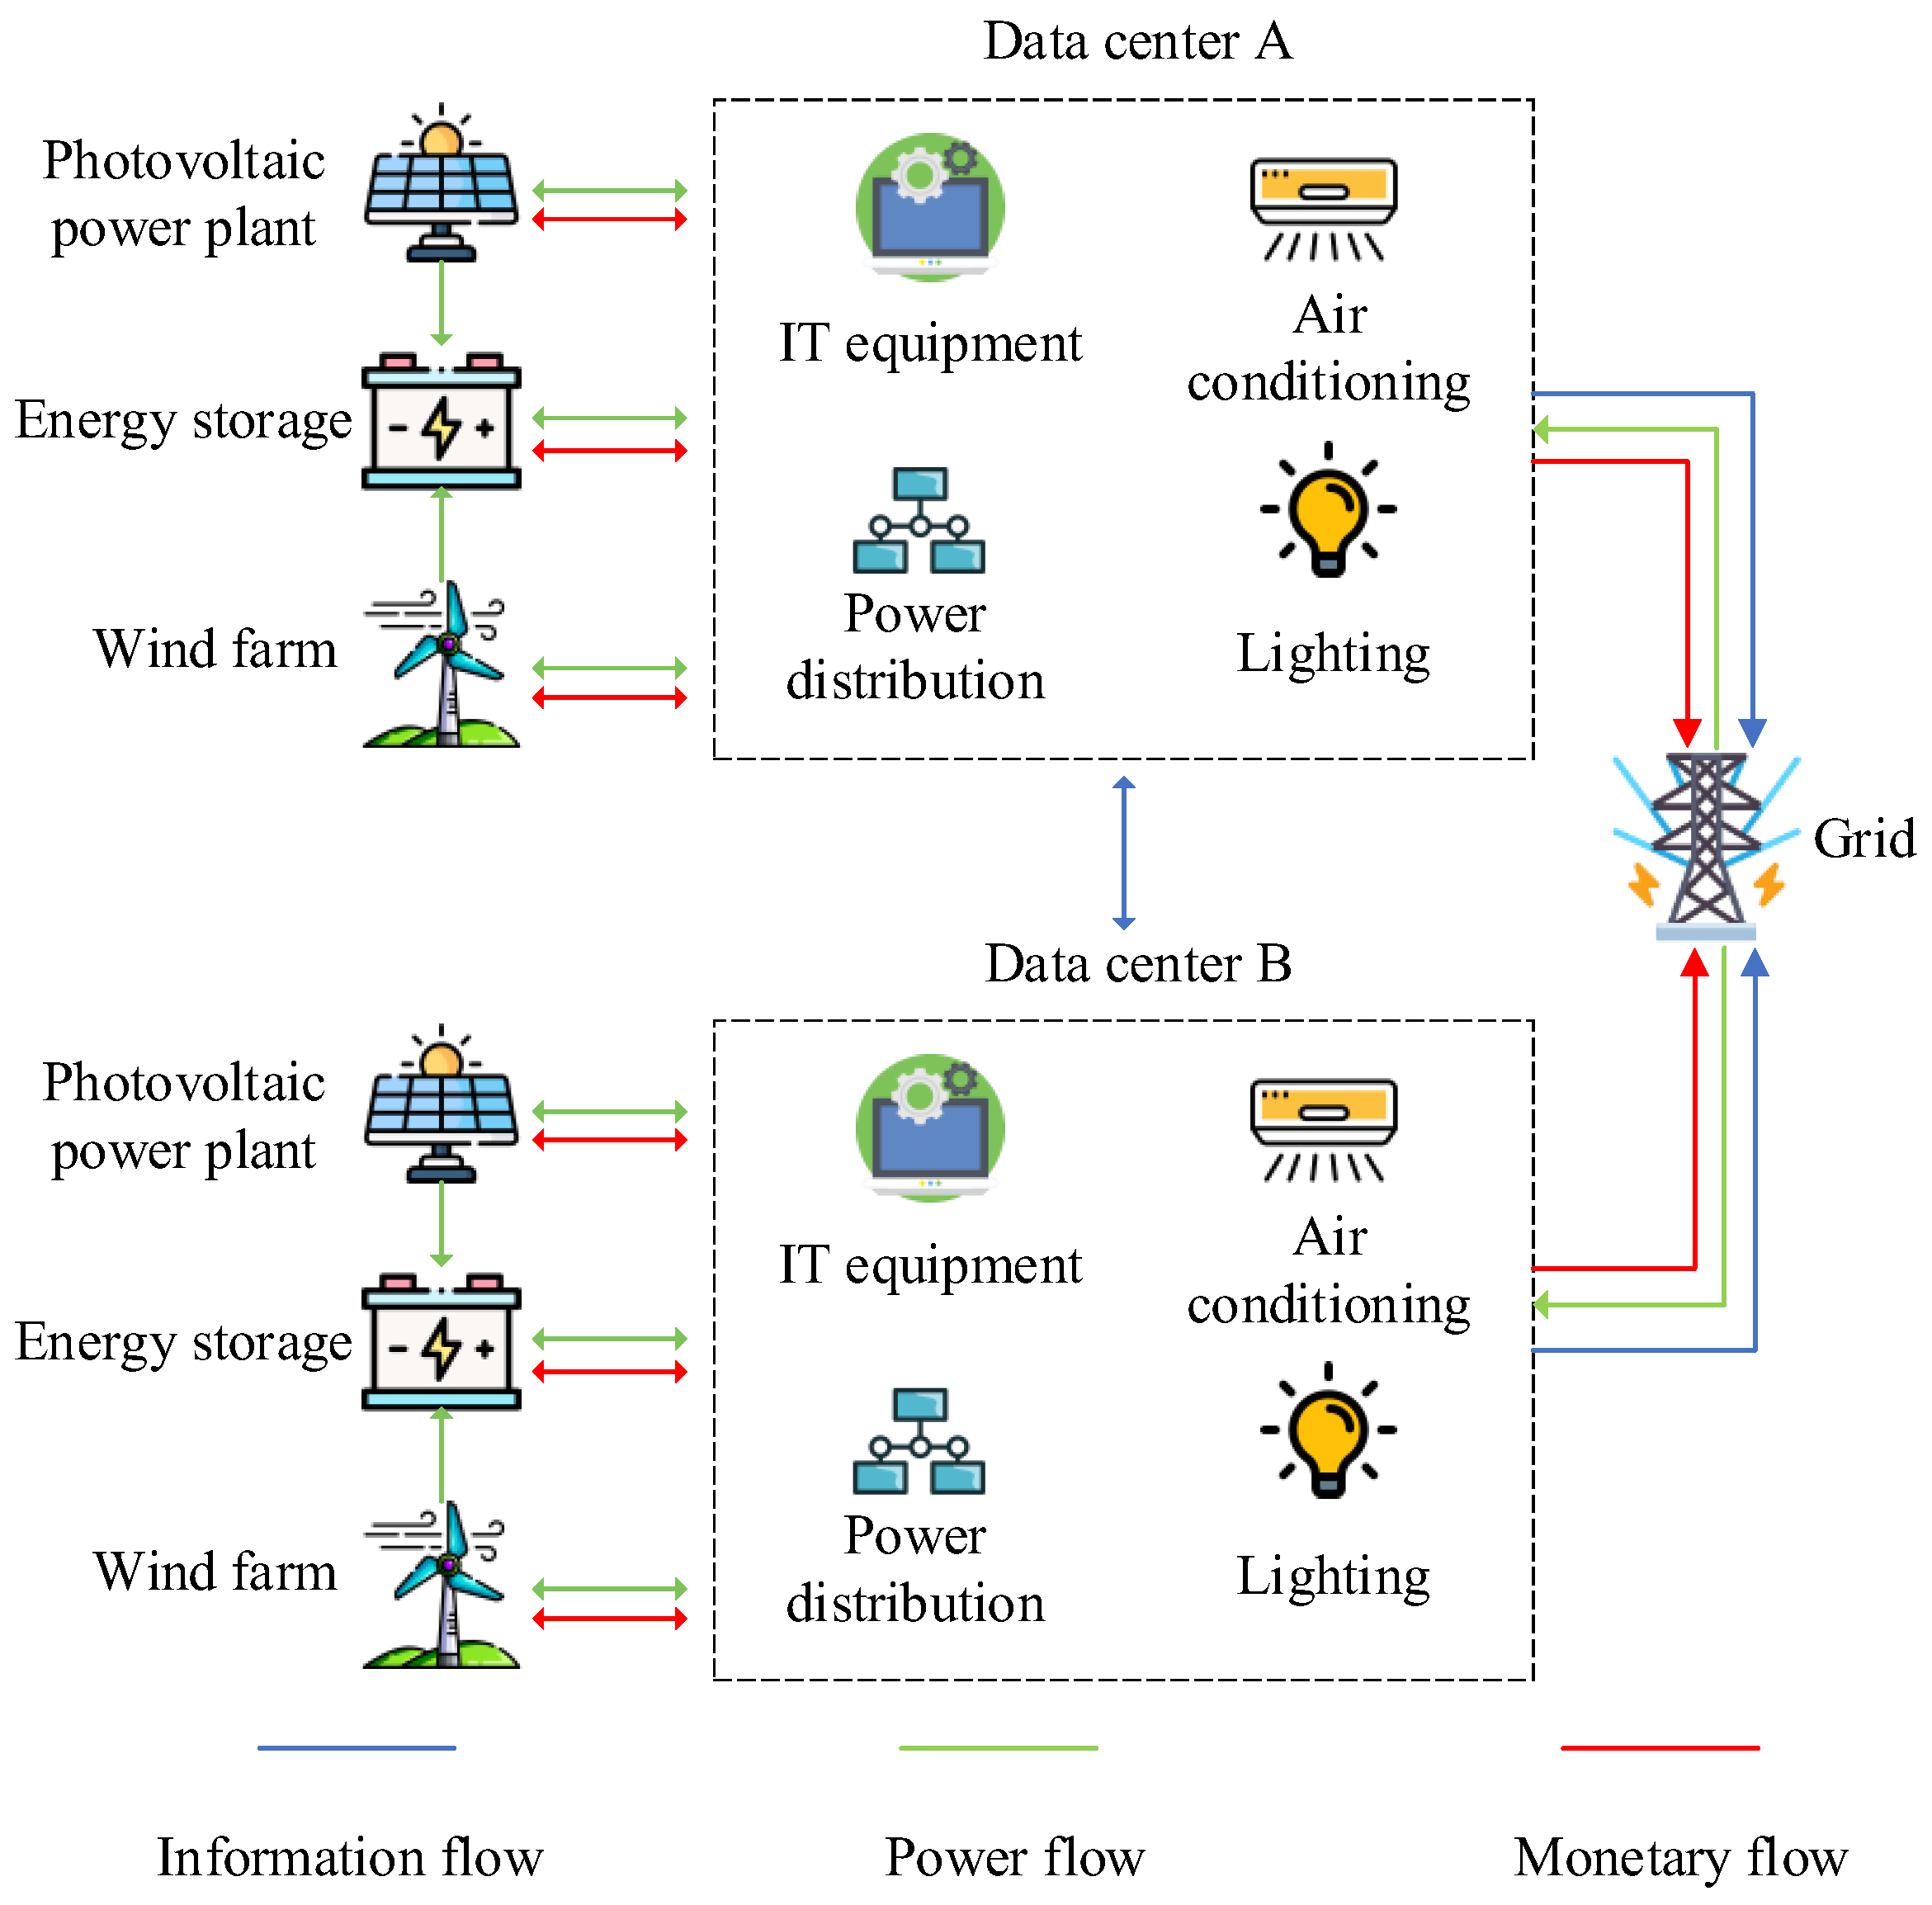
2. Problem Description

The operation framework of the DC integrated with wind, solar, and ES is shown in Figure 1. Energy consumption in a DC is mainly driven by IT equipment, air conditioning, power distribution, and lighting. Based on the difference in real-time demand, IT equipment carries two types of loads: interactive loads and batch loads. Interactive loads are delay-sensitive and do not have the ability to regulate time, but their data load transmission speed is extremely fast, so they can be flexibly deployed on a spatial scale. Batch loads are delay-tolerant and have the ability to migrate in time sequence, showing a high degree of flexibility in regulating both time and space scales [16] since a large proportion of the electricity consumed by IT equipment is converted into heat. Thus, air-conditioning systems consume a large amount of electricity for cooling.
By deploying a wind farm (WF), a photovoltaic power plant (PV), and ES devices within the DC, the DC is able to capture energy from this source. At the same time, ES can store the surplus energy to be used in case of an emergency. In addition, DC can also purchase power from the grid.

3. Mathematical Formulation

3.1. Objective Function

In this paper, with the objective of economic optimization, the total cost C includes the cost of purchasing electricity for the DC C b u y , as well as the cost of operation and maintenance C o p .
min C = C b u y + C o p
C b u y = t = 1 T ( P b u y , t D C , A + P b u y , t D C , B ) c t e
C o p = ω P V ( P P V , t D C , A + P P V , t D C , B ) + ω W T ( P W T , t D C , A + P W T , t D C , B ) + ω E S ( P E S , c h , t D C , A + P E S , c h , t D C , B + P E S , d i s , t D C , A + P E S , d i s , t D C , B )

3.2. DC Energy-Consumption Model

P t D C = P t I T + P t A C + P t L
P t L = P 0 L + χ P t I T

3.2.1. IT Equipment Model

P t I T = Σ m M Σ s S P m , s , t
P m , s , t = P m , s t + P m , d y , t
P m , d y , t = k m f m 3

3.2.2. Air-Conditioning System Model

Based on the building’s thermal inertia, the heat balance equation of the building is obtained based on the conservation of energy as follows:
Δ Q = ρ C V d T t i n d t
k w a l l F w a l l ( T t o u t T t i n ) + k w i n F w i n ( T t o u t T t i n ) + I F w i n S C + Q t I T Q t A C = ρ C V d T t i n d t
where ρ = 1.225 kg/m3 according to reference [17], and C = 1.005 kJ/(kg·K) according to reference [18].
The power expression for an air-conditioning system is shown below:
P t A C = Q t A C / E E E R

3.2.3. PV Model

The light intensity of PV obeys a Beta distribution, and the density function that represents its probability is as follows:
f P V ( r ) = Γ ( a + b ) Γ ( a ) Γ ( b ) r a 1 ( 1 r ) b 1
The output power of PV with the intensity of sunlight, temperature, and other uncertainties.
P t P V = P S T C G t G S T C ( 1 + k ( T t T S T C ) )

3.2.4. WF Model

In the WF model, the output power P t W T is calculated using the following equation:
P t W T = 0 ν < ν i 0.5 ρ π R 2 ν 3 ν i < ν < ν n P n ν n < ν < ν 0 0 ν > ν 0

3.2.5. ES Model

The ES is modeled based on the law of conservation of energy and battery operation constraints as follows [19]:
E t E S = ( 1 τ ) E t 1 E S + [ η ch P E S , t c h 1 η dis P E S , t d i s ] Δ t
P E S , t c h = max { 0 , P t E S }
P E S , t d i s = max { 0 , P t E S }
10 % E E S max E t E S 90 % E E S max
E 0 E S = 20 % E E S max
E 0 E S = E T E S

3.3. Constraints

3.3.1. Data Load Rate Constraints

The data load rate is the amount of cloud subscriber load per unit of time allocated to a DC. The sum of the data load rates of the N DC at time t  λ t can be expressed as
λ t = λ t i t r + λ t b a t c h
Accordingly, the data load rate of the nth DC λ n , t can be expressed as
λ n , t = λ n , t i t r + λ n , t b a t c h

3.3.2. Aggregate Service Rate Constraints

The sum of the service rates of the N DC in terms of server types μ t is represented as
μ t = i = 1 N m M s S μ t , i m , s
From the point of view of the user’s real-time requirements, it can also be expressed as follows:
μ t = μ t i t r + μ t b a t c h
Interactive loads have spatial adjustment capabilities, as shown below:
n = 1 N u n , t i t r = n = 1 N u ^ n , t i t r
The batch load has the flexibility to be regulated in both time and space; it can be represented as
n = 1 N t = 1 N T u n , t b a t c h = n = 1 N t = 1 N T u ^ n , t b a t c h

3.3.3. Maximum Response Time Constraints

The maximum response time of an interactive load satisfies the following constraints:
t w , t D i t r d i t r
The maximum response time for batch loads satisfies the following constraints:
t = 1 T b a t c h μ t b a t c h = t = 1 T b a t c h λ t b a t c h

3.3.4. Indoor Temperature Requirements

The indoor temperature during normal operation of the DC servers should be within a certain interval range, which meets the following constraints:
T min i n T t i n T max i n

3.3.5. Maximum Data Load Rate Constraint

DC servers should process data within the maximum data load they can handle, meeting the following constraints:
0 λ n , t λ n , max

3.3.6. Server Operating Frequency and Service Rate Constraints

In order to adjust the CPU frequency and service rate in real time according to the load demand, the server processors considered in this paper are equipped with discrete operating frequencies and service rate steps that correspond to each other:
f t f 1 , f 2 , f h , f H
μ t μ 1 , μ 2 , μ h , μ H
The CPU operating frequency ft and service rate μt at time period t are specifically described as
f t = f H x t H = [ f 1 , f 2 , f h , f H ] x t 1 x t 2 x t h x t H
μ t = μ H x t H = [ μ 1 , μ 2 , μ h , μ H ] x t 1 x t 2 x t h x t H
f h x t h = 1
x t h 0 , 1

3.3.7. Air-Conditioning Operational Constraints

0 P t A C P max A C

3.3.8. Renewable Energy Capacity Constraints

0 P t P V P max P V
0 P t W T P max W T

3.3.9. ES Multiplier Constraints

E E S max = β P E S max
where β is the energy multiplier of the ES.

3.3.10. Power Balance Constraints

P t D C = P t P V + P t W T + P t E S + P b u y , t D C

4. Case Studies

4.1. Basic Data

Table 1 shows the relevant parameters of DC, PV, WF, and ES [20,21]. The upper limit of the response time for batch loads is set to 24 h; the optimization period of the model is 24 h, and the indoor temperature range of the servers is 18–27 °C [22].

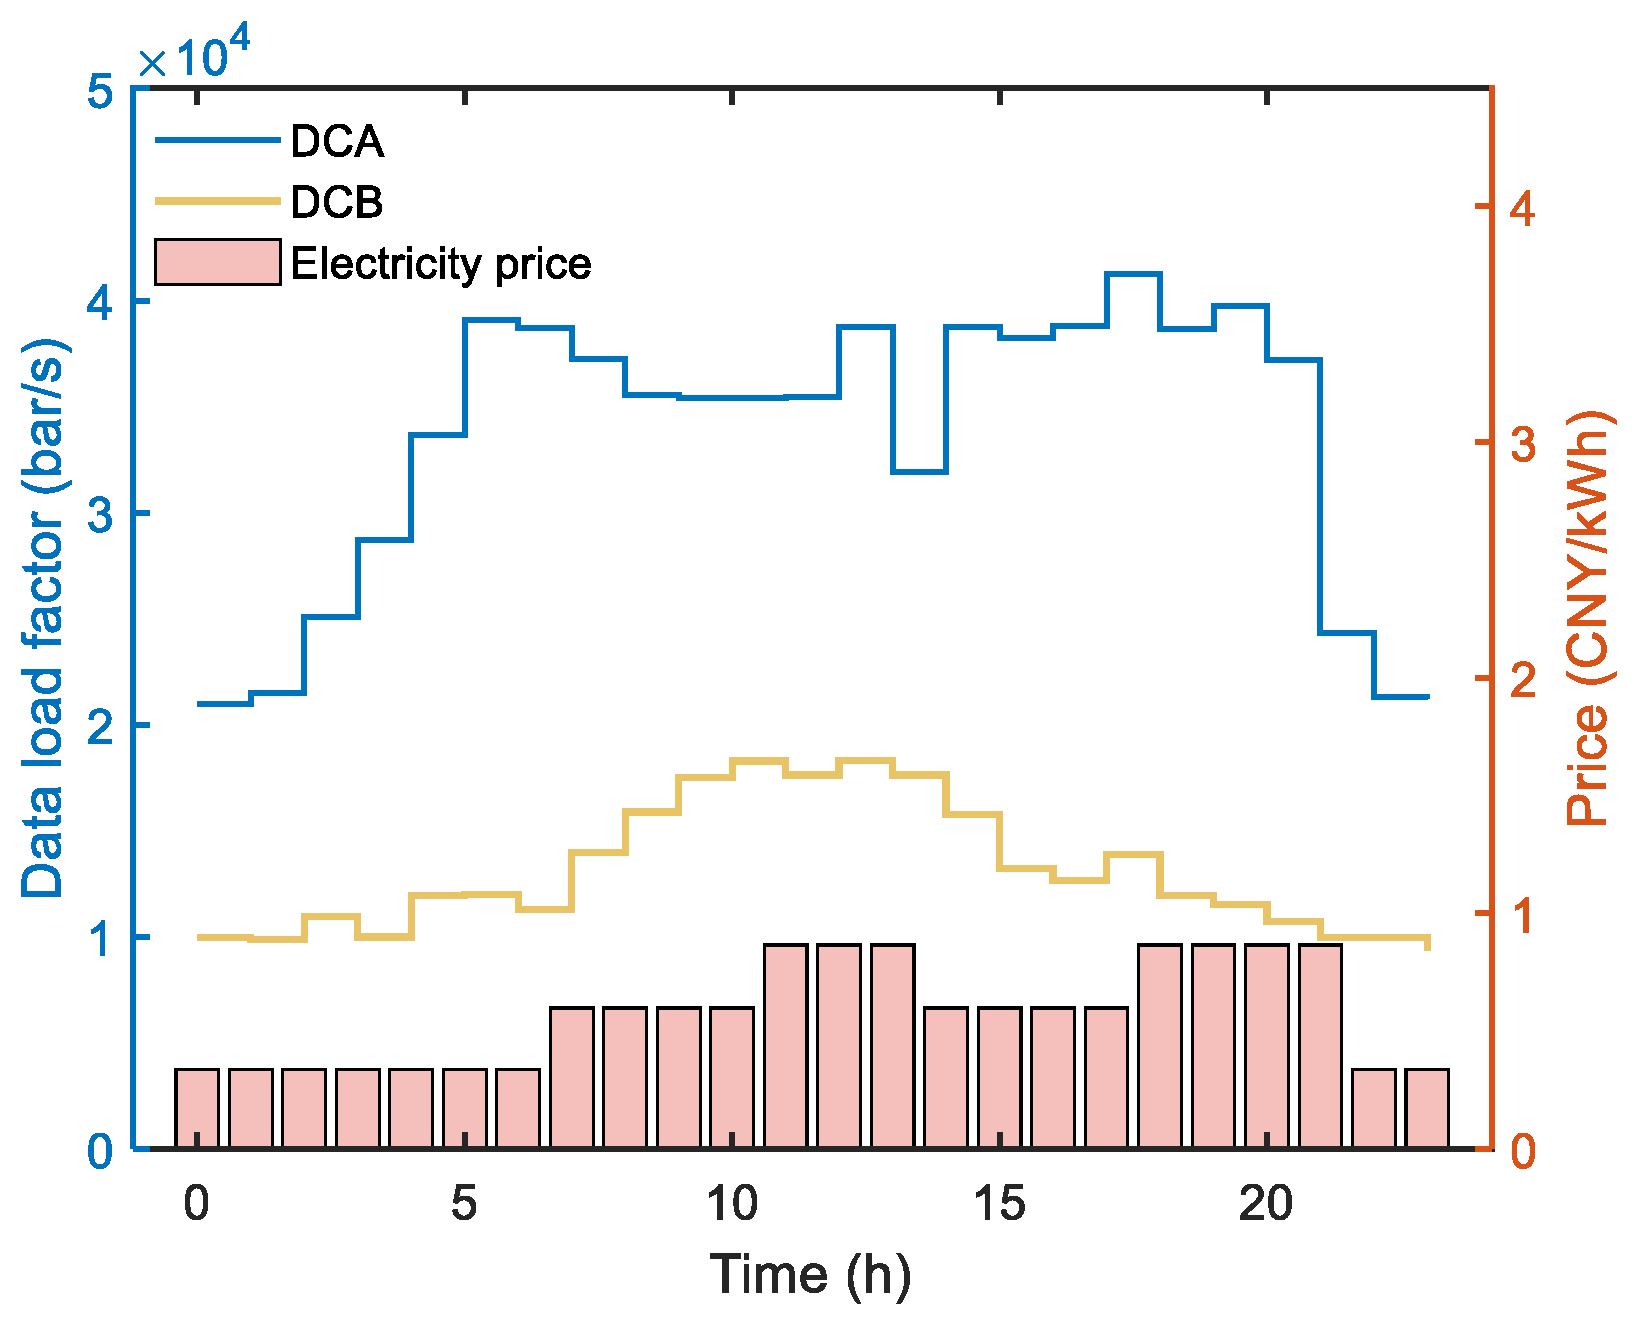
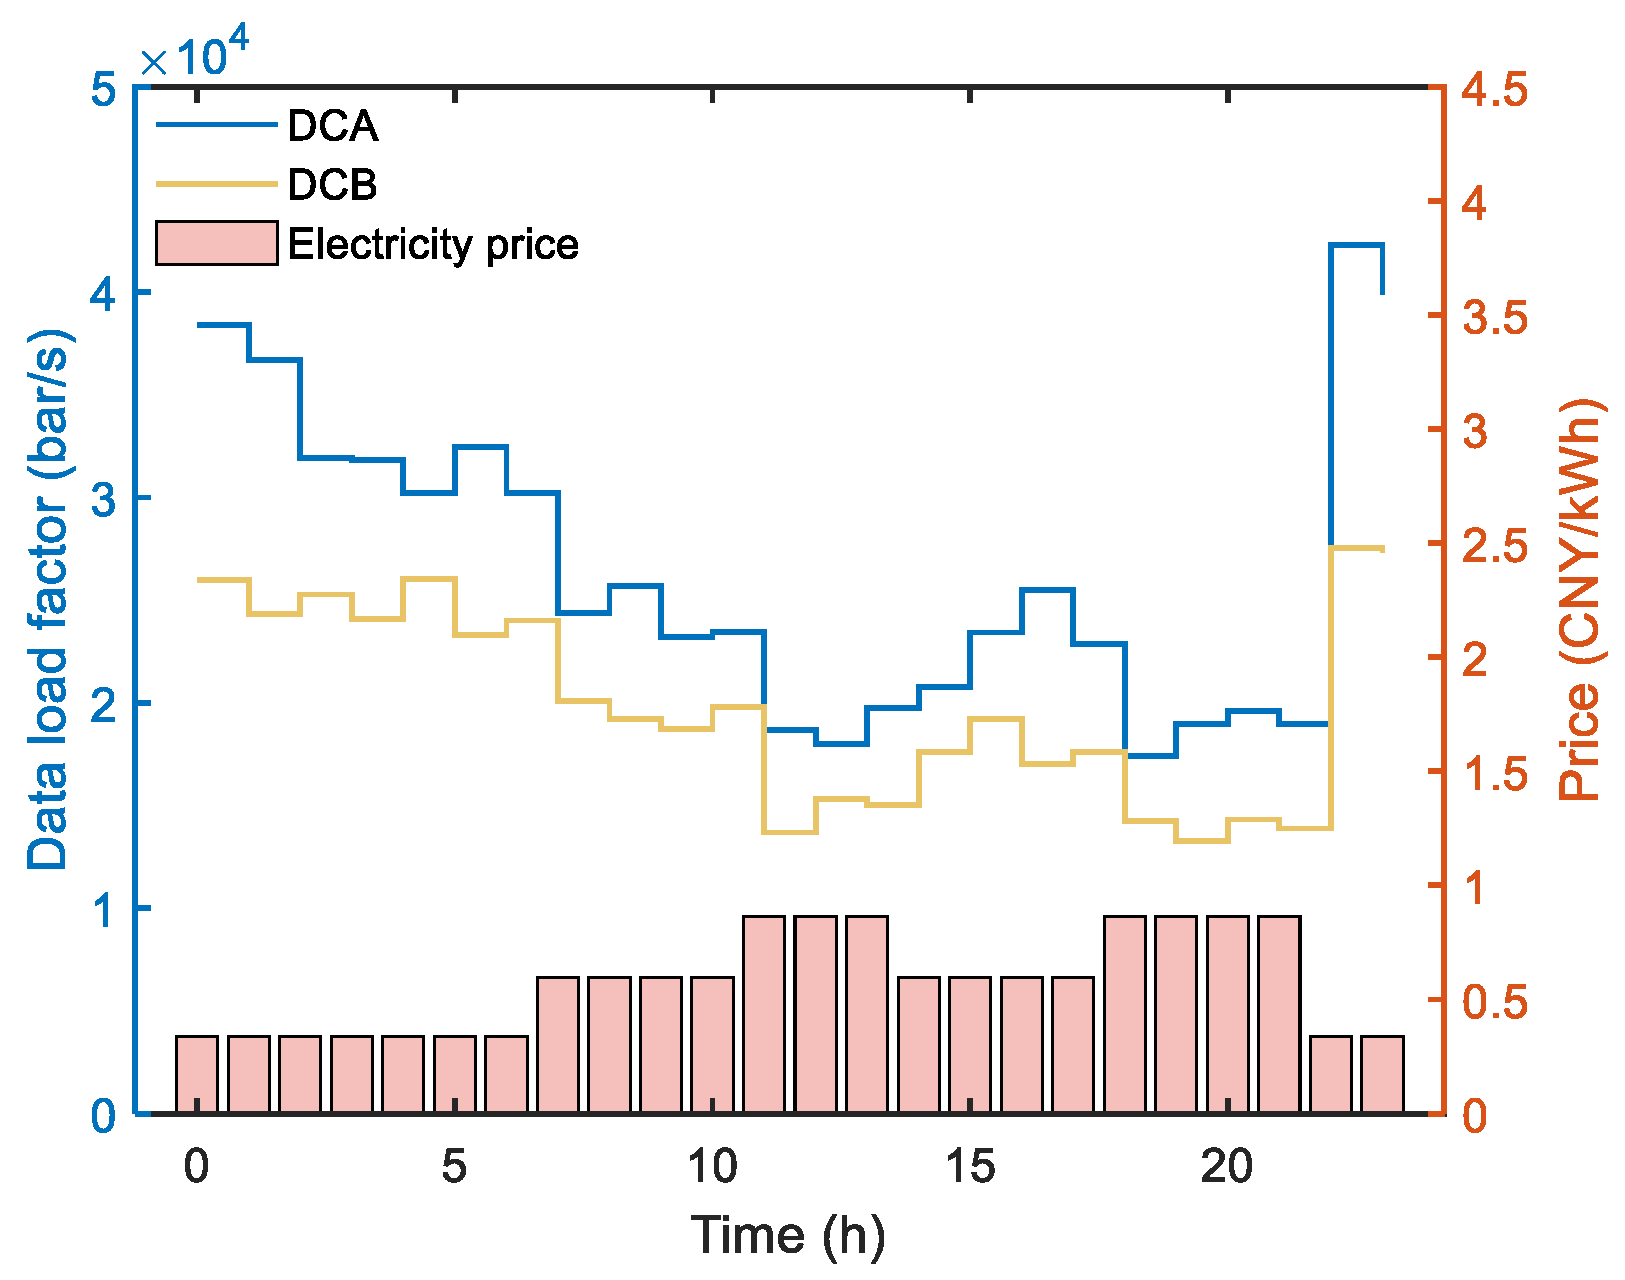
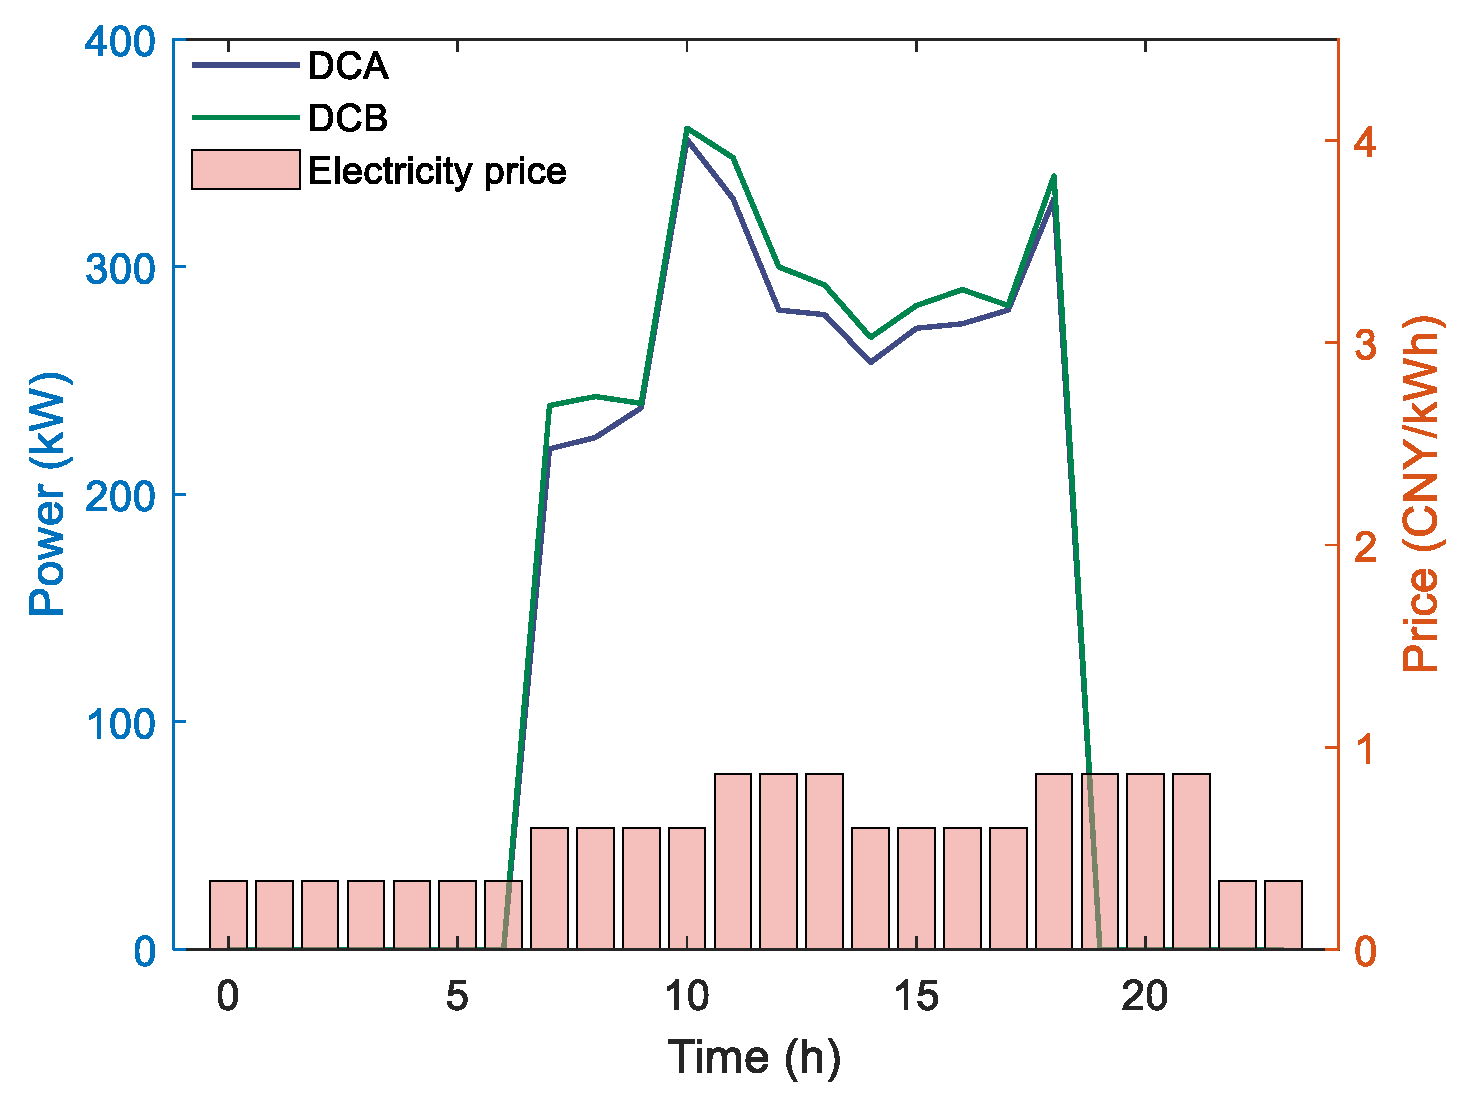
4.2. Results Analysis

Table 2 provides the cost of the following three cases:
Case1: DCs are not configured with WF, PV, and ES, and the spatio-temporal regulation characteristics of the load and thermal inertia of DCs are not considered;
Case2: DCs are not configured with WF, PV, and ES, but the spatio-temporal regulation characteristics of the load and thermal inertia of DCs are considered;
Case3: DCs are configured with WF, PV, and ES, and the spatio-temporal regulation characteristics of the load and thermal inertia of DCs are considered.
Figure 2 illustrates the raw load arrival rate and the electricity price for each DC. Figure 3 demonstrates the data load arrival rate as well as the electricity price for each DC. In consideration of the temporal and spatial adjustment properties of DC, it is anticipated that each DC will level batch loads from periods of high tariffs to periods of low tariffs. Furthermore, it is expected that the DCA will shift both types of loads to DCB processing with the aim of reducing operating costs.
Figure 4 and Figure 5 demonstrate the air-conditioning power and room temperature for each DC. Due to the temporal and spatial flexibility of the data load, the power of the air-conditioning system also exhibits temporal and spatial adjustment characteristics. When the air-conditioning power is high, the temperature of the server room is higher at this time in order to reduce the operating cost, while when the air-conditioning power is low, the temperature of the server room is more utilized for the operation of the IT equipment.
Figure 6 and Figure 7 demonstrate ES charging from WF and PV. Figure 8 demonstrates DC’s power purchase from the grid. In order to effectively promote the green transformation of DC and reduce its operating costs, the power generated by PV and WF is prioritized to meet the power demand of DC. When the combined output of PV and WF exceeds the power demand of the DC, the surplus power generated will be stored in the ES. And when the sum of PV and WF output cannot satisfy the DC’s power demand, the ES will start the discharge mode, and at the same time, the DC will purchase the required power from the grid to ensure its normal operation.

5. Conclusions

This paper proposes a coordinated spatio-temporal operation of wind–solar–storage-powered DCs considering building thermal inertia. Through the case studies, the following conclusions and outlook were drawn [23,24,25]:
(1)
By digging deeper into the temporal and spatial flexibility of loads, each DC can be enabled to significantly reduce DC operating costs by rationally migrating loads from periods of high tariffs to periods of low tariffs and by optimizing the distribution of loads between different DC;
(2)
It is vital to fully take into account the building thermal inertia of DC, as this will significantly reduce the energy consumption of air-conditioning systems while guaranteeing the normal operating ambient temperature of servers in DC;
(3)
The proposed strategy of DC integrated with wind, solar, and ES can reduce the operation cost of the DC by 37.92% and improve the level of renewable energy consumption.
In future research, we will focus on two key areas:
(1)
Conduct significance tests and sensitivity analyses, define error margins, and evaluate the strategy’s robustness under complex conditions to ensure reliable and generalizable results;
(2)
Explore limitations related to renewable energy availability, scalability, and real-world constraints to enhance the practical applicability of the research.

Author Contributions

X.Q., conceptualization, methodology, validation, writing—original draft preparation, writing—review and editing, and supervision; X.Z., methodology, validation, formal analysis, writing—original draft preparation, and writing—review and editing; J.Z., methodology and project administration; X.L., conceptualization and supervision; X.B., visualization and project administration; C.W., conceptualization and writing—original draft preparation; L.C., conceptualization, methodology, and validation; Z.L., methodology, formal analysis, and supervision. All authors have read and agreed to the published version of the manuscript.

Funding

This work was supported by the Shanxi Energy Internet Research Institute Major Research Pillar Program (SXEI2023ZD001) and the opening Foundation of Shanxi Province Key Laboratory of Energy Internet (EI202403).

Data Availability Statement

The original contributions presented in this study are included in the article. Further inquiries can be directed to the corresponding author.

Conflicts of Interest

The authors declare no conflict of interest.

Symbols and Abbreviations

List of abbreviations
Data CenterDC
International Energy AgencyIEA
Information Technology equipmentIT equipment
Photovoltaic power plantPV
Wind farmWF
Energy storageES
List of symbols
P b u y , t D C , A / P b u y , t D C , B Power purchased from the grid for DC A and B (kW)
P P V , t D C , A / P P V , t D C , B PV output for DC A and B (kW)
P W T , t D C , A / P W T , t D C , B WF output for DC A and B (kW)
P E S , c h , t D C , A / P E S , d i s , t D C , A Charge/discharge power of the ES for DC A (kW)
P E S , c h , t D C , B / P E S , d i s , t D C , B Charge/discharge power of the ES for DC B (kW)
ω P V / ω W T / ω E S Operation and maintenance cost coefficients of WF, PV, and ES (CNY/kWh)
c t e Purchased price of the electricity (CNY)
P t D C Total power consumption of the DC (kW)
P t I T Power consumption of the IT equipment (kW)
P t A C Power consumption of the air-conditioning system (kW)
P t L Power consumption of the power distribution and lighting system (kW)
P 0 L Fixed portion of the power distribution and lighting system (kW)
P m , s , t Power of class m server in s operating state (kW)
P m , s t / P m , d y , t Static/dynamic power of the server (kW)
km/fmDynamic power calculation coefficient of class m server/chip operating frequency
Δ Q The amount of heat change in the room of the DC (kW)
ρ /C/VAir density (kg/m3)/heat capacity(kg·K)/volume (m3)
T t i n / T t o u t Temperature of the room/outdoor temperature (°C)
k w a l l / k w i n Heat transfer coefficient from the external wall/window
F w a l l / F w i n Area of the wall/window (m2)
I/ S C Intensity of light/shading coefficient
Q t I T / Q t A C The power of heat dissipation of the IT equipment/cooling capacity
E E E R Energy efficiency ratio
f P V ( r ) Probability density function of solar luminous intensity r
Γ /a,bGamma function/shape parameters
G S T C / T S T C / P S T C Light intensity, PV array temperature (°C)/maximum output power (kW)
kTemperature coefficient
T t Surface temperature of the PV array (°C)
ν i / ν 0 / ν n Wind speeds (m/s)
RBlade length (m)
P n Specified power of the fan (kW)
τ / η ch / η dis Self-discharge efficiency/charging efficiency /discharging efficiency
E t E S / E t 1 E S ES capacity at time t and time t − 1 (kW)
P E S , t c h / P E S , t d i s / P t E S Charging/discharging power/total power of the electricity traded (kW)
E 0 E S / E T E S The amount of electricity in the beginning/the end of the time of the ES (kW)
λ t i t r / λ t b a t c h Interactive load rate/batch load rate (bar/s)
μ t / μ t , i m , s The sum of the service rates of the servers/service rate of m types of servers in DC i in the s state (bar/s)
μ t i t r / μ t b a t c h Service rate for interactive load/batch load (bar/s)
u ^ n , t i t r / u ^ n , t b a t c h Service rate for interactive load/batch load after space-time regulation (bar/s)
D i t r / d i t r Maximum response time of the interactive load/Load transfer delay time (s)
T b a t c h Maximum response time of batch load (h)
T min i n / T max i n Lower and upper limits of the indoor temperature (°C)
λ n , max Maximum amount of data load (bar/s)
H/ x t H Type of operating frequency that the server can choose/selection variable for the time slot operating frequency and service rate
P max A C Upper limit of the power of the air-conditioning system (kW)

References

  1. International Energy Agency (IEA). Data Centers and Data Transmission Networks; World Energy Outlook; IEA: Paris, France, 2022. [Google Scholar]
  2. Liu, Y.; Wei, X.; Xiao, J.; Liu, Z.; Tian, Y. Energy consumption and emission mitigation prediction based on data center traffic and Pue for global data centers. Glob. Energy Interconnect. 2020, 3, 272–282. [Google Scholar] [CrossRef]
  3. Ding, Z.; Cao, Y.; Xie, L.; Lu, Y.; Wang, P. Integrated stochastic energy management for data center microgrid considering waste heat recovery. IEEE Trans. Ind. Appl. 2019, 55, 2198–2207. [Google Scholar] [CrossRef]
  4. Wang, J.; Deng, H.; Liu, Y.; Guo, Z.; Wang, Y. Coordinated optimal scheduling of integrated energy system for data center based on computing load shifting. Energy 2023, 267, 126585. [Google Scholar] [CrossRef]
  5. Chen, M.; Gao, C.; Shahidehpour, M.; Li, Z.; Chen, S.; Li, D. Internet Data Center Load Modeling for Demand Response Considering the Coupling of Multiple Regulation Methods. IEEE Trans. Smart Grid 2021, 12, 2060–2076. [Google Scholar] [CrossRef]
  6. Zhai, X.; Li, Z.; Li, Z.; Xue, Y.; Chang, X.; Su, J.; Jin, X.; Wang, P.; Sun, H. Risk-averse energy management for integrated electricity and heat systems considering building heating vertical imbalance: An asynchronous decentralized approach. Appl. Energy 2025, 383, 125271. [Google Scholar] [CrossRef]
  7. Wang, P.; Sun, J.; Yoon, S.; Zhao, L.; Liang, R. A global optimization method for data center air conditioning water systems based on predictive optimization control. Energy 2024, 295, 0360–5442. [Google Scholar] [CrossRef]
  8. Nadjahi, C.; Louahlia, H.; Stéphane, L. A review of thermal management and innovative cooling strategies for data center. Sustain. Comput. Inform. Syst. 2018, 19, 14–28. [Google Scholar] [CrossRef]
  9. Ding, B.; Li, Z.; Li, Z.; Xue, Y.; Chang, X.; Su, J.; Sun, H. Cooperative Operation for Multiagent Energy Systems Integrated with Wind, Hydrogen, and Buildings: An Asymmetric Nash Bargaining Approach. IEEE Trans. Ind. Inform. 2025. [Google Scholar] [CrossRef]
  10. Li, Y.; Wang, B.; Xue, F. Research on the Current Development Status of Energy Storage Technologies. Power Gener. Air Cond. 2017, 38, 56–61. [Google Scholar]
  11. Xie, Y.; Cui, Y.; Wu, D.; Zeng, Y.; Sun, L. Economic analysis of hydrogen-powered data center. Int. J. Hydrogen Energy 2021, 460, 27842–27850. [Google Scholar] [CrossRef]
  12. Zhou, K.; Fei, Z.; Lu, X. Optimal energy mangement of internet data center with distributed energy resources. IEEE Trans. Cloud Comput. 2023, 11, 2285–2295. [Google Scholar] [CrossRef]
  13. Zhang, G.; Zhang, S.; Zhang, W.; Shen, Z.; Wang, L. Distributed energy management for multiple data centers with renewable resources and energy storages. IEEE Trans. Cloud Comput. 2022, 10, 2469–2480. [Google Scholar] [CrossRef]
  14. Xu, D.; Xiang, S.; Bai Zi Wei, J.; Gao, M. Optimal multi-energy portfolio towards zero carbon data center buildings in the presence of proactive demand response programs. Appl. Energy 2023, 350, 121806. [Google Scholar] [CrossRef]
  15. Kwon, S. Ensuring renewable energy utilization with quality of service guarantee for energy-efficient data center operations. Appl. Energy 2020, 276, 115424. [Google Scholar] [CrossRef]
  16. Wang, P.; Cao, Y.; Ding, Z.; Tang, H.; Wang, X.; Cheng, M. Stochastic programming for cost optimization in geographically distributed internet data centers. CSEE J. Power Energy Syst. 2022, 8, 1215–1232. [Google Scholar]
  17. Nwambu, C.N.; Emekwisia, C.C.; Opetuki, O.K.; Ajimatanrareje, G.A.; Nwoye, C.I. Predictive analysis of wind energy density based on the associated Weibull parameters and air density of the environment. Int. J. Mater. Sci. 2024, 5, 6–15. [Google Scholar]
  18. Liu, J.; Li, W.; Liu, J.; Wang, B. Efficiency of energy recovery ventilator with various weathers and its energy saving performance in a residential apartment. Energy Build. 2010, 42, 43–49. [Google Scholar] [CrossRef]
  19. Zhang, H.; Li, Z.; Xue, Y.; Chang, X.; Su, J.; Wang, P.; Guo, Q.; Sun, H. A Stochastic Bi-level Optimal Allocation Approach of Intelligent Buildings Considering Energy Storage Sharing Services. IEEE Trans. Consum. Electron. 2024, 5, 06–15. [Google Scholar] [CrossRef]
  20. AMD. “Channel News August 2019”. AMD Newsletters. August 2019. Available online: https://subscriptions.amd.com/newsletters/channelnews/archive/2019_08_en.html (accessed on 20 February 2025).
  21. Chen, Z.; Chen, Y.; Che, S. Framework of integrated charging station for renewable energy vehicle and energy optimal dispatching method. Autom. Electr. Power Syst. 2019, 43, 41–49. [Google Scholar]
  22. Chu, J.; Huang, X. Research status and development trends of evaporative cooling air-conditioning technology in data centers. Energy Built Environ. 2023, 4, 86–110. [Google Scholar] [CrossRef]
  23. Wang, X.; Shahidehpour, M.; Jiang, C.; Li, Z. Coordinated Planning Strategy for Electric Vehicle Charging Stations and Coupled Traffic-Electric Networks. IEEE Trans. Power Syst. 2019, 34, 268–279. [Google Scholar] [CrossRef]
  24. Cui, X.; Liang, L.; Liu, W.; Yin, W.; Liu, J.; Hou, Y. Modeling EV dynamic wireless charging loads and constructing risk constrained operating strategy for associated distribution systems. Appl. Energy 2025, 378, 124735. [Google Scholar] [CrossRef]
  25. Wang, X.; Li, Z.; Shahidehpour, M.; Jiang, C. Robust Line Hardening Strategies for Improving the Resilience of Distribution Systems with Variable Renewable Resources. IEEE Trans. Sustain. Energy 2019, 10, 386–395. [Google Scholar] [CrossRef]
Figure 1. The operation framework of the DC integrated with wind, solar, and ES.
Buildings 15 01782 g001
Figure 2. The raw load arrival rate and electricity price.
Buildings 15 01782 g002
Figure 3. The spatio-temporally adjusted data load rate.
Buildings 15 01782 g003
Figure 4. The air-conditioning power of DC.
Buildings 15 01782 g004
Figure 5. The indoor temperature of DC.
Buildings 15 01782 g005
Figure 6. The power charged from the WF by ES.
Buildings 15 01782 g006
Figure 7. The power charged from the PV by ES.
Buildings 15 01782 g007
Figure 8. The power purchased by DC from the grid.
Buildings 15 01782 g008
Table 1. Parameters of DC, PV, WF, and ES.
DC ADC B
ParametersValuesParametersValues
CPU typeADM EPYC 7003CPU typeADM EPYC 7002
ft (GHz){2.0, 2.5, 3.0, 3.5, 4.0}ft (GHz){1.8, 2.3, 2.7, 3.1, 3.3}
μt (Bar/s){15, 20, 25, 30, 35}μt (Bar/s){14, 18, 22, 27, 31}
Pm,st (W)80Pm,st (W)78
Pm,dy,t (W/GHz3)8.0Pm,dy,t (W/GHz3)7.8
ωPV (CNY/kWh)0.05ωPV (CNY/kWh)0.05
ωWT (CNY/kWh)0.07ωWT (CNY/kWh)0.07
ωES (CNY/kWh)0.05ωES (CNY/kWh)0.05
Table 2. Cost comparison of different cases.
CasesCost (CNY)
Case 131,126.72
Case 226,470.46
Case 319,324.39
Disclaimer/Publisher’s Note: The statements, opinions and data contained in all publications are solely those of the individual author(s) and contributor(s) and not of MDPI and/or the editor(s). MDPI and/or the editor(s) disclaim responsibility for any injury to people or property resulting from any ideas, methods, instructions or products referred to in the content.

