Abstract
Hydraulic concrete is subject to severe durability challenges when abraded by the high-speed flow of sandy water. Conventional concrete frequently needs to be repaired because of its high brittleness and insufficient abrasion resistance, while granular rubber can easily be dislodged from the matrix during abrasion, forming a new source of abrasion and increasing the damage to the matrix. For this reason, we used fibrous rubber concrete to systematically study the mechanisms of the influence of the dosage of nitrile rubber (5%, 10%, and 15%) and fiber length (6, 12, and 18 mm) on resistance to impact and abrasion performance. Through mechanical tests, underwater steel ball abrasion tests, three-dimensional morphology measurements, and fractal dimension analysis, the law behind the damage evolution of fibrous rubber concrete was revealed. The results show that concrete with 15% NBR and 12 mm fibers yielded the best performance, and its 144-hour abrasion resistance reached 25.0 h/(kg/m2), which is 163.7% higher than that for the baseline group. Fractal dimension analysis (D = 2.204 for the optimum group vs. 2.356 for the benchmark group) showed that the fiber network effectively suppressed surface damage extension. The long-term mass loss rate was only 2.36% (5.82% for the benchmark group), and the elastic energy dissipation mechanism remained stable under dynamic loading. The results of a microanalysis showed that the high surface roughness of NBR enhances interfacial bonding, which synergizes with crack bridging and stress dispersion and, thus, forms a multiscale anti-impact abrasion barrier. This study provides a new material solution for the design of durable concrete for use in high-impact and high-abrasion environments, which combines mechanical property preservation and resource recycling value. However, we did not systematically examine the evolution of the performance of fiber rubber concrete concrete under long-term environmental coupling conditions, such as freeze–thaw cycles, ultraviolet aging, or chemical attacks, and there are limitations to our assessment of full life-cycle durability.
1. Introduction
Hydraulic concrete structures (e.g., spillway tunnels, spillway dams, dissipative ponds, etc.) are commonly subject to durability problems such as surface spalling, aggregate exposure, and even structural failure due to long-term abrasion by high-speed sandy water [1,2]. According to statistics, the average annual maintenance cost of large-scale water conservancy projects undertaken to address the damage caused by abrasion can range up to hundreds of millions of dollars, posing a serious threat regarding the safety and economy of such projects [3,4]. Although traditional concrete is very strong, it has a brittle damage mode when subjected to dynamic impacts and cyclic wear and suffers from a significant performance disadvantage: on the one hand, the interface transition zone (ITZ) between the cement matrix and the aggregate is prone to sprouting microcracks and rapid expansion; on the other hand, the lack of an energy dissipation mechanism leads to a greater stress concentration effect, ultimately triggering progressive damage to the surface and underground material [5,6]. This contradiction is particularly prominent in harsh water environments with high sand content and a rapid flow velocity [7].
To enhance concrete’s impact and abrasion resistance, scholars have attempted to improve its toughness and energy absorption capacity by incorporating elastic materials such as rubber particles [8]. Granular rubber concrete (CRC) dissipates impact energy through the elastic deformation of rubber, and its impact and abrasion resistance can be more than 50% greater than that of ordinary concrete [9,10]. However, there are two major bottlenecks regarding this type of material: first, the rubber–cement matrix interface is weakly bonded, and the mechanical properties (compressive and tensile strength) of the concrete decrease by more than 30% when high dosages of rubber (>15%) are added, restricting this type of concrete’s application in hydraulic structures [11]; second, granular rubber is prone to dislodging from the matrix under dynamic loading conditions, forming a secondary source of abrasion and exacerbating material deterioration [12,13]. These shortcomings have prompted researchers to turn to fiber reinforcement strategies to enhance the toughness of concrete by incorporating steel fibers, polypropylene fibers, and so on. However, the difference in the modulus of elasticity between inorganic fibers and rubber leads to inefficient stress transfer, and these high-density fibers increase the self-weight of the material, limiting its applicability in hydraulic scenarios [14,15].
In recent years, fibrous rubber concrete (FRC) has attracted attention because of its unique “form–function” synergistic effect [16]. The multi-scale synergistic reinforcement mechanism of “elastic energy dissipation—crack bridging—stress dispersion” can be realized by combining elastic rubber fibers with a concrete matrix [17]. However, most of the existing studies focus on the univariate analysis of fiber-reinforced concrete, whereas the systematic optimization of material parameters (fiber length, mixing amount, and surface properties) and the mechanisms of their impact on anti-abrasion performance have not yet been clarified; especially deficient in this regard is the lack of a quantitative description of the law regarding long-term performance evolution under the coupling of multi-factors. In order to address the above problems, we focused on the design requirements regarding the impact resistance of hydraulic concrete and systematically investigated the effects of the dosage (5%, 10%, and 15%) and length (6, 12, and 18 mm) of Buna-N fibers on the mechanical properties, impact resistance, and long-term impact resistance of the concrete. The dynamic evolution of surface damage was quantified by simulating a high-impact and highly abrasive environment using the underwater steel ball method and carrying out three-dimensional morphology and fractal dimension calculations. The microstructural characteristics of the fiber–substrate interface and its regulatory mechanism with respect to macroscopic properties were revealed with the aid of scanning electron microscopy (SEM). The results of this research can provide a theoretical basis for the design of hydraulic concrete structures intended for use in high-impact and high-abrasion environments, promote the high-value-added utilization of rubber resources, and contribute to the sustainable development of construction materials. The steps of the experiments conducted are shown in Figure 1.
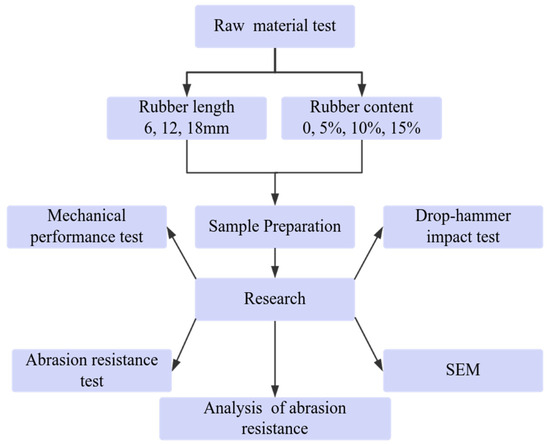
Figure 1.
Experimental procedure.
2. Materials and Methods
2.1. Raw Materials Used in the Experiment
The cement employed was Xinjiang Tianshan Cement P-O42.5R, whose dimensional stability was verified. Its physical and mechanical properties are detailed in Table 1. The aggregate system comprised mechanism sand (fineness modulus, 2.9; apparent density, 2.6 g/cm3) and 5~20 mm continuously graded gravel (apparent density, 2.66 g/cm3). A polycarboxylic-acid-based high-efficiency water reducer served as the admixture. Nitrile fibrous rubber, processed into lengths of 6, 12, and 18 mm through mechanical shearing, was used and maintained a uniform diameter of 2 mm and a density of 1.53 g/m3. The morphological characteristics of the varying-length rubber fibers are illustrated in Figure 2, and their elemental compositions, quantified via energy-dispersive X-ray spectroscopy (EDS), are presented in Table 2.

Table 1.
The physical and mechanical properties of the cement.
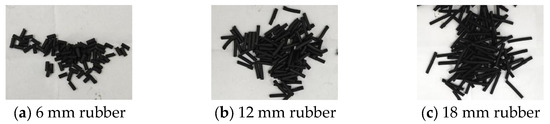
Figure 2.
Morphological characteristics of the varying-length rubber fibers.
Table 2.
Nitrile rubber EDS results.
2.2. Preparation of Rubberized Fiber-Reinforced Concrete Specimens
Rubberized fiber-reinforced concrete specimens were prepared using a water-to-cement (w/c) ratio of 0.4, incorporating fibrous rubber as partial replacement for fine aggregate by volume. The water reducer dosage was 0.2%, and the mix proportions are documented in Table 3.
Table 3.
Ratios pertaining to the concrete composites.
The components of the concrete mixture—cement, aggregates (stone and sand), and rubber fibers—were proportionally measured according to the formulation requirements before being introduced into the mixer. Mechanical blending was conducted for approximately 60 s to achieve a uniform material distribution throughout the mixture. The water-reducing agent was weighed, and the water was mixed well. After being poured and then stirred for about 120~180 s, the homogenized concrete was systematically cast into three distinct mold configurations: 100 mm cubic specimens, cylindrical forms (150 mm in diameter × 65 mm in height), and large-scale cylindrical molds (300 mm in diameter × 100 mm in height). We employed vibration compaction in each casting process to ensure proper mold filling and eliminate air voids. After placing the mixture in the test mold cavity, we sealed the assembly with plastic film to minimize moisture evaporation. The prepared sample was then transferred to a controlled curing chamber in which the temperature and relative humidity were kept at 20 ± 2 °C and 95%, respectively. Following 24-hour initial setting, the cured specimens were demolded, assigned identification codes, and subsequently allowed to undergo 28-day maturation before being subjected to mechanical performance evaluations, including compressive strength measurements (with 3 test pieces per group), splitting tensile strength testing (with 3 test pieces per group), impact resistance assessments (with 8 test pieces per group), and wear durability analysis (with 3 test pieces per group) [17].
2.3. Test Methods
Following the specifications outlined in SL/T 325-2020 “Hydraulic Concrete Test Procedure”, we conducted compressive strength tests at a controlled loading rate of 0.5–0.8 MPa/s, while a reduced rate of 0.05–0.08 MPa/s was employed in the splitting tensile strength evaluations to comply with standardized mechanical testing requirements [18].
Compressive strength was calculated according to Formula (1):
where fcc is compressive strength, MPa; P is the destructive load, kN; and A is the specimen’s compressive area, mm2.
Split tensile strength was calculated using Equation (2).
where fts is the splitting tensile strength, MPa; P is the destructive load, kN; and A is the area of the splitting surface of the specimen, mm2.
In accordance with CECS 13:2009 “Standard Test Methods for Fiber Concrete”, an impact resistance evaluation was conducted using a rigid horizontal plate as the base for the drop hammer apparatus. Disk-shaped specimens (150 mm in diameter × 65 mm in height) were subjected to repeated impacts using a 63 mm diameter steel ball positioned centrally on their upper surfaces. A 4.5 kg hammer was released from a fixed height of 450 mm in a free-fall mode. After each strike, the hammer was repositioned into a preset alignment groove to maintain vertical alignment of the center of the specimen, the impact ball, and the hammer axis. Two critical parameters were recorded in the test, namely, N1 (initial crack formation impact count) and N2 (final penetration crack impact count), with each hammer drop constituting one cycle [19].
The work pertaining to the impact on concrete was calculated as follows:
where W is the impact work, J; m is the mass of the impact hammer, kg; g is the acceleration of gravity, taken to be 9.81 m/s2; h is the height from which the impact hammer falls, m; and n is the number of impacts.
The impact toughness ratio, D, was calculated according to Formula (4).
W is the impact work of the fibrous rubberized concrete specimen, J; W0 is the impact work of the control specimen, J.
According to SL/T 352-2020 “Hydraulic Concrete Test Procedure”, the underwater steel ball method should be used in the impact abrasion resistance test, and an HKCM-2-type impact abrasion resistance testing machine should be used [18].
Abrasion strength was calculated according to Equations (5)–(7).
where fa is anti-abrasion strength, h/(kg/m2); t is the cumulative time of abrasion, h; ΔM is the cumulative amount of abrasion of the specimen, kg; M0 is the initial mass of the specimen, kg; Mf is the mass of the specimen at the time of grinding, kg; A is the area of the specimen subjected to grinding, m2; and D is the diameter of the specimen, m.
The wear rate is calculated according to Equation (8).
where La is the concrete wear rate; M0 is the mass of the specimen before the test, kg; and Mt is the mass of the specimen after time t, kg.
3. Results
3.1. Mechanical Properties
The trends pertaining to compressive and splitting tensile strengths were plotted using the test results in Table 4. As shown in Figure 3, the compressive and splitting tensile strengths of the baseline group (without rubber) are 52.6 MPa and 3.76 MPa. When increasing the rubber doping amount from 5% to 15%, the compressive strength decreased significantly, but the decrease in splitting tensile strength was smaller than that for compressive strength; this is due to the weak interfacial bonding between the rubber and the cement matrix leading to a strength decrease that is more obvious at high doping levels [20]. At the same doping level, the longer the fibers, the greater the compressive and splitting tensile strengths; this is because the fibers partially offset the loss of strength by forming a three-dimensional network structure that inhibits crack expansion and relieves the stress concentration at the ends of the cracks [21]. However, at a 15% doping, the compressive (39.97 MPa) and splitting tensile (3.1 MPa) strengths of long fibers (18 mm) were slightly lower than those of the 12 mm fibers (40.12 MPa and 3.18 MPa); excessively long fibers resulted in poor dispersion and local stress concentration. The interfacial bonding efficiency between the fibers and the matrix decreased because of the increase in length. Compressive strength decreased in a stepwise manner with an increase in the doping (corresponding to a decrease in height in the histogram), while the increase in fiber length partially offset the loss of strength, suggesting that the reinforcing effect of the fibers was more significant at low doping levels. The columns in the histogram pertaining to splitting tensile strength decreased gently (e.g., there are smaller differences in the heights of the columns for the 15% doping group), indicating that the fibers compensated for tensile properties to a greater extent than compressive properties.
Table 4.
Mechanical strength of fibrous rubberized concrete.
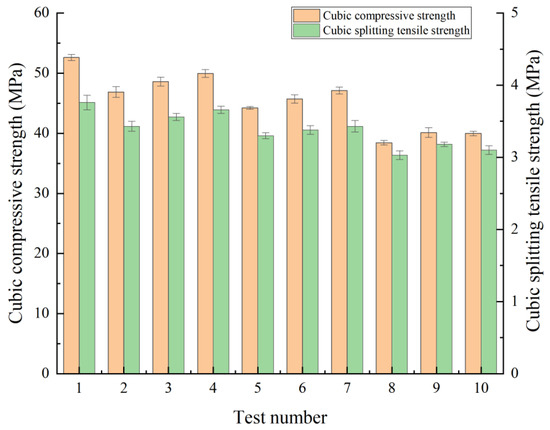
Figure 3.
Mechanical strength.
3.2. Impact Resistance
The impact toughness ratio is used to characterize the toughness properties of concrete, and a high impact toughness ratio indicates that a concrete specimen has good toughness in terms of its ability to absorb energy and resist damage when subjected to impacts; conversely, a low ratio indicates that the concrete is relatively brittle and prone to damage under impact loading. The concrete impact toughness ratios were plotted based on the test results given in Table 5. As shown in Figure 4, with the increase in the rubber doping from 5% to 15%, the impact toughness ratio significantly improved, and the synergistic effect of rubber’s elastic deformation ability and the fibers effectively improved the concrete’s energy absorption efficiency. With the same doping amount, the longer the fiber, the higher the impact toughness ratio, and the greater the energy absorption and dissipation ability of the material. However, the impact toughness ratio for the 18 mm fibers (4.25) is slightly lower than that of the 12 mm (4.3) fibers because of the uneven dispersion or a decrease in interfacial bonding efficiency due to the great length of the fibers. The histograms show that the impact toughness ratio increases in a stepwise manner with the increase in rubber doping, and the 12 mm fiber group reaches a peak at 15% doping, verifying the key role of fiber length optimization in performance enhancement.
Table 5.
Impact test results.
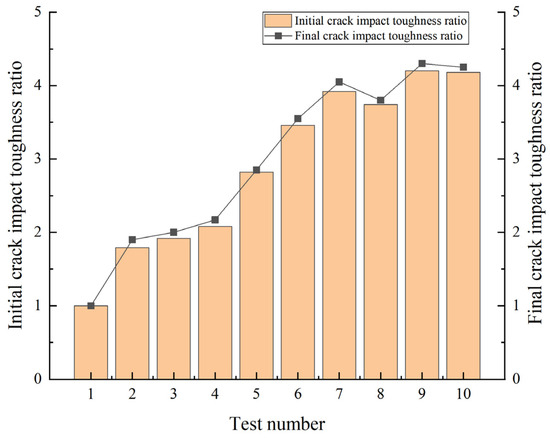
Figure 4.
Concrete impact toughness ratio.
3.3. Evolutionary Pattern of Abrasion Strength
The differences in the impact and abrasion resistance of concrete with different admixtures and different strengths can lead to differences in the impact and abrasion resistance of different evaluation criteria. Therefore, the mass loss values at 72 h and 144 h were used to calculate impact resistance, and the results are shown in Table 6.
Table 6.
Abrasion strength of fibrous rubberized concrete.
Relative values quantify proportional comparisons between a measured parameter and a baseline quantity and are typically presented in percentage terms. The corresponding calculation is as follows: (target value/reference value) × 100%.
As shown in Figure 5, the 144 h impact abrasion resistance for all the groups is higher than 72 h. This is because before the 72 h mark, it is mainly the surface layer of the mortar that is abraded, i.e., the abrasion of fibrous rubber gradually plays a role in the late stage of abrasion, resulting in a reduction in quality. The performance regarding 144 h impact abrasion resistance is greater than that for 72 h impact abrasion resistance, so the 144 h abrasion conditions are more reflective of the impact abrasion resistance of the rubberized concrete. Therefore, the 144 h abrasion conditions more accurately reflect the rubberized concrete’s abrasion strength. The 144 h strength of the benchmark group (Test No. 1) (9.48) is different by 9.3% from the 72 h strength (8.67), and the 144 h strength of the optimal group (Test No. 9) (25) is different by 19.2% from the 72 h strength (20.98). When the dosage is higher and the fibers are longer, the increase in impact strength is more significant, indicating that fibrous rubber’s impact strength enhancement capacity has significant time-varying characteristics.
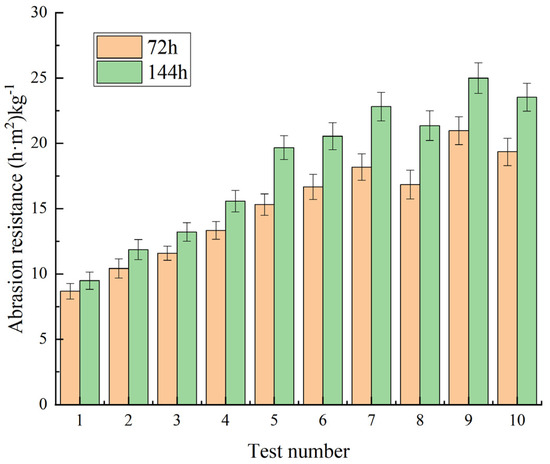
Figure 5.
Abrasion strength of fibrous rubberized concrete at different times.
3.4. Characteristics of Dynamic Evolution Regarding Punching and Grinding Damage
The volumetric and mass wear rates pertaining to the punching and abrasion of concrete are given by the following equations:
where Rm is the mass wear rate; Rv is the volumetric wear rate; Δm is the mass loss over time, in g; Δv is the mass loss volumetric loss over a period of time, in cm3; T is the flushing and grinding time, in h; and A is the area of impulse wear, in m2.
The cumulative mass loss and volume loss percentage data in Table 7 show regular variations. For example, the baseline group (Test number 1) had a mass loss of 5.82% and a volume loss of 4.44% at 144 h, consistent with the general rule that mass loss is slightly higher than volume loss during the punching and grinding of concrete. This suggests that the preferential wear of surface materials (e.g., mortar layers) leads to greater mass loss during the wear process, whereas volume loss is influenced by the supportive effect of the matrix material (e.g., aggregate), resulting in a slower volume reduction. In addition, the elasticity of the fiber rubber allows some of the volume to recover after dynamic loading, resulting in relatively low volume loss.
Table 7.
Cumulative mass and volume loss of concrete.
The effect of doping on wear rate: An increase in doping significantly reduces the wear rate, but there is a threshold effect. With a low dosage (5%~10%), after the initial formation of the fiber network, impact wear strength is mainly dependent on the absorbance of energy due to the elastic deformation of rubber (e.g., for the 10% dose group, mass loss reduced by 50.2%); with a high dosage (15%), the fiber network is densified, so the inhibition of crack expansion is significant (e.g., compare the number of end-cracking impacts for the 15% dosage group with that for the baseline group, showing an improvement of 330%), but this is not the case with an excessive dosage (>15%). Excessive doping (>15%) may lead to an increase in the number of defects in the interfacial transition zone (ITZ) and exacerbate wear (e.g., the impact and wear strength in Test No. 10 are slightly lower than those in Test No. 9).
The effect of fiber length on the wear rate: For short fibers (6 mm) at low doping (5%), the dispersion is better, but the length-to-diameter ratio is insufficient, and wear resistance is limited (with a mass loss of 4.76%). For medium-length fibers (12 mm), the formation of a three-dimensional network at a doping rate of 10–15% significantly reduces wear through the bridging of cracks and the dispersal of stresses (with a mass loss of only 2.36% in Test No. 9). Long fibers (18 mm) tend to agglomerate at high dosages, resulting in weak local interfaces and increased wear rate fluctuations (with 2.42% mass loss in test number 10, slightly higher than that in Test No. 9).
As shown in Figure 6 and Figure 7, the abrasion rate of the fibrous rubber concrete tended to be stable over time, and the increase in mass loss from 72 to 144 h only ranged from 0.89% to 1.12%, indicating that the material could still maintain its structural integrity under long-term impact abrasion conditions. Comparison of the compressive strength data (mixed with 15% NBR, for which the compressive strength decreased by 23.73%) indicates that improving impact and abrasion resistance is not entirely dependent on static strength, as the dynamic energy absorption capacity is also a key factor.
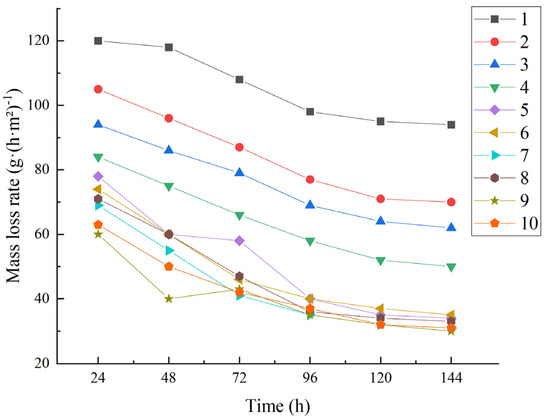
Figure 6.
Mass loss rate of concrete.
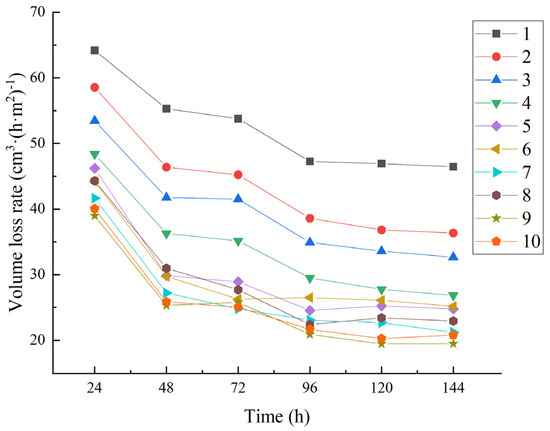
Figure 7.
Volume loss rate of concrete.
As shown in Figure 8 and Figure 9, the cumulative mass loss of all groups showed an approximately linear relationship with time, indicating that the scouring and abrasion damage did not enter the accelerated damage stage, and the elastic energy dissipation mechanism of the fibrous rubber was still effective under long-term loading. The benchmark group (Test No. 1) had a mass loss of 5.82% at 144 h, while the optimum group (Test No. 9) had only 2.36%, verifying the durability advantage of fibrous rubber concrete.
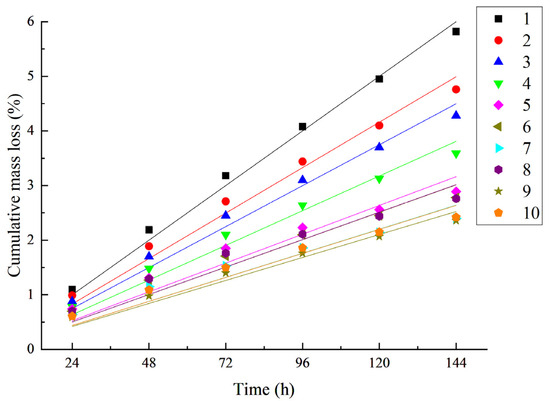
Figure 8.
Cumulative mass loss as a function of time.
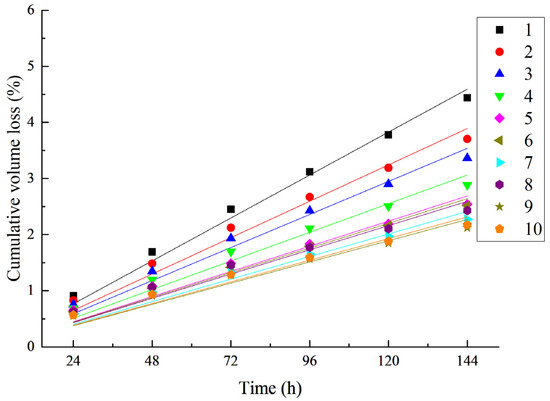
Figure 9.
Cumulative volume loss as a function of time.
3.5. Fractal Characterization of Surface Topography and Damage Quantification
3.5.1. Three-Dimensional Morphology Measurement
Changes in the apparent morphology of concrete specimens can reflect (to a certain extent) the degree of damage to concrete benchmark and test groups under punching and abrasion conditions. In this test, a simplified three-dimensional morphology–scanning measurement system was created using the mechanical probe point method so as to determine the morphological changes of concrete under different working conditions. The three-dimensional morphology test schematic is shown in Figure 10. A three-dimensional Cartesian coordinate system (X, Y, Z) was established, with the center of the specimen as the center and the Z-axis perpendicular to the surface of the specimen. A depth gauge was used instead of a sensor to measure the depth of wear of the specimen, and the maximum range of this depth gauge in the direction of the Z-axis was 120 mm, with an accuracy of 0.01 mm. The depth gauge and bracket can be moved along the X- and Y-axes, respectively, to measure the wear and shape changes on the surfaces of the entire specimen. Considering the accuracy of the wear pattern reflected by the number of measurement points and the workload required for measurement, we selected 5 mm as the spacing of each measurement point in the X- and Y-axis directions, and the data measured within this spacing were used to model the three-dimensional morphological characteristics of the change process and calculate the wear volume of the concrete under different conditions, in addition to the fractal dimensions, as shown in Equation (11) for the calculation of the wear volume.
where S, s denote the area of the whole concrete wear specimen and individual measuring point, given in mm2; Δz is the depth of wear of each measuring point on the surface of the specimen, in mm; and N is the total number of measuring points, and N = 2826 when the spacing of measuring points is 5 mm.
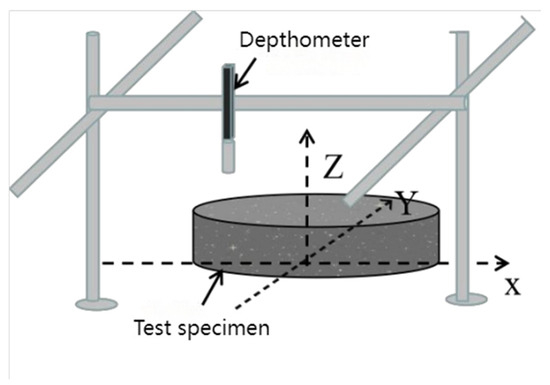
Figure 10.
A schematic diagram of the three-dimensional topography test [22].
3.5.2. Calculation of the Fractal Dimension
The surface abrasion of concrete specimens results in the formation of complex uneven and porous multi-scale structures that are self-similar (i.e., they exhibit similar characteristics at different scales), and fractal dimensions can be used to quantify this self-similarity. By calculating the fractal dimensions of the surfaces of concrete specimens, we can quantitatively analyze the magnitude of damage to the concrete caused by alluvial abrasion. In this test, we used the cubic cover method (a box-counting method) to cover the worn surface of the concrete, measure the wear depth of the specimen, and determine the change in fractal dimensions under different working conditions using the corresponding formula. A schematic diagram of the test conducted using the cubic cover method is shown in Figure 11.
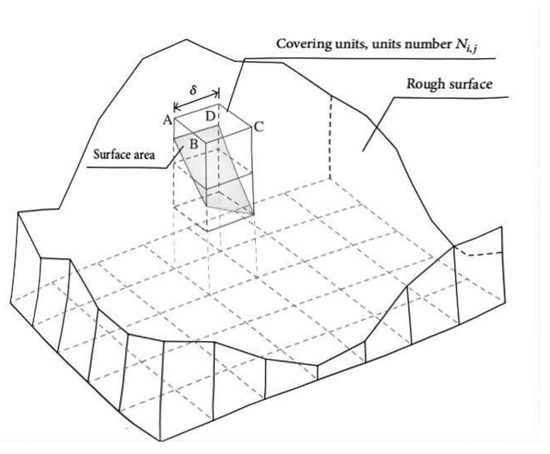
Figure 11.
A schematic diagram of the cube coverage method test [23].
A square grid, ABCD, is assumed to be on the wear surface, and these four corners correspond to four height values on the wear surface, with the following coordinates: h(i,j), h(i + 1,j), h(i,j + 1), and h(i + 1,j + 1); then, the punched surface is covered with a cube with a side length of δ. The number of δ × δ cubes required to cover the surface of ABCD is calculated as Ni,j, the formula for which is given in Equation (12).
where INT is a rounding function. The total number of cubes N(δ) required to cover the entire punched surface was calculated using Equation (13).
Ni,j = INT{(1/δ)[max(h(i,j), h(i + 1,j), h(i,j + 1), h(i + 1,j + 1)) −
min(h(i,j), h(i + 1,j), h(i,j + 1), h(i + 1, j + 1))] + 1}
By changing the edge length δ of the cube covering the punched surface, the corresponding total number of cubes N(δ) can be calculated, and if there exists a functional relationship consisting of N(δ) ~ δ−D, then it is proved that the morphological features of the punched surface can quantify this self-similarity in terms of fractal dimensions, D, which can be calculated using Equation (14).
3.5.3. Test Results and Analysis
The evolution of the data in Table 8 shows that there was a continuous increase in the fractal dimension during the concrete abrasion process, and the underlying mechanism is that the abrasion changes the surface morphology of the concrete: the initially smooth surface gradually evolves into a multi-scale concave–convex structure, and as the abrasion time extends from 72 h to 144 h (Figure 12 and Figure 13), the effective abrasion area of the specimen expands, and its roughness increases significantly. This morphological evolution directly leads to the enhancement of geometrical complexity, which increases the value of the fractal dimension. In addition, the inherent non-homogeneous characteristics of concrete make the wear rate vary in different areas, and this spatial heterogeneity further leads to a discrete distribution of the fractal dimensions of the wear surface.
Table 8.
The fractal dimension (D) of concrete during the wear process.
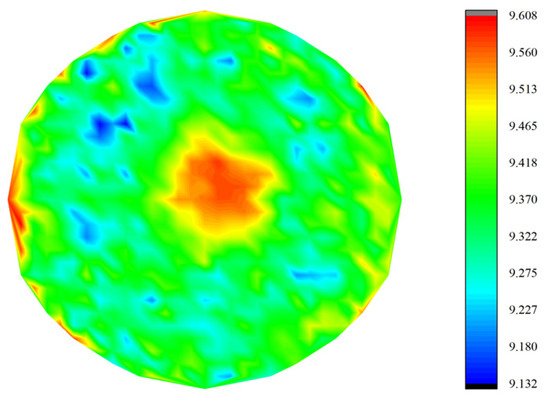
Figure 12.
The three-dimensional wear pattern after 72 h.
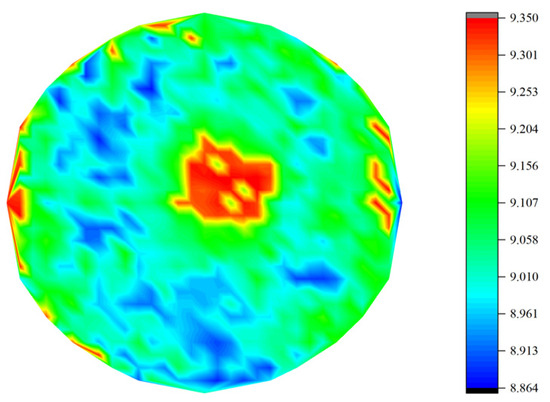
Figure 13.
The three-dimensional wear pattern after 144 h of punching and grinding.
Benchmark group (test number 1): The fractal dimension gradually increased with time (24 h:2.194→144 h:2.356), indicating that the surface of the plain concrete gradually roughened during the punching and grinding process, and the depth of abrasion and volume loss increased significantly. Fibrous rubber concrete group: The fractal dimensions are lower overall than those of the benchmark group and exhibited a growth rate that decreased with the increase in fiber admixture and length optimization. For example, the fractal dimension of the optimal group (test number 9) is only 2.204 at 144 h, which is significantly lower than that of the baseline group (2.356), indicating that the rubber fiber effectively inhibits the expansion of surface damage.
The fractal dimension was used to characterize the change in concrete surface morphology, which was fitted to the cumulative mass loss and cumulative volume loss; the results of the fitting are shown in Figure 14 and Figure 15. Quantitative analysis revealed that there is a significant positive correlation between the fractal dimension D and the cumulative mass loss M and volume loss V: with an increase in the value of D, M and V synchronously show a monotonous growth trend. The fractal dimension–wear mathematical model obtained by fitting the test data is shown in Equations (15) and (16), according to which the quantitative conversion relationships of D-M and D-V were established. The model has important application value in engineering testing: when it is difficult to directly measure concrete wear quality and volume, the indirect derivation of the wear volume can be realized by determining the fractal dimension of the surface morphology along with Equations (15) and (16), providing a new technological path for the evaluation of concrete durability.
M = 46.56ln(D) − 99.9 R2 = 0.8391
V = 37.22ln(D) − 79.78 R2 = 0.8697
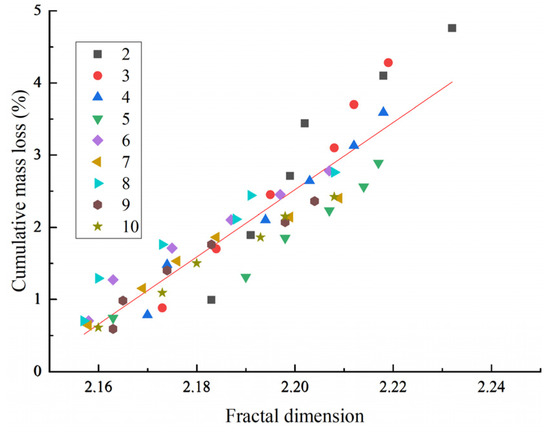
Figure 14.
Fractal dimension versus cumulative mass loss.
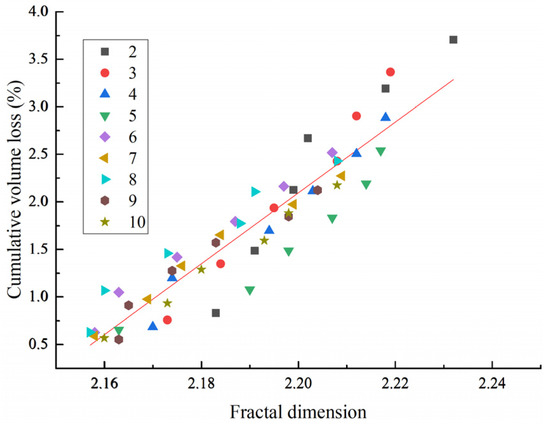
Figure 15.
The relationship between fractal dimension and cumulative volume loss.
3.6. Multiscale Analysis of the Mechanism of the Impact Abrasion Resistance of Fibrous Rubber
The superior impact and abrasion resistance of fibrous rubber concrete are a product of its unique material composite effect and dynamic response mechanism. Together with the experimental data and a microstructure analysis, the mechanisms of impact and abrasion resistance are summarized as follows:
The high elasticity of fibrous rubber gives the concrete in which it is incorporated a significant elastic cushioning capacity. When impacted by a high-speed water flow or solid particles, the rubber fiber absorbs the impact energy through large deformation (the test results show that the final cracking impact function of the concrete incorporating 15% NBR was 330% higher than that of the benchmark group), which reduces the direct effect of external forces on the cement matrix. In addition, the elastic recovery properties of rubber can delay the cumulative damage caused by surface abrasion, manifested as a slowdown in the growth rate for mass loss in the long-term abrasion test (e.g., in test number 9, the 144 h mass loss is only 40.5% of that for the benchmark group).
The fibrous rubber is distributed chaotically in the concrete, forming a spatial network structure. When surface microcracks formed because of punching and grinding, the fibers bridged the two sides of the cracks through mechanical occlusion and friction, inhibiting the crack expansion rate. Fractal dimension analysis showed that the surface roughness growth of the fiber-doped group was significantly lower than that of the benchmark group (with 144 h fractal dimensions of 2.204 vs. 2.356), confirming the restraining effect of the fiber network with respect to surface damage. Longer fibers (12 mm) have a higher aspect ratio than short fibers (6 mm), which enhances their ability to span the main cracks and, thus, provide better impact and abrasion resistance (with a 7.3% higher impact and abrasion resistance for test number 9 compared to that in test number 8).
The higher roughness of the NBR surface (Figure 16 and Figure 17a) enhances the physical bond with the cement matrix and reduces the risk of interfacial debonding. At the same time, the elasticity of the fibers redistributes the stresses at the interface to avoid local stress concentration, which is manifested in the more uniform distribution of surface wear in the high-dosage group (15%) (the increase in the fractal dimension is only 52% of that for the baseline group).
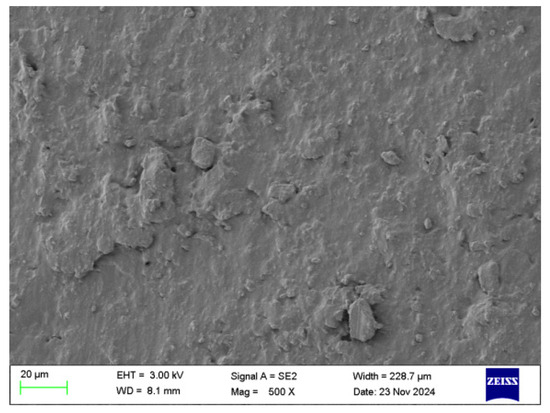
Figure 16.
NBR surface.
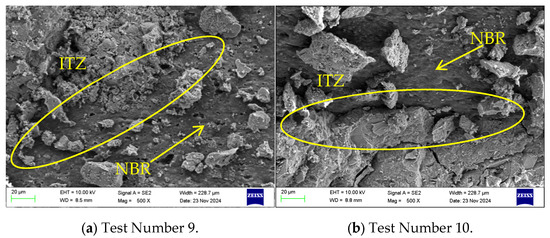
Figure 17.
The microstructure of the fibrous rubber concrete.
Under prolonged wear loading, the fibrous rubber adapted to the dynamic wear environment via repeated elastic deformation. The concrete’s impact strength increased slightly with the increase in impact time, indicating that a more realistic reflection of the impact situation can be achieved by appropriately extending the impact time. At the same time, the morphology of the fibrous rubber prevents the secondary wear caused by particle shedding to a certain extent, further improving the concrete’s durability.
The tests show that the dosage and fiber length need to be optimized synergistically: at a low dosage (5%), the 18 mm fibers performed best because of good dispersion; at a medium-high dosage (10–15%), the 12 mm fibers were optimal because of the balance between network density and interfacial defects (in Test no. 9, there was an abrasion resistance of 25.0 h/(kg/m2)). An excessive dosage (e.g., 15% + 18 mm) reduces performance because of localized stress concentration caused by fiber agglomeration (the strength of the concrete specimen in Test No. 10 was 3.2% lower than that in Test No. 9). This is due to the relatively weak bond between the fibrous rubber itself and the concrete matrix; a weakness was further exacerbated by the presence of rubber agglomerates (Figure 17b). The pieces of rubber inside the agglomerates are pressed against each other, so the rubber on the outer surface in contact with the substrate is not sufficiently in contact with the substrate, and bonding occurs. The weak interface between the agglomerates and the substrate is susceptible to small relative displacements caused by stress or the external environment, leading to an increase in the size of the gap or the creation of new gaps.
3.7. Mechanism Behind the Negative Correlation Between Compressive Strength and Splitting Tensile Strength and Abrasion Resistance
The test results of the analysis of anti-abrasion strength and mechanical properties show that the fibrous rubber concrete’s anti-abrasion strength, compressive strength, and splitting tensile strength behave according to a linear law of change, indicating the relationship between these properties in the fibrous rubber concrete. Accordingly, function fitting was conducted, as shown in Figure 18 and Figure 19. The functional expressions and R2 values are shown in Equations (17) and (18).
y = −0.92x + 60.11 R2 = 0.635
y = −17.95x + 79.01 R2 = 0.625
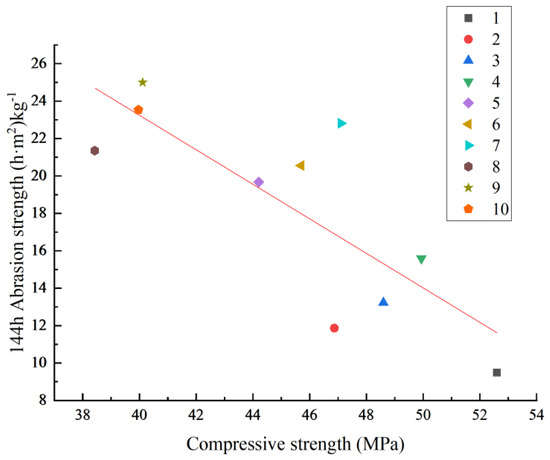
Figure 18.
The relationship between the abrasion strength and compressive strength of fibrous rubberized concrete.
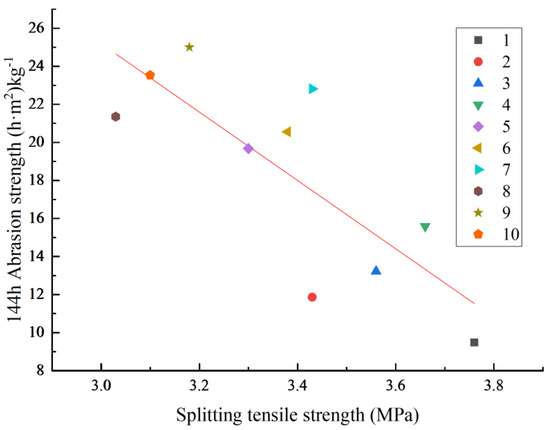
Figure 19.
The relationship between the abrasion strength and splitting tensile strength of fibrous rubberized concrete.
Analyzing Figure 18 and Figure 19 reveals that the properties of rubber grant the concrete good elasticity and flexibility. The addition of fibrous rubber to concrete will reduce its compressive strength and splitting tensile strength to some extent, but it will also improve its toughness. Furthermore, the fibrous rubber absorbs impact energy and improves the impact and abrasion strength of concrete. Therefore, in this case, the compressive strength and splitting tensile strength are negatively correlated with impact and abrasion strength.
Additionally, a pore structure difference can cause the interface transition zone between rubber and cement in fibrous rubber concrete to exhibit pores or defects. These pores may become a source of cracks during the compressive process, reducing the concrete’s compressive strength and splitting tensile strength. However, during impact abrasion, these pores can accommodate some of the impact abrasion energy, reducing the abrasion of the material surface, thus favorably affecting impact abrasion resistance and leading to a lower correlation between the two.
3.8. Positive Drivers of the Influence of the Impact Toughness Ratio on Impact Wear Performance
The test results obtained from the analysis of the impact abrasion resistance and impact toughness ratio show that the impact abrasion resistance and impact toughness ratio of fibrous rubber concrete behave according to a linear law of change, indicating the relationship between the impact abrasion resistance of fibrous rubber concrete and the impact toughness ratio according to the graph and function fitting, as shown in Figure 20.
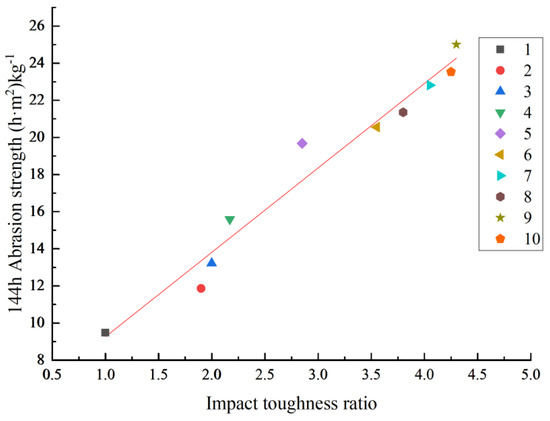
Figure 20.
The relationship between the abrasion resistance and impact toughness ratio of fibrous rubberized concrete.
Figure 20 shows that the impact toughness of fibrous rubber concrete is positively correlated with impact abrasion resistance, with R2 = 0.966, showing a high correlation. The rubber in fibrous rubber concrete can dissipate energy through its own deformation and friction when subjected to impact loading, improving the impact toughness of concrete. In the process of impact abrasion, a material also needs to absorb and dissipate the external impact energy. The energy absorption mechanism of rubber fibers helps improve the ability of concrete to resist the damage caused by impact abrasion, so impact toughness and impact abrasion resistance show a positive correlation. Fibrous rubber is uniformly distributed in this type of concrete, and it can play a role in connecting and restraining the concrete matrix and enhancing the integrity of the concrete structure. When concrete is subjected to impact abrasion, this integrity can effectively prevent cracks and expansion, thus improving the impact toughness and abrasion resistance of the concrete. At the same time, fibrous rubber can improve the stress distribution within the concrete, and the good interfacial properties of NBR and the substrate can make the stress more uniformly transmitted, reduce local stress concentration, and, thus, improve the impact toughness and abrasion resistance of concrete. In summary, the impact toughness of fibrous rubber concrete is closely related to its impact abrasion resistance. The impact toughness of fibrous rubber concrete is good, indicating, by extension, its greater impact abrasion resistance.
4. Discussion
The weak interfacial bond between rubber and the cement matrix in rubberized concrete is a key issue governing its performance. The interfacial bond between rubber fibers and the matrix can be significantly enhanced using surface modification techniques (e.g., chemical oxidation, plasma treatment, or the introduction of silane coupling agents) [24,25]. For example, chemical oxidation can introduce polar functional groups (e.g., carboxyl and hydroxyl groups) on the surface of the rubber to enhance its chemical bonding with cement hydration products [26], while silane coupling agents can improve physical adsorption through “bridging” [27]. Experimental results have shown that the modification of rubber increases the roughness of the resulting concrete, which further reduces the risk of interfacial stripping through the mechanical embedding effect, and, in an abrasive environment, strong interfacial bonding can effectively inhibit the expansion of microcracks caused by abrasion stress and reduce the peeling of rubber caused by high-speed water washout, thus enhancing long-term durability [28]. Future research could explore using nanomaterials (e.g., SiO2 coatings) or bio-based modifiers to balance environmental friendliness with performance optimization [29].
Under the coupled effects of freeze–thaw cycles and high-speed sandy water scouring and abrasion, the durability of fiber rubber concrete faces a dual challenge: internal microcracking due to freeze–thaw processes and surface spalling induced by scouring and abrasion [30,31]. Our experimental data showed that the optimal group (15% NBR + 12 mm fiber) lost only 2.36% of its mass after 144 h of scouring and abrasion (compared to 5.82% for the baseline group) and exhibited a slow increase in the fractal dimension (D = 2.204 vs. 2.356), suggesting that the fiber network can effectively inhibit damage accumulation. Freeze–thaw experiments (although not directly carried out in this study) can be inferred by analogy: the elastic cushioning of rubber relieves freezing stress, while the fiber network restricts crack expansion, and the two synergistically enhance frost resistance. However, the aging of rubber (e.g., via ozone oxidation) may reduce its elasticity following long-term exposure, so accelerated-aging experiments (e.g., −20 °C to 20 °C cycling + punch–abrasion simulation) must be conducted to verify the service life of this material. In addition, optimizing fiber distribution uniformity (avoiding agglomeration) is critical to ensure stable performance in harsh environments.
5. Conclusions
This paper focuses on the performance of fibrous rubber concrete in terms of impact and abrasion resistance and the corresponding mechanism. Through systematic tests and theoretical analysis, the following key conclusions were drawn.
- (1)
- The incorporation of fibrous rubber significantly increased the impact abrasion resistance of the concrete. The optimum group (15% NBR and a fiber length of 12 mm) achieved 25.0 h/(kg/m2) after 144 h, which is 163.7% higher than that of ordinary concrete. The dosage and length of fibers need to be synergistically optimized: the higher the dosage (15%) and the longer the fibers (12 mm), the better the performance, but excessively long fibers (18 mm) lead to a decrease in performance due to agglomeration at high dosages.
- (2)
- Fibrous rubberized concrete showed stability in long-term punching and grinding experiments. In the case of the optimum group, the mass loss after 144 h was only 2.36%, which is 40.5% of that of ordinary concrete. The wear rate tended to level off with time, indicating that this concrete’s elastic energy dissipation mechanism was still effective under long-term loading conditions.
- (3)
- Surface roughness was characterized using the fractal dimension D. It was found that the fractal dimension of fiber concrete was significantly lower than that of ordinary concrete (D = 2.204 for 144 h in the optimal group and D = 2.356 in the benchmark group), indicating that the fiber network inhibited surface damage extension. The fractal dimension was highly correlated with mass loss and volume loss, which can be used as quantitative evaluation indices of impact and abrasion resistance.
- (4)
- Fibrous rubber absorbs impact energy through large deformation and reduces matrix stress. A chaotic distribution of fibers leads to the formation of a spatial mesh structure, bridging cracks and slowing down expansion. The high surface roughness of nitrile rubber enhances its bonding force with the cement matrix and reduces interfacial debonding, and the elasticity of the fibers restores the structural integrity of a material over long-term punching and grinding.
- (5)
- Compressive strength and splitting tensile strength are negatively correlated with impact and abrasion strength. The impact toughness of fibrous rubber concrete is positively correlated with its impact abrasion resistance; i.e., fibrous rubber concrete with good impact toughness will have greater impact abrasion resistance.
Author Contributions
Writing—original draft, Z.L.; writing—review and editing, S.L.; project administration, C.J. All authors have read and agreed to the published version of the manuscript.
Funding
The authors gratefully acknowledge the financial support provided by the National Natural Science Foundation of China (52269028), the Xinjiang Uygur Autonomous Region University Research Program (XJEDU2024J045), and the Innovation Project of the Xinjiang Key Laboratory for Hydraulic Engineering Security and Water Disasters Prevention (ZDSYS-YJS-2023-11).
Data Availability Statement
The original contributions presented in this study are included in the article. Further inquiries can be directed to the corresponding author.
Conflicts of Interest
The authors declare no conflicts of interest.
References
- Tanchev, L. Dams and Appurtenant Hydraulic Structures; CRC Press: Boca Raton, FL, USA, 2014. [Google Scholar]
- Su, F.; Ma, X.; Lin, Y.; He, T. Exploring the factors influencing the abrasion resistance of hydraulic concrete based on underwater steel ball test. Case Stud. Constr. Mater. 2024, 20, e03020. [Google Scholar] [CrossRef]
- Müller-Hagmann, M.; Albayrak, I.; Auel, C.; Boes, R.M. Field Investigation on Hydroabrasion in High-Speed Sediment-Laden Flows at Sediment Bypass Tunnels. Water 2020, 12, 469. [Google Scholar] [CrossRef]
- Liu, Q.; Andersen, L.V.; Zhang, M.; Wu, M. Abrasion damage of concrete for hydraulic structures and mitigation measures: A comprehensive review. Constr. Build. Mater. 2024, 422, 135754. [Google Scholar] [CrossRef]
- Cheyad, S.M.; Hilo, A.N.; Al-Gasham, T.S. Comparing the abrasion resistance of conventional concrete and geopolymer samples. Mater. Today Proc. 2022, 56, 1832–1839. [Google Scholar] [CrossRef]
- Guo, J.; Gao, M.; Wang, K.; Zhang, P. Mechanisms and influential variables on the abrasion resistance hydraulic concrete. Nanotechnol. Rev. 2022, 11, 2997–3019. [Google Scholar] [CrossRef]
- Qiong, L.; Liang, L.; Vabbersgaard, L.A.; Min, W. Studying the abrasion damage of concrete for hydraulic structures under various flow conditions. Cem. Concr. Compos. 2023, 135, 104849. [Google Scholar]
- Thomas, B.S.; Kumar, S.; Mehra, P.; Gupta, R.C.; Joseph, M.; Csetenyi, L.J. Abrasion resistance of sustainable green concrete containing waste tire rubber particles. Constr. Build. Mater. 2016, 124, 906–909. [Google Scholar] [CrossRef]
- Kang, J.; Zhang, B.; Li, G. The abrasion-resistance investigation of rubberized concrete. J. Wuhan Univ. Technol.-Mater. Sci. Ed. 2012, 27, 1144–1148. [Google Scholar] [CrossRef]
- Bisht, K.; Ramana, P.V. Evaluation of mechanical and durability properties of crumb rubber concrete. Constr. Build. Mater. 2017, 155, 811–817. [Google Scholar] [CrossRef]
- Chen, F.; Zou, C.; Zhou, Y.; Hu, S.; Mao, J. Correlation analysis of abrasion resistance of rubber concrete with microstructure and pore structure. Constr. Build. Mater. 2025, 475, 141211. [Google Scholar] [CrossRef]
- Chen, X.; Han, X.; Ji, Y.; Duan, W.; Zhang, K. Research Status on Mechanical and Anti-Abrasion Properties of Rubber Concrete. Henan Sci. Technol. 2022, 41, 65–68. (In Chinese) [Google Scholar]
- Feng, L.; Chen, A.; Liu, H. Effect of waste tire rubber particles on concrete abrasion resistance under high-speed water flow. Int. J. Concr. Struct. Mater. 2021, 15, 37. [Google Scholar] [CrossRef]
- Niu, J.; Kong, F.; Zhu, X.; Li, J. Research and Application of Fiber-Reinforced Hydraulic Anti-Abrasion Concrete. Henan Water Resour. South-to-North Water Divers. 2019, 48, 84–86. (In Chinese) [Google Scholar]
- Li, S.; Tang, L.; Shi, W.; Zhong, C. Experimental investigation on hydroabrasive erosion of steel fiber UHPC and rubber UHPC. Adv. Mater. Sci. Eng. 2020, 2020, 5920824. [Google Scholar] [CrossRef]
- Li, S.; Wei, K.; Jiang, C. Anti-Abrasion Performance of Basalt Fiber Rubber Concrete. J. Civ. Environ. Eng. (Chin. Engl.) 2024, 46, 175–182. (In Chinese) [Google Scholar]
- Li, Z.; Li, S.; Jiang, C. A Study on the Mechanical Properties and Performance of Fibrous Rubberized Concrete. Buildings 2025, 15, 1245. [Google Scholar] [CrossRef]
- SL/T 325-2020; Hydraulic Concrete Test Procedure. Ministry of Water Resources of the People’s Republic of China: Beijing, China, 2020.
- CECS 13:2009; Standard Test Methods for Fiber Concrete. Beijing China Planning Publishing House: Beijing, China, 2009.
- Feng, L.; Yuan, Q.; Ma, Y.; Shi, C. Experimental Study on Mechanical Properties of Rubber Concrete. J. Yangtze River Sci. Res. Inst. 2015, 32, 115–118. (In Chinese) [Google Scholar]
- Liang, C.; Liu, T.; Xiao, J.; Zou, D.; Yang, Q. The damping property of recycled aggregate concrete. Constr. Build. Mater. 2016, 102, 834–842. [Google Scholar] [CrossRef]
- Jiang, C.; An, S.; Li, S.; Wu, B. Evaluation and Prediction of Anti-Abrasion Performance of Hydraulic Concrete Based on Three-Dimensional Topography. Concr. Cem. Prod. 2024, 6, 82–87. (In Chinese) [Google Scholar] [CrossRef]
- Zhou, H.W.; Xie, H. Direct estimation of the fractal dimensions of a fracture surface of rock. Surf. Rev. Lett. 2003, 10, 751–762. [Google Scholar] [CrossRef]
- Li, Y.; Zhang, X.; Wang, R.; Lei, Y. Performance enhancement of rubberised concrete via surface modification of rubber: A review. Constr. Build. Mater. 2019, 227, 116691. [Google Scholar] [CrossRef]
- Zhu, Z.; Tai, C.; Zhang, Y.; Lu, Y. Effects and mechanisms of green-modified waste rubber particles on the mechanical properties and durability of cement-based materials. J. Build. Eng. 2025, 104, 112237. [Google Scholar] [CrossRef]
- He, L.; Ma, Y.; Liu, Q.; Mu, Y. Surface modification of crumb rubber and its influence on the mechanical properties of rubber-cement concrete. Constr. Build. Mater. 2016, 120, 403–407. [Google Scholar] [CrossRef]
- Li, G.; Wang, Z.; Leung, C.K.Y.; Tang, S.; Pan, J.; Huang, W.; Chen, E. Properties of rubberized concrete modified by using silane coupling agent and carboxylated SBR. J. Clean. Prod. 2016, 112, 797–807. [Google Scholar] [CrossRef]
- Zhang, L. Comparative Experimental Study on Anti-Abrasion Performance of Modified Rubber Concrete. Water Sci. Cold Reg. Eng. 2023, 6, 34–37. (In Chinese) [Google Scholar]
- Wang, D.; Wang, Z.; Cao, H.; Wang, W. Study on Fractal Characteristics and Mechanical Properties of Nano-SiO2 Coated Modified Rubber Concrete. Shanxi Archit. 2024, 50, 9–13. (In Chinese) [Google Scholar] [CrossRef]
- Li, S.; Wu, B.; Jiang, C.; Wu, L. Study on the damage mechanism of hydraulic concrete under the alternating action of freeze-thaw and abrasion. Constr. Build. Mater. 2024, 447, 137976. [Google Scholar] [CrossRef]
- Gesoğlu, M.; Güneyisi, E.; Khoshnaw, G.; İpek, S. Abrasion and freezing–thawing resistance of pervious concretes containing waste rubbers. Constr. Build. Mater. 2014, 73, 19–24. [Google Scholar] [CrossRef]
Disclaimer/Publisher’s Note: The statements, opinions and data contained in all publications are solely those of the individual author(s) and contributor(s) and not of MDPI and/or the editor(s). MDPI and/or the editor(s) disclaim responsibility for any injury to people or property resulting from any ideas, methods, instructions or products referred to in the content. |
© 2025 by the authors. Licensee MDPI, Basel, Switzerland. This article is an open access article distributed under the terms and conditions of the Creative Commons Attribution (CC BY) license (https://creativecommons.org/licenses/by/4.0/).