Article

Optimizing Sound Insulation Performance of Triple Glazing with Different Glass and Cavity Thickness Combinations

1
College of Civil Engineering and Architecture, Zhejiang University, Hangzhou 310058, China
2
Cryogenic Center, Hangzhou City University, Hangzhou 310015, China
*
Author to whom correspondence should be addressed.
Buildings 2025, 15(11), 1766; https://doi.org/10.3390/buildings15111766
Submission received: 27 April 2025 / Revised: 18 May 2025 / Accepted: 20 May 2025 / Published: 22 May 2025
(This article belongs to the Section Building Energy, Physics, Environment, and Systems)

Abstract

Triple glazing has garnered widespread attention as a key solution that balances sound insulation, building energy efficiency, and thickness-related cost-effectiveness. This study evaluated the acoustic performance of triple glazing, focusing on how cavity and glass thickness combinations performed under a fixed total thickness. Laboratory measurements were first conducted, which revealed that asymmetric triple glazing performed better for sound insulation than symmetric combinations. Based on this, 28 triple glazing combinations with a total thickness of 42 mm were selected to build finite element models, including window frames. These models were used to calculate the sound transmission loss curves, the weighted sound reduction index, and the distributions of structural stress and the displacement amplitude. The best sound insulation performance was achieved when the glass panes had unequal thicknesses, with the thickest pane positioned on the outermost layer (either on the source or the receiver side). The weighted sound reduction index R w increased by 6 dB, and the combined value of R w and the traffic noise spectrum correction ( R w + C tr ) improved by up to 11 dB. The optimal combination was 8-12A-6-12A-4, and R w reached 44 dB. Combinations with the thickest pane in the middle layer or with equal pane thicknesses exhibited a worse sound insulation performance. Variations in the cavity thickness had a smaller effect on sound insulation than changes in the glass’s thickness. A reasonable combination of glass thicknesses in triple glazing effectively reduced the displacement amplitude and improved the sound insulation performance.

1. Introduction

The 2024 Annual Report on the Prevention and Control of Noise Pollution in China [1] indicates that nighttime compliance with noise standards is the lowest in areas along major roadways and railway lines (Subcategory 4a) [2]. Relevant regulations [3,4,5] stipulate that triple-glazed doors and windows should be used for noise-sensitive buildings near major traffic arteries. However, in practice, the acoustic benefits of triple glazing are often not fully realized.
Compared with single or double glazing systems, triple glazing incorporates additional glass and gas layers, which enhance the reflection, refraction, and absorption of sound waves, thereby reducing a window’s sound transmission coefficient [6]. However, this combination also introduces additional resonance effects that result in dips in the sound insulation performance: at low frequencies, these dips are governed by the mass–spring–mass resonance frequency [7,8], while at high frequencies, they are related to the resonance characteristics of the air cavities [9,10]. In addition, many other factors influence sound insulation, including the type of frame, the material and thickness of the glass, the cavity composition, and window size [11,12,13,14]. Most existing studies on triple glazing have primarily investigated the effect of a single parameter (such as glass thickness, cavity width) while holding the other factors constant. However, in practical applications, these parameters are often interdependent and constrained by the total thickness. Few studies have conducted a comprehensive evaluation of various structural combinations under a fixed overall thickness, which is critical for real-world design optimization.
The existing studies mostly compare single, double, and triple glazing. The sound insulation of single glazing generally follows the “mass law” [15]. While an increased mass can reduce sound transmissions, it adds weight and costs. Compared to single panels, double panels exhibit a better acoustic performance [16] and have been widely adopted in modern buildings, transportation, and aerospace. Motivated by the improvements gained from an additional panel, researchers have explored the benefits of triple-layer combinations. W.S. Chen et al. [17] used transfer matrix theory to analyze periodic multilayer panels and showed that thickness and spacing adjustments could shift the insulation dips to the desired frequency bands. Composite structures combining thick and thin layers can improve both low- and high-frequency insulation. F.X. Xin et al. [18] studied a clamped triple-pane system and identified the physical mechanisms behind the dips in the sound insulation, including mass–spring resonance and the panel modes. These results show that triple glazing offers more design flexibility due to its tunable structure.
The research methods in the sound insulation field include experiments and simulations. Common experimental methods include the standing wave tube method [19,20], the laboratory double-room method [21,22], and field tests (e.g., traffic noise or loudspeaker methods) [23], among which the laboratory double-room method is the most widely used. The methods for calculating the sound insulation of windows include the finite element method (FEM) [9,24,25,26,27,28], the transfer matrix method (TMM) for N-layer structures [29,30], the finite layer method (FLM) [31], and the compressed transfer function (CTF) method [32]. Among these, the finite element method is the most widely used, and it can accurately analyze the sound insulation dips in a sound insulation curve caused by resonance phenomena. It can also set different boundary conditions on the computational domain and accurately analyze it, providing clear advantages over other methods. Zhu Xi et al. [33] used the FEM and acoustic software to establish various models and performed simulation experiments on the sound transmission loss of double glazing using the ideal double-chamber method. They concluded that appropriately adjusting the air layer and the glass’s thickness can effectively improve the sound insulation at the resonance frequencies of the window structure. Mimura [34] used the FEM to analyze the impact of different glass sizes on the sound insulation of hollow windows in a diffuse sound field. This study demonstrated significant differences in low and mid-frequency sound insulation between windows with and without frames. Arjunan [35] and Maurin [36] used the FEM to study the 1/3-octave-band sound insulation and weighted sound reduction index of lightweight double walls and hollow windows, comparing their results with laboratory measurements, showing good consistency.
In summary, how to optimize the combination of the glass and cavity thickness under the constraint of a fixed total multilayer thickness remains an open research question. To address this, the present study combines experimental and simulation approaches and draws on the Chinese Technical Code for the Application of Architectural Glass [37]. Typical models of triple glazing are systematically analyzed. In window design, the overall thickness cannot be increased indefinitely due to structural, installation, and cost constraints. One typical configuration used in engineering practice—6-12A-6-12A-6—has a total thickness of 42 mm and served as a reference in this study. A total of 28 combinations were selected, with the total thickness (of the glass and the cavity combined) kept within 42 mm. This study analyzes their frequency-dependent sound insulation curves, weighted sound reduction indices, natural frequencies, and modal behavior, in order to identify high-performance specifications and discuss the underlying mechanisms.

2. The Method

2.1. Simulation

2.1.1. Model Development

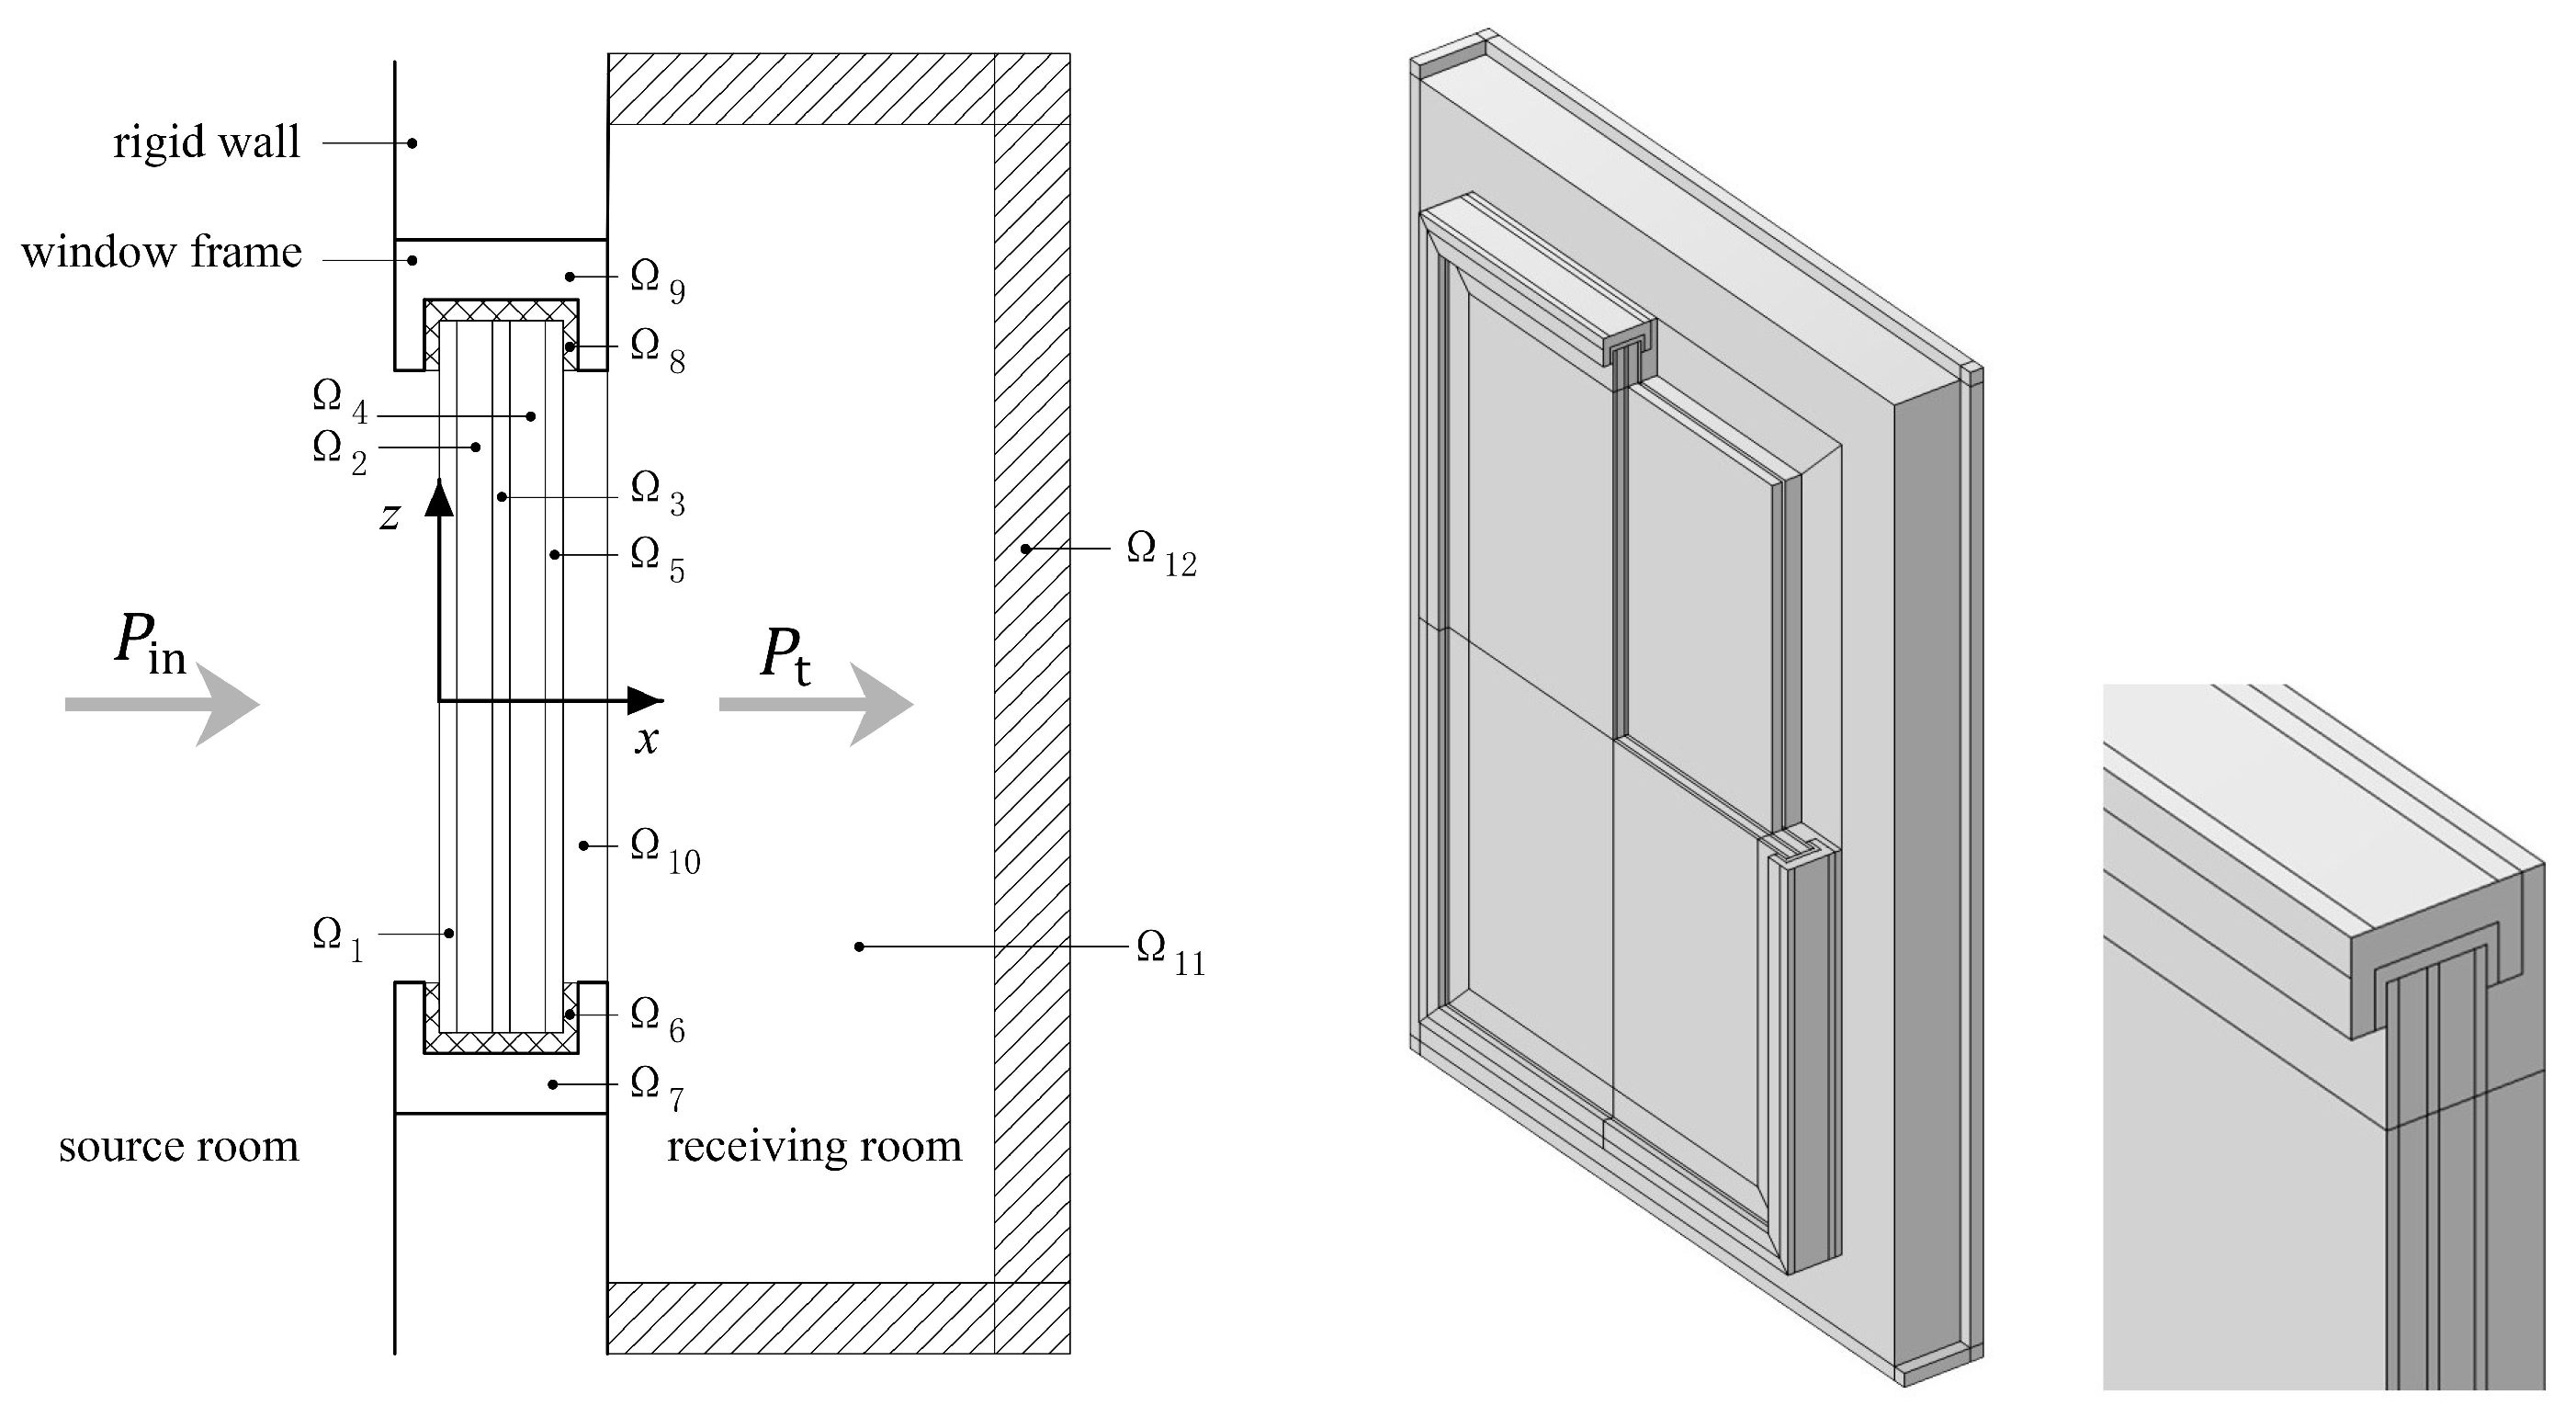
A sound insulation simulation model for triple glazing was established, as shown in Figure 1. The whole window is embedded into an infinitely large rigid wall. Domains Ω 1 , Ω 3 , and Ω 5 are glass; domains Ω 2 , Ω 4 , Ω 10 , and Ω 11 are standard air; domains Ω 6 and Ω 8 represent sealing strips; domains Ω 7 and Ω 9 represent the window frame; and domain Ω 12 is the perfect matching layer (PML).
(1) The boundary condition
Considering that glass is a brittle material and cannot directly make contact with the frame, the sealing strips were set according to the minimum installation dimensions specified in the Technical Specification for the Application of Architectural Glass. This ensures that the glass does not make contact with the frame under a load and can deform appropriately. The simulation assumes the optimal performance of the sealing strips. In actual use, the outer side of the window frame is directly connected to the surrounding wall structure, but neither completely free nor rigid boundary conditions exist in reality. In practice, the constraints on the window frame are between these two extreme states. In this simulation, fixed boundary conditions were applied around the window frame. The simulation only considers the interaction forces under sound waves and does not take frictional forces into account.
(2) Material properties
The basic principle of using the finite element method to calculate the sound insulation of windows is to discretize the partial differential equations and control the boundary conditions. Both the pressure acoustic field and the solid mechanics field have corresponding governing equations to solve for the unknown field variables. The governing equations are generally partial differential equations derived from the constitutive relationships of related variables and various conservation laws. In this study, the glass, window frame (PVC material), and sealing strips are modeled as isotropic linear elastic materials with damping properties. The parameter settings are shown in Table 1.
(3) Model setup
The finite element model was developed using COMSOL Multiphysics 6.3. Three-dimensional solid elements were used to simulate the triple glazing structure. The model was meshed using a combination of different mesh types, including free triangular, mapped, and swept meshes. The mesh size in the calculation is determined by the highest frequency from the research: the maximum mesh element size = c 0 / f max / 5 , and the minimum mesh element size = c 0 / f max / 6 . Calculations are performed in the frequency range of 100 Hz to 4000 Hz using 1/6-octave-band steps. Two random seed values are used, and the sound insulation results are obtained under two random test conditions using the parameter scanning method.

2.1.2. Calculations

(1) The sound field
In laboratory measurements of the sound insulation of building components, a reverberation room is typically used on the source side, ensuring that the sound generated in the source room is steady-state with a continuous spectrum within the measured frequency range. On the receiver side, either a reverberation room or an anechoic chamber can be used. To reduce the computational effort and avoid modeling the source and receiver rooms, it is assumed that the source side of the component is an ideal diffuse sound field, and the receiver side is an ideal anechoic field, with minimal absorption on the component, resulting in a negligible effect on the receiver side. Therefore, in this study, a number of independent plane waves were used on the source side to simulate a diffuse sound field similar to that in a laboratory environment, with each plane wave having a random direction and phase. On the receiver side, the PML is set to absorb all incident sound waves, ensuring no reflected sound.
The expression for the incident pressure field on the source side is
p in = 1 N n = 1 N exp i ( k n , x x + k n , y y + k n , z z ) exp i ϕ n ,
k n , x = cos ( θ n ) · k ,
k n , y = sin ( θ n ) cos ( φ n ) · k ,
k n , z = sin ( θ n ) sin ( φ n ) · k .
Equation (2a–c) represents the x, y, and z components of the wavevector k, where θ and φ are the polar and azimuthal angles, respectively, and ϕ is the random phase. These variables are functions of n and the random seed, where n is used to distinguish different random numbers, and the seed is used to generate the random number sequence.
The reflected component of the incident pressure field on the source side is represented as
p refl = 1 N n = 1 N exp i k n , x x + k n , y y + k n , z z exp i ϕ n .
The sound field ( p window ) on the source side can be defined as the sum of the incident sound pressure ( p win ) and the reflected sound pressure ( p refl ) within the source field, as shown in Equation (4).
p window = p in + p refl .
(2) The sound reduction index
The sound reduction index R is calculated as the ratio of the sound power incident on the building component to the sound power radiated through the component into the receiving room. This ratio is then taken to the base 10 logarithm and multiplied by 10, with the unit in decibels (dB):
R = 10 log 10 P in P t ,
P in and P t are shown in Equation (6a) and (6b):
P in = A 1 I x , in d A 1 ,
P t = A 2 I x , t d A 2 ,
where I x , in and I x , t are the components of the intensity of incident sound and the intensity of transmitted sound in the x direction, respectively; A 1 represents the area of the incident plate, and A 2 represents the area of the radiating plate.
Time-averaging the transient sound intensity over one cycle yields the average sound intensity I, whose component in the x-direction is seen in Equation (7):
I x = 1 2 Re p · v x ,
where v x is the velocity component of the acoustic wave in the x-direction; see Equation (8):
v x = 1 i ω ρ p x ,
where ρ is air’s density. When solving for the component I in of the intensity of incident sound along the x-direction in Equations (7) and (8), the pressure of incident sound obtained using Equation (4) is used; when solving for the component of the intensity of transmitted sound in the x-direction in Equations (7) and (8), the sound pressure on the coupling surface between the radiating plate and the right cavity is used, which is obtained using the finite element method.

2.2. The Experiment

In the laboratory test method, the two adjacent reverberation rooms serve as the source room and the receiving room, respectively. Broadband noise (such as pink or white noise) is generated in the source room to ensure a uniformly distributed sound field, approximating a diffuse sound field, which simulates real-world sound transmission conditions.
A test specimen with the area S is installed between the two reverberation rooms. In a diffuse sound field, the sound energy density is uniform, and the average intensity of sound is the same in all directions. Let the root mean square sound pressure be p rms , and the average sound intensity be I ¯ ; then,
p rms 2 = 4 ρ 0 c 0 I ¯ ,
where c 0 is the speed of sound in air, and ρ 0 is air’s density.
Thus, the sound pressure level in a diffuse sound field is given by
L = 10 lg p rms 2 p ref 2 = 10 lg ρ 0 c 0 p ref 2 · I ¯ ,
where p ref is the reference sound pressure.
In the receiving room, the sound power absorbed by the equivalent absorption area A is P = I ¯ A . When the sound field is steady-state, the incoming sound power P + must equal the absorbed power: P + = P = I ¯ A .
Assuming both the source and receiving rooms contain diffuse sound fields, with the average sound intensities I ¯ 1 and I ¯ 2 , respectively, the incident sound power in the source room is P in = I ¯ 1 S , and the power transmitted into the receiving room is P + = P t = I ¯ 2 A .
Substituting into Equation (5) yields
R = 10 lg I ¯ 1 S I ¯ 2 A = 10 lg I ¯ 1 I ¯ 2 + 10 lg S A = L 1 L 2 + 10 lg S A .
Therefore, in the laboratory method for measuring sound insulation, the sound pressure levels L 1 and L 2 in the source and receiving rooms are measured. The level difference D = L 1 L 2 is calculated. Based on the absorption characteristics of the receiving room and the specimen area, the sound insulation value R can be determined.

3. The Experimental Study

3.1. The Experimental Equipment and Testing Environment

The experiment was conducted in the Acoustics Laboratory of the College of Civil Engineering and Architecture at Zhejiang University. The testing setup consisted of two adjacent reverberation rooms (a source room and a receiving room), as shown in the figure. The volume of the receiving room is 81.54 m 3 , and the level of background noise is below 25 dB(A).
The partition wall between the two rooms is a double-layer wall constructed using solid clay bricks. Both sides and the middle layer are plastered with 20 mm thick cement mortar, forming a total of three layers. A 100 mm air cavity is reserved in the middle.
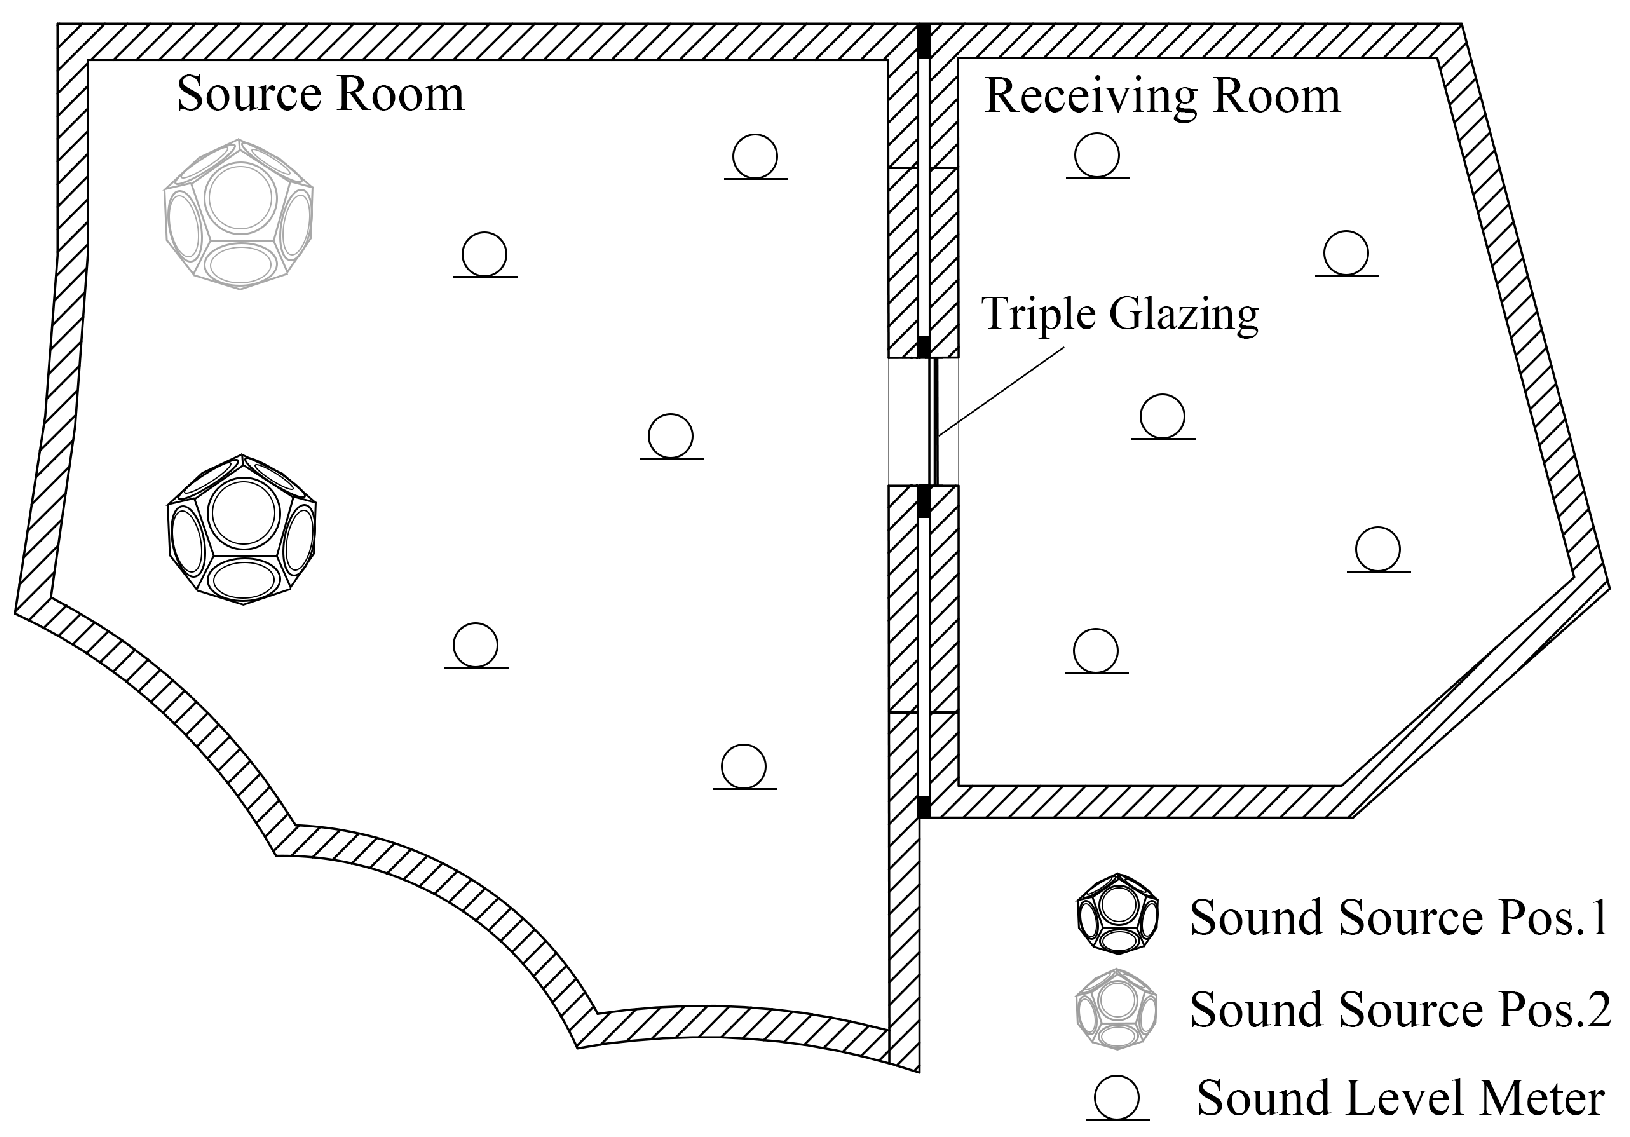
The size of the test window’s opening is 1100 mm × 1300 mm, and the edges of the opening are densely filled with cement mortar. The laboratory layout and the arrangement of the sound source measurement points are shown in Figure 2.
The main testing equipment includes a dodecahedral loudspeaker, a power amplifier, a B&K ZE0948 USB audio interface (Brüel & Kjær, Nærum, Denmark), a B&K 2270-S sound level meter (Brüel & Kjær, Nærum, Denmark) with a matched B&K 4189 microphone (Brüel & Kjær, Nærum, Denmark), a laptop, and a temperature–humidity meter. All instruments were calibrated before use. Photos of the experimental equipment and test setup are shown in Figure 3.

3.2. The Design of the Experimental Samples

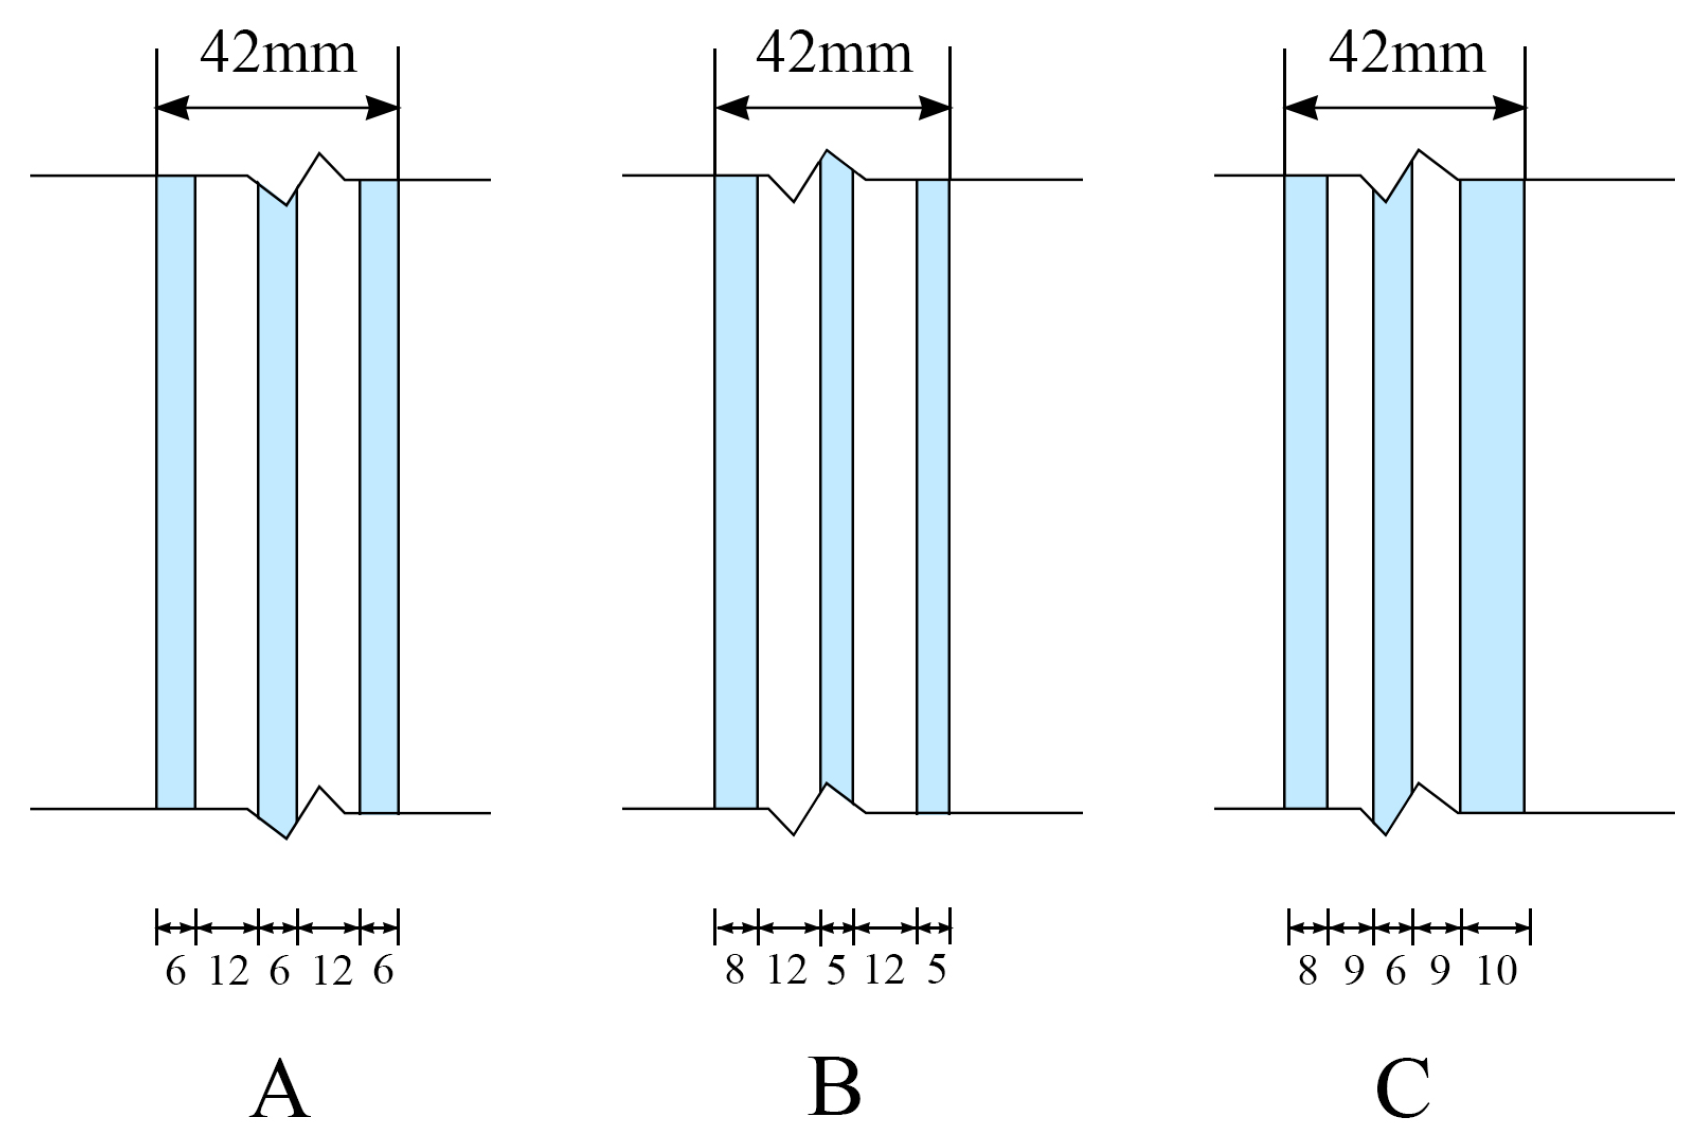
Three window combinations were designed for this experiment. The reference sample adopts a symmetric structure with a 6-12A-6-12A-6 combination. The two asymmetric combinations are 8-9A-6-9A-10 and 8-12A-5-12A-5. All three samples have a total thickness of 42 mm and are identical in all aspects except for the thickness combinations of the glass and air cavities.
The 8-12A-5-12A-5 combination retains the same total glass thickness as that of the reference (18 mm) but forms an asymmetric structure by increasing the glass thickness on the incident side to 8 mm and reducing the thickness of the middle and receiving side glass layers to 5 mm each. In contrast, the 8-9A-6-9A-10 combination increases the total glass thickness to 24 mm by thickening both outer glass layers by a combined 6 mm. To maintain the overall thickness of the sample, the thickness of the air cavity is reduced by 6 mm accordingly. Schematics of the thicknesses of the three window samples are shown in Figure 4.

3.3. The Experimental Results

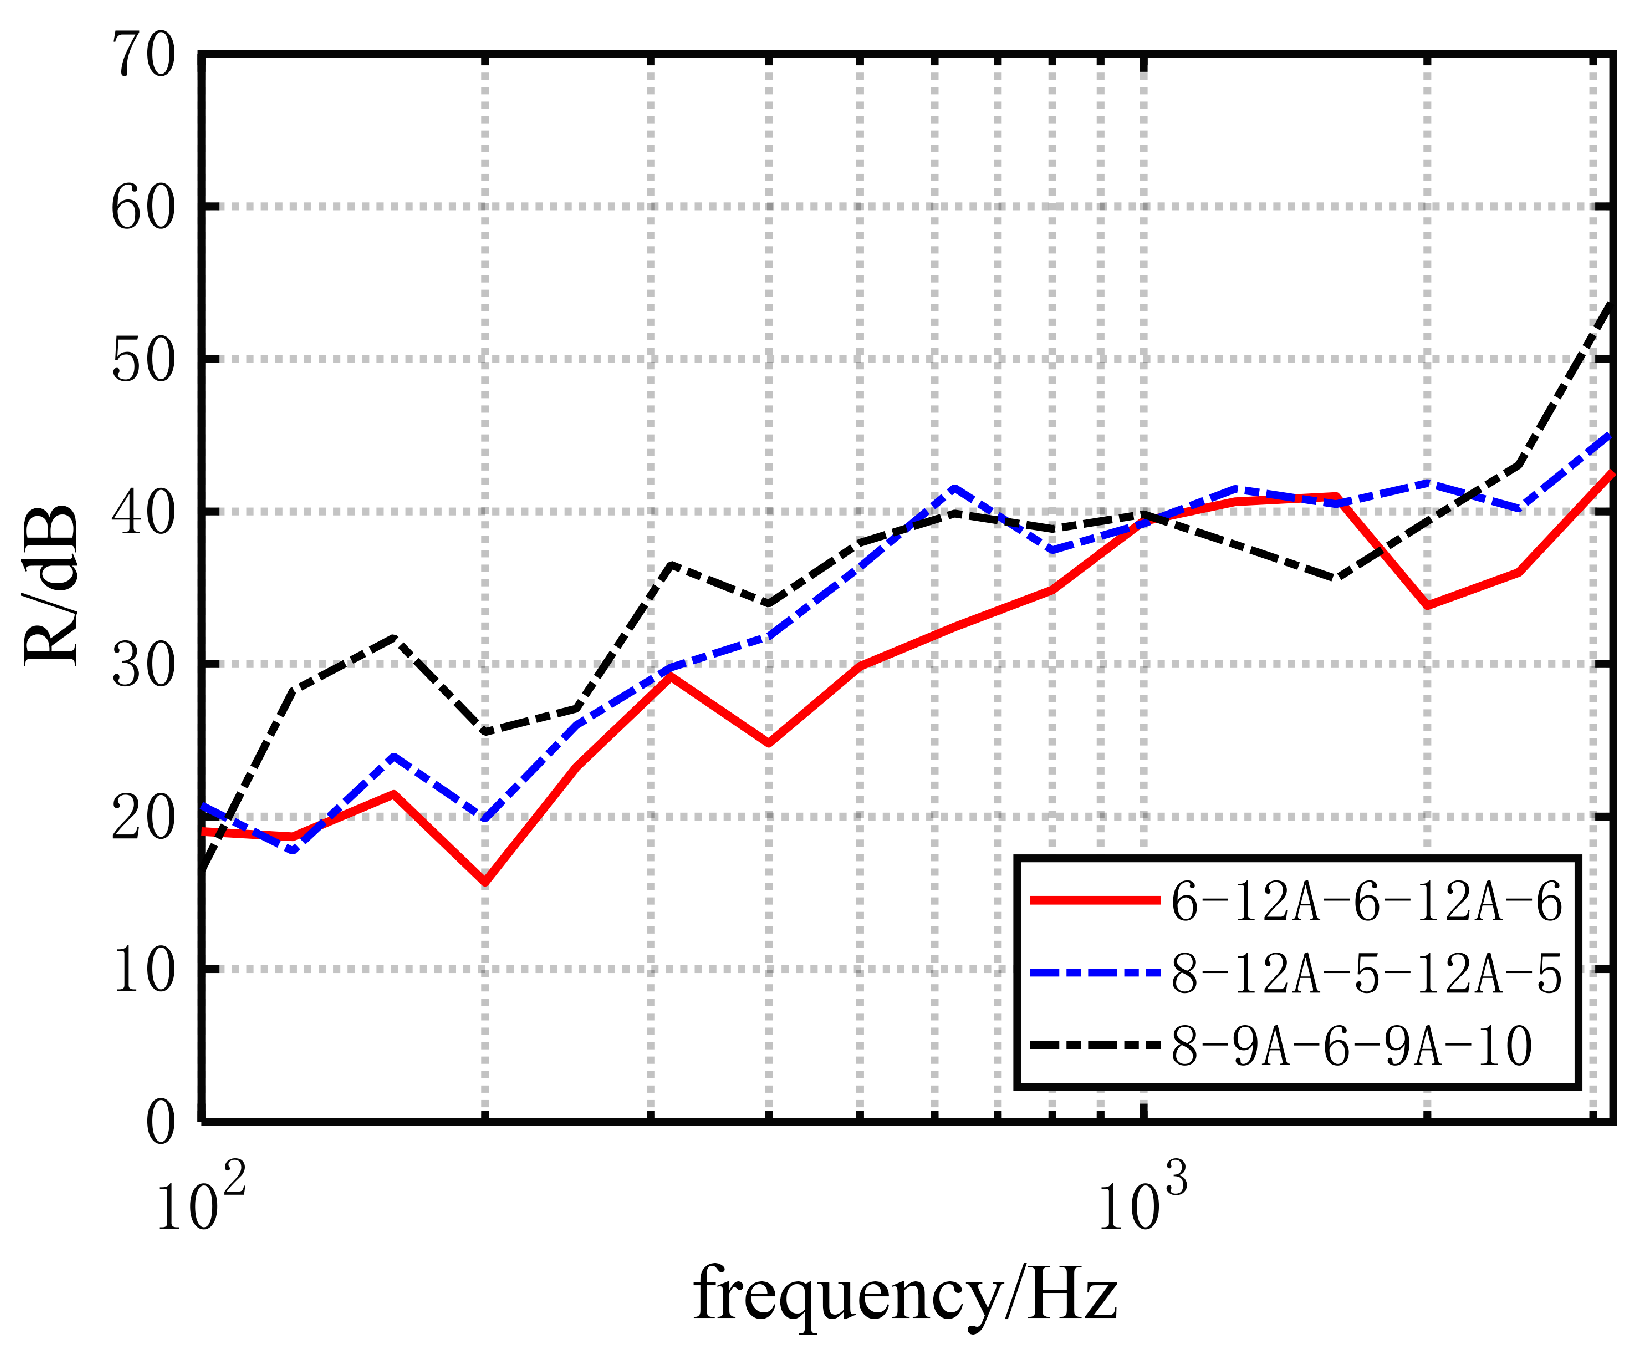
Figure 5 shows a comparison of the sound insulation curves in one-third of an octave band for the three types of windows. It can be seen that all three triple glazing combinations exhibit similar frequency-dependent trends: the sound insulation improves with increasing frequency, with dips occurring in certain frequency bands.
In most frequency bands, the sound insulation of the symmetric combination is lower than that of the asymmetric combinations. Between the two asymmetric samples, 8-12A-5-12A-5 and 8-9A-6-9A-10, the sound insulation values are comparable in the mid- to high-frequency range. Below 400 Hz, the 8-9A-6-9A-10 sample shows a better performance.
Table 2 lists the average sound insulation values across frequency bands and the weighted sound reduction indexes. Compared with the symmetric combination, the two asymmetric combinations achieve improvements of 4–5 dB in R w and 3–5 dB in R w + C tr . Between the two asymmetric types, the performance at mid- to high frequencies is similar, but 8-9A-6-9A-10 shows the largest improvement at low frequencies, indicating that increasing the glass’s thickness is particularly effective for low-frequency insulation.
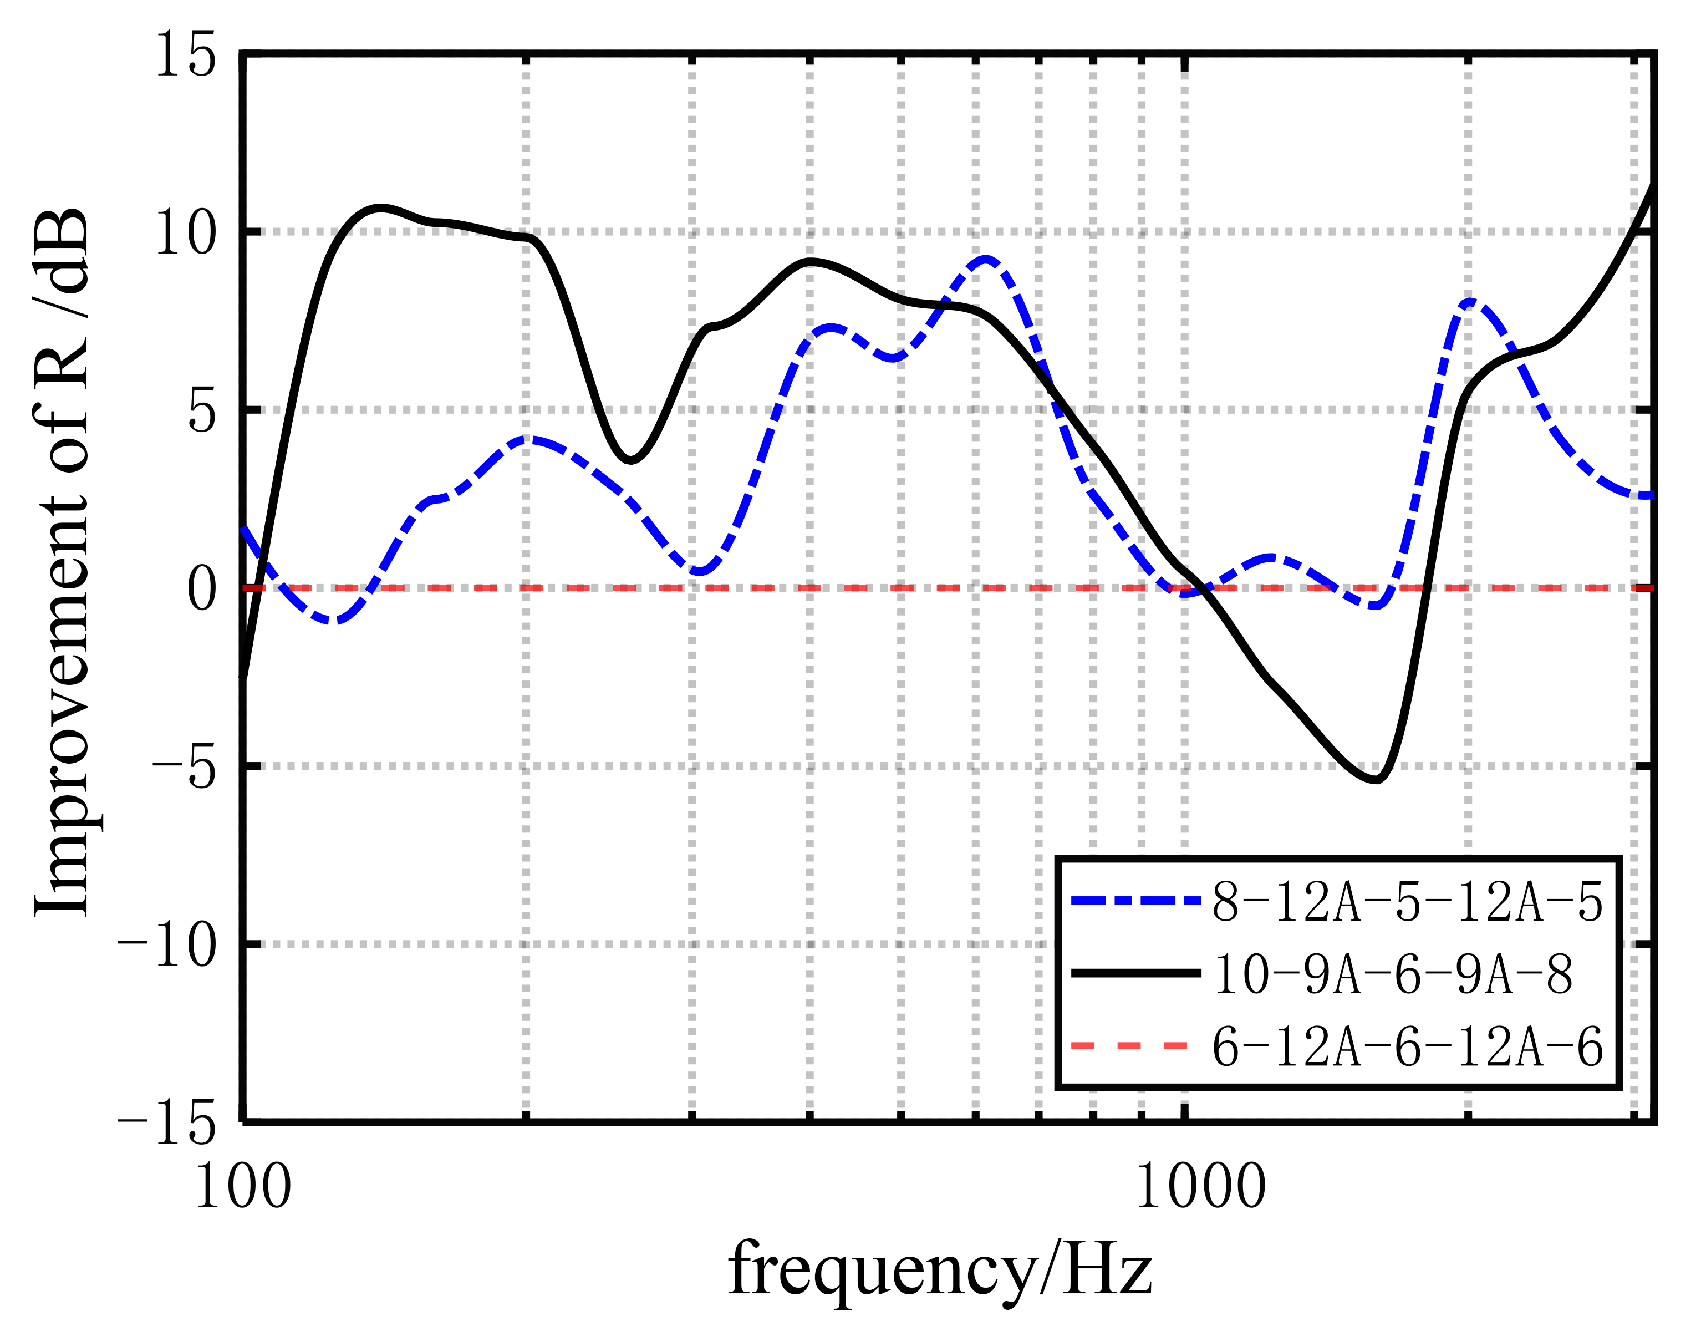
As shown in Figure 6, taking the symmetric combination as the baseline, the improvement in sound insulation for the two asymmetric types is calculated. The figure shows that in bands below 1000 Hz and above 2000 Hz, both asymmetric windows achieve improvements of 5–10 dB. In the 1000–2000 Hz range, no significant improvement is observed, and the sound insulation of the 8-9A-6-9A-10 combination is even slightly lower than that of the 6-12A-6-12A-6 combination.

4. The Simulation Study

4.1. Model Validation

In the sound insulation simulations of this study, the incident sound field on the source side is defined as the sum of the incident and reflected sound pressures (see Equation (4)), which is equivalent to the sound pressure level measured near the wall surface of the component. In contrast, the experimental measurement adopts the spatially averaged sound pressure level in the source room (see Equation (9)). A discrepancy of approximately 3 dB exists between these two definitions. Therefore, to eliminate any deviation in the comparison between the simulations and the experimental results in this section, a 3 dB reduction is applied to all of the simulated sound insulation values to ensure consistency in the definition of the incident sound field.

4.1.1. Comparison with Existing Studies

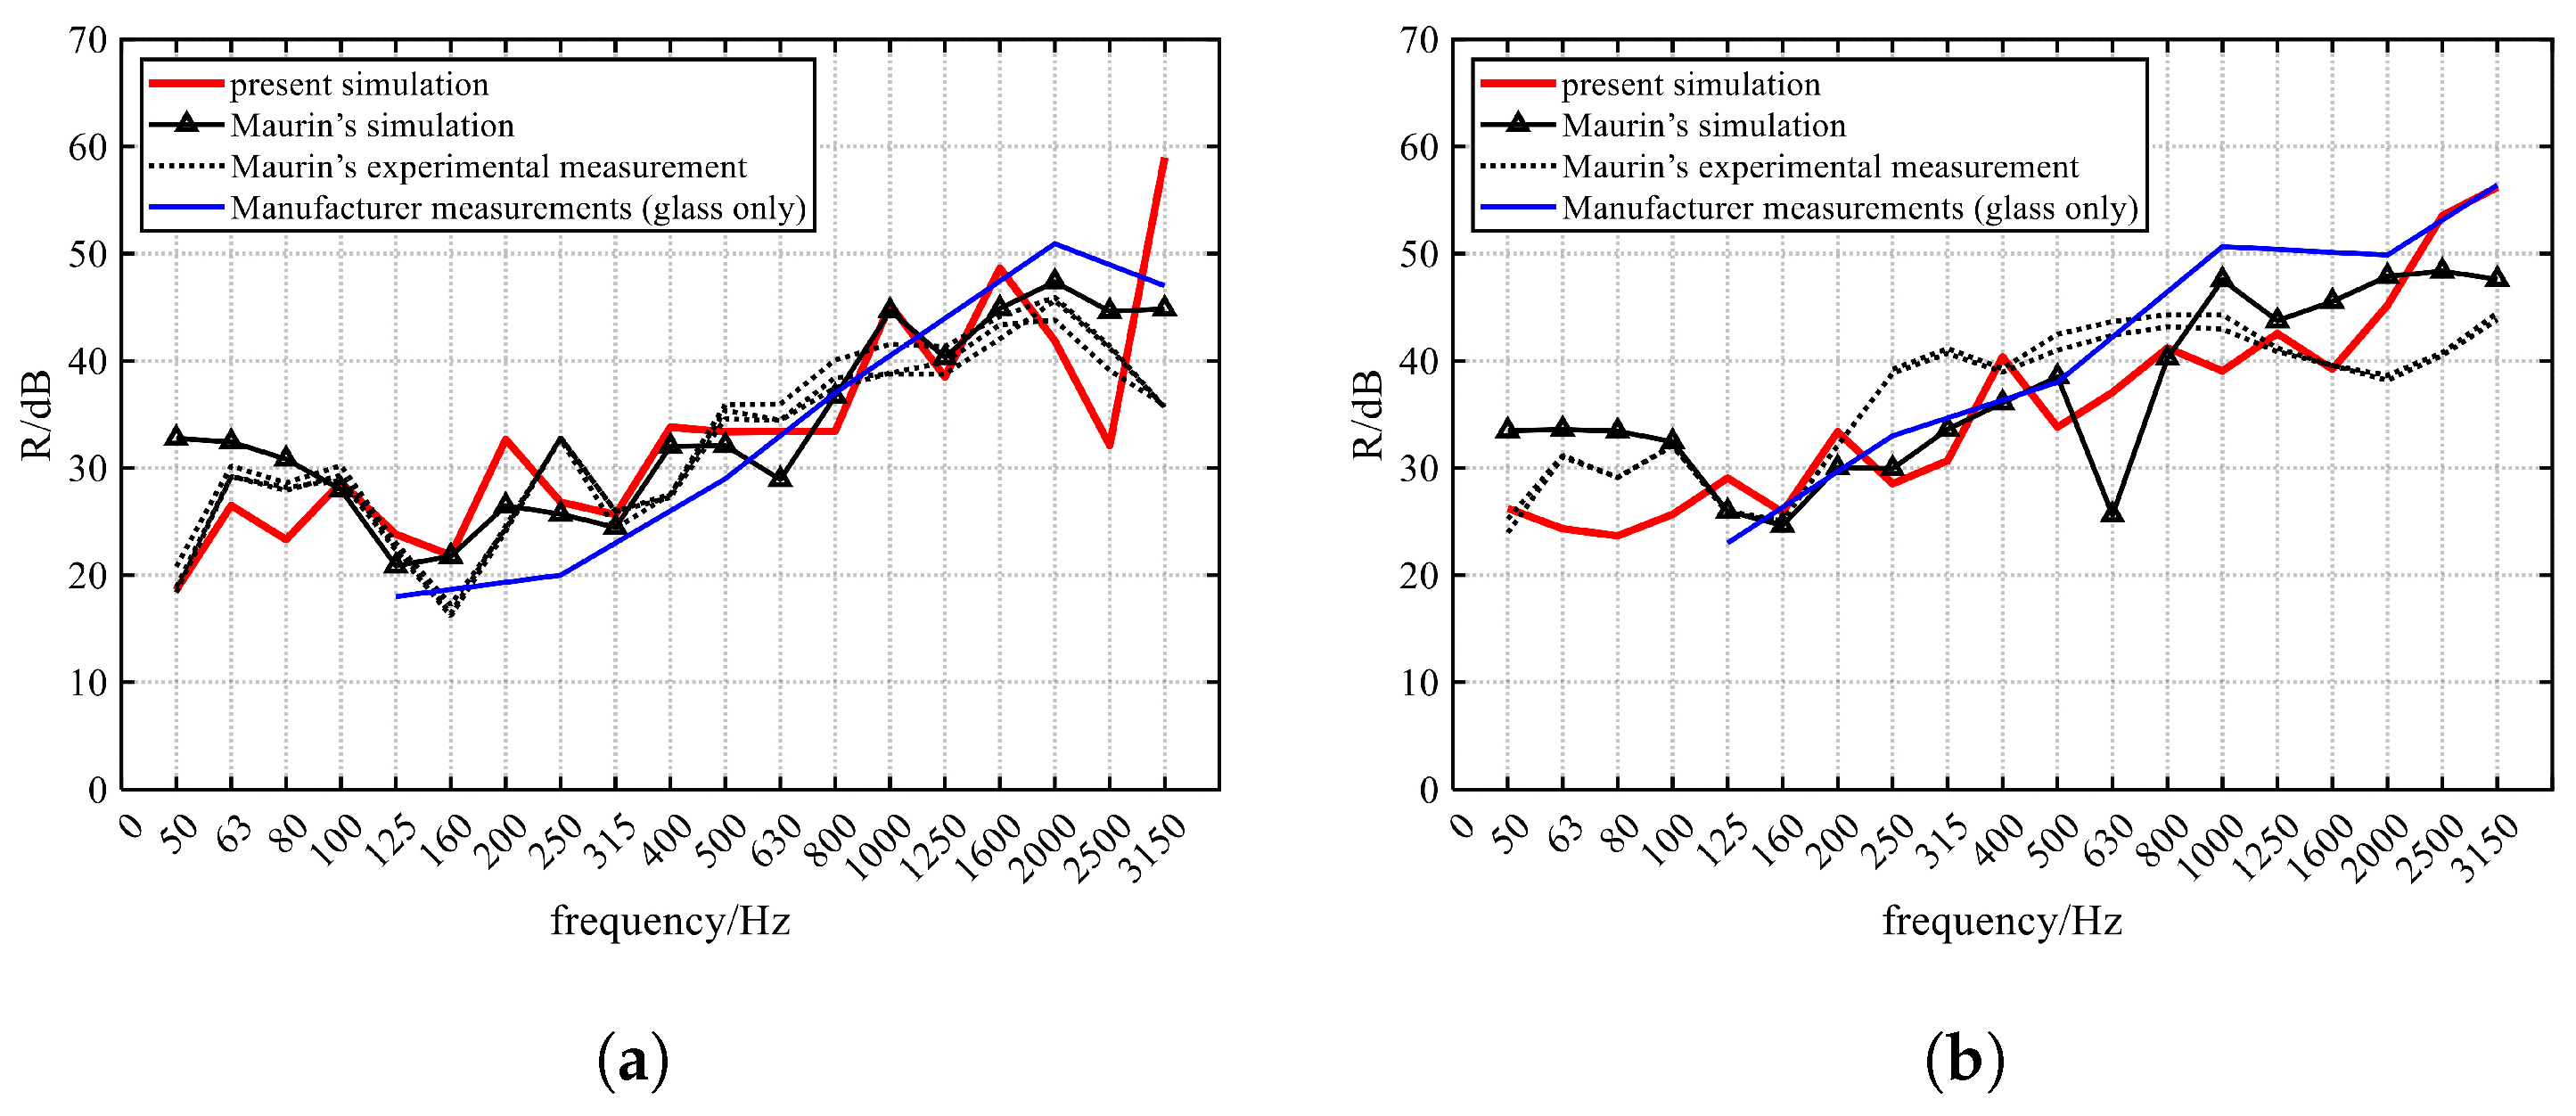
Experimental data from Maurin [36], focusing on 4-12A-4-12A-4 and 8-12A-4-12A-4 triple glazing, is used for comparison with the simulation results of this study. All results were evaluated using the Z-weighting method. The outcomes are presented in Figure 7a,b, which include two sets of experimental results from previous studies, one finite element simulation from the existing research, sound insulation data provided by the manufacturer, and the results from the finite element model with the window frames developed in this study. The five curves in the figures exhibit similar trends and align well overall, accurately reproducing the troughs observed in the experimental data for triple glazing. To obtain a single-value index for evaluating the sound insulation performance, the results are weighted in Table 3. The simulations in this study yielded values of 35 dB and 39 dB, which were very close to the experimentally derived weighted sound reduction indices of 36 dB and 41 dB, respectively. This demonstrates the effectiveness of the proposed model in predicting the acoustic performance of triple glazing.

4.1.2. Comparison with the Experimental Results in This Study

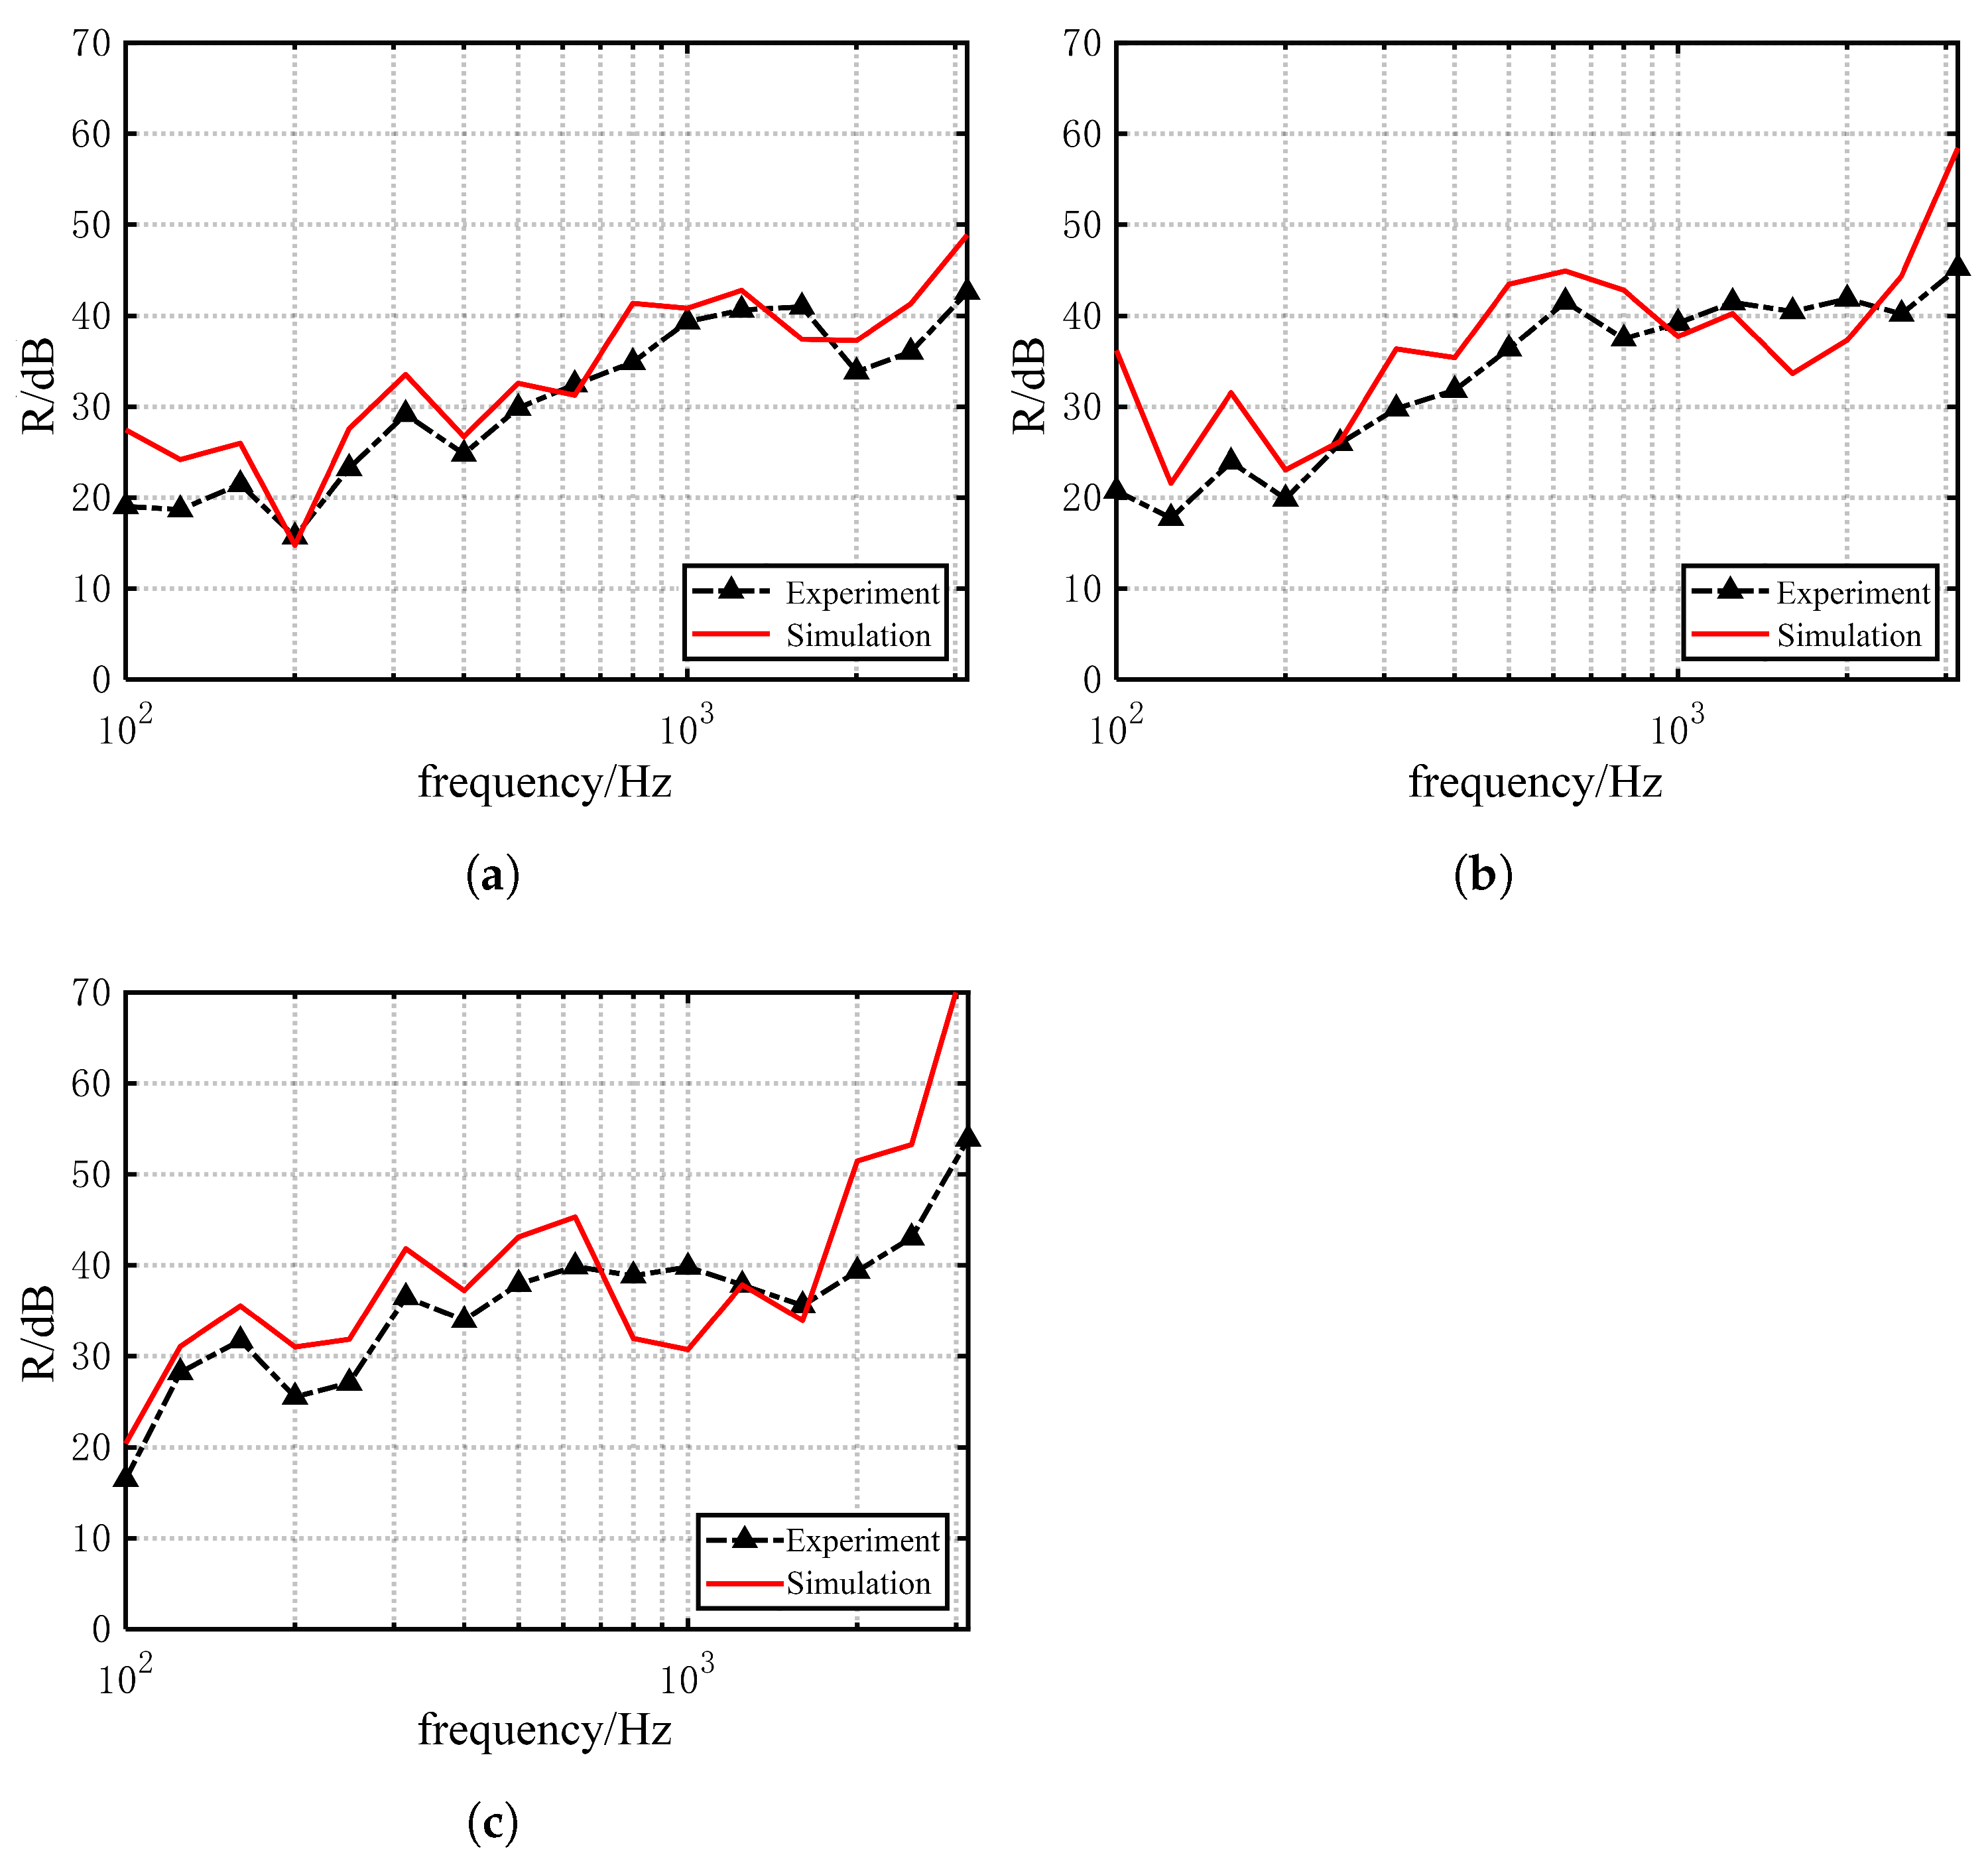
Laboratory measurements were carried out in Section 3.3 to evaluate the sound insulation performance of three asymmetric triple glazing combinations, each with a total thickness of 42 mm. These experimental results were used to validate the finite element model developed in this study. As shown in Figure 8, the simulated frequency-dependent sound insulation curves are directly compared with the measured results. All of the model parameters were set based on the physical properties of the materials and the experimental setup, without any parameter fitting. The results indicate that the simulated and measured frequency-dependent sound insulation curves exhibit consistent trends across all three window types. The model successfully predicts the sound insulation dips observed in the measurements. In terms of the single-value indicators, as shown in Table 4, the difference in the weighted sound reduction index R w is within 2 dB. For R w + C tr , the difference is within 3 dB.
Given the inherent uncertainty in sound insulation measurements of building elements [38] and according to ISO 12999-1:2020 [39], the standard deviation in the reproducibility for R w is σ R = 1.2 dB. With a coverage factor k = 2 , the expanded uncertainty is U = 2.4 dB (at a 95% confidence level). For R w + C tr , the standard deviation in the reproducibility is σ R = 1.5 dB, corresponding to an expanded uncertainty of U = 3 dB (at a 95% confidence level). The differences between the simulations and experimental results in this study fall within these uncertainty bounds, indicating the feasibility of using the proposed model for engineering predictions and performance evaluations.

4.2. The Sound Insulation of Triple Glazing

Considering diverse combinations of triple glazing, this study selects common glass and cavity thicknesses based on the Technical Specification for the Application of Architectural Glass. In consideration of the limited thickness of the window frame, a total glass and cavity thickness of 42 mm was chosen for this study. According to these requirements, the glass thicknesses were set to 4 mm, 5 mm, 6 mm, 8 mm, and 10 mm, while the cavity thicknesses were set to 6 mm, 9 mm, 12 mm, 15 mm, and 16 mm, resulting in a total of 28 combinations (Table 5).

4.2.1. The Influence of the Glass’s Thickness

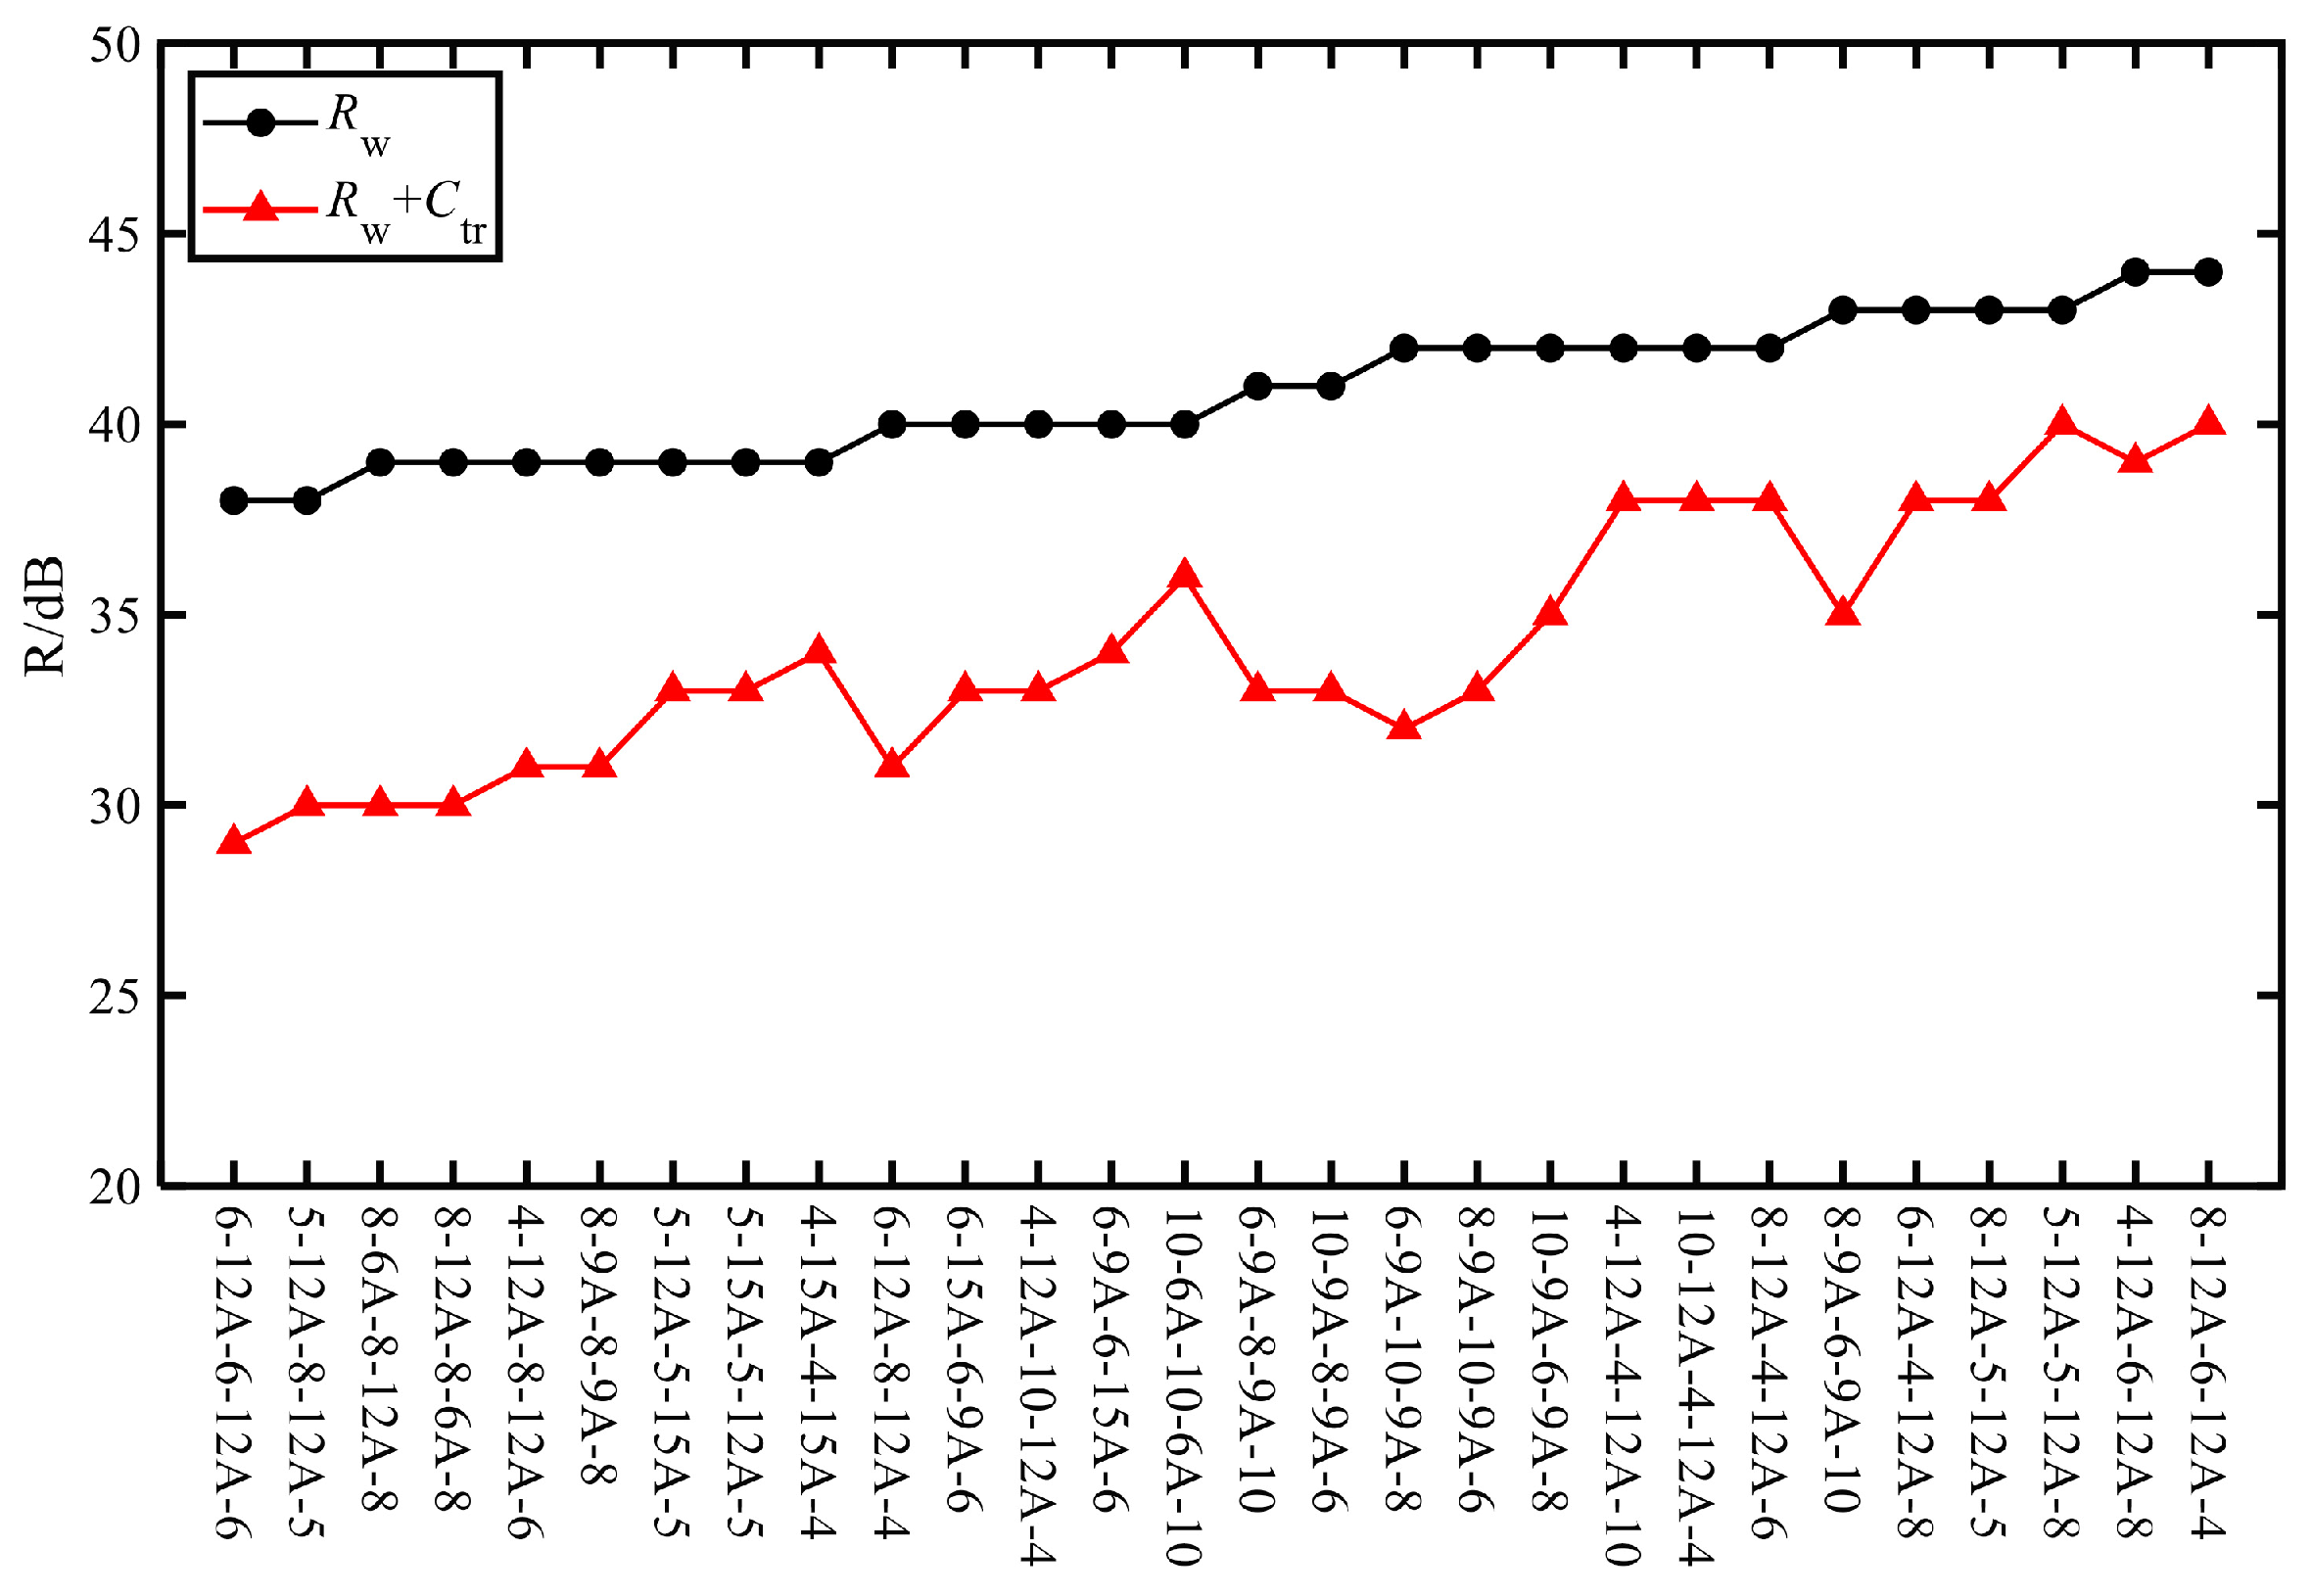
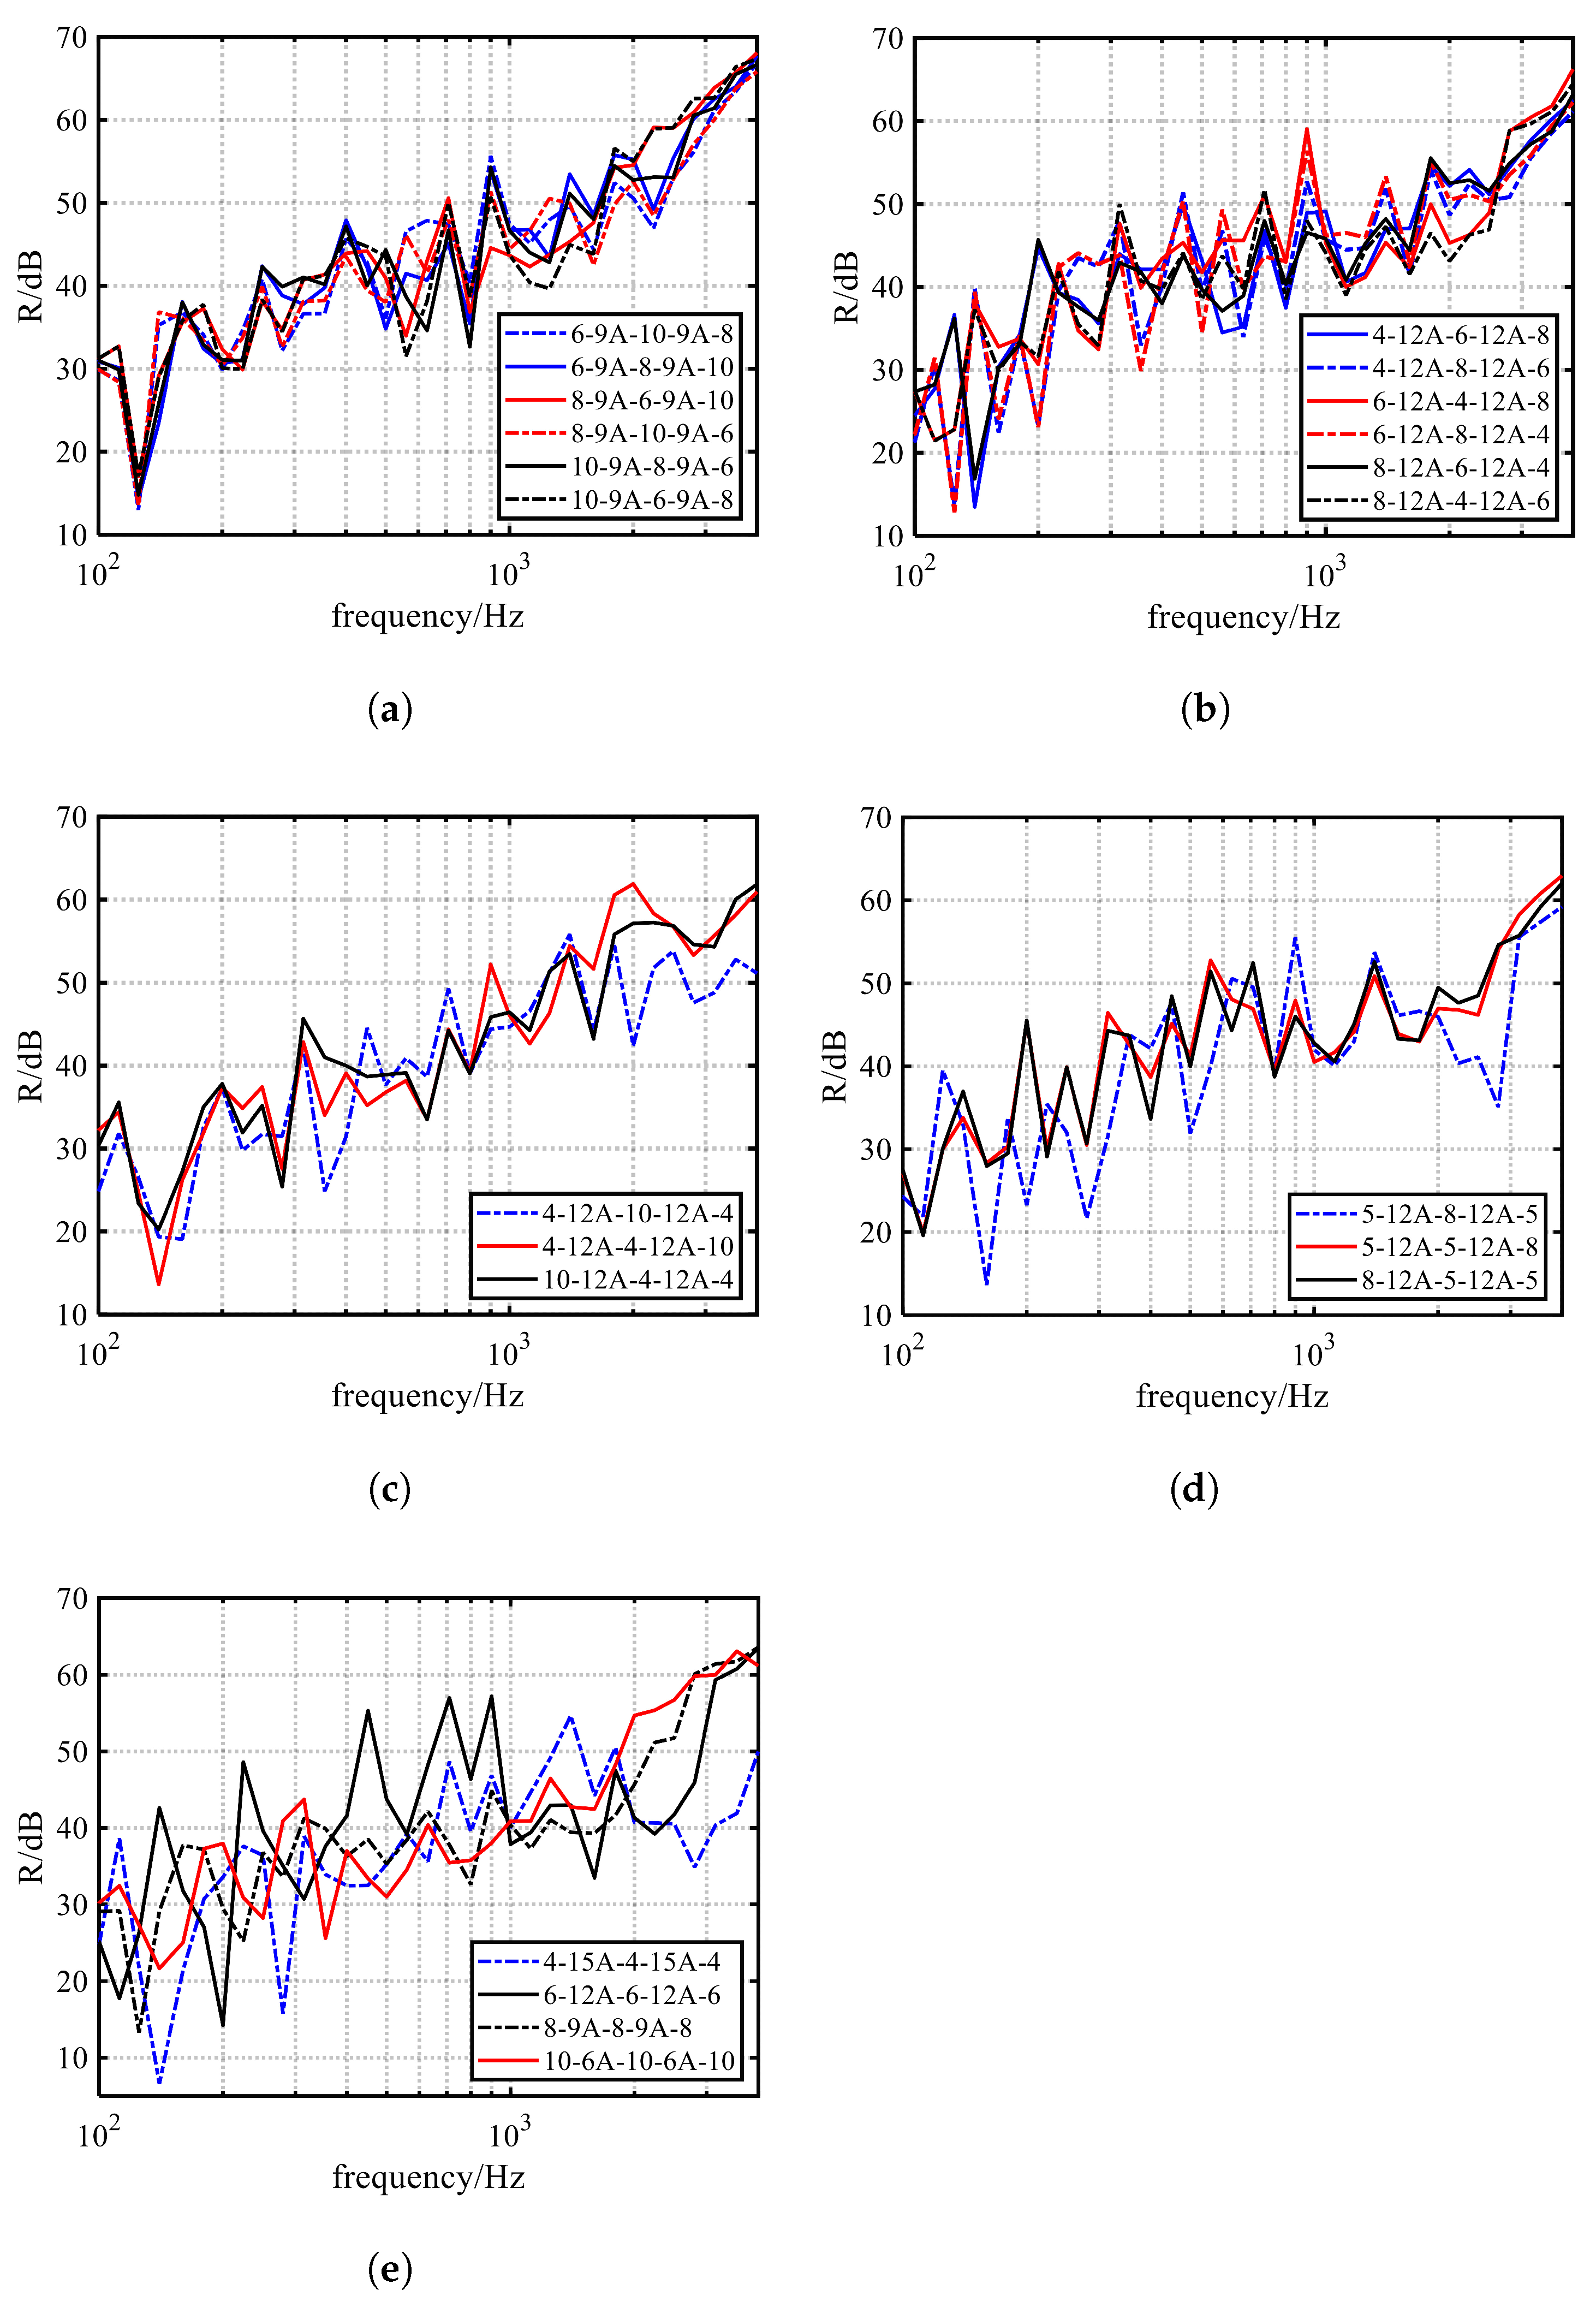
The 22 different combinations of triple glazing with a total thickness of 42 mm listed in Table 6 (combinations 1.1–1.22) have varying glass thicknesses and the same cavity thickness (where the total glass thickness for types 1.1–1.13 is 18 mm; for 1.14–1.20, it is 24 mmL; for 1.21, it is 30 mm; and for 1.22, it is 12 mm). Simulations were performed for each combination, and the results were calculated based on the receiving side, including low-frequency, mid-low frequency, and mid-high frequency averages, as well as the weighted sound reduction index R w and the traffic noise spectrum correction value C tr , as shown in Table 5. A line graph was created by arranging the results in ascending order of the weighted sound reduction index, as shown in Figure 9. To investigate the differences in the sound insulation performance among the 22 glass combinations, the glass samples were grouped into five categories based on their thickness, and the sound insulation frequency characteristics were compared, as shown in Figure 10.
The results show the following:
(1) When the thickness of each glass pane of triple glazing is different (Figure 10a–d), the best sound insulation performance is achieved when the thickest glass is placed on the outermost layer (both the source and receiving sides), while placing it in the middle layer results in the worst performance. The difference in R w between these two combinations is 6 dB, and R w + Ctr can differ by up to 11 dB. The placement of the medium-thick and thinnest glass has a minimal impact on the results. The combination with the best sound insulation performance is 8-12A-6-12A-4.
(2) When the thickness of the glass is the same (Figure 10e), as the glass’s thickness increases and the the cavity’s thickness decreases, the low-frequency and mid-/high-frequency sound insulation improves. The low-frequency difference is 4.5 dB, and the mid-/high-frequency difference is 7.3 dB. However, the overall difference in R w is small, with a maximum of 2 dB. R w + Ctr varies significantly, with a difference of up to 7 dB.
(3) For triple glazing using a 10 mm glass pane (Figure 10a,e), the sound insulation in the mid-/high-frequency range improves significantly, with an increase of over 12 dB, but the overall weighted sound reduction index is still lower than that of the 8-12A-6-12A-4 combination.
(4) A comparison of the sound insulation values of the 22 selected triple glazing configurations is shown in Figure 9. The 12 combinations with the lowest R w values are those where the thickest glass is placed in the middle layer or where the three layers of glass have the same thickness. These combinations should be avoided in practical applications.

4.2.2. The Influence of Cavity Thickness

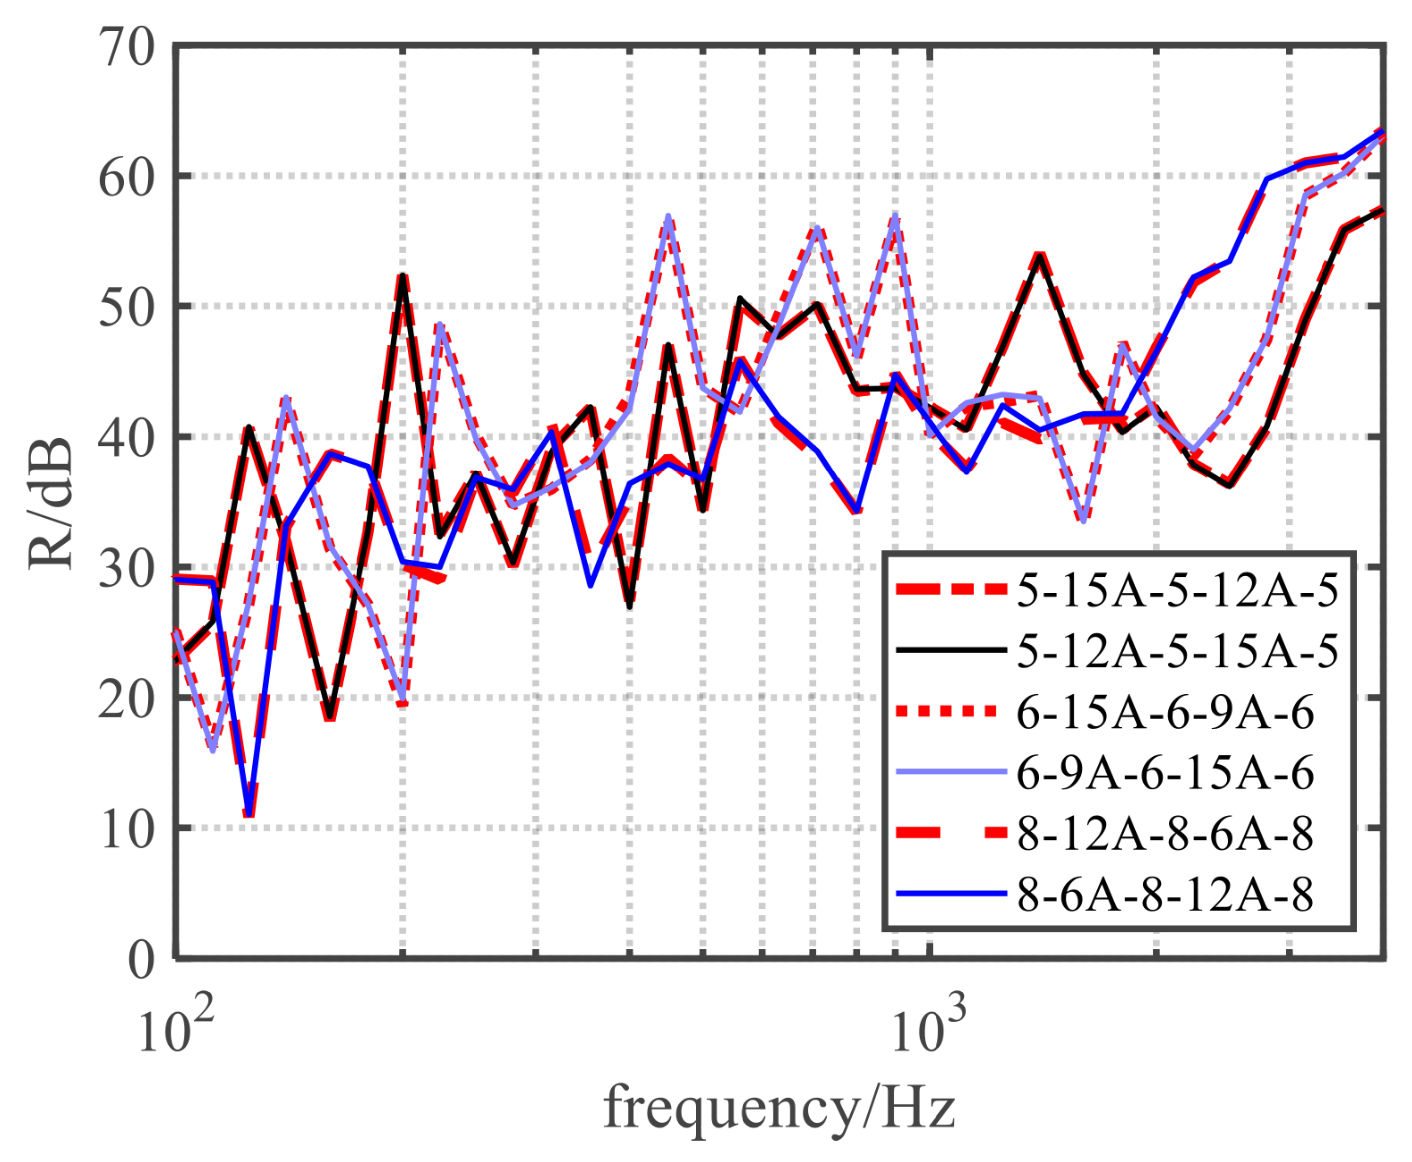
Due to the limitation on the cavity’s thickness, there are only six possible cavity thickness combinations (2.1–2.6 in Table 6). The simulation results were also used to calculate the average low-frequency, mid-/low-frequency, and mid-/high-frequency values, as well as R w and C tr , as shown in Table 7. The results show that the impact of variations in the cavity’s thickness on sound insulation is less significant than the effect of variations in the glass’s thickness. As shown in Figure 11, the sound insulation curves for the same cavity thickness combinations are almost identical, with no noticeable differences, and the positions of the peaks and troughs are consistent. The difference in R w between different cavity thickness combinations is only 1 dB, with all combinations outperforming the 6-12A-6-12A-6 combination. The cavity thickness combination of 12A–15A performs better for low-frequency sound insulation, while the combination of 9A–15A has the highest R w value. As shown in Figure 9, the sound insulation performance of combinations with varying cavity thicknesses ranks lower compared to that of those with different glass thicknesses due to the equal thickness of the glass. Therefore, changes in the cavity’s thickness alone cannot compensate for the loss in sound insulation caused by equal glass thicknesses.

4.2.3. Natural Frequency and Modal Analyses

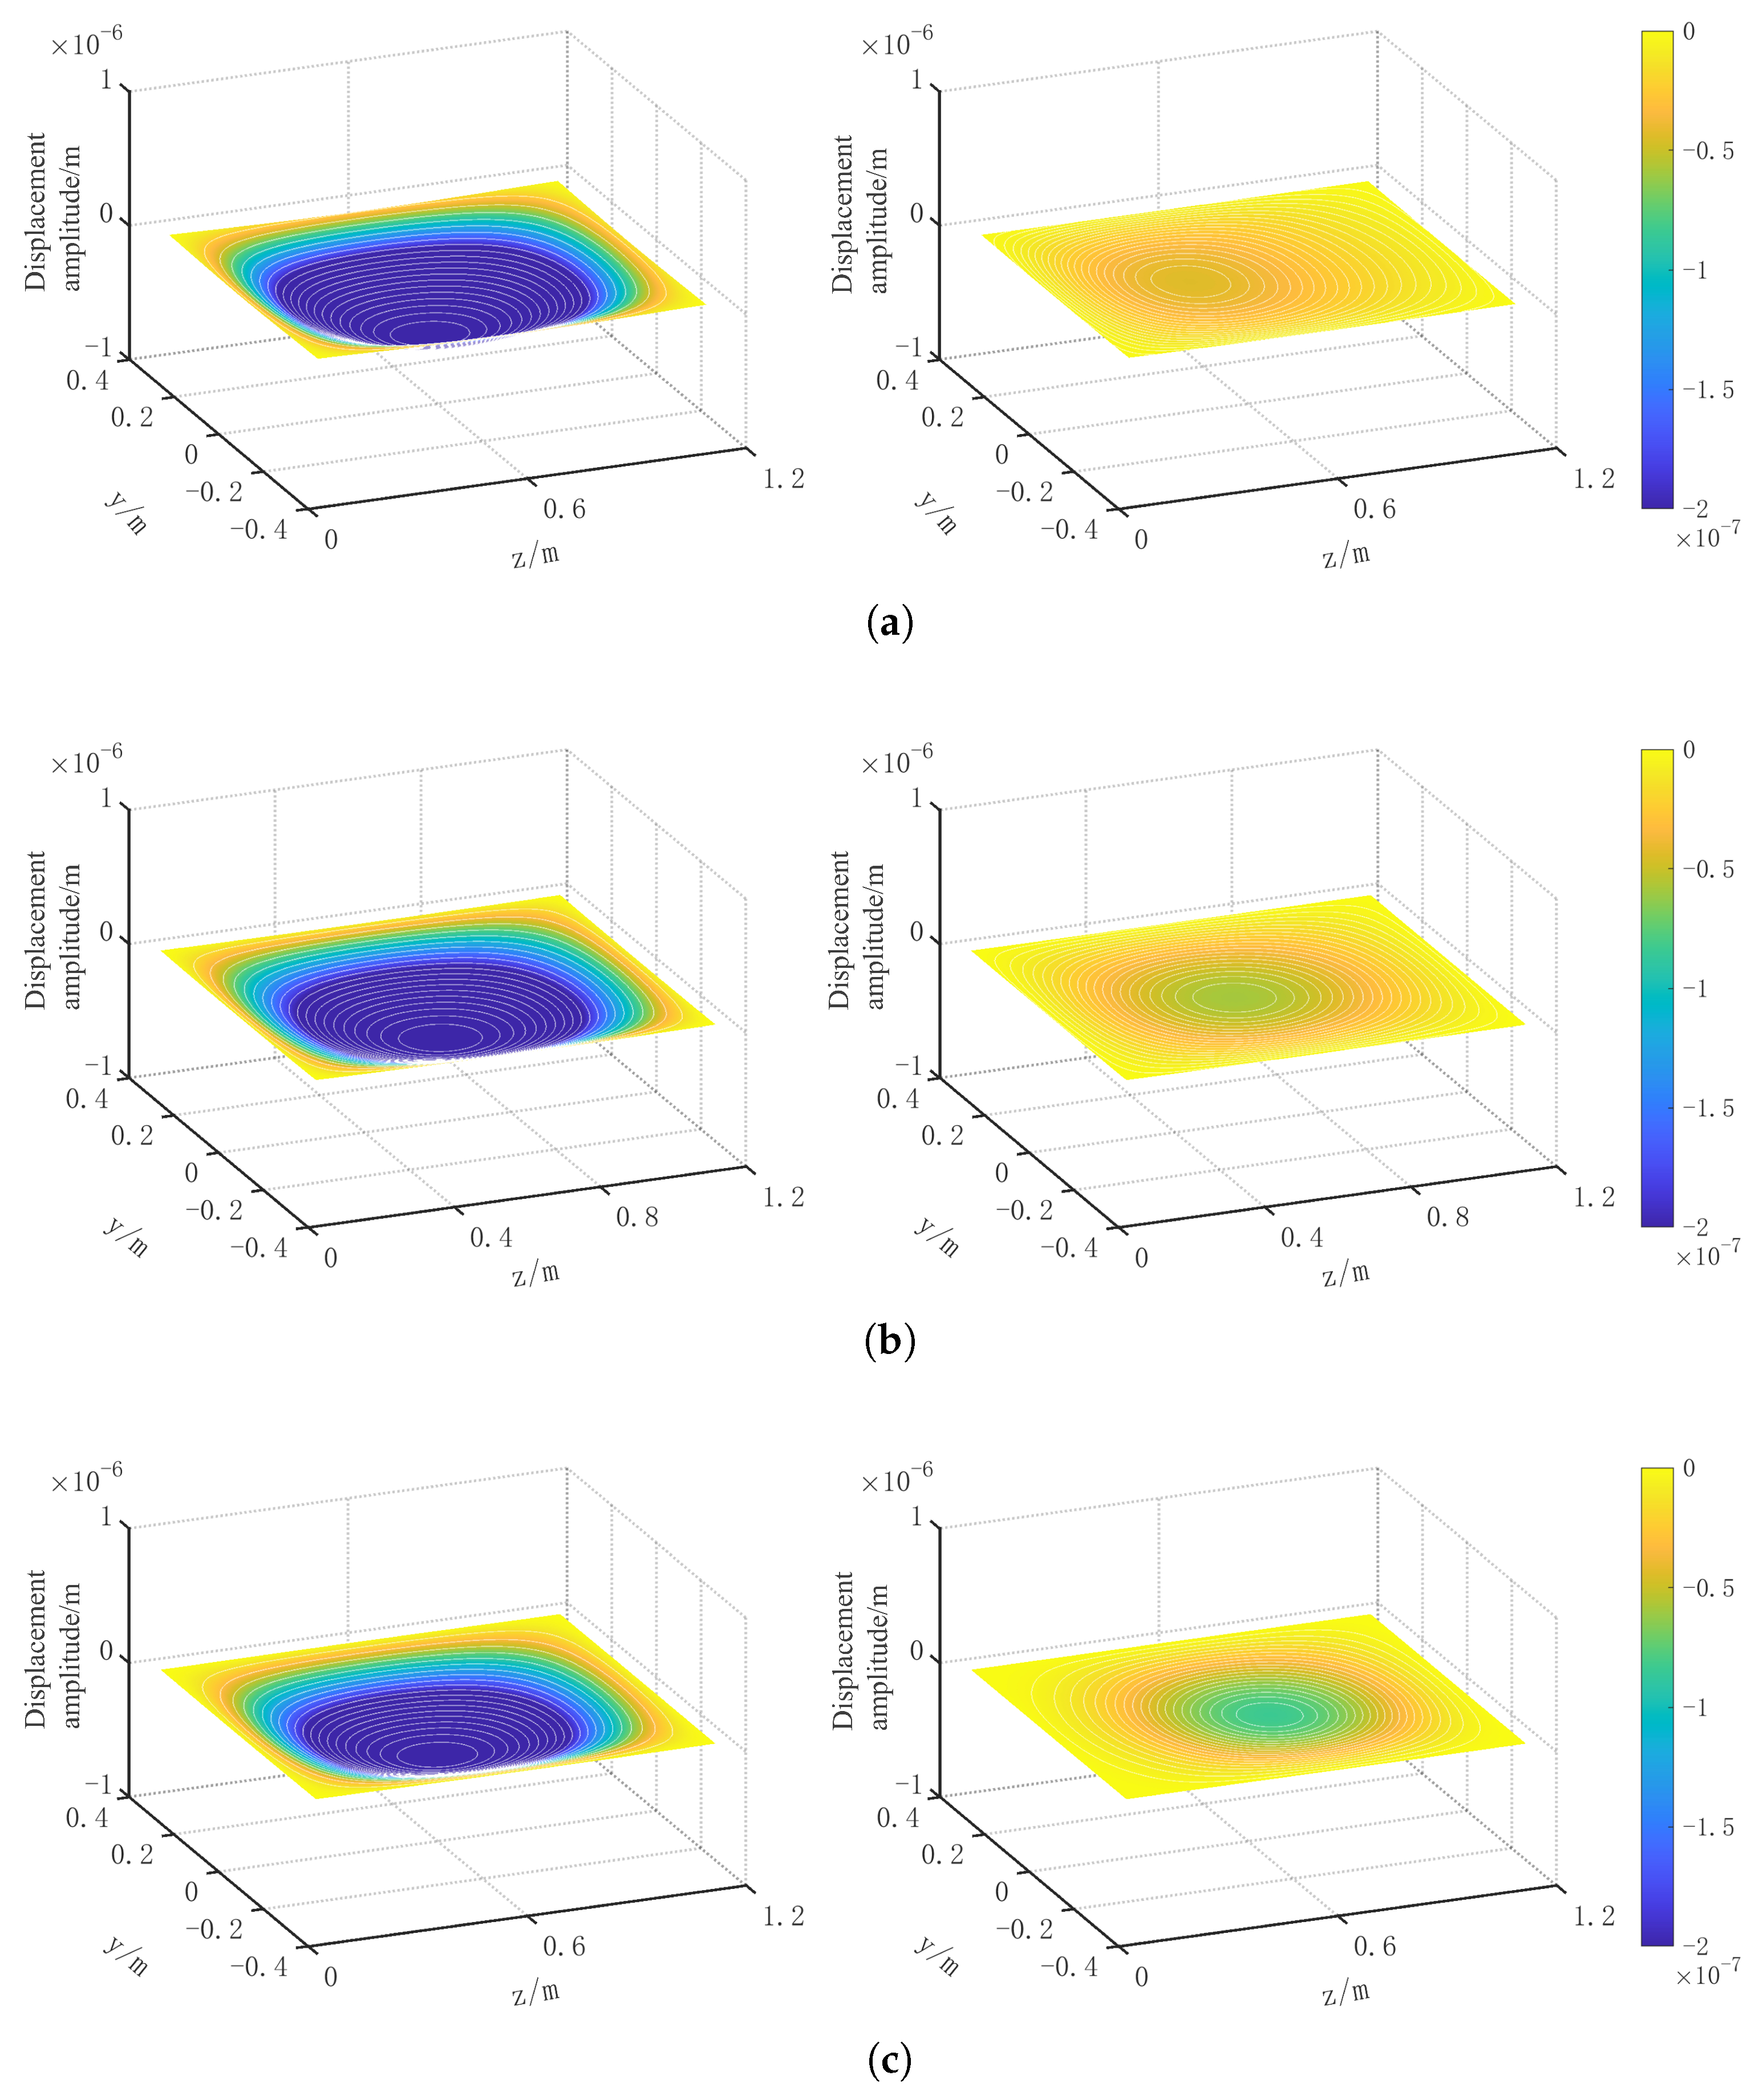
Natural frequency and modal analyses were performed for the two combinations with the greatest difference in sound insulation, namely 8-12A-6-12A-4 and 6-12A-6-12A-6. From the stress analysis (Figure 12), a significant stress concentration was observed on both the incident and radiation panels, while the stress distribution on the middle panel was relatively uniform. The stress on the incident panel in 8-12A-6-12A-4 was lower than that in the 6-12A-6-12A-6 combination; the stress on the middle panel showed little difference; and the stress on the radiation panel was higher than that for the 6-12A-6-12A-6 combination. This is because an increase in the thickness improves the stiffness of the structure, which reduces the stress on the glass panels, while a reduction in the thickness of the radiation panel decreases the stiffness, resulting in higher stress.
Although stress affects the vibration characteristics of the structure, it does not directly determine the sound insulation. Some of the vibration energy is also dissipated within the system, reducing the displacement amplitude. Of the displacement amplitudes (Figure 13), the amplitude of the 6-12A-6-12A-6 system is significantly higher than that of the 8-12A-6-12A-4 system, with more pronounced vibrations at this frequency. This leads to sound insulation dips, which in turn degrade the sound insulation performance.

5. Conclusions

This study establishes a finite element model to simulate and analyze the sound insulation performance of 28 different combinations of triple glazing. Combined with laboratory measurements, the key conclusions are as follows:
Through experimental investigation, it is found that compared to the conventional symmetric combination (6-12A-6-12A-6), the two asymmetric triple-glazed windows (8-12A-5-12A-5 and 8-9A-6-9A-10) exhibit a superior overall sound insulation performance. The weighted sound reduction index ( R w ) increases by about 4–5 dB, and the combined value of R w and the traffic noise spectrum correction ( R w + C tr ) improves by 3–5 dB, especially at low and high frequencies.
The best sound insulation performance with triple glazing is achieved when the thickest glass is placed on the outermost layers (on the source and receiving sides), while the worst performance occurs when the thickest glass is placed in the middle layer. The value of R w increases by 6 dB, and R w + C tr increases by 11 dB. The positioning of the next thickest and thinnest glass has less of an influence on the results. Additionally, using 10 mm thick glass significantly improves the sound insulation in the mid- to high-frequency range, with a greater than 12 dB increase in the average value, but there is no significant advantage for R w . The combination of 8-12A-6-12A-4 performs the best, with an R w value of 44 dB.
When the thicknesses of the glass used in triple glazing are equal, increasing the glass’s thickness and reducing the cavity’s thickness enhance the sound insulation at both low and mid- to high frequencies. The low-frequency sound insulation increases by 4.5 dB, and the mid- to high-frequency sound insulation increases by 7.3 dB. However, R w does not vary significantly, with a maximum difference of 2 dB. R w + C tr increases by as much as 7 dB.
Changes in the air cavity’s thickness have less of an impact on sound insulation than the glass’s thickness. The difference in R w is only 1 dB. Combination with air cavity thicknesses of 12A–15A shows a better low-frequency sound insulation performance.
From the perspective of natural frequency and modal analyses, although changing the thickness combinations of the triple glazing’s three glass layers alters the stress distribution, leading to stress concentration, adjusting the thickness of the three layers reduces the displacement amplitude by dissipating some of the energy, thereby improving the sound insulation performance. Therefore, reasonably configuring the glass thickness in triple glazing can enhance the sound insulation performance, achieving better results compared to double-glazing using the same thickness.
Since this research focuses on the acoustic performance of triple glazing configurations under fixed thickness constraints, the results are not yet comprehensive or widely generalizable. The range of structural combinations is limited, and other performance aspects such as thermal insulation, structural safety, and costs were not considered. In addition, the simulations assume ideal boundary and sealing conditions, which may differ from those in real installations. Future work will explore more diverse glazing types, frame materials, and connection methods to enhance its relevance to engineering.
Author Contributions

Conceptualization: H.Z. Methodology: H.Z. and Y.W. Investigation: Y.W. Data curation: Y.W. Writing—original draft preparation: Y.W. Writing—review and editing: H.Z., Y.W. and X.J. Supervision: H.Z. and X.J. All authors have read and agreed to the published version of the manuscript.

Funding

This research was funded by the National Natural Science Foundation of China (Grant No. 52078451).

Data Availability Statement

The data presented in this study are available on request from the corresponding author.

Conflicts of Interest

The authors declare no conflicts of interest.

References

  1. Ministry of Ecology and Environment of the People’s Republic of China. Annual Report on Prevention and Control of Noise Pollution in China; Ministry of Ecology and Environment: Beijing, China, 2024; pp. 1–68. [Google Scholar]
  2. Harrou, F.; Zeroual, A.; Hittawe, M.M.; Sun, Y. Chapter 2-Road traffic modeling. In Road Traffic Modeling and Management; Elsevier: Amsterdam, The Netherlands, 2022; pp. 15–63. [Google Scholar]
  3. Ningbo Housing and Urban-Rural Development Bureau. Opinions on Improving the Noise and Vibration Reduction Design Standards for Sensitive Buildings Along Both Sides of Urban and Rural Traffic Main Lines: Yongjiefa [2021] No.99; Ningbo Housing and Urban-Rural Development Bureau: Ningbo, China, 2021. [Google Scholar]
  4. Huzhou Housing and Urban-Rural Development Bureau. Notice on Issuing the “Huzhou City Design Regulations for Improving the Quality of Residential Buildings”; Huzhou Housing and Urban-Rural Development Bureau: Huzhou, China, 2022. [Google Scholar]
  5. Jiaxing Housing and Urban-Rural Development Bureau. Notice on the Implementation of the "Jiaxing City Design Regulations for Improving the Quality of Residential Buildings" (Trial); Jiaxing Housing and Urban-Rural Development Bureau: Jiaxing, China, 2023. [Google Scholar]
  6. Naify, C.J.; Huang, C.; Sneddon, M.; Nutt, S. Transmission loss of honeycomb sandwich structures with attached gas layers. Appl. Acoust. 2011, 72, 71–77. [Google Scholar] [CrossRef]
  7. Secchi, S.; Astolfi, A.; Calosso, G.; Casini, D.; Cellai, G.; Scamoni, F.; Scrosati, C.; Shtrepi, L. Effect of outdoor noise and façade sound insulation on indoor acoustic environment of Italian schools. Appl. Acoust. 2017, 126, 120–130. [Google Scholar] [CrossRef]
  8. Liu, Y. Sound transmission through triple-panel structures lined with poroelastic materials. J. Sound Vib. 2015, 339, 376–395. [Google Scholar] [CrossRef]
  9. Shimizu, T.; Toyoda, M.; Takahashi, D.; Kawai, Y. Numerical analysis of the influence of acoustic resonance in air cavities between windowpanes on sound transmission loss. Appl. Acoust. 2013, 74, 1010–1017. [Google Scholar] [CrossRef]
  10. Long, M. 9-Sound Transmission Loss. In Architectural Acoustics, 2nd ed.; Long, M., Ed.; Academic Press: Boston, MA, USA, 2014; pp. 345–382. [Google Scholar]
  11. Bliūdžius, R.; Miškinis, K.; Buhagiar, V.; Banionis, K. Sound Insulation of Façade Element with Triple IGU. Buildings 2022, 12, 1239. [Google Scholar] [CrossRef]
  12. Garg, N.; Sharma, O.; Maji, S. Design considerations for enhancing sound insulation characteristics of window glazing for traffic noise abatement. Build. Acoust. 2012, 19, 89–97. [Google Scholar] [CrossRef]
  13. Pietrzko, S.; Mao, Q. Vibration identification and sound insulation of triple glazing. Noise Control. Eng. J. 2013, 61, 345–354. [Google Scholar] [CrossRef]
  14. Miškinis, K.; Dikavičius, V.; Bliūdžius, R.; Banionis, K. Comparison of sound insulation of windows with double glass units. Appl. Acoust. 2015, 92, 42–46. [Google Scholar] [CrossRef]
  15. Yairi, M.; Koga, T.; Takebayashi, K.; Sakagami, K. Transmission of a spherical sound wave through a single-leaf wall: Mass law for spherical wave incidence. Appl. Acoust. 2014, 75, 67–71. [Google Scholar] [CrossRef]
  16. Xin, F.X.; Lu, T.J.; Chen, C.Q. Dynamic response and acoustic radiation of double-leaf metallic panel partition under sound excitation. Comput. Mater. Sci. 2009, 46, 728–732. [Google Scholar] [CrossRef]
  17. Chen, W.S.; Qiu, X.J. Study on sound insulation characteristics of multi-layer panels. J. Nanjing Univ. (Nat. Sci.) 2005, 41, 91–97. [Google Scholar]
  18. Xin, F.X.; Lu, T.J. Analytical modeling of sound transmission through clamped triple-panel partition separated by enclosed air cavities. Eur. J.-Mech.-A/Solids 2011, 30, 770–782. [Google Scholar] [CrossRef]
  19. Li, J.-Y.; Wu, X.-W.; Wang, C.-L.; Huang, Q.-B. Sound insulation prediction and band gap characteristics of four vibrators acoustic metamaterial with composite phononic crystal structure. Mater. Today Commun. 2023, 37, 107455. [Google Scholar] [CrossRef]
  20. Caballol, D.; Raposo, Á.P. Analysis of the measurement of transmission loss in rigid building materials with a standing wave tube. Constr. Build. Mater. 2018, 182, 242–248. [Google Scholar] [CrossRef]
  21. Tadeu, A.; António, J.; Mateus, D. Sound insulation provided by single and double panel walls—A comparison of analytical solutions versus experimental results. Appl. Acoust. 2004, 65, 15–29. [Google Scholar] [CrossRef]
  22. Gai, X.L.; Xing, T.; Kang, Z.X.; Li, X.H.; Zhang, B.; Cai, Z.N.; Wang, F.; Guan, X.W. Study on sound insulation performance of the periodic arrangement expansion chambers structure with built-in micro-perforated panel. Appl. Acoust. 2020, 161, 107187. [Google Scholar] [CrossRef]
  23. Zhu, Z.Y.; Wang, G.; Sheng, Z.H.; Zhang, Y.F.; Xu, R.K. Sound insulation properties of embedded co-cured composite damping sandwich panel under arbitrary boundary conditions. Mech. Syst. Signal Process. 2023, 204, 110810. [Google Scholar] [CrossRef]
  24. Weiqing, S.; Zongxi, Q.; Heng, Z. Analysis of Sound Insulation in Multilayer Composites with Finite Element Method. J. Zhengzhou Univ. (Nat. Sci. Ed.) 2002, 34, 51–54. [Google Scholar]
  25. Ackermann, L.; Antes, H. Sound insulation analysis of solid walls using the finite element method. J. Acoust. Soc. Am. 2001, 109, 2352. [Google Scholar] [CrossRef]
  26. Fusaro, G.; Yu, X.; Kang, J.; Cui, F. Development of metacage for noise control and natural ventilation in a window system. Appl. Acoust. 2020, 170, 107510. [Google Scholar] [CrossRef]
  27. Yu, X.; Lau, S.K.; Cheng, L.; Cui, F. A numerical investigation on the sound insulation of ventilation windows. Appl. Acoust. 2017, 117, 113–121. [Google Scholar] [CrossRef]
  28. Arjunan, A.; Wang, C.J.; Yahiaoui, K.; Mynors, D.J.; Morgan, T.; Nguyen, V.B.; English, M. Sound frequency dependent mesh modelling to simulate the acoustic insulation of stud based double-leaf walls. In Proceedings of the 2014 Leuven Conference on Noise and Vibration Engineering (ISMA2014), Leuven, Belgium, 15–17 September 2014; pp. 4139–4149. [Google Scholar]
  29. Santoni, A.; Bonfiglio, P.; Davy, J.L.; Fausti, P.; Pompoli, F.; Pagnoncelli, L. Sound transmission loss of ETICS cladding systems considering the structure-borne transmission via the mechanical fixings: Numerical prediction model and experimental evaluation. Appl. Acoust. 2017, 122, 88–97. [Google Scholar] [CrossRef]
  30. Bonfiglio, P.; Pompoli, F.; Lionti, R. A reduced-order integral formulation to account for the finite size effect of isotropic square panels using the transfer matrix method. J. Acoust. Soc. Am. 2016, 139, 1773–1783. [Google Scholar] [CrossRef]
  31. Díaz-Cereceda, C.; Poblet-Puig, J.; Rodríguez-Ferran, A. The finite layer method for modelling the sound transmission through double walls. J. Sound Vib. 2012, 331, 4884–4900. [Google Scholar] [CrossRef]
  32. Hu, Z.; Maxit, L.; Cheng, L. Acoustic design and analyses of a double Skin Façade system. Appl. Acoust. 2021, 173, 107727. [Google Scholar] [CrossRef]
  33. Zhu, X.; Wang, L.; Wang, X.; Jiang, J. Simulation Study on the Sound Insulation Performance of Double-Layer Hollow Glass. Noise Vib. Control 2022, 42, 256. [Google Scholar]
  34. Mimura, M.; Okuzono, T.; Sakagami, K. Finite element modeling for predicting sound insulation of fixed windows in a laboratory environment. Front. Built Environ. 2022, 8, 971459. [Google Scholar] [CrossRef]
  35. Arjunan, A.; Wang, C.J.; Yahiaoui, K.; Mynors, D.J.; Morgan, T.; Nguyen, V.B.; English, M. Development of a 3D finite element acoustic model to predict the sound reduction index of stud based double-leaf walls. J. Sound Vib. 2014, 333, 6140–6155. [Google Scholar] [CrossRef]
  36. Maurin, A.; Kwapisz, L. Simplified method for calculating airborne sound transmission through composite barriers. Compos. Struct. 2021, 276, 114526. [Google Scholar] [CrossRef]
  37. JGJ113-2015; Ministry of Housing and Urban-Rural Development of the People’s Republic of China. Chinese Technical Code for the Application of Architectural Glass: Beijing, China, 2021.
  38. Cai, Y.S.; Zhao, Y.Z. Measurement uncertainty of building sound insulation and its application in classification evaluation. Noise Vib. Control 2018, 38, 233–238.ISO. [Google Scholar]
  39. ISO 12999-1:2020; Acoustics–Determination and Application of Measurement Uncertainties in Building Acoustics—Part 1: Sound Insulation. International Organization for Standardization (ISO): Geneva, Switzerland, 2020.
Figure 1. Schematic diagram of the model in the XZ plane and 3D view.
Buildings 15 01766 g001
Figure 2. The layout of the laboratory and arrangement of the sound source measurement points.
Buildings 15 01766 g002
Figure 3. Layout of the laboratory and arrangement of sound source measurement points.
Buildings 15 01766 g003
Figure 4. A schematic diagram of the three experimental windows. (A) Symmetric configuration (6-12A-6-12A-6); (B) Asymmetric configuration (8-12A-5-12A-5); (C) Asymmetric configuration (8-9A-6-9A-10).
Buildings 15 01766 g004
Figure 5. The insulation curves of the three experimental windows.
Buildings 15 01766 g005
Figure 6. The improvement in the sound reduction index with asymmetric triple glazing.
Buildings 15 01766 g006
Figure 7. Insulation curves of simulated and measured triple glazing. (a) 4-12A-4-12A-4; (b) 8-12A-4-12A-4.
Buildings 15 01766 g007
Figure 8. A comparison between simulations and experimental results for triple glazing. (a) 6-12A-6-12A-6; (b) 8-12A-5-12A-5; (c) 8-9A-6-9A-10.
Buildings 15 01766 g008
Figure 9. Weighted sound reduction index and traffic noise spectrum correction of 28 types of triple glazing.
Buildings 15 01766 g009
Figure 10. Insulation curves of glass thickness combinations of (a) 6 mm–8 mm–10 mm, (b) 4 mm–6 mm–8 mm, (c) 4 mm–4 mm–10 mm, (d) 5 mm–5 mm–8 mm, and (e) equal thicknesses.
Buildings 15 01766 g010
Figure 11. Insulation curves of different air cavity combinations.
Buildings 15 01766 g011
Figure 12. The stress distribution at the first-order resonant frequency on the incident plate (a), middle plate (b), and transmission plate (c). (Left: 6-12A-6-12A-6; right: 8-12A-6-12A-4).
Buildings 15 01766 g012
Figure 13. Displacement amplitudes at the first-order resonant frequency of the incident plate (a), middle plate (b), and transmission plate (c). (Left: 6-12A-6-12A-6, right: 8-12A-6-12A-4).
Buildings 15 01766 g013
Table 1. Material parameters.
MaterialParametersAirPVCGlassSealant
Sound velocityc342.2 m/s   
Densities ρ 1.2 kg/m31200 kg/m32500 kg/m31200 kg/m3
Young’s modulusE75 Pa4 GPa72 GPa0.1 GPa
Poisson’s ratio μ 0.30.30.30.45
Isotropic loss factor η  0.150.0020.4
Table 2. The sound insulation values by frequency band for the three experimental windows (unit: dB).
Type100 Hz–315 Hz315 Hz–1000 Hz1000 Hz–3150 HzAverage R w R w + C tr
6-12A-6-12A-621.2132.2638.8130.173328
8-12A-5-12A-523.0137.2741.8533.363731
8-9A-6-9A-1027.5938.0941.9535.363833
Table 3. Comparison of simulated and measured weighted sound reduction indices for triple glazing.
Type4-12A-4-12A-48-12A-4-12A-4
Rw/dBCtr/dBRw/dBCtr/dB
Present simulation35−239−3
Maurin’s simulation34−340−6
Maurin’s experiment36−541−3
Table 4. Comparison of weighted sound reduction indexes between simulated and experimental results for triple glazing.
Type6-12A-6-12A-68-12A-5-12A-58-9A-6-9A-10
Rw/dBCtr/dBRw/dBCtr/dBRw/dBCtr/dB
simulation35−638−438−4
experiment33−537−638−5
Table 5. Twenty-eight combinations of triple glazing with a total thickness of 42 mm (1.1–1.22: different glass thicknesses with the same air cavity thickness; 2.1–2.6: the same glass thickness with different air cavity thicknesses). Unit: mm.
No.GlassAirGlassAirGlassTotalNo.GlassAirGlassAirGlassTotalNo.GlassAirGlassAirGlassTotal
1.1412A612A8421.1469A89A10421.21106A106A1042
1.2412A812A6421.1569A109A8421.22415A415A442
1.3412A412A10421.1689A89A842       
1.4412A1012A4421.1789A109A642       
1.5512A512A8421.1889A69A1042       
1.6512A812A5421.19109A69A842       
1.7612A612A6421.20109A89A642       
1.8612A812A442              
1.9612A412A842              
1.10812A512A542              
1.11812A612A442              
1.12812A412A642              
1.131012A412A442              
2.1812A86A8422.3615A69A6422.5515A512A542
2.286A812A8422.469A615A6422.6512A515A542
Table 6. The sound insulation performance of 28 types of triple glazing. Unit: dB.
Type100 Hz–315 Hz315 Hz–1000 Hz1000 Hz–3150 HzAverage R w C tr Type100 Hz–315 Hz315 Hz–1000 Hz1000 Hz–3150 HzAverage R w C tr
4-12A-6-12A-833.542.950.041.944−56-9A-8-9A-1031.842.853.042.241−8
4-12A-8-12A-632.642.949.541.339−86-9A-10-9A-832.044.750.742.142−10
4-12A-4-12A-1031.239.954.241.442−48-9A-8-9A-831.138.646.938.639−8
4-12A-10-12A-429.739.549.739.340−78-9A-10-9A-632.142.951.041.742−9
5-12A-5-12A-832.944.347.641.343−38-9A-6-9A-1032.642.353.142.343−8
5-12A-8-12A-528.244.244.838.738−810-9A-6-9A-832.542.852.442.242−7
6-12A-6-12A-630.846.443.439.938−910-9A-8-9A-632.542.552.142.141−8
6-12A-8-12A-432.843.550.541.940−910-6A-10-6A-1032.335.250.739.240−4
6-12A-4-12A-833.146.047.942.043−54-15A-4-15A-427.838.444.036.539−5
8-12A-5-12A-532.844.148.141.443−5       
8-12A-6-12A-433.942.050.341.844−4       
8-12A-4-12A-633.142.947.340.942−4       
10-12A-4-12A-433.042.155.543.242−4       
5-12A-5-15A-533.042.943.239.539−68-6A-8-12A-832.038.647.739.239−9
5-15A-5-12A-533.042.943.339.539−68-12A-8-6A-831.938.447.439.039−9
6-15A-6-9A-631.747.243.740.640−76-9A-6-15A-631.747.043.840.640−6
Table 7. First ten orders of natural frequency for 6-12A-6-12A-6 and 8-12A-6-12A-4 systems.
6-12A-6-12A-68-12A-6-12A-4
OrderFrequency/HzOrderFrequency/Hz
1th48.391th48.50
2nd69.222nd52.95
3rd69.263rd79.78
4th85.614th82.22
5th107.405th85.68
6th107.466th125.56
7th142.337th130.63
8th148.258th131.94
9th172.509th142.38
10th172.6010th148.30
Disclaimer/Publisher’s Note: The statements, opinions and data contained in all publications are solely those of the individual author(s) and contributor(s) and not of MDPI and/or the editor(s). MDPI and/or the editor(s) disclaim responsibility for any injury to people or property resulting from any ideas, methods, instructions or products referred to in the content.