1. Introduction
To assist in the smooth implementation of the “Belt and Road” strategic objectives, a large number of tunnels will be constructed in the southwestern mountainous areas with karst landforms. These regions are characterized by multiple faults, sinkholes, and karst ducts, resulting in a high risk of water inrush disasters. Over the past two decades, China has experienced numerous high-pressure water inrushes, causing significant fatalities and financial losses [
1,
2,
3,
4]. Water inrush is not only a critical issue in tunnel engineering but also poses a significant risk in mining operations in karst areas. Therefore, understanding the causes and mechanisms of water inrush is essential to minimize such engineering accidents [
5,
6,
7,
8,
9,
10].
Traditional methods for studying water inrush include the finite element method (FEM) and discrete element method (DEM). While FEM is highly accurate for small-scale deformations, it is less suitable for large and discontinuous deformations typical in blasting areas [
11,
12,
13]. On the other hand, DEM excels in simulating large deformations and fluid flow but requires extensive computational resources for engineering-scale problems [
14,
15,
16,
17,
18]. Recent studies have focused on the multi-field evolution of water inrush, analyzing factors such as joints, burial depth, hydraulic pressure, and aquifer thickness [
19,
20,
21,
22,
23,
24,
25]. However, these studies often lack a comprehensive consideration of blasting effects, particularly the interaction between blasting stress waves and water pressure [
26,
27,
28,
29,
30,
31,
32,
33].
In recent years, hybrid modeling methods such as the FEM-SPH coupling approach have gained attention. The FEM-SPH method combines the advantages of FEM in accurately handling small deformations and SPH in managing large, discontinuous deformations and free-surface fluid flows. Notably, Duan et al. (2022) [
9] applied a similar coupled method to explore safe rock thickness under combined water pressure and blasting loads. Jin et al. (2021) [
13] introduced a coupled LBM-DEM model to simulate mud inrush. However, these studies primarily focus on vertical flow paths or simplified geological conditions. Additional recent advancements include the application of SPH-FVM [
34], SPH-FEM in cracked rock simulations [
35], and the combination of deep learning with FEM mesh optimization for tunnel settlement predictions [
36,
37,
38,
39]. These developments demonstrate the increasing sophistication and practical integration of FEM-SPH methods [
40,
41,
42,
43].
To address these limitations, this paper proposes a novel FEM-SPH coupling method to simulate the water inrush process induced by blasting. The proposed model combines the strengths of FEM and SPH, enabling accurate simulation of both small and large deformations [
44,
45,
46,
47]. By focusing on the horizontal distribution of aquifers, this study goes beyond the traditional analysis of vertical water-conducting channels and provides a detailed analysis of the relationship between explosion stress waves [
48,
49,
50], water pressure, and rock mass damage. The findings offer new insights for the prevention and control of water inrush in underground engineering construction [
51,
52,
53,
54].
2. Method for FEM-SPH Coupling Damage Analysis
2.1. Johnson–Holmquist Criterion Failure Model
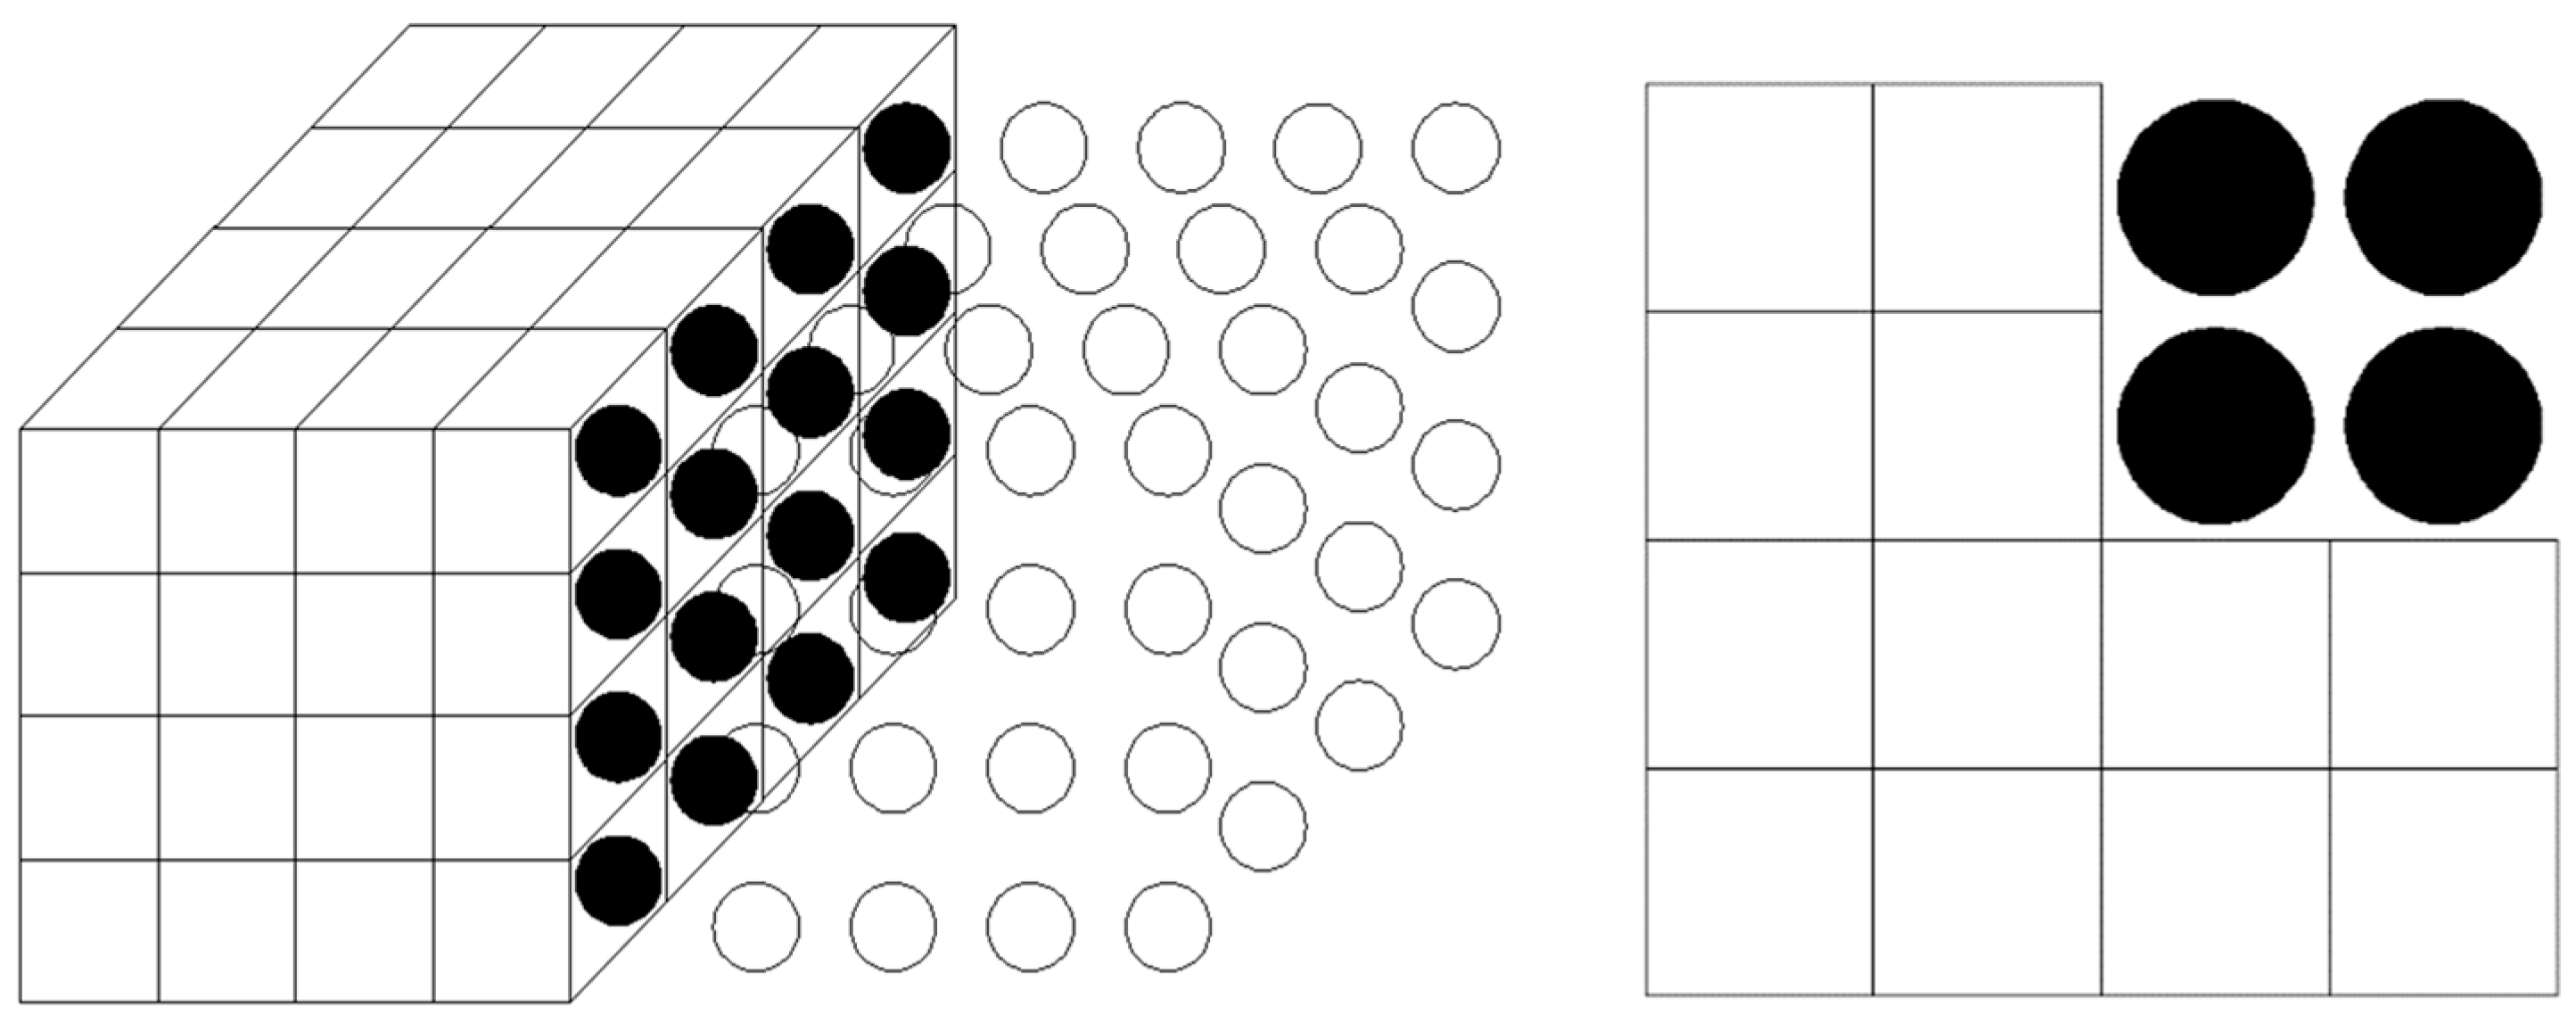
The FEM-SPH coupling method used in this study combines the finite element method (FEM) for solid rock simulation and smoothed particle hydrodynamics (SPH) for fluid behavior. The coupling algorithm is implemented in LS-DYNA, where SPH particles are treated as special joints, and forces are transmitted to the finite element units using a point-surface contact mode. This approach allows for the simulation of large deformations near the explosion source using SPH particles, while FEM is applied in areas with small deformations.
The Johnson–Holmquist constitutive model was selected to represent the failure process of the rock mass. The model accounts for the effects of hydrostatic pressure, strain rate, and damage, making it suitable for simulating the dynamic behavior of rock under blasting loads. The yield surface is described by the following function:
where
stands for the normalized equivalence strength, Pa;
A represents the normalized cohesive strength, Pa;
D denotes the damage indicator;
B,
,
N, and
C are all dimensionless parameters that characterize normalized pressure hardening coefficient, normalized pressure, pressure hardening index, and strain rate coefficient, respectively;
represents the equivalence strain rate, S
−1.
D is a dimensionless variable with a range between 0 and 1 that is defined by volumetric strain and equivalent plastic strain. A
D value of 0 demonstrates that the material is undamaged and fully capable of withstanding shear. On the other hand, a
D value of 1 illustrates the rock is broken and cannot withstand tensile and shear strains. The fracture initiation threshold refers to the minimum effective stress or strain energy required for microcracks to nucleate within the rock matrix, marking the onset of failure under dynamic loading conditions. It represents a critical parameter in the Johnson–Holmquist constitutive model that determines when damage begins to accumulate under blast-induced stress.
where
represents the equivalent plastic deviator strain incremental value;
represents the plastic volume strain incremental value;
represents the equivalent plastic deviator strain; and
represents the plastic volume.
2.2. Explosive State Equation
A sophisticated nonlinear dynamic analysis function in the finite element program LS-DYNA allows it to correctly model the detonation of powerful explosives. The Jone–Wilkins–Lee (JWL) state and MAT-HIGH-EXPLOSIVE-BURN equations are typically used to define the high explosive material in LS-DYNA, thereby characterizing the explosive substance. The JWL equation of state for modeling the connection between pressure and specific volume throughout an explosive blast is as follows (Busch and Tarefder 2017 [
6]; Tiwari et al. 2020 [
21]):
where
A,
R1,
R2, ω, and
B refer to constants representing the material properties;
P stands for detonation pressure, Pa;
E0 stands for initial ratio internal energy, Pa; and
V represents relative volume. The pressure of the computational models inside the source at any given time when the explosive detonates is calculated using the following equation:
where
represents the explosion pressure, Pa;
denotes the chemical energy release rate of the explosive unit;
stands for the explosive detonation velocity, m/s;
and
are the maximum cross-sectional area and volume of the explosive, respectively;
and
represent the present time and detonating time of a point inside the explosive, s, respectively; and
is the relative volume of the Chapman–Jouguet surface.
2.3. Air State Equation
The air domain was simulated by the MAT-NULL (empty material) model and characterized by the EOS-LINEAR-POLYNOMIAL polynomial state equation. The formula is as follows:
where
is the dynamic viscosity coefficient,
;
is the current density;
is the initial density;
E0 is the initial internal energy; and
C0~
C6 are the parameters of the equation of state.
2.4. Water State Equation
The water body was simulated by the MAT-NULL model and characterized by the EOS-GRUNEISEN state equation. The formula is as follows:
where
C represents the curve intercept;
denotes the Gruneisen parameter;
S1,
S2, and
S3 are the curve slope coefficients; and
is the first-order volume modification of
and
.
2.5. FEM-SPH Coupling Algorithm
In LS-DYNA, SPH particles are treated as special joints, and the force is transmitted to the superficies of the finite element unit using the punitive function, which is the point-surface contact mode. The large deformation area near the explosion source is modeled by SPH particles, and the finite element model is established in the small deformation area far from the explosion source. The finite element and SPH particles at the coupling location are coupled using contact, which can fully integrate the advantages of the two algorithms. Therefore, in this paper, the stress and strain of solid rock were determined by finite element analysis, and SPH was used as the fluid particle. Moreover, the leapfrog algorithm in SPH computation was used to work out the Navier–Stokes formula, and the particle node information was subsequently updated, including mass, velocity, and energy displacement. The nodal data, comprising displacement, speed, and stress, were handled using dynamic analysis in FEM, which used a discrete approach to the difference format.
Figure 1 depicts the fundamentals of the FEM-SPH coupling method.
3. Project Background
With a maximum depth of 485.2 m, the Shangjiawan tunnel is situated on the Xiangyang segment of the Bao-Yi Expressway. Limestone is the primary component of the surrounding rock, with karst, fractures, and groundwater in some sections. There are many karst depressions at the tunnel site, which is a special high-risk karst tunnel.
Figure 2 illustrates the geological distribution of the Shangjiawan tunnel’s longitudinal section.
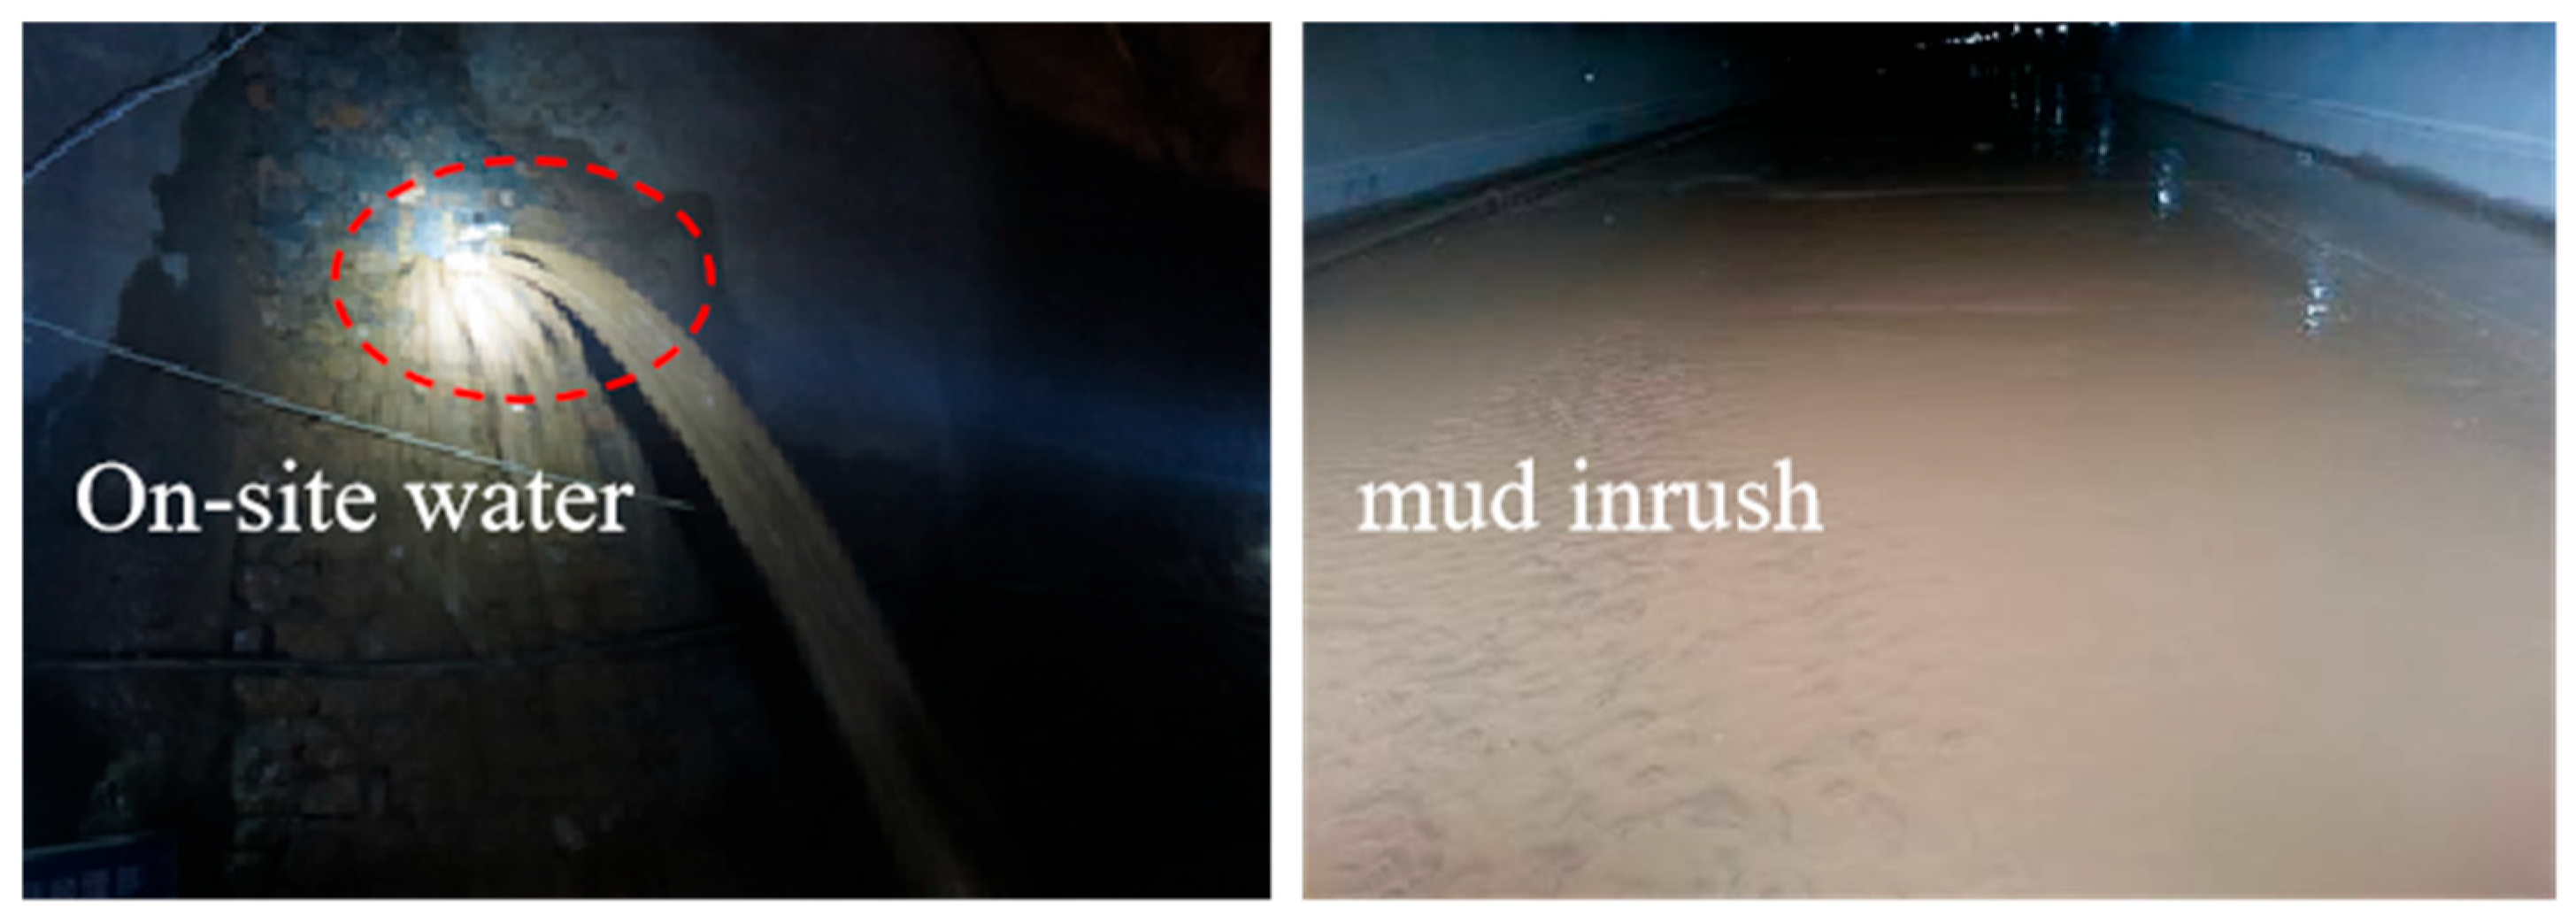
Advance drilling has been carried out at the left line of ZK64+918. There was a sudden increase in water volume during the drilling procedure, with a flow rate of around 200 m
3/h. During excavation, a high volume of muddy water was released from the working area. In a very short period, the amount of mud gushing reached 7700 m
3, and the muddy water rapidly poured out of the hole, flooding the tunnel invert 50 cm deep.
Figure 3 displays the situation. After exploring, a water-filled karst cave was identified ahead of the face and was classified as a potential disaster source.
4. Model Establishment and Results
4.1. Model Setup
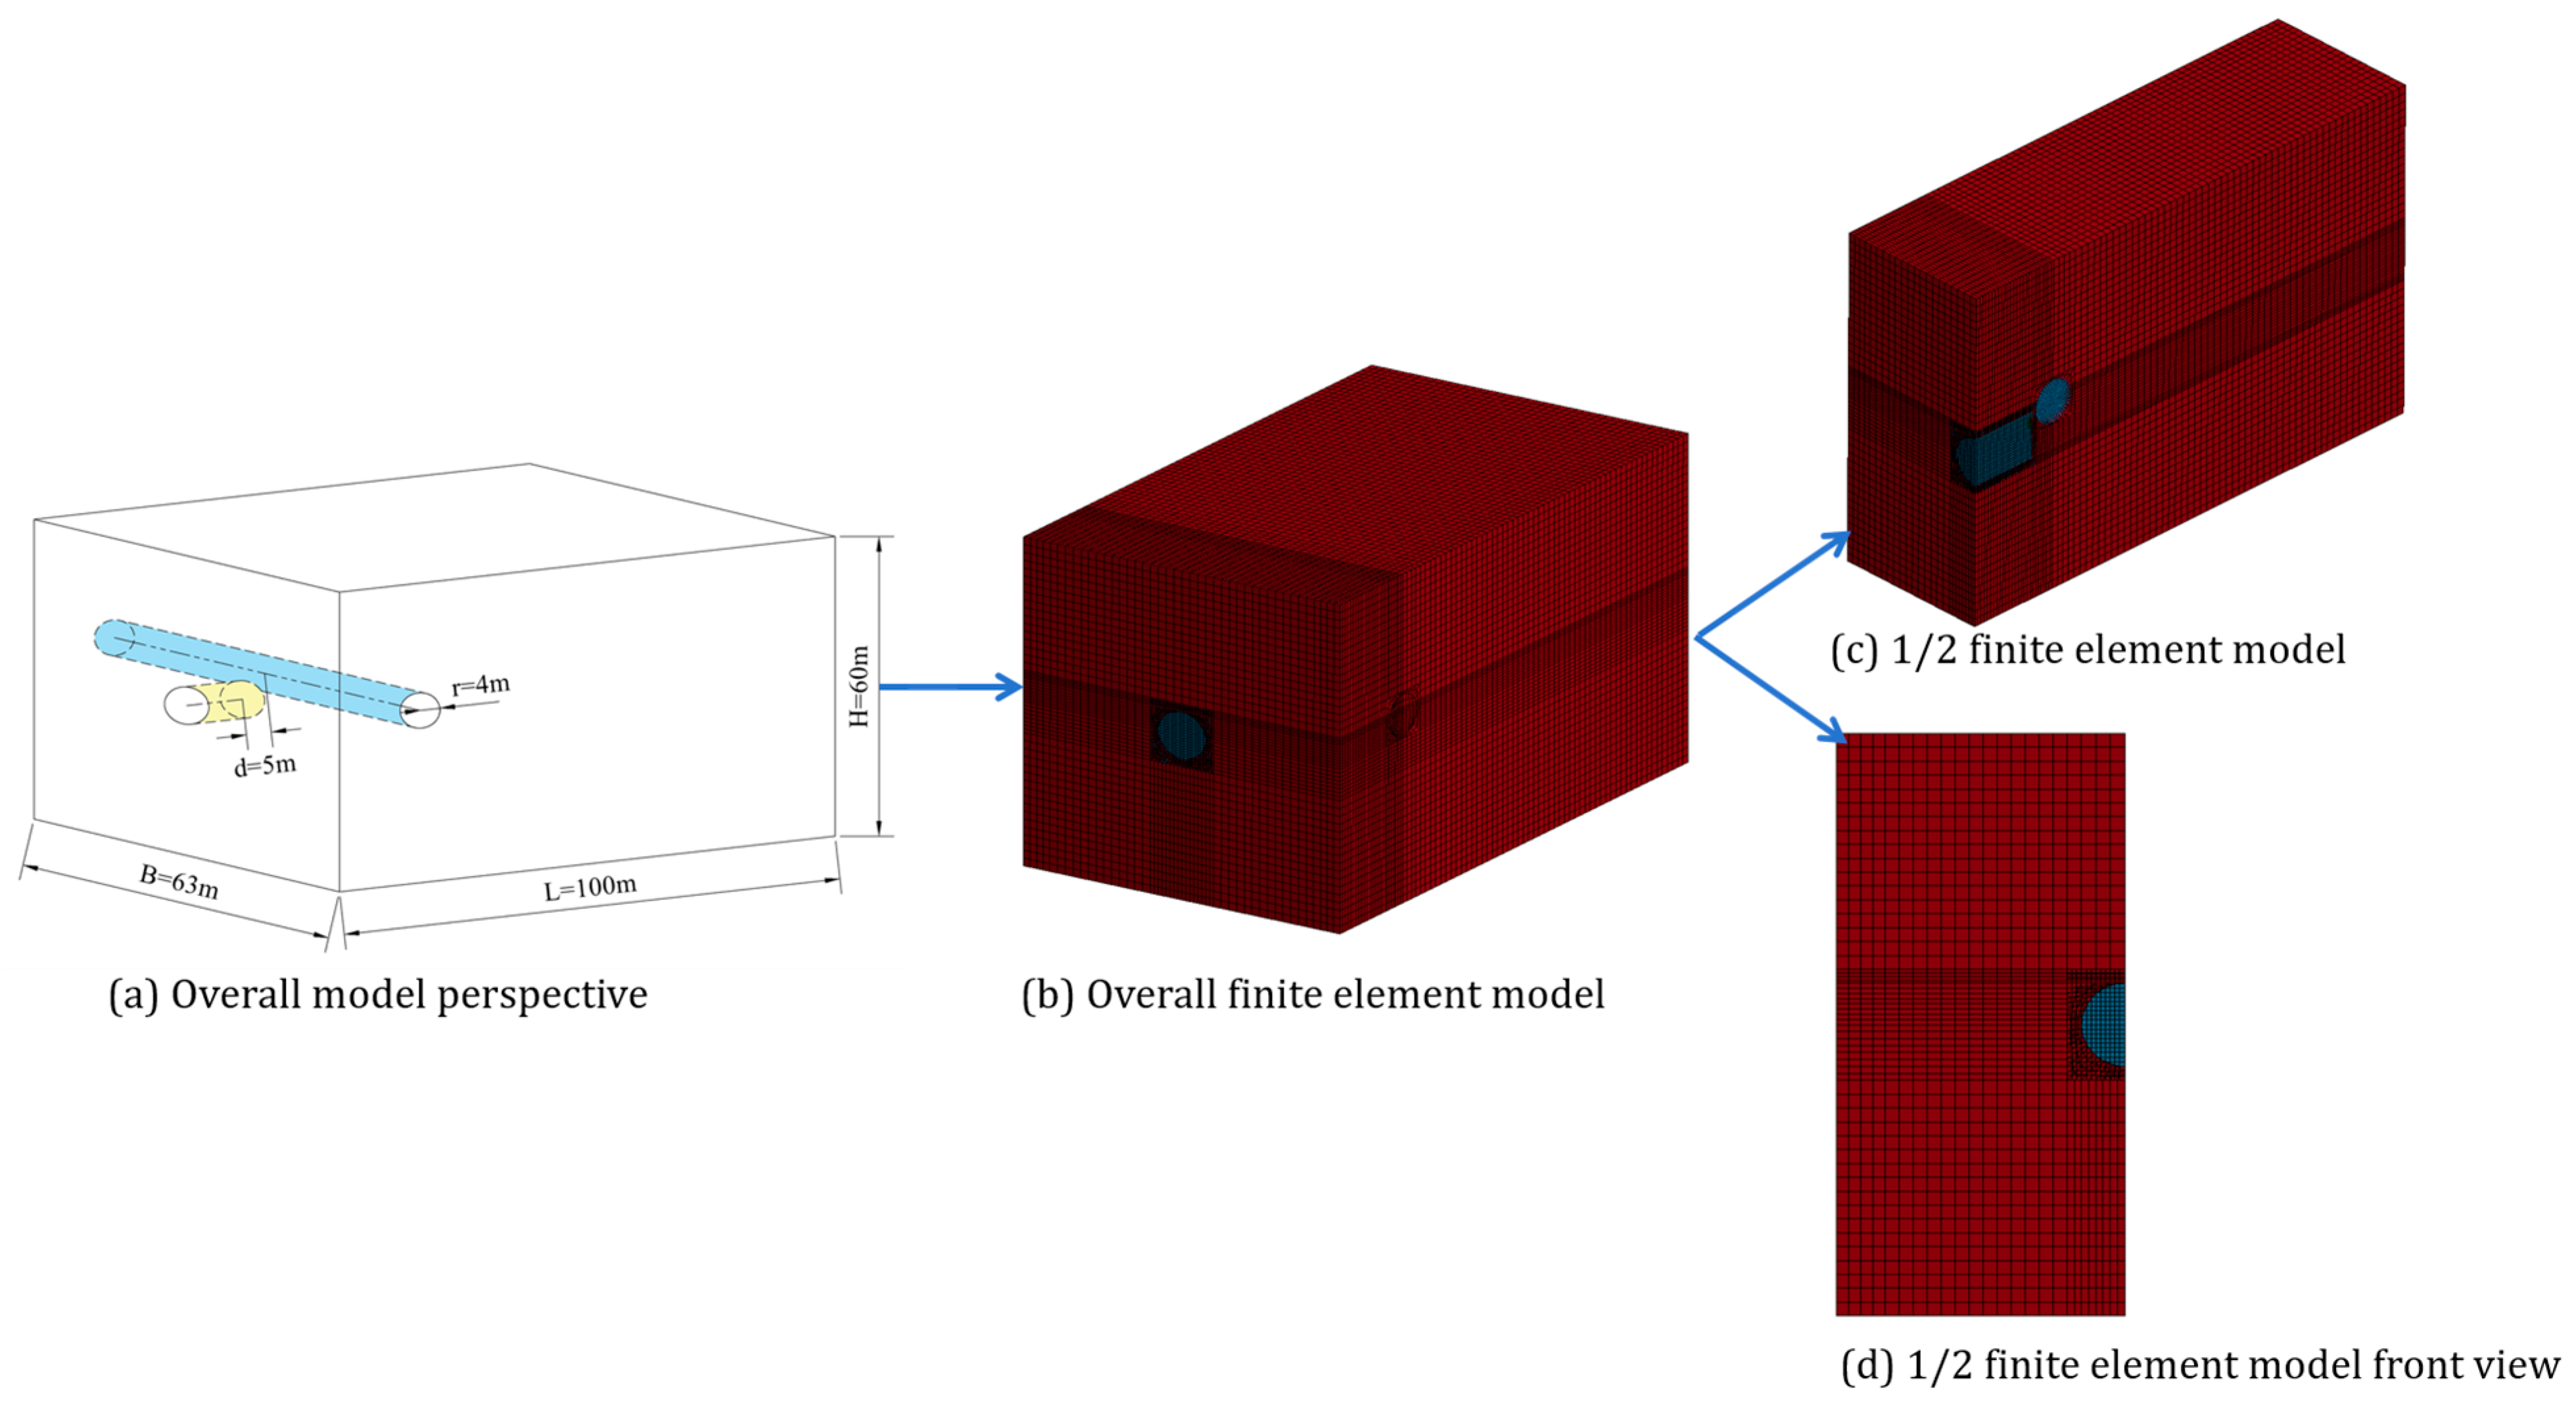
The tunnel structure and the geological conditions of the working area were modeled with a scale ratio of 1:20, as shown in
Figure 4. Considering the symmetric geometry of the tunnel, only half the domain was modeled. The left and right planes of the model were assigned symmetric boundary conditions. The top surface was modeled as a free surface to allow blast-induced expansion, while the bottom surface was fixed in all directions. Non-reflecting boundaries were used at the far-field surfaces to prevent wave reflection artifacts. The whole model comprised four components, which were calculated using the multiple material arbitrary Lagrangian–Eulerian algorithm: fluid, air, explosive, and rock. The size of the calculated domain was 100 m × 63 m × 60 m, and the diameter of the tunnel was 4 m. The explosive strip capsule was situated in the center of the model. Using the symmetrical characteristics of the structure, only half of the model was calculated to reduce the amount of calculation. The model material was represented using SOLID164 units. All the elements constituting the model were set to solid elements with eight nodes, and each element exhibited a regular hexahedron shape. The number of units and nodes were 128,839 and 139,232, respectively. During the modeling process, we compared the actual blasting data with the simulation results in order to achieve better modeling accuracy. However, due to the requirements of the construction company, the experimental data were not saved.
4.2. Calculation Parameters
The constitutive relationship of rock was determined using the Johnson–Holmquist criterion, and the table below,
Table 1, presents the specific model parameters. It is worth noting that the dimensionless parameters in the table represent dimensionless quantities.
The Eos–Jones–Wilkens–Lee (JWL) equation and Mat-High-Explosive-Burn model were used in the constitutive relationship for the explosives. Details of the parameters of the model are summarized in
Table 2.
The Eos–Linear–Polynomial state equation and Mat-Null model were used in the constitutive relationship for the air domain.
Table 3 lists the exact model parameters.
Eos–Gruneisen state equation and Mat-Null model were applied as the constitutive relationship of water bodies. Details of the model parameters are presented in
Table 4.
4.3. Simulation Results
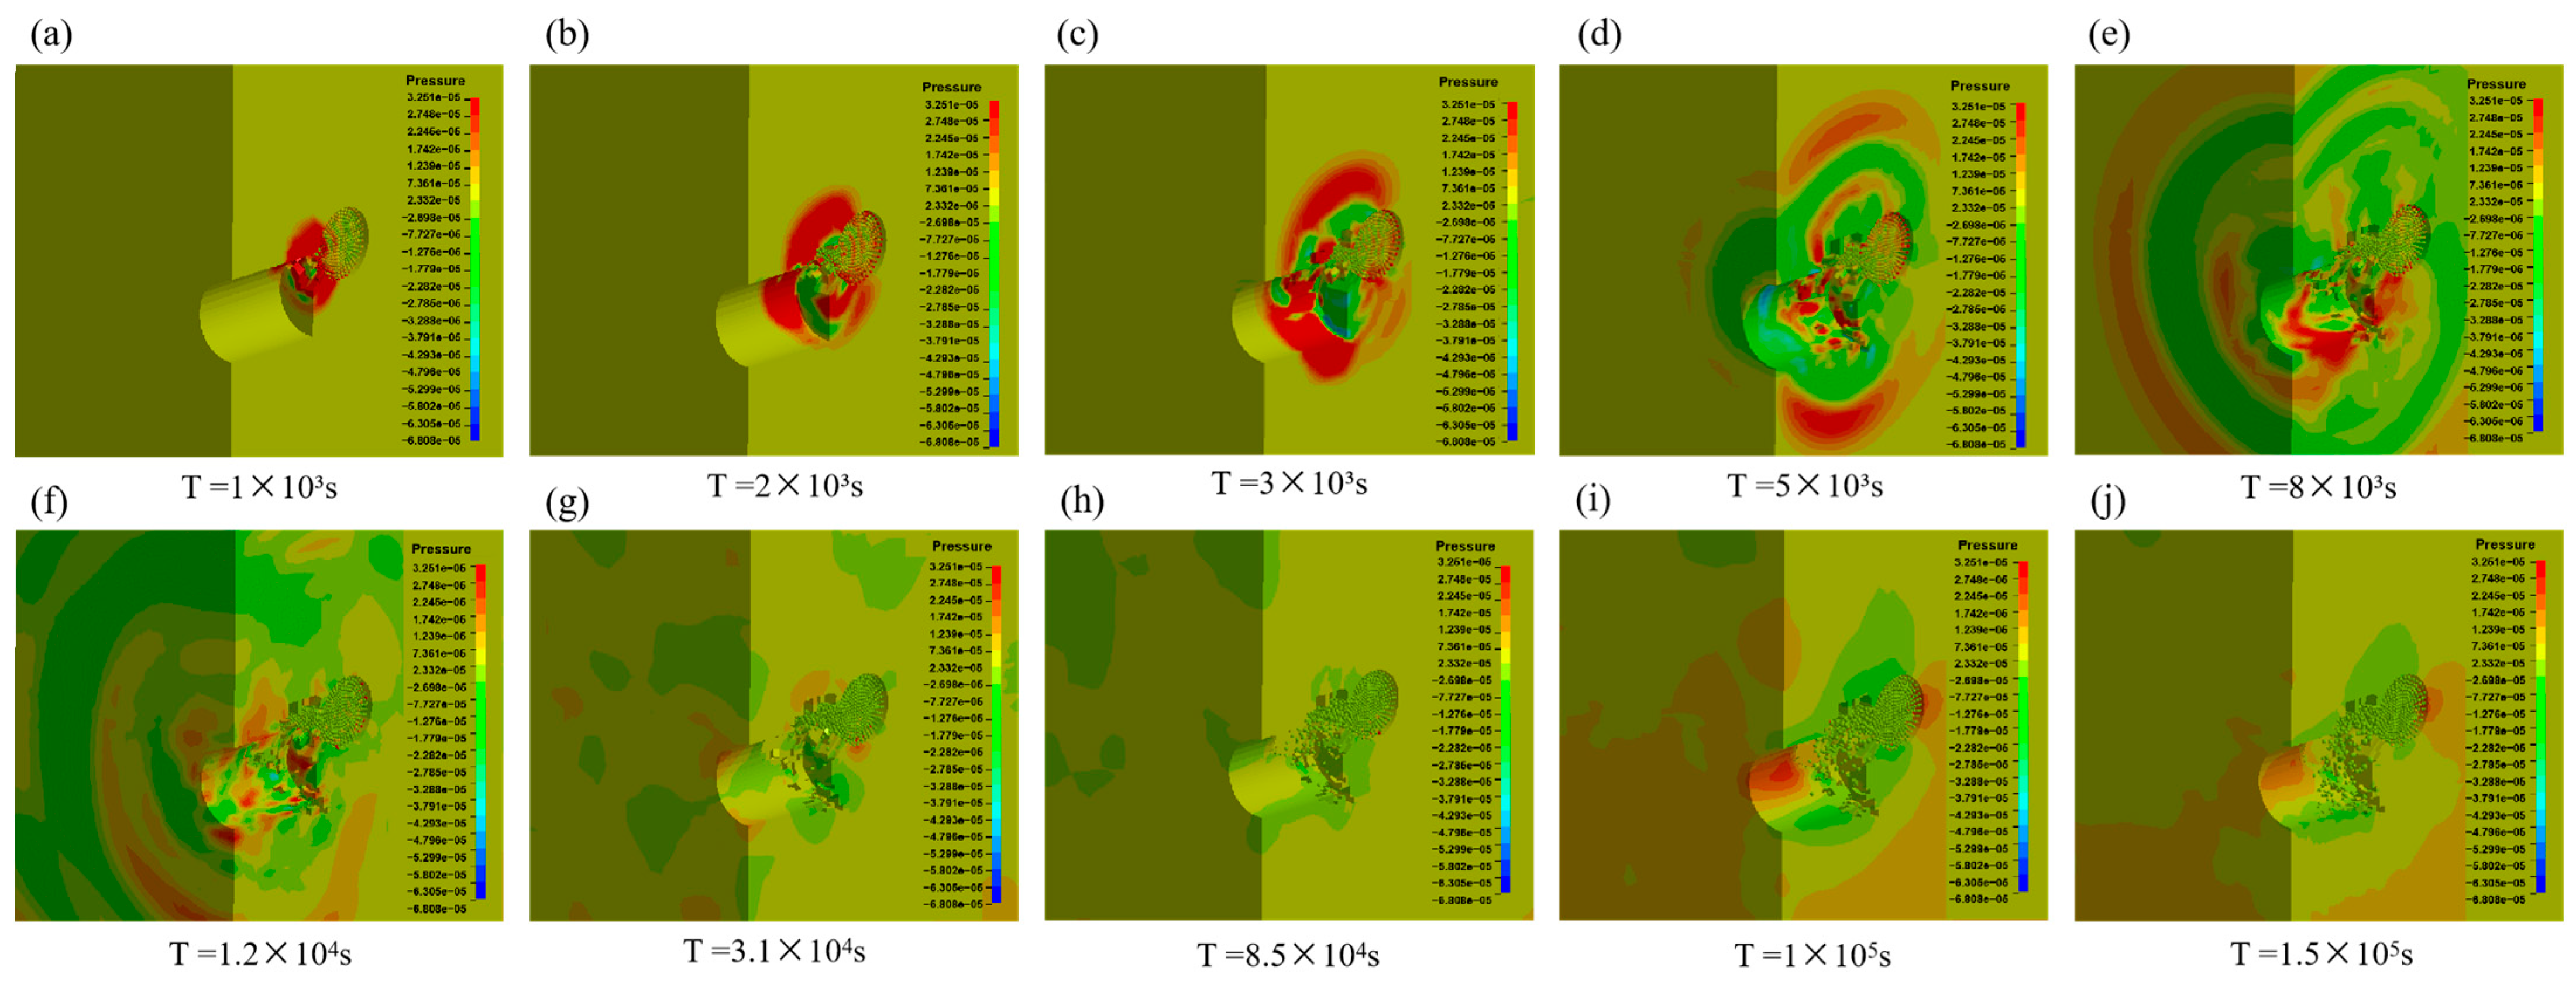
The evolutionary process of water inrush during drilling and blasting construction was visualized by the bursting pressure cloud picture (
Figure 5). Attributed to the shock wave generated by the explosion, the stress of the rock mass adjacent to the blast hole instantaneously peaked. At the same time, radial cracks were observed at the edge of the crushed area due to the tensile stress reflected by the blasting stress wave. It can be deduced from the figure that the water-resisting rock mass was destroyed at 3000 μs, which further collapsed under the action of hydraulic erosion, and a water-conducting channel was initially formed and eventually induced water inrush.
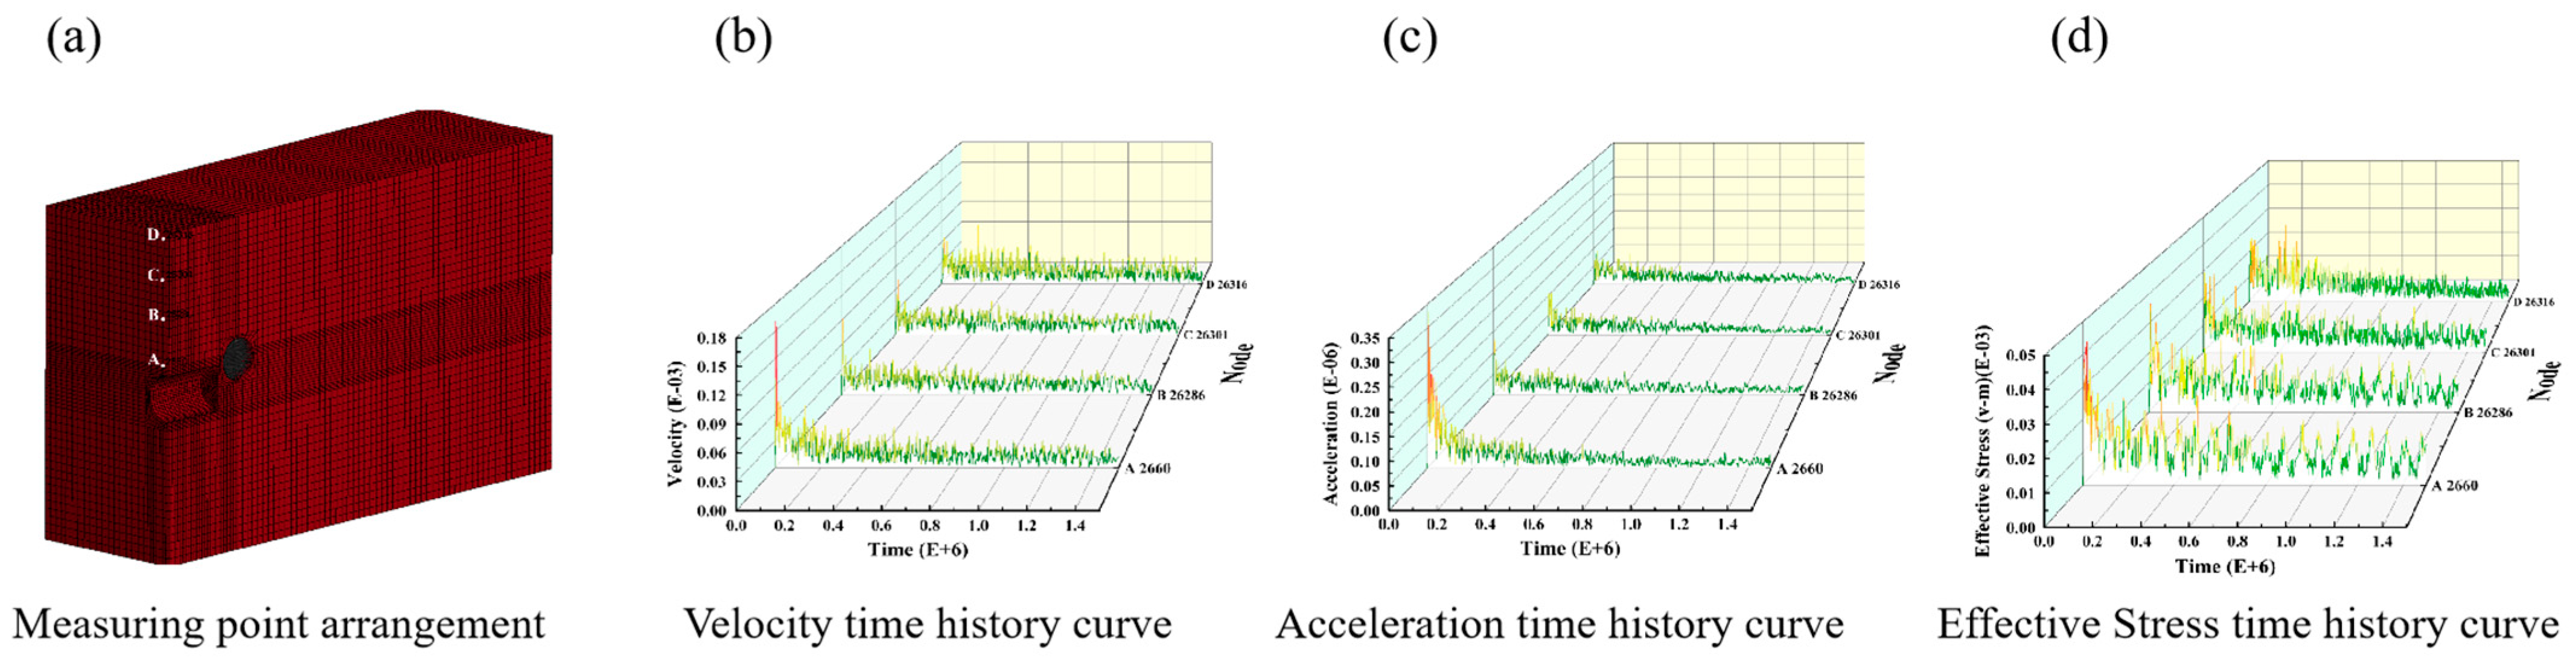
Four measuring points were selected on the outer wall of the wall rock of the remote tunnel to analyze the impact of explosions on the surrounding rock mass at different distances (
Figure 6). This provides a basis for explaining the stress distribution and the extent of the blasting effect on the rock mass. Point A was closest to the blast hole and numbered 2660. Point B was numbered 26,286 and was located at 1/3 from the blast hole. Point C was numbered 26,301 and was located at 2/3 from the blast hole; Point D, designated by the number 26,316, was located at the edge of the model. The velocity, acceleration, and stress time history curves of each point are displayed in
Figure 6b–d.
The time history curve displays that from point A to point D, the velocity, acceleration, and stress decreased as the distance from the blast hole increased, and the value of point A was significantly larger than that of points B, C, and D. This can be explained by the fact that the rock mass had a large dynamic compressive strength, which consumed a large amount of energy during the formation of the crushing zone. Consequently, the loss of blast wave was larger in in the crushing zone, resulting in a lower amount of blast wave energy transmitted to B, C, and D, thus generating lower speed, acceleration, and stress. Hence, it is advisable to employ geophysical exploration techniques in conjunction with underground engineering construction processes to promptly ascertain the position and size of water-bearing formations in each section. This can be achieved through methods such as numerical simulation and mechanical calculations to estimate the potential extent of blasting impact. Furthermore, when construction reaches the designated areas, measures such as isolating water passages and implementing drainage and dewatering techniques should be employed to manage the presence of water-filled caves.
Three measuring points were selected on the tunnel face (
Figure 7). Point A, designated 22,296, was situated at the top of the tunnel face; point B was positioned in the middle of the interior side of the tunnel face and numbered 22,328; point C was numbered 22,263 and was situated in the middle of the tunnel face. These three points can represent the changes in stress distribution along the excavation face during the blasting-induced water inrush process.
Figure 7b–d delineate the stress, pressure, and maximum shear stress time history curves for the three points, respectively. The pressure value of point A attained the maximum value in a very short amount of time and was significantly greater than that of points B and C; points B and C had a large tensile force under the action of blasting stress wave reflection tensile stress. Following damage, the stress value dropped to zero. Hence, apart from focusing on the minimum thickness between blast holes and water-bearing formations, equal attention should be given to the tensile strength of the rock mass in the central region of the excavation face. It is crucial to be particularly wary of potential strength reduction resulting from rock fracturing.
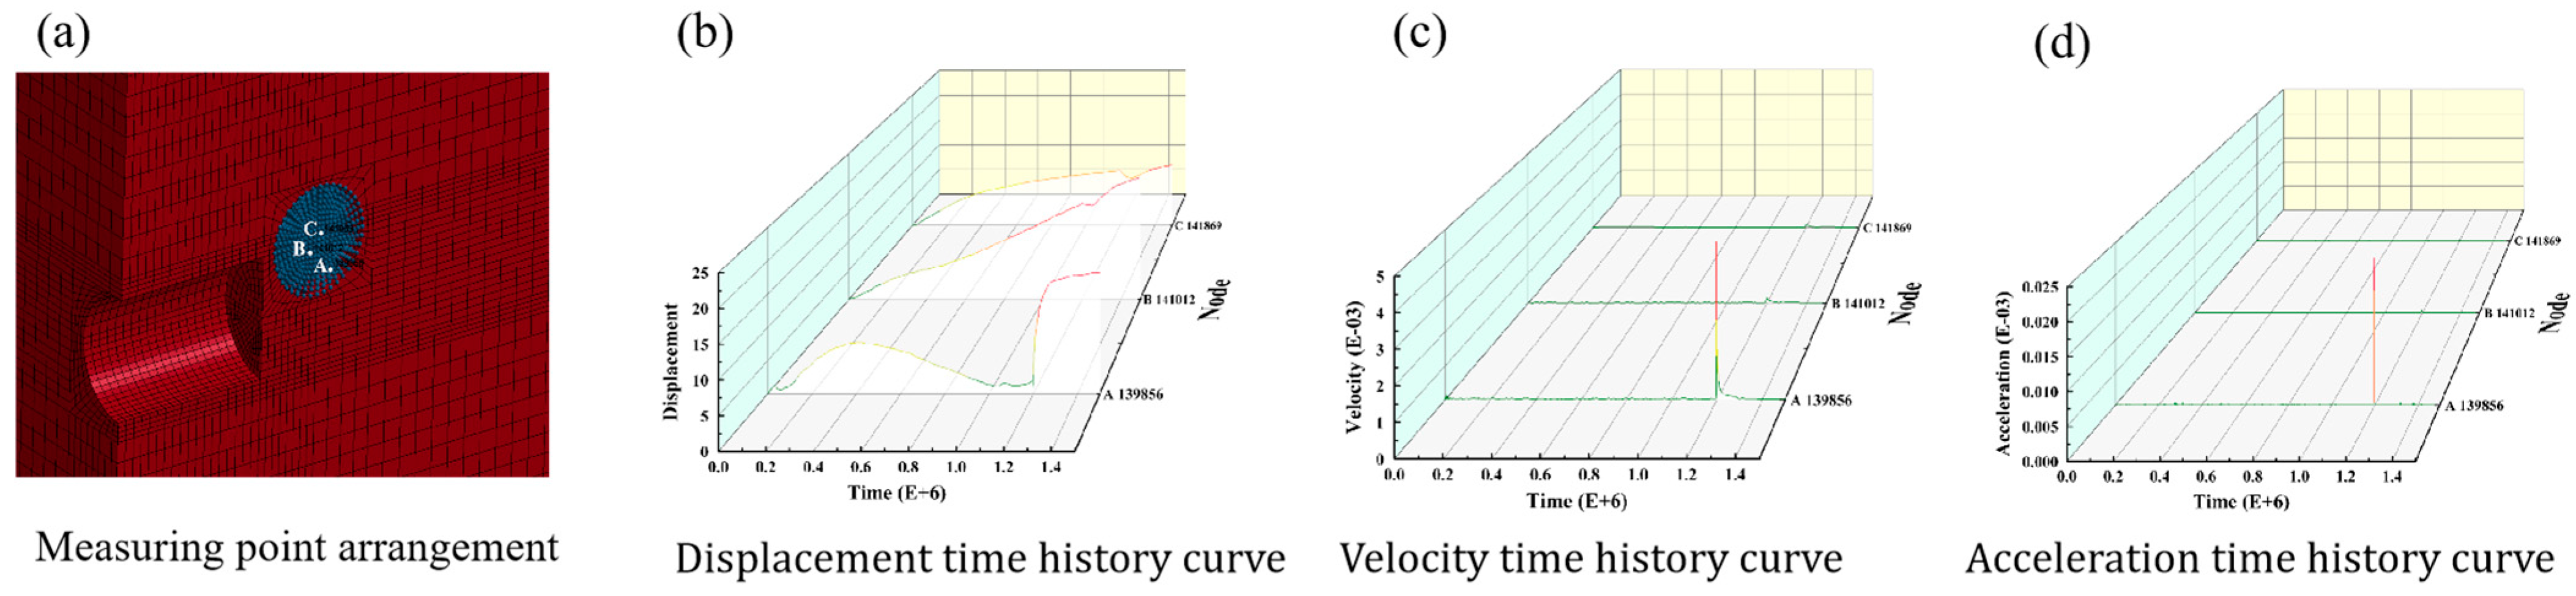
Herein, fluid particles were monitored at three specific locations (
Figure 8). Among them, point A (139,856) was located at the edge of the karst cave, whereas points B (141,012) and C (141,869) were situated at the center. The three points were selected at different radii to analyze the movement of water in the karst cave during the water inrush process. This analysis helps evaluate the hydraulic conditions and assess the impact of blasting on water inrush. As shown in
Figure 8, the findings demonstrate that upon the initial explosion, the water-conducting channel develops, and the velocity of the fluid is slow. Thereafter, with the gradual expansion of the water channel, at 1.2 × 10
6 μs, the velocity and acceleration of each measuring point significantly fluctuated, with the change at point A being the most severe with a substantial increase in displacement. The higher velocity and stress at point A are attributed to the constructive interference of reflected stress waves and local geometric focusing effects. The observed vortex pattern in
Figure 8 results from the high-speed jet formed at fractured zones interacting with free surfaces, consistent with vortex generation theory in fluid mechanics. Analysis showed that under the action of hydrostatic pressure, water flowed along the conduit, causing the flow of particles within the karst cave. The presence of water outlets on the cave walls led to differences in water flow velocity in various directions, resulting in highly irregular particle movement and the formation of rotational tendencies and vortices. This process was instantaneous, and the rapid increase in acceleration indicated high water pressure and a destructive nature. Hence, while implementing dewatering measures, it is important to minimize damage to the cavity walls and prevent the formation of significant hydraulic pressure impacts at the drainage outlets resulting from differences in flow velocity.
5. Discussion
Herein, the FEM-SPH coupling method was used to simulate changes in tunnel water inrush over time during drilling and blasting construction, and the dynamic characteristics of surrounding rocks under high hydrostatic pressure, high strain rate, and high stress were analyzed.
According to the characteristics of rock mass stress and fluid particle velocity and acceleration in the simulation process, the progression to water inrush was separated into three stages: (1) the water-resisting rock mass was crushed under explosion pressure, and radial fractures were formed by tension at the edge of the crushing area; (2) the fluid particles flowed irregularly under the influence of the blasting force, further collapsing the rock mass and forming the water channel; (3) when the resultant force of the confining stress in the rock mass and the explosion pressure was lower than the water pressure, the water channel promptly expanded. After forming a water-conducting channel allowing the free flow of the fluid, the water particles were sprayed along the water channel, which further expanded the water channel.
The FEM-SPH coupling method utilized in this study takes into account the combined effect of dynamic water pressure and explosive stress waves on the surrounding rock masses. In comparison to traditional methods, it demonstrates superior application performance in both large-scale and small-scale deformations, achieving a balance between computational efficiency and accuracy, thus better meeting the actual situation of the project. However, this study treats the rock mass as a homogeneous and isotropic material, overlooking material heterogeneity. Further optimization is necessary when applying this method under complex geological conditions. Nevertheless, this approach still holds reference value and practical significance for the construction of the drill-blasting method.
To further evaluate the robustness of the proposed model, a sensitivity analysis was conducted by adjusting the explosive charge from 0.1 kg to 0.5 kg. The results showed that increased charge intensity significantly reduced the time to initiate rock failure and accelerated fluid particle velocity. Additionally, when water pressure exceeded 0.25 MPa, the formation of water-conducting channels occurred earlier and more violently. This finding highlights the importance of carefully controlling both explosive energy and groundwater conditions during construction to mitigate the risk of sudden water inrush.
Compared with the findings of Li et al., who used DEM to simulate water migration through cracked rock, the proposed FEM-SPH model captures the early pressure accumulation and microfracture evolution more precisely.
As shown in
Figure 5,
Figure 6 and
Figure 7, the SPH particle velocity, fracture onset time, and peak water discharge rate are identified as dominant indicators in assessing the optimization of water-resistant rock mass integrity. These metrics are essential in evaluating the dynamic stability of aquifers subjected to explosive disturbances.
6. Conclusions
In this study, the LS-DYNA method was further improved by introducing the FEM-SPH algorithm to focus on horizontally distributed aquifers. The relationship and influencing mechanism among explosion stress, water pressure, and rock mass damage were analyzed, enabling a detailed investigation of the triggering causes and formation process of rock mass rupture and water inrush during blasting. The findings provide new references for water control in tunnel engineering and mining construction. The specific conclusions are as follows:
(1) Analyzing the bursting pressure cloud picture and the velocity and stress time history curves of different measuring points uncovered that the explosion stress wave had a powerful impact force that was sufficient to instantaneously destroy the water-resistant rock mass. Nevertheless, it exerted marginal effects on distant surrounding rocks due to rapid energy dissipation. Therefore, it is necessary to pay attention to the range of explosion impact and estimate the minimum water-resisting thickness of the rock mass.
(2) The monitoring results of the tunnel face demonstrated that the rock mass adjoining the blast hole was destroyed by the blast wave, and the distant rock mass was first subjected to compressive stress generated by the explosion and then destroyed by the tensile force. It is worth noting that, after the explosion, the rock mass at the center of the excavation face experiences higher stresses compared to the rock mass at the sidewalls. Thus, it is crucial to pay attention to the weak points where the excavation face lacks support and the overall strength attenuation of the rock mass after rupture, in order to avoid damage at these vulnerable locations.
(3) The monitoring results illustrated that the fluid particles flowed erratically after blasting, the velocity vector consistently fluctuated, and the velocity and acceleration sharply increased at the moment of water inrush. The fluid particles at the edge of the water-filled cave changed most violently, forming an eddy current, leading to the continuous expansion of the water channel under high water pressure and triggering large-scale water inrush. It is necessary to be vigilant about the powerful suction effect of the water passage formed, which can lead to different flow velocities within the cave system. This differential flow velocity can trigger vortex-induced impacts at the water outlet, leading to the expansion of the water passage.
To conclude, water inrush in the drilling and blasting construction was instantaneous, could reach an extremely high flow rate in a very short time, and had intense destructive power, which seriously threatened the safety of the project. Instead of listing all simulation stages, we emphasize the key finding that the time to inrush initiation correlates nonlinearly with explosive energy and initial aquifer pressure. Future work will involve integrating real-time field monitoring to validate model dynamics under variable hydrogeological conditions and extending the model to three-dimensional and anisotropic aquifer environments for broader engineering applicability.
However, this study assumes the rock mass to be homogeneous and isotropic, which does not capture the influence of natural joints and heterogeneities. Future research will focus on introducing discrete fracture networks (DFNs) and heterogeneous material properties to improve realism and predictive capability.
Author Contributions
Y.M. and X.B.; methodology, J.W.; software, Y.M. and Z.Z.; validation, Y.M., J.W. and X.B.; formal analysis, Y.M. and Z.Z.; investigation, Y.M., Z.Z. and X.Y.; resources, C.W. and J.W.; data curation, X.Y.; writing—original draft preparation, Y.M.; writing—review and editing, J.W. and X.B.; visualization, Z.Z. and K.W.; supervision, J.W. and X.B.; project administration, J.W.; funding acquisition, X.B. All authors have read and agreed to the published version of the manuscript.
Funding
This article was funded by Shandong Taishan Industry Leading Talent Program (No. tscx202306007), Young Top Talent Support Program (No. 2024GJJLJRC-086), Taishan Scholars Young Experts Programme (No. tsqn202306328), National Natural Science Foundation of China (No. 52378403), Jinan New University 20 Funding Projects (No. 202228054), National Natural Science Foundation of China Youth Project (No. 52408426).
Data Availability Statement
The data presented in this study are not publicly available due to institutional or project confidentiality agreements.
Conflicts of Interest
Yanqing Men and Kai Wang were employed by Jinan Rail Transit Group Co., Ltd. Chuan Wang was employed by Shandong Hi-Speed Group Co., Ltd. The remaining authors declare that the research was conducted in the absence of any commercial or financial relationships that could be perceived as a potential conflict of interest.
References
- Zhang, Q.; Wang, J.; Feng, L. Mechanical Mechanism of Hydraulic Fracturing Effect Caused by Water Inrush in Tunnel Excavation by Blasting. Math. Probl. Eng. 2021, 2021, 9919260. [Google Scholar] [CrossRef]
- Zhao, Y.; Liao, J.; Liu, Q.; Li, Y.; Cheng, J. Linkage Analysis between Solid-Fluid Coupling and the Strength Reduction Method for Karst Cave Water Inrush in Mines. Shock. Vib. 2020, 2020, 5415812. [Google Scholar] [CrossRef]
- Lin, C.; Wang, Z.; Shi, J.; Ma, B.; Liang, R.; Luo, X. Elasto-plastic solution for tunnelling-induced nonlinear responses of overlying jointed pipelines in sand. Tunn. Undergr. Space Technol. 2024, 152, 105953. [Google Scholar] [CrossRef]
- Chen, D.; Chen, Y.; Zhou, Z.; Tu, W.; Li, L. Study on internal rise law of fracture water pressure and progressive fracture mechanism of rock mass under blasting impact. Tunn. Undergr. Space Technol. 2025, 161, 106545. [Google Scholar] [CrossRef]
- Abdollahi, M.S.; Najafi, M.; Bafghi, A.Y.; Marji, M.F. A 3D numerical model to determine suitable reinforcement strategies for passing TBM through a fault zone, a case study: Safaroud water transmission tunnel, Iran. Tunn. Undergr. Space Technol. 2019, 88, 186–199. [Google Scholar] [CrossRef]
- Busch, C.L.; Tarefder, R.A. Evaluation of Appropriate Material Models in LS-DYNA for MM-ALE Finite Element Simulations of Small-Scale Explosive Airblast Tests on Clay Soils. Indian. Geotech. J. 2017, 47, 173–186. [Google Scholar] [CrossRef]
- Chen, S.; Peng, H.; Yang, C.; Chen, B.; Chen, L. Investigation of the impacts of tunnel excavation on karst groundwater and dependent geo-environment using hydrological observation and numerical simulation: A case from karst anticline mountains of southeastern Sichuan Basin, China. Environ. Sci. Pollut. Res. 2021, 28, 40203–40216. [Google Scholar] [CrossRef]
- Chiu, C.-C.; Weng, M.-C.; Shiu, W.-J. Simulating flow in rock joints using a particulate interface model of a discrete element method. Bull. Eng. Geol. Environ. 2021, 80, 2789–2804. [Google Scholar] [CrossRef]
- Duan, Y.; Zhang, X.; Zhou, X.; Ou, X. Research on the Mechanism and Safe Thickness of Karst Tunnel-Induced Water Inrush under the Coupling Action of Blasting Load and Water Pressure. Appl. Sci. 2022, 12, 11891. [Google Scholar] [CrossRef]
- Guo, J.; Wang, E.; Lai, Y.; He, Z.; Chen, F. Study on Catastrophe Information Characteristics of Water Inrush in Karst Tunnel by Drilling and Blasting Method. Adv. Civ. Eng. 2022, 2022, 9228569. [Google Scholar] [CrossRef]
- He, Y.; Wang, H.; Zhou, J.; Su, H.; Luo, L.; Zhang, B. Water Inrush Mechanism and Treatment Measures in Huali Highway Banyanzi Tunnel-A Case Study. Water 2023, 15, 551. [Google Scholar] [CrossRef]
- Hirmand, M.R.; Vahab, M.; Papoulia, K.D.; Khalili, N. Robust simulation of dynamic fluid-driven fracture in naturally fractured impermeable media. Comput. Methods Appl. Mech. Eng. 2019, 357, 112574. [Google Scholar] [CrossRef]
- Jin, L.; Zeng, Y.; Cheng, T.; Li, J. Numerical simulation of mud inrush of tunnels with coupled LBM-DEM. Chin. J. Geotech. Eng. 2021, 43, 1000–1009. [Google Scholar]
- Li, B.; Wang, X.; Liu, Z.; Li, T. Study on multi-field catastrophe evolution laws of water inrush from concealed karst cave in roadway excavation: A case of Jiyuan coal mine. Geomat. Nat. Hazards Risk 2021, 12, 222–243. [Google Scholar] [CrossRef]
- Li, S.; Gao, C.; Zhou, Z.; Li, L.; Wang, M.; Yuan, Y.; Wang, J. Analysis on the Precursor Information of Water Inrush in Karst Tunnels: A True Triaxial Model Test Study. Rock Mech. Rock Eng. 2019, 52, 373–384. [Google Scholar] [CrossRef]
- Liu, N.; Pei, J.; Cao, C.; Liu, X.; Huang, Y.; Mei, G. Geological investigation and treatment measures against water inrush hazard in karst tunnels: A case study in Guiyang, southwest China. Tunn. Undergr. Space Technol. 2022, 124, 104491. [Google Scholar] [CrossRef]
- Mishra, S.; Yadav, H.; Chakraborty, T.; Kapuria, S. Physio-Mechanical Characterization of Limestone and Dolomite for Its Application in Blast Analysis of Tunnels. J. Eng. Mech. 2022, 148, 04022019. [Google Scholar] [CrossRef]
- Mu, W.; Wu, X.; Deng, R.; Hao, Q.; Qian, C. Mechanism of Water Inrush Through Fault Zones Using a Coupled Fluid-solid Numerical Model: A Case Study in the Beiyangzhuang Coal Mine, Northern China. Mine Water Environ. 2020, 39, 380–396. [Google Scholar] [CrossRef]
- Pu, C.; Yang, X.; Zhao, H.; Chen, Z.; Xiao, D. Numerical investigation on crack propagation and coalescence induced by dual-borehole blasting. Int. J. Impact Eng. 2021, 157, 103983. [Google Scholar] [CrossRef]
- Shaffee, S.N.A.; Luckham, P.F.; Matar, O.K.; Karnik, A.; Zamberi, M.S.A. Numerical Investigation of Sand-Screen Performance in the Presence of Adhesive Effects for Enhanced Sand Control. SPE J. 2019, 24, 2195–2208. [Google Scholar] [CrossRef]
- Tiwari, R.; Chakraborty, T.; Matsagar, V. Analysis of curved tunnels in soil subjected to internal blast loading. Acta Geotech. 2020, 15, 509–528. [Google Scholar] [CrossRef]
- Varzaneh, A.A.S.; Ahmadi, M.; Goshtasbi, K. Simulation of hydraulic fracturing and Darcy fluid flow in a porous medium using a coupled Discrete Element Method with fluid flow. J. Pet. Sci. Eng. 2021, 204, 108706. [Google Scholar] [CrossRef]
- Wang, J.; Zhang, Y.; Qin, Z.; Song, S.; Lin, P. Analysis method of water inrush for tunnels with damaged water-resisting rock mass based on finite element method-smooth particle hydrodynamics coupling. Comput. Geotech. 2020, 126, 103725. [Google Scholar] [CrossRef]
- Xu, Y.; Yang, G.; Zhu, Y.; Hu, D. A coupled SPH-FVM method for simulating incompressible interfacial flows with large density difference. Eng. Anal. Bound. Elem. 2021, 128, 227–243. [Google Scholar] [CrossRef]
- Ye, T.; Pan, D.; Huang, C.; Liu, M. Smoothed particle hydrodynamics (SPH) for complex fluid flows: Recent developments in methodology and applications. Phys. Fluids 2019, 31, 011301. [Google Scholar] [CrossRef]
- Yu, J.; Zhu, Y.; Yao, W.; Liu, X.; Ren, C.; Cai, Y.; Tang, X. Stress relaxation behaviour of marble under cyclic weak disturbance and confining pressures. Measurement 2021, 182, 109777. [Google Scholar] [CrossRef]
- Peng, S.; Rice, J.D.; Zhang, W.; Luo, G.; Cao, H.; Pan, H. Laboratory Investigation of the Effects of Blanket Defect Size on Initiation of Backward Erosion Piping. J. Geotech. Geoenviron. Eng. 2024, 150, 4024095. [Google Scholar] [CrossRef]
- Zhou, H.; Liu, Z.; Shen, W.; Feng, T.; Zhang, G. Mechanical property and thermal degradation mechanism of granite in thermal-mechanical coupled triaxial compression. Int. J. Rock. Mech. Min. Sci. 2022, 160, 105270. [Google Scholar] [CrossRef]
- Wang, H.; Liu, Z.; Lin, C.; Yang, Q.; Hamdi, E. Non-monotonic effect of differential stress and temperature on mechanical property and rockburst proneness of granite under high-temperature true triaxial compression. Geomech. Geophys. Geo-Energy Geo-Resour. 2024, 10, 162. [Google Scholar] [CrossRef]
- Hu, D.; Hu, Y.; Hu, R.; Tan, Z.; Ni, P.; Chen, Y.; Xiang, X.; Li, Y.; Liu, J. Machine Learning–Finite Element Mesh Optimization-Based Modeling and Prediction of Excavation-Induced Shield Tunnel Ground Settlement. Int. J. Comput. Methods 2024, 22, 2450066. [Google Scholar] [CrossRef]
- Yin, Q.; Xin, T.; Zhenggang, H.; Minghua, H. Measurement and Analysis of Deformation of Underlying Tunnel Induced by Foundation Pit Excavation. Adv. Civ. Eng. 2023, 2023, 8897139. [Google Scholar] [CrossRef]
- Li, D.; Nie, J.; Wang, H.; Yu, T.; Kuang, K.S.C. Path planning and topology-aided acoustic emission damage localization in high-strength bolt connections of bridges. Eng. Struct. 2025, 332, 120103. [Google Scholar] [CrossRef]
- Li, D.; Chen, Q.; Wang, H.; Shen, P.; Li, Z.; He, W. Deep learning-based acoustic emission data clustering for crack evaluation of welded joints in field bridges. Autom. Constr. 2024, 165, 105540. [Google Scholar] [CrossRef]
- Li, Z.; Nie, L.; Xue, Y.; Li, W.; Fan, K. Model Testing on the Processes, Characteristics, and Mechanism of Water Inrush Induced by Karst Caves Ahead and Alongside a Tunnel. Rock Mech. Rock Eng. 2025, 58, 5363–5380. [Google Scholar] [CrossRef]
- Li, Y.; Weng, X.; Hu, D.; Tan, Z.; Qi, K.; Liu, J. Data-Driven Deep-Learning Model for Predicting Jacking Force of Rectangular Pipe Jacking Tunnel. J. Comput. Civ. Eng. 2025, 39, 4025017. [Google Scholar] [CrossRef]
- Cao, D.; Zeng, L.; Gomez-Rivas, E.; Gong, L.; Liu, G.; Lu, G.; Bons, P.D. Correction of linear fracture density and error analysis using underground borehole data. J. Struct. Geol. 2024, 184, 105152. [Google Scholar] [CrossRef]
- Xu, D.; Zhao, Y.; Liu, H.; Zhu, H. Deformation Monitoring of Metro Tunnel with a New Ultrasonic-Based System. Sensors 2017, 17, 1758. [Google Scholar] [CrossRef]
- Meng, W.; Xin, L.; Jinshuai, S.; Weiwei, L.; Zhongzheng, F.; Shuai, W.; Jiaxu, K.; Wenguang, Y. A study on the reasonable width of narrow coal pillars in the section of hard primary roof hewing along the air excavation roadway. Energy Sci. Eng. 2024, 12, 2746–2765. [Google Scholar] [CrossRef]
- Wang, M.; Kang, J.; Liu, W.; Li, M.; Su, J.; Fang, Z.; Li, X.; Shang, L.; Zhang, F.; Guo, C. Design and study of mine silo drainage method based on fuzzy control and Avoiding Peak Filling Valley strategy. Sci. Rep. 2024, 14, 9300. [Google Scholar] [CrossRef]
- Wang, M.; Su, J.; Qin, H.; Shang, L.; Kang, J.; Liu, W.; Li, M.; Zhang, F.; Li, X.; Fang, Z. Research on Active Advanced Support Technology of Backfilling and Mining Face. Rock. Mech. Rock. Eng. 2024, 57, 7623–7642. [Google Scholar] [CrossRef]
- Wang, J.; Zhang, Y.; Wang, K.; Li, L.; Cheng, S.; Sun, S. Development of similar materials with different tension-compression ratios and evaluation of TBM excavation. Bull. Eng. Geol. Environ. 2024, 83, 190. [Google Scholar] [CrossRef]
- Zou, B.; Chen, Y.; Bao, Y.; Liu, Z.; Hu, B.; Ma, J.; Kuang, G.; Tang, C.; Sun, H.; Zaheer, Q.; et al. Impact of tunneling parameters on disc cutter wear during rock breaking in transient conditions. Wear 2025, 560–561, 205620. [Google Scholar] [CrossRef]
- Zou, B.; Yin, J.; Liu, Z.; Long, X. Transient rock breaking characteristics by successive impact of shield disc cutters under confining pressure conditions. Tunn. Undergr. Space Technol. 2024, 150, 105861. [Google Scholar] [CrossRef]
- Niu, Q.; Hu, M.; Chang, J.; Wang, W.; Yuan, W.; Wang, Q.; Zheng, Y.; Shang, S. Explosive fracturing mechanism in low-permeability sandstone-type uranium deposits considering different acidification reactions. Energy 2024, 312, 133676. [Google Scholar] [CrossRef]
- Fang, T.; Ren, F.; Wang, B.; Hou, J.; Wiercigroch, M. Multi-scale mechanics of submerged particle impact drilling. Int. J. Mech. Sci. 2025, 285, 109838. [Google Scholar] [CrossRef]
- Ding, C.; Guo, X.; Xiao, C.; Sui, Z.; Yang, Y. Experimental Study on the Influence of Blast Hole Bottom Cushion Medium on Blasting Damage Characteristics and Strain Evolution of Rock Mass. Rock. Mech. Rock. Eng. 2025, 58, 1895–1909. [Google Scholar] [CrossRef]
- Niu, Q.; Wang, J.; He, J.; Yuan, W.; Chang, J.; Wang, W.; Yuan, J.; Wang, Q.; Zheng, Y.; Shang, S. Evolution of pore structure, fracture morphology and permeability during CO2+O2 in-situ leaching process of fractured sandstone. Energy 2025, 315, 134348. [Google Scholar] [CrossRef]
- Ren, Q.; Li, L.; Wang, J.; Jiang, R.; Li, M.; Feng, J. Dynamic evolution mechanism of the fracturing fracture system—Enlightenments from hydraulic fracturing physical experiments and finite element numerical simulation. Pet. Sci. 2024, 21, 3839–3866. [Google Scholar] [CrossRef]
- Chang, J.; Thewes, M.; Zhang, D.; Huang, H.; Lin, W. Deformational behaviors of existing three-line tunnels induced by under-crossing of three-line mechanized tunnels: A case study. Can. Geotech. J. 2025, 62, 1–21. [Google Scholar] [CrossRef]
- Li, L.; Jin, H.; Tu, W.; Zhou, Z. Study on the minimum safe thickness of water inrush prevention in karst tunnel under the coupling effect of blasting power and water pressure. Tunn. Undergr. Space Technol. 2024, 153, 105994. [Google Scholar] [CrossRef]
- Zhou, Y.; Xia, C.; Shi, Z.; Lu, G.; Liu, L.; Liu, M. Progressive Failure of Water-Resistant Stratum in Karst Tunnel Construction Using an Improved Meshfree Method Considering Fluid–Solid Interaction. Buildings 2024, 14, 3140. [Google Scholar] [CrossRef]
- Sun, F.; Fang, Q.; Li, P.; Pan, R.; Zhu, X. Research on the Water Inrush Mechanism and Grouting Reinforcement of a Weathered Trough in a Submarine Tunnel. Buildings 2024, 14, 2432. [Google Scholar] [CrossRef]
- Guo, Y.; Li, S.; Mao, S.; Song, Q.; Zheng, L.; Yan, H.; Li, X.; Niu, Y. Study on Catastrophic Evolution Law of Water and Mud Inrush in Water-Rich Fault Fracture Zone of Deep Buried Tunnel. Buildings 2024, 14, 2220. [Google Scholar] [CrossRef]
- Lu, G.; Ma, Y.; Zhang, Q.; Wang, J.; Du, L.; Hao, G. Research on Tunnel Boring Machine Tunnel Water Disaster Detection and Radar Echo Signal Processing. Buildings 2024, 14, 1737. [Google Scholar] [CrossRef]
| Disclaimer/Publisher’s Note: The statements, opinions and data contained in all publications are solely those of the individual author(s) and contributor(s) and not of MDPI and/or the editor(s). MDPI and/or the editor(s) disclaim responsibility for any injury to people or property resulting from any ideas, methods, instructions or products referred to in the content. |
© 2025 by the authors. Licensee MDPI, Basel, Switzerland. This article is an open access article distributed under the terms and conditions of the Creative Commons Attribution (CC BY) license (https://creativecommons.org/licenses/by/4.0/).


 ,
, 


