
The Walkability Evaluation and Optimization Strategies of Metro Station Areas Taking Shanghai as an Example

Abstract
1. Introduction
1.1. Rapid Development of Urban Metro Transport Construction in China
1.2. Walkability of the Environment Connecting to Metro Stations Needs to Be Improved
2. Literature Review
2.1. Walking Environment Around the Metro Station Area
2.2. Walkability Measurement and Quantification
2.3. Walkability Elements
3. Methods
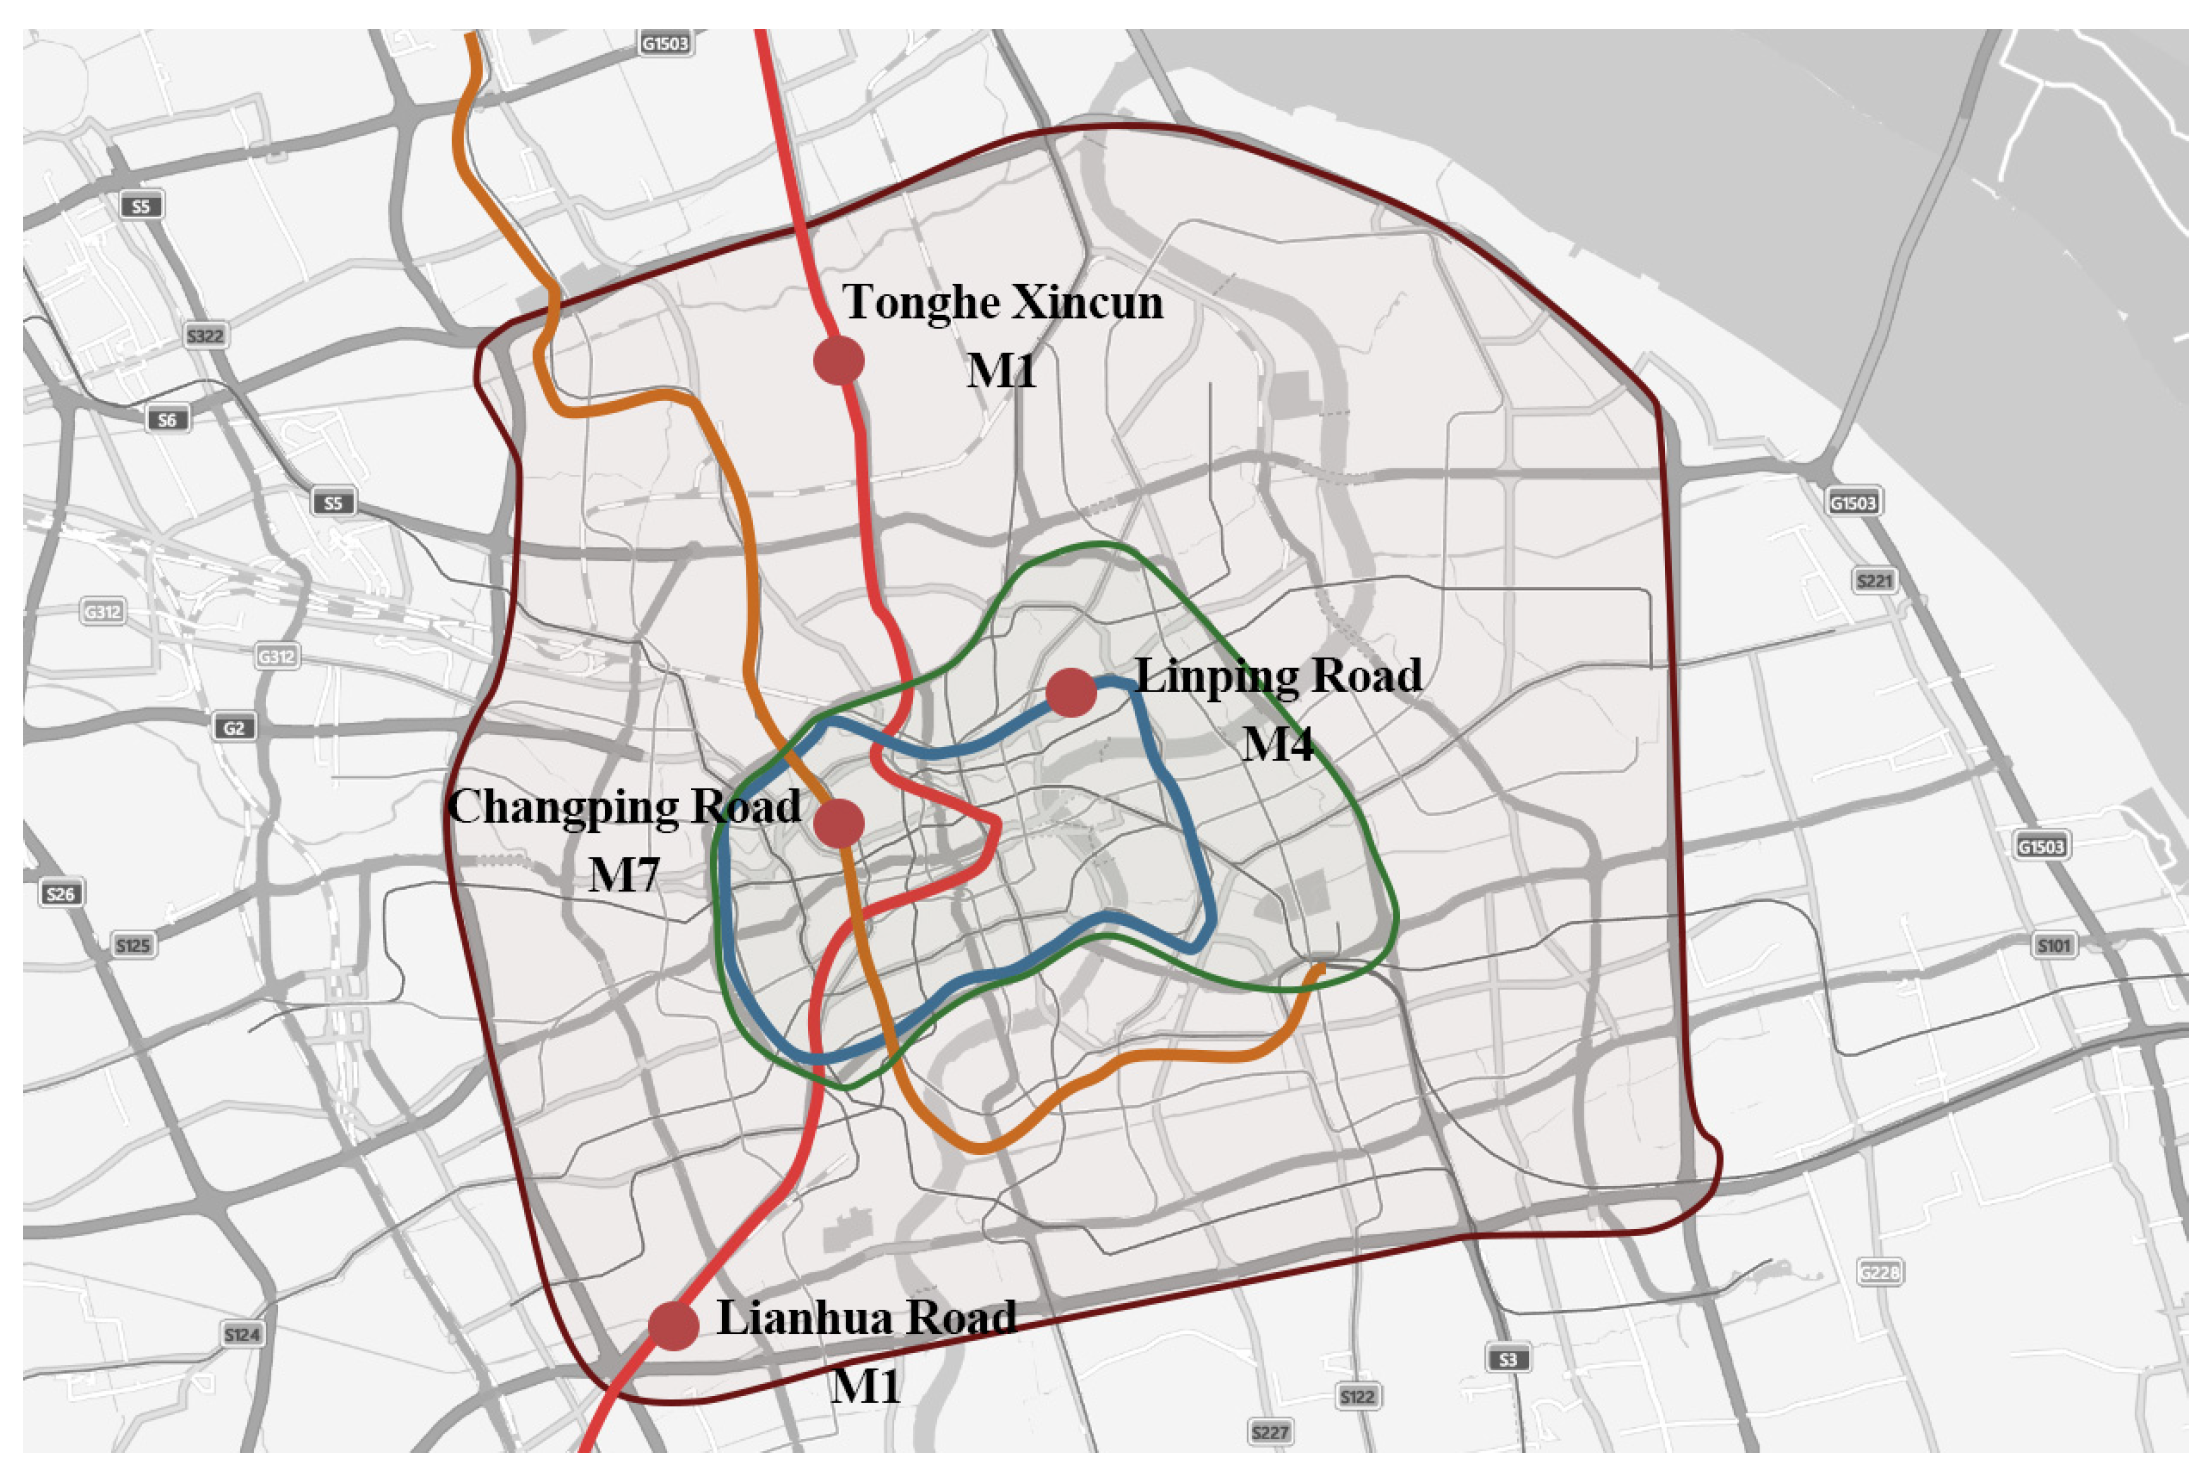
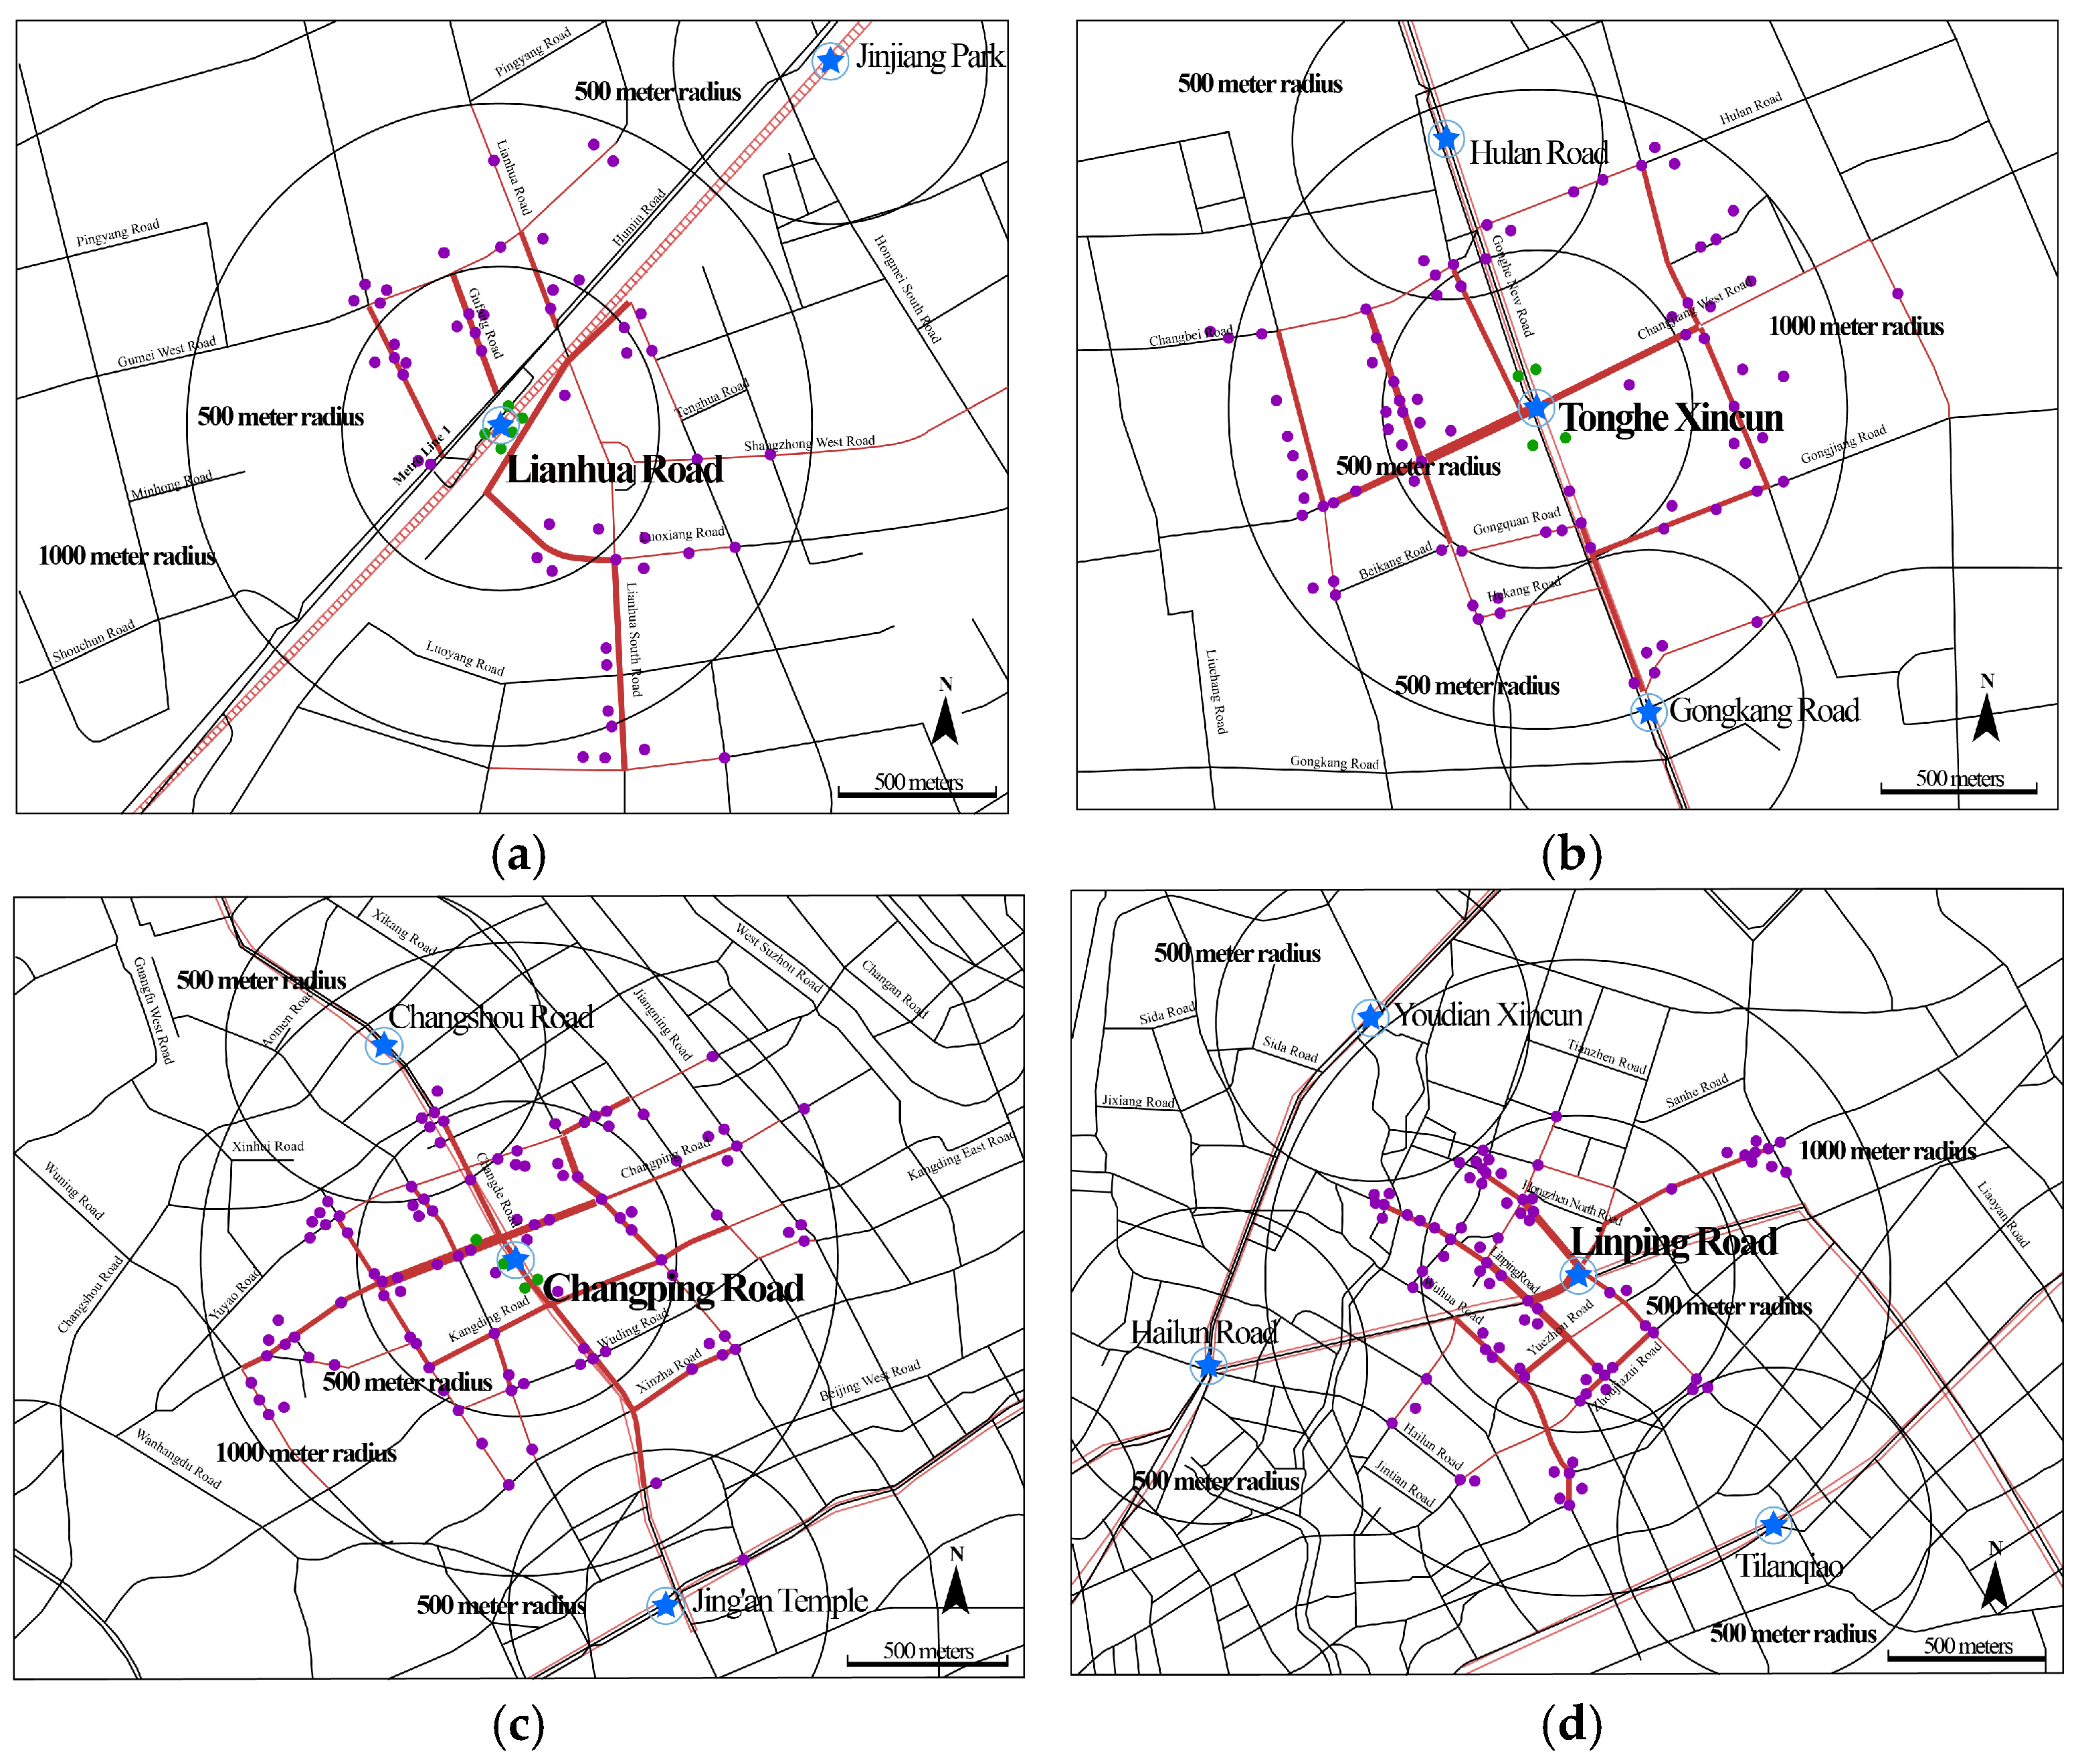
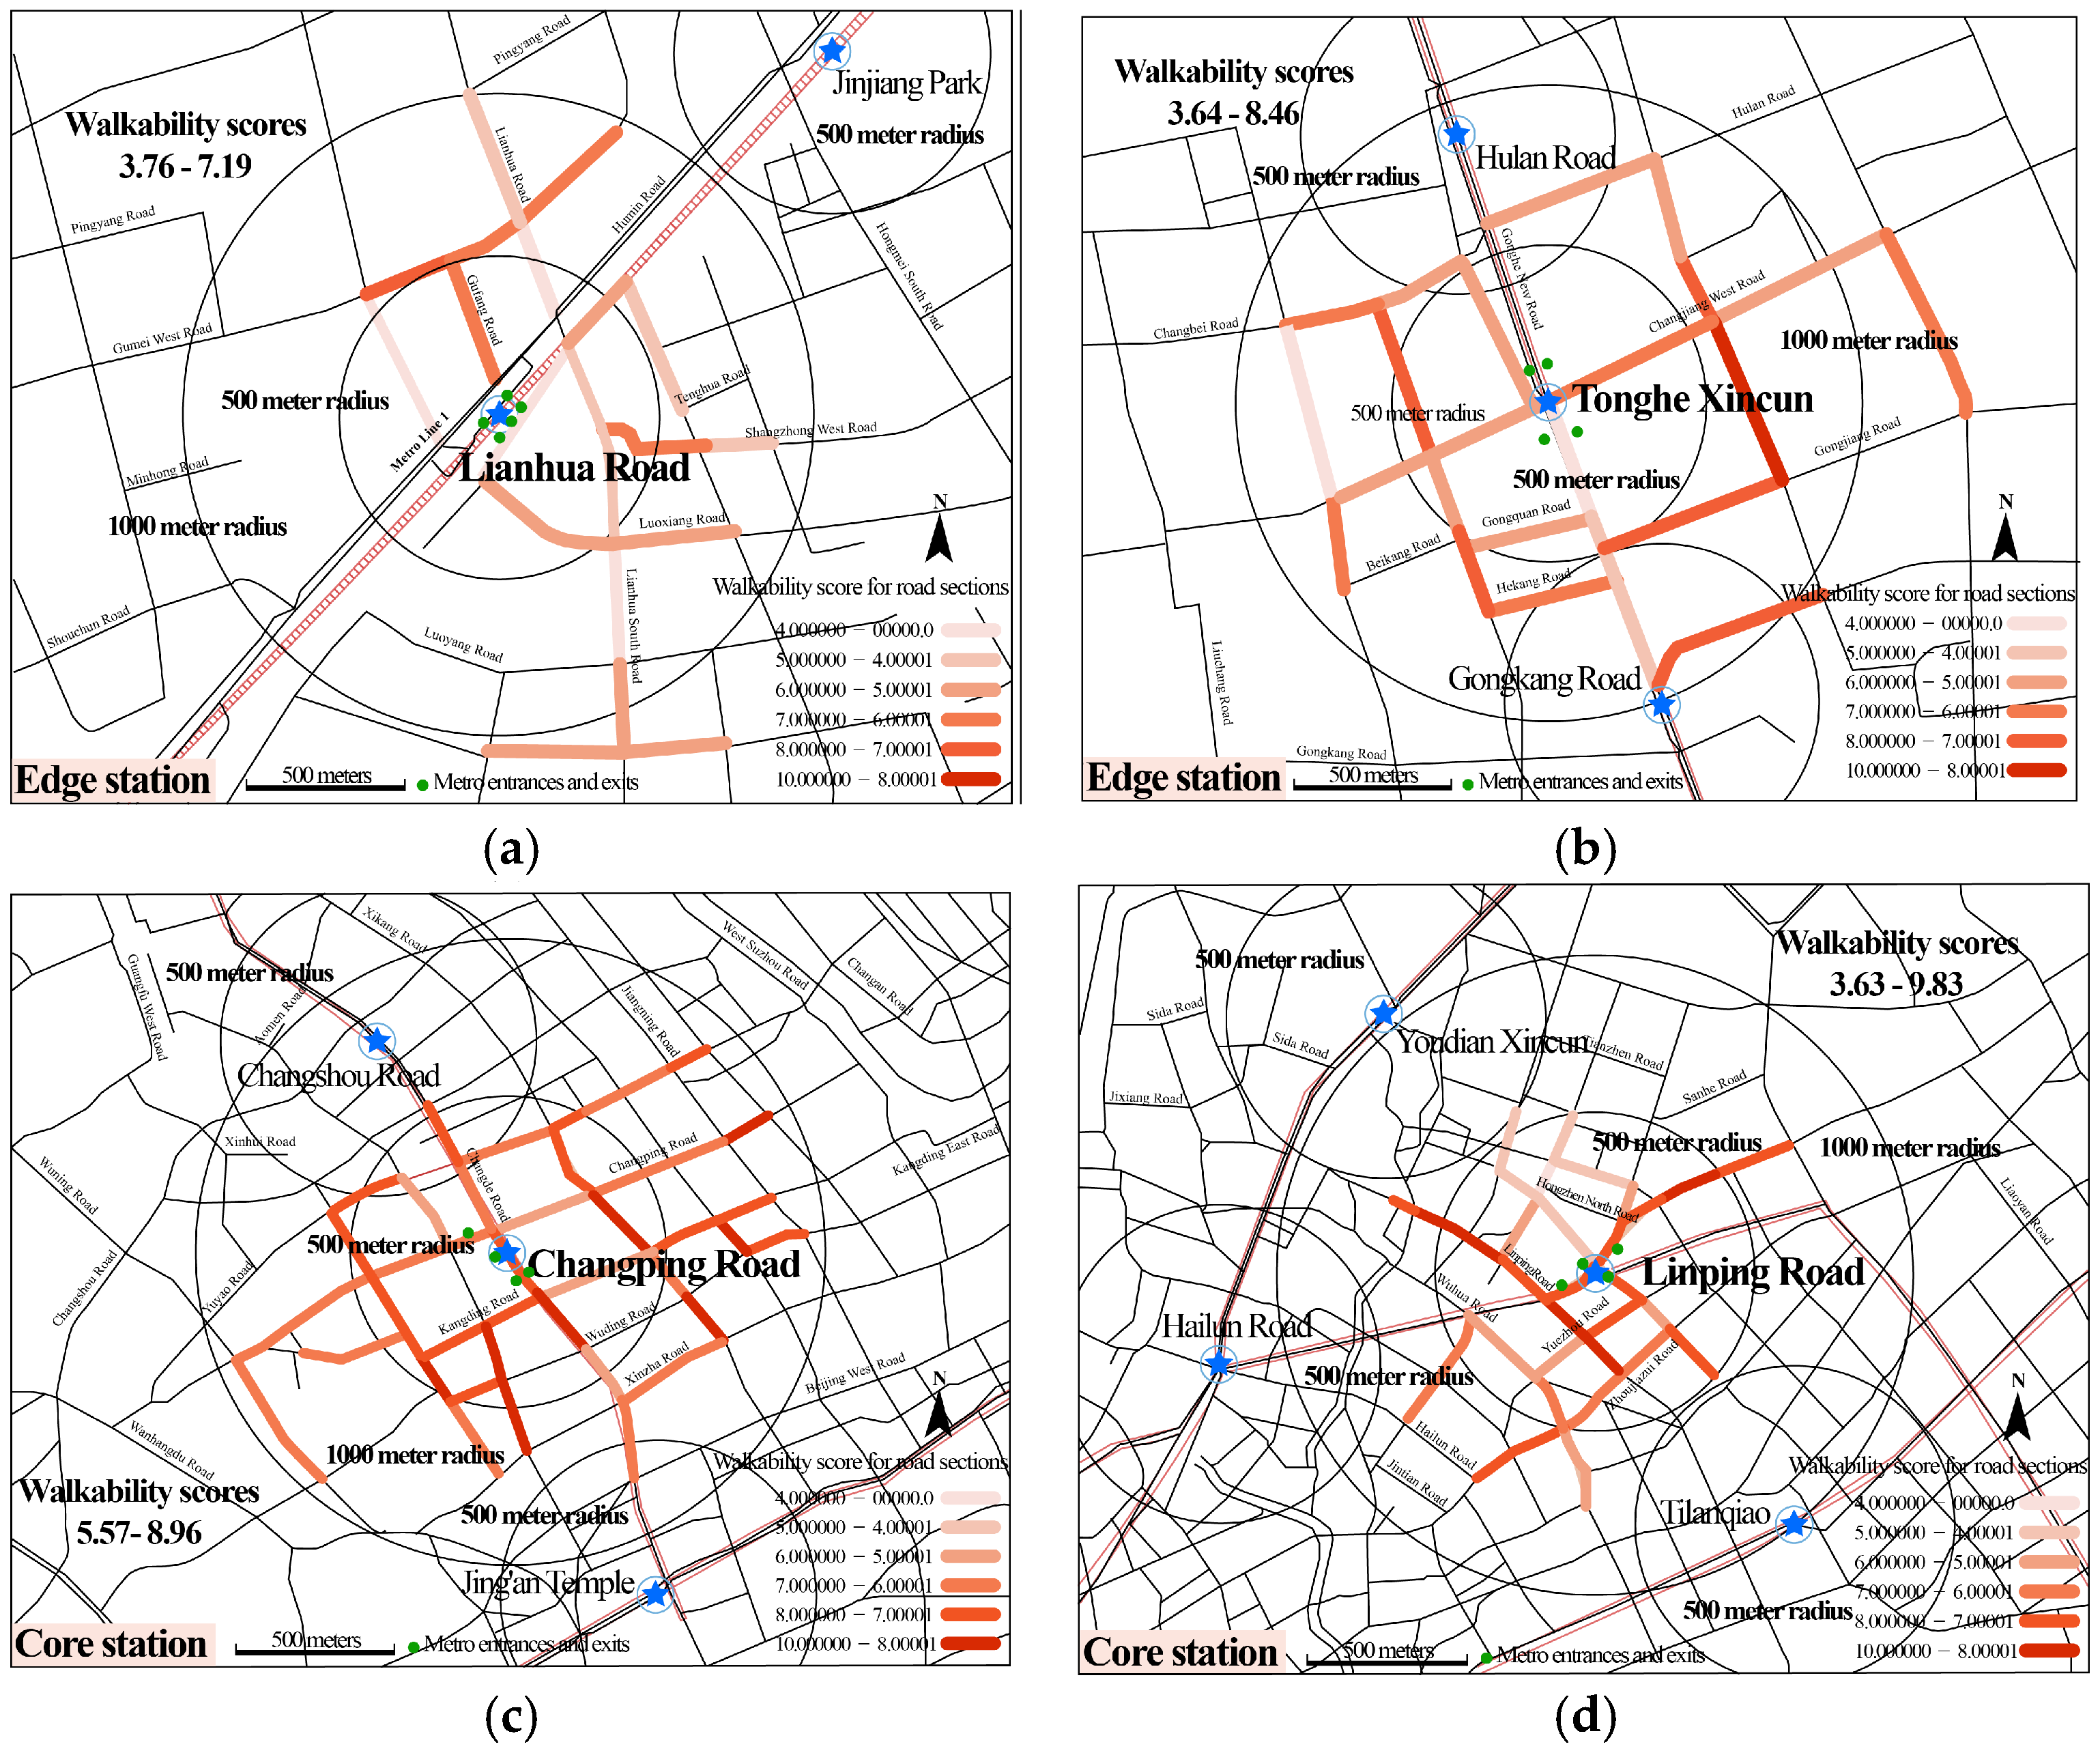
3.1. Study Areas
3.2. Walkability Factor Selection
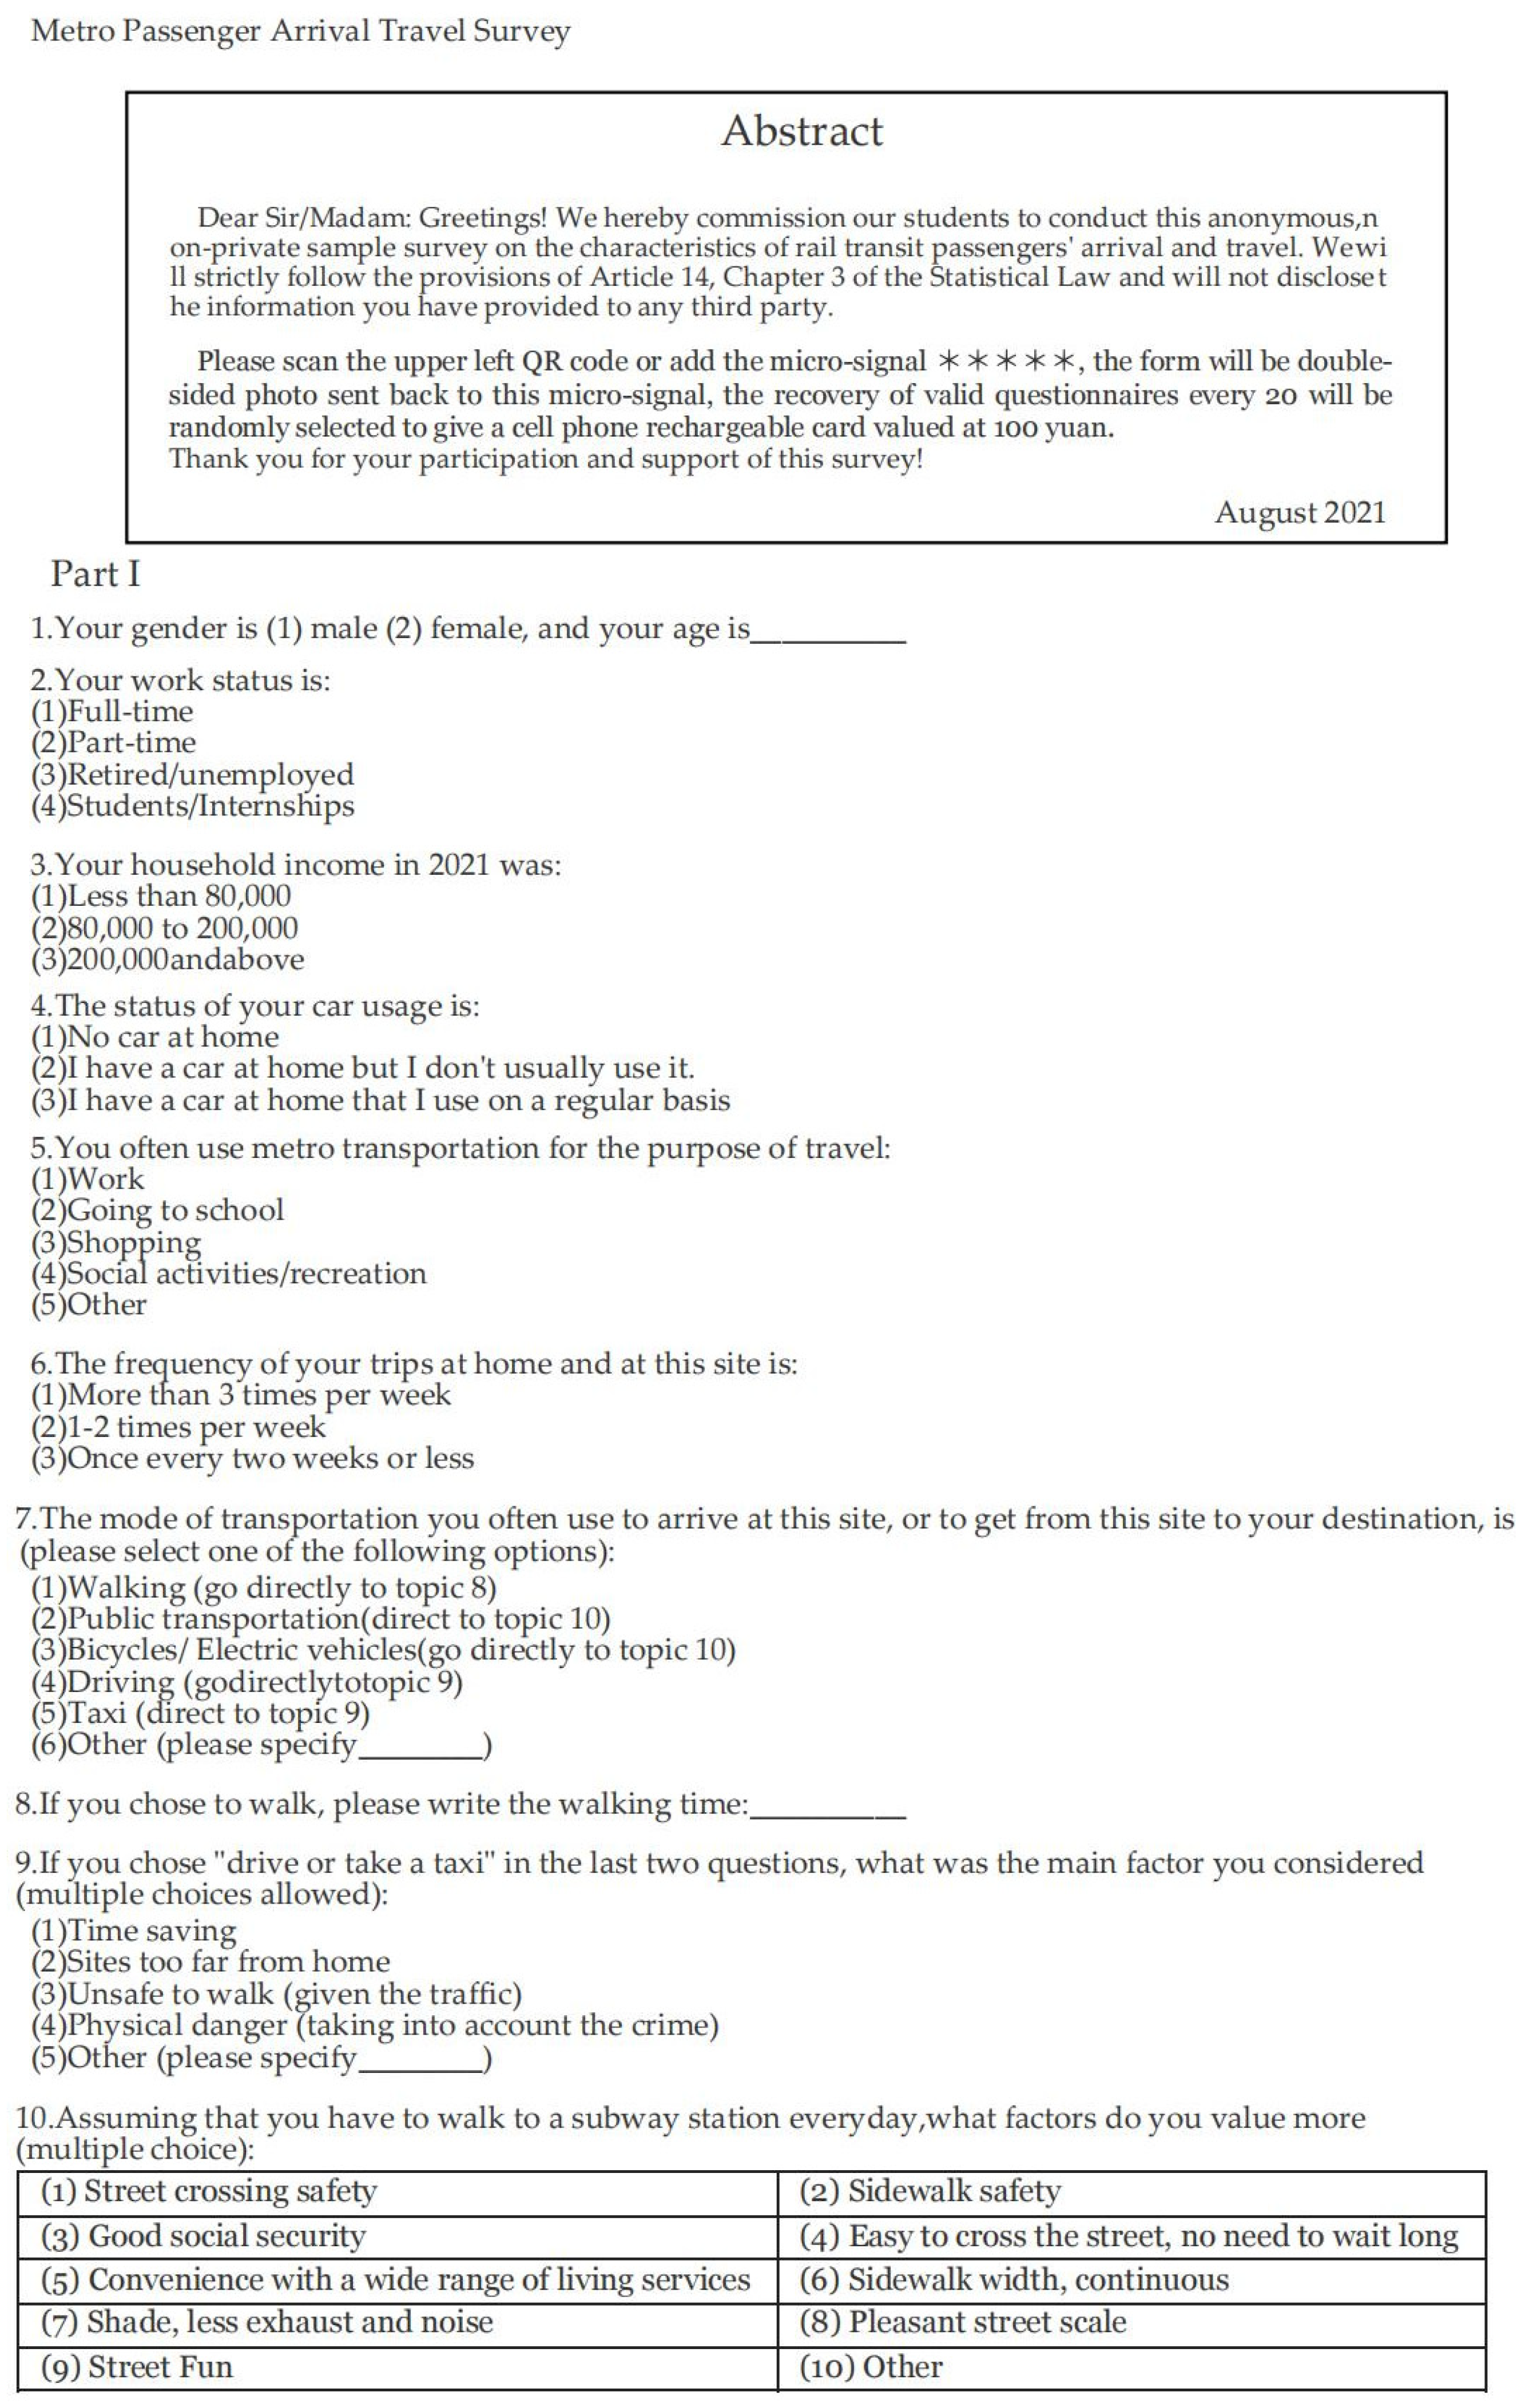
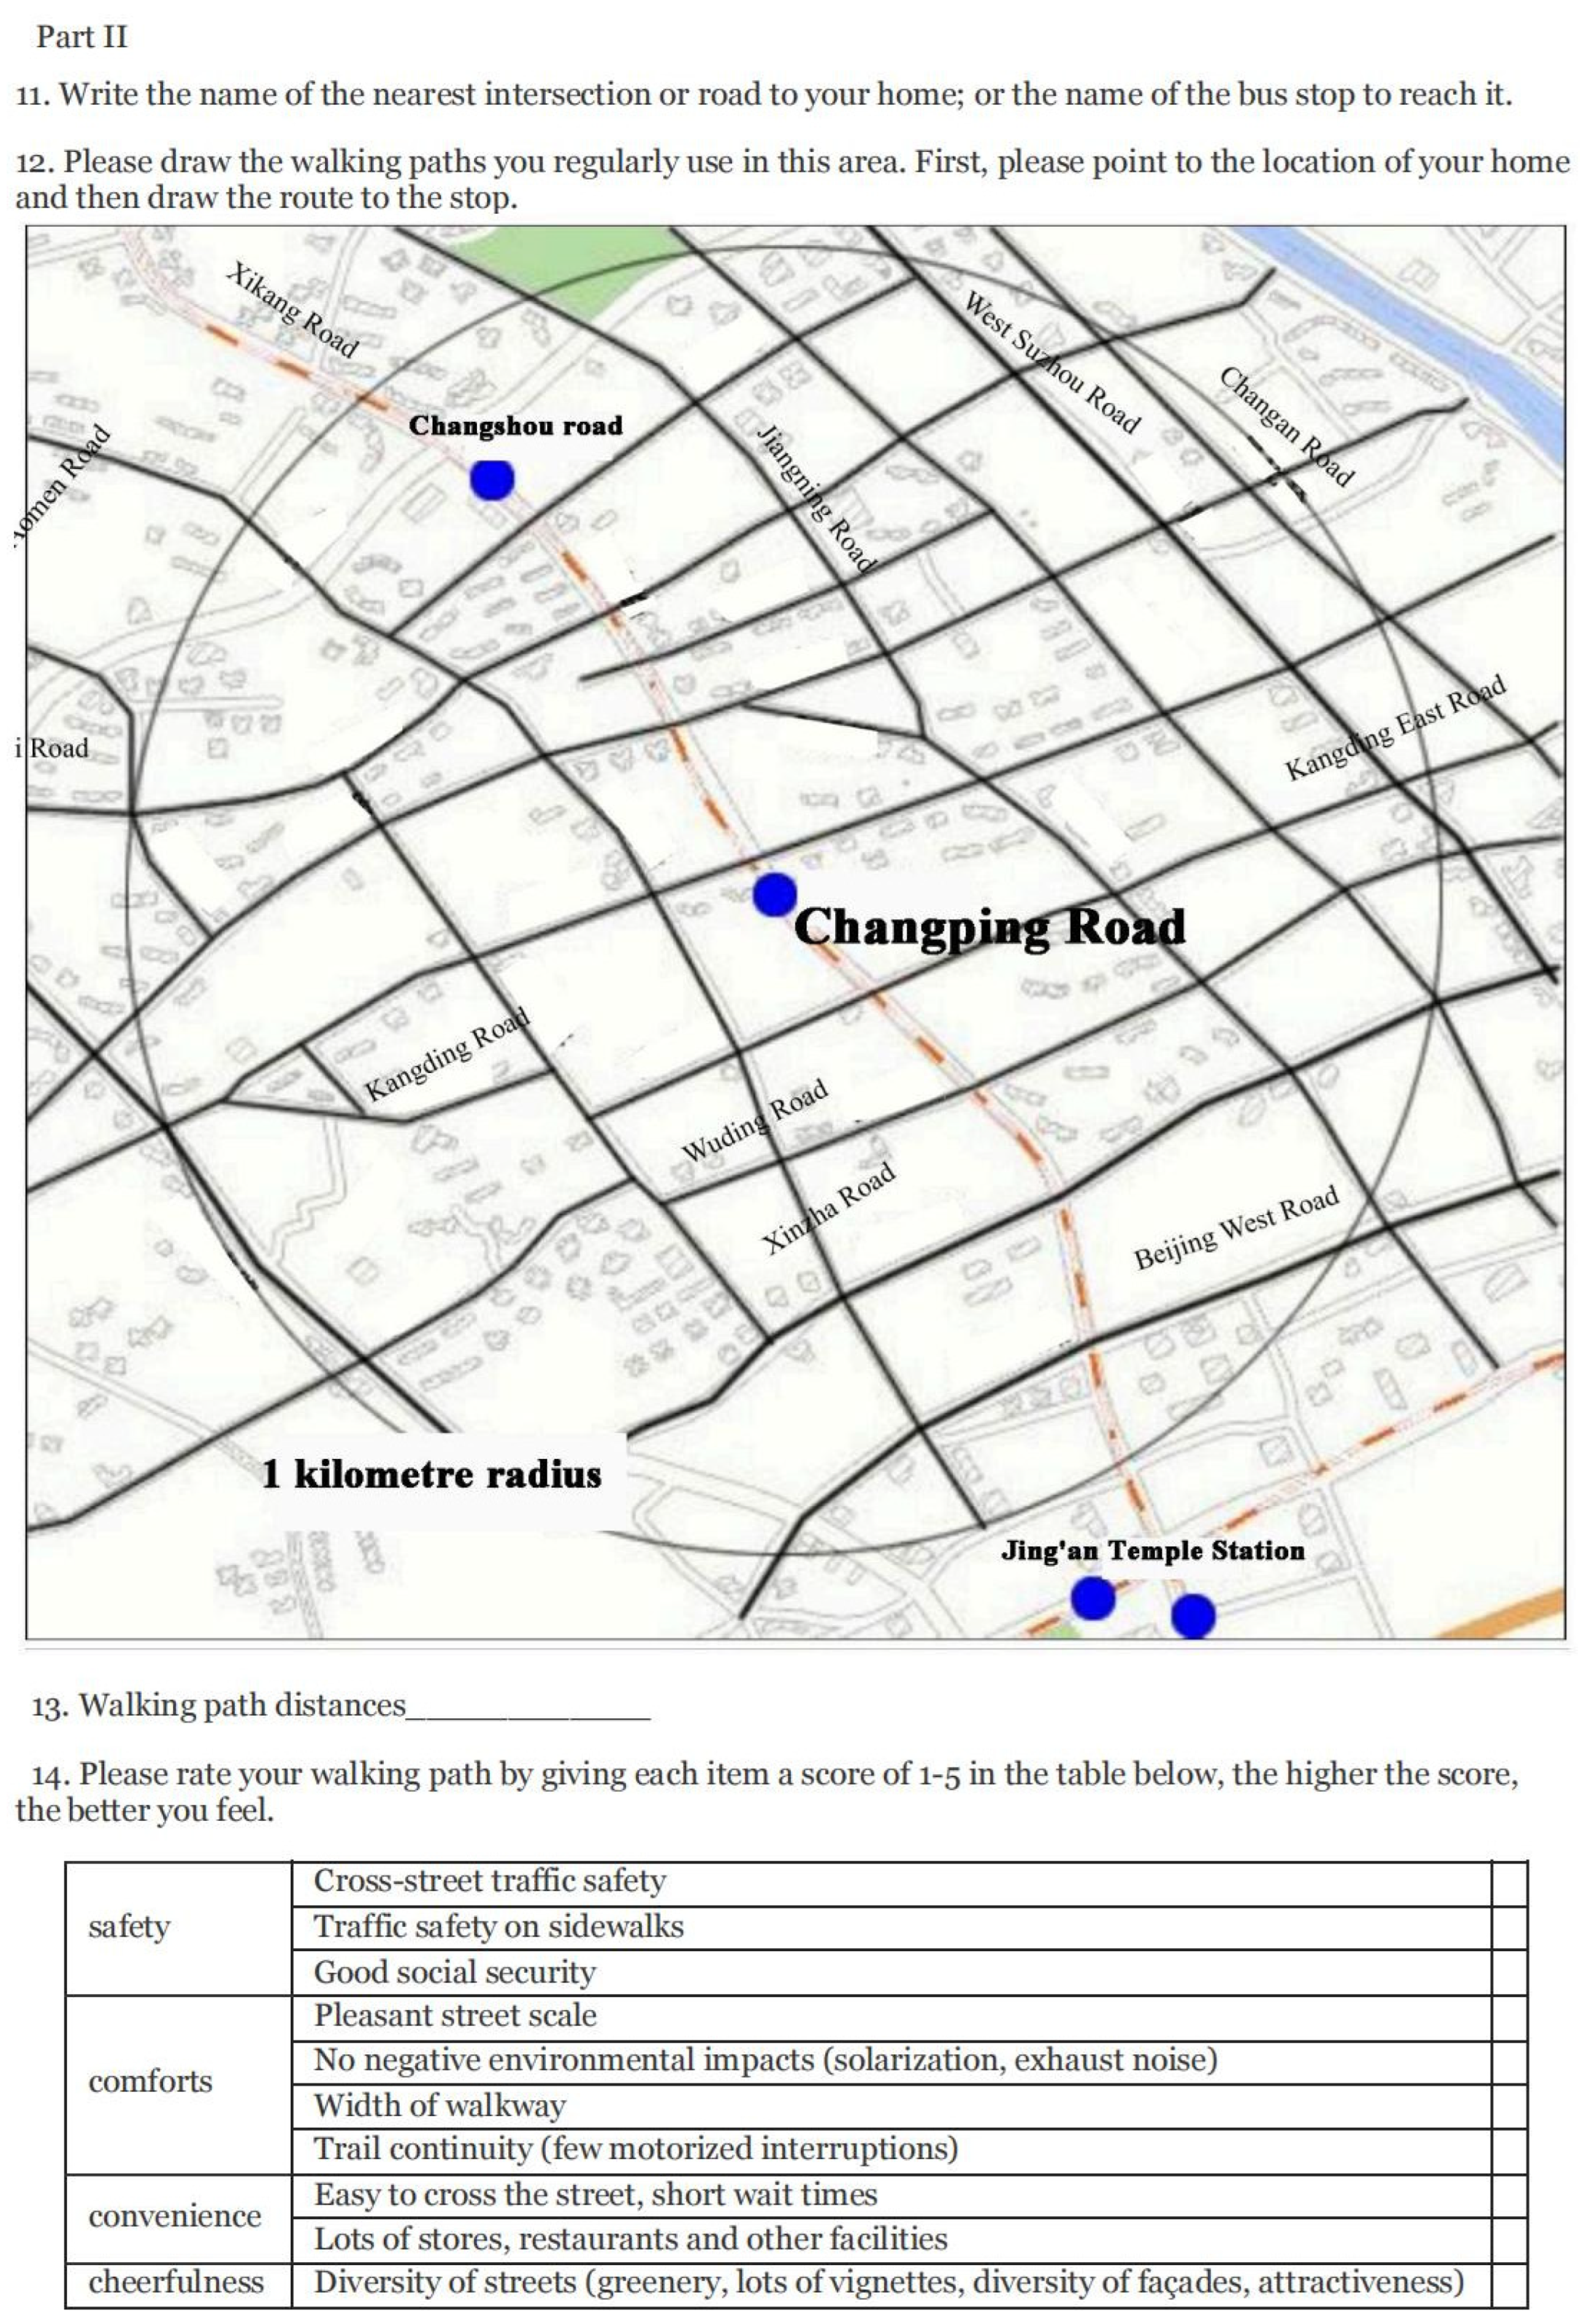
3.3. Passenger Research
3.4. Selection of Walkability Indicators
3.5. Regression Analysis
3.6. Street Survey
4. Result
4.1. Sample Feature Analysis and Walking Passenger Path Selection
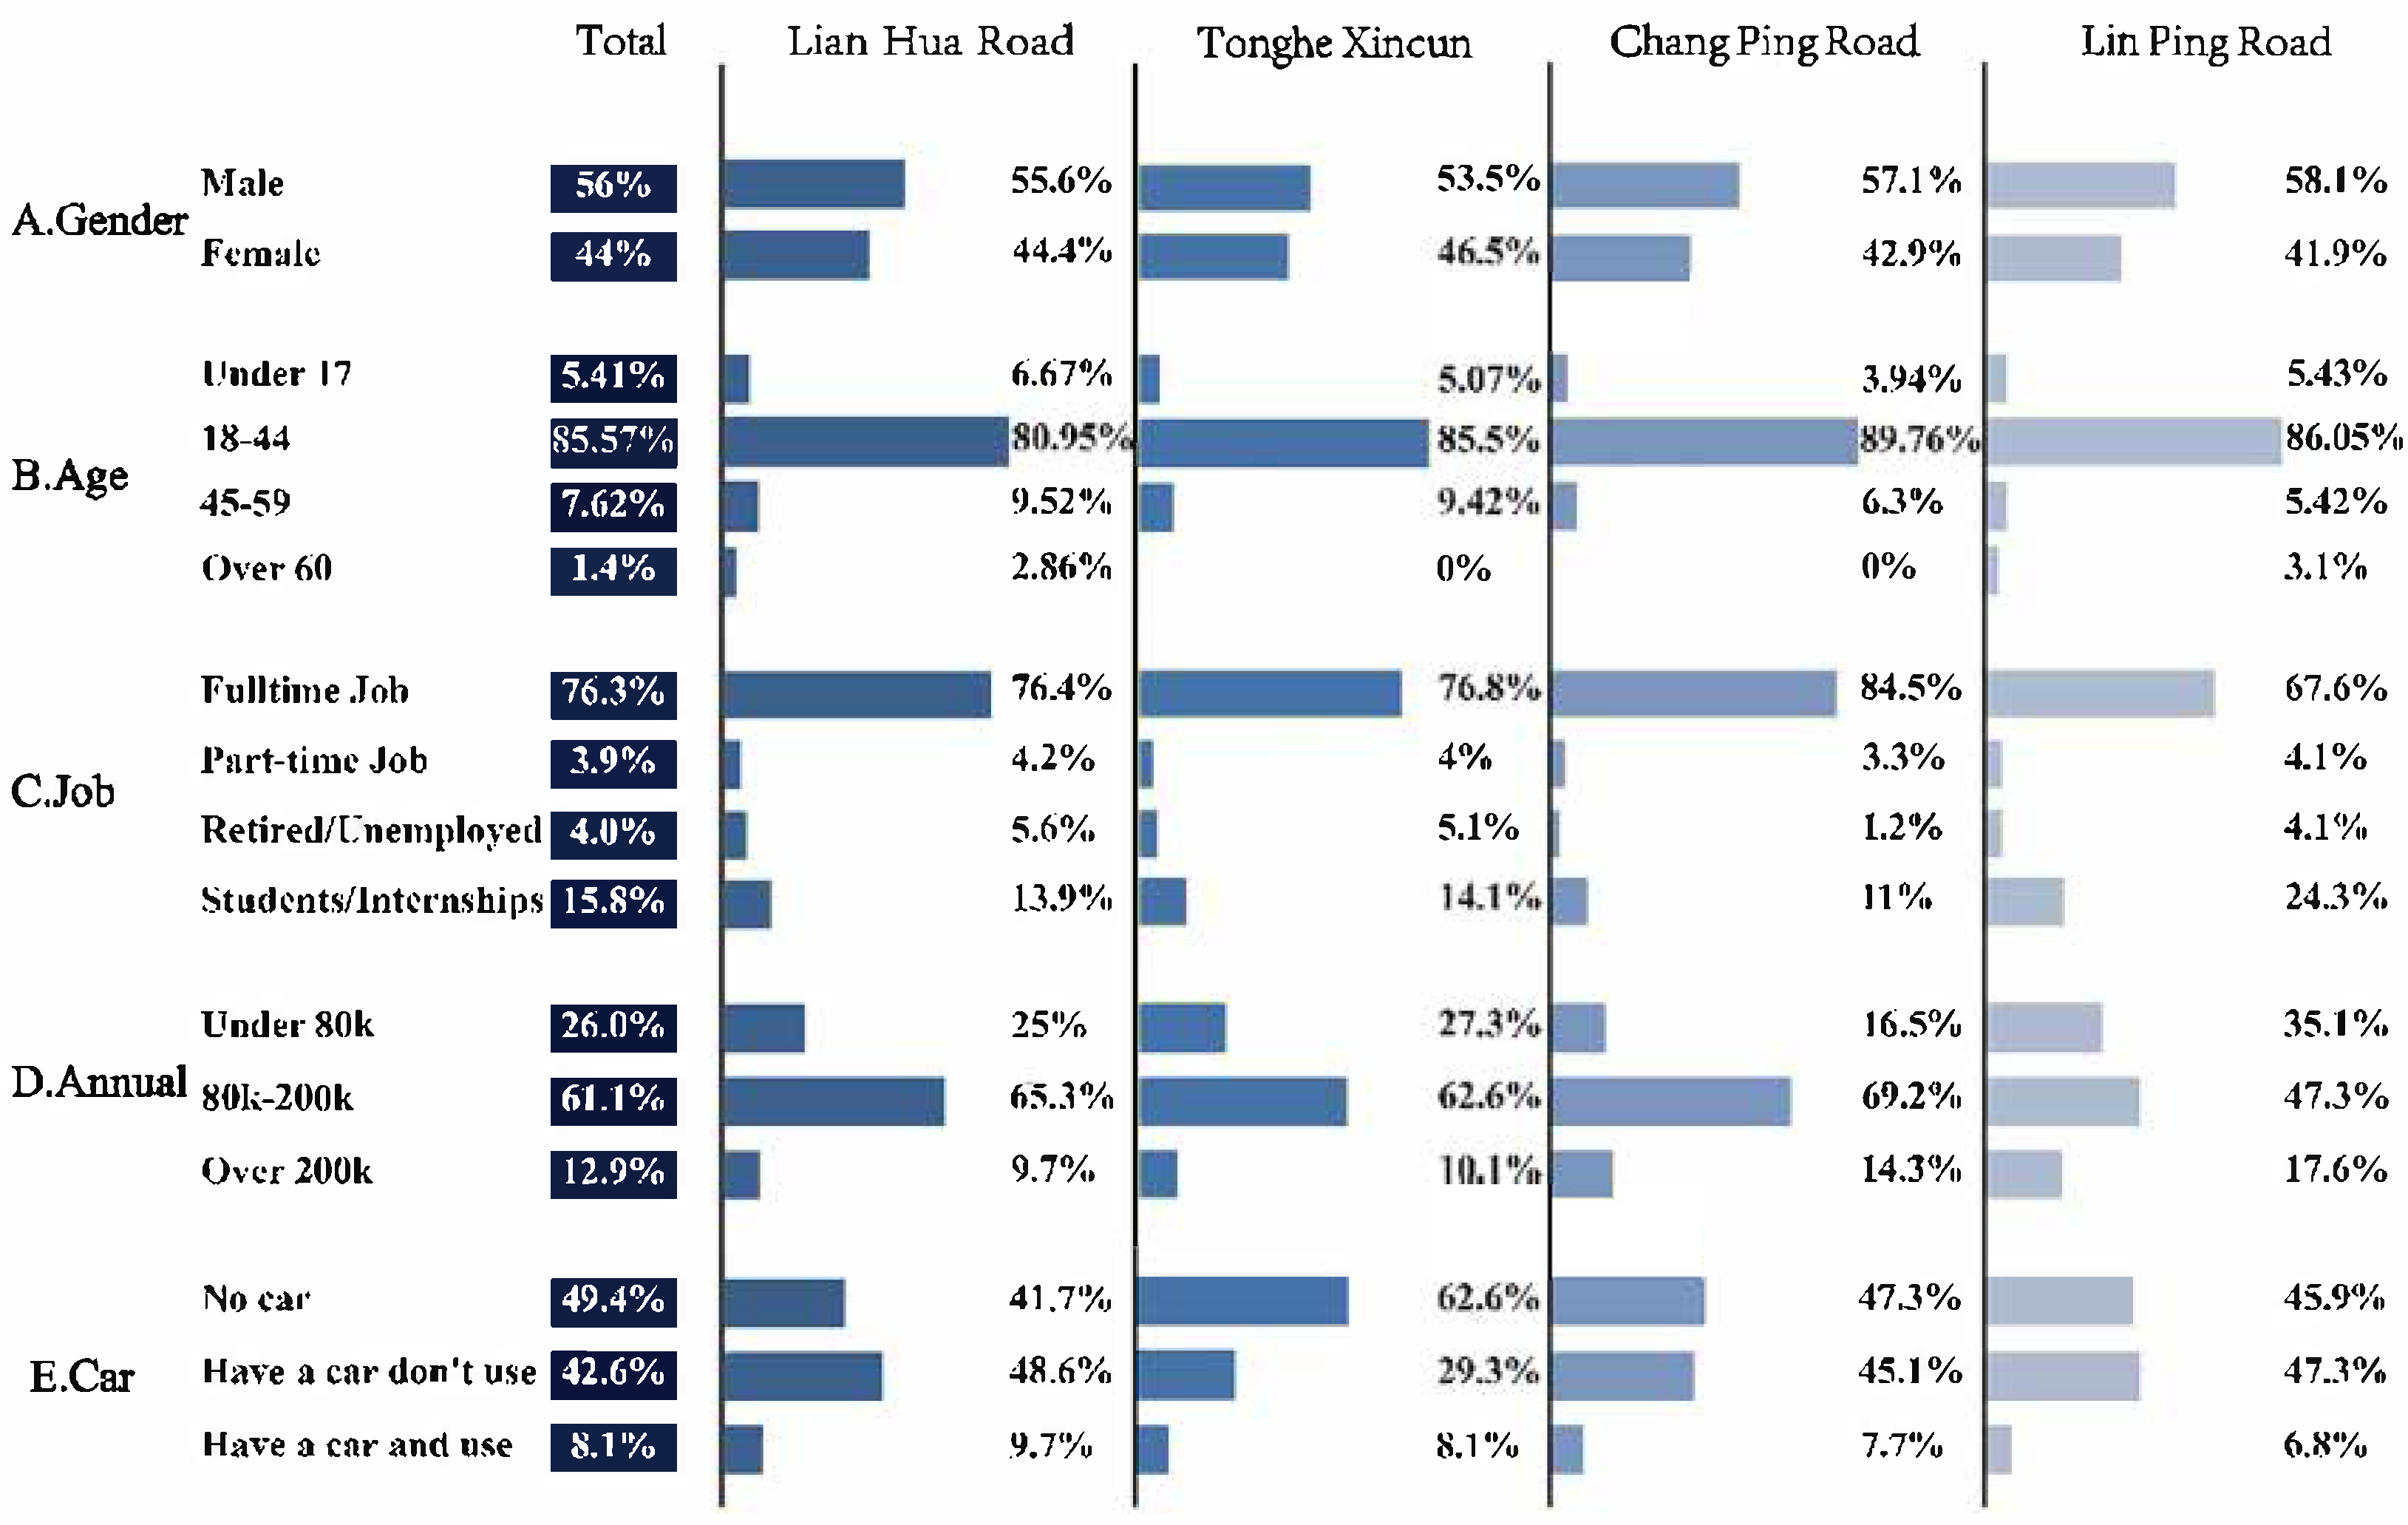
4.1.1. Analysis of the Personal and Travel Characteristics of the Sample Passengers
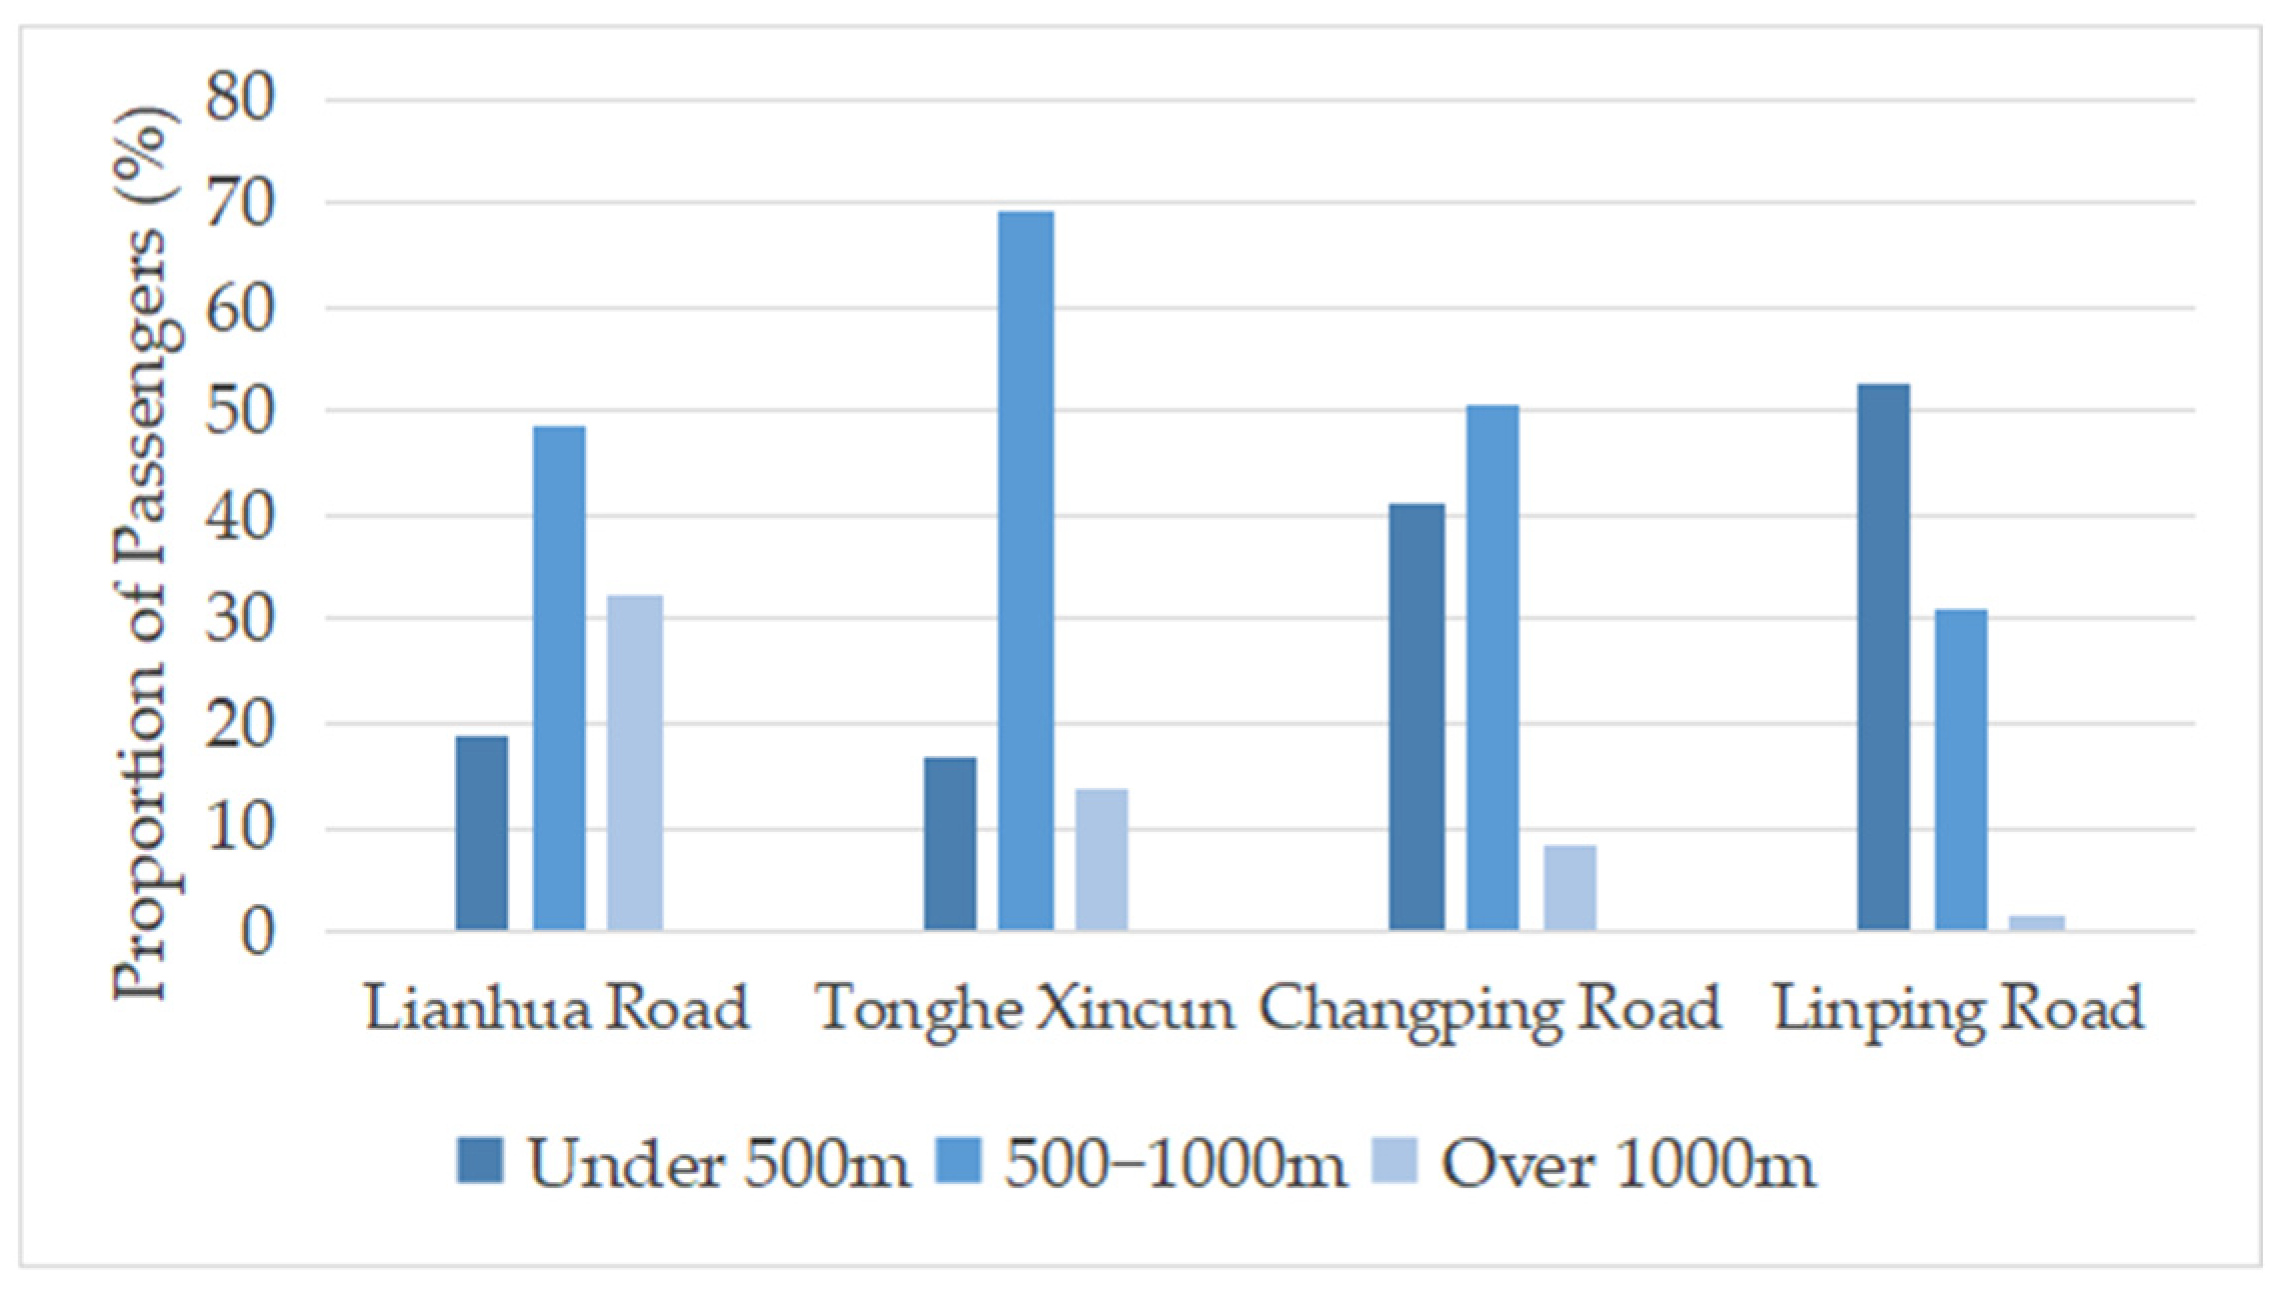
4.1.2. Walking Detour Coefficient for Metro Transit Passengers
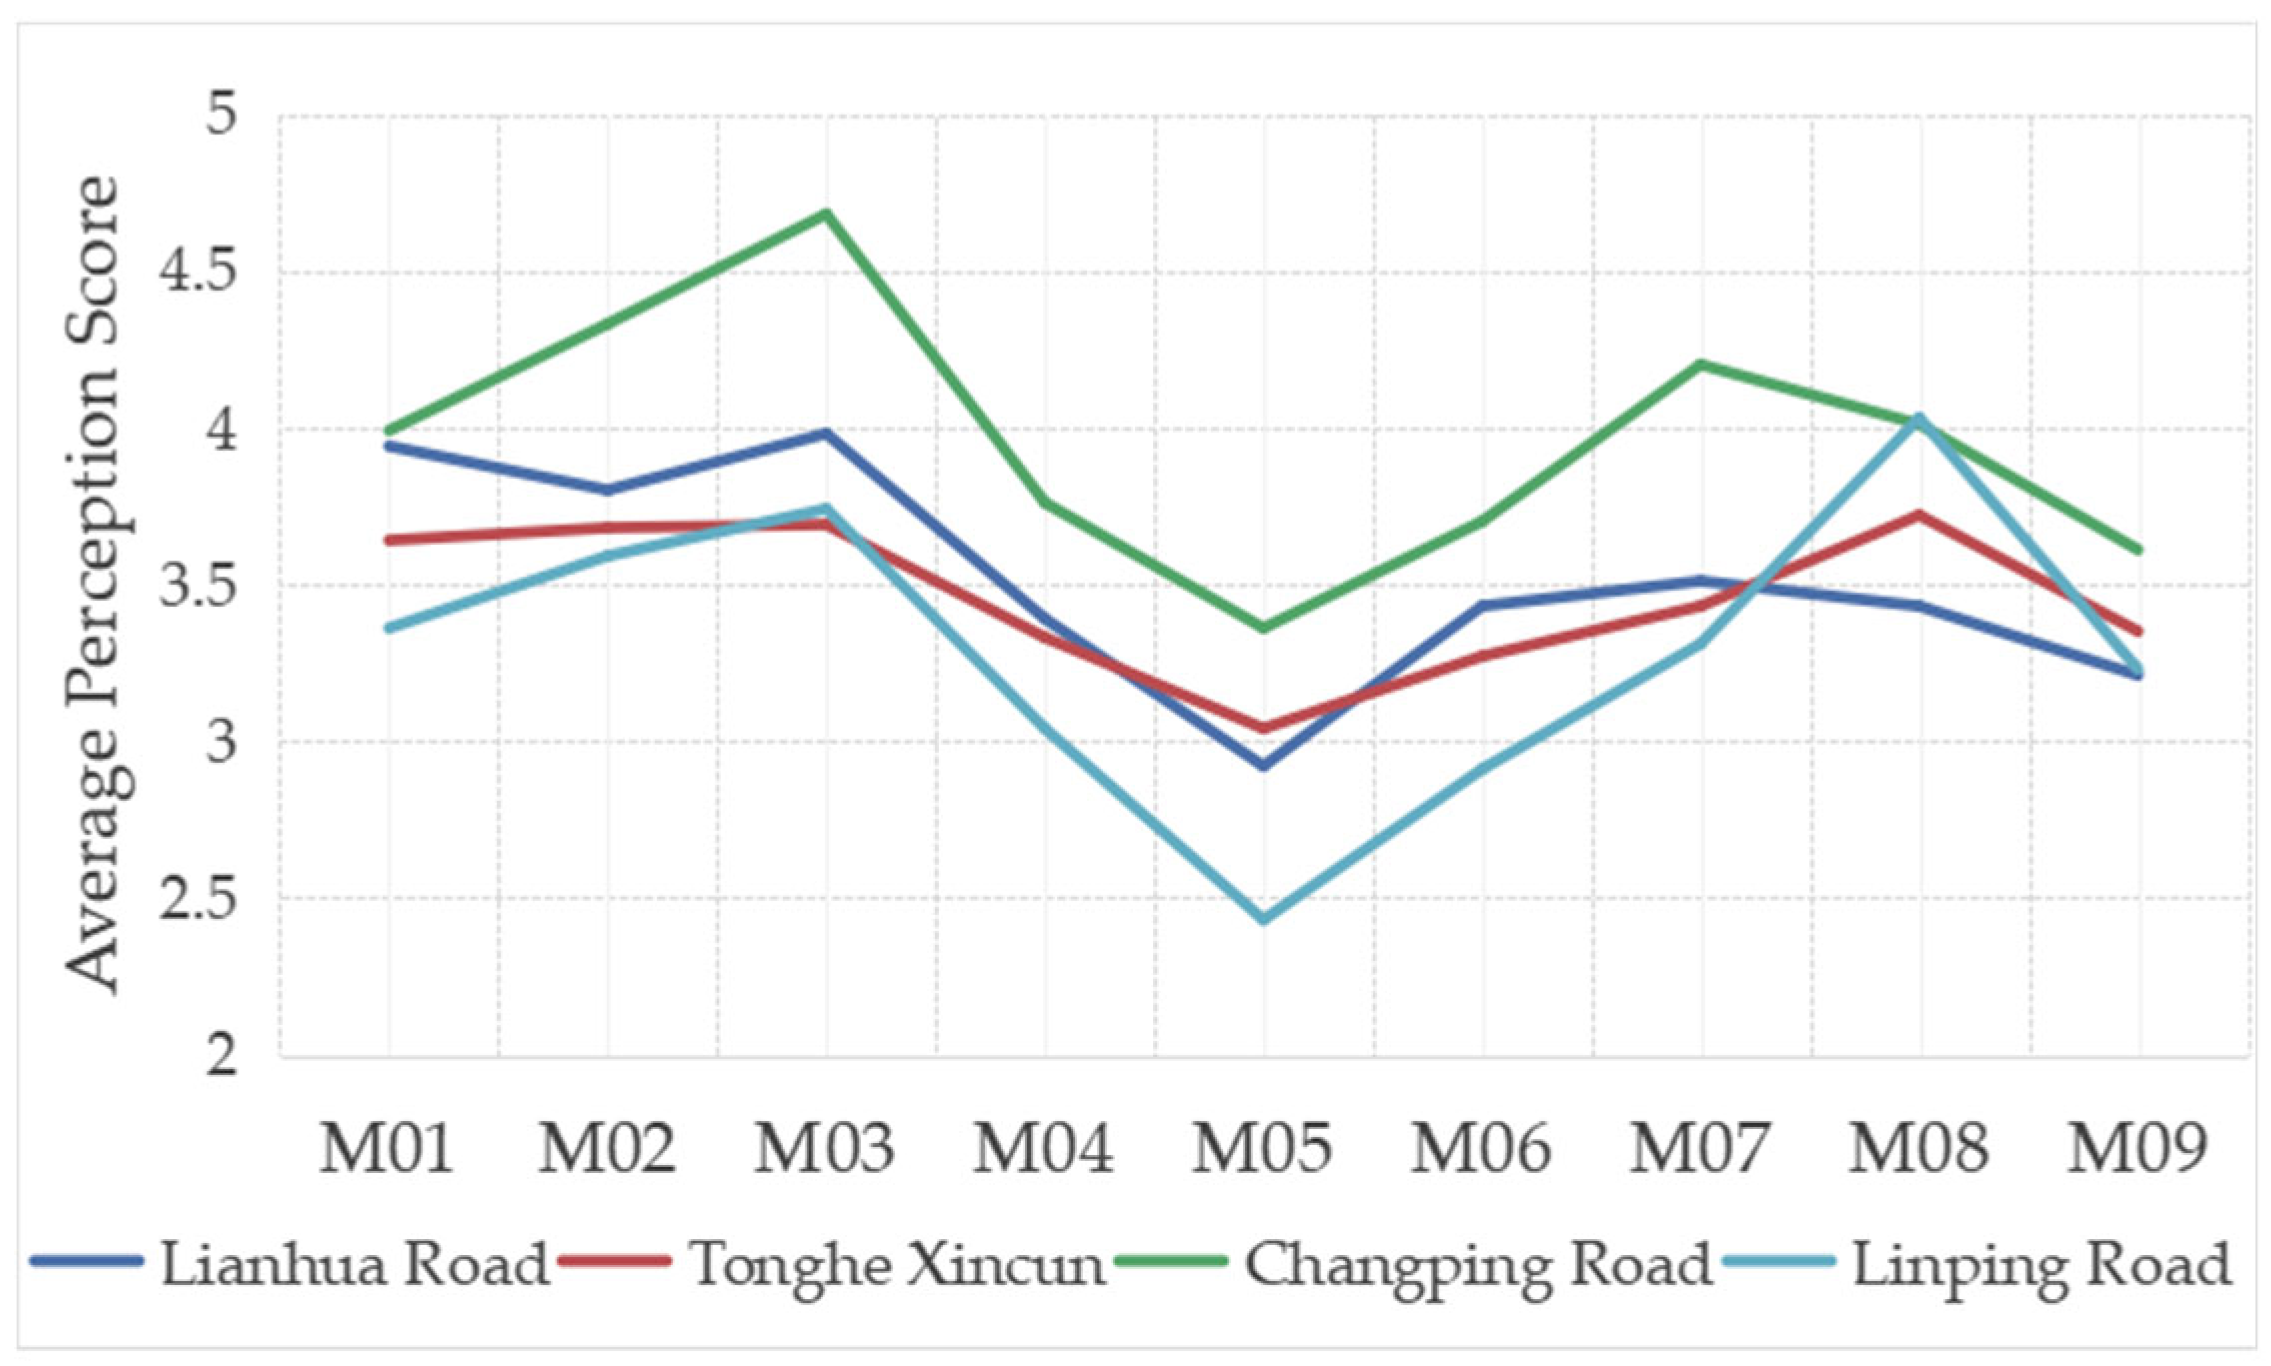
4.1.3. Perception Evaluation of Walking Passengers at Different Stations
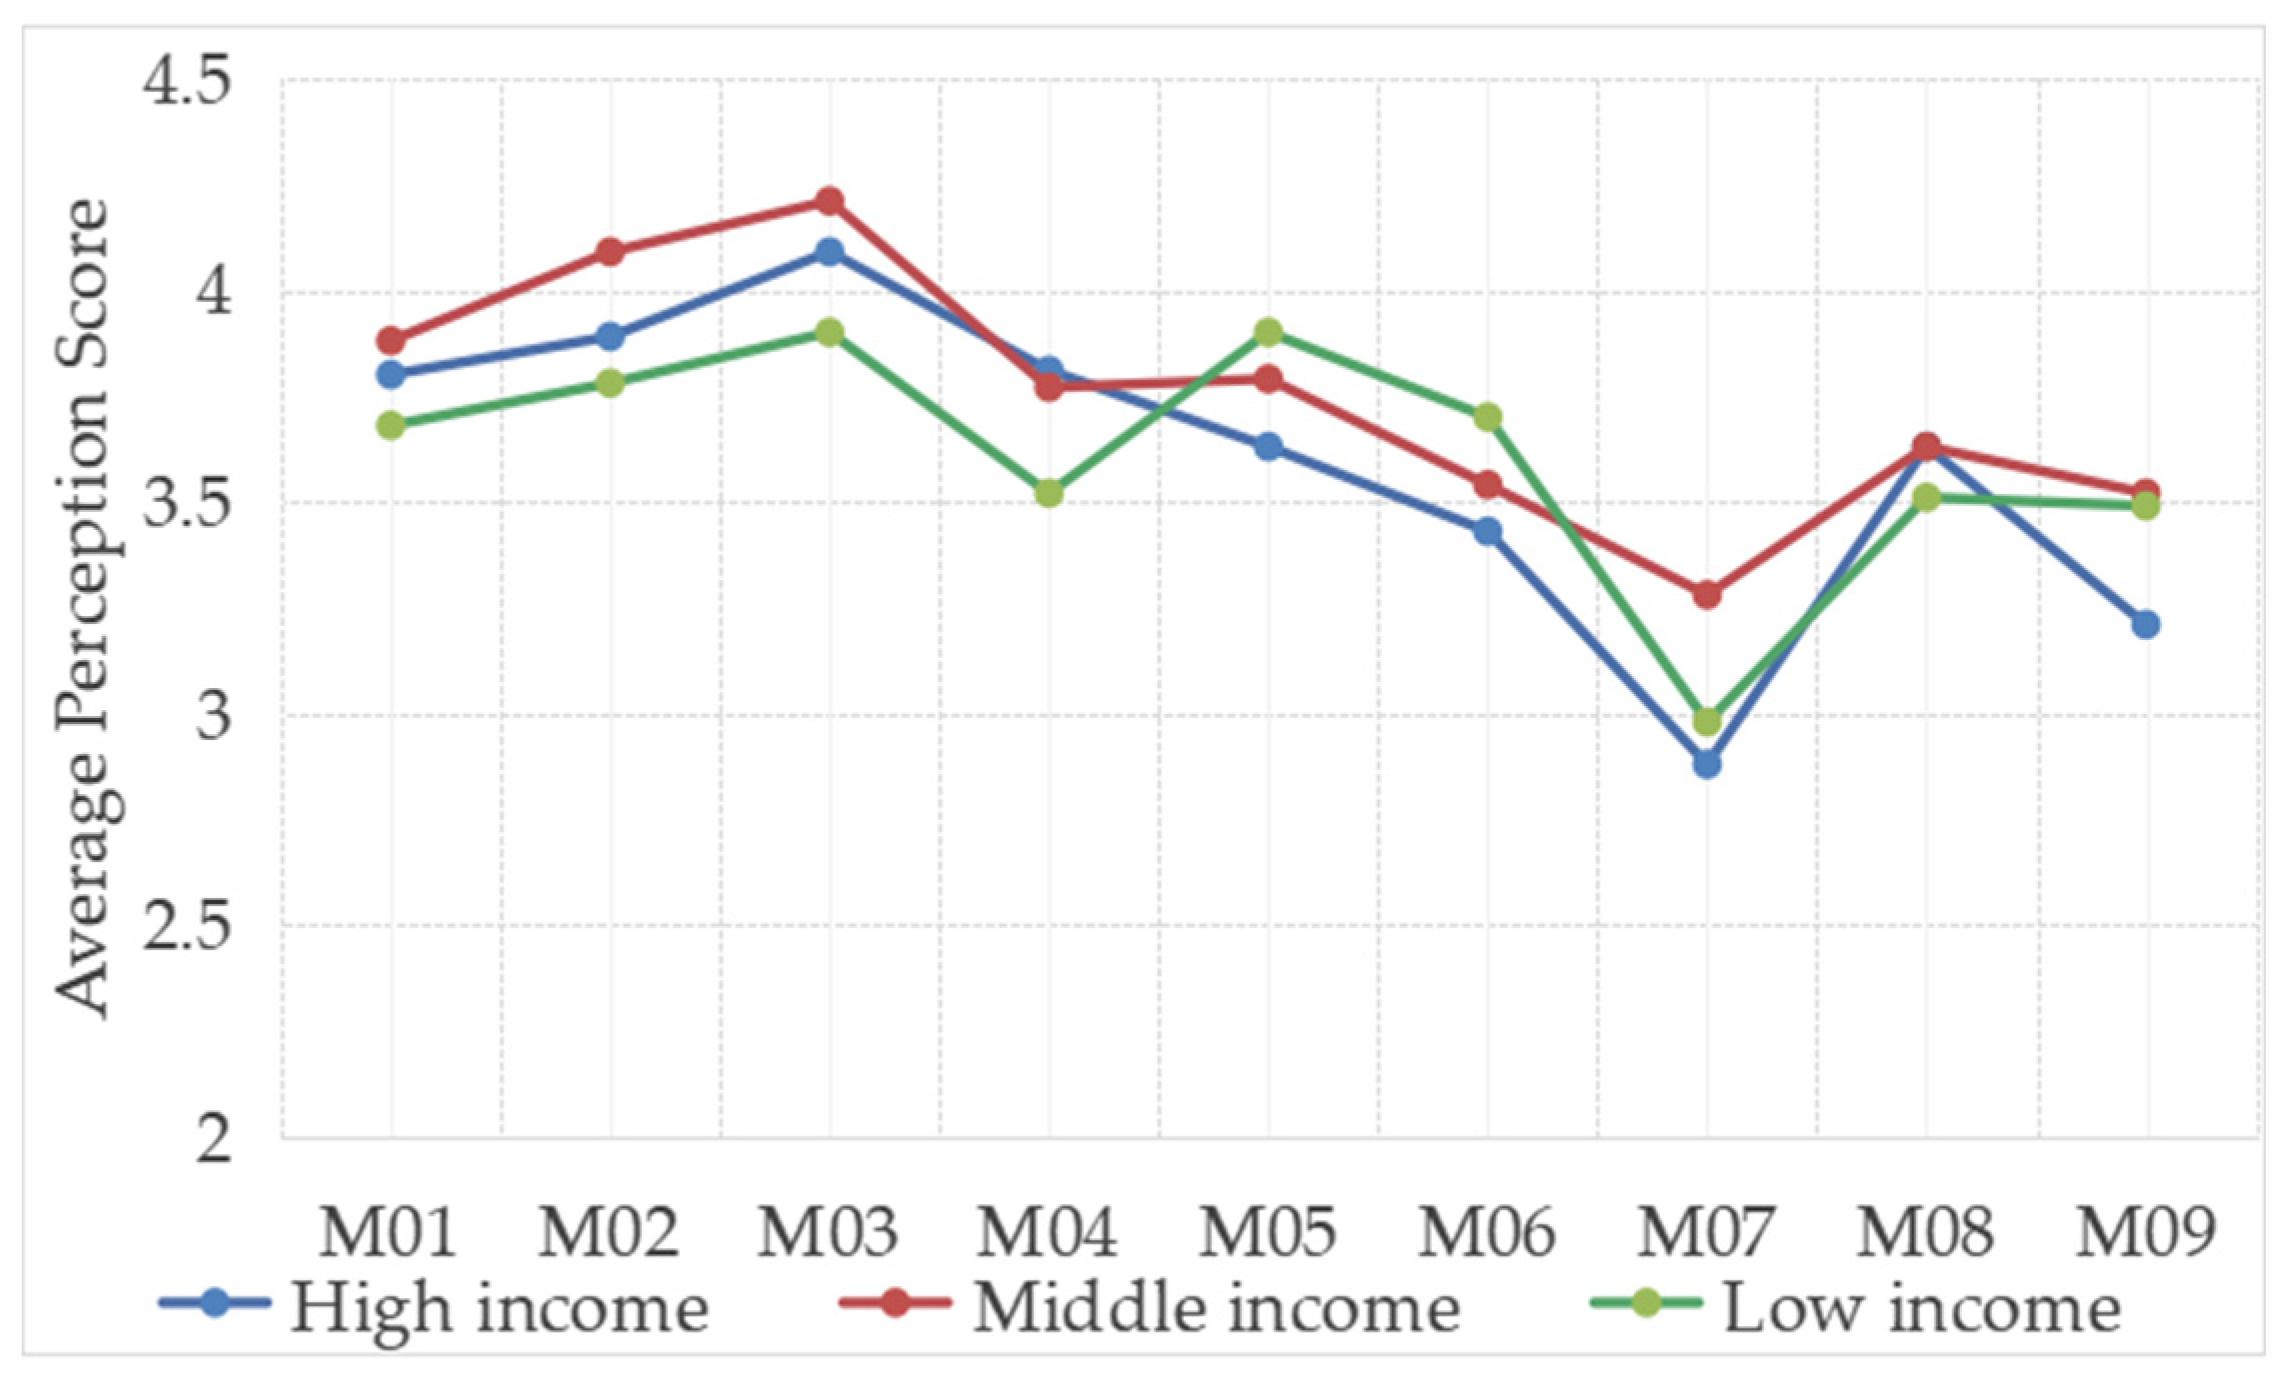
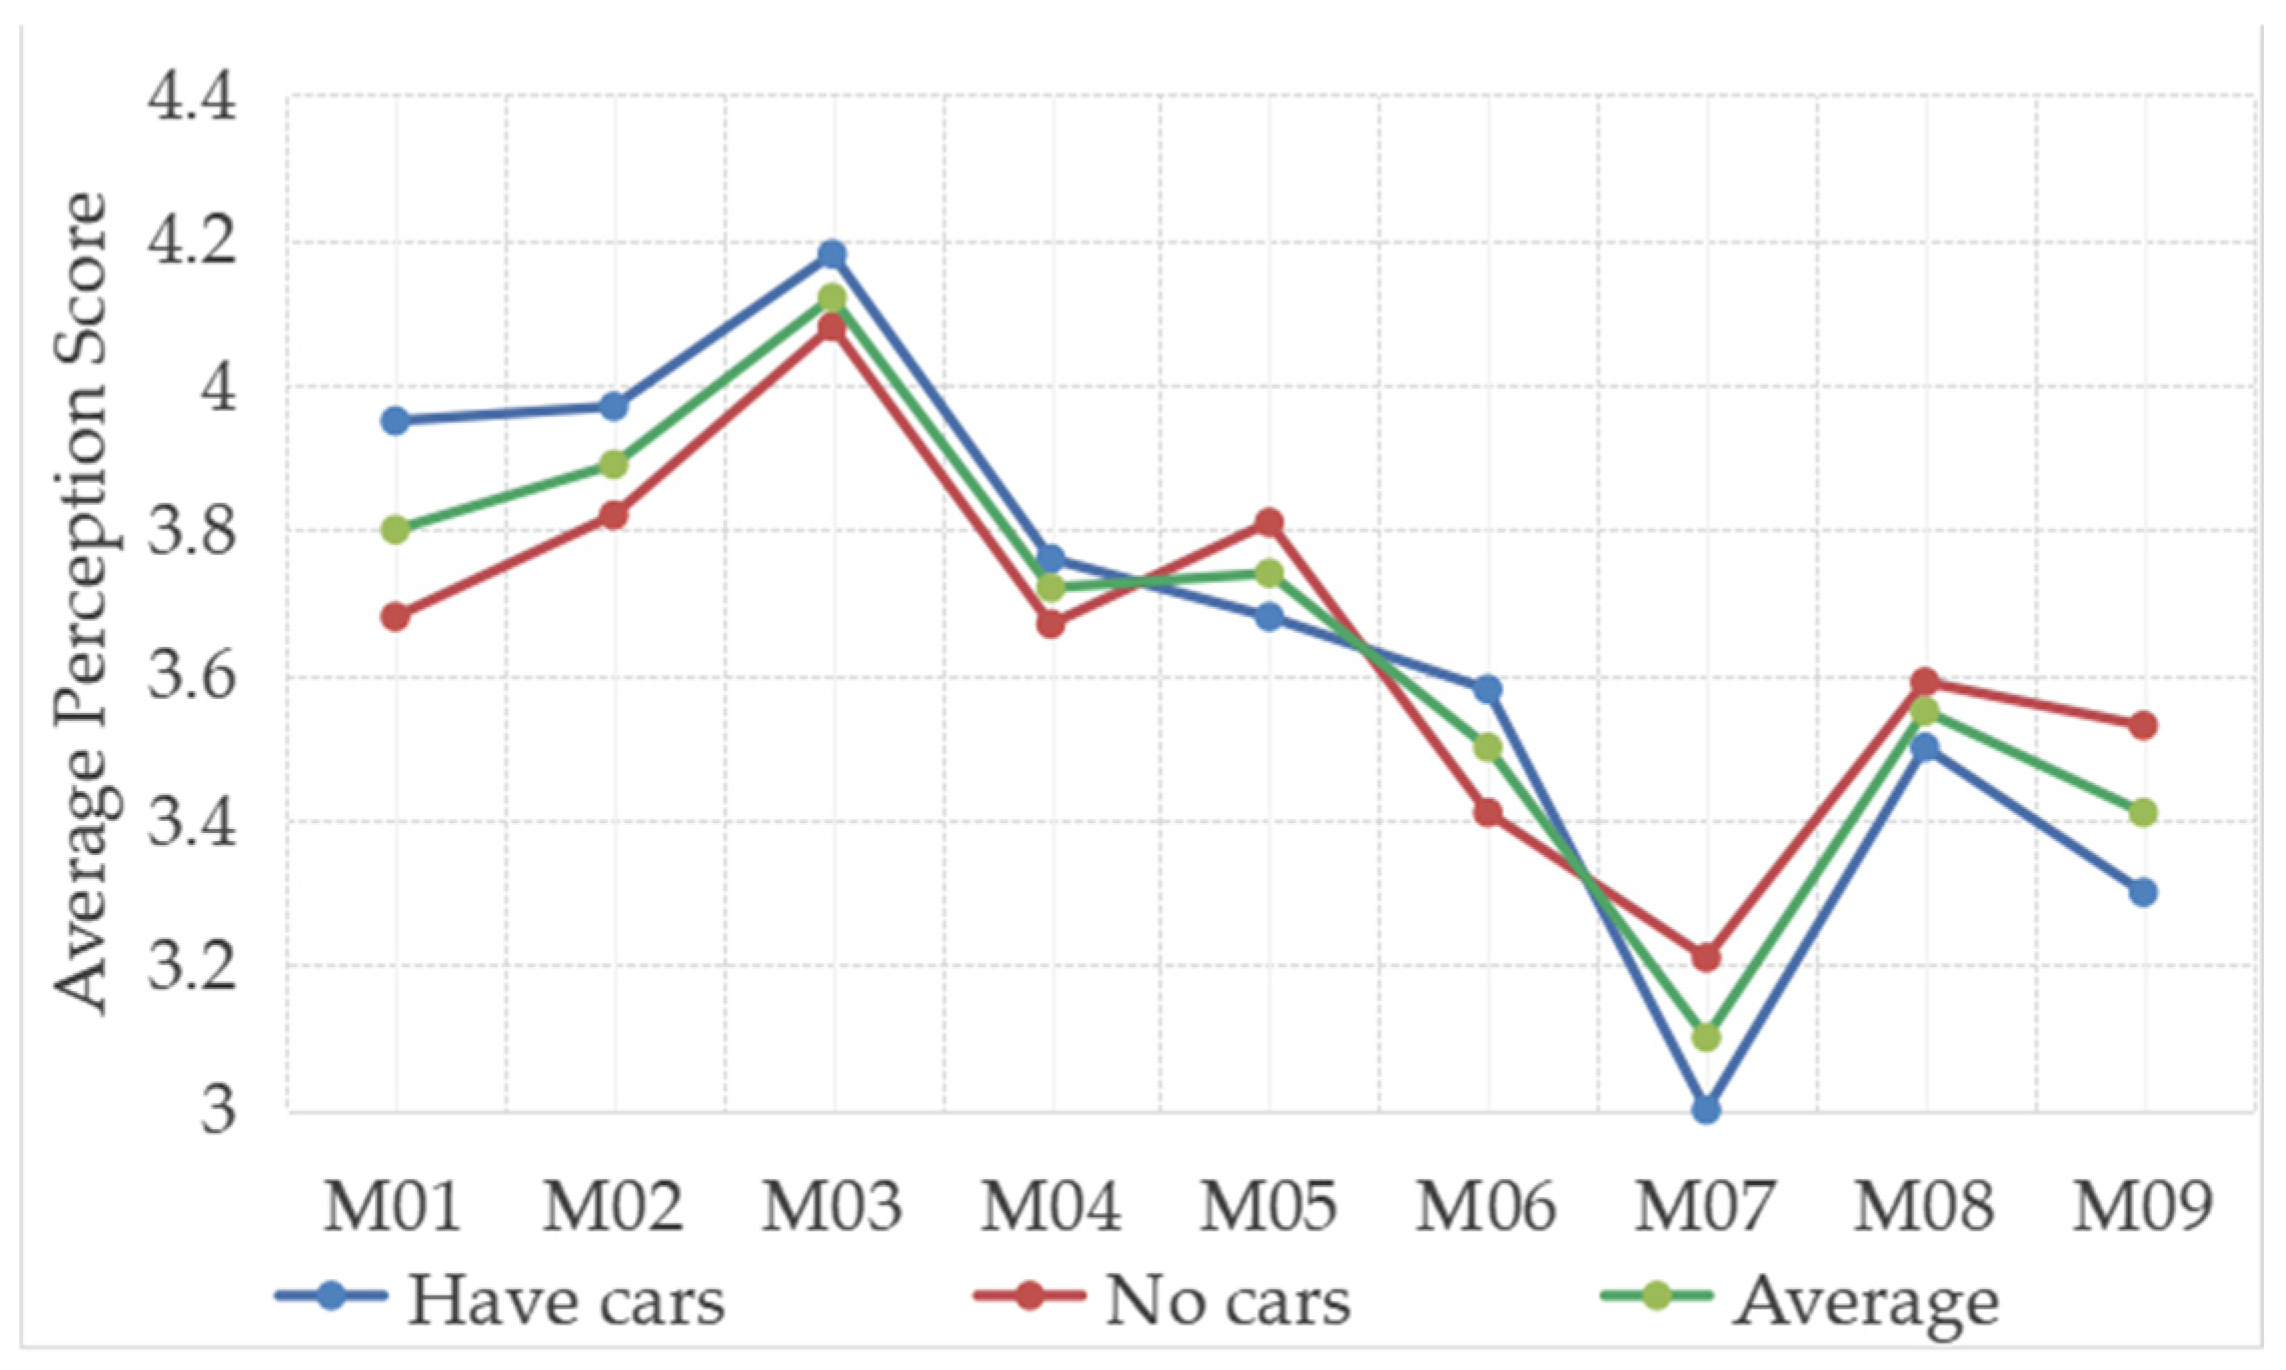
4.1.4. Analysis of Route Evaluation Scores by Passengers with Different Characteristics
4.2. Analysis of Walkability Impact Indicators at the Path Level and Construction of a Composite Index
4.2.1. Regression Analysis Between Walkability Factors and Indicators
4.2.2. Scores Walkability Factors Based on the Perceived Choices of Walking Passengers
5. Discussion
5.1. Comparing the Walkability of Stations in the Core and Edge Areas
5.2. Directions for Future Pedestrian Environment Improvements in Site Areas
6. Conclusions
Author Contributions
Funding
Data Availability Statement
Conflicts of Interest
Abbreviations
| PERS | Pedestrian Environmental Rating System |
| PP plot | Probability-Probability Plot |
| WCI | Walking Composite Index |
Appendix A
References
- Wang, P.; Zhang, R.; Sun, S.; Gao, M.; Zheng, B.; Zhang, D.; Carmichael, G.R.; Zhang, H. Aggravated air pollution and health burden due to traffic congestion in urban China. Atmos. Chem. Phys. 2023, 23, 2983–2996. [Google Scholar] [CrossRef]
- Liu, J.; Peng, Q.; Chen, J.; Yin, Y. Connectivity reliability on an urban rail transit network from the perspective of passenger travel. Urban Rail Transit 2020, 6, 1–14. [Google Scholar] [CrossRef]
- Lin, D.; Nelson, J.D.; Cui, J. Exploring influencing factors on metro development in China from urban and economic perspectives. Tunn. Undergr. Space Technol. 2021, 112, 103877. [Google Scholar] [CrossRef]
- Chen, H.; Zhao, K.; Zhang, Z.; Zhang, H.; Lu, L. Methods for the Performance Evaluation and Design Optimization of Metro Transit-Oriented Development Sites Based on Urban Big Data. Land 2024, 13, 1233. [Google Scholar] [CrossRef]
- Sun, G.; Zacharias, J.; Ma, B.; Oreskovic, N.M. How do metro stations integrate with walking environments? Results from walking access within three types of built environment in Beijing. Cities 2016, 56, 91–98. [Google Scholar] [CrossRef]
- Paydar, M.; Fard, A.K.; Khaghani, M.M. Walking toward Metro Stations: The Contribution of Distance, Attitudes, and Perceived Built Environment. Sustainability 2020, 12, 10291. [Google Scholar] [CrossRef]
- Jiao, J.; Chen, Y.; He, N. Plan pedestrian friendly environments around subway stations: Lessons from Shanghai, China. J. Urban Des. 2017, 22, 796–811. [Google Scholar] [CrossRef] [PubMed]
- Owen, N.; Humpel, N.; Leslie, E.; Bauman, A.; Sallis, J.F. Understanding environmental influences on walking: Review and research agenda. Am. J. Prev. Med. 2004, 27, 67–76. [Google Scholar] [CrossRef]
- Lee, M.; Lee, H.; Hwang, S.; Choi, M. Understanding the impact of the walking environment on pedestrian perception and comprehension of the situation. J. Transp. Health 2021, 23, 101267. [Google Scholar] [CrossRef]
- Li, Z.; Han, Z.; Xin, J.; Luo, X.; Su, S.; Weng, M. Transit oriented development among metro station areas in Shanghai, China: Variations, typology, optimization and implications for land use planning. Land Use Policy 2019, 82, 269–282. [Google Scholar] [CrossRef]
- Khosravi, H.; Abrishami, M.; Mehrian, M.R.; Chamberlain, B. The positive impact of transit-oriented-development characteristics on Metro Station usage: A case study of Tehran’s metro stations and TOD index calculation. Cities 2024, 148, 104840. [Google Scholar] [CrossRef]
- Yao, C.; Li, G.; Yan, S. Design Strategies to Improve Metro Transit Station Walking Environments: Five Stations in Chongqing, China. Buildings 2024, 14, 1025. [Google Scholar] [CrossRef]
- Salaheldin, H.T.; Major, M.D.; Ahmad, A.M.; Tannous, H.O. Analyzing walkability in the vicinity of three metro stations in Doha, Qatar. Open House Int. 2023, 48, 487–503. [Google Scholar] [CrossRef]
- Kim, H.; Park, S.H.; So, J. Identifying walkability factors for urban metro station areas toward transit-oriented development. Int. J. Urban Sci. 2024, 1–21. [Google Scholar] [CrossRef]
- Yan, C.; Gao, Y.; Yang, Y. Exploring the Spatial Patterns of Accessibility to Metro Services Considering the Locations of Station Entrances/Exits. Buildings 2024, 14, 3532. [Google Scholar] [CrossRef]
- Shanghai MaaS Public Travel Annual Report (2023). Available online: https://www.shmaas.cn/data.html (accessed on 23 September 2024).
- 2024 Shanghai Urban Rail Transit Service Quality Evaluation Results Released. Available online: https://www.shanghai.gov.cn (accessed on 10 March 2025).
- Bivina, G.R.; Gupta, A.; Parida, M. Influence of microscale environmental factors on perceived walk accessibility to metro stations. Transp. Res. Part D Transp. Environ. 2019, 67, 142–155. [Google Scholar] [CrossRef]
- Fonseca, F.; Ribeiro, P.J.; Conticelli, E.; Jabbari, M.; Papageorgiou, G.; Tondelli, S.; Ramos, R.A. Built environment attributes and their influence on walkability. Int. J. Sustain. Transp. 2022, 16, 660–679. [Google Scholar] [CrossRef]
- Kim, E.J.; Kim, J.; Kim, H. Does Environmental Walkability Matter? The Role of Walkable Environment in Active Commuting. Int. J. Environ. Res. Public Health 2020, 17, 1261. [Google Scholar] [CrossRef]
- Cepolina, E.M.; Menichini, F.; Rojas, P.G. Level of service of pedestrian facilities: Modelling human comfort perception in the evaluation of pedestrian behaviour patterns. Transp. Res. Part F Traffic Psychol. Behav. 2018, 58, 365–381. [Google Scholar] [CrossRef]
- Bivina, G.R.; Gupta, A.; Parida, M. Walk accessibility to metro stations: An analysis based on meso-or micro-scale built environment factors. Sustain. Cities Soc. 2020, 55, 102047. [Google Scholar] [CrossRef]
- Saelens, B.E.; Sallis, J.F.; Frank, L.D. Environmental correlates of walking and cycling: Findings from the transportation, urban design, and planning literatures. Ann. Behav. Med. 2003, 25, 80–91. [Google Scholar] [CrossRef]
- Lamour, Q.; Morelli, A.M.; Marins, K.R.D.C. Improving walkability in a TOD context: Spatial strategies that enhance walking in the Belém neighbourhood, in São Paulo, Brazil. Case Stud. Transp. Policy 2019, 7, 280–292. [Google Scholar] [CrossRef]
- Eom, S.; Kim, H.; Hasegawa, D.; Yamada, I. Pedestrian movement with large-scale GPS records and transit-oriented development attributes. Sustain. Cities Soc. 2024, 102, 105223. [Google Scholar] [CrossRef]
- Live Where You Love. Available online: www.walkscore.com (accessed on 15 May 2024).
- Liu, M.; Jiang, Y.; He, J. Quantitative evaluation on street vitality: A case study of Zhoujiadu community in Shanghai. Sustainability 2021, 13, 3027. [Google Scholar] [CrossRef]
- Gu, P.; Han, Z.; Cao, Z.; Chen, Y.; Jiang, Y. Using open source data to measure street walkability and bikeability in China: A case of four cities. Transp. Res. Rec. 2018, 2672, 63–75. [Google Scholar] [CrossRef]
- Chen, Z.; Huang, R.; Huang, Y.; Chen, Z.; Ye, Y. The measurements of fine-scale street walkability and precise design control: An evidence-based approach based on virtual reality and wearable bio-sensors. Chin. Landsc. Archit. 2022, 38, 70–75. [Google Scholar]
- Telega, A.; Telega, I.; Bieda, A. Measuring Walkability with GIS—Methods Overview and New Approach Proposal. Sustainability 2021, 13, 1883. [Google Scholar] [CrossRef]
- Tsiompras, A.B.; Photis, Y.N. What matters when it comes to “Walk and the city”? Defining a weighted GIS-based walkability index. Transp. Res. Procedia 2017, 24, 523–530. [Google Scholar] [CrossRef]
- Mateo-Babiano, I. Pedestrian’s needs matter: Examining Manila’s walking environment. Transp. Policy 2016, 45, 107–115. [Google Scholar] [CrossRef]
- Park, S. Defining, Measuring, and Evaluating Path Walkability, and Testing Its Impacts on Transit Users’ Mode Choice and Walking Distance to the Station; University of California: Berkeley, CA, USA, 2008. [Google Scholar]
- Villaveces, A.; Nieto, L.A.; Ortega, D.; Ríos, J.F.; Medina, J.J.; Gutiérrez, M.I.; Rodríguez, D. Pedestrians’ perceptions of walkability and safety in relation to the built environment in Cali, Colombia, 2009–10. Inj. Prev. 2012, 18, 291–297. [Google Scholar] [CrossRef]
- Hussain, M.S.; Kumari, R.; Nimesh, V.; Goswami, A.K. Assessing impact of urban street infrastructure on pedestrian safety perception. Proc. Inst. Civ. Eng.-Urban Des. Plan. 2021, 174, 76–84. [Google Scholar] [CrossRef]
- Huang, G.; Yu, Y.; Lyu, M.; Sun, D.; Dewancker, B.; Gao, W. Impact of Physical Features on Visual Walkability Perception in Urban Commercial Streets by Using Street-View Images and Deep Learning. Buildings 2025, 15, 113. [Google Scholar] [CrossRef]
- Fonseca, F.; Rodrigues, A.; Silva, H. Pedestrian Perceptions of Sidewalk Paving Attributes: Insights from a Pilot Study in Braga. Infrastructures 2025, 10, 79. [Google Scholar] [CrossRef]
- Shach-Pinsly, D.; Ganor, T. A New Approach for Assessing Secure and Vulnerable Areas in Central Urban Neighborhoods Based on Social-Groups’ Analysis. Sustainability 2021, 13, 1174. [Google Scholar] [CrossRef]
- Chin, K.K.; Menon, G. Transport accessibility and infrastructure in Singapore–pedestrian facilities. Proc. Inst. Civ. Eng.-Munic. Eng. 2015, 168, 133–139. [Google Scholar] [CrossRef]
- Eboli, L.; Forciniti, C.; Mazzulla, G.; Bellizzi, M.G. Establishing Performance Criteria for Evaluating Pedestrian Environments. Sustainability 2023, 15, 3523. [Google Scholar] [CrossRef]
- Majumdar, B.B.; Sahu, P.K.; Patil, M.; Vendotti, N. Pedestrian satisfaction-based methodology for prioritization of critical sidewalk and crosswalk attributes influencing walkability. J. Urban Plan. Dev. 2021, 147, 04021032. [Google Scholar] [CrossRef]
- Ewing, R.; Handy, S. Measuring the unmeasurable: Urban design qualities related to walkability. J. Urban Des. 2009, 14, 65–84. [Google Scholar] [CrossRef]
- Singh, R. Factors affecting walkability of neighborhoods. Procedia-Soc. Behav. Sci. 2016, 216, 643–654. [Google Scholar] [CrossRef]
- Nasar, J.L. Urban design aesthetics: The evaluative qualities of building exteriors. Environ. Behav. 1994, 26, 377–401. [Google Scholar] [CrossRef]
- Li, Y.; Yabuki, N.; Fukuda, T. Measuring visual walkability perception using panoramic street view images, virtual reality, and deep learning. Sustain. Cities Soc. 2022, 86, 104140. [Google Scholar] [CrossRef]
- Sevtsuk, A.; Kalvo, R.; Ekmekci, O. Pedestrian accessibility in grid layouts: The role of block, plot and street dimensions. Urban Morphol. 2016, 20, 89–106. [Google Scholar] [CrossRef]
- Xuan, W.; Zhao, L. Research on correlation between spatial quality of urban streets and pedestrian walking characteristics in china based on street view big data. J. Urban Plan. Dev. 2022, 148, 05022035. [Google Scholar] [CrossRef]
- Kweon, B.-S.; Rosenblatt-Naderi, J.; Ellis, C.D.; Shin, W.-H.; Danies, B.H. The Effects of Pedestrian Environments on Walking Behaviors and Perception of Pedestrian Safety. Sustainability 2021, 13, 8728. [Google Scholar] [CrossRef]
- Boarnet, M.G.; Anderson, C.L.; Day, K.; McMillan, T.; Alfonzo, M. Evaluation of the California Safe Routes to School legislation: Urban form changes and children’s active transportation to school. Am. J. Prev. Med. 2005, 28, 134–140. [Google Scholar] [CrossRef]
- Yosifof, R.; Fisher-Gewirtzman, D. Hybrid quantitative mesoscale analyses for simulating pedestrians’ visual perceptions: Comparison of three New York City streets. Environ. Plan. B Urban Anal. City Sci. 2024, 51, 140–156. [Google Scholar] [CrossRef]
- Jacobs, J. The Economy of Cities; Vintage: New York, NY, USA, 2016. [Google Scholar]
- Fonseca, F.; Papageorgiou, G.; Tondelli, S.; Ribeiro, P.; Conticelli, E.; Jabbari, M.; Ramos, R. Perceived walkability and respective urban determinants: Insights from Bologna and Porto. Sustainability 2022, 14, 9089. [Google Scholar] [CrossRef]
- Basu, N.; Oviedo-Trespalacios, O.; King, M.; Kamruzzaman, M.; Haque, M.M. The influence of the built environment on pedestrians’ perceptions of attractiveness, safety and security. Transp. Res. Part F Traffic Psychol. Behav. 2022, 87, 203–218. [Google Scholar] [CrossRef]
- Sang, Y.; Hu, Y.; Qin, X.; Yan, H.; Wu, R.; Qian, F.; Nan, X.; Shao, F.; Bao, Z. Impacts of street tree canopy coverage on pedestrians’ dynamic thermal perception and walking willingness. Sustain. Cities Soc. 2025, 121, 106196. [Google Scholar] [CrossRef]
- Zordan, M.; Talamini, G.; Villani, C. The Association between Ground Floor Features and Public Open Space Face-To-Face Interactions: Evidence from Nantou Village, Shenzhen. Int. J. Environ. Res. Public Health 2019, 16, 4934. [Google Scholar] [CrossRef]
- Guo, J.; Wei, Y.D.; Chen, W.; Liu, W.; Wang, L. Daily Flows, Urban Polycentricity, and Transit Commuting Patterns: A Study of Shanghai, China. Geogr. Rev. 2024, 114, 243–267. [Google Scholar] [CrossRef]
- Moura, F.; Cambra, P.; Gonçalves, A.B. Measuring walkability for distinct pedestrian groups with a participatory assessment method: A case study in Lisbon. Landsc. Urban Plan. 2017, 157, 282–296. [Google Scholar] [CrossRef]
- Nakamura, K. The relationship between walkability and QOL outcomes in residential evaluation. Cities 2022, 131, 104008. [Google Scholar] [CrossRef]
- Joshi, A.; Kale, S.; Chandel, S.; Pal, D.K. Likert scale: Explored and explained. Br. J. Appl. Sci. Technol. 2015, 7, 396. [Google Scholar] [CrossRef]
- Woldeamanuel, M.; Kent, A. Measuring walk access to transit in terms of sidewalk availability, quality, and connectivity. J. Urban Plan. Dev. 2016, 142, 04015019. [Google Scholar] [CrossRef]

| Sense of safety | M01 | Street crossing safety |
| M02 | Safety on the sidewalk | |
| Sense of public security | M03 | Public security sense of personal safety |
| Convenience | M04 | Convenience of street crossing |
| M05 | Accessibility of facilities | |
| Comfort | M06 | Sidewalk Features |
| M07 | Unaffected by negative environment | |
| M08 | Sense of street dimensions | |
| Visual Interest | M09 | Street diversity |
| Category | Walkability Indicators | Units | Quantification of Indicators |
|---|---|---|---|
| Indicators of walkability within the lanes | Number of lanes | Number | The number of lanes within a road, excluding left-turn lanes or traffic islands at flared intersections. |
| Pedestrian crossing Facility coverage | % | Represents the percentage of pedestrian crossing facilities owned by each street segment. | |
| Walkability indicators related to buffers | Buffer width | m | Average of the buffer zone widths on both sides of the street; this area is between the edge of the carriageway and the effective width of the sidewalk. |
| Green belt width | m | The average value of the width of the green belt (including the municipal facility belt) on both sides of the street. | |
| Roadside parking | (1) Availability of roadside parking: 1 = at least one side; 0 = neither side | This is a dummy variable that counts as 1 when there is parking on at least one side of the street and 0 when there is none on either side. | |
| Walkability indicators related to sidewalks and facilities | Effective width of sidewalk | m | The average of the net width of the sidewalk on both sides, counting only the width of the area used for human walking. |
| Length of sidewalk | (m) | The average of the total length of sidewalks on both sides is equal to the block side length. | |
| Sidewalk coverage | % | If a street segment has sidewalks on both sides, then its coverage is 100%; if only one side has them, then the coverage is 50%. | |
| Proportion of sidewalks covered by tree canopy | % | The tree canopy referred to includes not only street trees but also the canopy in adjacent private spaces or green spaces, obtained by measuring the length of coverage on the sidewalk centerline. | |
| Walkability indicators related to street scale and enclosure | Distance between adjacent buildings | m | The average distance between building facades on both sides of the street. |
| Average building height | m | The average height of buildings within a street segment, but open space and green space do not count. | |
| Spatial enclosure | Height/Length | This indicator is the ratio of the average building height and the adjacent building distance; the larger the ratio, the higher the degree of the street enclosure. When this ratio is greater than 1, a greater sense of oppression will be formed. | |
| Building stick line rate | % | This indicator indicates the proportion of street segments with building facades. | |
| Walkability indicators related to buildings along the street | Ground floor facade transparency | facade/500 m sidewalk length | This indicator reflects the extent to which people walking on the sidewalk can see the interior of buildings along the street. |
| Enclosure ratio | % | The study used fenestration above 1.5 m as the basis for the calculation, which is the ratio of the fence’s length to the sidewalk. | |
| Proportion of ground-floor commercial uses (walkable) | % | Using Park’s classification of walkable building uses and modified for the characteristics of Shanghai | |
| Proportion of ground-floor residential uses | % | Proportion of the width of ground-floor buildings used for residences to the total building length of the building along the street. | |
| Mixed use of buildings along the street | mixed = 1; not mixed = 0 | Based on the pre-study, this paper defines a road section as mixed use if the proportion of buildings used for residence is greater than 25% and that used for commercial purposes is greater than 35%. |
| NL | GB | BW | SW | BH | SE | AG | FT | PC | PR | ER | TC | SL | ||
|---|---|---|---|---|---|---|---|---|---|---|---|---|---|---|
| Pearson’s correlation | Number of lanes (NL) | 1.000 | 0.056 | 0.240 | 0.294 | −0.196 | −0.434 | 0.116 | −0.330 | 0.137 | −0.132 | 0.478 | 0.090 | 0.207 |
| Green belt width (GB) | 0.056 | 1.000 | 0.859 | 0.385 | −0.039 | −0.045 | 0.120 | 297 | 0.003 | −0.088 | −0.192 | 0.253 | 0.102 | |
| Buffer width (BW) | 0.240 | 0.859 | 1.000 | 0.364 | 0.001 | 0.075 | 0.067 | 214 | 0.090 | −0.166 | −0.058 | 0.277 | 0.150 | |
| Effective width of sidewalk (SW) | 0.294 | 0.385 | 0.364 | 1.000 | −0.052 | −0.170 | −0.093 | 0.163 | 0.222 | 0.010 | −0.030 | 0.178 | 0.208 | |
| Average building height (BH) | −0.196 | −0.039 | 0.001 | −0.052 | 1.000 | 0.755 | 0.165 | −0.018 | −0.547 | 0.080 | 0.04 | 0.261 | −0.496 | |
| Street enclosure (SE) | −0.434 | −0.045 | −0.075 | −0.170 | 0.755 | 1.000 | 0.271 | 0.364 | −0.517 | 0.215 | −0.367 | −0.129 | −0.398 | |
| Building adherence rate (AG) | −0.116 | 0.120 | 0.067 | −0.093 | 0.165 | 0.271 | 1.000 | 0.017 | −0.053 | −0.112 | −0.173 | 0.063 | 0.050 | |
| Ground floor facade transparency (FT) | −0.330 | 0.297 | 0.214 | 0.163 | −0.018 | 0.364 | 0.017 | 1.000 | 0.084 | 0.284 | −0.697 | 0.251 | −0.014 | |
| Proportion of ground-floor commercial uses (PC) | 0.137 | 0.003 | 0.090 | 0.222 | −0.547 | −0.517 | −0.053 | 0.084 | 1.000 | −0.585 | 0.032 | 0.265 | 0.397 | |
| Proportion of ground-floor residential uses (PR) | −0.132 | −0.088 | −0.166 | 0.010 | 0.080 | 0.215 | −0.112 | 0.284 | −0.585 | 1.000 | −0.343 | 0.069 | −0.174 | |
| Enclosure ratio (ER) | 0.478 | −0.192 | −0.058 | 0.030 | 0.041 | −0.367 | −0.173 | −0.697 | 0.032 | −0.343 | 1.000 | −0.344 | 0.075 | |
| Proportion of pavements covered by tree canopy (TC) | 0.090 | 0.253 | 0.277 | 0.178 | −0.26 | −0.129 | 0.063 | 0.251 | 0.265 | 0.069 | −0.344 | 1.000 | 0.120 | |
| Length of sidewalk (SL) | 0.207 | 0.102 | 0.150 | 0.208 | −0.496 | −0.398 | −0.050 | −0.014 | 0.397 | −0.174 | 0.073 | 0.120 | 1.000 |
| N | Minimum Value | Maximum Value | Average | Standard Deviation | |
|---|---|---|---|---|---|
| Number of lanes | 113 | 1 | 10 | 3.02 | 1.973 |
| Buffer width (green belt, roadside parking, non-motorized lanes) | 112 | 0.00 | 12.0 | 3.272 | 1.7007 |
| Effective width of sidewalk | 113 | 0.5 | 4.2 | 2.200 | 0.9041 |
| Street enclosure (aspect ratio) | 113 | 0.07 | 2.31 | 0.9188 | 0.56237 |
| Building stick line rate | 113 | 0.00 | 90.00 | 1.3789 | 8.41484 |
| Ground floor facade transparency | 113 | 0 | 176 | 78.97 | 36.988 |
| Proportion of ground-floor commercial uses | 113 | 0.00 | 1.00 | 0.6189 | 0.27276 |
| Enclosure ratio | 113 | 0.00 | 1.00 | 0.3359 | 0.29206 |
| Proportion of sidewalks covered by tree canopy | 113 | 0.00 | 0.94 | 0.6750 | 0.20707 |
| Length of sidewalk | 113 | 74 | 604 | 247.13 | 124.973 |
| Valid Number (list status) | 112 | - | - | - | - |
| Model | Unstandardized Coefficients | Standardized Coefficients | T | Sig | ||
|---|---|---|---|---|---|---|
| B | Standard Error | Beta | ||||
| M01 Street crossing safety | (Constant) | 3.119 | 0.267 | 11.679 | 0.000 | |
| Proportion of sidewalks covered by tree canopy | 1.310 | 0.355 | 0.324 | 3.695 | 0.000 | |
| Number of lanes | −0.110 | 0.036 | 0.272 | −3.101 | 0.002 | |
| M02 Safety on the sidewalk | (Constant) | 4.882 | 0.345 | 14.140 | 0.000 | |
| Enclosure ratio | −1.648 | 0.332 | −0.425 | −4.968 | 0.000 | |
| Ground floor facade transparency | −0.010 | 0.003 | −0.312 | −3.593 | 0.000 | |
| Effective width of sidewalk | 0.190 | 0.090 | 0.131 | 2.107 | 0.036 | |
| M03 Public security sense of personal safety | (Constant) | 3.221 | 0.264 | 12.223 | 0.000 | |
| Proportion of sidewalks covered by tree canopy | 0.901 | 0.324 | 0.243 | 2.777 | 0.006 | |
| Street enclosure (aspect ratio) | 0.626 | 0.191 | 0.459 | 3.271 | 0.001 | |
| Ground floor facade transparency | 0.390 | 0.195 | 0.178 | 1.999 | 0.048 | |
| M04 Convenience of street crossing | (Constant) | 2.751 | 0.353 | 7.797 | 0.000 | |
| Number of lanes | −0.113 | 0.041 | −0.252 | −2.751 | 0.007 | |
| Proportion of sidewalks covered by tree canopy | 1.231 | 0.387 | 0.274 | 3.182 | 0.002 | |
| Street enclosure (aspect ratio) | 0.359 | 0.144 | 0.228 | 2.483 | 0.015 | |
| M05 Accessibility of facilities | (Constant) | 4.551 | 0.158 | 28.887 | 0.000 | |
| Length of sidewalk | −0.003 | 0.001 | −0.395 | −4.504 | 0.000 | |
| M06 Sidewalk Features | (Constant) | 3.170 | 0.233 | 13.595 | 0.000 | |
| Number of lanes | −0.106 | 0.031 | −0.306 | −3.430 | 0.001 | |
| Proportion of sidewalks covered by tree canopy | 0.763 | 0.310 | 0.220 | 2.464 | 0.015 | |
| M07 Unaffected by negative environment | (Constant) | 2.671 | 0.278 | 9.595 | 0.000 | |
| Proportion of sidewalks covered by tree canopy | 1.089 | 0.370 | 0.266 | 2.948 | 0.004 | |
| Number of lanes | −0.098 | 0.037 | −0.239 | −2.656 | 0.009 | |
| M08 Sense of street dimensions | (Constant) | 2.439 | 0.305 | 8.005 | 0.000 | |
| Street enclosure (aspect ratio) | 0.381 | 0.132 | 0.262 | 2.887 | 0.005 | |
| Proportion of sidewalks covered by tree canopy | 0.974 | 0.377 | 0.235 | 2.585 | 0.011 | |
| M09 Street Diversity | (Constant) | 4.075 | 0.239 | 17.053 | 0.000 | |
| Number of lanes | −0.112 | 0.040 | −0.259 | −2.823 | 0.006 | |
| Proportion of ground-floor commercial uses | −0.595 | 0.287 | −0.190 | −2.072 | 0.041 | |
| Weights | Model Equation |
|---|---|
| 0.14 | M01 = 3.119 + 1.310 × TC − 0.110 × NL |
| +0.14 | M02 = 4.882 − 1.648 × ER − 0.010 × FT + 0.190 × SW |
| +0.09 | M03 = 3.221 + 0.901 × TC + 0.626 × SE + 0.390 × FT |
| +0.13 | M04 = 2.751 − 0.113 × NL + 1.231 × TC + 0.359 × SE |
| +0.1 | M05 = 4.551 − 0.003 × SL |
| +0.09 | M06 = 3.170 − 0.106 × NL + 0.763 × TC |
| +0.21 | M07 = 2.671 + 1.089 × TC − 0.098 × NL |
| +0.06 | M08 = 2.439 + 0.381 × SE + 0.974 × TC |
| +0.04 | M09 = 4.075 − 0.112 × NL − 0.595 × PC |
| Symbol | Description |
|---|---|
| TC | Proportion of sidewalks covered by tree canopy |
| NL | Number of lanes |
| ER | Enclosure ratio |
| FT | Ground floor facade transparency |
| SW | Effective width of sidewalk |
| SE | Street enclosure (aspect ratio) |
| SL | Length of sidewalk |
| PC | Proportion of ground-floor commercial uses |
Disclaimer/Publisher’s Note: The statements, opinions and data contained in all publications are solely those of the individual author(s) and contributor(s) and not of MDPI and/or the editor(s). MDPI and/or the editor(s) disclaim responsibility for any injury to people or property resulting from any ideas, methods, instructions or products referred to in the content. |
© 2025 by the authors. Licensee MDPI, Basel, Switzerland. This article is an open access article distributed under the terms and conditions of the Creative Commons Attribution (CC BY) license (https://creativecommons.org/licenses/by/4.0/).
Share and Cite
Chen, X.; Shi, Z.; Hu, Y. The Walkability Evaluation and Optimization Strategies of Metro Station Areas Taking Shanghai as an Example. Buildings 2025, 15, 1746. https://doi.org/10.3390/buildings15101746
Chen X, Shi Z, Hu Y. The Walkability Evaluation and Optimization Strategies of Metro Station Areas Taking Shanghai as an Example. Buildings. 2025; 15(10):1746. https://doi.org/10.3390/buildings15101746
Chicago/Turabian StyleChen, Xiaoyan, Zhengyan Shi, and Yanzhe Hu. 2025. "The Walkability Evaluation and Optimization Strategies of Metro Station Areas Taking Shanghai as an Example" Buildings 15, no. 10: 1746. https://doi.org/10.3390/buildings15101746
APA StyleChen, X., Shi, Z., & Hu, Y. (2025). The Walkability Evaluation and Optimization Strategies of Metro Station Areas Taking Shanghai as an Example. Buildings, 15(10), 1746. https://doi.org/10.3390/buildings15101746