Article

Parameter Optimization Analysis of Buttressed Pile Foundation Beam Retaining Wall Under Seismic Action

1
Guangzhou Municipal Engineering Design & Research Institute Co., Ltd., Guangzhou 510000, China
2
School of Civil Engineering and Transportation, Guangzhou University, Guangzhou 511370, China
*
Author to whom correspondence should be addressed.
Buildings 2025, 15(10), 1748; https://doi.org/10.3390/buildings15101748
Submission received: 28 March 2025 / Revised: 22 April 2025 / Accepted: 24 April 2025 / Published: 21 May 2025

Abstract

To enhance the seismic performance of the pile foundation beam retaining wall-anti-slide pile system in slope engineering, this study adopts an innovative approach combining shaking-table tests and three-dimensional numerical modeling to systematically investigate the dynamic coupling effects between the geometric parameters of the beam-slab and the height of the retaining wall. The results demonstrate that the numerical model effectively reproduces the time–frequency characteristics of pile-top acceleration observed in the shaking-table tests, revealing a U-shaped displacement distribution pattern along the slope crest under seismic loading, with larger displacements in the middle and smaller ones on both sides. Parameter sensitivity analysis of the pile foundation beam retaining wall-anti-slide pile system indicates that while increasing the width of the beam-slab improves the overall stability of anti-slide piles, it also exacerbates the stress concentration at the base of the retaining wall. Conversely, an increase in retaining wall height leads to the nonlinear amplification of the acceleration response in the pile–soil system. The study confirms that optimizing the synergistic design of the beam-slab length and width while controlling the retaining wall height can significantly enhance the seismic performance of the structure. These findings provide a numerical model-based analysis method with both theoretical depth and engineering applicability for the parametric design of pile foundation beam retaining wall anti-slide pile systems in slope engineering located in high-seismic regions.

1. Introduction

In slope disaster management, the construction of retaining walls is one of the commonly used methods for slope disaster prevention. The pile–beam retaining wall, an improved version of the traditional retaining wall, is widely applied in slope reinforcement in mountainous areas due to its advantages such as good stability and strong anti-sliding capacity. The pile–beam retaining wall is mainly suitable for locations requiring high stability, a large bearing capacity, and excellent seismic performance, such as (1) areas with unstable soil, gentle terrain, or requiring significant earthmoving; (2) embankments on steep slopes, with riverbank erosion, with unstable overburden adjacent to existing lines, or on deep bedrock; and (3) locations with insufficient foundation-bearing capacity or inadequate foundation depth.
Qiao [1] studied the optimal parameters (pile spacing, row spacing, and tie beam dimensions) of portal anti-slide piles to balance stability, structural deformation, and economic efficiency. Xia [2] investigated the mechanical characteristics of pile–beam retaining walls under high-fill and soft-foundation conditions, including stress distribution, displacement, and deformation. Zhang [3] analyzed the reinforcement effect of pile length parameters on backfill soil slopes reinforced by pile–beam retaining walls. Fu [4] studied the settlement patterns of mountainous half-filled and half-cut widened subgrades reinforced with pile–beam retaining walls.
As early as the 1980s, pile–beam retaining walls were used in subgrade engineering. Li Haiping [5] proposed a new type of buttressed pile–beam retaining wall. Their research results demonstrated that with the increase in support beam spacing, both the axial force in the support beams and the horizontal displacement at the top of the retaining piles increase, while the bending moment of the pile body shows minimal changes. When tie beams are installed, the horizontal displacement at the top of the retaining piles decreases, and the retaining piles generate significant counter-moment mutations at the tie beam locations. When pile foundations are adopted for the support beams, both the maximum bending moment of the retaining piles and the horizontal displacement at the top of the retaining piles are greater than those when strip foundations are used for the support beams. Zhao Qinghai [6] innovatively proposed a pile–beam–counterfort tray retaining structure. The structure mainly consists of three parts: the counterfort tray retaining wall, the transfer beam, and the pile foundation. The upper counterfort tray retaining wall effectively narrows the embankment slope, the middle transfer beam transmits the upper loads to the lower pile foundation, and the lower pile foundation then transfers the loads to the bearing stratum. Yi Heng [7] proposed a buttressed pile–beam retaining wall, but their designs were limited to simple working conditions and were not suitable for complex slope reinforcement scenarios. Li [8] developed an EPS anti-slide pile composed of flexible EPS material. The frequency characteristics and dominant frequency band shift of EPS piles primarily occurred during the propagation phase following the main seismic acceleration. Under high seismic acceleration, both EPS piles and conventional piles exhibited certain degrees of deformation. The study employed EPS panels as damping layers to effectively buffer and dissipate slope deformation under seismic loading, with their damping performance closely related to seismic wave characteristics. Their test results demonstrated that the overall reduction in spectral displacement of EPS piles was significantly greater than that of conventional piles. Notably, the slip surface of the pile body showed high sensitivity to seismic action, making it a potential weak point in the seismic resistance of EPS piles. Luo [9] proposed a novel drainage anti-slide pile (DASP) consisting of an upper hollow section with drainage holes and a lower solid section. However, these designs were not applicable to complex slope conditions. Sun [10] discussed the stability of slopes reinforced with truncated piles and proposed a simplified numerical method based on the shear strength reduction method for analyzing slope stability.
Bao Jingjing et al. [11] investigated the seismic performance of single-row anti-slide piles through combined FLAC3D numerical simulation and shaking-table tests. While the study successfully characterized the stress distribution and deformation patterns of piles under seismic loads, its simplified structural configuration (a single-row arrangement with a uniform cross-section) failed to capture the complex mechanical behavior of more sophisticated anti-slide systems. Their research particularly lacked an examination of structural complexities such as multi-row pile arrangements, variable cross-sections, or hybrid reinforcement systems, which are common in engineering practice. These limitations, coupled with the absence of parametric optimization, reduced the applicability of the findings to real-world seismic design scenarios. Huang Gucheng et al. [12] elaborated on the earth pressure behind single-row pile–beam retaining walls, the beam structure, and the pile foundation structure, clarifying the design process of pile–beam retaining walls. Yu Wenjie [13] further derived formulas for calculating the internal forces and displacements of double-row pile–beam retaining walls and validated these formulas using numerical simulations. Xia [2] established a numerical model and found that the mechanical characteristics of three-row pile composite retaining walls, including the stress distribution, displacement, and deformation, were superior to those of single gravity retaining walls. Fu [4] developed a finite element numerical model based on the translational and rotational tilt characteristics of pile–beam retaining walls during their service life, analyzing the impact of outward tilting on the settlement of widened subgrades.
In addition to the anti-slide pile–slope system, there is also the tunnel–slope system. In the tunnel–slope system, common relationships between tunnels and slopes include tunnels perpendicular to slopes [14,15], tunnels parallel to slopes [16], two tunnels intersecting orthogonally within a slope [17,18], and tunnels obliquely intersecting slopes [19]. Previous studies have primarily focused on the interaction between tunnels and slopes. Feng Haizhou et al. [20] studied the seismic response of open-cut tunnels arranged longitudinally along anti-slide piles under the support of frame beams and anchor cable pile-slab walls, revealing the instability types of tunnel portal slopes under seismic action after rainfall. Zhong Zhanyong et al. [21] proposed a large-span pile–beam retaining wall, allowing existing culverts to pass between two pile foundations, ensuring both the safe construction of culverts and the stability of railway subgrades.
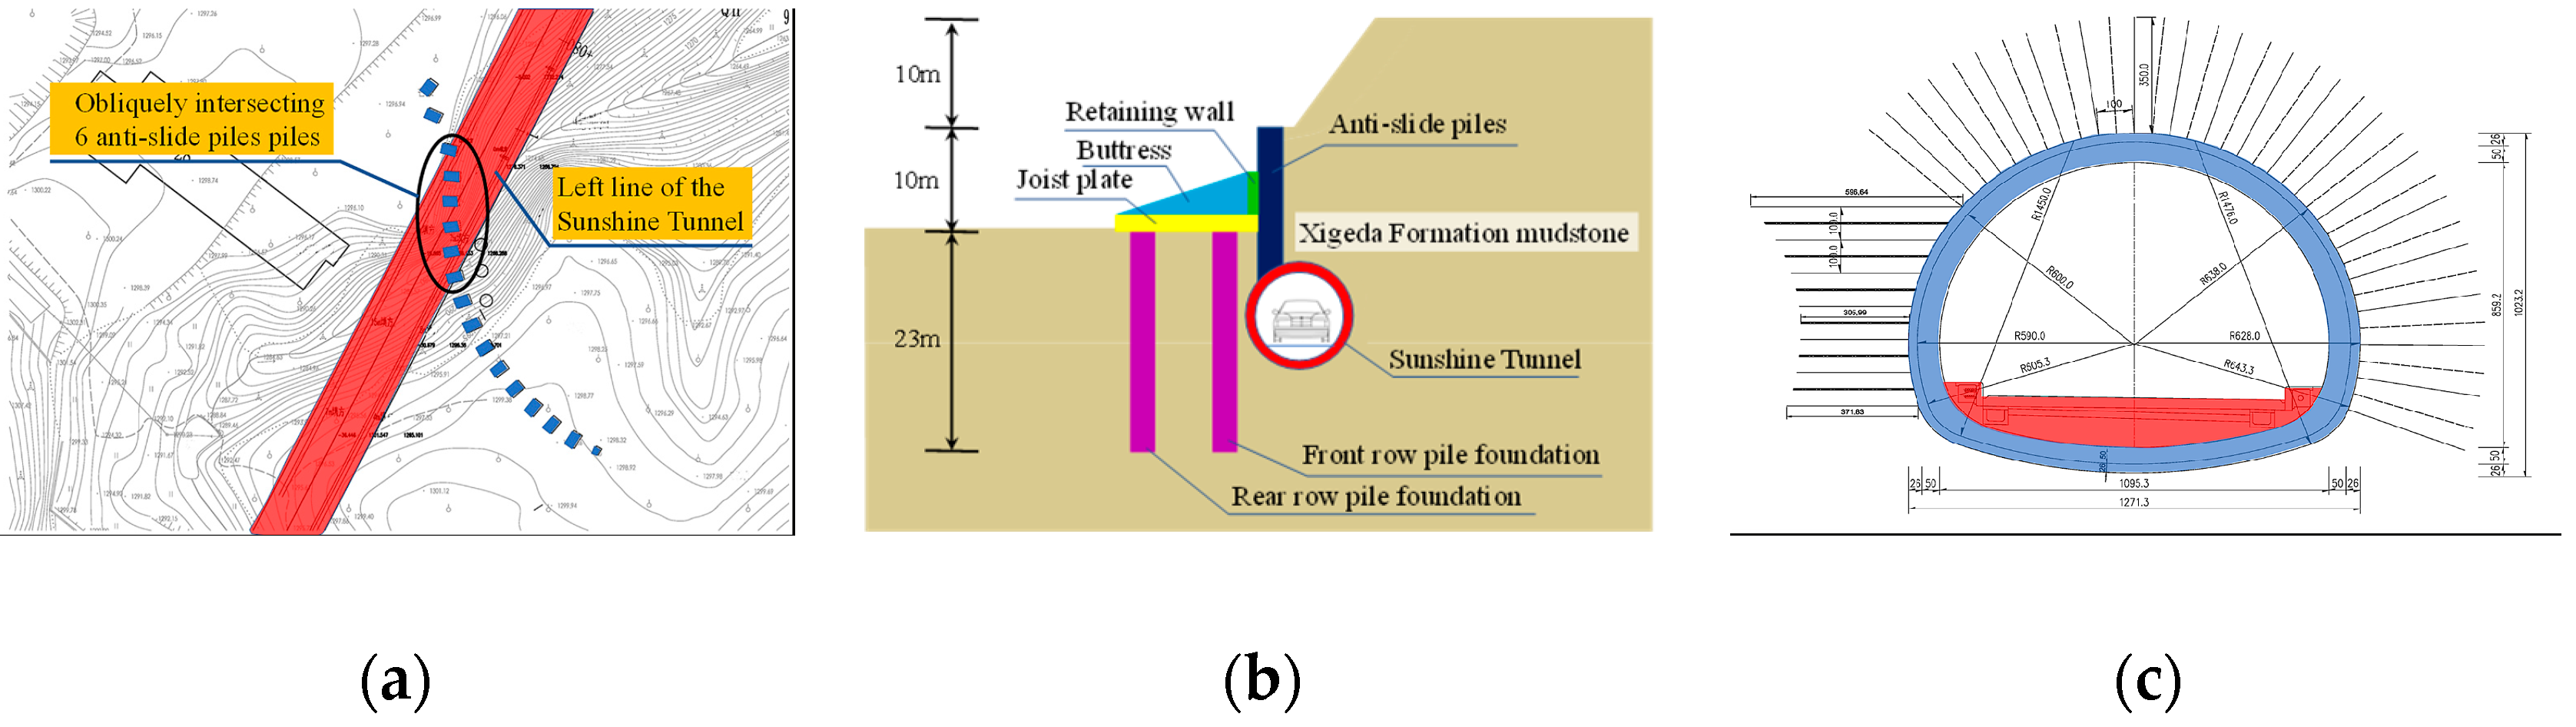
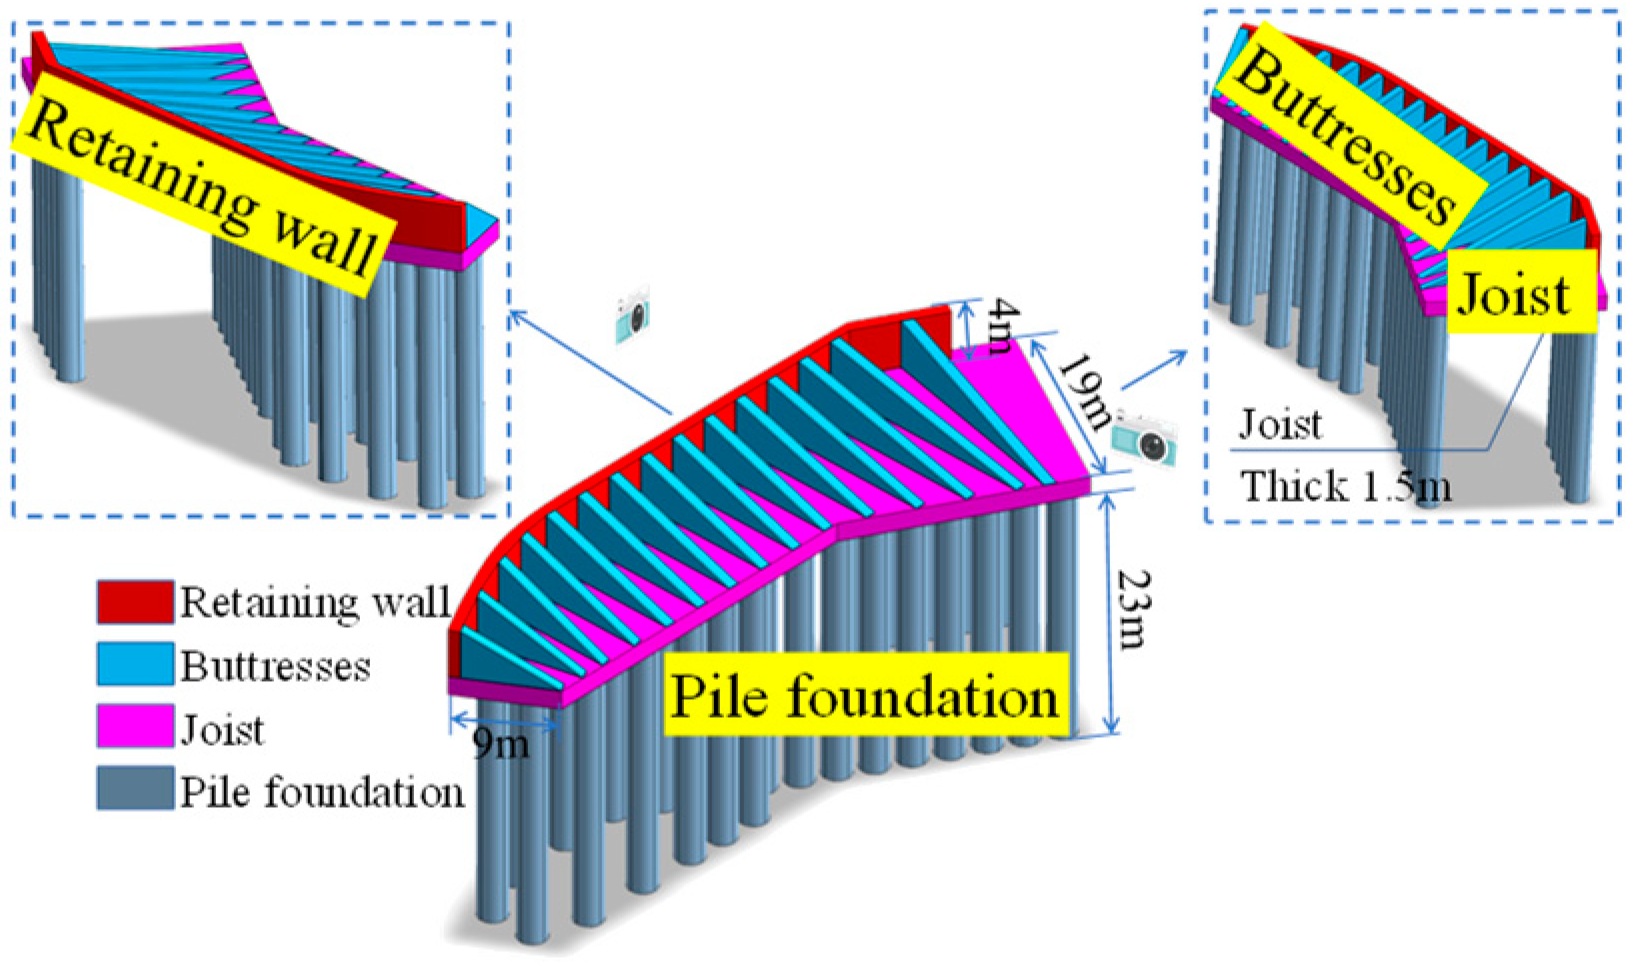
However, research on the intersection of tunnels and slope anti-slide piles, such as the orthogonal or oblique intersection of mountain tunnels and slope anti-slide piles, remains limited. Additionally, there is insufficient research on the parametric analysis of buttressed pile–beam retaining walls, particularly their seismic performance under strong earthquakes. Therefore, this study proposes a new type of buttressed pile–beam retaining wall and takes the portal engineering of the Panzhihua Sunshine Tunnel’s left line, where anti-slide piles were removed, as an example. Using numerical methods, parametric analyses of the beam length, beam width, and retaining wall height were conducted to clarify the influence of these parameters on the reinforcement effect and mechanical performance of the buttressed pile–beam retaining wall, providing recommendations for its practical application.

2. Calculation Model and Parameters

2.1. Engineering Background

This project is based on the oblique intersection of the left line of the Panzhihua Sunshine Tunnel with slope anti-slide piles. The maximum width of the tunnel section is 12.7 m and the height is 10.2 m. The dimensions of the slope anti-slide piles are 2 m × 3 m, with a length of 22 m and an embedded depth of 12 m. The concrete used is C30. The tunnel intersects the slope at approximately a 27° angle, and during tunnel excavation, six anti-slide piles at the tunnel face were cut, with cutting heights ranging from 6.2 m to 6.9 m. The positional relationship between the tunnel and the anti-slide piles is shown in Figure 1.
To ensure the safe excavation of the tunnel, the existing buttressed pile foundation beam retaining wall was improved, and a new buttressed pile foundation beam retaining wall suitable for this project was proposed to ensure the smooth progress of tunnel construction. The buttressed pile foundation beam retaining wall consists of four parts: the beam slab, retaining wall, buttress, and pile foundation. The maximum plane length is 54 m, and the maximum width is 22 m. The width of the buttress is 1 m, the width of the retaining wall is also 1 m, the thickness of the beam slab is 1.5 m, the diameter of the pile foundation is 2.5 m, and the length of the pile is 23 m. The three-dimensional effect of the buttressed pile foundation beam retaining wall is shown in Figure 2.
Before the excavation of the Sunshine Tunnel, the buttressed pile foundation beam retaining wall was constructed on the ground to reinforce the anti-slide piles, allowing for the subsequent cutting of the six anti-slide piles at the tunnel face. The tunnel portal work was then carried out between the two rows of pile foundations at the front end of the buttressed pile foundation beam retaining wall, forming a cover-cut excavation method. The Sunshine Tunnel is one of the rare engineering cases where anti-slide piles are cut within the tunnel. Construction photos from the project site are shown in Figure 3.

2.2. Model Parameters

Based on the engineering prototype, a finite element model was established with a plane size of 111 m × 96 m (length × width). The first-level vertical slope height is 10 m and the second-level slope height is also 10 m, totaling a high slope of 20 m. The maximum height of the finite element model is 60 m and the length along the tunnel axis is 127 m, with the detailed configuration of the model shown in Figure 4.
The physical and mechanical parameters used in the numerical simulation are listed in Table 1, with those of the Xigeda Formation mudstone calibrated based on shaking-table test results. Based on its significant pressure-sensitive characteristics (cohesion c = 250 kN/m2, internal friction angle φ = 23°), the Mohr–Coulomb constitutive model was adopted in the dynamic calculations to characterize the mechanical behavior of the Xigeda Formation mudstone, accurately reflecting its plastic deformation and shear failure mechanisms under cyclic loading; concrete parameters were selected in accordance with the GB 50010-2010 [22] Code for Design of Concrete Structures.
To improve the computational efficiency, the pile foundations were simplified as 1D beam elements. Anti-slide piles, tunnels, beam slabs, buttress ribs, retaining walls, and other concrete structural materials were modeled using 3D solid elements.

2.3. Seismic Wave Selection

Considering the site category and seismic design requirements of the project location, the Wolong seismic wave from the Wenchuan earthquake was selected as the input ground motion. Based on the seismic design and regional seismic intensity requirements, the peak acceleration was adjusted to 0.2 g, corresponding to a seismic fortification intensity of 8 degrees.
The seismic wave was loaded in the most unfavorable direction for the slope, i.e., perpendicular to the slope strike. The acceleration time history curve and Fourier amplitude spectrum of the input Wolong seismic wave are shown in Figure 5.

2.4. Dynamic Analysis Method

The dynamic analysis was conducted using the linear time history direct integration method. Prior to the dynamic analysis, a modal analysis was performed. The first 10 natural frequencies of the overall model obtained from the modal analysis were statistically analyzed, and the mass participation factors and effective mass ratios for these frequencies are summarized in Table 2.
In this dynamic analysis, viscous–elastic boundaries based on the Lysmer–Kuhlemayer wave absorption theory were applied to both lateral sides of the model, effectively suppressing over 90% of boundary wave reflections through impedance-matching coefficients. The validity of this approach was confirmed by prior shaking-table tests conducted by the research group, while the model base was assigned a fixed boundary. The free-field boundary conditions in MIDAS GTS NX 2018 R1(64bit) finite element software were utilized to implement viscous–elastic boundaries around the model, with viscous parameters assigned via absorbing boundaries (see Figure 6 for numerical boundary configuration). A time step of 0.005 s was adopted to satisfy the stability criteria for explicit dynamic analysis.

3. Seismic Response Analysis of Slope-Structure System

3.1. Shaking Table Test Overview

To investigate the seismic response characteristics of slopes, this study adopted the entrance slope of the Sunshine Tunnel as the prototype and established a scaled model using geometric similarity ratio Sl = 1:40 and density similarity ratio = 1. Based on the similarity ratio system presented in Table 3, the elastic modulus similarity ratio SE = 40 (determined by SE = Sρ·Sl = 1 × 40), stress and cohesion similarity ratio = Sc = 40, velocity similarity ratio Sv = Sl^0.5 = 6.25, and time similarity ratio St = Sl/Sv = 6.4 were derived. The rock mass model material was prepared with the following composition by mass: 33% barite powder, 56.5% river sand, 3.5% gypsum, 1% glycerin, and 6% water. The rationale for this formulation included density matching through a barite powder and river sand mixture to achieve 25.8 kN/m3 unit weight ( = 1), stiffness control via gypsum (2-3 GPa elastic modulus) and glycerin to attain a 30 MPa model elastic modulus (prototype 1.2 GPa, SE = 40), strength equivalence through ettringite formation from the gypsum–glycerin–water reaction yielding 3.75 kPa model cohesion (prototype 0.15 MPa, Sc = 40), and conservation of the internal friction angle by matching river sand gradation with prototype rock. For structural components, tunnel lining used a gypsum–water mixture (1950 kg/m3 density, 1020 MPa elastic modulus, 0.5 MPa compressive strength) representing 1/40 of C35 concrete’s elastic modulus (40.8 GPa), while anti-slide piles and retaining walls employed polyethylene plastic (1.02 GPa elastic modulus) to equivalently scale concrete properties, strictly satisfying SE = 40.
The tunnel lining was simulated using gypsum powder and water, with embedded steel mesh to simulate the tunnel’s reinforcement and steel arches. The density of the model lining was 1950 kg/m3, the elastic modulus was 1020 MPa, and the compressive strength was 0.5 MPa. Polyethylene plastic was used to simulate the buttressed pile foundation beam retaining wall and anti-slide piles, which met the scaled elastic modulus of C35 concrete.
The mechanical parameters of the mudstone similarity material under the specified mass ratio were determined through a series of laboratory tests, including triaxial compression tests and natural moisture content measurements of river sand. The experimental results are detailed in Table 4. The obtained parameters demonstrate excellent agreement with the engineering prototype rock mass parameters, fulfilling the similarity design requirements.
The shaking-table model fabrication procedure is shown in Figure 7, with the top of anti-slide pile D as the acceleration response data verification point. The maximum amplitude of the seismic acceleration loaded in the test was 0.2 g, with a duration of 48 s. The seismic load was applied in the horizontal Y direction, perpendicular to the slope strike. The shaking-table system was MTS, and the acceleration response data were collected using the MTS data acquisition system. The earth pressure data were collected using the Tokyo Sokki DS-50A dynamic acquisition instrument (Tokyo Sokki Kenkyujo Co., Ltd., Tokyo, Japan).

3.2. Slope Surface Acceleration Response

The cross-section shown in Figure 8 was selected as the main monitoring location. The horizontal acceleration response and Fourier amplitude spectrum data at the pile top under a peak acceleration of 0.2 g are compared in Figure 9. The acceleration response was obtained from the time history measurement points, and the stress and displacement data were extracted from the final displacement and stress after the calculation ended.
As shown in Figure 10, the maximum and minimum accelerations at the pile top obtained from the numerical simulation and the shaking table test were 0.483 g, −0.644 g and 0.452 g, −0.713 g, respectively. The corresponding errors between the two were 0.031 g and 0.069 g, with relative errors of 6.86% and 9.68% compared to the experimental results, both of which are less than 10%.
In the shaking-table test, the main frequency of the Fourier amplitude spectrum at the pile top measurement point was approximately 20 Hz. The frequency similarity ratio was Sω = 0.16, converting to a main frequency of 3.2 Hz for the actual slope model pile top, which is approximately equal to the 3 Hz main frequency in the numerical simulation. The difference in the Fourier amplitude spectrum peaks was about 6.25%, indicating a small error. Therefore, the acceleration response at the pile top in both time and frequency domains corresponded well between the numerical simulation and the shaking-table test model.

3.3. Peak Earth Pressure Response Behind Anti-Slide Piles

Figure 10 shows the peak earth pressure data behind the anti-slide piles obtained from numerical simulations and shaking-table tests. As can be seen in Figure 10, the peak earth pressure behind the anti-slide piles in both the numerical simulation and the shaking-table test exhibits a roughly triangular distribution, with higher earth pressure at the top and gradually decreasing earth pressure toward the bottom. At the pile bottom, due to the greater depth, there is still some embedment effect, resulting in a partial rebound in the peak earth pressure at the pile bottom. The distribution curve of earth pressure behind the anti-slide piles in the numerical model is generally consistent with the trend observed in the shaking-table test.

3.4. Peak Displacement Response at Slope Crest and Pile Top

Figure 11 shows the displacement data at the slope crest and pile top. The displacement at the slope crest exhibits a U-shaped distribution, with larger displacements in the middle, smaller displacements on both sides, and a wider opening at the bottom and top. The displacement of the pile top within the reinforced range of the buttressed pile foundation beam retaining wall is relatively uniform, while the displacement of the anti-slide piles on both sides varies significantly, indicating that the pile foundation beam retaining wall has a significant reinforcement effect on the slope anti-slide piles.

4. Parameter Analysis and Discussion

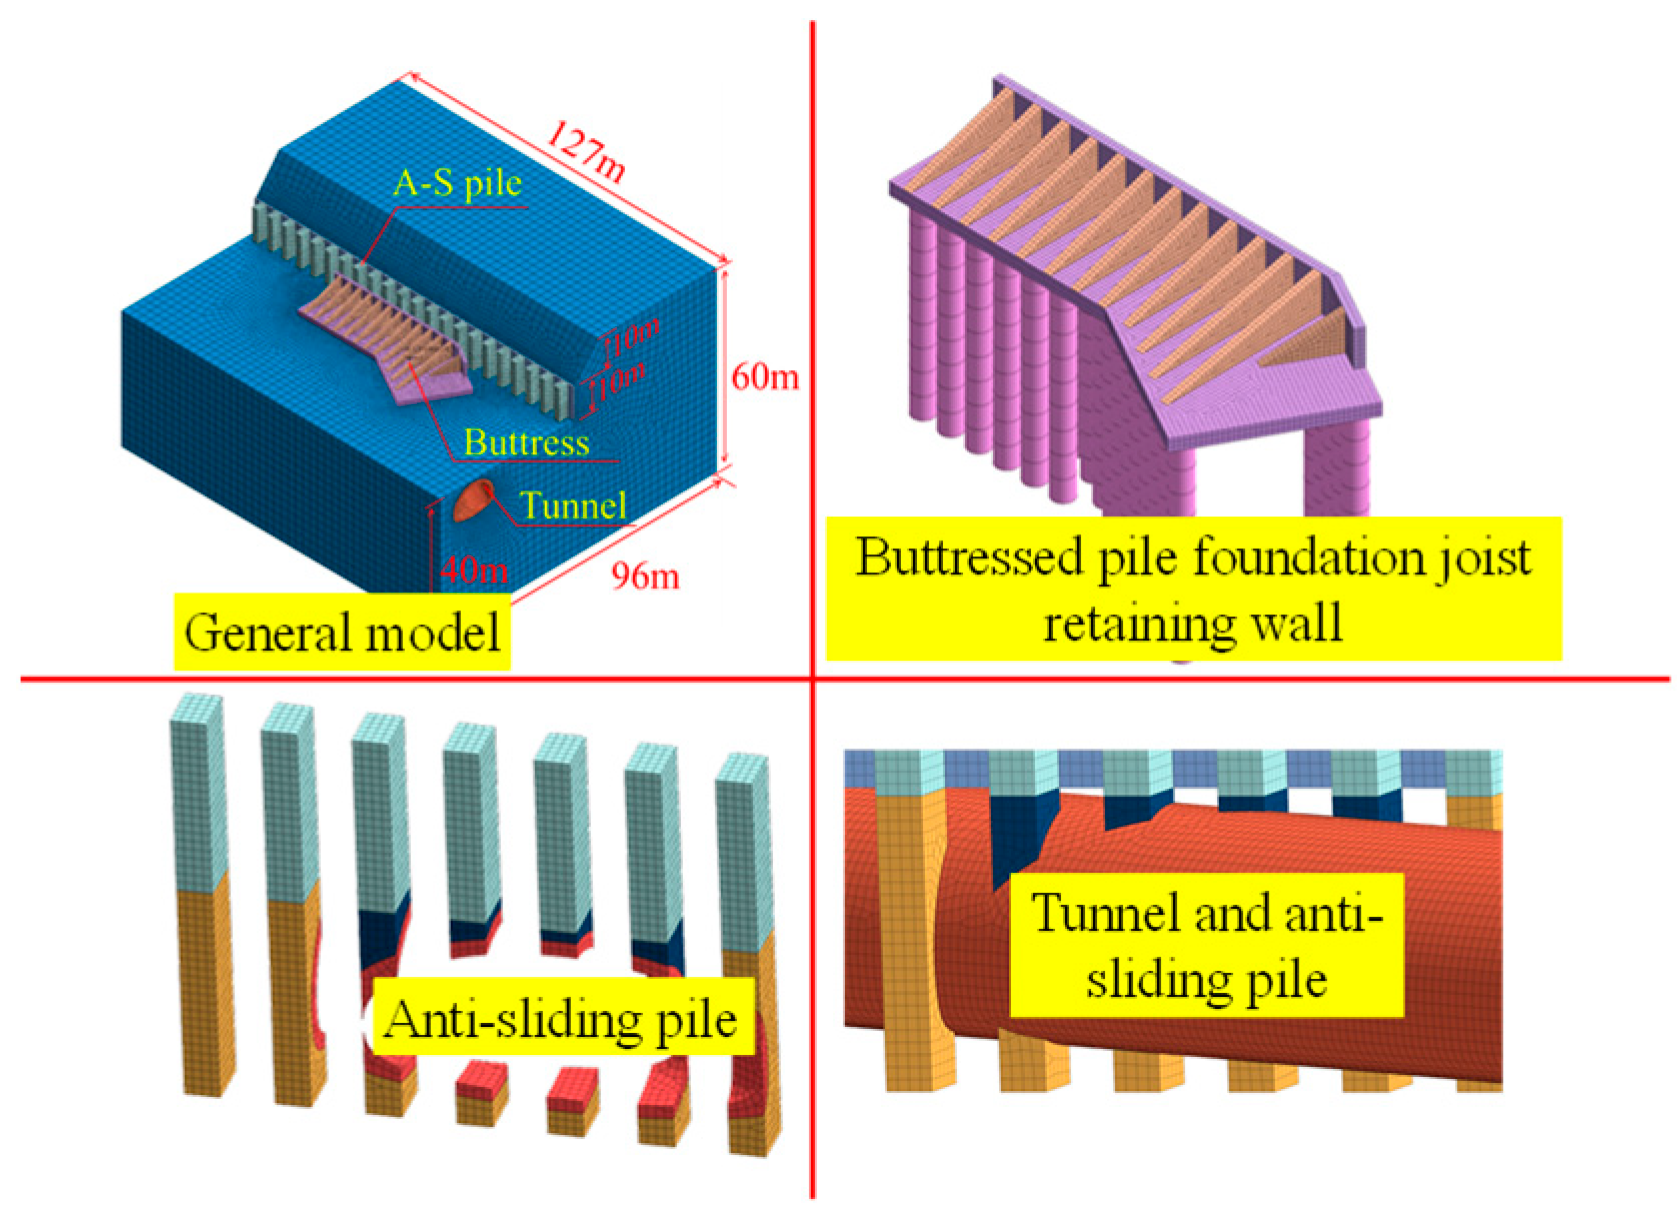
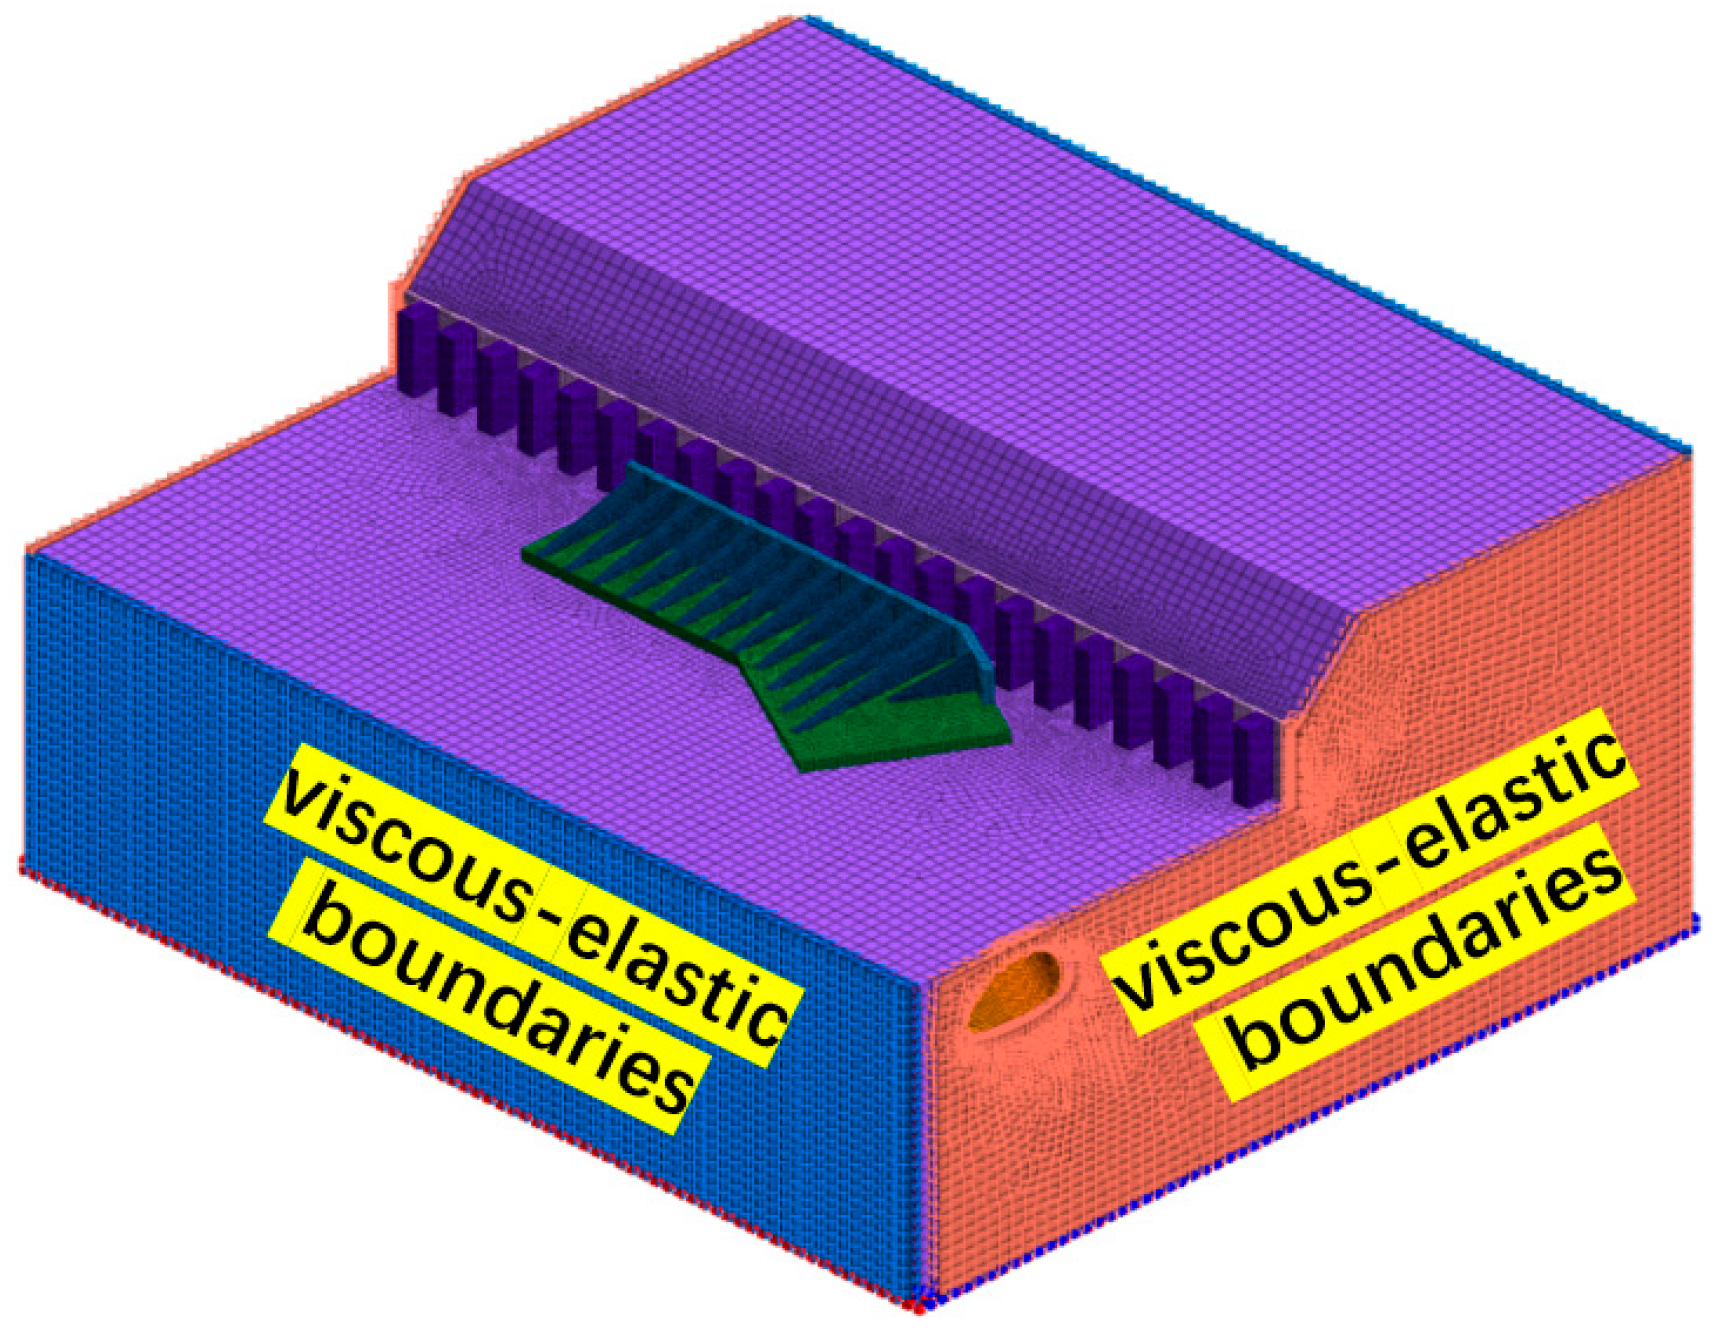
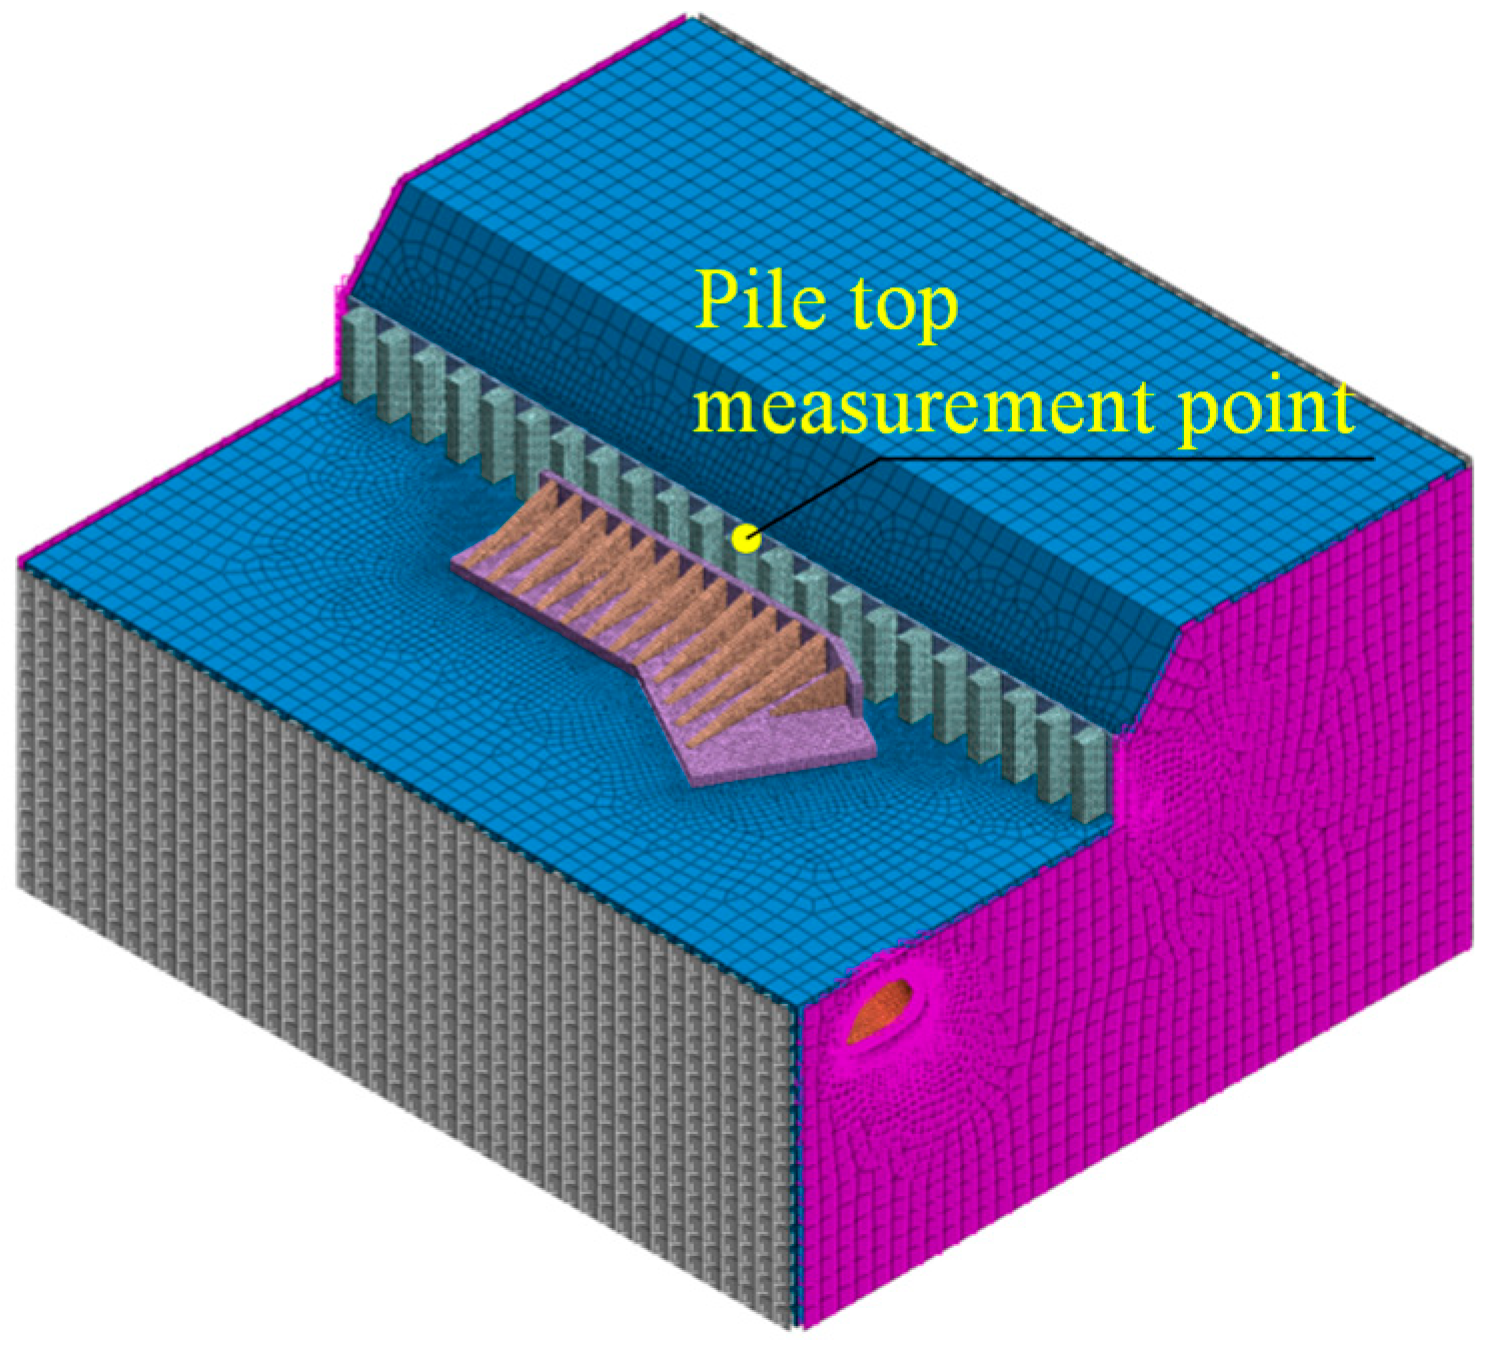
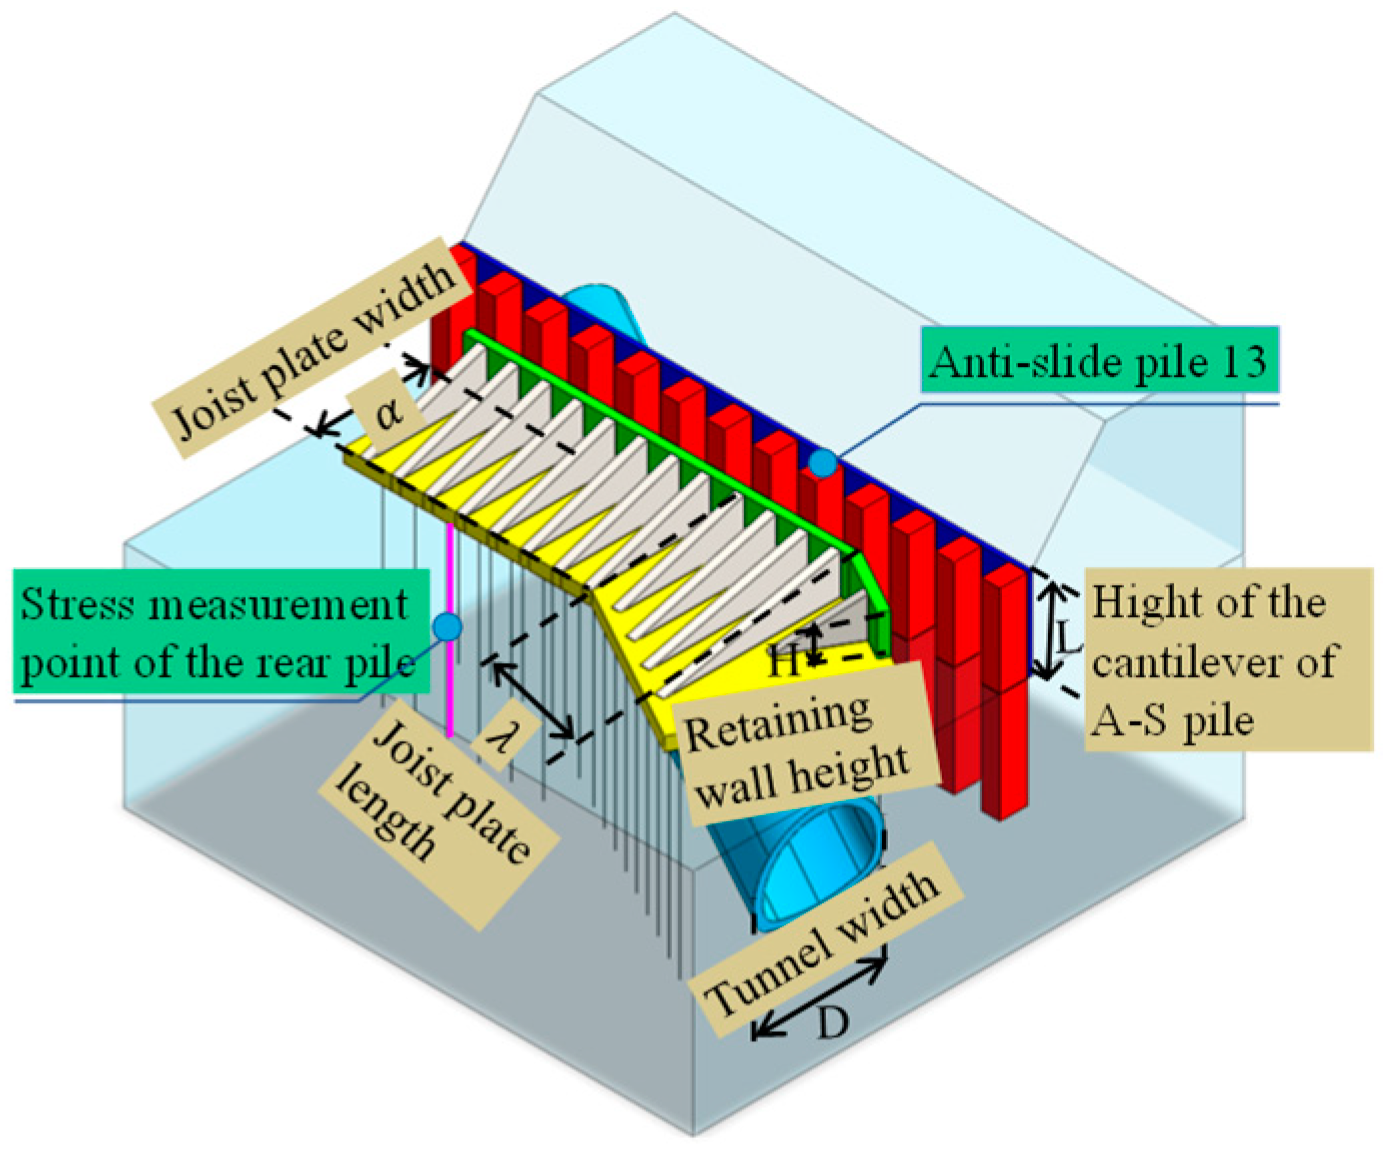
In the design of the underpinning structure, particular attention should be paid to parameters such as the length and width of the transfer beam slab and the height of the retaining wall. Therefore, a parametric analysis was conducted to evaluate the seismic performance and reinforcement effectiveness of the buttressed pile–beam underpinning system based on project requirements. The entire parametric analysis process adopted the same load inputs and boundary conditions as those used in the standard verification model. The extreme values of each parameter analysis model during the seismic response were extracted for discussion. The numerical simulation conditions for the parametric study of the buttressed pile–beam retaining wall are illustrated in Figure 12, and the influencing parameters are listed in Table 5.
The parameter ranges were determined through integrated engineering practice and theoretical analysis: the pile length λ (0.5 D–2.0 D) covers scenarios from shallow sliding control (short piles) to penetrating potential slip surfaces (long piles); the pile width α (2.0 H–3.5 H) ensures minimum longitudinal stiffness (2.0 H for shear resistance) while coordinating bending capacity with beam height H; the height range H (0.4 L–1.0 L) adheres to anchorage requirements (0.4 L prevents overturning and 1.0 L enables full cross-sectional load transfer in anti-slide piles). Detailed values are provided in Table 5.
To study the mechanical performance of the buttressed pile foundation beam retaining wall, the stress distribution at the top of the front and rear piles in the third group on the right side of the pile foundation and the stress distribution at the junction of the 13th anti-slide pile (from left to right) and the retaining wall were analyzed, as shown in Figure 12.

4.1. Influence of Beam Slab Length

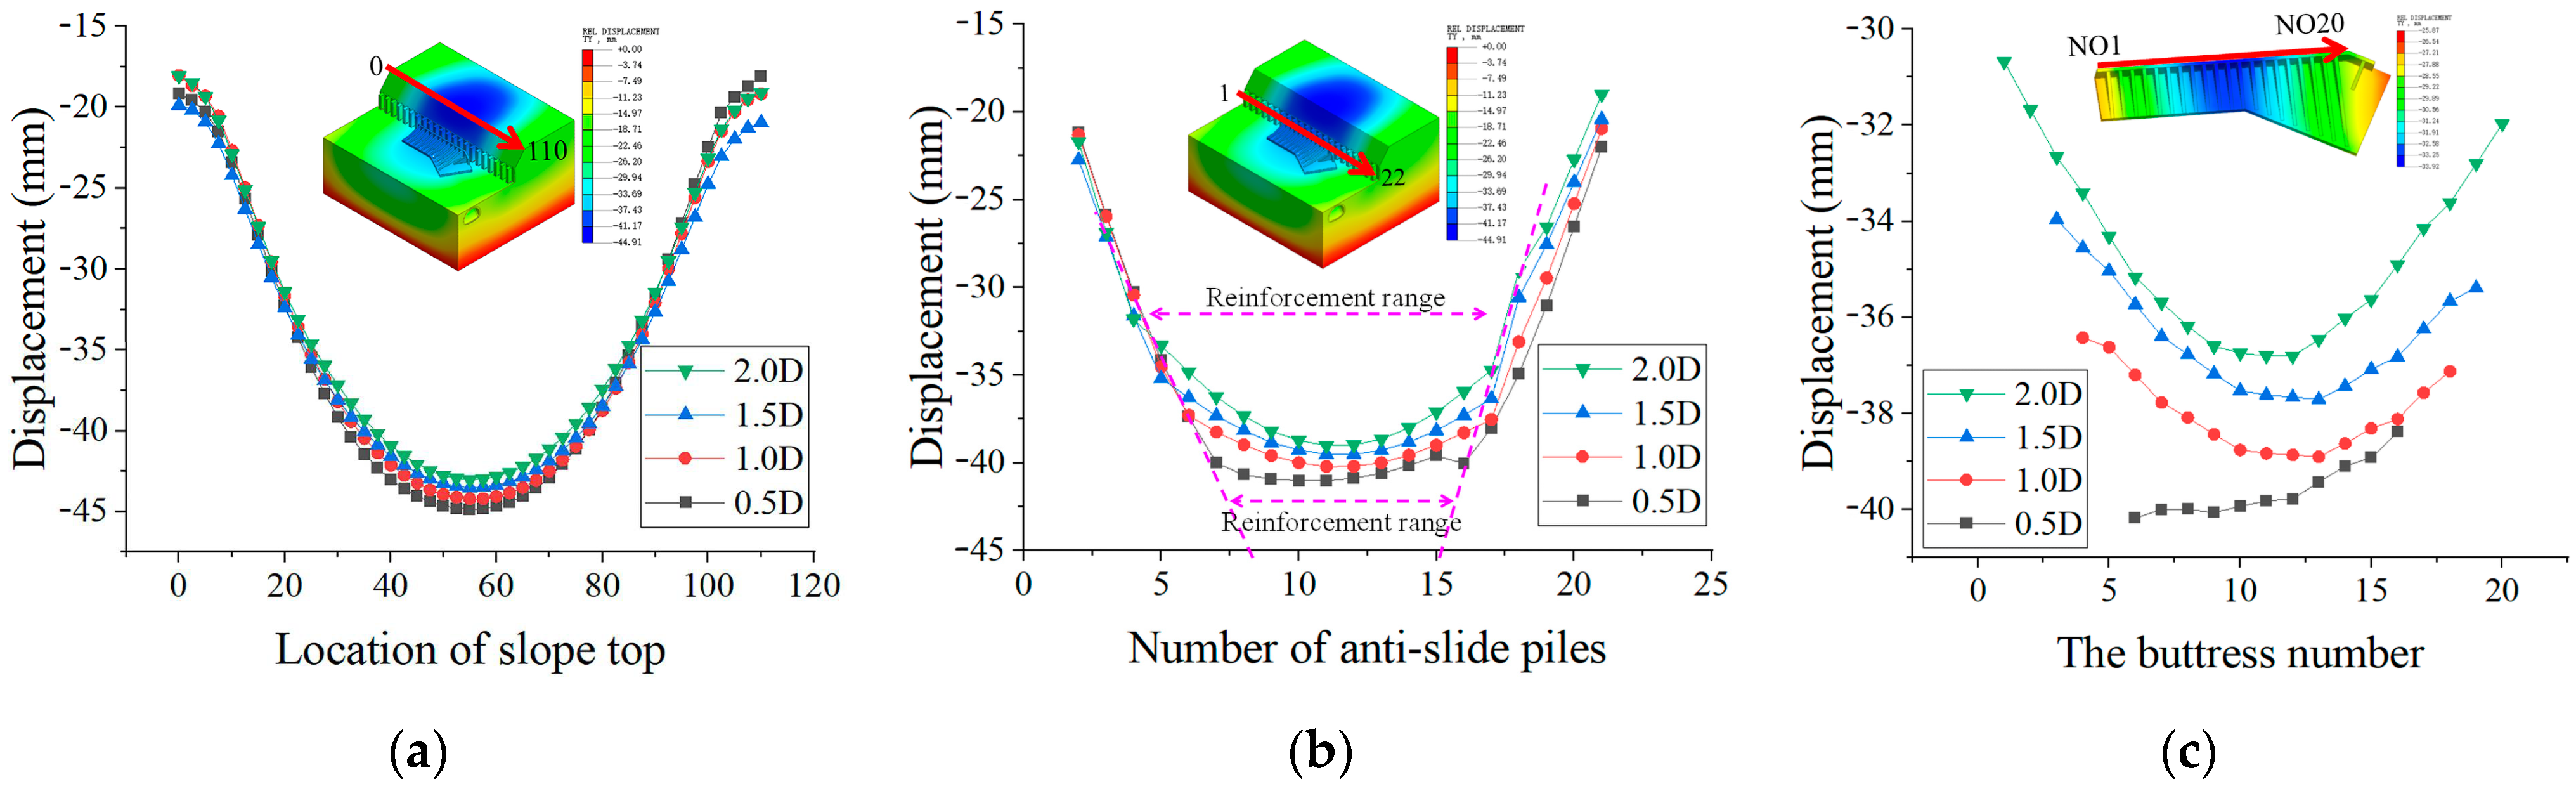
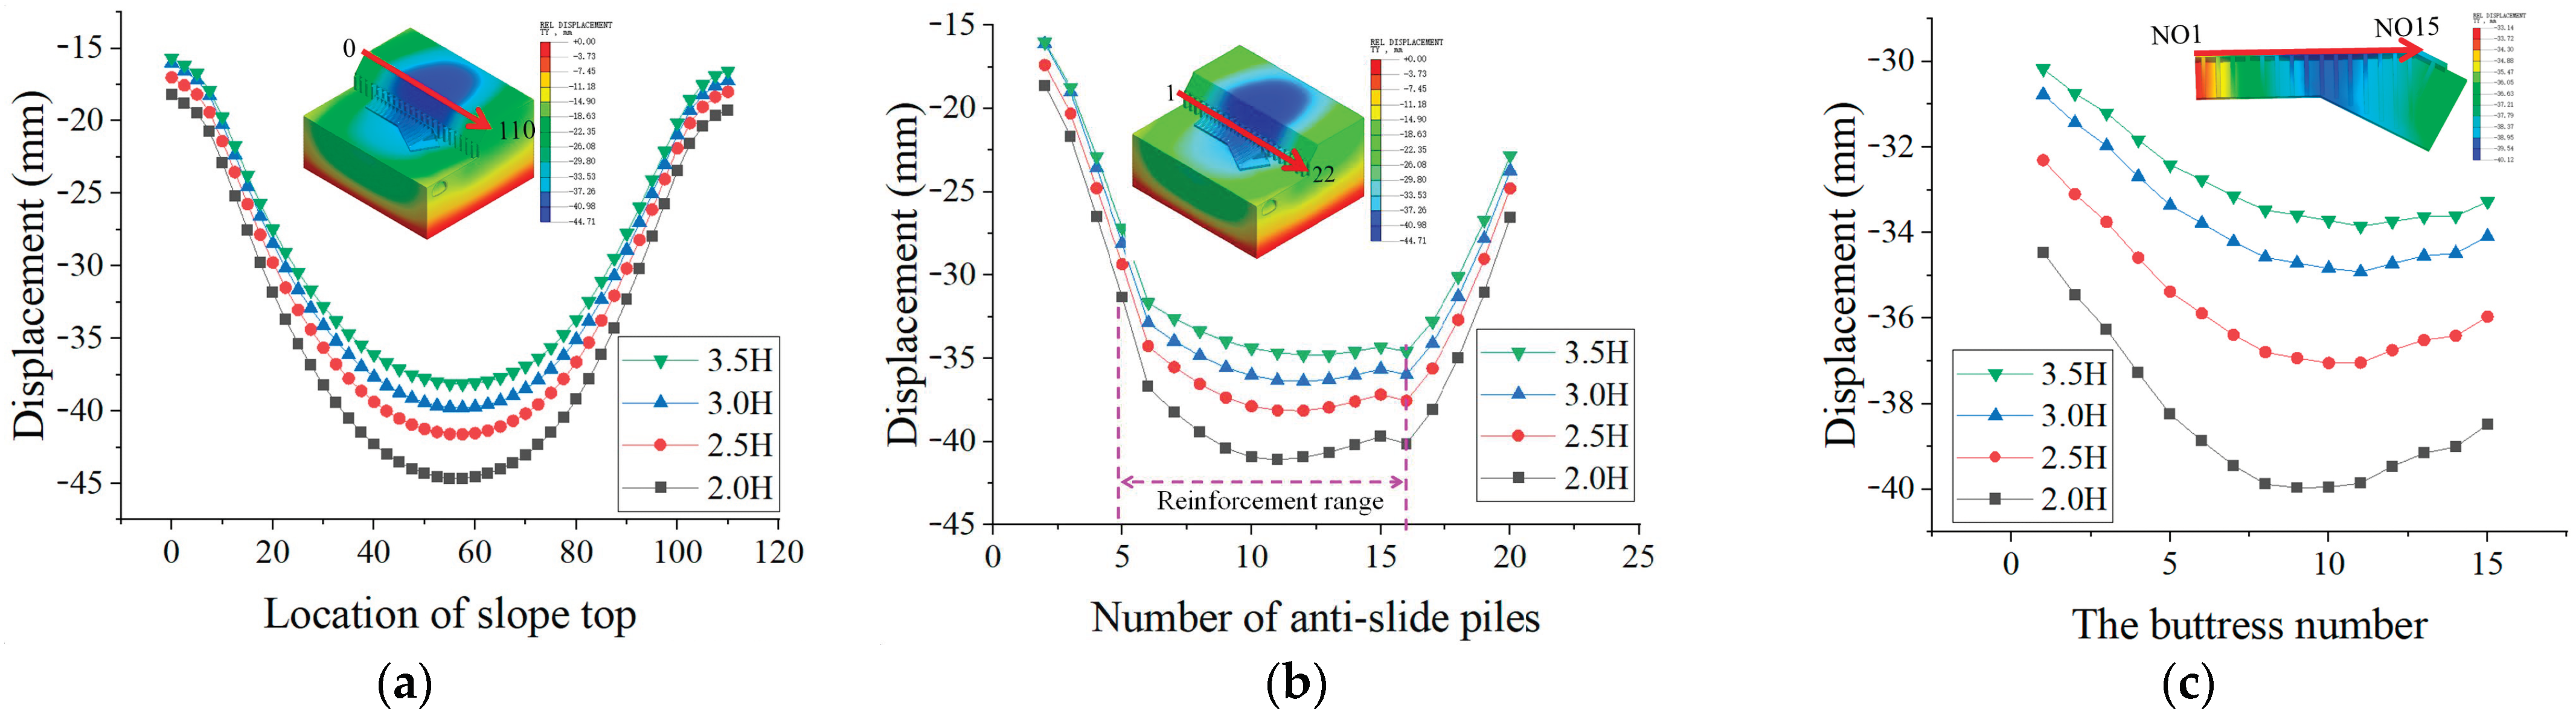
Figure 13 shows the displacement distribution at the slope crest, pile top, and buttress for different beam slab lengths. As shown in Figure 13a, different beam slab widths do not change the distribution pattern of horizontal displacement at the slope crest and pile top. When the beam slab length increases from 0.5 D to 2.0 D, the displacement at the slope crest and pile top decreases from 1.85 mm ± 0.1 mm to 2.1 mm ± 0.1 mm, indicating that increasing the beam slab length has a minor effect on displacement. As shown in Figure 13b, the transition point of pile top displacement between the reinforced and non-reinforced sections of the pile foundation beam retaining wall is quite noticeable. As shown in Figure 13c, the beam slab length has a significant impact on the displacement of the buttressed pile foundation beam. In the case of a beam slab length 0.5 times the tunnel radius, due to the shorter beam slab length, the reinforcement length on the right side is insufficient, and the lack of support similar to buttress 21 on the left side causes the horizontal displacement to gradually increase from buttress rib 20 towards buttress rib 1, with the maximum horizontal displacement occurring on the far right, reaching 40.2 mm ± 1.0 mm. When the beam slab length increases to 1.0 D, the displacement of the retaining wall exhibits a symmetrical distribution with larger displacements in the middle and smaller displacements on both sides. As the beam slab length further increases, the reinforcement range of the anti-slide piles expands and the maximum horizontal displacement of the buttressed pile foundation beam retaining wall gradually shifts to the middle, showing a symmetrical distribution on both sides.
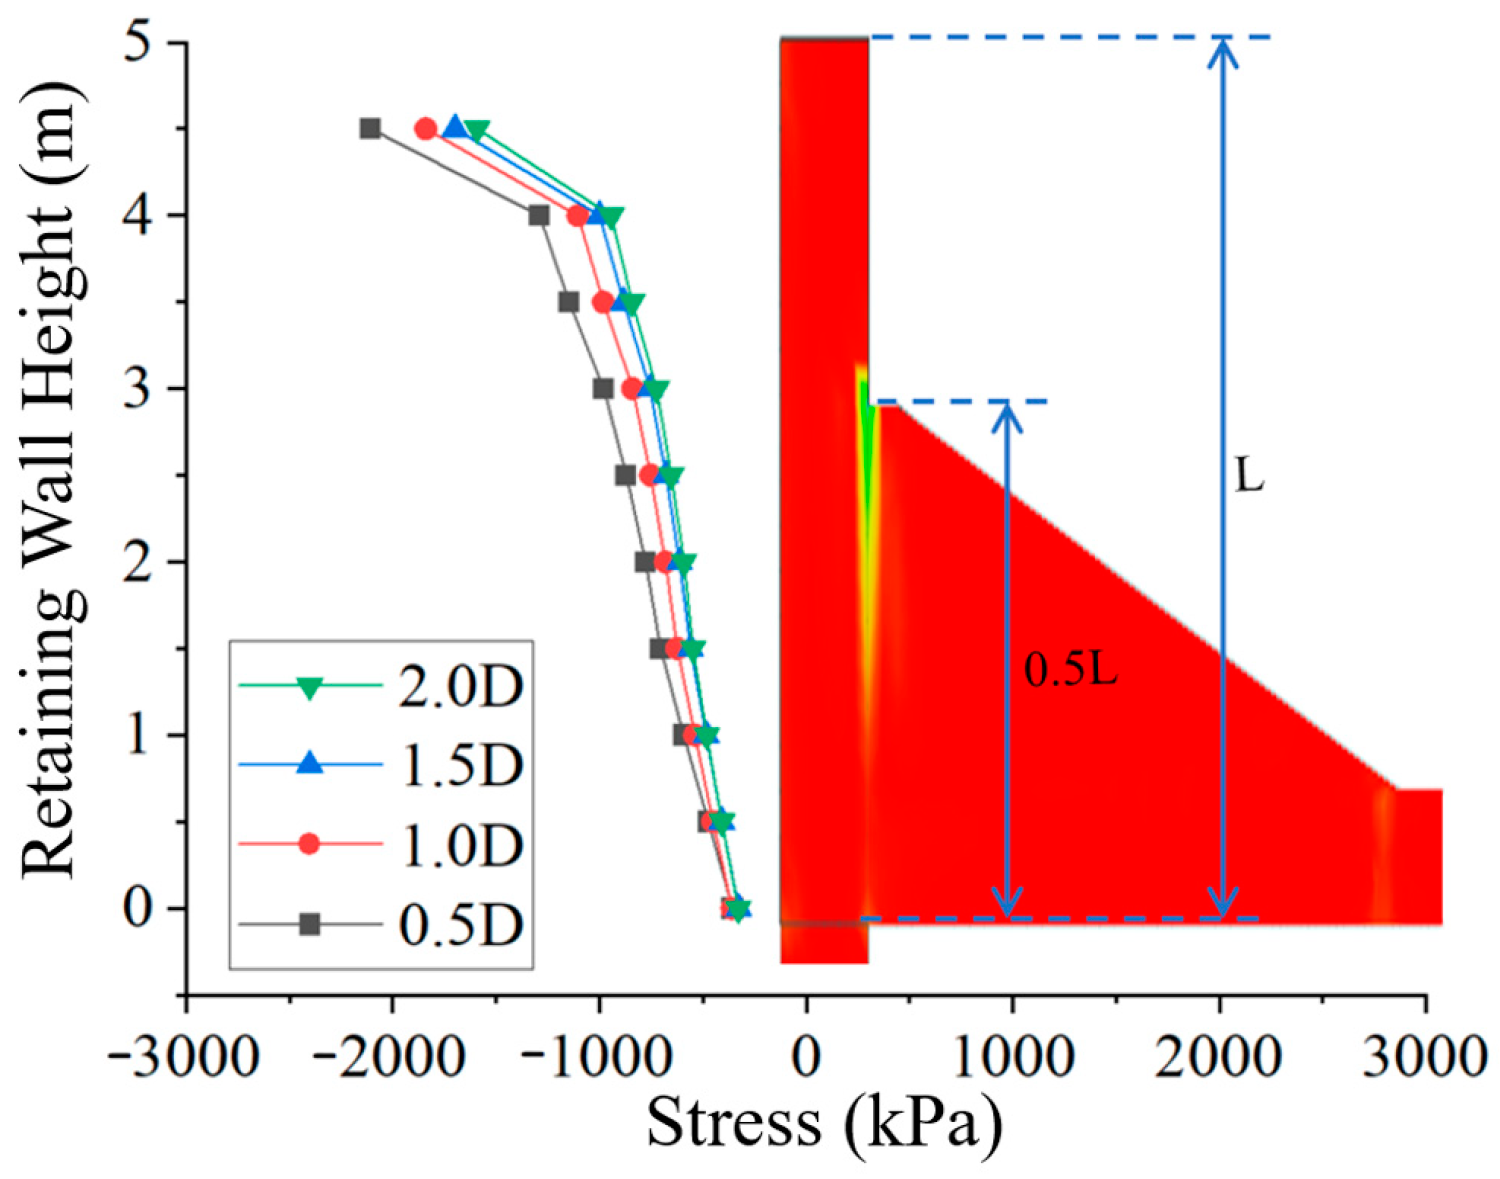
Figure 14 shows the stress distribution at the retaining wall for different beam slab lengths. The strain of the retaining wall increases nonlinearly with height. Taking the 0.5 D beam slab length as an example, the maximum stress at the top of the retaining wall is 2107.18 kPa ± 50 kPa, and the stress rapidly decreases to 1290.55 kPa ± 50 kPa at a height 0.5 m lower, showing a reduction of 38.7%. This indicates a sudden change at a height of 4 m, with a stress concentration at the top 0.5 m. Additionally, as the beam slab length increases, the stress on the retaining wall decreases slowly.
Table 6 shows the stress extremes at the top of the front and rear piles below the beam slab. As shown in Table 2, different beam slab lengths have little effect on the stress difference between the front and rear piles.

4.2. Influence of Beam Slab Width

Figure 15 illustrates the distribution of extreme displacement values at the slope crest, pile top, and buttress for different widths of the transfer beam slab. As shown in Figure 15a, when the width of the transfer beam slab increases from 2.0 H to 2.5 H, the extreme horizontal displacement at the slope crest decreases by nearly 5 mm ± 0.1 mm. However, the effectiveness of the slope support gradually diminishes with further increases in width. Additionally, the increase in width does not alter the distribution pattern of the horizontal displacement curves at the slope crest and pile top. As depicted in Figure 15b, there is a clear distinction in the horizontal displacement at the pile top between slopes reinforced with buttressed pile–beam retaining walls and those without such reinforcement.
As shown in Figure 15c, the influence of the transfer beam slab width on the reinforcement effect of the buttressed pile–beam retaining wall is primarily manifested through the soil-arching effect. The width of the transfer beam slab affects the clear spacing between the double-row piles beneath it, and this spacing controls the bearing capacity of the soil arch between the piles [23]. As the pile spacing increases, the soil-arching effect becomes more pronounced, which enhances the anti-sliding capacity of the buttressed pile–beam retaining wall, thereby reducing the displacement of the anti-slide piles. While increasing the width of the transfer beam slab has a positive effect on the reinforcement of the buttressed retaining wall, it diminishes the positive impact on the displacement of the buttress.
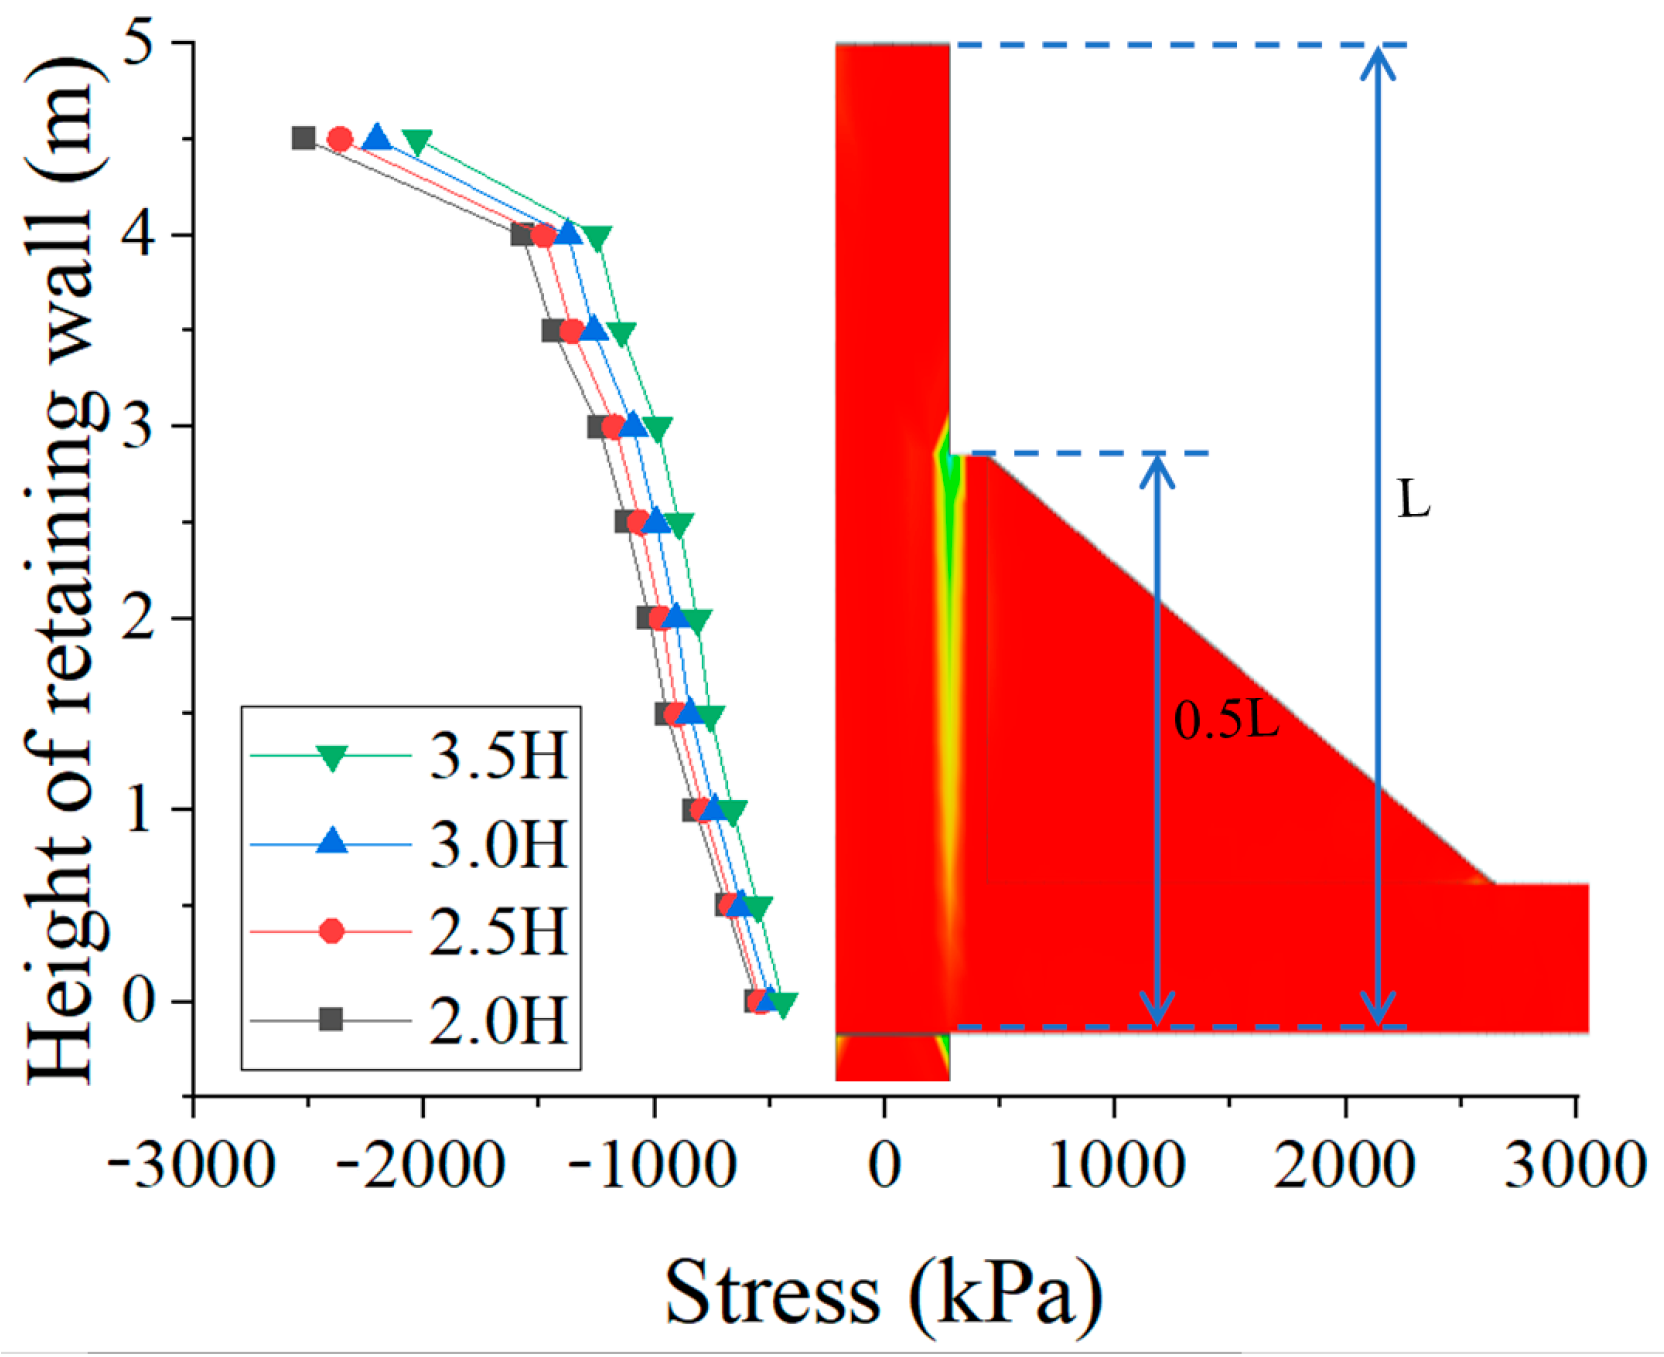
Figure 16 shows the stress distribution at the retaining wall for different beam slab widths. The stress of the retaining wall increases nonlinearly with height. Taking the 2.0 H beam slab width as an example, the maximum stress at the top of the retaining wall reaches 2518.83 kPa ± 50 kPa and the stress rapidly decreases to 1752.625 kPa ± 50 kPa at a height 0.5 m lower, showing a reduction of 30%. A sudden change occurs at a height of 4 m, indicating a stress concentration at this location. As the beam slab width increases, the stress on the retaining wall decreases, but the rate of reduction is slower than that achieved by increasing the length of the transfer beam slab. When the width of the transfer beam slab increases from 2.0 H to 2.5 H, 3.0 H, and 3.5 H, the reduction rates of strain at the top of the retaining wall are 6.13%, 6.68%, and 8.07%, respectively. Correspondingly, the required concrete volume increases by 8.01%, 7.95%, and 8.53% when the width increases from 2.0 H to 2.5 H, 3.0 H, and 3.5 H. While the concrete volume increase rate remains roughly equal at each stage, the strain reduction rate gradually rises. This indicates that increasing the width of the transfer beam slab to reduce stress at the top of the retaining wall is more cost-effective than increasing the length of the transfer beam slab.
Table 7 presents the stress extremes of front and rear piles under varying transfer beam slab widths. The data reveal that beam slab width significantly affects the stress difference between front and rear piles. Notably, front pile stress shows minimal variation across configurations and consistently exceeds rear pile stress, demonstrating that the front pile and soil-arching effect dominate landslide resistance. This implies that increasing the beam slab width (and thus pile spacing) amplifies the deformation incompatibility in the buttressed pile-supported retaining wall system. Therefore, reducing the pile spacing and beam slab width appropriately can mitigate the pile stress imbalance.

4.3. Influence of Retaining Wall Height

Figure 17 illustrates the distribution of extreme displacement values at the slope crest, pile top, and buttress for different retaining wall heights. As shown in Figure 17a, the influence of varying retaining wall heights on the distribution pattern of horizontal displacements at the slope crest and pile top is minimal. The horizontal displacements at both the pile top and slope crest reach their maximum values at the broken pile section. The displacement at the slope crest decreases nonlinearly as the retaining wall height increases.
As depicted in Figure 17b, with the increase in retaining wall height, the displacement curve of the anti-slide piles within the retaining wall range changes from a downward convex curve with a larger curvature to one with a smaller curvature. This indicates that increasing the retaining wall height has a positive effect on the reinforcement of the anti-slide piles, making their displacements more consistent. Additionally, the extreme horizontal displacement of the anti-slide piles consistently occurs at piles numbered 11 and 12.
As shown in Figure 17c, increasing the retaining wall height has a positive effect on the reinforcement of the buttressed retaining wall, but the rate of this positive effect decreases as the wall height increases. Theoretically, when the height of the retaining wall and the width of the transfer beam slab are equal, both at 13 m, forming an isosceles right triangle, the materials of the retaining wall and transfer beam slab can be utilized more efficiently. Equal lengths of the two perpendicular sides facilitate relatively uniform stress distribution, enhancing the supporting effect of the transfer beam slab and improving the stability and seismic performance of the retaining wall structure. This demonstrates that the height of the retaining wall significantly influences the overall stress distribution of the buttressed pile–beam retaining wall.
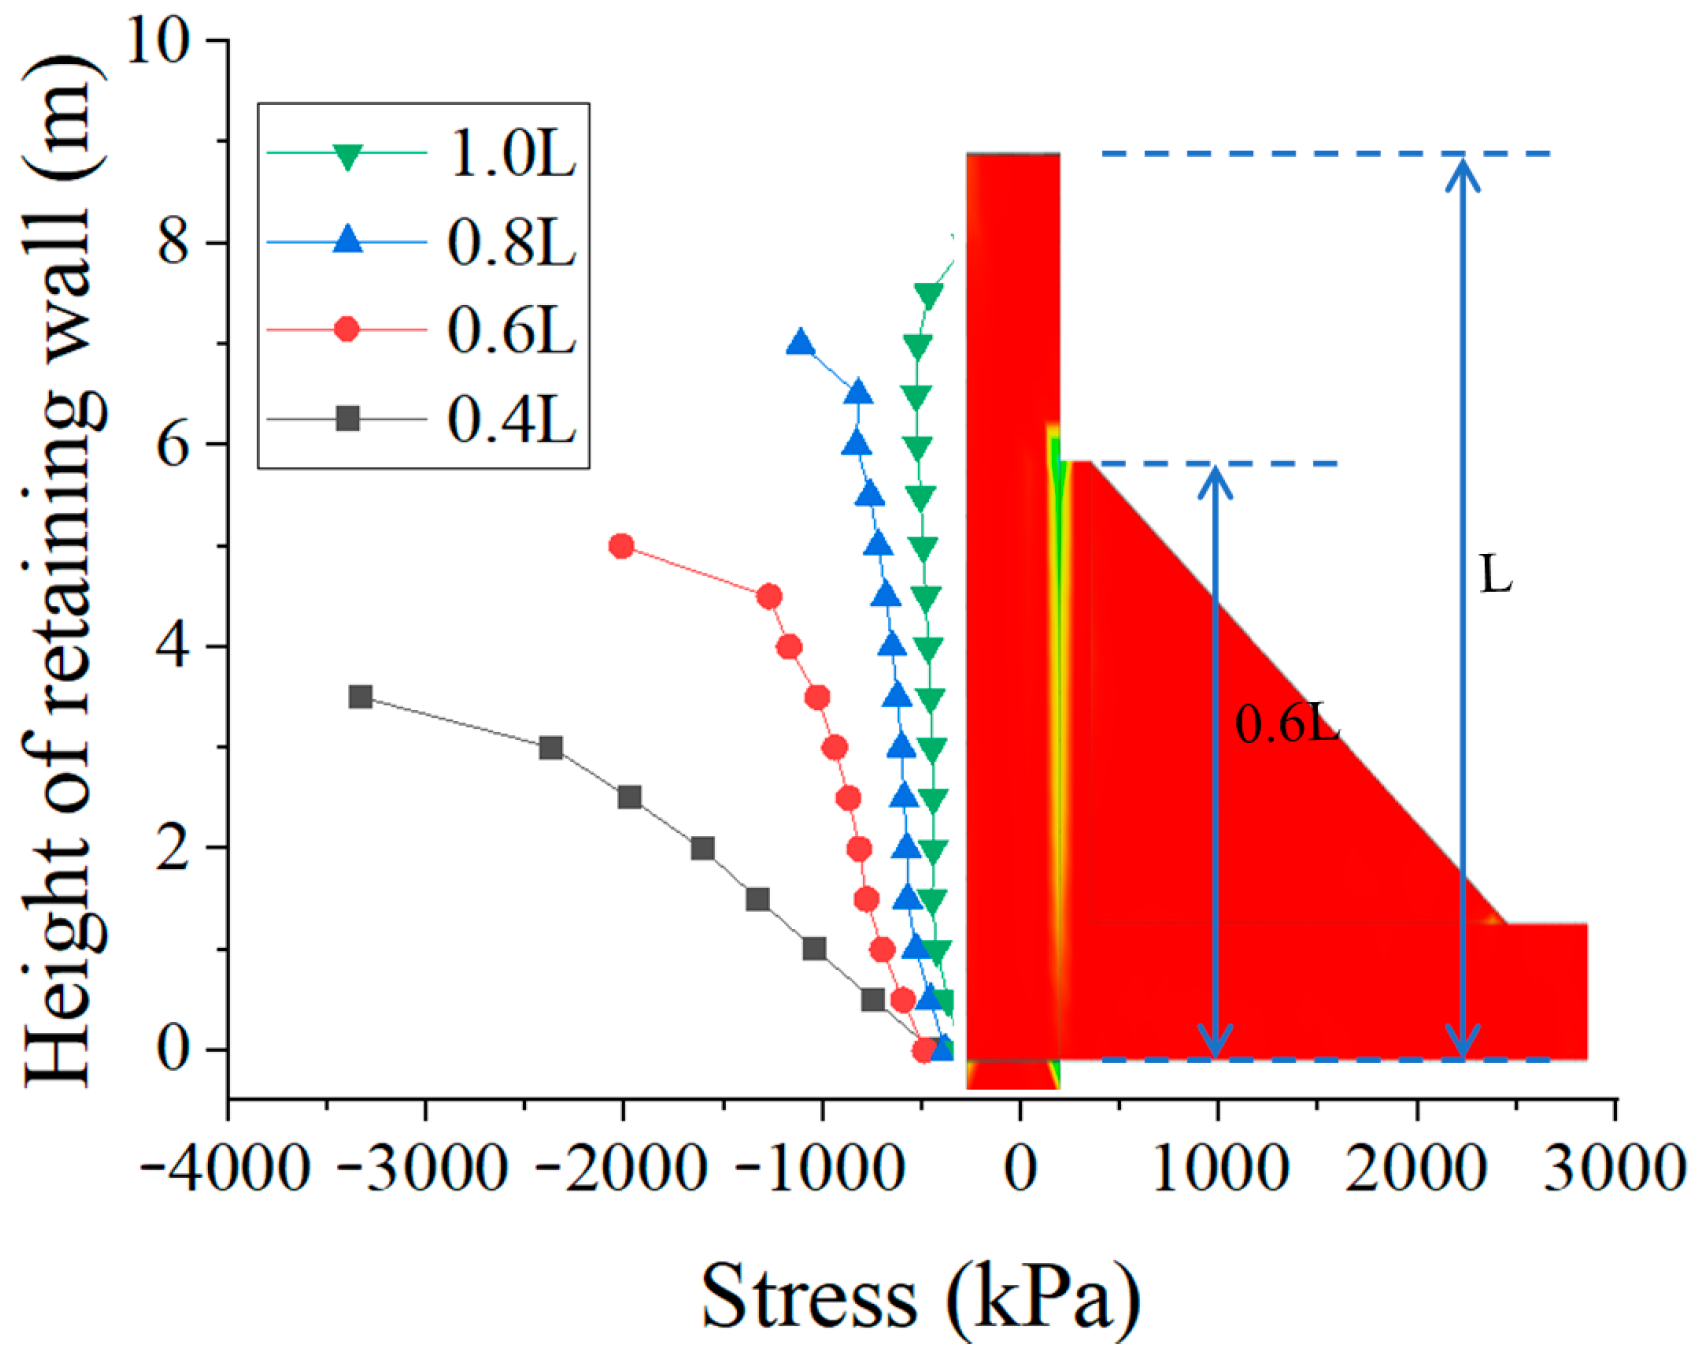
Figure 18 shows the stress distribution at the retaining wall for different retaining wall heights. The design height of the retaining wall affects the stress distribution pattern. When the design height of the retaining wall is less than 1.0 L, the maximum stress occurs at the top of the retaining wall; when the design height equals 1.0 L, the stress at the top of the retaining wall is the minimum.
As the design height of the retaining wall decreases below 1.0 L, the stress on the retaining wall decreases rapidly. When the design heights are 0.4 L, 0.6 L, 0.8 L, and 1.0 L, the strain at the top of the retaining wall decreases by 39.5%, 44.81%, and 52.43%, respectively; the corresponding increase in concrete volume is 14.3%, 12.51%, and 11.12%. The rate of stress reduction accelerates, while the incremental increase in concrete volume decreases, indicating that increasing the design height of the retaining wall can effectively reduce its stress.
Table 8 shows the stress extremes at the front and rear piles for different retaining wall heights. The retaining wall height has a significant effect on the stress difference between the front and rear piles. The higher the retaining wall height, the smaller the stress difference between the front and rear piles.
For different retaining wall heights, the stress on the front pile gradually decreases, and the stress on the front pile is always greater than that on the rear pile. When the retaining wall height increases from 0.4 L to 0.6 L, the stress on the rear pile increases while the stress on the front pile decreases; when the retaining wall height further increases to 0.8 L and 1.0 L, the stress on both the front and rear piles decreases. When the retaining wall height is small, the entire buttressed pile foundation beam retaining wall mainly relies on the pile foundation for anti-sliding force; when the retaining wall height is large, the anti-sliding capacity of the retaining wall itself increases, reducing its dependence on the pile foundation.

4.4. Selection Recommendations

In seismic zones, the impact of seismic forces on retaining structures is typically several times greater than that of static forces. Therefore, to fully consider the overall seismic performance and the influence during tunnel excavation, the Technical Code for Structural Safety Protection of Urban Rail Transit (CJJ/T 202-2013) specifies that for deep-buried mining method tunnels, the external operation influence zone remains a strongly affected area within the tunnel’s frontal and lateral 1.0b range (where b is the tunnel span) [24]. Consequently, the minimum length of the transfer beam slab should be at least one times the tunnel width.
When the width of the transfer beam slab increases from 2.0 D to 2.5 D, 3.0 D, and 3.5 D, the corresponding increase in concrete volume is 8.01%, 7.95%, and 8.53%, respectively, indicating a linear increase in concrete usage. As the concrete volume increases, the reinforcement effect on the slope anti-slide piles gradually weakens and the stress difference between the front and rear piles becomes more pronounced. Therefore, the recommended width of the transfer beam slab is 3.0 times the height of the retaining wall. At this width, the displacements at the slope crest and pile top remain within controllable limits, the bearing capacity of the soil-arching effect is fully utilized, and both the front and rear piles can function effectively.
When the height of the retaining wall increases from 0.4 L to 0.6 L, 0.8 L, and 1.0 L, the corresponding increase in concrete volume is 14.3%, 12.51%, and 11.12%, respectively. As the concrete volume increases, the reinforcement effect on the slope anti-slide piles gradually weakens, and the stress difference between the front and rear piles becomes more pronounced. Considering the decreasing rate of concrete usage, the recommended height of the retaining wall is 0.6 times the cantilever length of the anti-slide pile. At this height, the displacements at the slope crest and pile top remain within controllable limits, and the stress distribution in the retaining wall is relatively uniform.
Taking into account the reinforcement effect [25], structural stress characteristics, and economic efficiency of the buttressed pile–beam retaining wall under different parameters, the optimal parameters are determined as follows: the length of the transfer beam slab should be one times the tunnel diameter extended at the intersection of the tunnel and slope, the width of the transfer beam slab should be 3.0 times the height of the retaining wall, and the height of the retaining wall should be 0.6 times the cantilever length of the anti-slide pile. Additionally, referencing other studies [1], it is recommended that the horizontal and longitudinal clear spacing of the piles be twice the pile diameter and the thickness of the transfer beam slab be two-thirds of the pile clear spacing.

4.5. Differences in Seismic Performance

The buttressed pile-supported beam-slab retaining wall demonstrates significant differences compared to conventional retaining walls through its “beam-slab–double-row piles–retaining wall” collaborative mechanism. While traditional retaining walls primarily rely on self-weight to balance earth pressure, exhibiting linear displacement distribution at the slope crest with limited adjustment capacity, the buttressed system forms a displacement buffer zone by extending the beam-slab length, resulting in a characteristic U-shaped displacement pattern with larger values at the center and smaller at both sides. Regarding pile stress behavior, conventional walls tend to show synchronous stress increases in both front and rear piles, whereas the new structure achieves dynamic equilibrium through active control of beam-slab width, utilizing soil-arching effects to increase stress in front piles while reducing stress in rear piles. Furthermore, the quantitative relationship between wall height and cantilever length of anti-slide piles provides more precise coordination between structural stability and displacement control compared to traditional empirical design approaches.

5. Conclusions

This study, based on the Panzhihua Sunshine Tunnel anti-slide pile project, analyzed the seismic performance and conducted a shaking-table test. Using numerical simulation methods, the parameters of the buttressed pile–beam retaining wall for reinforcing slope anti-slide piles were optimized. The influences of factors such as the thickness and width of the transfer beam slab and the height of the retaining wall on the displacement of the slope crest, pile top, stress distribution of the retaining wall, and stress difference between the front and rear piles were analyzed. The main conclusions are as follows:
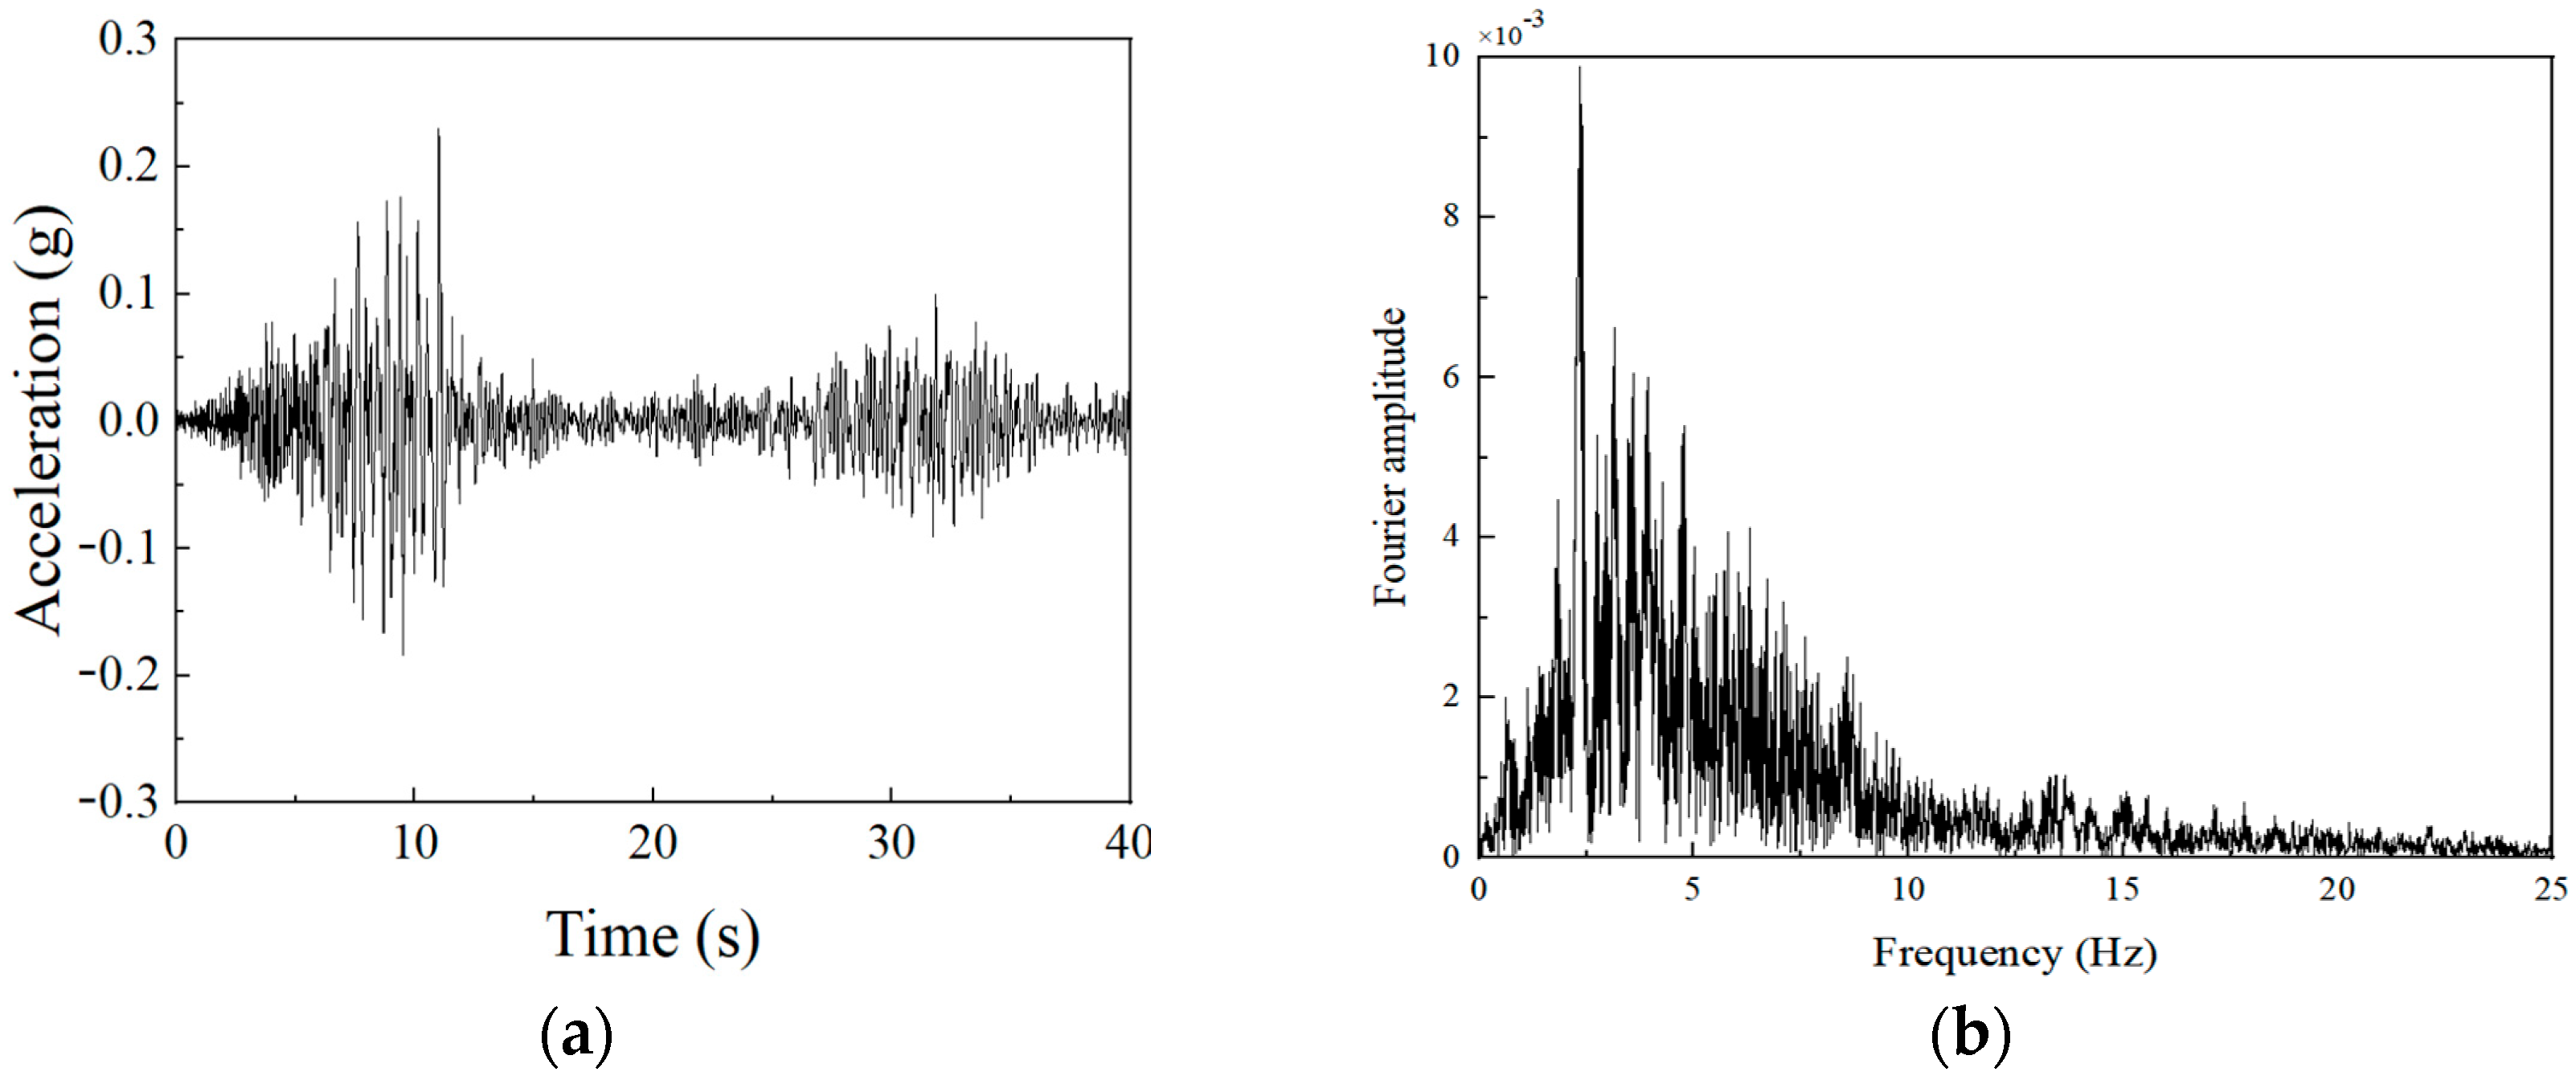
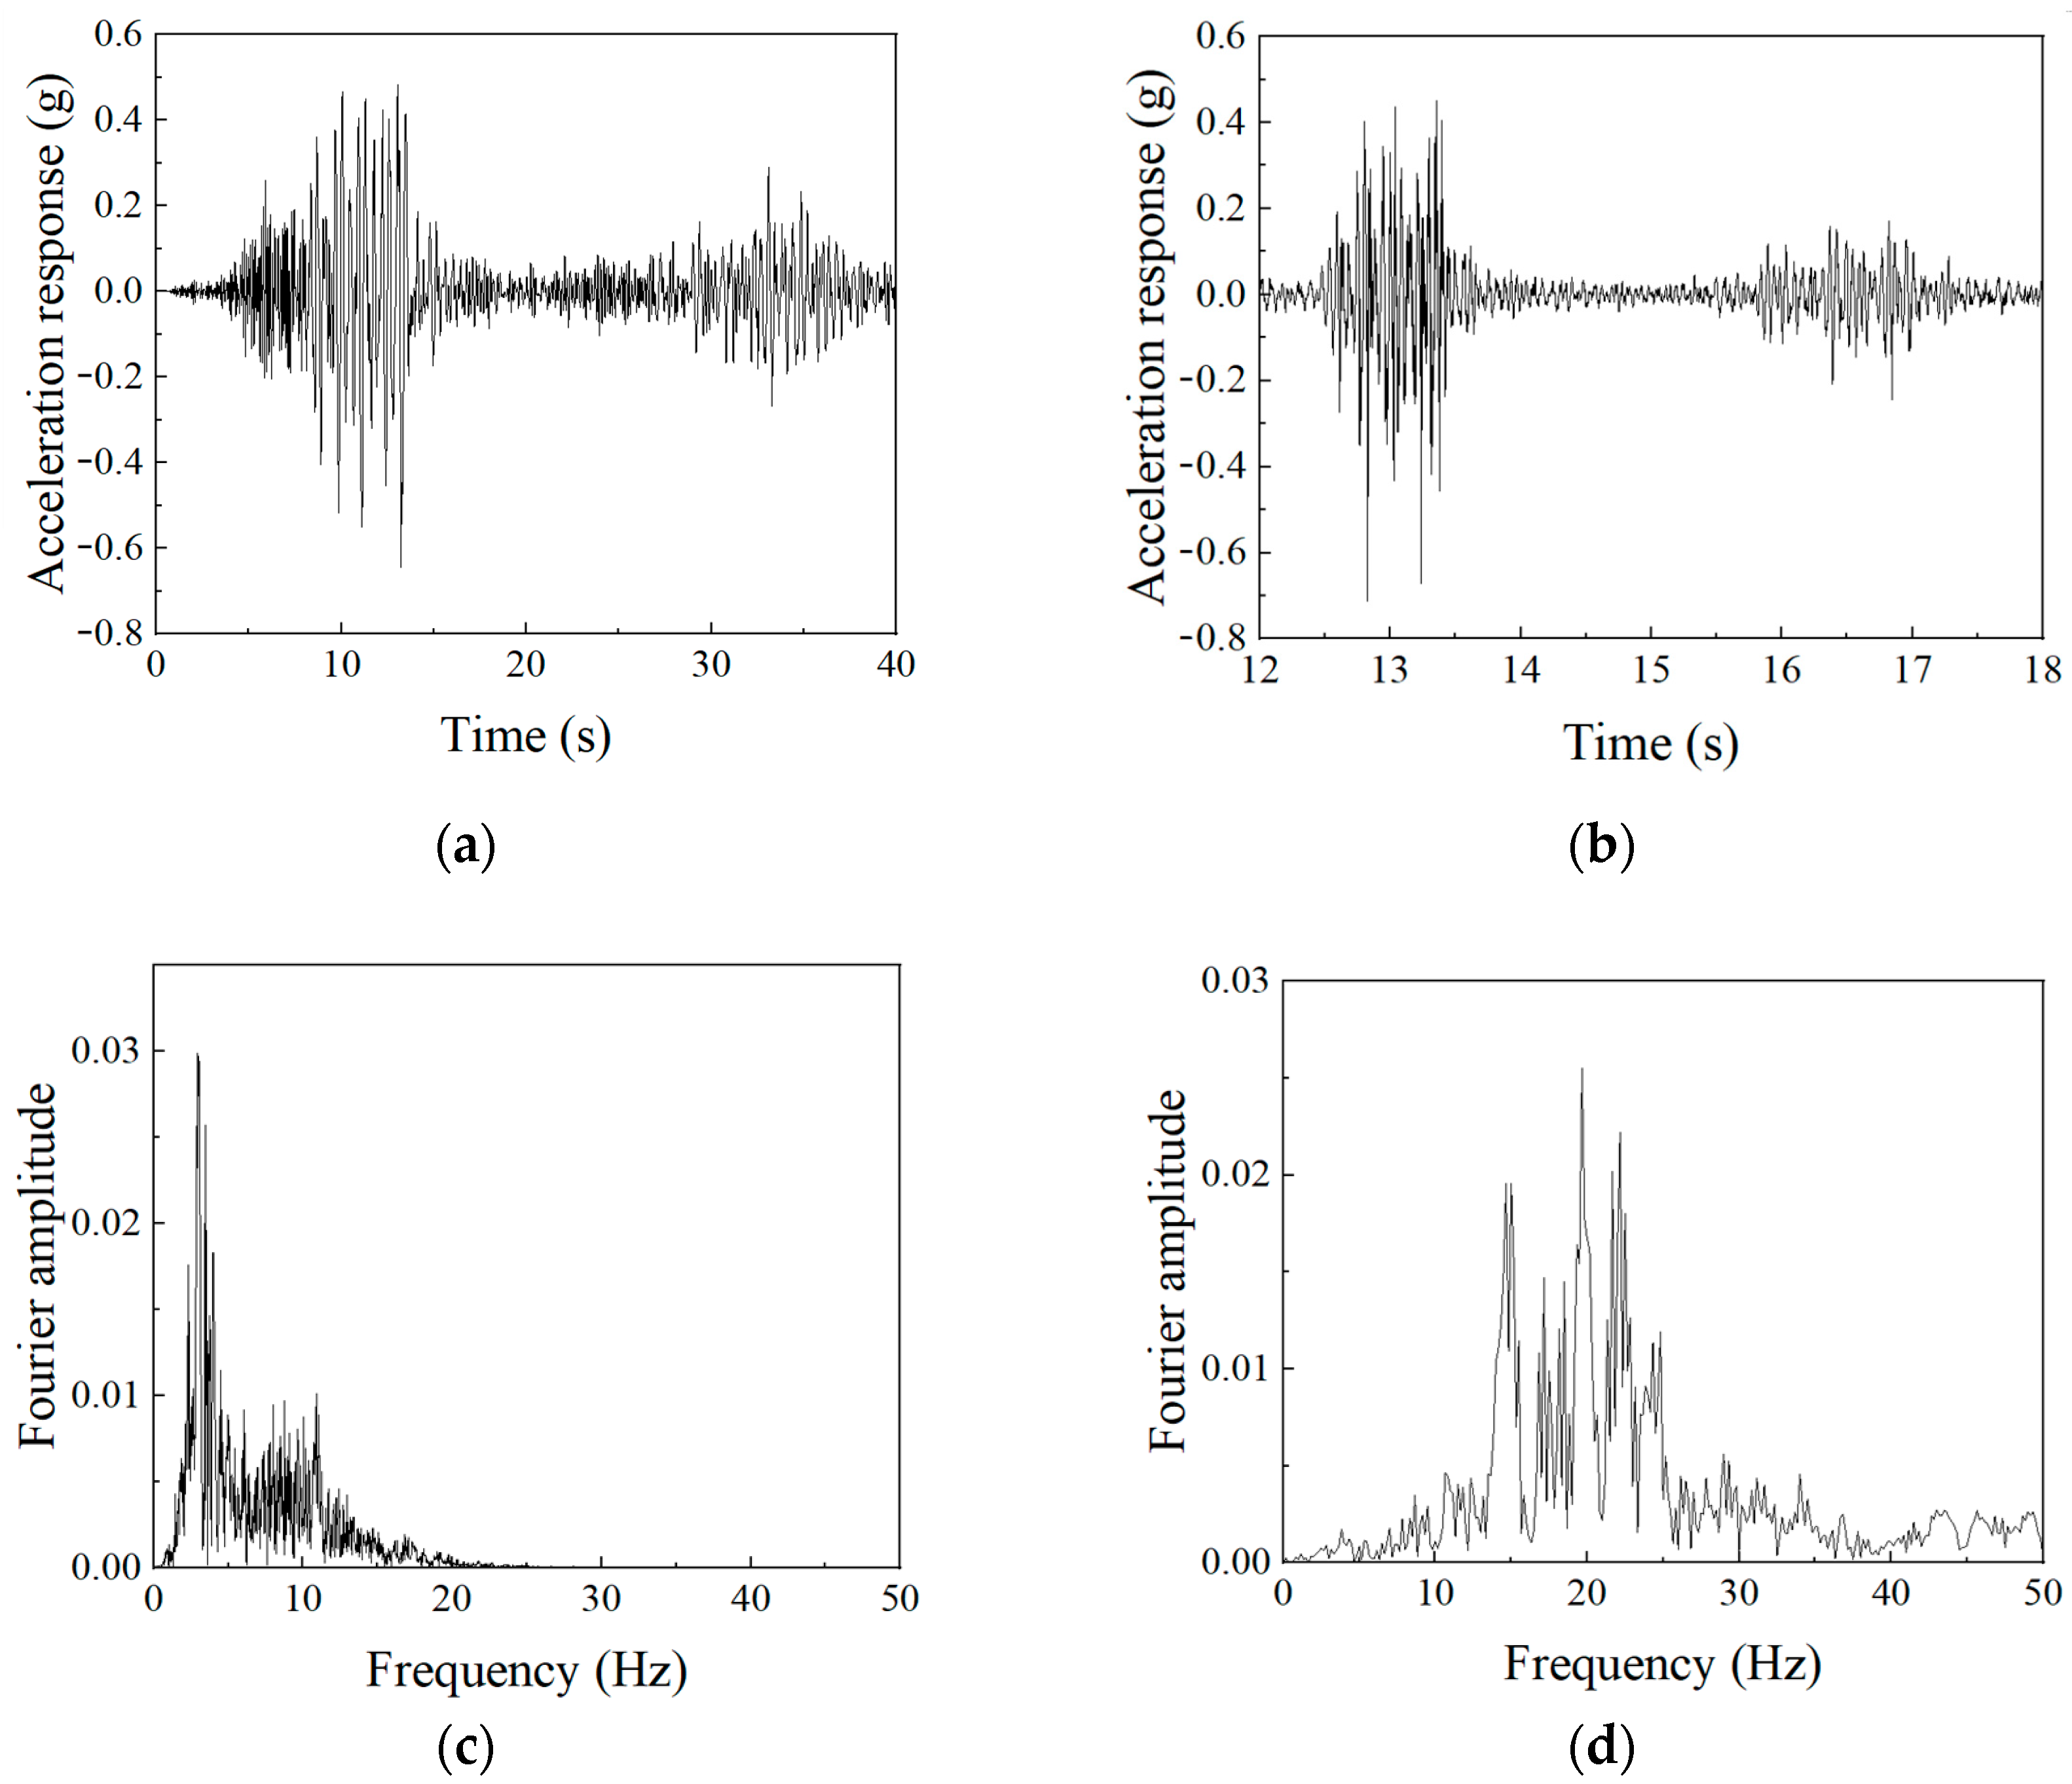
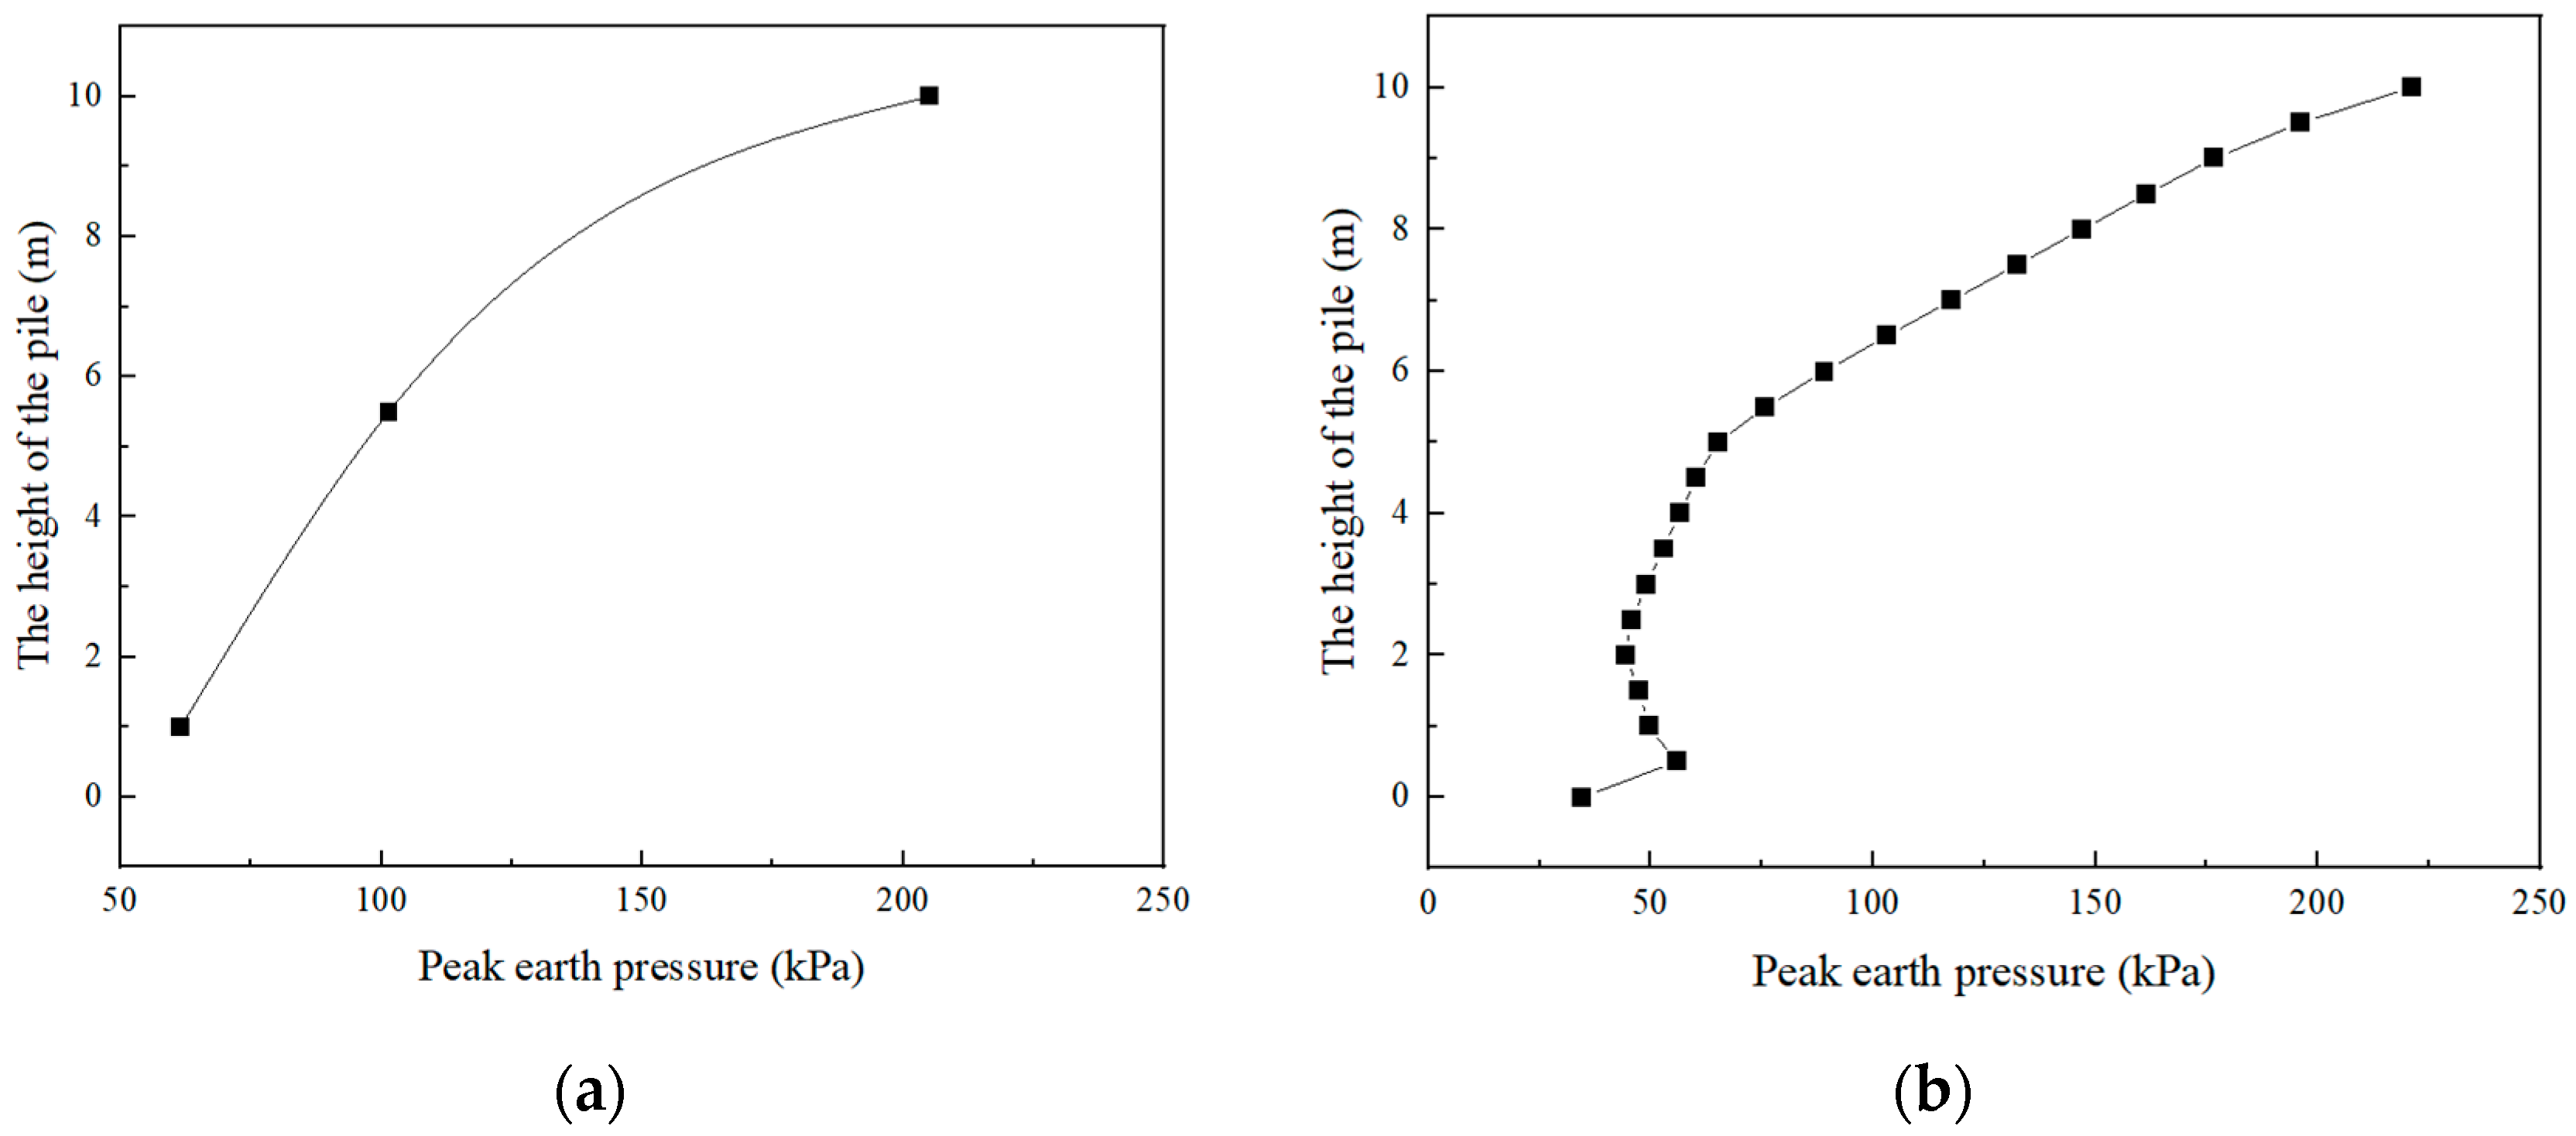
(1) The time–history data of the pile top obtained from the numerical model correspond well with the data collected from the shaking-table test in terms of shape and peak values. The main frequency of the Fourier amplitude spectrum and the trend of peak earth pressure on the anti-slide piles were also well validated.
(2) Increasing the length of the transfer beam slab has a limited effect on reducing the extreme displacements of the slope crest, pile top, and tunnel. However, it significantly improves the displacement and stress state of the buttressed retaining wall, making the displacement and stress distribution more reasonable and uniform.
(3) Due to the soil-arching effect, increasing the width of the transfer beam slab effectively reduces the displacements at the slope crest and pile bottom. However, it leads to increased stress on the front piles and decreased stress on the rear piles, resulting in uneven stress distribution in the buttressed retaining wall.
(4) Increasing the height of the retaining wall enhances its stability and reduces the extreme displacements at the slope crest and pile top. However, it also leads to decreased stress on the front piles and increased stress on the rear piles.
(5) The optimal parameters for the buttressed pile–beam retaining wall under seismic conditions are as follows: the length of the transfer beam slab should be one times the tunnel diameter extended at the intersection of the tunnel and slope, the width of the transfer beam slab should be 3.0 times the height of the retaining wall, and the height of the retaining wall should be 0.6 times the cantilever length of the anti-slide pile. Additionally, the horizontal and longitudinal clear spacing of the piles should be twice the pile diameter and the thickness of the transfer beam slab should be two-thirds of the pile clear spacing.
(6) It should be noted that this study is based on typical geotechnical conditions in the Panzhihua region and specific seismic inputs, with the optimization scheme applicable to seismic designs of moderately to strongly weathered rock slopes or dense sand–gravel mixed strata. For projects with significantly different geological conditions or seismic characteristics, parameter adjustments should be made according to specific circumstances. Although increasing the beam-slab width and retaining wall height can improve seismic performance, it may also lead to uneven stress distribution in the structure. Therefore, reasonable dimension control during construction is necessary to avoid compromising overall structural stability. The research findings can provide a theoretical basis and optimization references for the seismic design of similar mountain tunnel and slope engineering projects.

Author Contributions

Conceptualization, Y.L. (Yonggui Lin); Methodology, Y.L. (Yonggui Lin) and H.M.; Software, C.W.; Validation, C.W.; Formal analysis, A.X.; Investigation, A.X.; Resources, H.M. and Y.L. (Yadong Li); Data curation, Y.L. (Yadong Li); Supervision, C.Y.; Project administration, C.Y. All authors have read and agreed to the published version of the manuscript.

Funding

This study was conducted by Guangzhou University under the commission of Guangzhou Municipal Engineering Design & Research Institute Co., Ltd. (Contract Number: 2022440002001000). The article processing charge (APC) was funded by Li Yadong.

Data Availability Statement

The original contributions presented in the study are included in the article, further inquiries can be directed to the corresponding author.

Conflicts of Interest

Authors Yonggui Lin, Chunshan Yang, Chuanzhi Wang and Hui Ma were employed by the company Guangzhou Municipal Engineering Design & Research Institute Co., Ltd. The remaining authors declare that the research was conducted in the absence of any commercial or financial relationships that could be construed as a potential conflict of interest.

Correction Statement

This article has been republished with a minor correction to the Conflicts of Interest Statement. This change does not affect the scientific content of the article.

References

  1. Qiao, S.; Xu, P.; Teng, J.; Sun, X. Numerical Study of Optimal Parameters on the High Filling Embankment Landslide Reinforced by the Portal Anti-Slide Pile. KSCE J. Civ. Eng. 2020, 24, 1460–1475. [Google Scholar] [CrossRef]
  2. Xia, Y.; Huang, Z.; Dang, Z.; Wang, J. Application and analysis of force characteristics of high-fill pile bearing retaining wall. In Proceedings of the 2022 8th International Conference on Hydraulic and Civil Engineering: Deep Space Intelligent Development and Utilization Forum (ICHCE), Xi’an, China, 25–27 November 2022; pp. 920–926. [Google Scholar]
  3. Zhang, Z.; Ye, L.; Chen, Z.; Xu, S. Field direct shear tests on a backfill soil slope and finite element analysis of its reinforcement schemes. IOP Conf. Ser. Earth Environ. Sci. 2020, 558, 032033. [Google Scholar] [CrossRef]
  4. Fu, Y.G.; Jiang, X.; Gu, H.Y.; Qiu, Y.J. Settlement patterns of mountainous half-filled and half-cut widened subgrade with retaining wall. J. Mt. Sci. 2021, 18, 2791–2802. [Google Scholar] [CrossRef]
  5. Li, H.; Tao, W.; Shen, W.; Wang, W.; Tang, D.; Zhang, Z.; Nie, Z. Influencing factors research of a new type composite retaining wall with double-row-piles and counterfort retaining walls. Build. Struct. 2022, 52, 126–130+113. [Google Scholar]
  6. Zhao, Q.H.; Xue, H.Y.; Hu, H.X. Design of Pile Foundation Joist Buttress Tray Retaining Structure. High-Speed Railw. Technol. 2020, 11, 42–45+50. [Google Scholar]
  7. Yi, H.; Peng, Z.B.; Cao, J.W.; Zhong, L.; Zhou, L.X. Application of Buttressed Pile-Beam Retaining Wall in a Slope Engineering Project. Silicon Val. 2009, 91–92. [Google Scholar]
  8. Fang Pai, L.; Gang Wu, H.; Guan, W.; Wei, H.; Tang, L. Shaking table test for seismic optimization of soil slope reinforced by new EPS pile under earthquake. Soil Dyn. Earthq. Eng. 2022, 154, 107140. [Google Scholar]
  9. Luo, S.L.; Huang, D.; Peng, J.B.; Aierken, A.; Li, Z.; Kuang, X.B.; Tomás, R. Performance and application of a novel drainage anti-slide pile on accumulation landslide with a chair-like deposit-bedrock interface in the Three Gorges Reservoir area, China. Comput. Geotech. 2023, 155, 105199. [Google Scholar] [CrossRef]
  10. Sun, S.-W.; Zhao, F.; Zhang, K. Stability of Slopes Reinforced with Truncated Piles. Adv. Mater. Sci. Eng. 2016, 2016, 1570983. [Google Scholar] [CrossRef]
  11. Bao, J.J. Study on Dynamic Response Differences of Anti-Slide Pile-Supported High-Steep Slopes Under Sinusoidal Waves and El-Centro Waves Based on Shaking Table. Master’s Thesis, Southwest Jiaotong University, Sichuan, China, 2022. China Master’s Theses Full-Text Database. [Google Scholar]
  12. Huang, G.C.; Yu, P.; He, L.; Zhao, P. Discussion on the design and application of pile-beam retaining wall structure. Sci. Technol. Inf. 2015, 13, 86–87+89. [Google Scholar]
  13. Yu, W.J. Research on the Calculation Method of Internal Force of Pile Foundation Joist Retaining Wall; Zhejiang Sci-Tech University: Hangzhou, China, 2020. [Google Scholar]
  14. Yang, C.W.; Zhang, L.; Zhang, K.W.; Yue, M.; Tong, X.H.; Wen, H. Large scale shaking table model test on seismic response ofmountain tunnel portal section passing through fault zone. Chin. J. Rock Mech. Eng. 2023, 42, 993–1002. [Google Scholar]
  15. Hou, S.; Tao, L.J.; Zhao, X.; Qiu, W.G.; Huang, K.P.; Wu, B.L. Shaking table test for dynamic response in portal section ofmountain tunnel based on different vibration directions. J. Cent. South Univ. (Nat. Sci. Ed.) 2016, 47, 994–1001. [Google Scholar]
  16. Zhu, H.; Yan, S.H.; Sun, W.Y.; Ou, E.F.; Lin, J.C.; Wang, J.H. Seismic Response Analysis of Shallow-Buried Unsymmetrical-Loading Double Tunnel Under Oblique Incidence of Seismic Wave. J. Vib. Meas. Diagn. 2024, 44, 259–265+407. [Google Scholar]
  17. Lei, H.; Wu, H.G.; Gao, Y.; Qian, J.G.; Liang, Y.; Li, D.Z. Shaking table test study on dynamic response of tunnel crossing through slope. Chin. J. Rock Mech. Eng. 2022, 41 (Suppl. S2), 3327–3338. [Google Scholar]
  18. Lai, T.W.; Lei, H.; Wu, H.G. Vibration Acceleration Responses of Crossing Tunnels of Highway and Railway under Different Directions of Seismic Loads. China Railw. Sci. 2021, 42, 95–104. [Google Scholar]
  19. Liu, L.L. Research on Specialized Design of Shield Originating and Undercrossing by Highway Rockfill Subgrade Slope. Railw. Constr. Technol. 2024, 1, 87–91. [Google Scholar]
  20. Feng, H.Z.; Jiang, G.L.; He, Z.L.; Guo, Y.F.; He, X.L.; Liu, X.F.; Hu, J.S. Dynamic Response Characteristics of Tunnel Portal Slope Reinforced by Frame Beam and Anchor Cable Pile Sheet Wall. China Railw. Sci. 2024, 45, 134–145. [Google Scholar]
  21. Zhong, Z.Y. Application of long-span foundation pile joist retaining wall in railway reconstruction. Guizhou Sci. 2020, 38, 94–96. [Google Scholar]
  22. GB 50010-2010; Code for Design of Concrete Structures. China Architecture & Building Press: Beijing, China, 2010.
  23. Yang, M.; Yao, L.K.; Wang, G.J. Study on effect of width and space of anti-slide piles on soil arching between piles. Chin. J. Geotech. Eng. 2007, 10, 1477–1482. [Google Scholar]
  24. CJJ/T202-2013; Technical Code for Structural Safety Protection of Urban Rail Transit. China Architecture & Building Press: Beijing, China, 2013.
  25. Song, D.; Liu, X.; Chen, Z.; Chen, J.; Cai, J. Influence of Tunnel Excavation on the Stability of a Bedded Rock Slope: A Case Study on the Mountainous Area in Southern Anhui, China. KSCE J. Civ. Eng. 2020, 25, 114–123. [Google Scholar] [CrossRef]
Figure 1. Sunshine tunnel left-line project: (a) Tunnel obliquely intersecting six anti-slide piles; (b) typical cross-sectional relationship between the tunnel and anti-slide piles; (c) sunshine tunnel section.
Buildings 15 01748 g001
Figure 2. Designed buttressed pile foundation beam retaining wall.
Buildings 15 01748 g002
Figure 3. Buttressed retaining wall at the project site.
Buildings 15 01748 g003
Figure 4. Finite element model diagram.
Buildings 15 01748 g004
Figure 5. Wolong seismic waves: (a) Seismic wave time history curve; (b) Fourier amplitude spectrum of seismic waves.
Buildings 15 01748 g005
Figure 6. Absorbing boundary of the numerical model.
Buildings 15 01748 g006
Figure 7. Shaking-table model fabrication procedure.
Buildings 15 01748 g007
Figure 8. Pile top measurement points in numerical model.
Buildings 15 01748 g008
Figure 9. Comparison of pile head acceleration responses: (a) simulation of pile head acceleration response; (b) experimental pile head acceleration response; (c) Fourier amplitude spectrum of simulated pile head; (d) Fourier amplitude spectrum of experimental pile head.
Buildings 15 01748 g009
Figure 10. Comparison of peak earth pressure behind piles: (a) numerical simulation results; (b) shaking-table test.
Buildings 15 01748 g010
Figure 11. Displacement distribution for different beam slab length models: (a) slope crest displacement; (b) pile top displacement.
Buildings 15 01748 g011
Figure 12. Schematic diagram of studied parameters.
Buildings 15 01748 g012
Figure 13. Displacement extremes for different beam slab length models: (a) slope crest displacement; (b) pile top displacement; (c) displacement of buttress ribs.
Buildings 15 01748 g013
Figure 14. Stress extremes at retaining wall for different beam slab length models.
Buildings 15 01748 g014
Figure 15. Displacement extremes for different beam slab width models: (a) slope crest displacement; (b) pile top displacement; (c) displacement of buttress ribs.
Buildings 15 01748 g015
Figure 16. Stress extremes at retaining wall for different beam slab width models.
Buildings 15 01748 g016
Figure 17. Displacement extremes for different retaining wall height models: (a) slope crest displacement t; (b) pile top displacement; (c) displacement of buttress ribs.
Buildings 15 01748 g017
Figure 18. Stress distribution at retaining wall for different retaining wall height models.
Buildings 15 01748 g018
Table 1. Physical and mechanical parameters for finite element calculation model.
NameXigeda Group MudstoneC30 ConcreteC35 Concrete
Constitutive ModelMohr-Coulomb ModelElasticElastic
Elastic Modulus E (MPa)28530 × 10631.5 × 106
Poisson’s Ratio μ0.380.20.2
Unit Weight γ (kN/m3)19.52424
Cohesion c (kN/m3)250--
Friction Angle φ (°)23--
Table 2. The first 10 modes of the model.
ModeFrequency (Hz)Period (s)Effective Mass Ratio
T1T2T3
10.681.4611.33%2.47%4.68%
20.701.443.68%11.02%19.05%
30.741.352.97%0.38%1.12%
40.861.160.46%0.10%0.21%
50.911.1016.71%3.79%0.01%
60.931.082.00%27.51%0.46%
70.951.062.28%8.84%24.00%
80.981.023.30%3.17%7.67%
91.040.970.72%0.02%0.28%
101.050.960.58%0.02%14.68%
Table 3. Similarity coefficients for shaking table test.
Physical QuantitySimilarity RelationshipSimilarity RatioPhysical QuantitySimilarity RelationshipSimilarity Ratio
Geometric Size S l 40Displacement S D = S l 40
Acceleration S a 1Velocity S v = S l 0.5 6.25
Density S ρ 40Time S t = S l 0.5 6.25
Compressive Strength S f c 40Frequency S w = S l 0.5 0.16
Elastic Modulus S E = S l 40Stress S σ = S l 40
Cohesion S c 40Strain S ε 1
Internal friction Angle S φ 1Poisson’s Ratio S μ 1
Table 4. Mechanical parameters of similar materials.
Rock ParametersUnit Weight γ (kN/m3)Elastic
Modulus E (MPa)
Cohesion C (kPa)Internal Friction Angle φ (°)
Mudstone and siltstone interbed22.528529024
Interbedded rock layers22.57.137.2524
Table 5. Influencing parameters.
Analysis ParameterParameter MeaningParameter Value
Pile length λSlab width D λ = 0.5 D
λ = 1.0 D
λ = 1.5 D
λ = 2.0 D
Pile width αBeam height H α = 2.0 H
α = 2.5 H
α = 3.0 H
α = 3.5 H
Given height HAnti-slide pile height L H = 0.4 L
H = 0.6 L
H = 0.8 L
H = 1.0 L
Table 6. Stress extremes at front and rear piles for different beam slab length models (Unit: kPa).
Support Beam
Length
Front Row Pile
Stress
Rear Row Pile
Stress
Stress
Difference
0.5 D16,448.5812,659.673788.91
1.0 D11,481.487722.633758.85
1.5 D11,573.047825.223747.82
2.0 D11,750.468001.543748.92
Table 7. Stress extremes at front and rear piles for different beam slab width models (Unit: kPa).
Support Beam
Width
Front Row
Pile Stress
Rear Row
Pile Stress
Stress
Difference
2.0 H9997.257742.482254.77
2.5 H10,072.466730.483341.98
3.0 H10,296.866291.344005.52
3.5 H10,301.426063.184238.24
Table 8. Stress extremes at front and rear piles for different retaining wall height models (Unit: kPa).
Support Beam
Hight
Front Row
Pile Stress
Rear Row
Pile Stress
Stress
Difference
0.4 L12,083.056694.475388.58
0.6 L11,258.747232.774025.97
0.8 L9826.076840.532985.54
1.0 L9182.16636.182545.92
Disclaimer/Publisher’s Note: The statements, opinions and data contained in all publications are solely those of the individual author(s) and contributor(s) and not of MDPI and/or the editor(s). MDPI and/or the editor(s) disclaim responsibility for any injury to people or property resulting from any ideas, methods, instructions or products referred to in the content.

