Investigation into the Distribution Features and Determinants of Underground Commercial Spaces in Qingdao City


Abstract
1. Introduction
2. Research Area and Data Sources
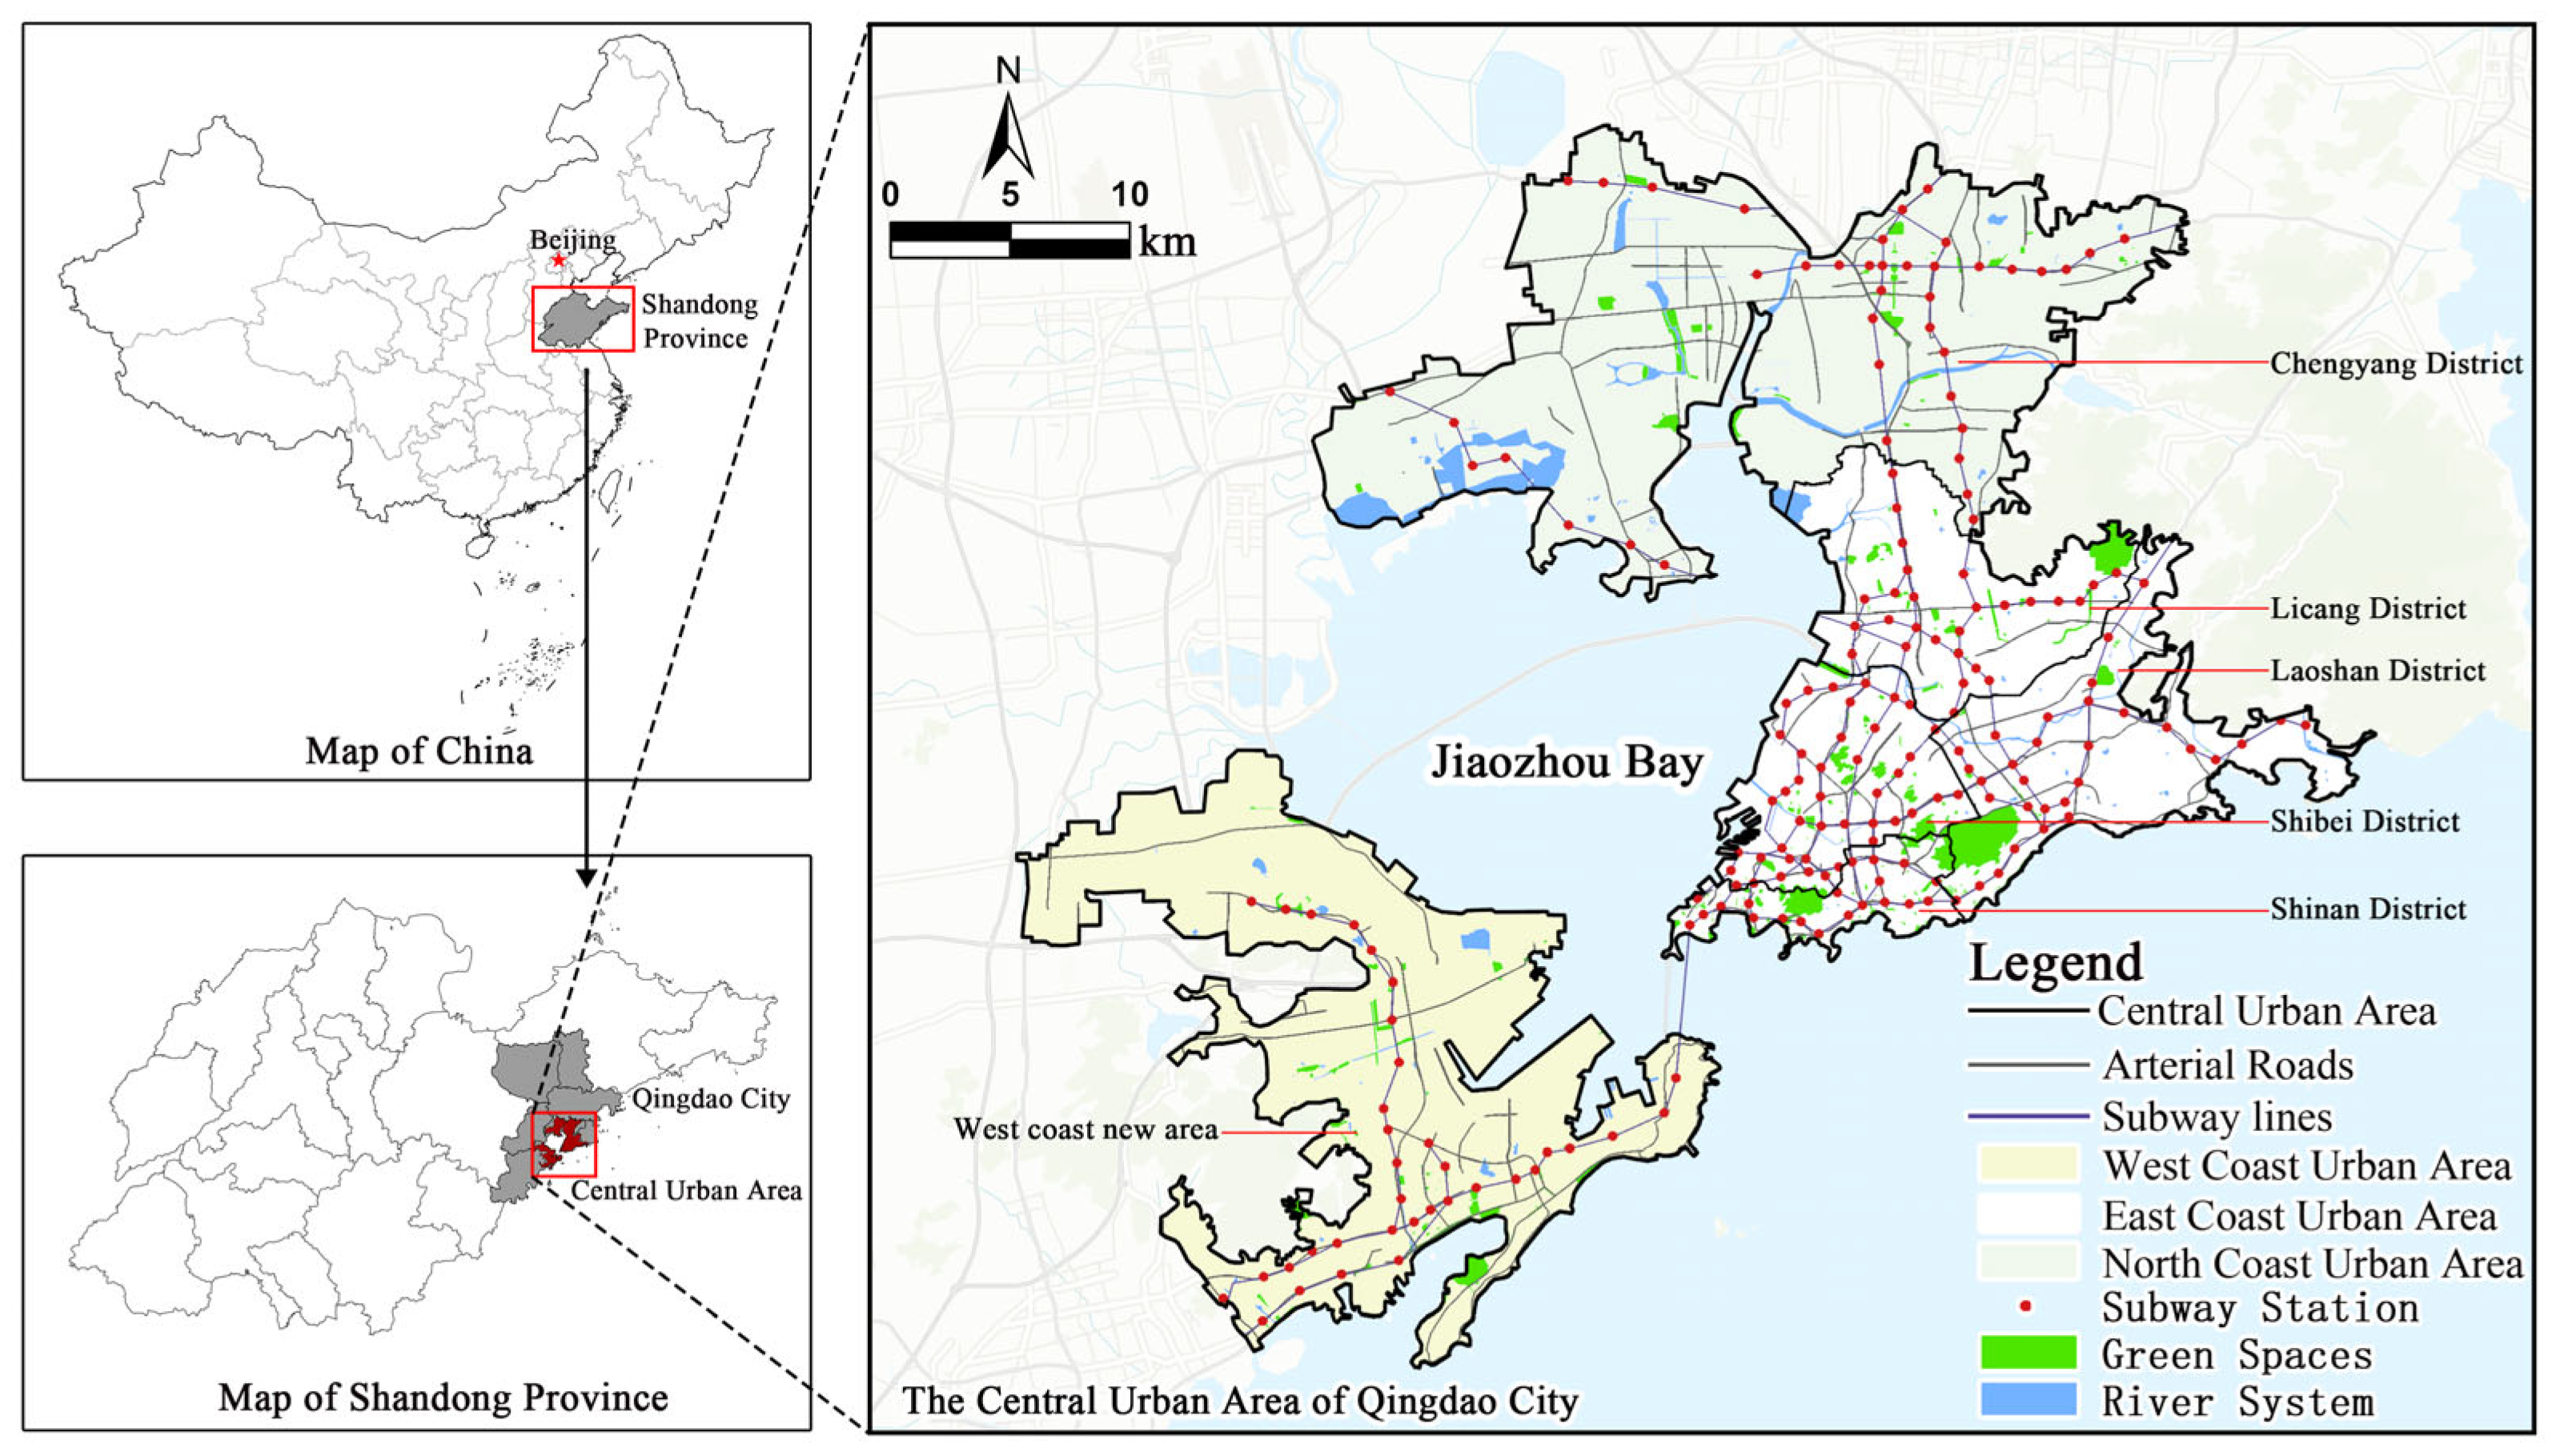
2.1. Research Area
2.2. Data Sources
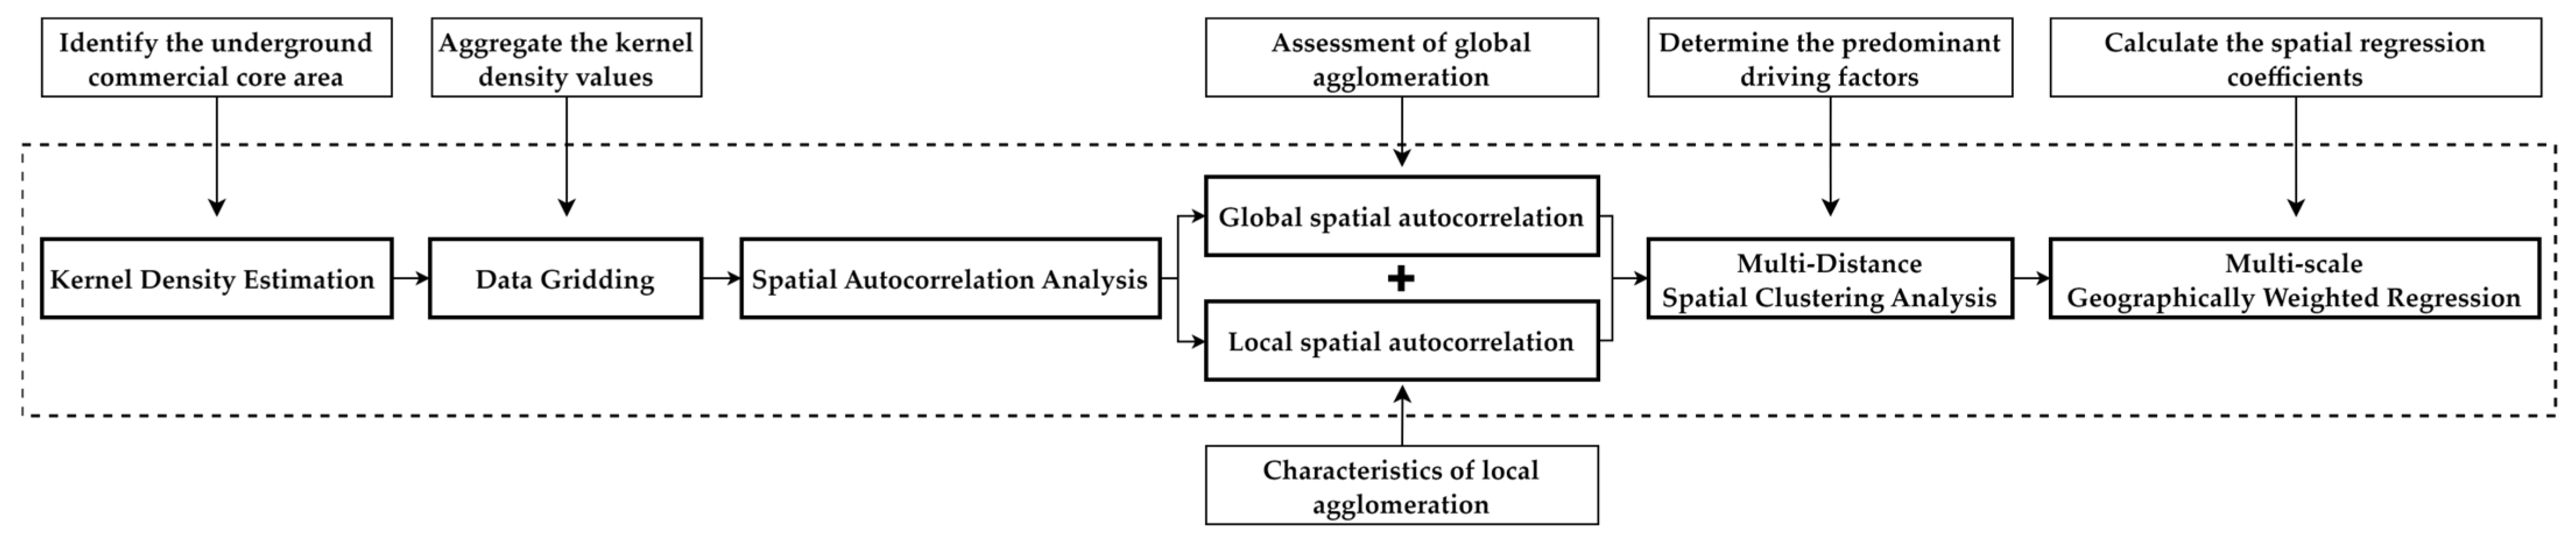
3. Methodology
3.1. Kernel Density Estimation (KDE)
3.2. Data Gridding
3.3. Spatial Autocorrelation Analysis
3.4. Multi-Distance Spatial Clustering (Ripley’s K) Analysis
3.5. Geographical Detector
3.6. Multi-Scale Geographically Weighted Regression (MGWR)
4. Results
4.1. Spatial Layout Features of Underground Commercial Spaces in the Central Urban Area
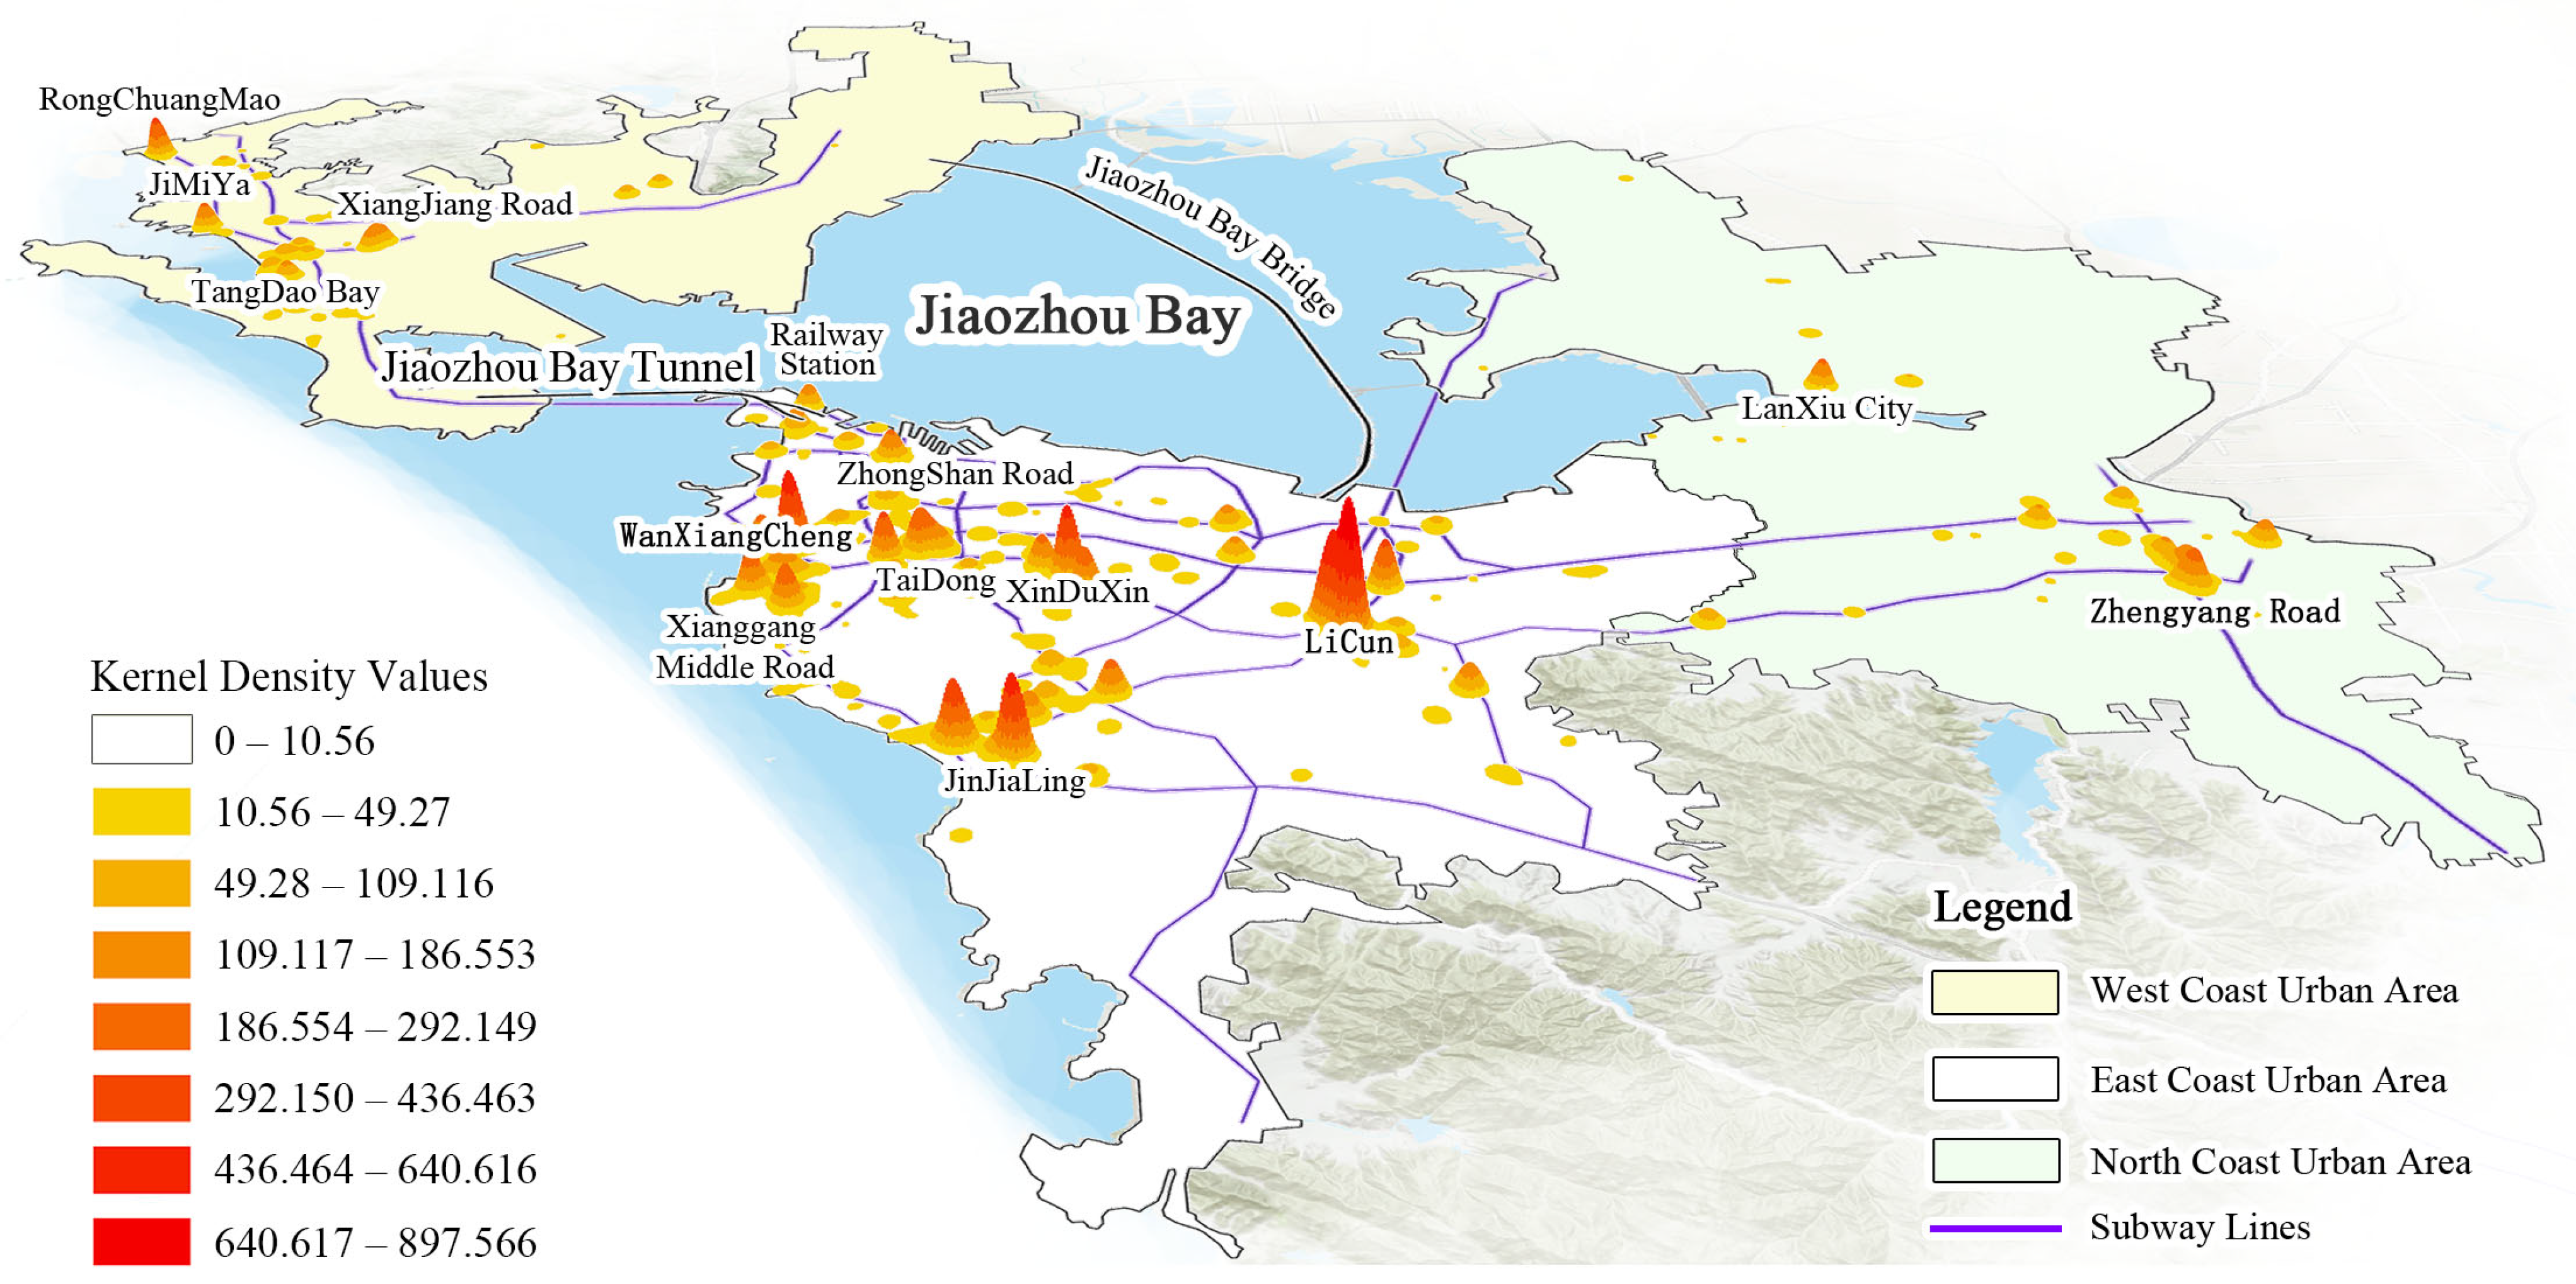
4.1.1. The Underground Commercial Space Exhibits a Layout Pattern Characterized by “Multiple Cores–Multiple Levels”
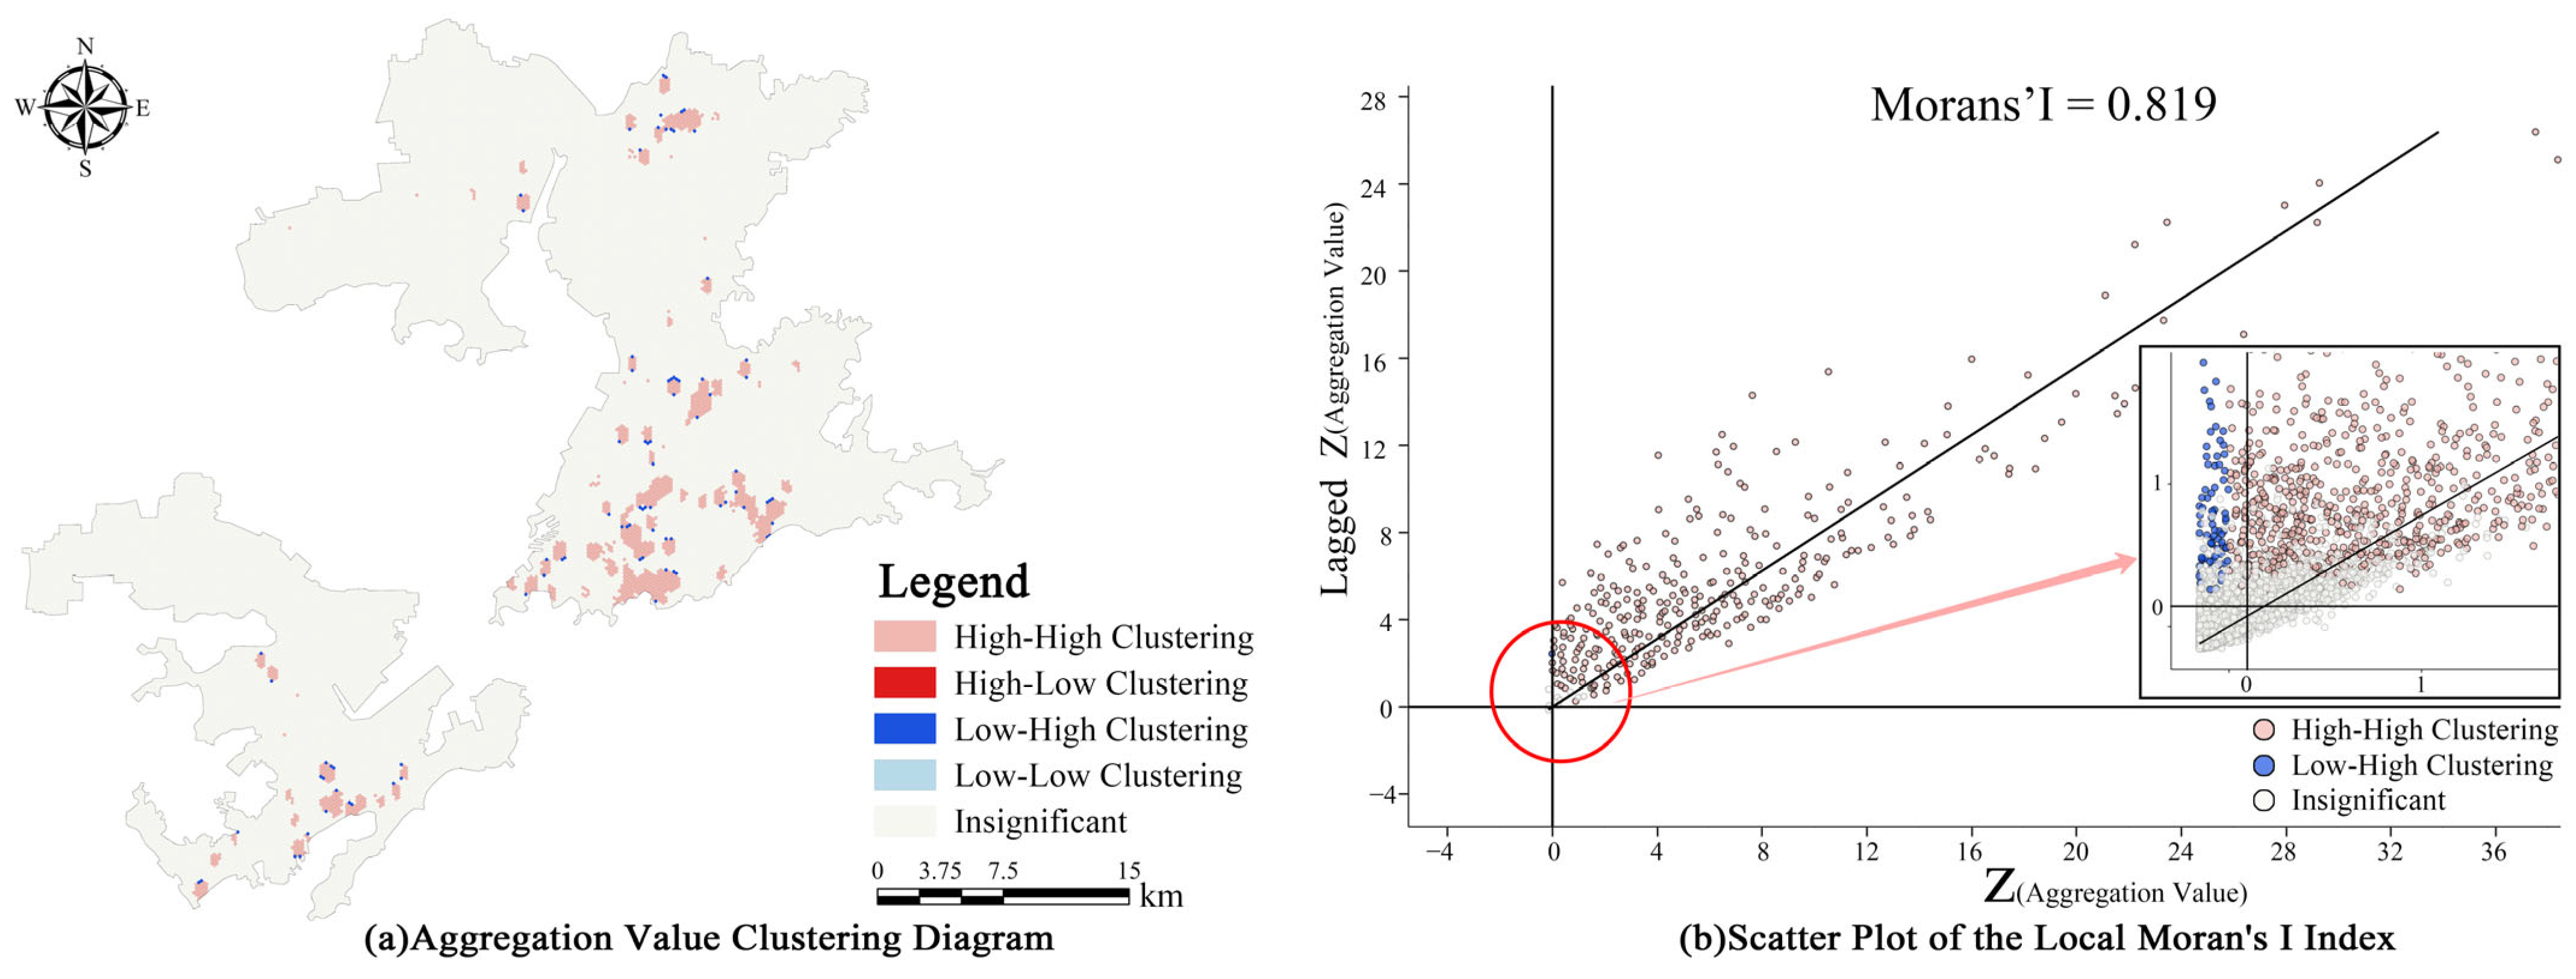
4.1.2. The Agglomeration Features of Underground Commercial Spaces Are Highly Pronounced
- (1)
- In terms of quantity, high–high clustering areas constitute a substantial proportion. Areas with higher underground commercial densities are more likely to cluster and exhibit continuous spatial distributions.
- (2)
- Spatially, underground commercial spaces form point-like clusters in multiple locations. Despite considerable spatial distances between clusters, a limited number of low–high clusters exist, suggesting that high-density areas exert weak radiation effects on surrounding regions, which diminish rapidly with increasing distance.
- (3)
- From a zoning perspective, the east coast urban area features larger high–high clustering areas, where the distribution of underground commercial spaces aligns closely with surface commercial layouts and metro line directions. In the west coast urban area, underground commercial spaces are primarily concentrated along Metro Line 1 and in the JiMiYa business district. In the north coast urban area, only the Zhengyang Road business district contains a relatively concentrated underground commercial space.
4.1.3. The Underground Commercial Space Exhibits a Core Agglomeration Scale of 3.39 km
4.2. Analysis of Influencing Factors Shaping the Layout of Underground Commercial Spaces
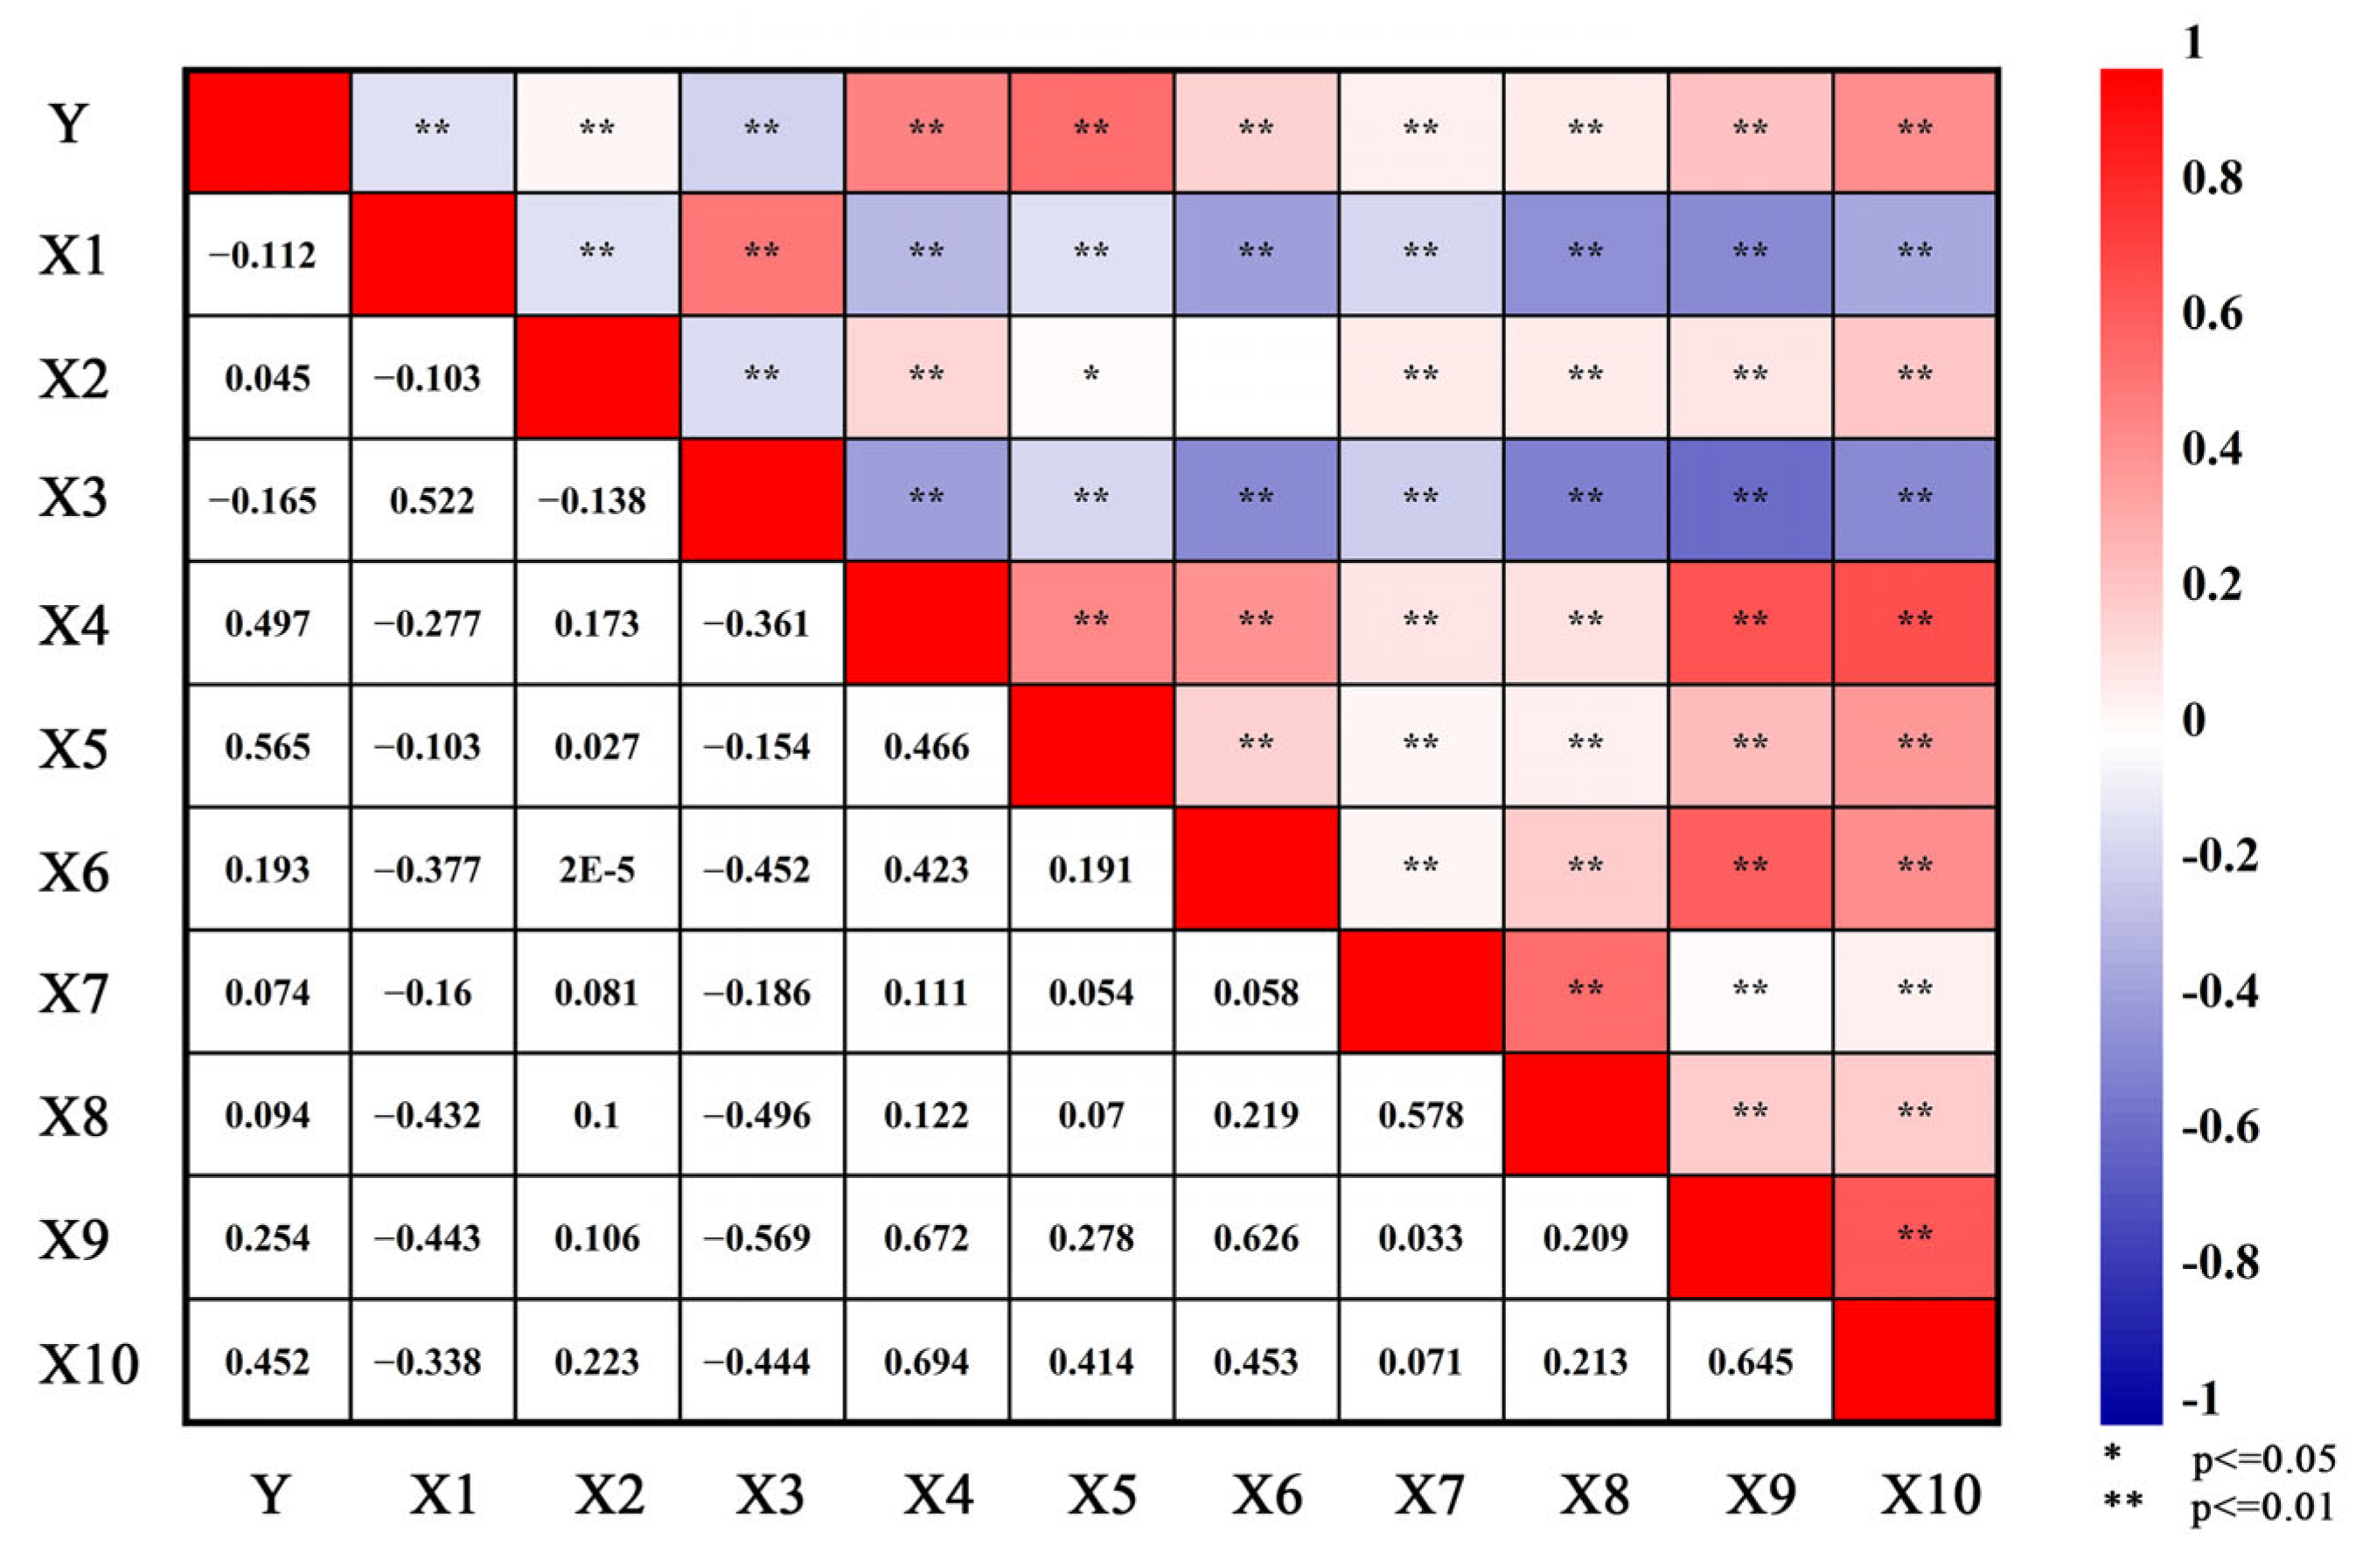
4.2.1. Selection of Influencing Factors
4.2.2. The Detection Results of the Influencing Factors
4.2.3. Model Development and Comparative Analysis of Results
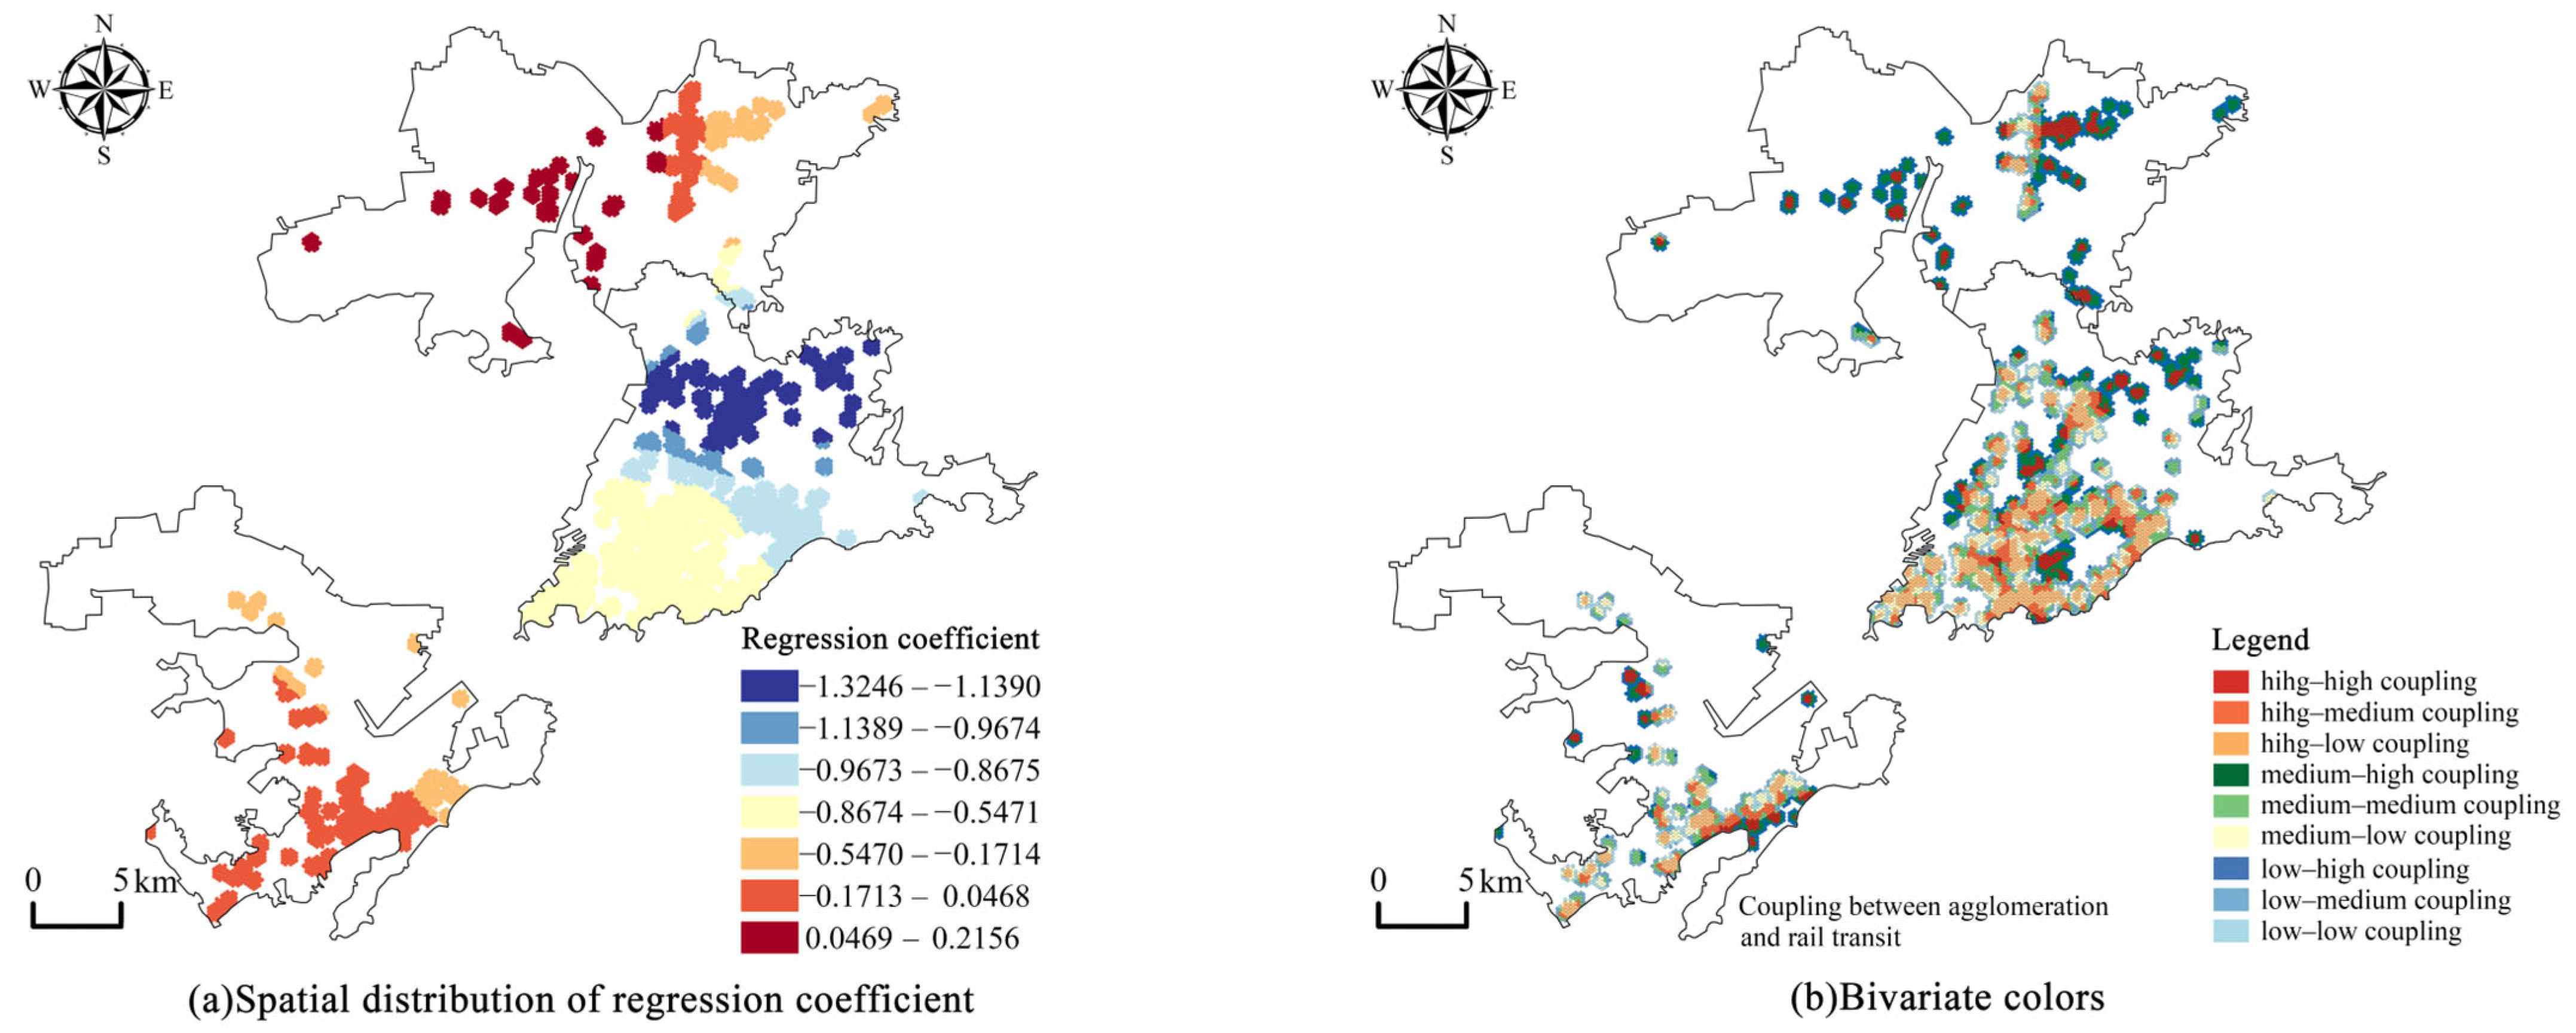
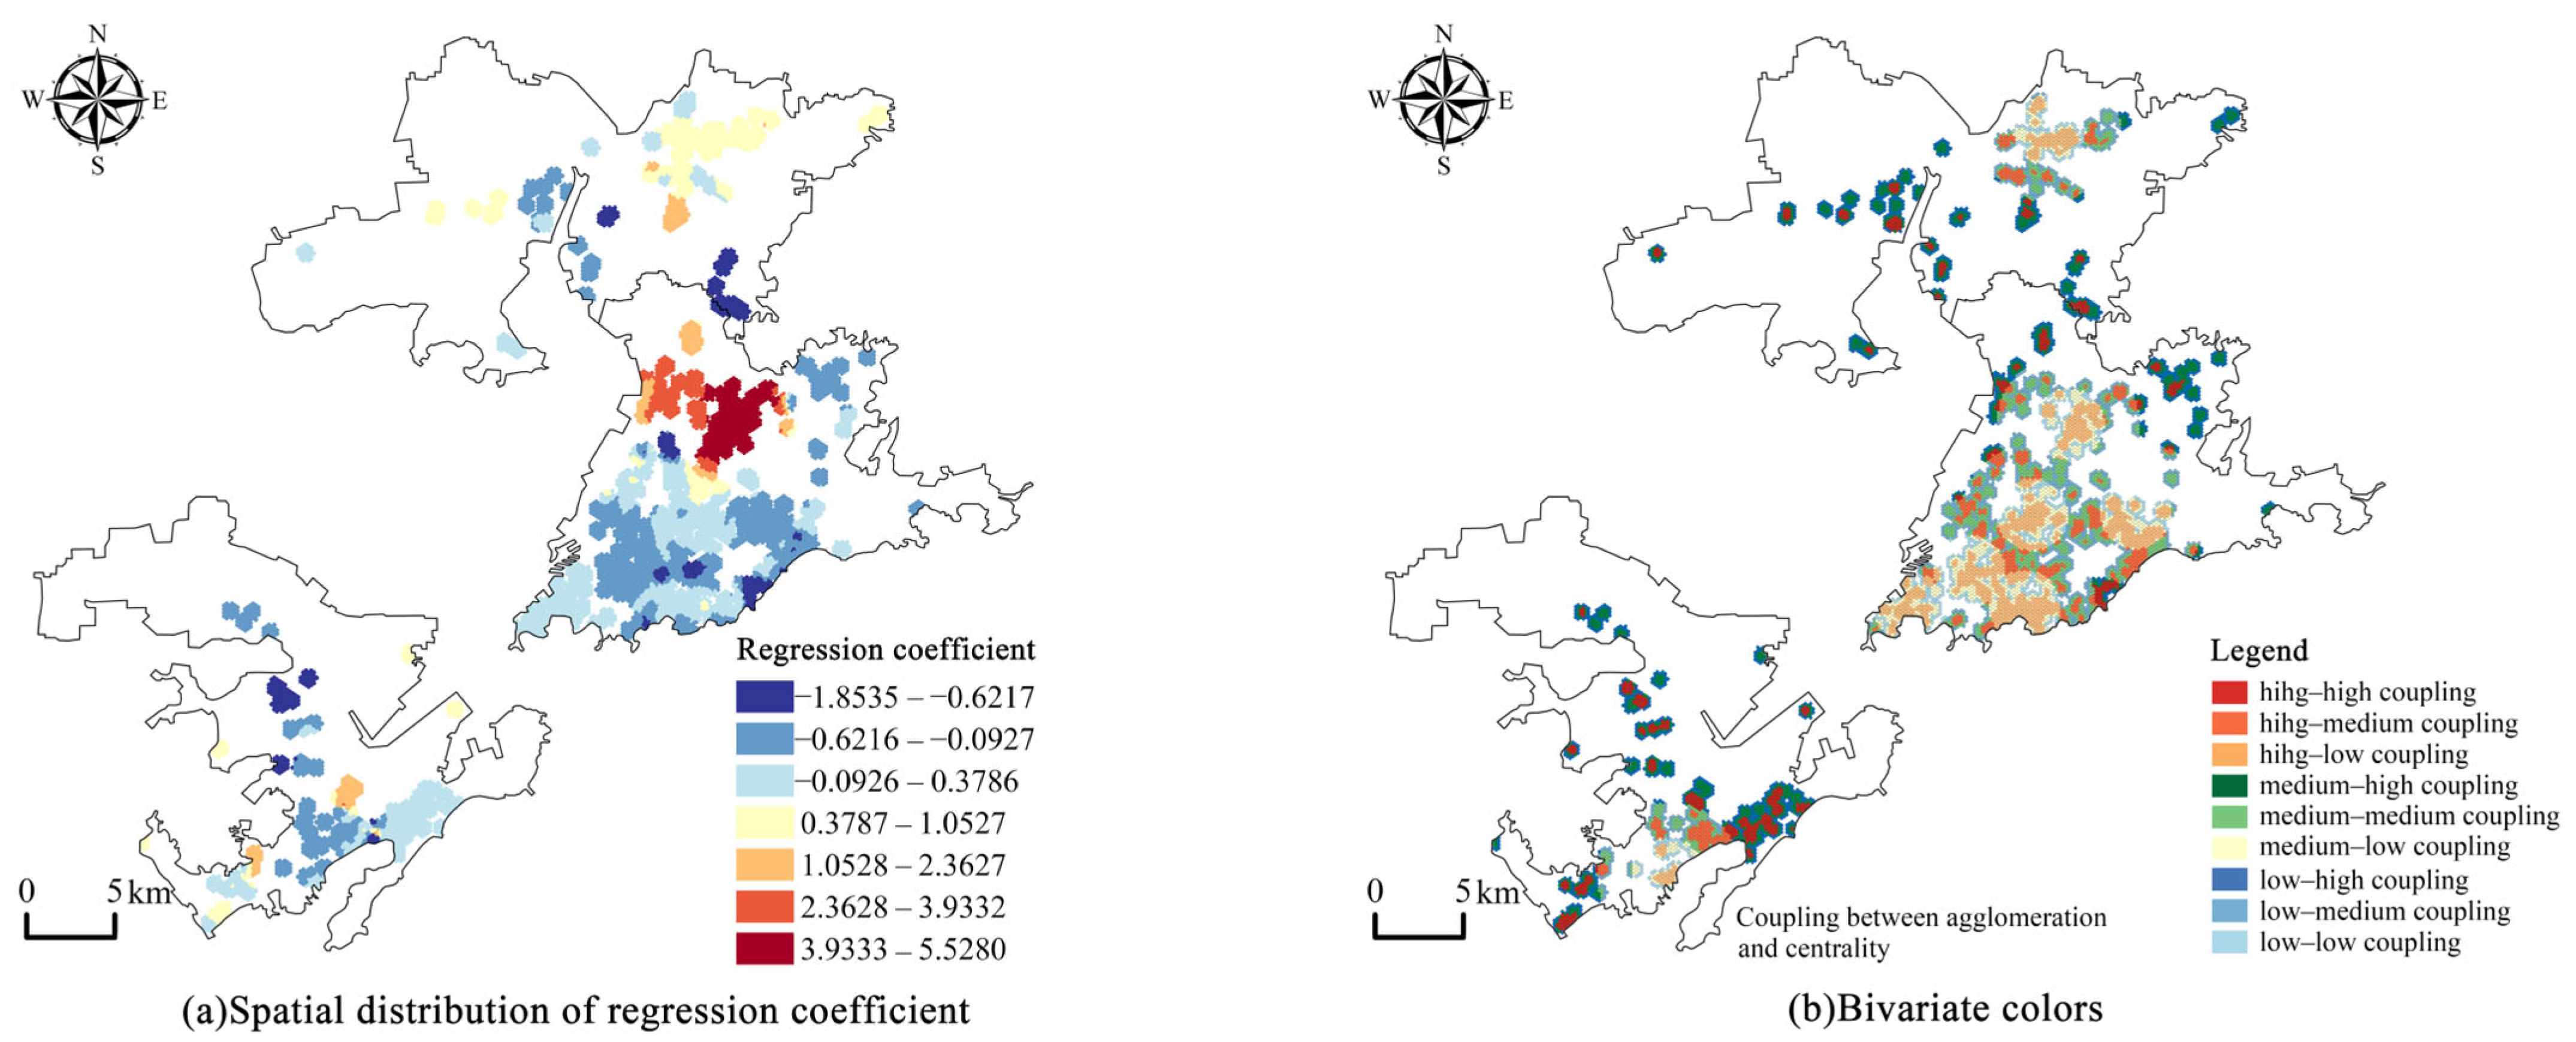
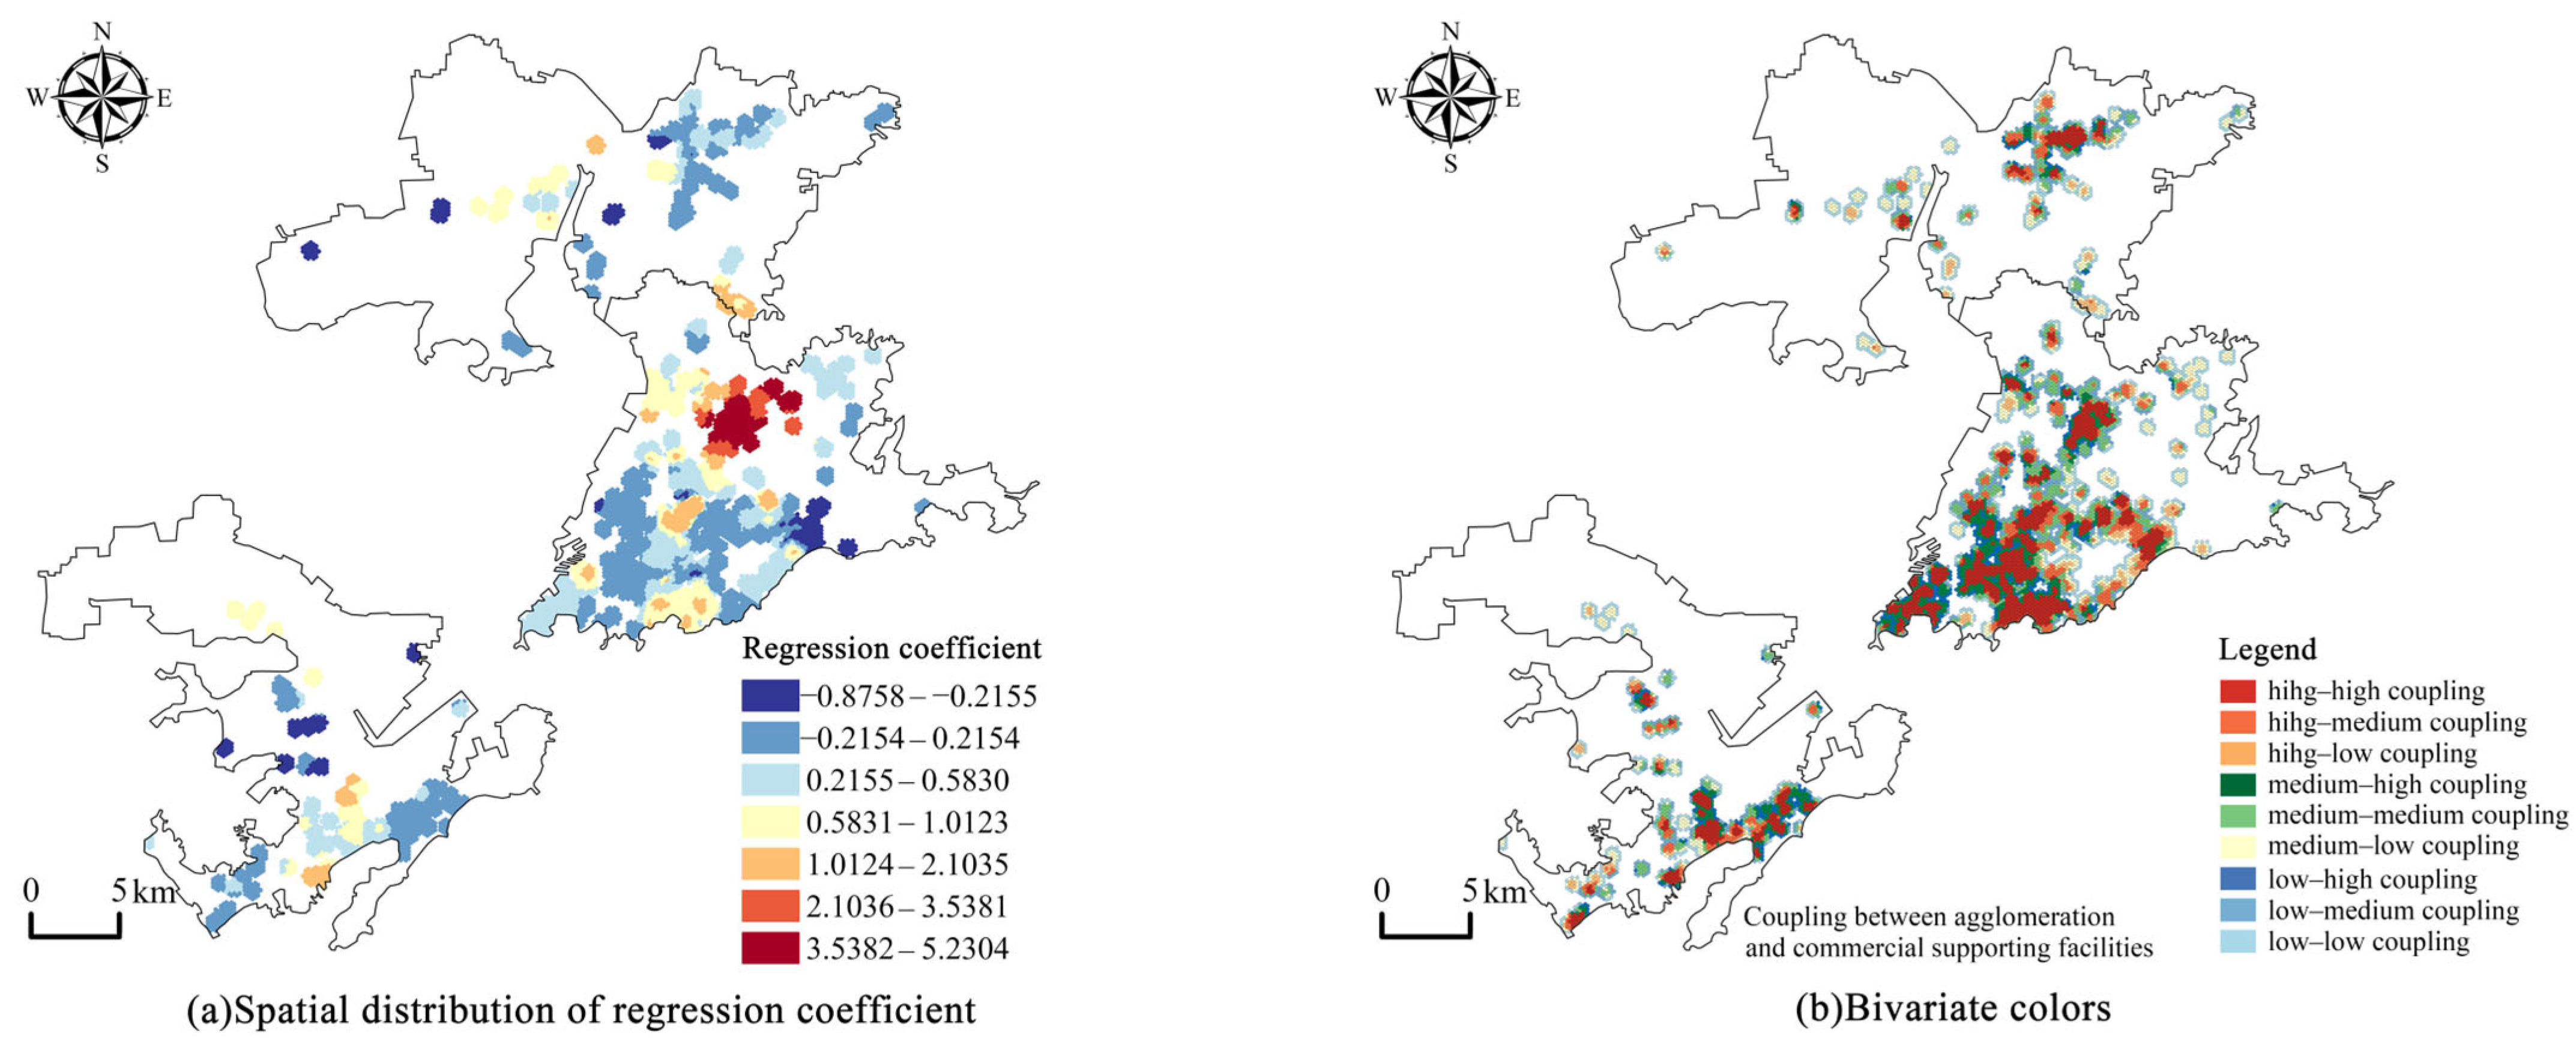
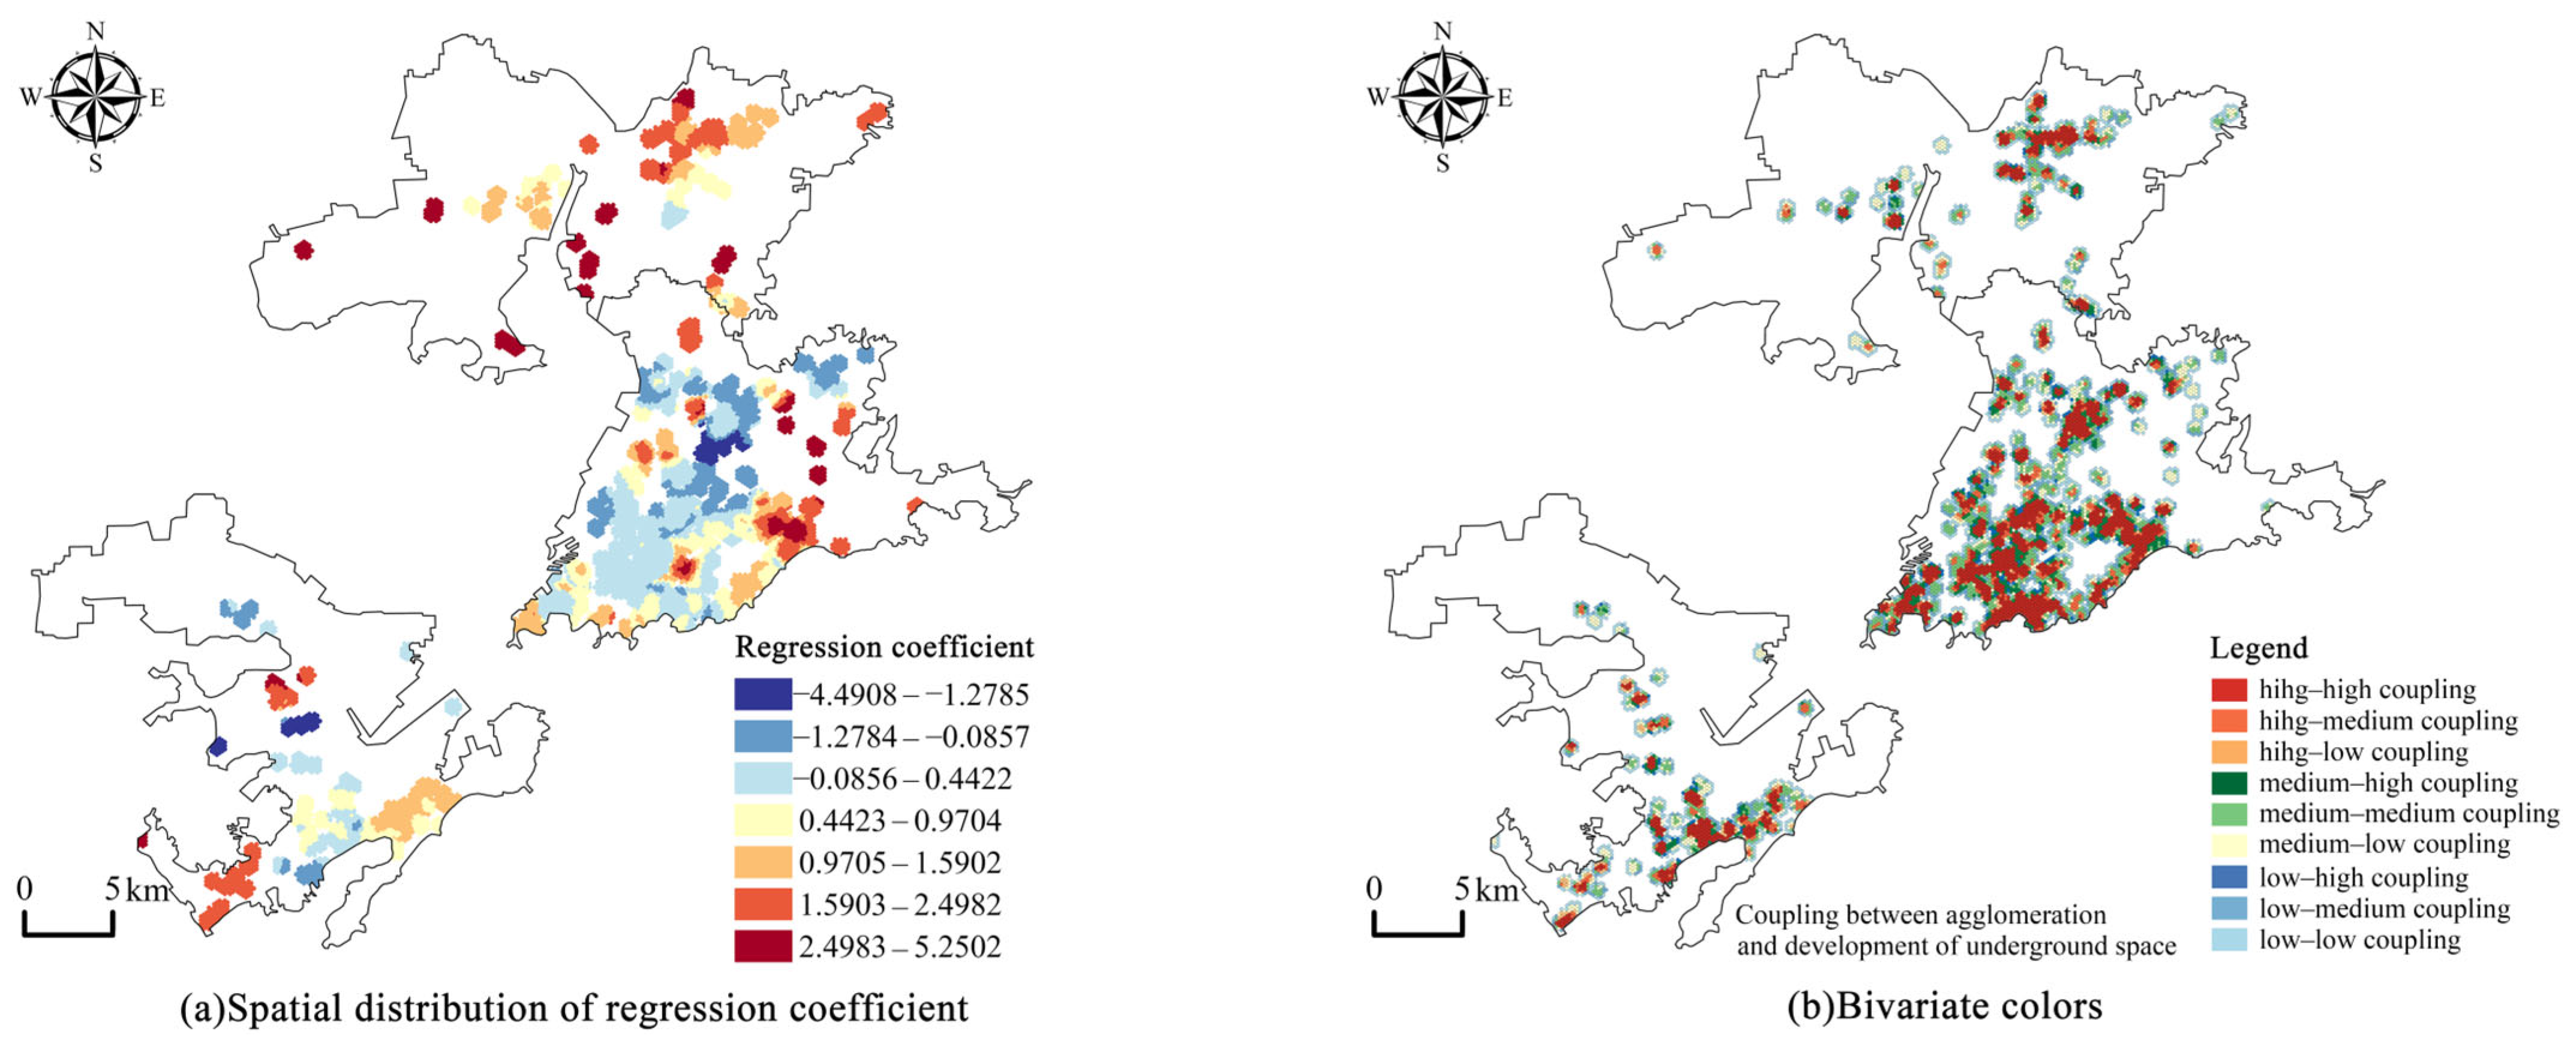
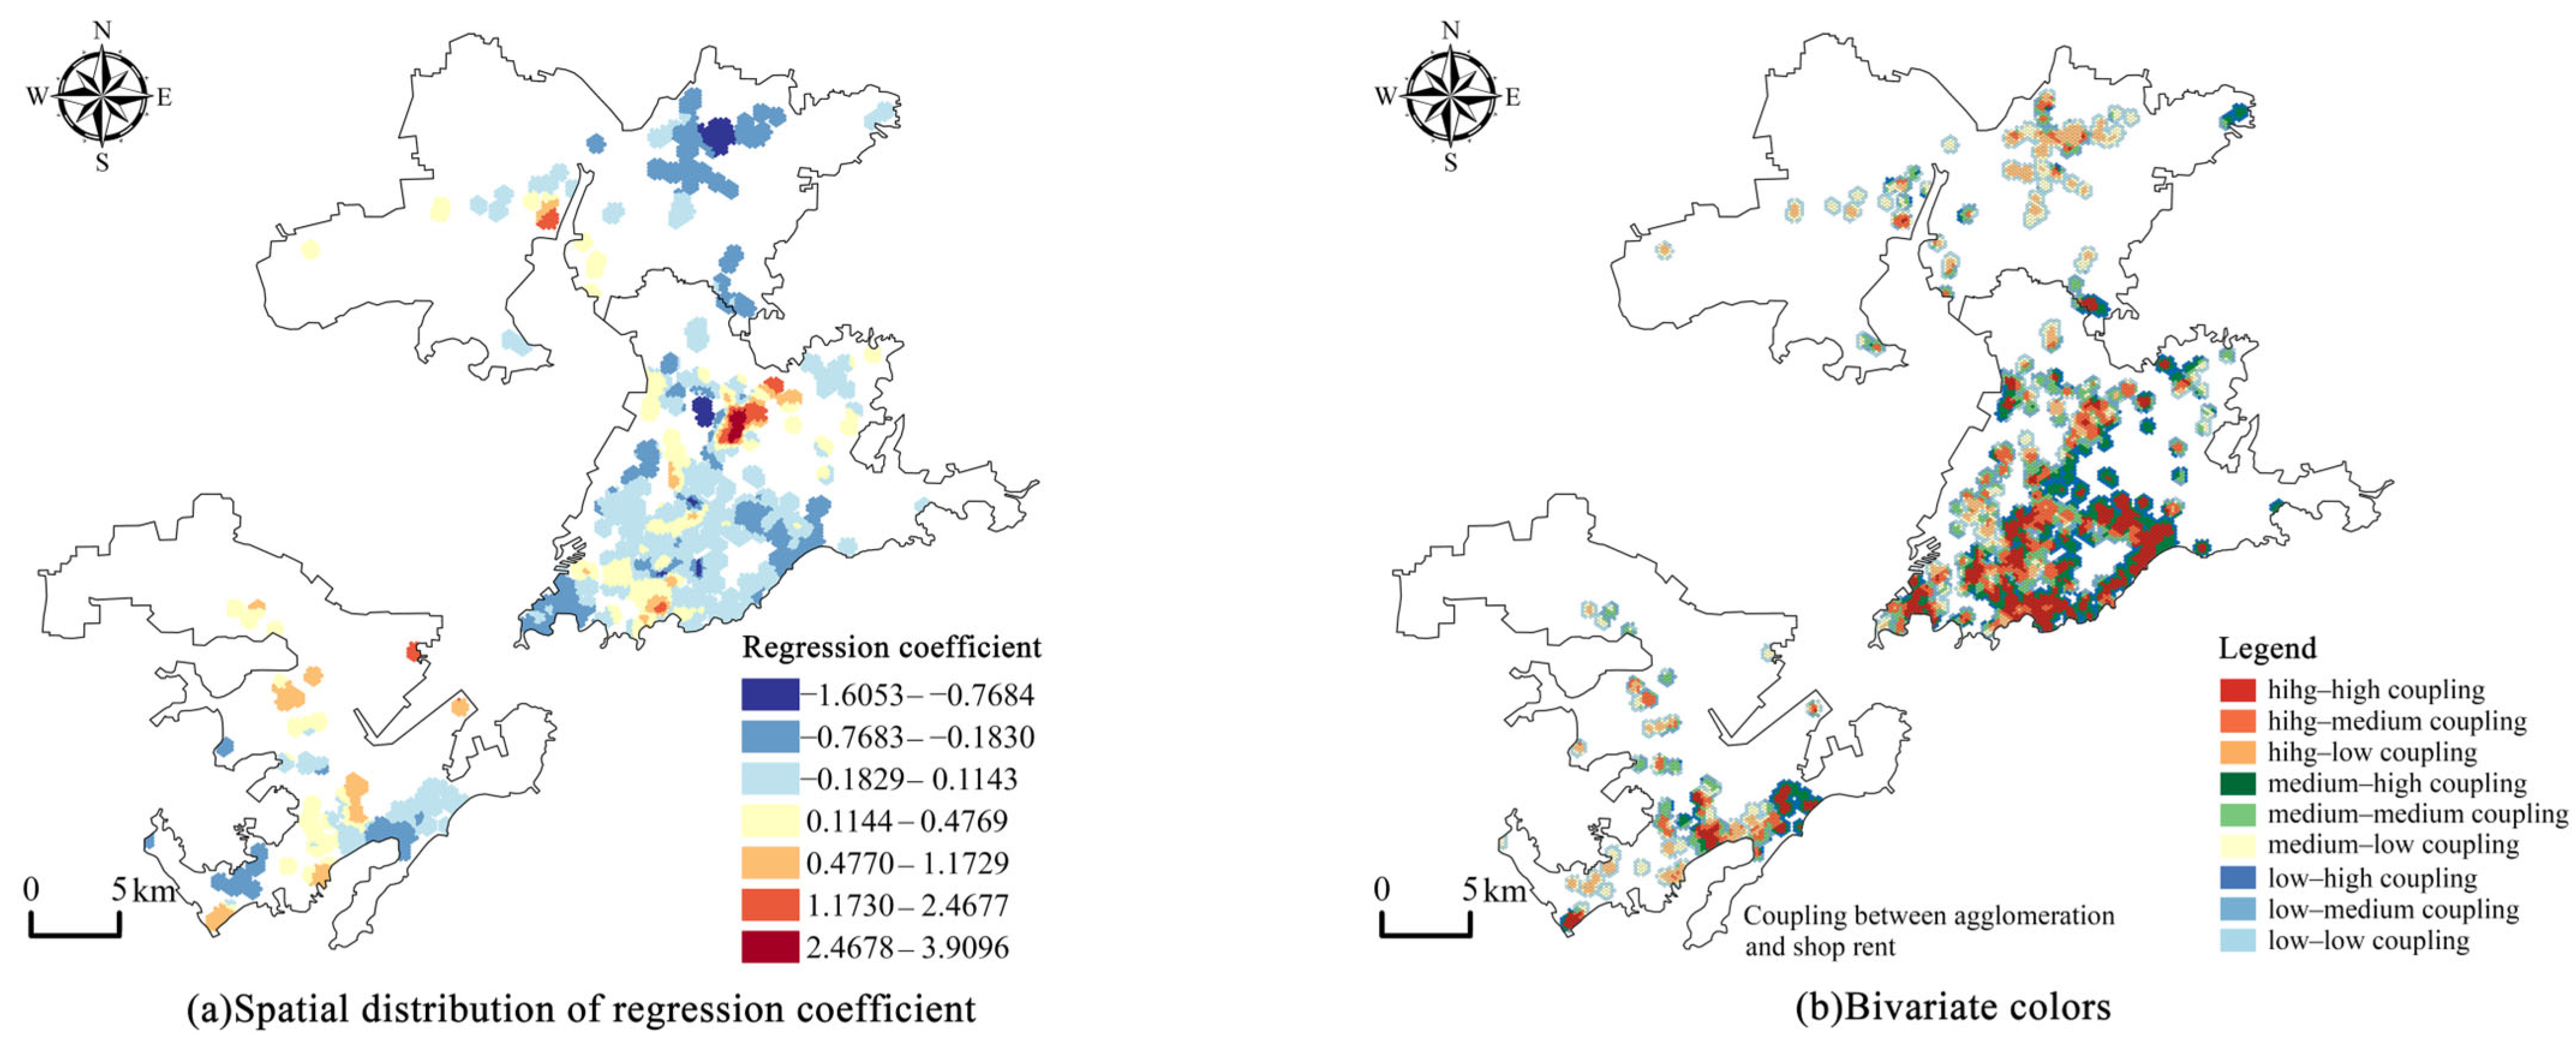
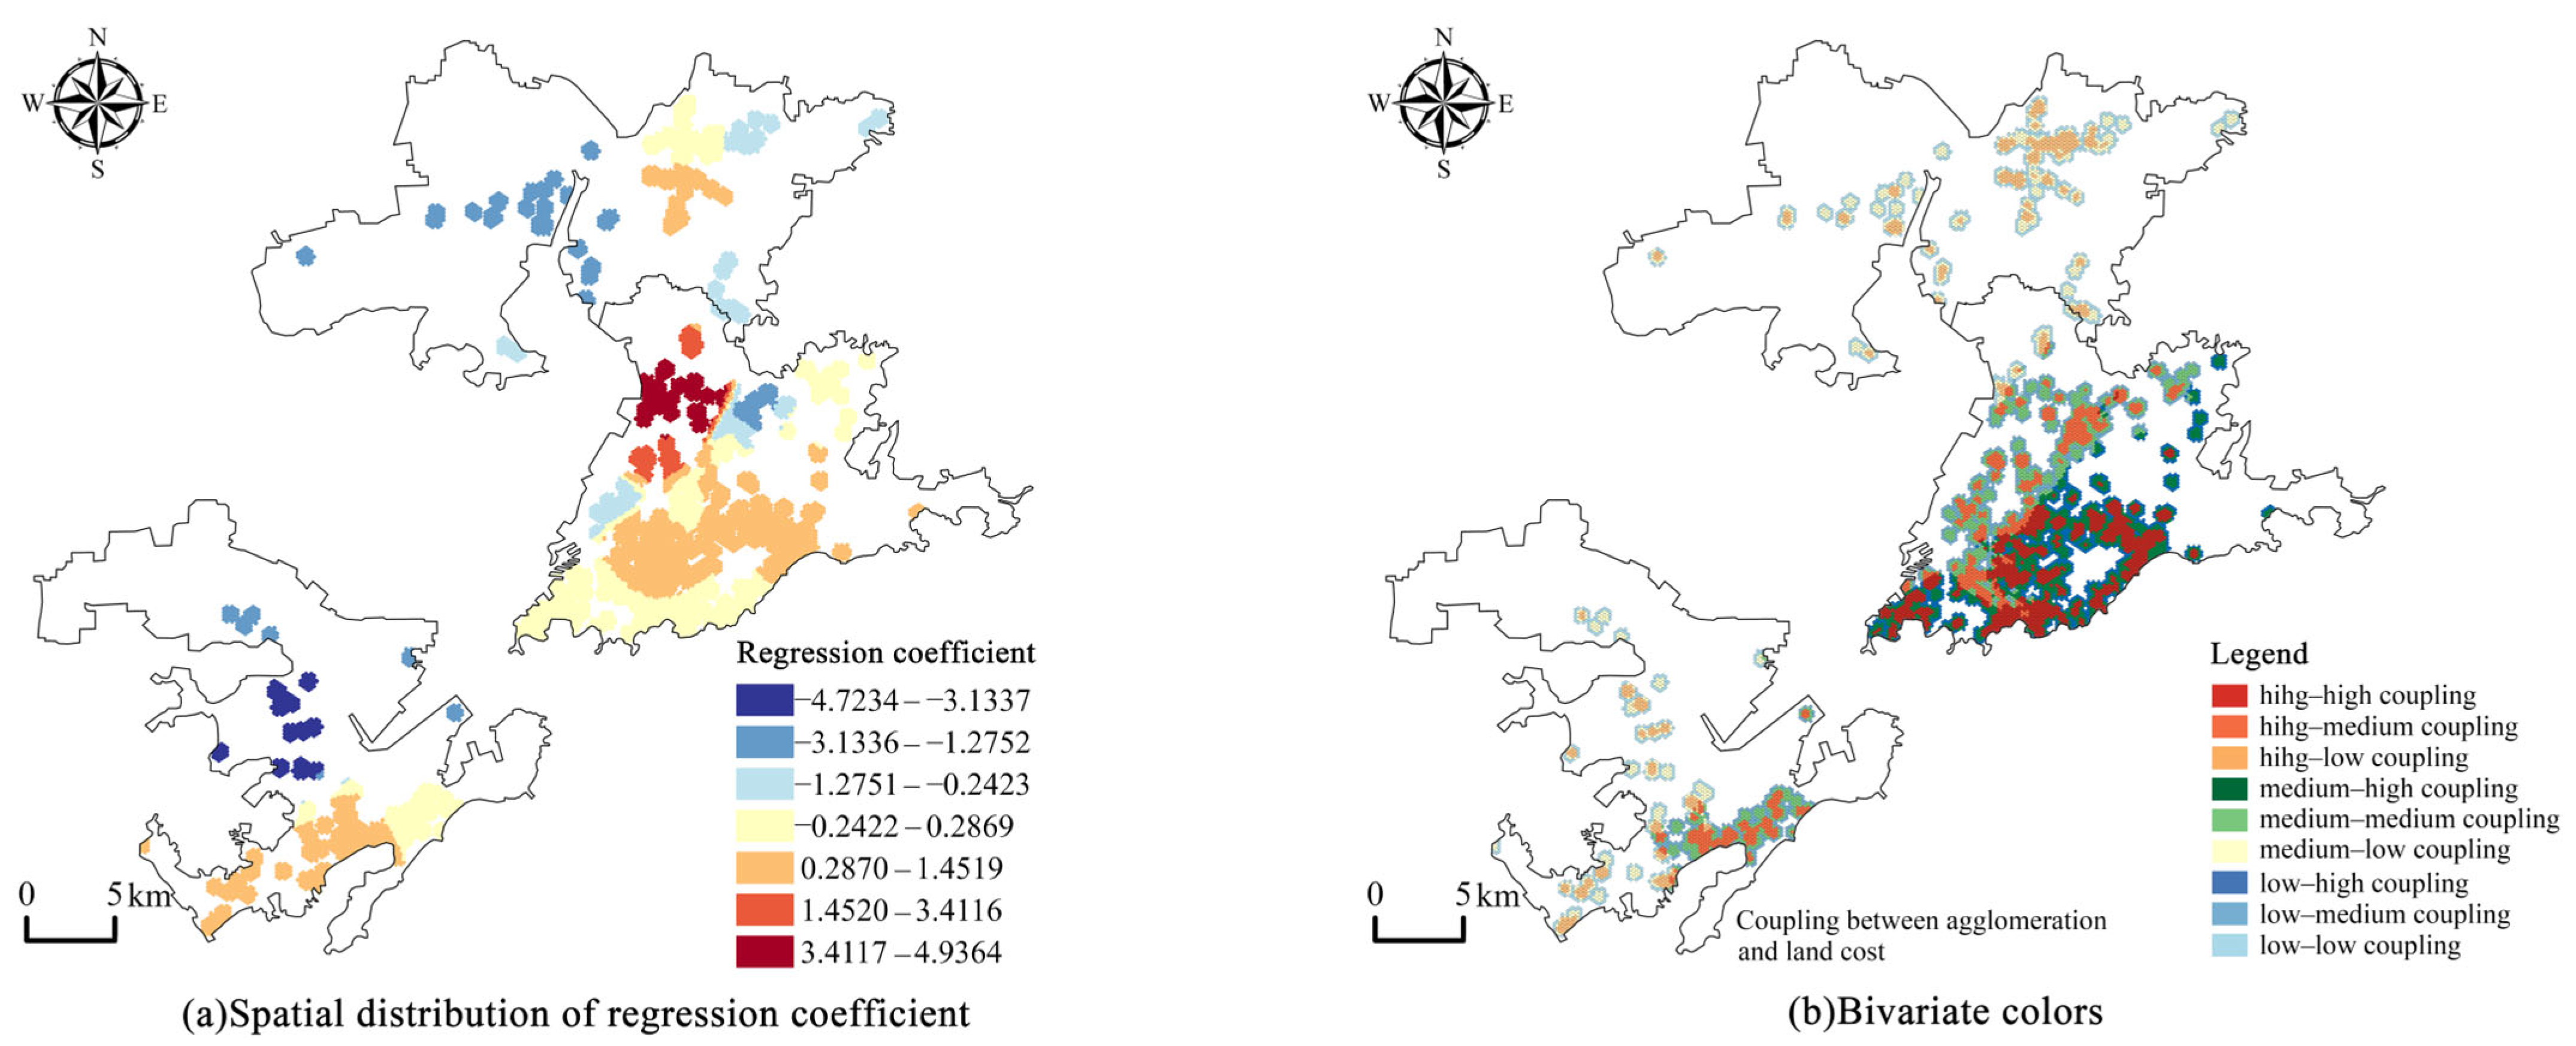
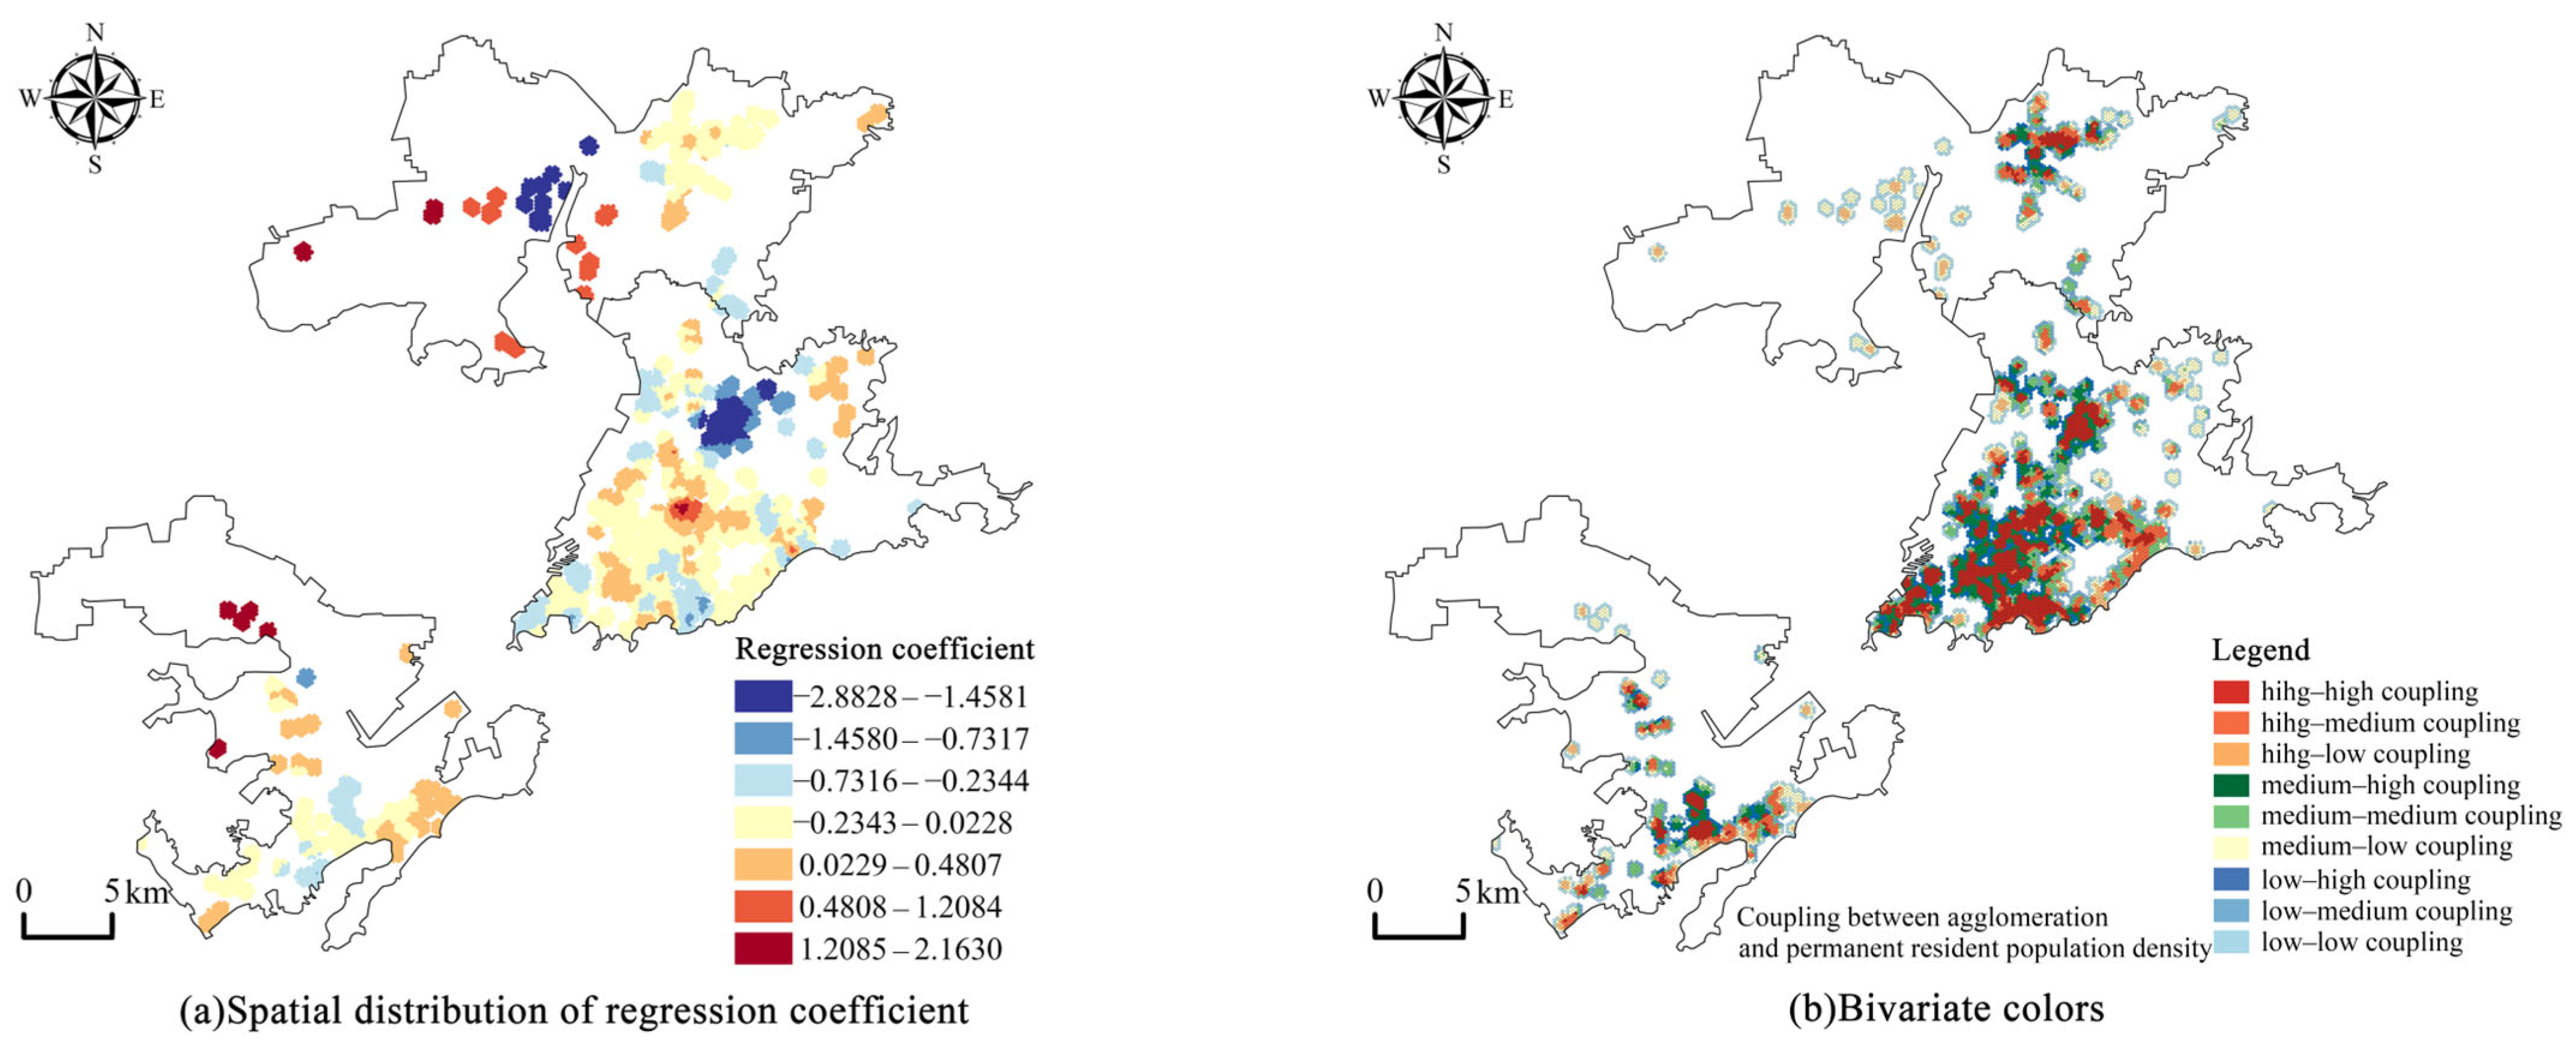
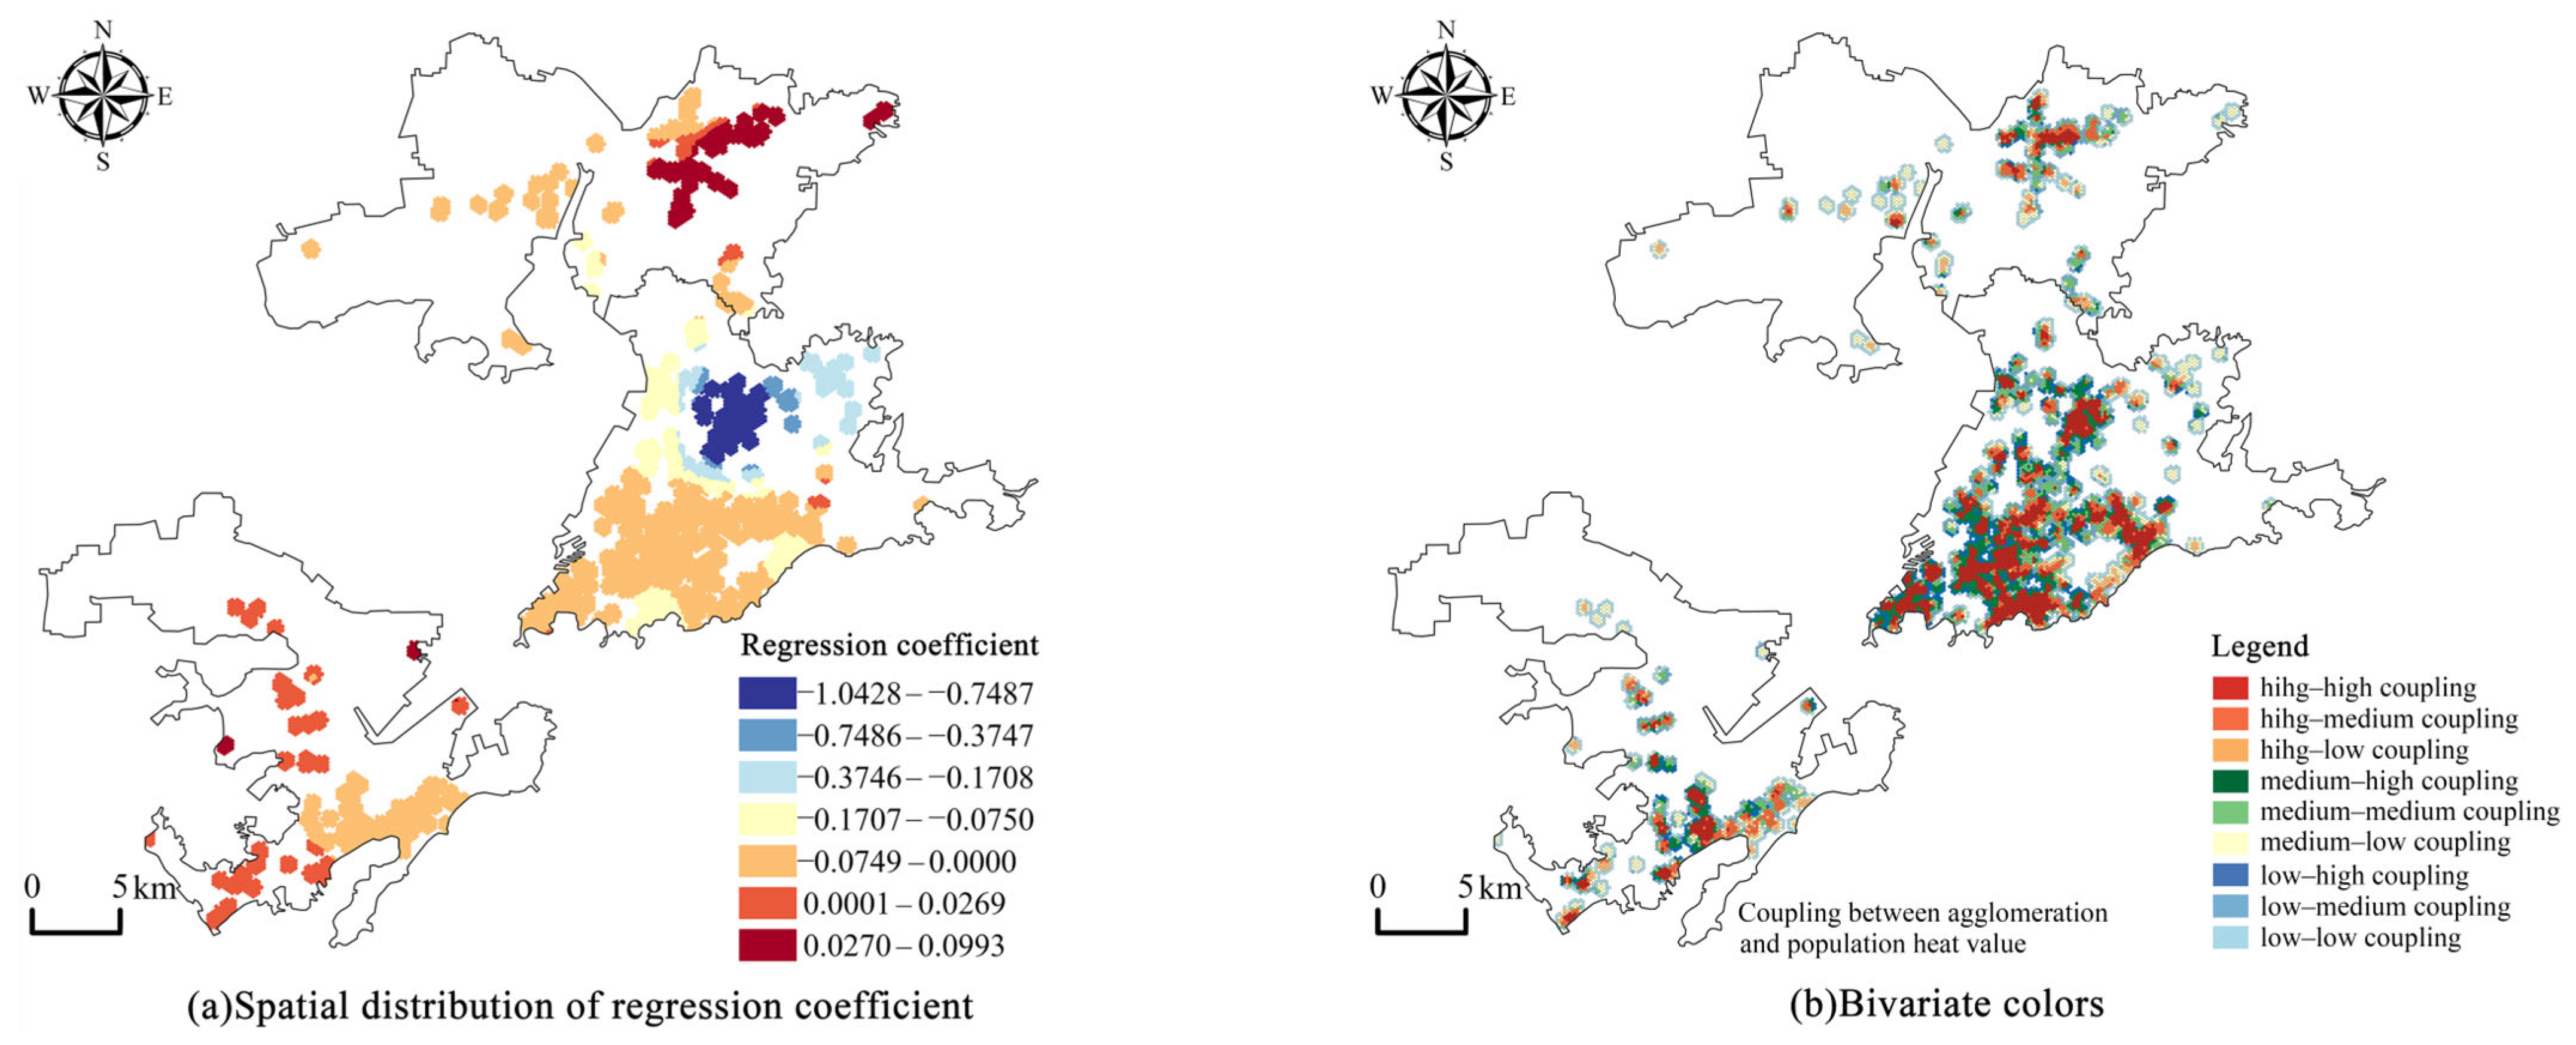
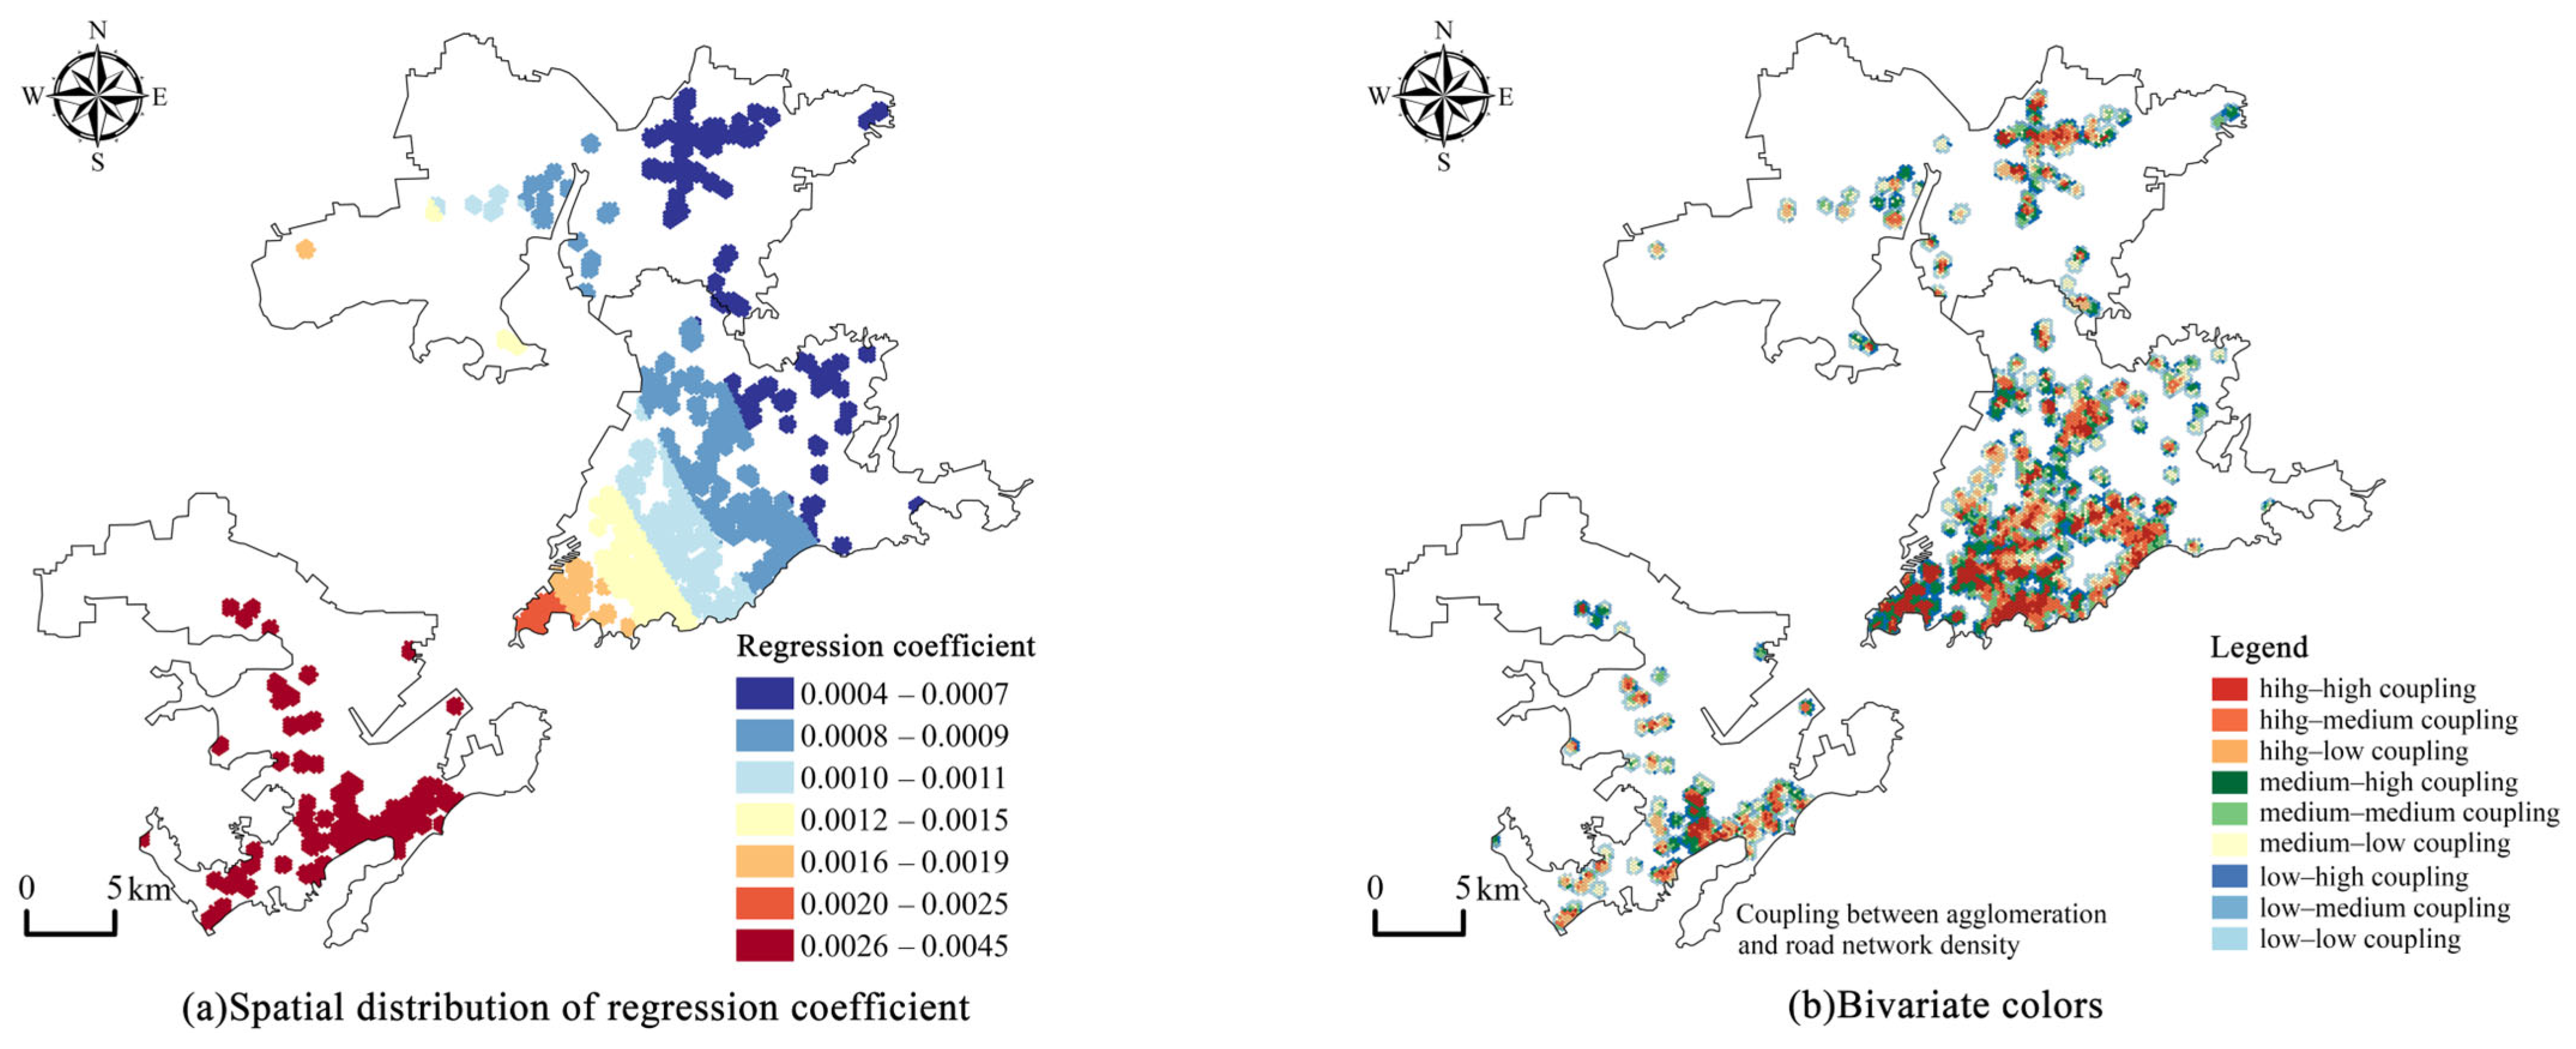
4.2.4. Regression Results of the MGWR Model
5. Discussion and Strategies
5.1. Discussion
5.2. Strategies for Optimizing the Layout of Underground Commercial Spaces
5.2.1. Business District Agglomeration-Driven Strategy: Activating Underground Commercial Clusters via Large-Scale Business Districts as Spatial Catalysts
5.2.2. Station–Area Synergistic Development: Building a Passenger–Flow–Business–Space Symbiotic Interface Through Three-Dimensional Transit-Oriented Development
5.2.3. Supply-and-Demand Coupling Measurement: Guiding the Flexible Layout of Underground Commercial Spaces via the “Population-Commercial Supply” Assessment Mechanism
5.2.4. 3D Cadastre Proactivity: Enhance the Top-Level Design by Integrating Forward-Looking Planning with the Development of a Three-Dimensional Cadastre System
6. Conclusions
- (1)
- The underground commercial spaces in the central urban area exhibit a “multi-core–multi-level” distribution pattern, with seven core areas and a hierarchical division into “high-density core–medium-density belt–low-density points–nascent areas”. Areas with higher underground commercial densities are more likely to agglomerate, and overall, they display a “high-high” clustering pattern, with the most significant agglomeration occurring at a scale of 3.39 km.
- (2)
- Commercial supporting facilities, development of underground space, and population heat value serve as the core driving factors for the clustering of underground commercial facilities. The interaction between development of underground space and population heat value exhibits the highest explanatory power, jointly accounting for 52.86% of the spatial layout of underground commercial facilities from the perspectives of underground facility development levels and consumer demand. The explanatory power of other factors significantly increases after interacting with rail transit and central location, indicating that these two factors exhibit the strongest coupling effects with other influencing factors.
- (3)
- The influences of centrality, commercial supporting facilities, development of underground space, shop rent, land cost, and permanent resident population density on the agglomeration of underground commercial space is predominantly localized; the influences of rail transit and population heat value exert a medium-scale influence on underground commercial space agglomeration. The spatial differentiation of various influencing factors is the fundamental cause of the spatial heterogeneity of underground commercial spaces. Therefore, the development of underground commercial spaces requires forward-looking planning to address these challenges. By establishing and improving a three-dimensional land registration management system, obstacles caused by unclear underground space usage rights can be effectively mitigated. Furthermore, specialized development can be achieved by leveraging the radiation and driving effects of regional advantages such as ground-level commercial areas and rail transit systems.
Author Contributions
Funding
Data Availability Statement
Conflicts of Interest
Abbreviations
| GWR | Geographically weighted regression |
| MGWR | Multi-scale geographically weighted regression |
| KDE | Kernel density estimation |
| POI | Point of Interest |
| Ripley’s K | Multi-distance spatial clustering |
| OLS | Ordinary least squares |
| L(d) | The observed value |
| ExpK | The expected value |
| DiffK | The difference between the observed value and the expected value |
| EB | Double-factor enhancement |
| EN | Nonlinear enhancement |
| WU | Single-factor nonlinear weakening |
| R2 | The goodness of fit |
| Adjusted R2 | The adjusted goodness of fit |
| RSS | Residual sum of squares |
| AICc | Akaike information criterion with correction for small sample sizes |
| VIF | Variance Inflation Factor |
References
- Broere, W. Urban Underground Space: Solving the Problems of Today’s Cities. Tunn. Undergr. Space Technol. 2016, 55, 245–248. [Google Scholar] [CrossRef]
- Yi, R.; Yan, H.; Qi, M.; Zhang, Z.; Dong, Z.; Wang, Y.; Jiang, Y.; Zeng, J.; Jia, K. Suitability Evaluation of Urban Underground Space Development Based on Urban Planning. Geol. Explor. 2024, 60, 339–347. [Google Scholar]
- Qiao, Y.; Peng, F.; Sabri, S.; Rajabifard, A. Socio-Environmental Costs of Underground Space Use for Urban Sustainability. Sustain. Cities Soc. 2019, 51, 101757. [Google Scholar] [CrossRef]
- Alfred, M. Principles of Economics; The Macmillan Company: London, UK, 1938. [Google Scholar]
- Alfred, W. Theory of the Location of Industries; J.C.B. Mohr (Paul Siebeck): Tübingen, Germany, 1909. [Google Scholar]
- Walter, C. Central Places in Southern Germany; Gustav Fischer Verlag: Jena, Germany, 1933. [Google Scholar]
- Wei, Z.; Su, H.; Huang, R. A POI Data-Based Analysis of Commercial Agglomeration Characteristics of Xi’an. J. Southwest Univ. Sci. Ed. 2020, 42, 97–104. [Google Scholar] [CrossRef]
- Chen, H.; Yang, D.; Li, J.; Wu, R.; Huo, J. Distribution Characteristics and Influencing Factors of Commercial Center and Hotspots Based on Big Data: A Case of the Main Urban Area of Urumqi City. Prog. Geogr. 2020, 39, 738–750. [Google Scholar] [CrossRef]
- Zhou, Q.; Zheng, Y. Research on the Spatial Layout Optimization Strategy of Huaihe Road Commercial Block in Hefei City Based on Space Syntax Theory. Front. Comput. Neurosci. 2023, 16, 1084279. [Google Scholar] [CrossRef]
- Zhang, J.; Song, J.; Fan, Z. The Study of Historical Progression in the Distribution of Urban Commercial Space Locations—Example of Paris. Sustainability 2023, 15, 14499. [Google Scholar] [CrossRef]
- Li, W.; Zhang, M.; Duan, J. The Research of Nanjing Urban Spatial Pattern Based on POI Data. World Reg. Stud. 2020, 29, 317–326. [Google Scholar]
- Tang, Y.; Tang, Y. Analysis of the Spatial Characteristics and Driving Forces of Underground Consumer Service Space in Chinese Megacities Based on Multi-Source Data. Sustain. Cities Soc. 2024, 116, 105924. [Google Scholar] [CrossRef]
- Peng, F.; Qiao, Y.; Zhao, J.; Liu, K.; Li, J. Planning and Implementation of Underground Space in Chinese Central Business District (CBD): A Case of Shanghai Hongqiao CBD. Tunn. Undergr. Space Technol. 2020, 95, 103176. [Google Scholar] [CrossRef]
- Hu, B.; Li, H. Design of Improving the Business Vigor of Underground Commercial Space. Chin. J. Undergr. Space Eng. 2014, 10, 1575–1579. [Google Scholar]
- Li, W.; Yin, F.; Zhang, M. Study on Development and Design of Underground Commercial Street in Old City—Take Jianjun Road Underground Street in Yan City as Example. Chin. J. Undergr. Space Eng. 2015, 11, 541–546. [Google Scholar]
- Guo, B. Discussion and Analysis on Designing of Underground Commercial Street. Chin. J. Undergr. Space Eng. 2014, 10, 1571–1574. [Google Scholar]
- Ma, G.; Yan, J.; Yang, X. The Research on ActivitIies of Underground Commercial Space of Rail Transit Station Based on Coordinated Development: Analysis of Underground Commercial Space of Jinhui Squara in Tianjin. Mod. Urban Res. 2016, 31, 100–105. [Google Scholar]
- Shang, Q.; Meng, F. Factors Affecting the Vitality of Underground Commercial Space. Chin. J. Undergr. Space Eng. 2024, 20, 1073–1085. [Google Scholar] [CrossRef]
- Yuan, H.; Zuo, F.; Zhang, L. Commercial Conditions and Realignment Measures for CBD’s Underground Space in Chongqing. Chin. J. Undergr. Space Eng. 2017, 13, 1157–1164+1172. [Google Scholar]
- Fan, L.; Cui, X. Analysis of the Factors Influencing the Comfort of Different Behaviors in Underground Commercial Space: A Case Study of Track Connection to Underground Space. Iran. J. Sci. Technol. Trans. Civ. Eng. 2023, 47, 2485–2495. [Google Scholar] [CrossRef]
- Shao, J.; Hu, Z. Study on Multi-coupling between Urban Underground and Aboveground. Chin. J. Undergr. Space Eng. 2017, 13, 1431–1443. [Google Scholar]
- Tang, Y.; He, L.; Wang, R.; Tang, F.; Zhang, Z. Spatial Distribution Patternand Influence Factors of Underground Commerce in Nanjing. Chin. J. Undergr. Space Eng. 2023, 19, 368–379. [Google Scholar]
- Dong, L.; Wei, C. Research on Stereo Design of Traditional Business District in City: Taking the Commercial District Around Kunshan Commercial Building as an Example. Zhuangshi 2022, 139–141. [Google Scholar] [CrossRef]
- Fang, H.; Shen, Z.; Yu, B.; Li, Y.; Luo, K. Spatial and Temporal Evolution of Underground Commercial Space in Chengdu Based on POI Data: A Case Study Based on North Railway Station Area, Chunxi Road Area and Global Center Area. South Archit. 2022, 85–93. [Google Scholar] [CrossRef]
- Zhang, D.; Xia, H.; Liu, Y. The Application Research and Assessment Method of Underground Commercial Space of Rail Transit. Huazhong Archit. 2019, 37, 59–62. [Google Scholar] [CrossRef]
- Yang, Q.; He, D.; Gao, P. Spatial Pattern and Influencing Factor Analysis of Experience Business in Shanghai. Urban Probl. 2018, 34–41. [Google Scholar] [CrossRef]
- Qiao, Y.; Peng, F. Advances and Development Thoughts on Three-Dimensional Urban Underground Cadastre. Chin. J. Undergr. Space Eng. 2023, 19, 359–367, 409. [Google Scholar]
- Yan, J.; Yin, C.; An, Z.; Zhang, S.; Wen, Q.; Chen, W. Integrated Impacts of Urban Spatial Form on Thermal Environment and Zonal Regulation under the Perspective of Spatial Heterogeneity. Trop. Geogr. 2025, 45, 143–154. [Google Scholar] [CrossRef]
- Song, Y.; Gao, M.; Wang, J.; Xu, Z. Spatial Prediction and Influencing Factors Analysis of Soil Salinization in Coastal Area Based on MGWR. Environ. Sci. 2024, 45, 4293–4301. [Google Scholar] [CrossRef]
- Hu, Y.; An, R.; Yang, J.; Liu, Y. Measurement and Driving Mechanism of Land Use Conflict Based on Landscape Pattern—A Case Study of Wuhan Metropolitan Area. Res. WaterConservation 2024, 31, 354–364. [Google Scholar] [CrossRef]
- The State Council’s Approval of the “Shandong Province Territorial Spatial Planning (2021–2035)” (Guo Han [2023] No. 102). Available online: https://www.gov.cn/zhengce/zhengceku/202309/content_6906387.htm (accessed on 10 March 2025).
- The State Council’s Approval of the “Qingdao City Territorial Space Planning (2021–2035)” (Guo Han [2024] No. 169). Available online: https://www.gov.cn/zhengce/zhengceku/202411/content_6986714.htm (accessed on 10 March 2025).
- The 2023 China Blue Book on the Development of Urban Underground Space. Available online: http://www.csrme.com/content/article/show/id/4617.do (accessed on 15 March 2025).
- Yang, Y.; Li, Q. Distribution Pattern and Lts Formation Mechanism of Public Recreational Space Based on POl Data: A Case Study of the Main Urban Area of Changsha City. Mod. Urban Res. 2021, 91–97. [Google Scholar] [CrossRef]
- Yang, Z.; He, X.; Sui, X.; Zhang, J. Analysis of the Evolution of Urban Center Space Based on POI:A Case Study of Main Area in Kunming. Urban Dev. Stud. 2019, 26, 31–35. [Google Scholar]
- Liu, W.; Lv, S.; Liang, F. Kernel Density Discriminant Method Based on Geodesic Distance. J. Fuzhou Univ. Nat. Sci. Ed. 2011, 39, 807–810. [Google Scholar]
- Chen, P.; Yuan, L.; Sun, Y. Research on the Spatial and Temporal Evolution of Urban Structure Based on POI Data and Nighttime Light Data: A Case Study of Fuzhou City. Mod. Urban Res. 2024, 39, 49–54. [Google Scholar]
- Meng, B.; Wang, J.; Zhang, W.; Liu, X. Evaluation of Regional Disparity in China Based on Spatial Analysis. Sci. Geogr. Sin. 2005, 25, 393–400. [Google Scholar]
- Zhang, S.; Zhang, K. Comparison between General Moran’ s Index and Getis-Ord General G of Spatial Autocorrelation. ACTA Sci. Nat. Univ. Sunyatseni 2007, 46, 93–97. [Google Scholar]
- Jin, C.; Lu, Y. Evolvement of Spatial Pattern of Economy in Jiangsu Province at County Level. ACTA Geogr. Sin. 2009, 64, 713–724. [Google Scholar]
- Liu, D.; Hu, J.; Chen, J.; Xu, X. The Study of Spatial Distribution Pattern of Traditional Villages in China. China Popul. Resour. Environ. 2014, 24, 157–162. [Google Scholar]
- Li, X.; Li, H.; Man, W.; Mao, D.; Wang, Z. Process and Driving Factors of Urban Land Expansion in Harbin-Changchun City Cluster. Sci. Geogr. Sin. 2018, 38, 1273–1282. [Google Scholar] [CrossRef]
- Wang, Z.; Xu, H.; Xu, W.; Lin, J.; Liu, X.; Li, Z.; Zhu, J. Distribution Dynamics of Red-Crowned Crane Population in Zhalong Wetland by the Point Pattern Analysis. Sci. Silvae Sin. 2017, 53, 168–174. [Google Scholar]
- Tang, Y.; Wu, Z.; Chen, H. Spatial Characteristics and Influencing Factors of Suzhou’s Catering Industry in the Internet Era. Trop. Geogr. 2022, 42, 1904–1917. [Google Scholar] [CrossRef]
- Wang, H.; Wu, J.; Gao, Y.; Liu, L.; Yang, W.; Peng, Z.; Guan, Q. Spatial Fitness of Urban Public Resources and Population Distribution: Taking Shenzhen as an Example. Acta Sci. Nat. Univ. Pekin. 2021, 57, 1143–1152. [Google Scholar] [CrossRef]
- Wang, J.; Xu, C. Geodetector: Principle and Prospective. ACTA Geogr. Sin. 2017, 72, 116–134. [Google Scholar]
- Lv, C.; Lan, X.; Sun, W. A Study on the Relationship between Natural Factors and Population Distribution in Beijing Using Geographical Detector. J. Nat. Resour. 2017, 32, 1385–1397. [Google Scholar] [CrossRef]
- Ding, Y.; Cai, J.; Ren, Z.; Yang, Z. Spatial Disparities of Economic Growth Rate of China’s National-Level ETDZs and Their Determinants Based on Geographical Detector Analysis. Prog. Geogr. 2014, 33, 657–666. [Google Scholar]
- Guo, F.; Tong, L.; Qiu, F.; Li, Y. Spatio-Temporal Differentiation Characteristics and Influencing Factors of Green Development in the Eco-Economic Corridor of the Yellow River Basin. ACTA Geogr. Sin. 2021, 76, 726–739. [Google Scholar]
- Yang, R.; Luo, X.; Chen, Y. Spatial Pattern and Influencing Factors of Rural Multifunctionality at County Level in China. Prog. Geogr. 2019, 38, 1316–1328. [Google Scholar] [CrossRef]
- Liu, Y.; Yang, R. The Spatial Characteristics and Formation Mechanism of the County Urbanization in China. ACTA Geogr. Sin. 2012, 67, 1011–1020. [Google Scholar]
- Zhou, L.; Ou, G.; Wang, J.; Xu, H. Light Saturation Point Determination and Biomass Remote Sensing Estimation of Pinus Kesiya Var. Langbianensis Forest Based on Spatial Regression Models. Sci. Silvae Sin. 2020, 56, 38–47. [Google Scholar]
- Wang, C.; Luo, J.; Wang, Z.; Zhang, Q.; Xie, L. Spatial Pattern Evaluation and Spatial Optimization of Natural Protected Areas in Taihang Mountains Based on the MGWR Model. Chin. J. Ecol. 2025, 44, 325–336. [Google Scholar] [CrossRef]
- Zhu, C.; Zheng, L.; Zhang, Y. Spatial Heterogeneity Analysis of Bikesharing Based on MGWR. Logist. Sci-Tech 2024, 47, 72–77. [Google Scholar] [CrossRef]
- Liu, Y.; Yang, Z.; Xu, G.; Liu, B.; Zhang, P.; Chi, J. Impacts of Urbanization on Habitat Quality Using MGWR Models in Wanjiang City Belt. Sci. Geogr. Sin. 2023, 43, 280–290. [Google Scholar] [CrossRef]
- Wang, E.; Zhou, J.; Yang, J.; Wang, Y.; Yang, P.; Wang, X. Impact of Built Environment on Spatial Differentiation of Urban Vitality at the Subdistrict Level Based on MGWR: A Case Study of of Shenyang Central Urban Area. Sci. Geogr. Sin. 2024, 44, 1322–1331. [Google Scholar] [CrossRef]
- Wang, Y.; Ye, S.; Jin, Y.; Shi, J. A Study on the Underground Commercial Layout of Hangzhou Rail Transit Stations. Railw. Transp. Econ. 2018, 40, 95–100. [Google Scholar] [CrossRef]


| Type | Underground Commercial Spaces | Catering Services | Shopping Services | Science, Education, and Cultural Services | Accommodation Services | Business Support Services | Life Support Services | Leisure and Entertainment Services |
|---|---|---|---|---|---|---|---|---|
| Global Moran’s I | 0.819 | 0.501 | 0.470 | 0.479 | 0.088 | 0.511 | 0.550 | 0.105 |
| p-Value | 0.00 | 0.00 | 0.00 | 0.00 | 0.00 | 0.00 | 0.00 | 0.00 |
| Z-Score | 203.1 | 58.07 | 55.39 | 48.05 | 7.06 | 48.74 | 65.99 | 7.959 |
| Dimensions | Influencing Factor | Description |
|---|---|---|
| Location and Transportation | Rail transit (×1) | Distance from the grid centroid to the nearest subway station |
| Road network density (×2) | The ratio of road network length to the buffer zone area within a 500 m walking buffer | |
| Centrality (×3) | Shortest distance from the grid centroid to a major commercial district 1 | |
| Functional Space | Commercial supporting facilities (×4) | The ratio of road network length to the area of the 500 m walking buffer |
| Development of underground space (×5) | The ratio of the number of underground POIs to the area of the 500 m walking buffer | |
| Development Status | Ground development Intensity (×6) | The ratio of built-up areas to the area of the 500 m walking buffer |
| Shop rent (×7) | Average shop rent within the grid | |
| Land cost (×8) | Average transaction price per unit area for new housing within the grid | |
| Population Factors | Permanent resident population density (×9) | The ratio of permanent resident population to the area of the 500 m walking buffer |
| Population heat value (×10) | The average population heat value within the 500 m walking buffer |
| Factor | ×1 | ×2 | ×3 | ×4 | ×5 | ×6 | ×7 | ×8 | ×9 | ×10 |
|---|---|---|---|---|---|---|---|---|---|---|
| q-value | 0.0051 | 0.0104 | 0.0701 | 0.2653 | 0.3890 | 0.0632 | 0.0087 | 0.0176 | 0.1117 | 0.2801 |
| p-value | <0.001 | <0.001 | <0.001 | <0.001 | <0.001 | <0.001 | <0.001 | <0.001 | <0.001 | <0.001 |
| Factor | ×1 | ×2 | ×3 | ×4 | ×5 | ×6 | ×7 | ×8 | ×9 | ×10 |
|---|---|---|---|---|---|---|---|---|---|---|
| ×1 | 0.0551 | EB | EN | EN | EB | EN | EN | EN | EN | EB |
| ×2 | 0.0638 | 0.0104 | EN | EN | EB | EN | EN | EB | EN | EB |
| ×3 | 0.1337 | 0.0926 | 0.0701 | EB | EB | EN | EN | EN | EN | EB |
| ×4 | 0.3206 | 0.3707 | 0.3210 | 0.2653 | EB | EB | EN | EN | EB | EB |
| ×5 | 0.4359 | 0.3986 | 0.4286 | 0.5190 | 0.3890 | EB | EN | EN | EB | EB |
| ×6 | 0.1233 | 0.0823 | 0.1363 | 0.3274 | 0.4453 | 0.0632 | EN | EN | EB | EB |
| ×7 | 0.073 | 0.0197 | 0.0927 | 0.3000 | 0.4008 | 0.0799 | 0.0087 | EB | EN | WE |
| ×8 | 0.0751 | 0.0255 | 0.0984 | 0.2899 | 0.4299 | 0.0903 | 0.0222 | 0.0176 | EN | EN |
| ×9 | 0.1746 | 0.1394 | 0.2340 | 0.3364 | 0.4564 | 0.1598 | 0.1278 | 0.1440 | 0.1117 | EB |
| ×10 | 0.319 | 0.2886 | 0.3125 | 0.3569 | 0.5286 | 0.3050 | 0.2611 | 0.3013 | 0.3153 | 0.2801 |
| Model | OLS | GWR | MGWR |
|---|---|---|---|
| R2 | 0.418 | 0.677 | 0.859 |
| Adjusted R2 | 0.417 | 0.676 | 0.834 |
| RSS | 4199 | 2332 | 1016 |
| AICc | 16,588 | 12,659 | 8872 |
| Explanatory Variables | Mean | Minimum | Maximum | Standard Deviation | Bandwidth (GWR) | Bandwidth (MGWR) | VIF |
|---|---|---|---|---|---|---|---|
| Rail transit | −0.615 | −1.325 | 0.216 | 0.460 | 722 | 1115 | 1.564 |
| Road network density | 0.002 | 0.000 | 0.005 | 0.001 | 722 | 7210 | 1.091 |
| Centrality | 0.421 | −1.853 | 5.528 | 1.317 | 722 | 46 | 2.050 |
| Commercial supporting facilities | 0.538 | −0.876 | 5.230 | 0.934 | 722 | 47 | 2.654 |
| Development of underground space | 0.798 | −4.491 | 5.250 | 1.097 | 722 | 48 | 1.332 |
| Ground development intensity | −0.017 | −0.019 | −0.013 | 0.002 | 722 | 7210 | 1.730 |
| Shop rent | 0.028 | −1.605 | 3.910 | 0.492 | 722 | 50 | 1.596 |
| Land cost | 0.087 | −4.723 | 4.936 | 1.557 | 722 | 145 | 2.149 |
| Permanent resident population density | −0.144 | −2.883 | 2.163 | 0.608 | 722 | 48 | 3.085 |
| Population heat value | −0.109 | −1.043 | 0.099 | 0.239 | 722 | 406 | 2.393 |
Disclaimer/Publisher’s Note: The statements, opinions and data contained in all publications are solely those of the individual author(s) and contributor(s) and not of MDPI and/or the editor(s). MDPI and/or the editor(s) disclaim responsibility for any injury to people or property resulting from any ideas, methods, instructions or products referred to in the content. |
© 2025 by the authors. Licensee MDPI, Basel, Switzerland. This article is an open access article distributed under the terms and conditions of the Creative Commons Attribution (CC BY) license (https://creativecommons.org/licenses/by/4.0/).
Share and Cite
Zhao, J.; Wang, H.; Sun, Y.; Li, H.; Zhu, Y. Investigation into the Distribution Features and Determinants of Underground Commercial Spaces in Qingdao City. Buildings 2025, 15, 1743. https://doi.org/10.3390/buildings15101743
Zhao J, Wang H, Sun Y, Li H, Zhu Y. Investigation into the Distribution Features and Determinants of Underground Commercial Spaces in Qingdao City. Buildings. 2025; 15(10):1743. https://doi.org/10.3390/buildings15101743
Chicago/Turabian StyleZhao, Jingwei, Heqing Wang, Yu Sun, Haoqi Li, and Yinge Zhu. 2025. "Investigation into the Distribution Features and Determinants of Underground Commercial Spaces in Qingdao City" Buildings 15, no. 10: 1743. https://doi.org/10.3390/buildings15101743
APA StyleZhao, J., Wang, H., Sun, Y., Li, H., & Zhu, Y. (2025). Investigation into the Distribution Features and Determinants of Underground Commercial Spaces in Qingdao City. Buildings, 15(10), 1743. https://doi.org/10.3390/buildings15101743