Article

Fire Resistance of Prefabricated Steel Tubular Columns with Membrane Protections

1
Shenzhen International Graduate School, Tsinghua University, Shenzhen 518055, China
2
China Construction Science and Industry Corporation Ltd., Shenzhen 518118, China
3
School of Materials Science and Engineering, Harbin Institute of Technology, Shenzhen, Shenzhen 518067, China
*
Author to whom correspondence should be addressed.
Buildings 2025, 15(10), 1730; https://doi.org/10.3390/buildings15101730
Submission received: 23 April 2025 / Revised: 16 May 2025 / Accepted: 17 May 2025 / Published: 20 May 2025

Abstract

With the acceleration of construction industrialization and carbon reduction goals, prefabricated steel structures are widely used for their efficiency and strength. However, steel’s poor fire resistance limits its use. At high temperatures, steel weakens, leading to collapse risks. Common fire protection methods like rock wool, fire-resistant boards, and coatings focus on single materials, leaving composite systems for modular steel columns understudied. This study systematically examines the fire resistance of modular steel columns with composite protective layers through tests and simulations. It finds that rock wool shrinks under heat, reducing its effectiveness by approximately 66.7%, and suggests construction improvements to mitigate this issue. A simplified fire resistance formula is proposed, showing that the total fire resistance of multi-layer systems approximates the sum of each layer’s resistance. These insights offer practical design guidance and fill a key research gap in composite fire protection for modular steel structures.

1. Introduction

In recent years, with the acceleration of China’s construction industrialization and the advancement of carbon reduction goals, prefabricated steel structures have emerged as a mainstream technical direction in the building sector due to their core advantages, including short construction cycles, superior seismic performance, and lightweight yet high-strength characteristics [1,2]. Compared to traditional cast-in-place concrete structures, steel components, through the collaborative model of factory prefabrication and on-site assembly, significantly enhance construction efficiency and resource utilization while reducing construction pollution and energy consumption. As a more advanced form of prefabricated construction, modular steel structures achieve dual breakthroughs in building quality and functional adaptability through standardized design, intelligent manufacturing, and integrated construction. These structures have been widely applied in large-scale commercial complexes, emergency medical facilities, and high-rise residential buildings [3,4,5,6].
However, the inherent fire resistance deficiencies of steel materials severely hinder the widespread adoption of modular steel structures. Under high-temperature fire conditions, the strength and stiffness of steel degrade rapidly, leading to structural instability or even collapse [7]. In current engineering practice, passive fire protection measures, such as rock wool cladding, fire-resistant board coverage, and intumescent coating spraying, are commonly employed to delay the temperature rise of steel components. Extensive studies have been conducted on the fire resistance of steel columns with these protective measures, as well as bare steel columns [8,9,10,11,12,13]. In addition, many advances have also been made in research on the fire resistance of rock wool [14,15,16], calcium silicate boards [17,18,19], and thin fireproof coatings [20,21] themselves. Nevertheless, existing research predominantly focuses on evaluating the impact of single fireproof materials on enhancing the fire resistance of steel columns. There remains a lack of systematic investigation into synergistic interaction mechanisms, the evolution patterns of failure modes, and quantitative models for fire resistance limits in modular steel columns with composite fire protection systems. For instance, critical issues such as the thermal resistance effects of layered rock wool and fire-resistant boards, as well as the nonlinear relationship between coating thickness and thermal conductivity coefficients, have yet to establish unified design guidelines.
The primary objective of this study is to systematically investigate the impact of composite protective layers on the fire resistance of modular steel columns and to develop a simplified calculation method for evaluating their performance. Fire resistance tests and finite element simulations were conducted to analyze the effects of composite and single-layer protective systems. Rock wool was selected as the primary fireproofing material due to its widespread application, excellent thermal insulation, and cost-effectiveness. However, its susceptibility to shrinkage under high temperatures, influenced by installation methods, as well as its considerable thickness, which increases the occupied space, pose significant limitations. In contrast, calcium silicate boards and fire-resistant coatings occupy less space but are more expensive. Therefore, this study explores the composite fire resistance performance of calcium silicate boards, fire-resistant coatings, and rock wool to optimize both fire resistance and construction economics. Investigating the impact of composite protective layers on modular steel columns is thus essential for advancing fire protection design in modular steel structures.

2. Experiment Program

2.1. Test Specimens

Three full-scale modular rectangular steel columns with composite fire protection systems were designed and fabricated for this study. The geometric and material configurations of the specimens are detailed in Table 1.
In this study, the thicknesses of rock wool, calcium silicate boards, and fireproof coatings were optimized to balance economic efficiency, fire resistance duration, and cross-sectional area reduction. By varying rock wool thickness between BM1 and BM2 and comparing the addition of fireproof coatings between BM1 and BM3, we investigated their effects on the fire resistance limit of steel columns under realistic protective layer conditions, with a predicted fire resistance limit exceeding 120 min.
The test adhered to Chinese codes GB/T 9978.1-2008 [22] and GB/T 9978.7-2008 [23], which mandate at least one specimen per component with specific support or restraint conditions. Thus, fabricating a single specimen complied with the standard and minimized costs given the high expense of fire resistance testing.
Specimen BM1 comprised a dual-layer protection system: an inner 50 mm-thick rock wool insulation layer and an outer 15 mm-thick calcium silicate board.
Specimen BM2 retained the same configuration as BM1 but increased the rock wool thickness to 75 mm to evaluate insulation thickness effects.
Specimen BM3 introduced a three-layer system, incorporating an innermost thin-film intumescent fire-resistant coating (thickness: 5 mm), followed by the 50 mm rock wool and 15 mm calcium silicate board layers identical to BM1.
All specimens featured identical geometric dimensions: a total height of 3750 mm with a rectangular hollow section of 300 mm × 250 mm × 12 mm. End plates (thickness: 25 mm) were welded to both column extremities. Local stiffeners were integrated adjacent to the end plates to mitigate stress concentration and preclude end-region premature failure.
The calcium silicate boards were mechanically fastened to light-gauge steel studs that were continuously welded around the column perimeter. Structural analysis confirmed that the studs contributed negligibly to the axial load-bearing capacity; thus, the global stability was governed exclusively by the steel column. A critical 20 mm thermal expansion gap was maintained between the upper edge of the calcium silicate boards and the end plate to decouple the fire-induced axial deformation of the steel column from the protection system, thereby preventing compressive crushing of the boards prior to column buckling.
The steel column material exhibited a nominal yield strength of 355 MPa, which was validated through coupon testing. The design buckling resistance of the column, which was calculated in accordance with Chinese Code for Design of Steel Structures (GB50017-2017) [24], was 3860.6 kN.
The cross-sectional configuration of the modular steel column specimens is illustrated in Figure 1, where black dots indicate thermocouple positions at the mid-span cross-section, with red circled numbers designating sensor identifiers. All thermocouple wires exit through the top arrow-marked opening in Figure 1, with each specimen containing 10 thermocouples. As shown in Figure 1, the key variables between specimens are rock wool thickness and thin fire-resistant coating thickness: BM2 demonstrates increased rock wool thickness (75 mm) compared to the reference specimen BM1 (50 mm), while BM3 incorporates a 5 mm thin fire-resistant coating.
The protective layer installation for specimens follows the engineering sequence depicted in Figure 2. After steel column fabrication, base coat application is performed using industrial spraying techniques, with specimen BM3 receiving an additional 5 mm thin fire-resistant coating. Light steel framing is subsequently installed as structural support for calcium silicate boards, creating compartmentalized spaces for discontinuous rock wool placement (Figure 2a). Rock wool (density: 100 kg/m3) is custom-cut to match framing dimensions and friction-fitted into designated compartments: 50 mm thickness for BM1 and BM3; 75 mm thickness for BM2 (Figure 2b).
Calcium silicate cladding panels are mechanically fastened using 24 screws per face, with pre-drilled wire openings sealed post-installation using fire-rated sealant to maintain thermal integrity. This discontinuous insulation configuration aligns with standardized prefabrication protocols, replicating thermal bridging conditions observed in modular construction.

2.2. Test Setup and Specimen Installation

The fire resistance testing apparatus mainly consists of a combustion system, a specimen loading system, a control system, and a measurement and data acquisition system. The full front view of the testing apparatus is shown in Figure 3a. Among these, the specimen loading system includes an external reaction frame, a top jack, and a rail car, with the configuration of the rail car illustrated in Figure 3b. This loading system provides the necessary load conditions for the test specimens. The steps for installing the specimen are as follows: The specimen is hoisted, positioned, and transported by a tower crane to the front of the rail car, where the rail car adjusts the angle and position of the specimen. The specimen is then slowly pushed into the test furnace by the rail car, and finally, the bolt holes at the ends of the specimen are aligned with the jacks inside the test furnace and the bottom bolt holes, and the bolts are tightened to secure the specimen. The control system and the measurement and data acquisition system of the test furnace work in coordination to meet the precise control and measurement requirements of load and combustion (temperature) during the test. A strain sensor is installed below the jack outside the furnace chamber, which can display the applied load value in real time, ensuring the precise application and monitoring of the load. For temperature measurement, 10 thermocouples are arranged inside the furnace chamber to measure the temperature within the chamber, and the average temperature measured by these thermocouples is taken as the furnace chamber temperature. During the heating process, the furnace chamber temperature can be automatically controlled by the control system according to the ISO-834 standard heating curve. For the measurement of the specimen temperature, pre-embedded thermocouples are used. The specific arrangement of the thermocouples is shown in Figure 1, and the quality of these thermocouples meets the requirements of GBT2614-2010 [25], ensuring the accuracy and reliability of the specimen temperature measurement.

2.3. Test Procedures

After completing the installation of the specimen and carefully verifying the wiring and data acquisition system, the test officially enters the room temperature pre-loading phase. During this phase, the load is applied incrementally to reach 70–80% of the test load value. Incremental loading allows the specimen to adapt smoothly to load changes, avoiding damage caused by sudden load variations and ensuring the reliability of the test data. Once the target load is reached, it is maintained for a period to allow the internal stress distribution within the specimen to reach a relatively balanced state, after which the load is slowly unloaded. This pre-loading process helps assess the mechanical performance and stability of the specimen at room temperature, providing foundational data for subsequent formal testing.
Following this process, the room temperature loading phase begins. This phase also employs incremental loading, gradually increasing the load to the test load. After each loading increment, the load is held stable for 2 min, during which high-precision data acquisition equipment is used to collect displacement data from the specimen. Analyzing the displacement data at each load level provides a detailed understanding of the mechanical behavior and deformation patterns of the specimen at room temperature.
During the heating phase, the load is kept stable while ignition and temperature rise occur, and temperature and displacement data are automatically and continuously collected. When the specimen fails, heating is stopped, and the specimen is slowly unloaded, marking the end of the test.
For the fire resistance limit test, the criteria specified in ISO-834-193 [12,13] are used to determine specimen failure. The specimen is considered to have failed when one of the following conditions are met: the axial compression of the column reaches 0.01 H (mm) (37.5 mm in this test) or the axial compression rate exceeds 0.003 H (mm/min) (11.25 mm/min in this test), where H is the column height in mm (3750 mm in this test).

3. Test Results and Discussions

3.1. Observations

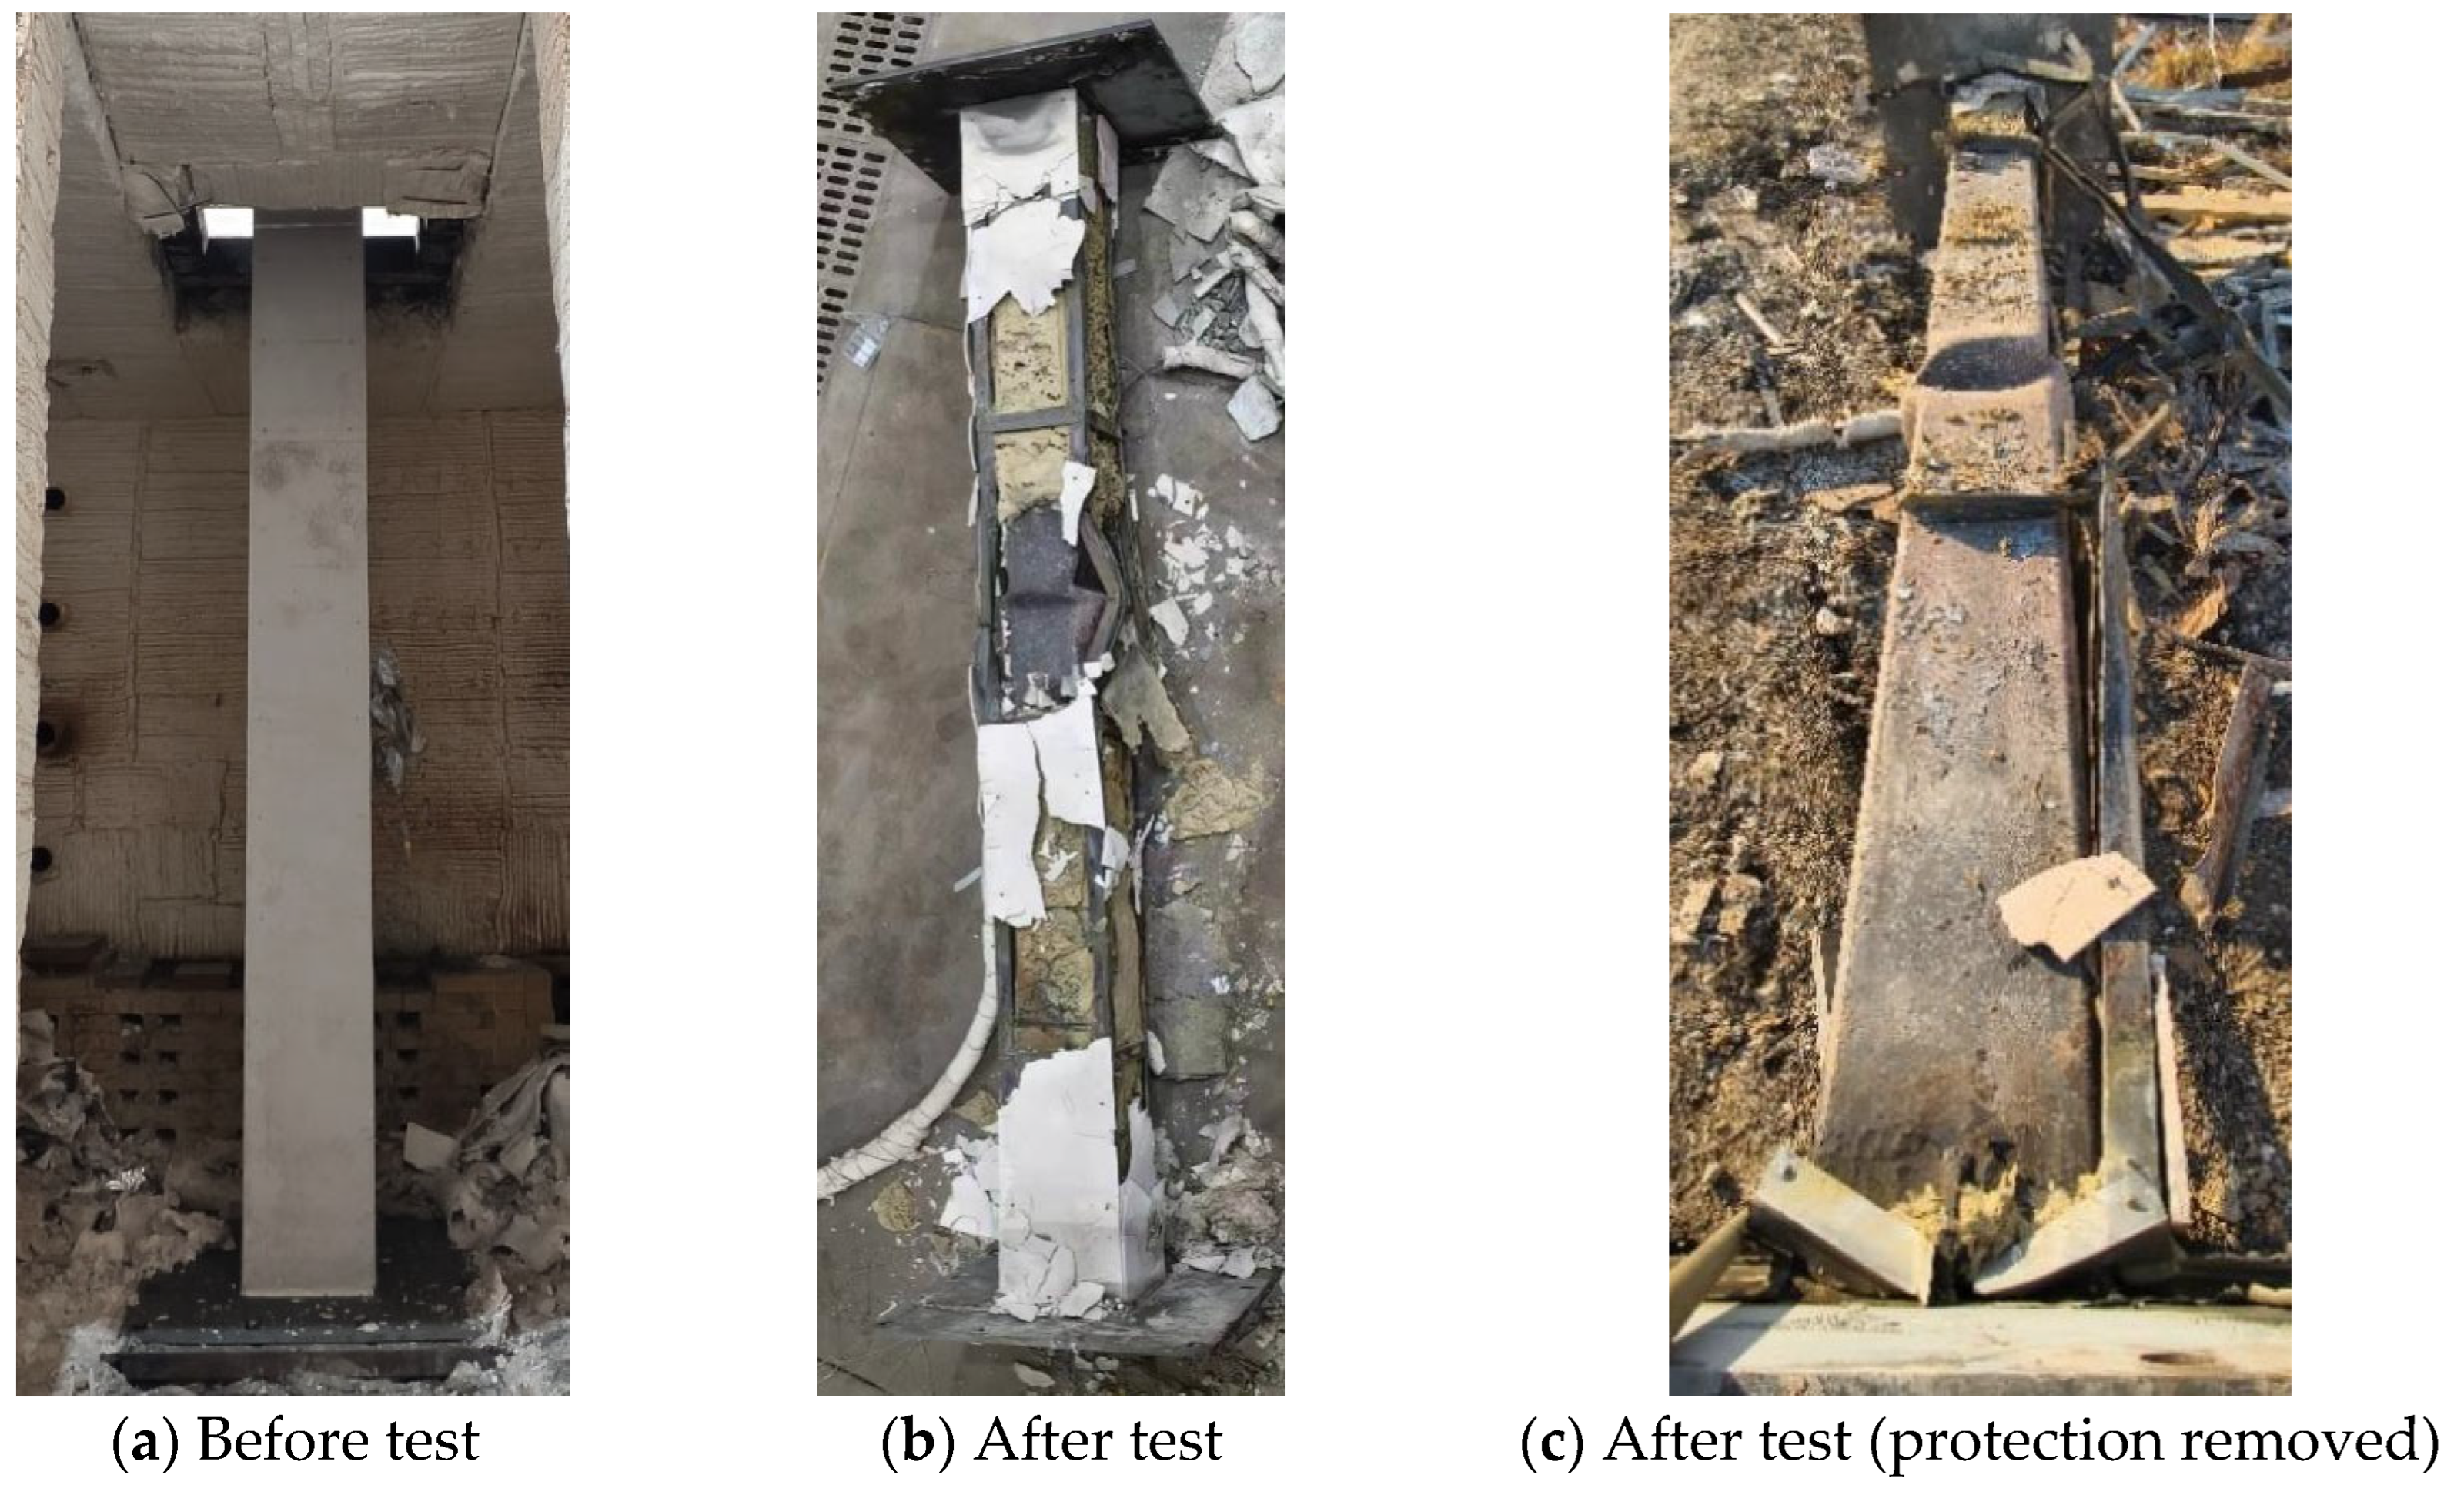
A comparison of specimen BM1 before and after the test is shown in Figure 4. The failure mode observed after the test was global instability, with symmetrical wrinkling occurring on all four sides near the upper mid-span region due to this instability. Additionally, the light steel studs in the vicinity also exhibited instability. The fire resistance limit of the specimen was determined to be 86 min. Post-test, the calcium silicate boards were found to be shattered and delaminated, with near-complete destruction and noticeable buckling deformation observed in the mid-span region. In contrast, the calcium silicate boards near the ends showed minimal deformation and retained their white color, as seen in Figure 4b. The rock wool exhibited significant shrinkage and hardening. Since the rock wool was not continuous but rather severed at multiple locations, the shrinkage created noticeable gaps at these severed points, allowing flames to easily penetrate through the gaps, which adversely affected the fire insulation performance of the rock wool. Upon removing the surface protective layer of specimen BM1, as shown in Figure 4c, no visually observable deformation was found, except for the wrinkling caused by global instability.
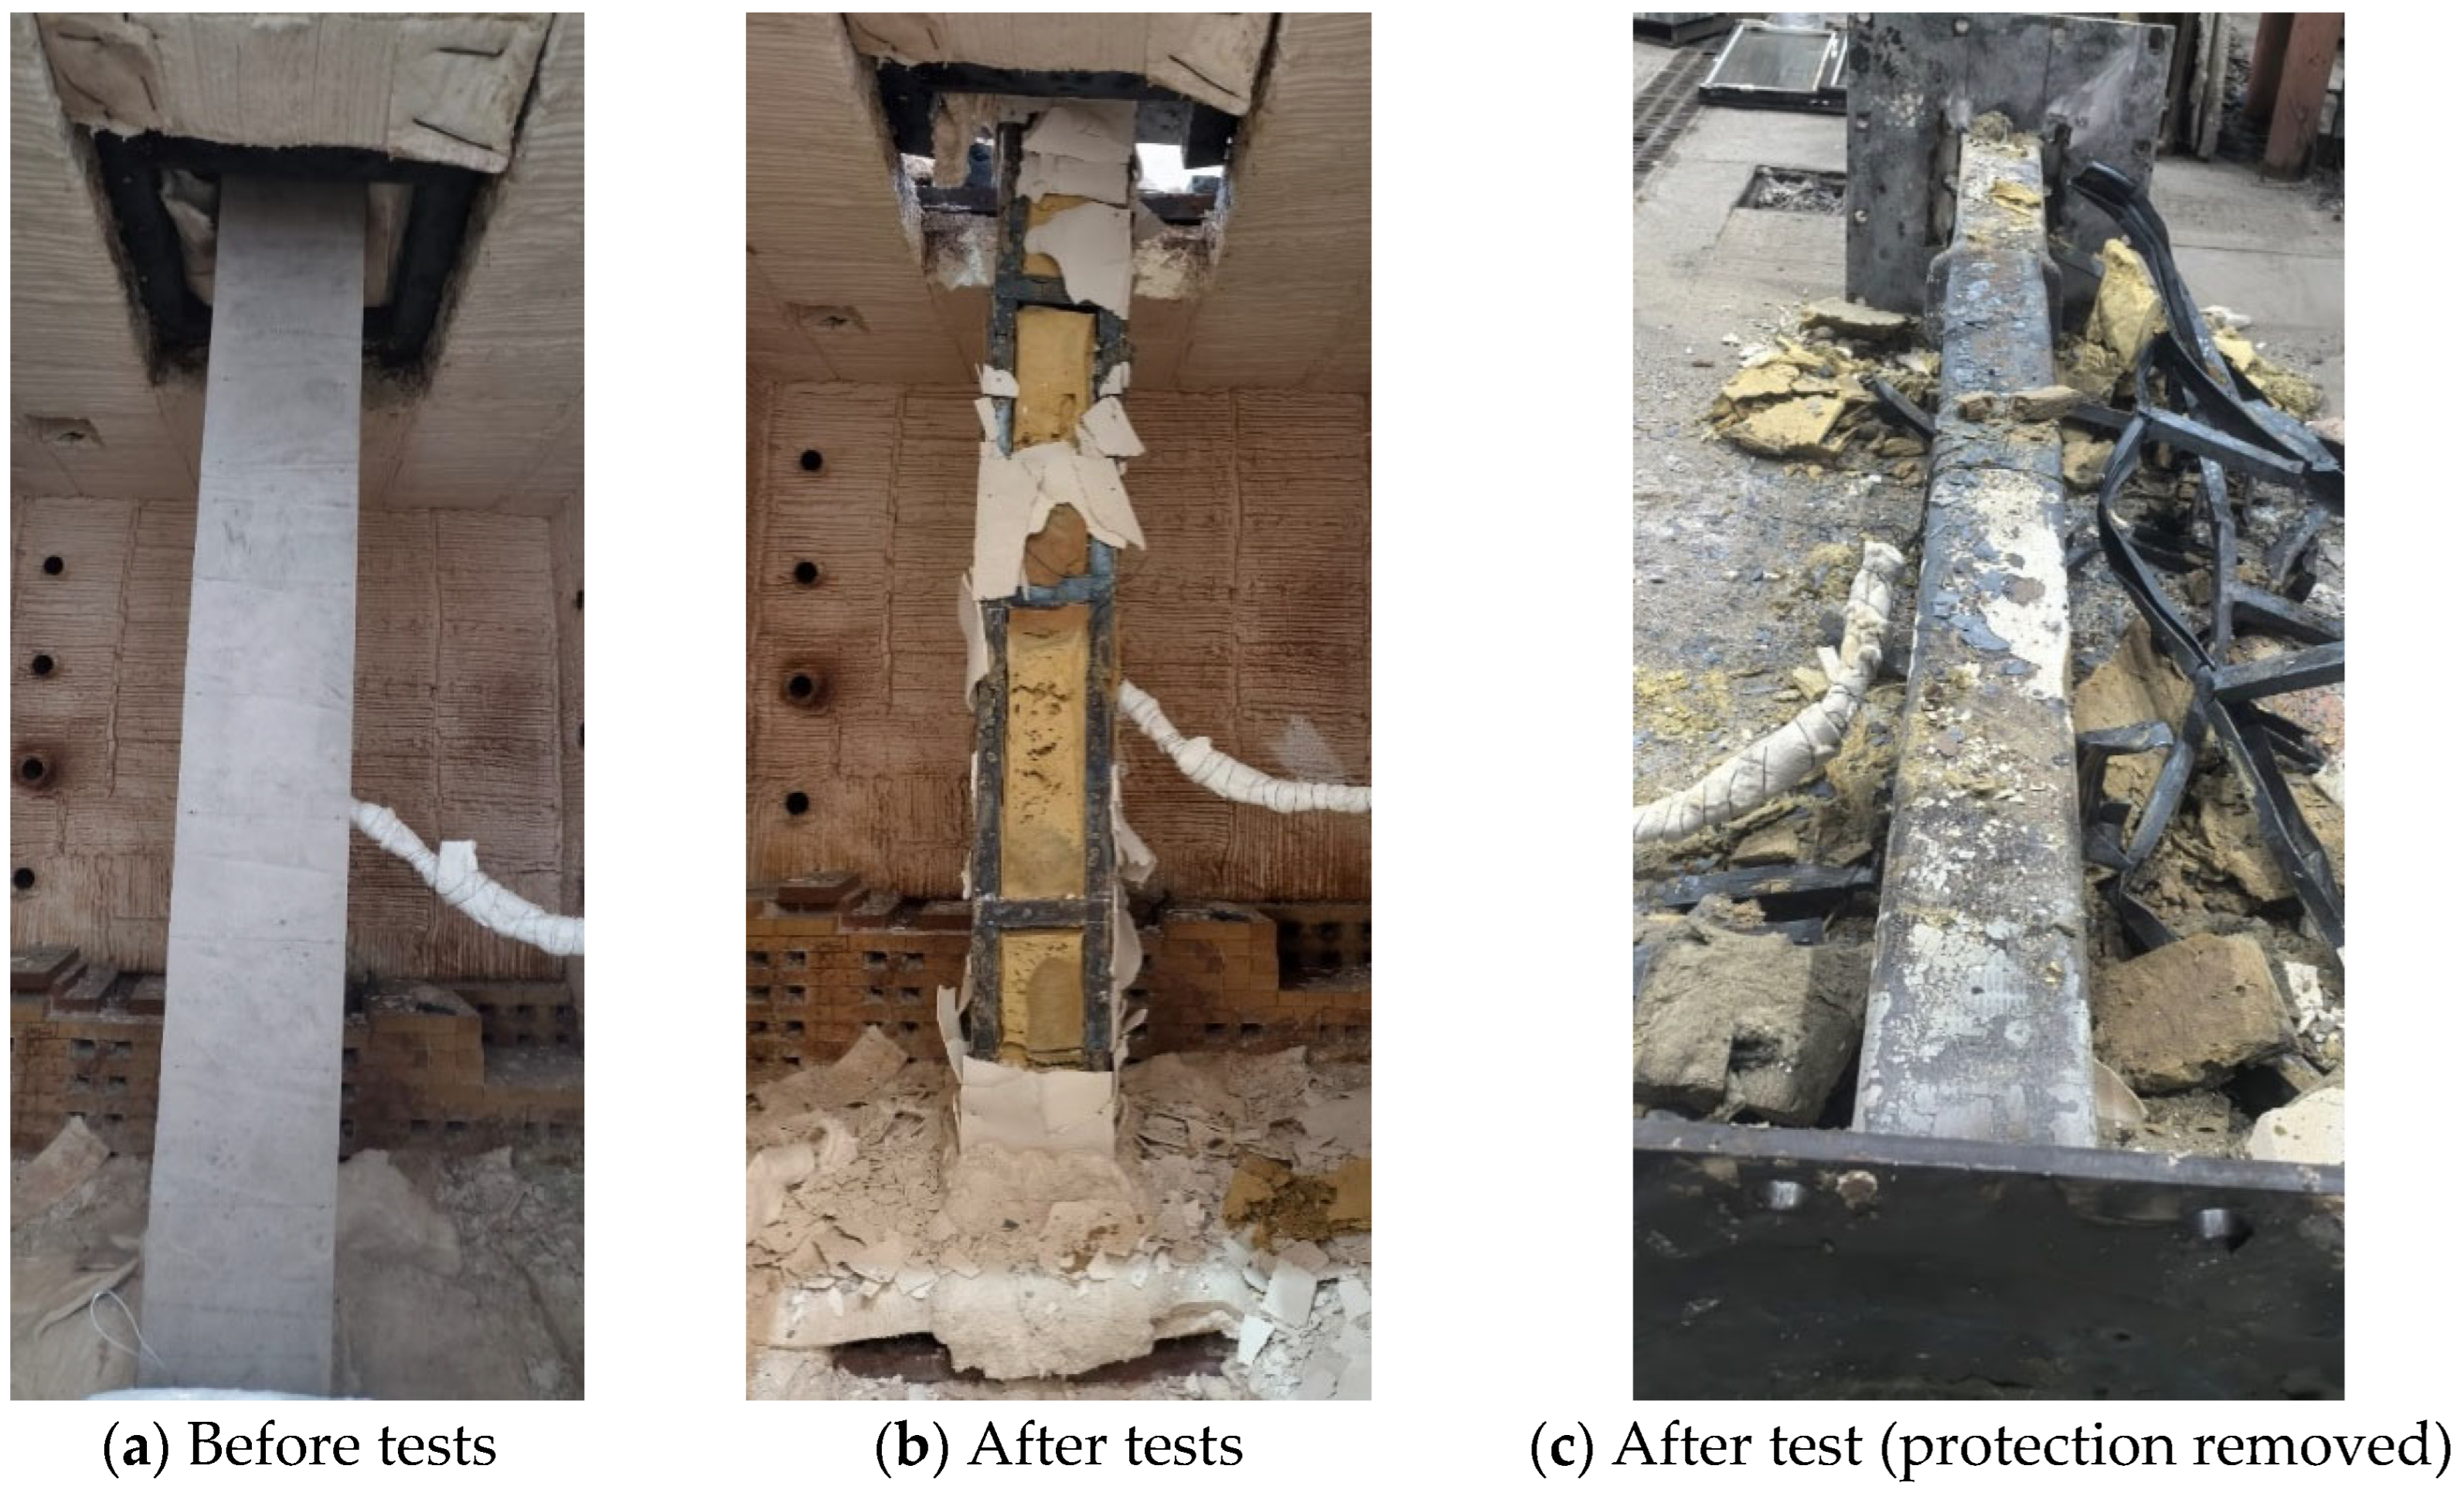
Specimen BM2, with a 75 mm rock wool layer slightly thicker than the 50 mm layer of specimen BM1, exhibited a fire resistance limit of 89 min. Similar to BM1, the failure mode of BM2 was global instability, characterized by symmetrical wrinkling on all four sides near the upper mid-span region due to this instability. Additionally, the light steel studs in the vicinity also exhibited instability. A comparison of BM2 before and after the test is shown in Figure 5. Post-test, the calcium silicate boards were found to be shattered and delaminated, with near-complete destruction and noticeable buckling deformation observed in the mid-span region. In contrast, the calcium silicate boards near the ends showed minimal deformation and retained their white color, as seen in Figure 5b. The rock wool exhibited significant shrinkage and hardening. Upon removing the surface protective layer of specimen BM2, as shown in Figure 5c, no visually observable deformation was found except for the wrinkling caused by global instability.
As shown in Figure 6, specimen BM3 featured an additional 5 mm layer of thin fire-resistant coating on the steel tube surface compared to specimen BM1. The fire resistance time was 110 min. The global instability phenomenon of the specimen, as well as the post-test conditions of the rock wool and calcium silicate boards, were similar to those observed in other specimens, as seen in Figure 6b. After removing the rock wool, steel studs, and calcium silicate boards, the thin fire-resistant coating was observed to exhibit signs of delamination (see Figure 6c).

3.2. Measurements

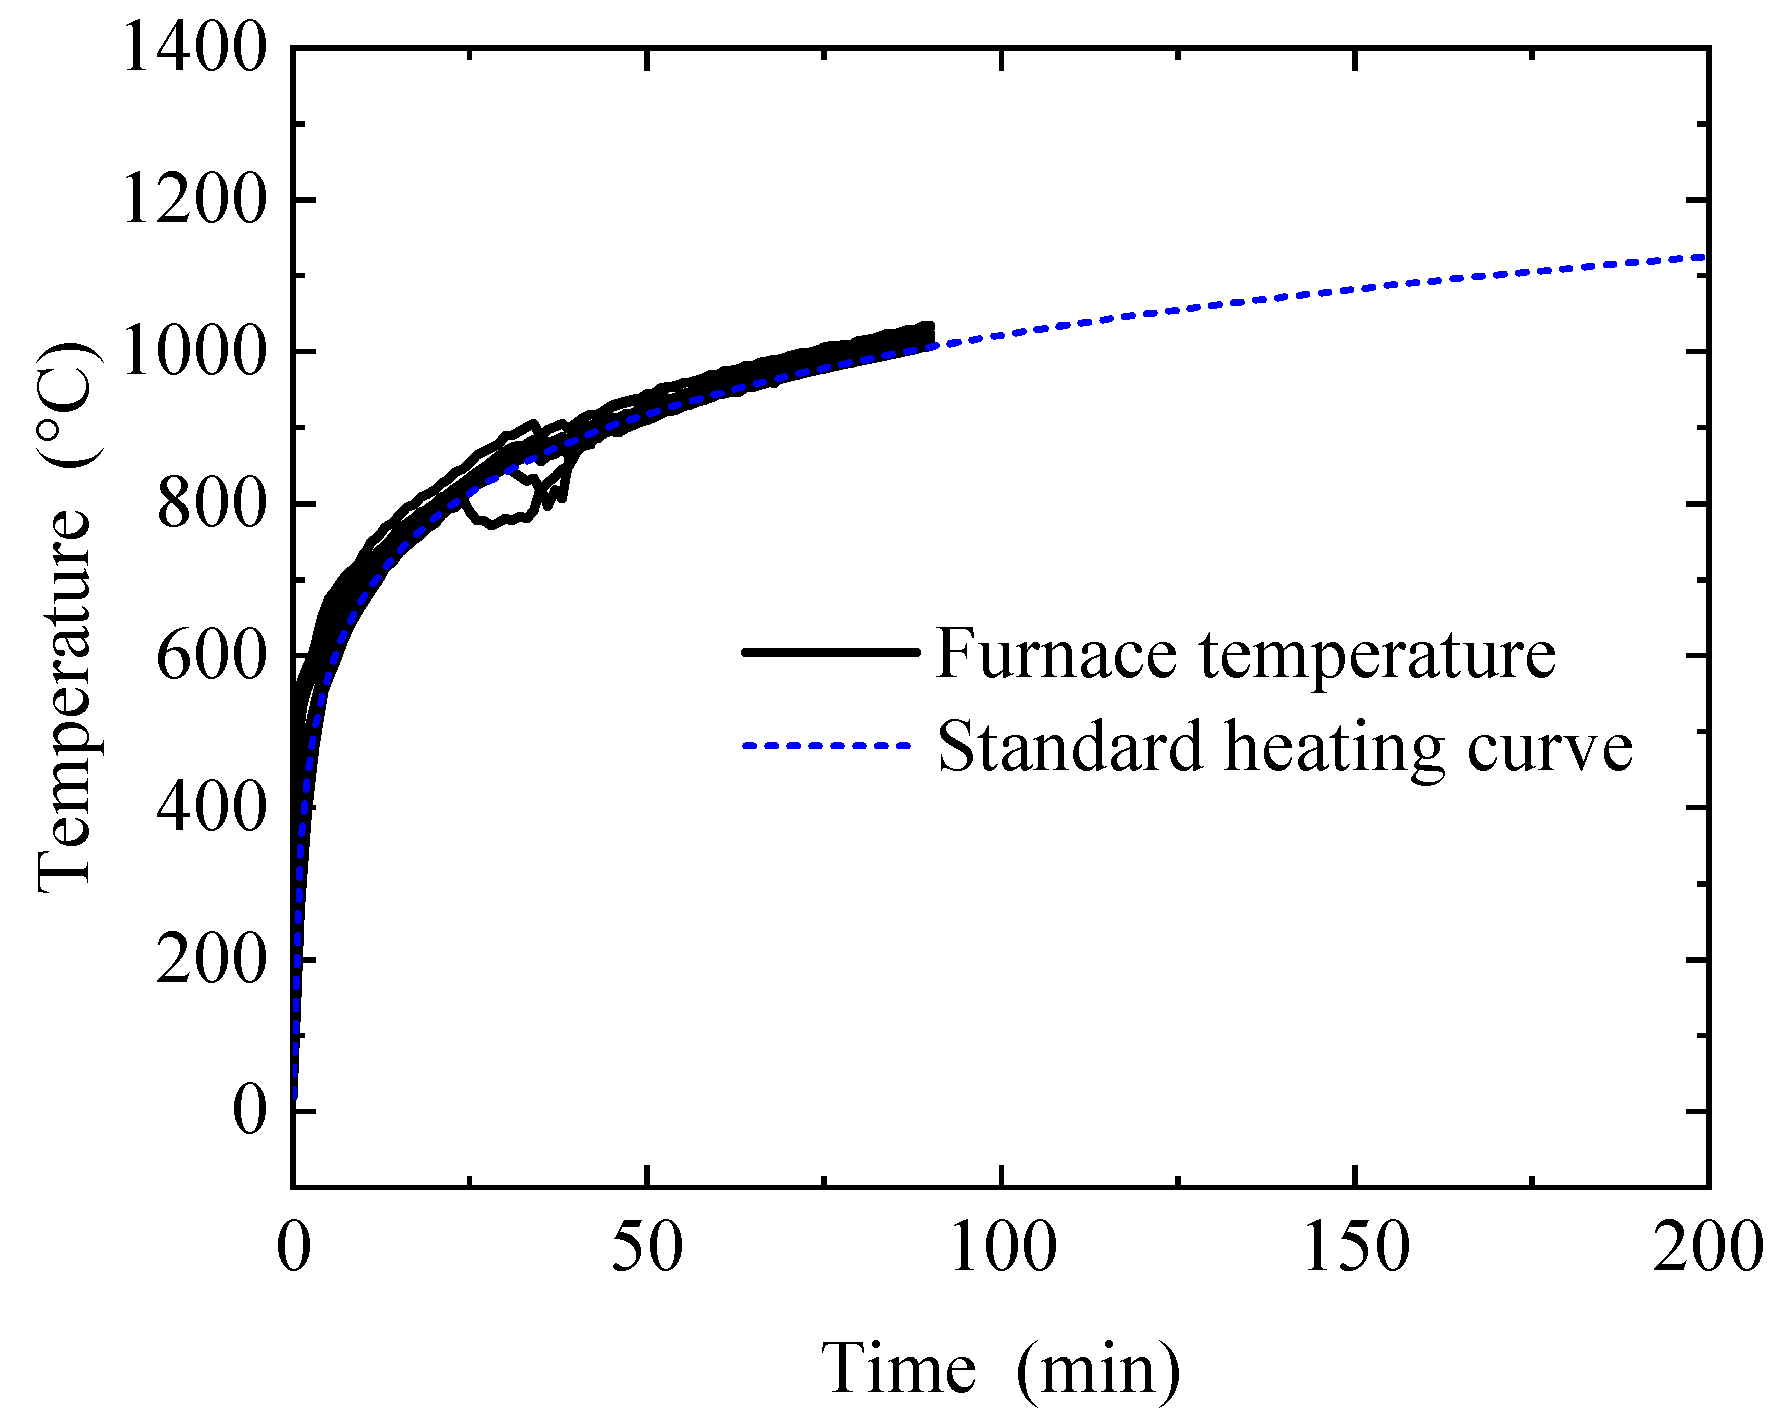
The comparison between the temperature field inside the fire resistance test furnace and the standard fire temperature curve is illustrated using the test data of specimen BM2, as shown in Figure 7. The temperature curve inside the test furnace aligns well with the standard fire temperature curve overall.
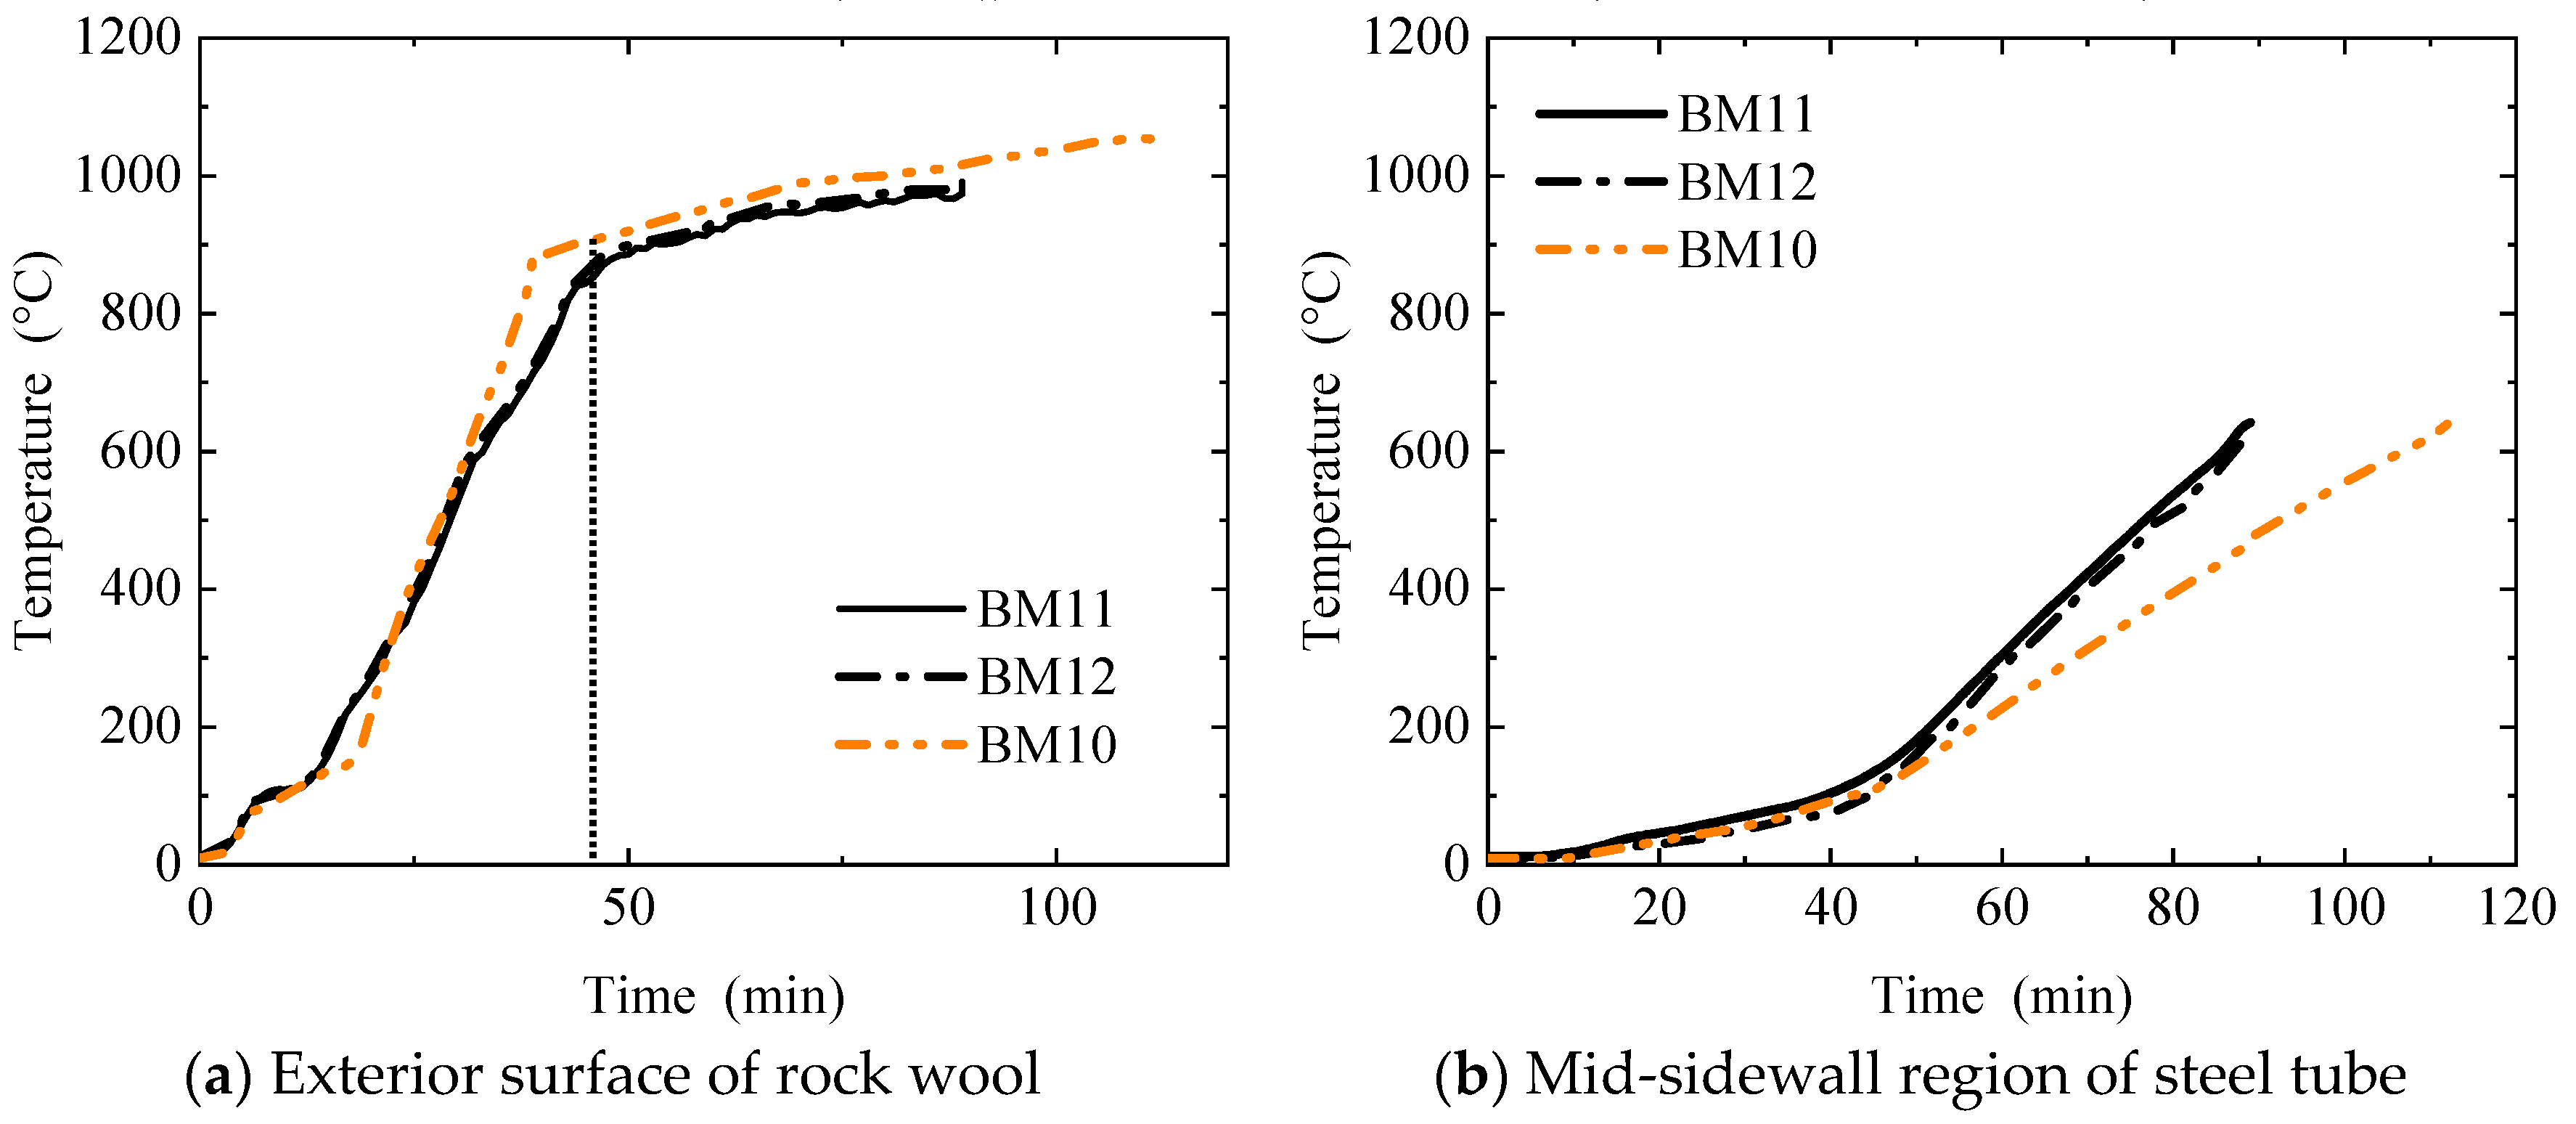
The temperature distribution at various points of the specimens is shown in Figure 8. For specimen BM1 (see Figure 8a), which has a fire resistance limit of 86 min, a comparison of the temperatures at the rock wool surface, steel tube corner, and mid-span of the steel tube is illustrated in the figure. As observed, when the fire resistance duration at the rock wool surface reached approximately 44 min, the fireproof board completely lost its insulation and fire resistance capabilities. Simultaneously, the temperature rise rate at the steel tube section exhibited an inflection point, indicating accelerated heating. Specimen BM2 (see Figure 8b), with a fire resistance limit of 88 min, showed minimal differences in the temperatures at the rock wool surface, steel tube corner, and mid-span compared to BM1.
For specimen BM3 (see Figure 8c), which has a fire resistance limit of 110 min, the temperature comparison at the rock wool surface, steel tube corner, and mid-span of the steel tube is also illustrated. Analysis reveals that when the fire resistance duration at the rock wool surface reached approximately 44 min, the fireproof board completely lost its insulation and fire resistance capabilities, and the temperature rise rate at the steel tube section exhibited an inflection point, indicating accelerated heating.
According to the comparison of the rock wool surface temperatures, the fire resistance performance of the fireproof boards in specimens BM1 and BM2 is similar, while that of BM3 is slightly weaker, although the difference is not significant.
Based on the comparison of mid-span temperature curves of the steel tube surface, there is no significant difference in the fire resistance capabilities of the rock wool in BM1 and BM2. This indicates that within the first 20 min, the rock wool had already begun to shrink, creating gaps, and increasing the thickness of the rock wool did not provide better insulation.
Comparing the curves of BM1 and BM3, it can be seen that after the fireproof board completely lost its insulation and fire resistance capabilities (i.e., after the inflection point in the curve), the heating rate of the steel tube surface in BM3, which was coated with fire-resistant paint, was significantly lower. This demonstrates that the fire-resistant paint effectively enhanced fire insulation. Combined with the test phenomena from the previous chapter, the continuous coating of fire-resistant paint on the steel tube blocked the gaps exposed due to rock wool shrinkage, preventing direct contact between the steel column and flames or high-temperature air, thereby significantly improving the fire resistance duration of the steel column.
A comparison of the rock wool surface temperatures across the specimens is shown in Figure 9a. The curves generally align, and the inflection points are close, indicating the stable fire resistance performance of the calcium silicate boards. A comparison of the mid-span steel tube temperatures across the specimens is shown in Figure 9b. The temperature curves of specimens BM1 and BM2 are highly consistent, suggesting that changes in rock wool thickness did not significantly alter the heating rate of the steel tube. However, the fire-resistant coating on specimen BM3 noticeably reduced the heating rate of the steel tube.

3.3. Discussion

Since the specimens were connected with hemispherical hinge supports at both ends, approximating a pin-ended condition, and all specimens were subjected to the same loading, the load ratio was uniformly 0.544. Overall, specimen BM1 exhibited a fire resistance time of 86 min, BM2 exhibited a fire resistance time of 88 min, and BM3 exhibited a fire resistance time of 110 min.
BM2 had an additional 25 mm of rock wool thickness compared to BM1, yet the fire resistance time increased by only 2 min. This indicates that increasing the rock wool thickness did not significantly enhance the fire resistance time. The primary reason is that during the installation of the rock wool, the presence of light steel studs caused multiple discontinuities in the rock wool. When the rock wool shrank under high temperatures, significant gaps formed at these discontinuities. Rock wool of different thicknesses exhibited similar shrinkage times at the same high temperatures, resulting in similar heat transfer times through the gaps to the steel tube. Therefore, the fire resistance limits of specimens BM1 and BM2 were similar. BM3, on the other hand, had an additional 5.86 mm layer of intumescent fire-resistant coating compared to BM1, resulting in a 25 min increase in fire resistance time. The main reason is that the coating provided complete encapsulation of the steel column. When the rock wool significantly shrank and gaps appeared, the coating blocked the heat, preventing it from directly transferring to the steel tube.

4. Finite Element Simulation and Verification

4.1. Thermal Parameters

The materials used for the specimens include steel, thin-film fire-resistant coating, rock wool, and calcium silicate board. When performing finite element analysis using ABAQUS 2017, the thermal parameters of these materials are essential. The thermal conductivity, k s , specific heat, c s , and bulk density, ρ s , of steel [26] are as follows:
k s = 0.022 T + 48 0   ° C T 900   ° C 28.2 T > 900   ° C
ρ s c s = ( 0.004 T + 3.3 ) × 10 6 0   ° C T 650   ° C ( 0.068 T 38.3 ) × 10 6 650   ° C T 725   ° C ( 0.086 T + 73.35 ) × 10 6 725   ° C T 800   ° C 4.55 × 10 6 T > 800   ° C
In the equation, T represents temperature in units of °C, k s represents thermal conductivity in units of W / ( m ° C ) , and c s represents specific heat in units of J / ( kg ° C ) . The stress ( σ s )–strain ( ε s ) model for steel is based on the stress–strain model proposed by Lie [27]. The calculated temperature–time values exhibit a close agreement with the experimental data, and thus, the model is employed as follows:
σ s = f ( T , 0.001 ) 0.001 ε s ε s ε p f ( T , 0.001 ) 0.001 ε p + f [ T , ( ε s ε p + 0.001 ) ] f ( T , 0.001 ) ε s > ε p
where ε p = 4 × 10 6 f y , f ( T , 0.001 ) = ( 345 0.276 T ) × { 1 exp [ ( 30 + 0.03 T ) 0.001 ] }   f [ T , ( ε s ε p + 0.001 ) ] = { 1 exp [ ( 30 + 0.03 T ) ε s ε p + 0.001 ] } × ( 345 0.276 T )
Since the rock wool supplier failed to provide the thermal conductivity of rock wool, the thermal conductivity of rock wool is referenced from the data for rock wool with a bulk density of 100 kg/m3 in the standard GB/T11835-2016 [28] as follows:
k r = 0.0337 + 0.000151 t ( 20 t 100 ) 0.0395 + 4.71 × 10 5 t + 5.03 × 10 7 t 2 ( 100 < t 600 )
The specific heat of rock wool, c r , is derived from test data provided by the supplier, with a value of 900 J / ( kg ° C ) . Finally, the thermal parameters of rock wool are listed in Table 2.
The thermal parameters of calcium silicate board are referenced from the experimental results of Fan Guangming et al. [29], where the density, ρ c , is 1050 kg/m3; the thermal conductivity, k c , specific heat, c c , and other thermal parameters are listed in Table 3.
The thermal parameters of thin-film fire-resistant coating are listed in Table 4, with a density, ρ t , of 1200 kg/m3, a thermal conductivity, k t , of 0.5 W/(m·K), and a specific heat, c t , of 1100 J/(kg·K).
Notably, the primary function of the protective layer is to provide thermal insulation rather than to bear the loads in place of the steel column. Moreover, the mechanical properties of the protective layer are far inferior to those of the steel column, and its influence on the temperature field can be neglected. To simplify the analysis, in this paper, all protective layers are assumed to be ideal isotropic elastoplastic materials. The elastic modulus and ultimate strain of these materials are both less than 0.001 times those of steel. Their mechanical properties do not vary with temperature and are significantly lower than those of steel.

4.2. Thermal Field Model

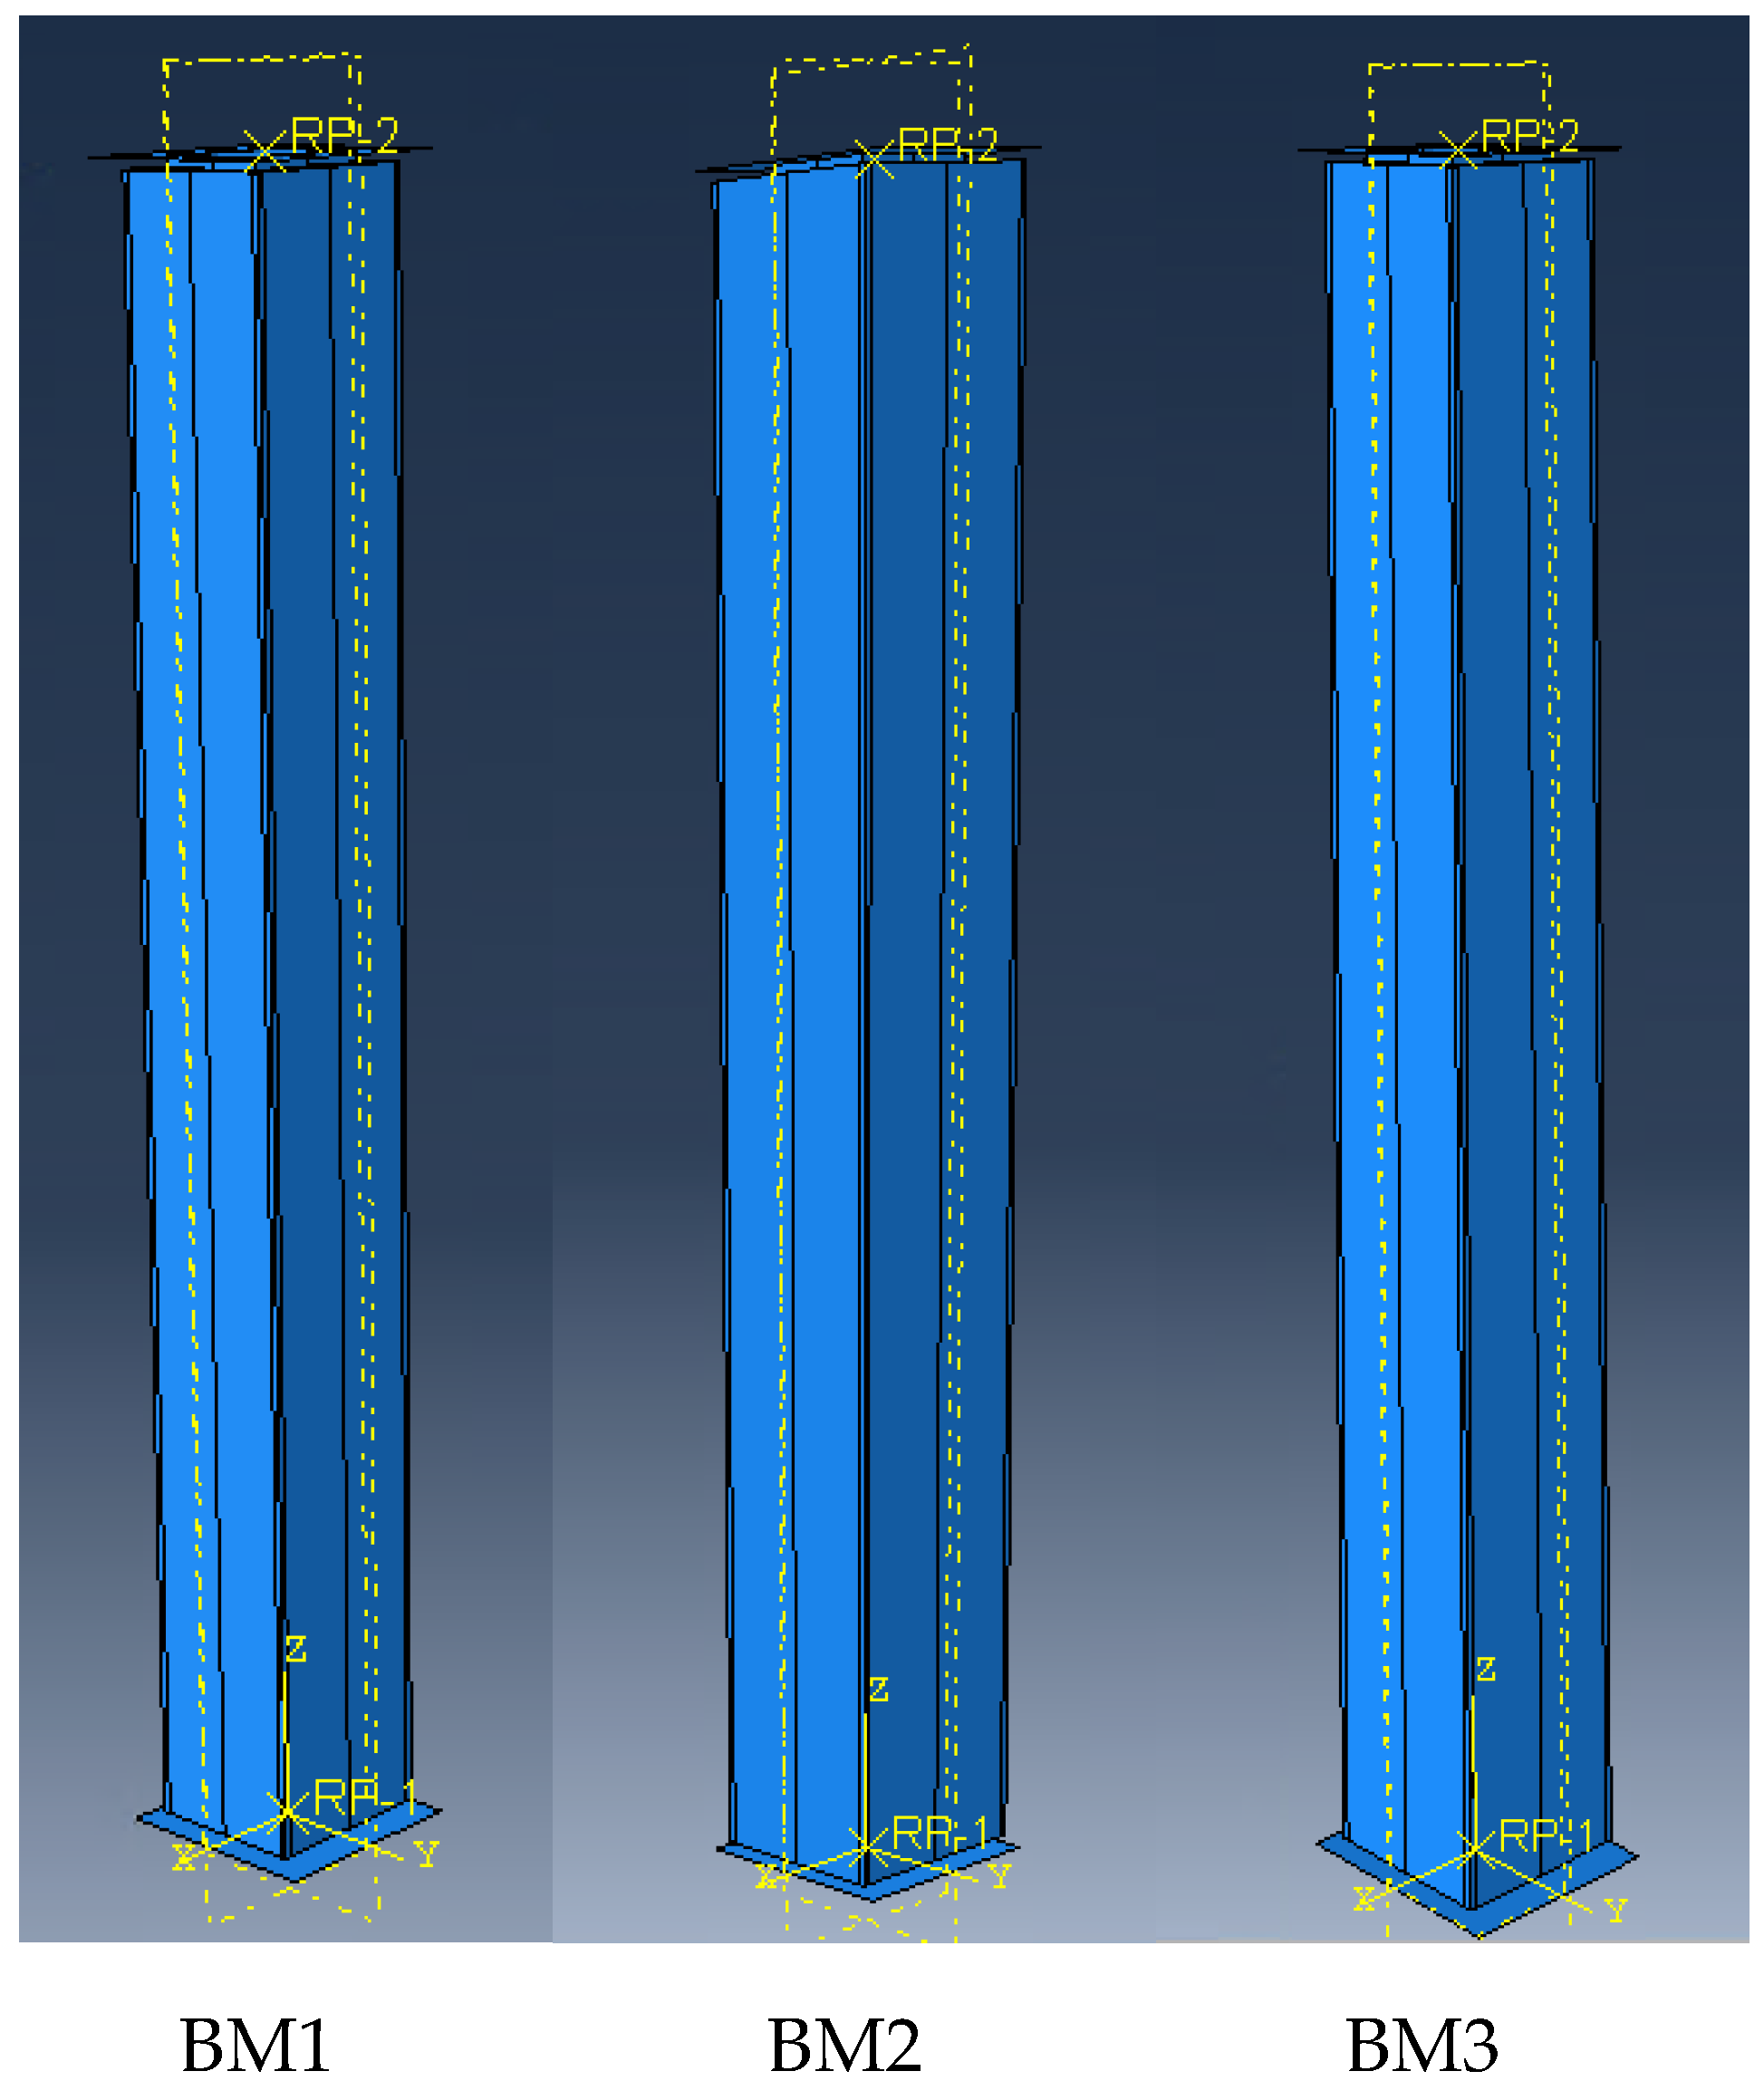
All materials of the steel column are modeled using the DC3D8 solid element. The temperature field analysis model is condensed into one analysis step, where the external temperature is defined using an amplitude curve and applied to the fire-exposed surface of the specimen. When simulating the results of the specimen, for the fire resistance limit test, the analysis time is set to the fire resistance limit duration. In this study, the influence of thermal resistance is ignored during the temperature field calculation. Therefore, in the finite element analysis model, “Tie” constraints are applied among the steel, coating, rock wool, and fireproof board. In the finite element analysis model, heat transfer between the specimen and the external environment occurs through heat conduction and heat convection. For the scenario involving fire exposure on all four sides, the temperature rise follows the ISO standard temperature curve. In the interaction module, surface heat radiation and surface heat convection are selected, and the pre-input ISO standard temperature curve is applied. For the surfaces exposed to fire on all four sides, the heat convection coefficient is set to 25 W/(m2·°C). The comprehensive radiation coefficient for the outer surface of the outermost fireproof board is set to 0.7 [29]. The models are shown in Figure 10.
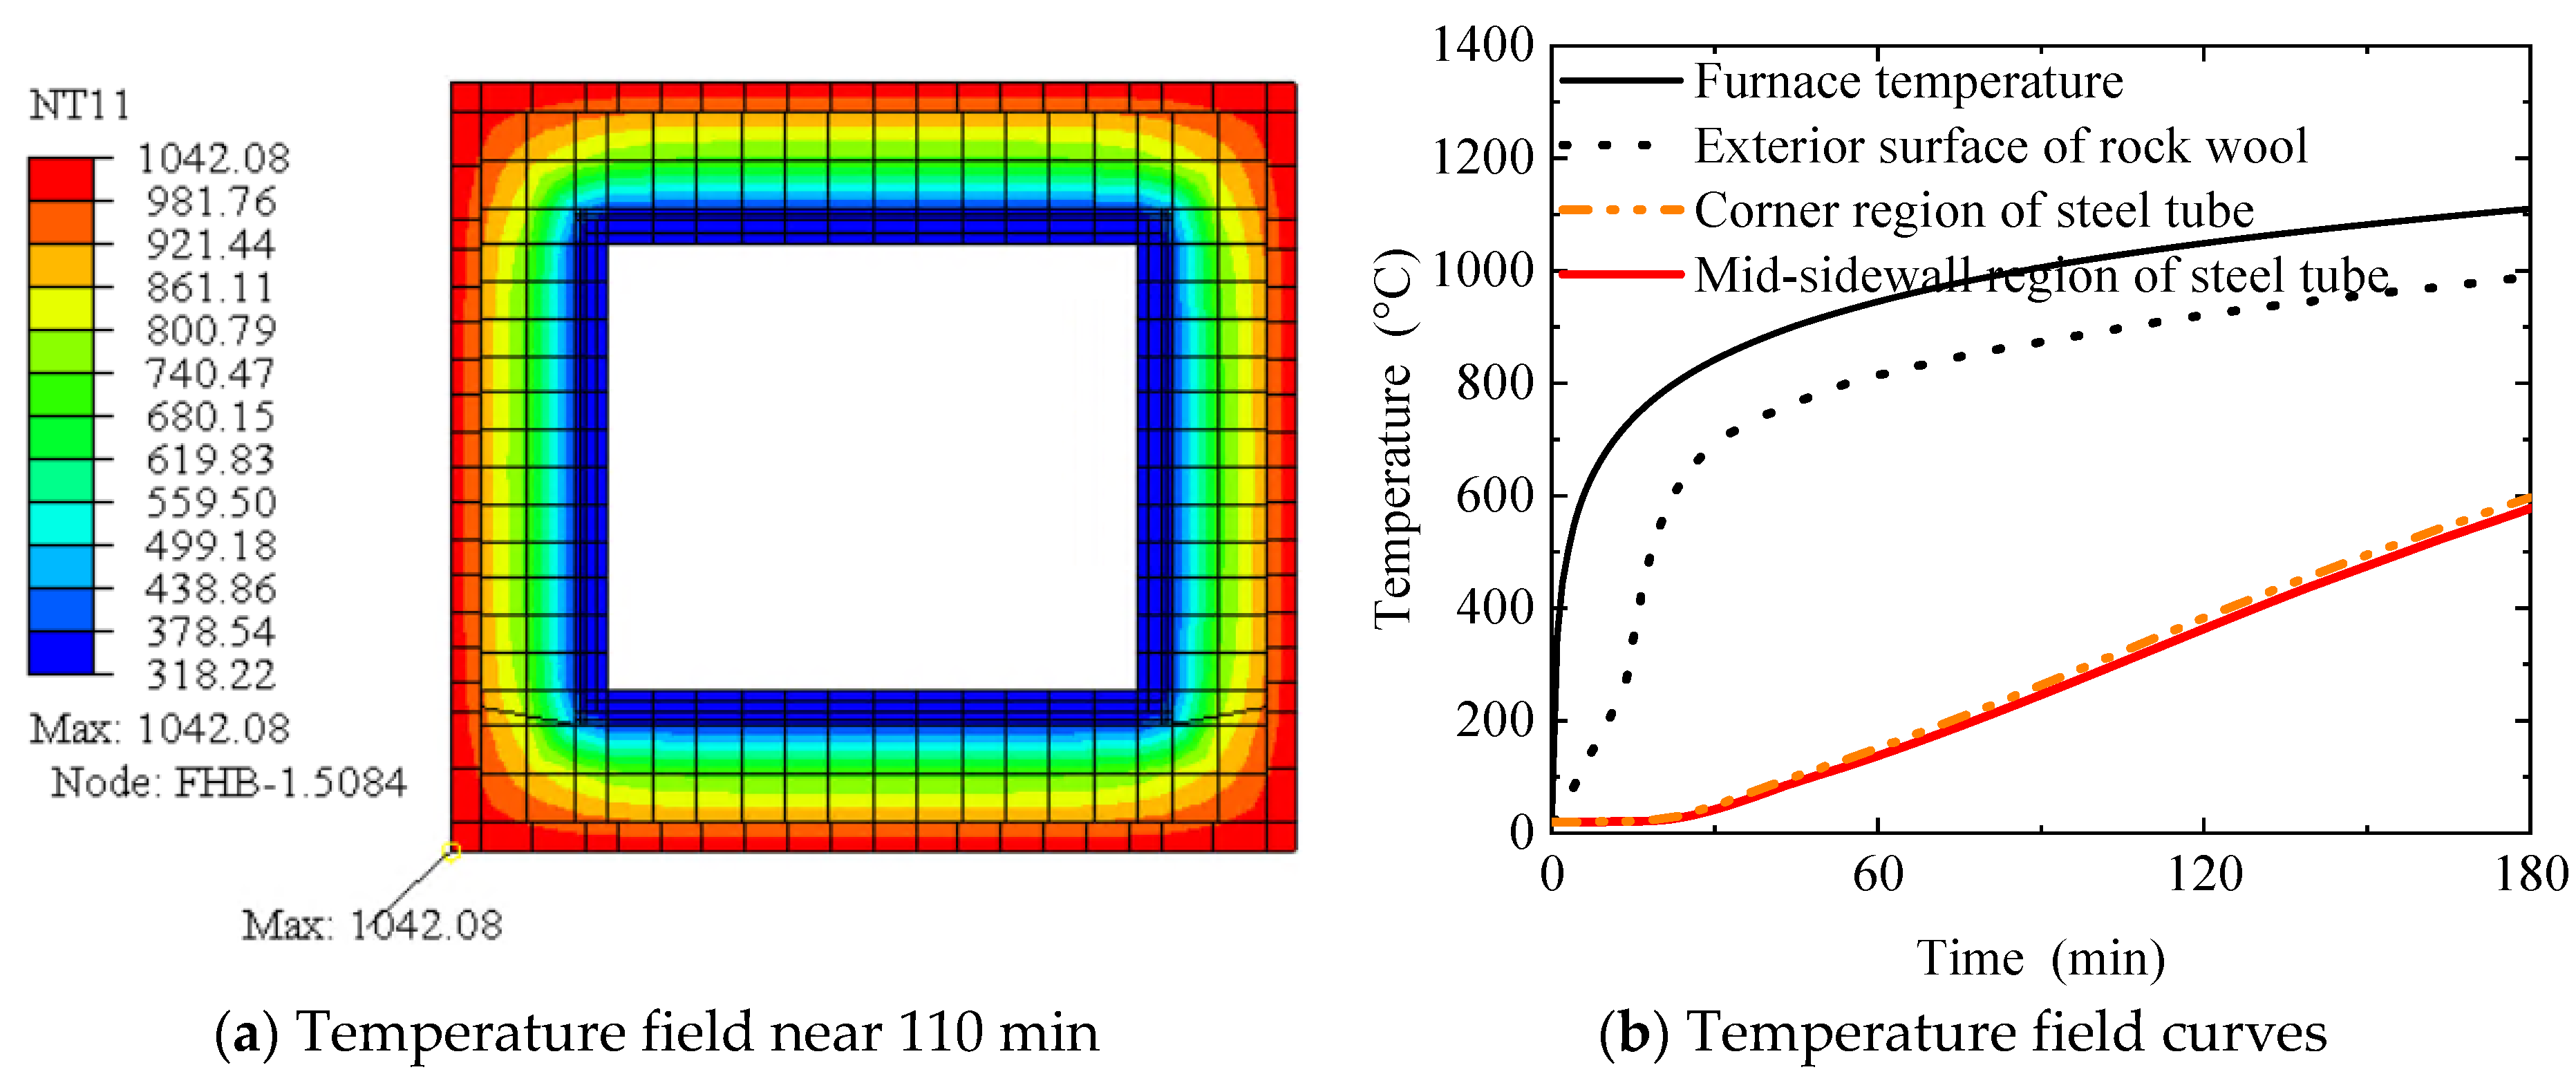
The temperature field contour plots and temperature field curves of the finite element model near the fire resistance limit time from tests are shown in Figure 11, Figure 12 and Figure 13.
As clearly shown in Figure 13, near the experimentally measured fire resistance limit, the temperatures of the steel column in the corresponding temperature field obtained from the finite element simulation range between 199 °C and 378 °C. This indicates that the finite element model has not yet reached the fire resistance limit of the steel column, resulting in a significant discrepancy between the simulation and test results. This discrepancy arises because the rock wool in the temperature field model is idealized as fully encapsulating the steel column, whereas in reality, the installation of rock wool involves numerous disconnected sections. Due to the obstruction of lightweight steel studs, the rock wool is forced to be cut into many small pieces, and wherever lightweight steel studs are present, the rock wool is discontinuous. Experimental observations reveal that the rock wool exhibits significant thermal shrinkage, which has not been considered in the finite element model. Consequently, the finite element simulation results deviate from the experimental findings.

4.3. Thermo-Mechanical Coupling Analysis

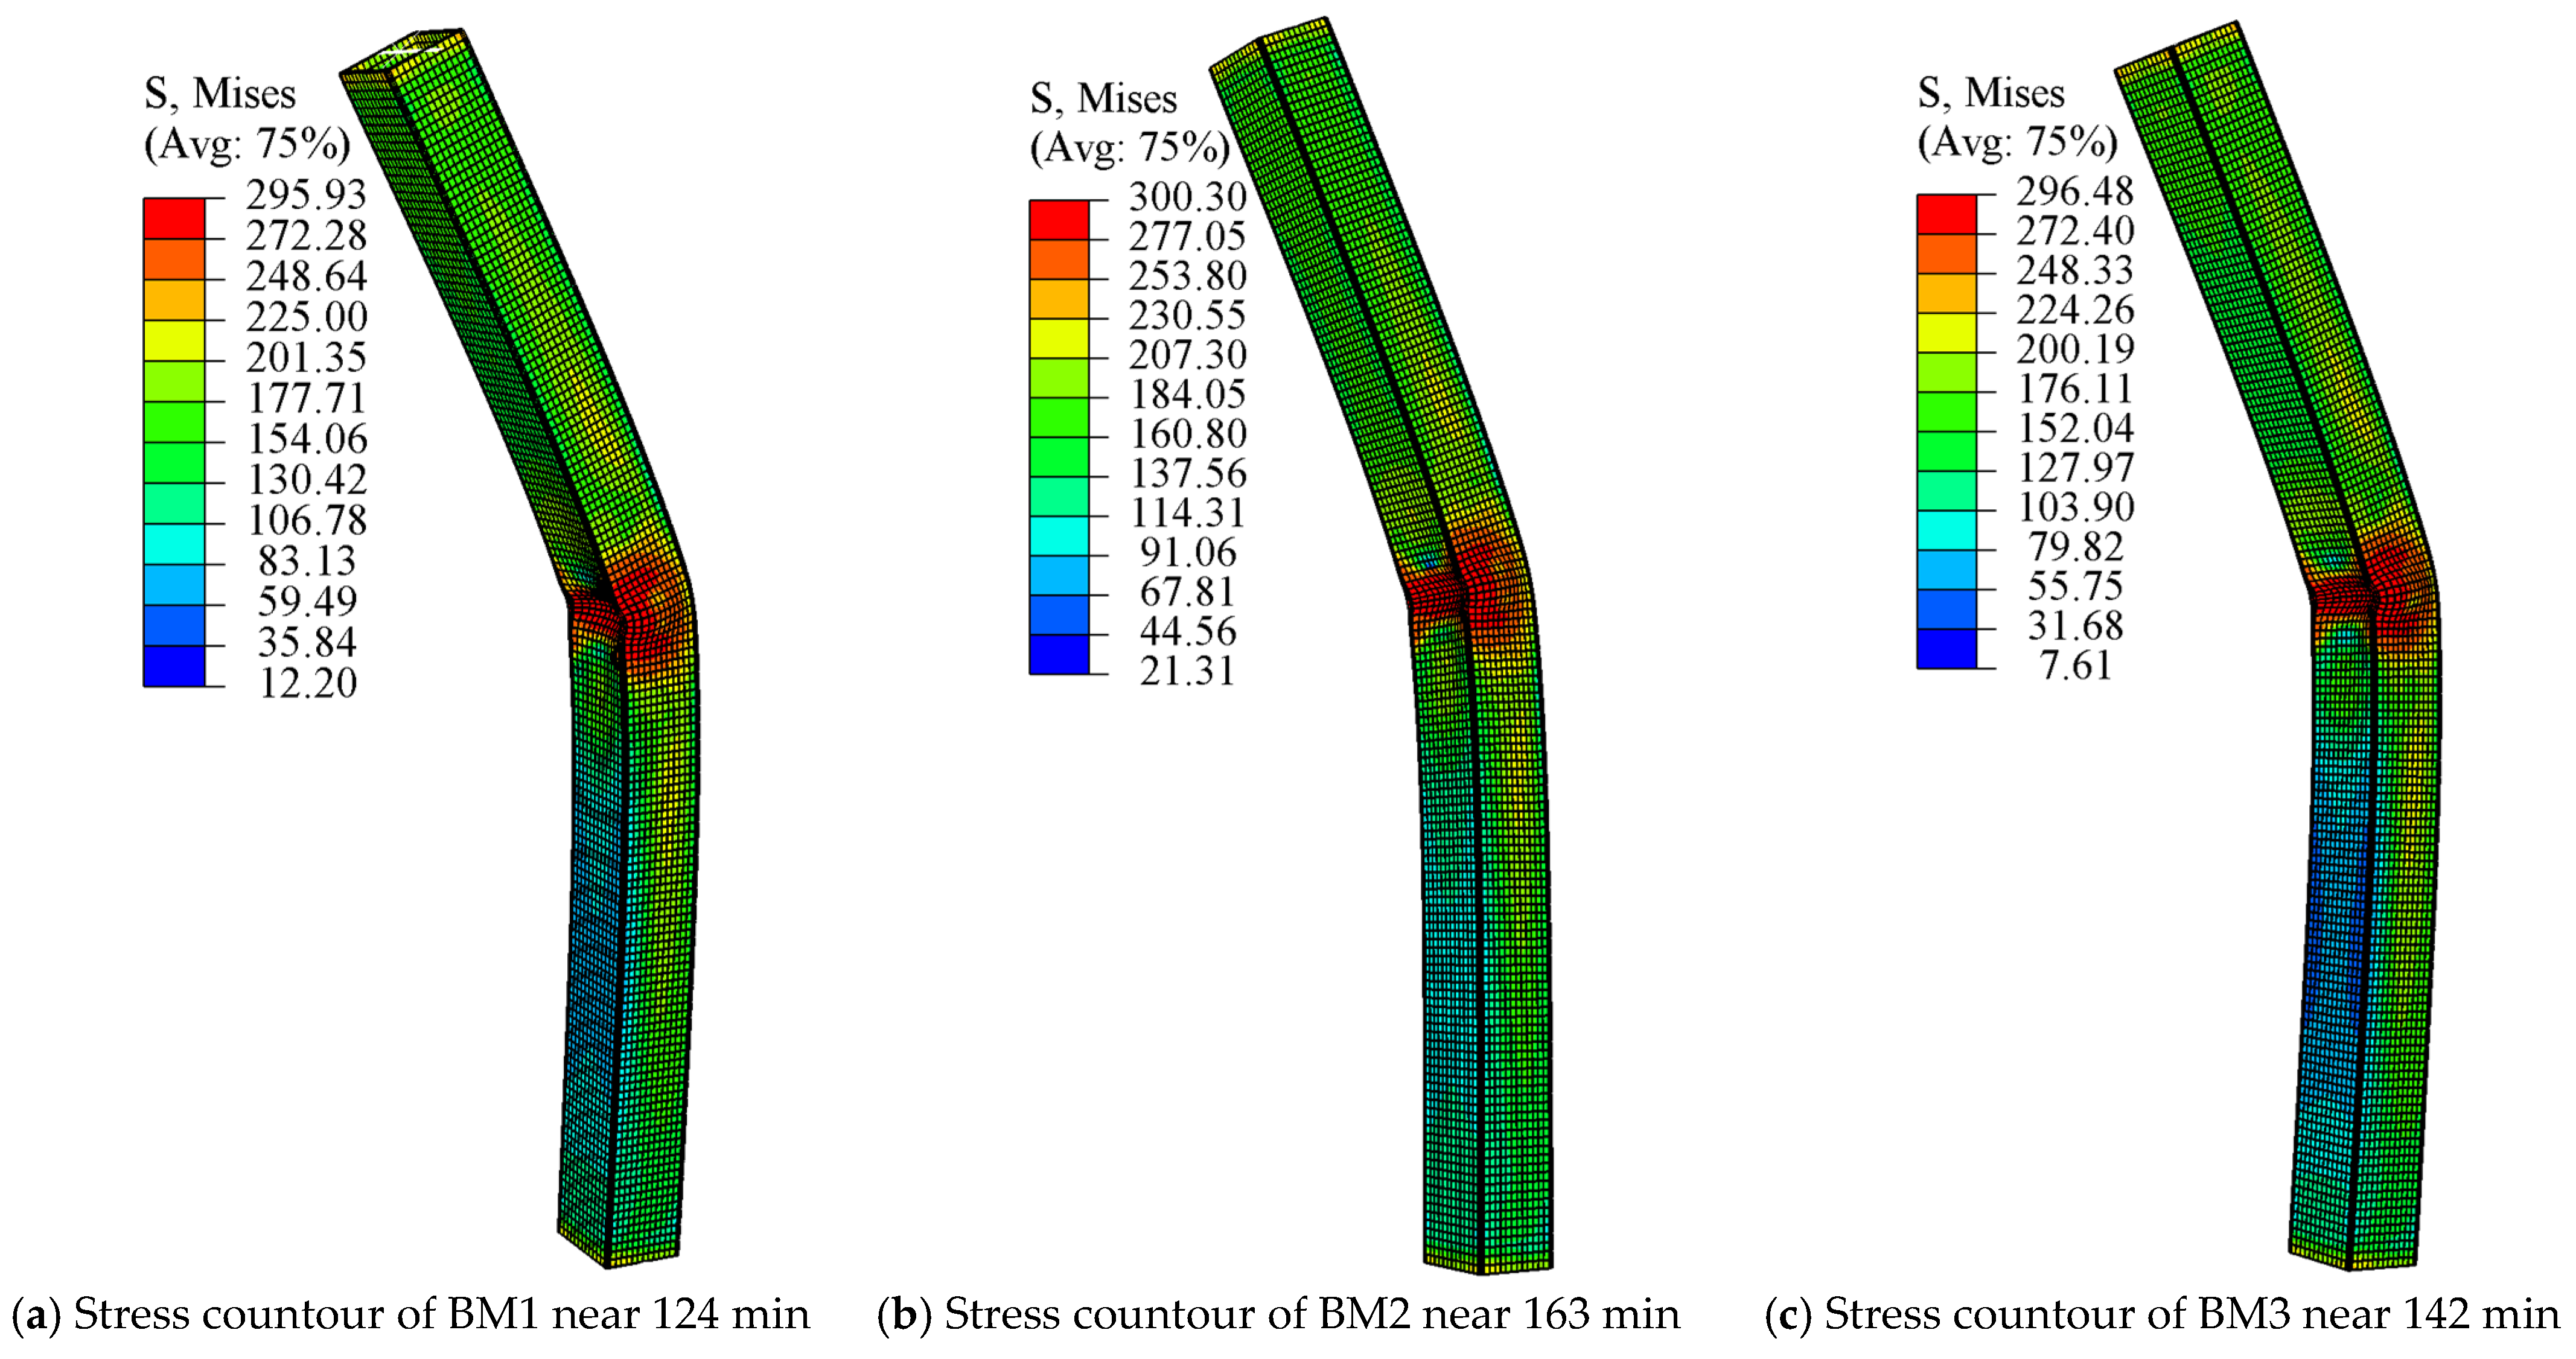
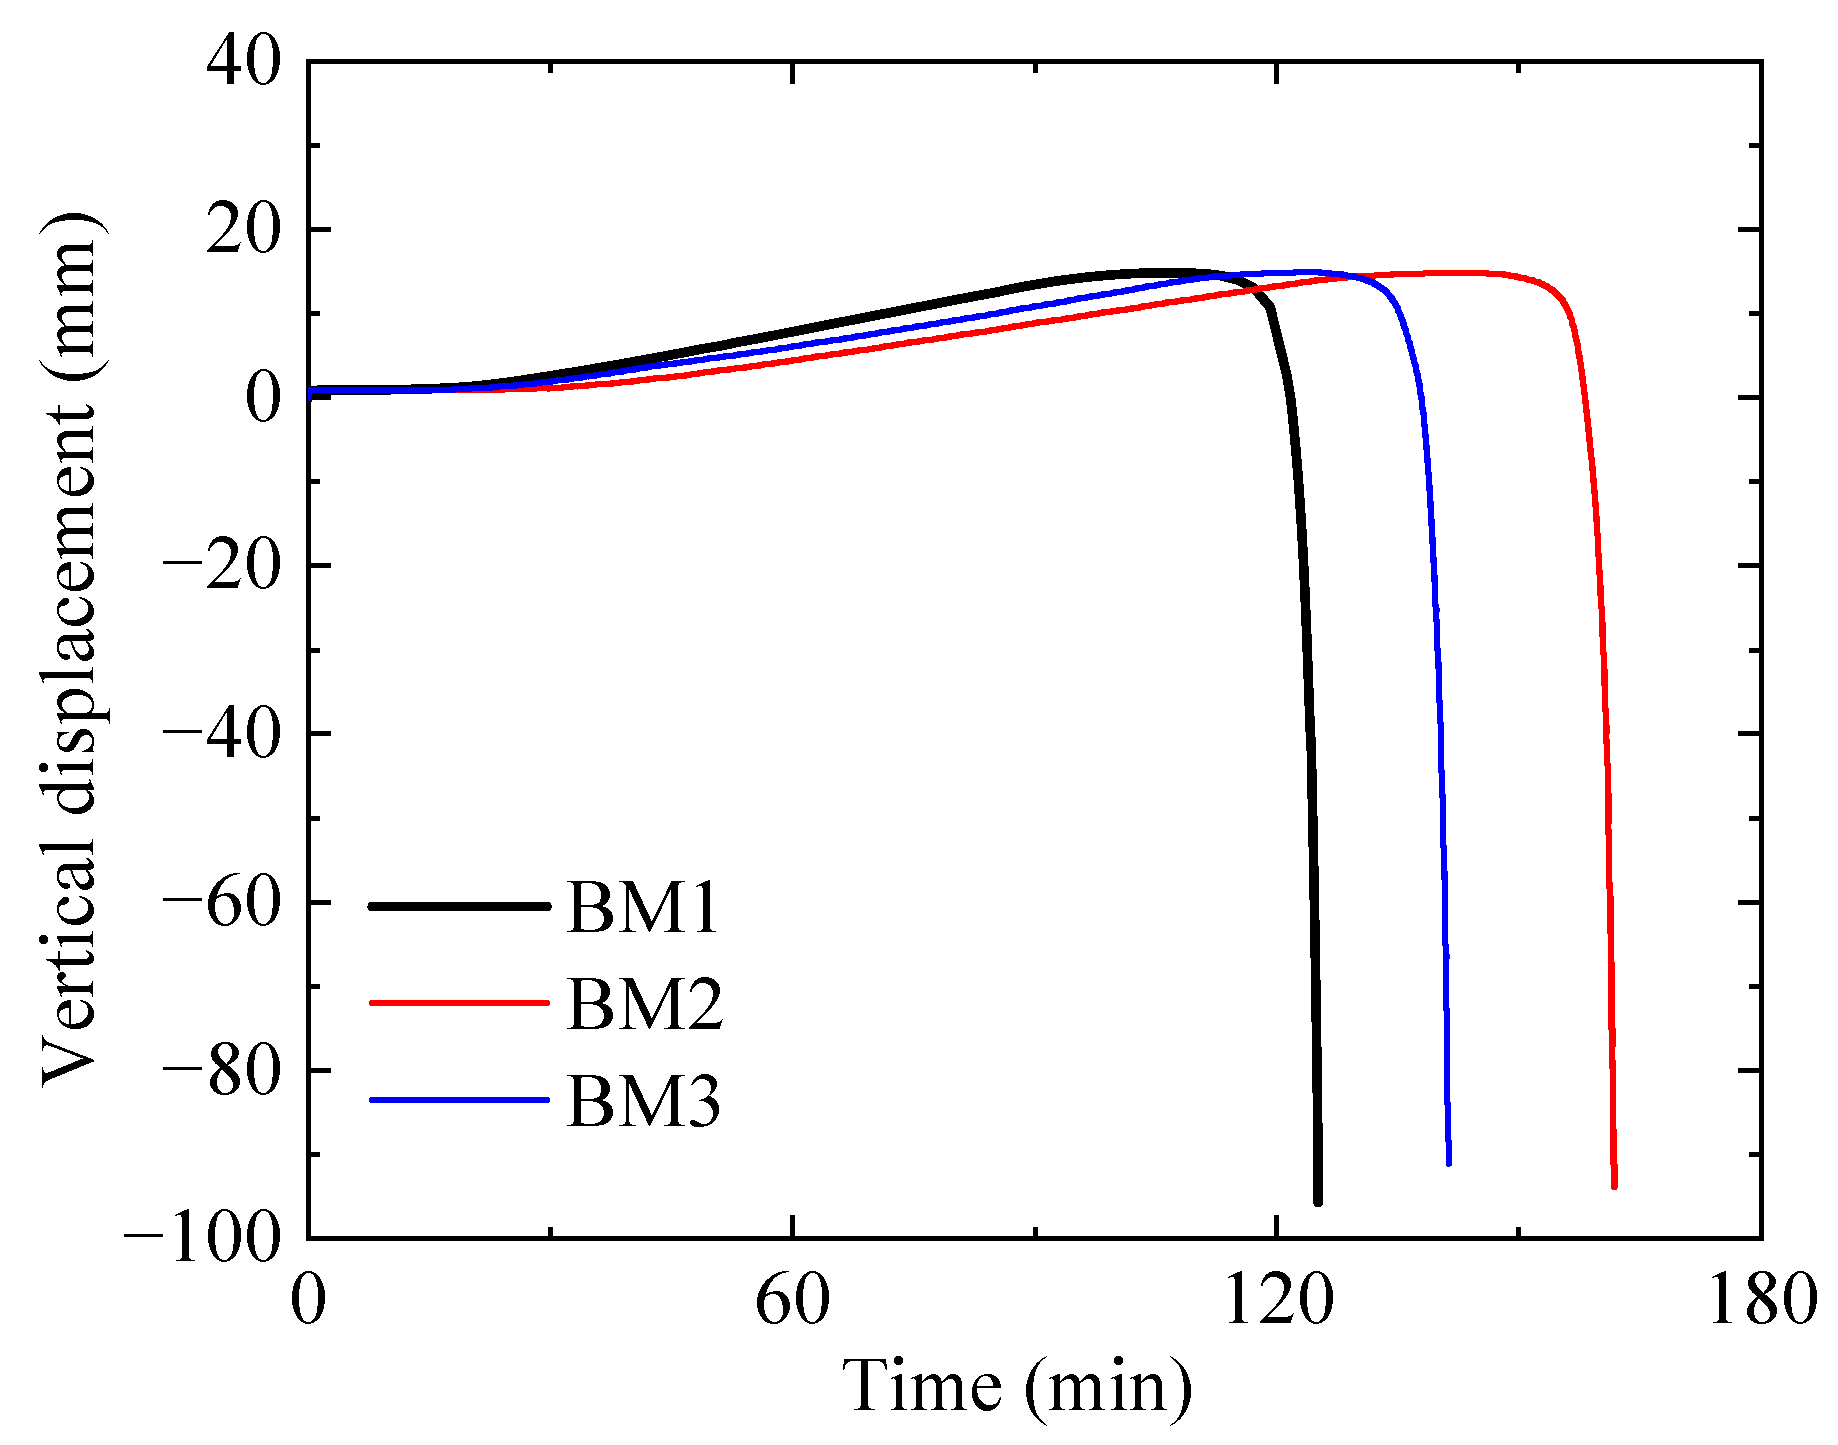
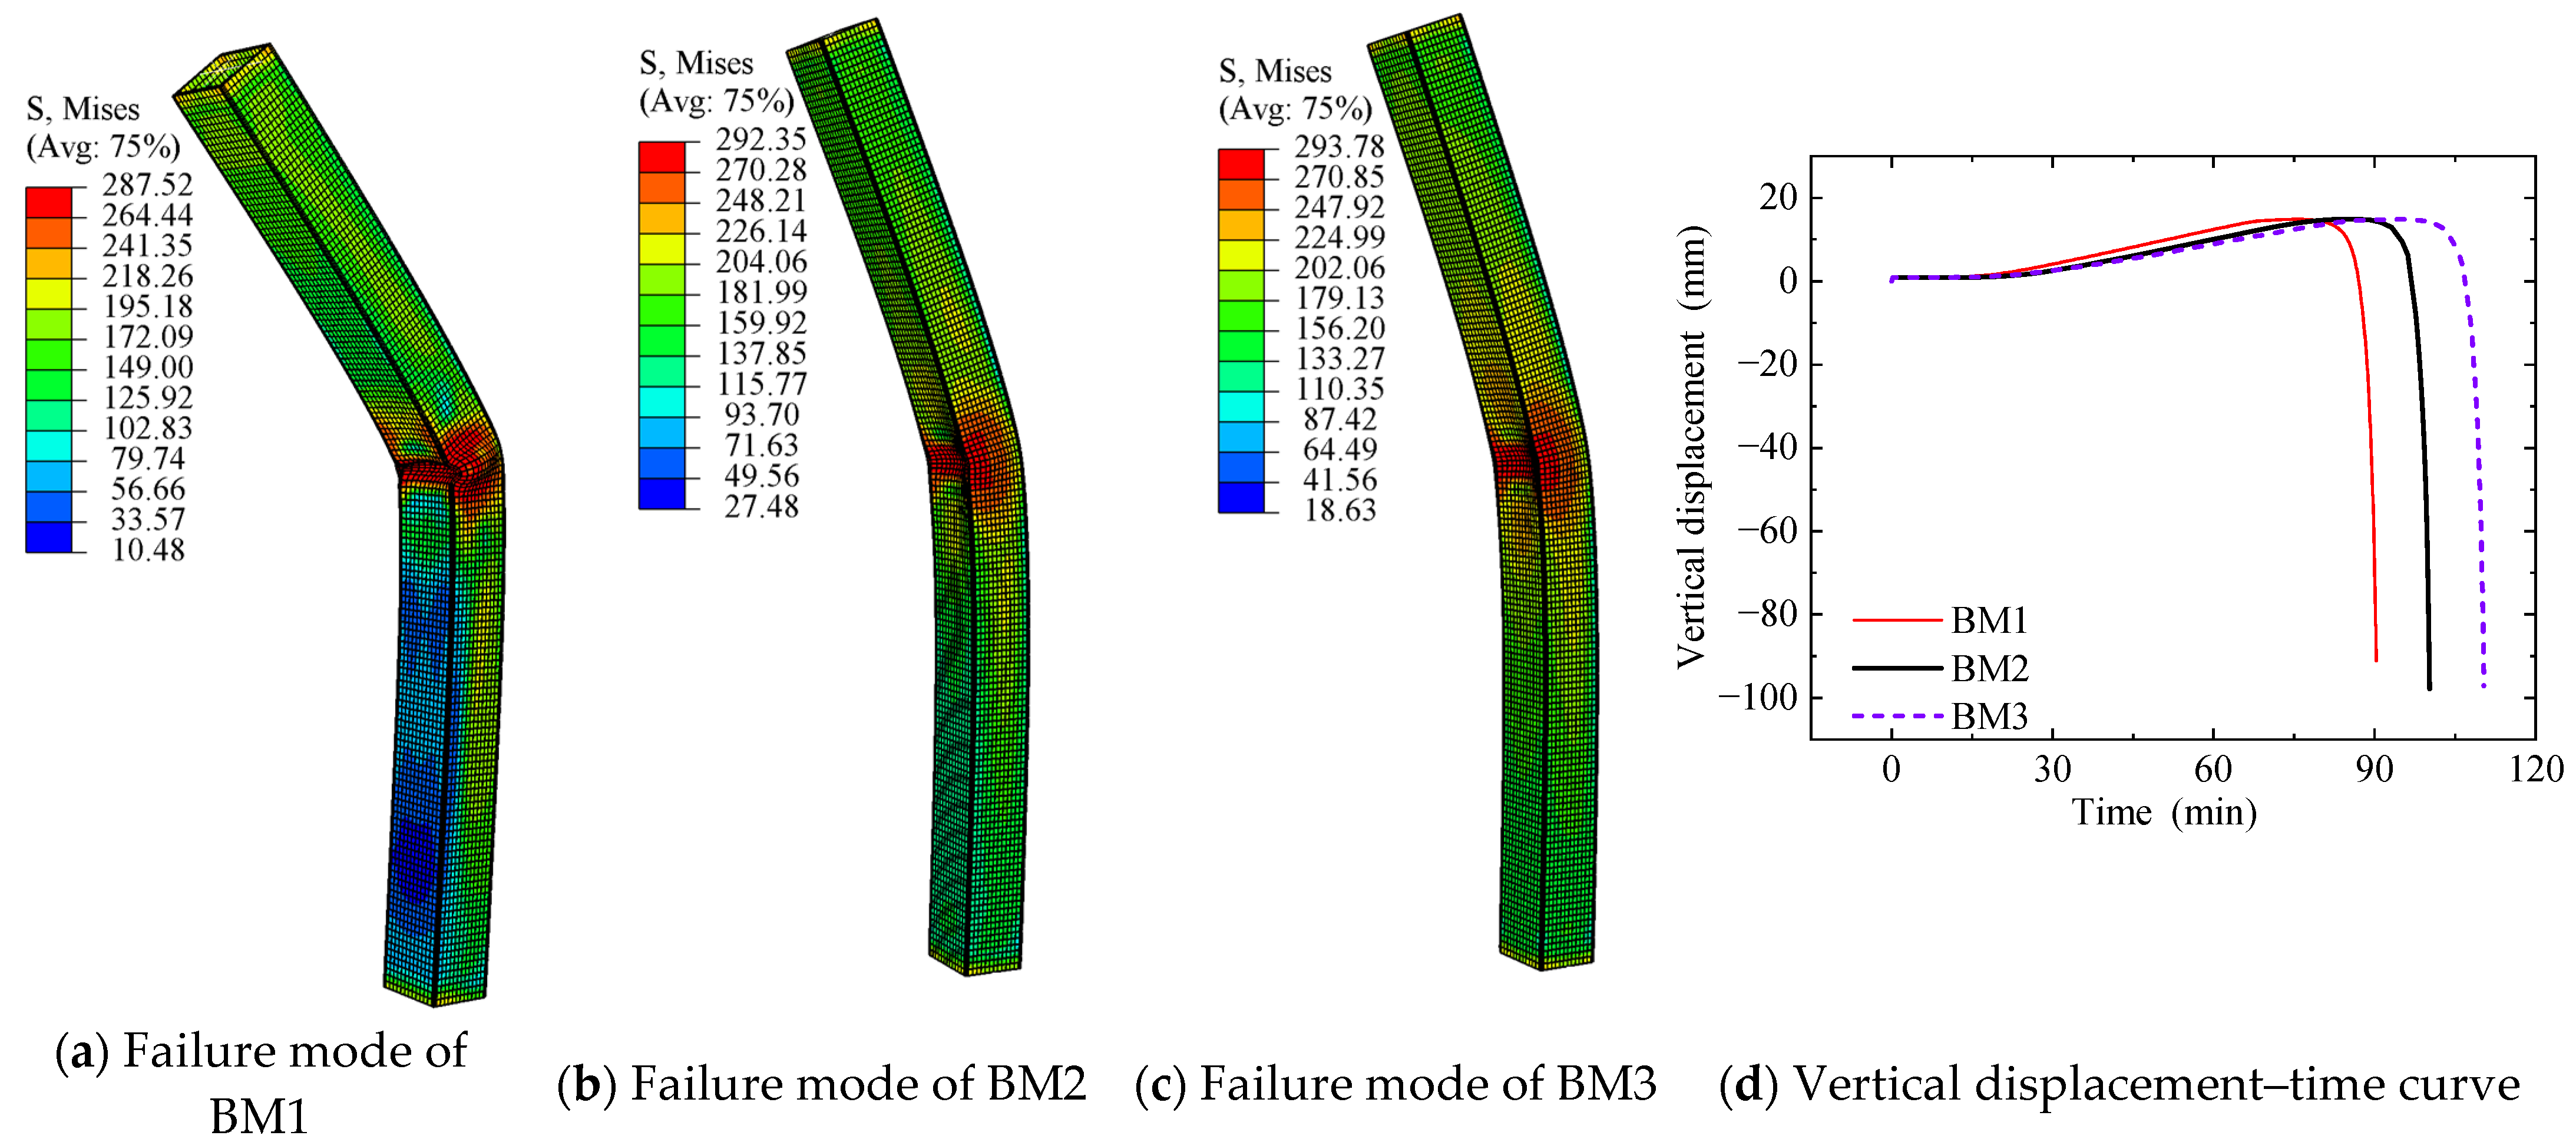
As shown in Figure 14 and Figure 15, the fire resistance times of models BM1, BM2, and BM3 are 124 min, 163 min, and 142 min, respectively.
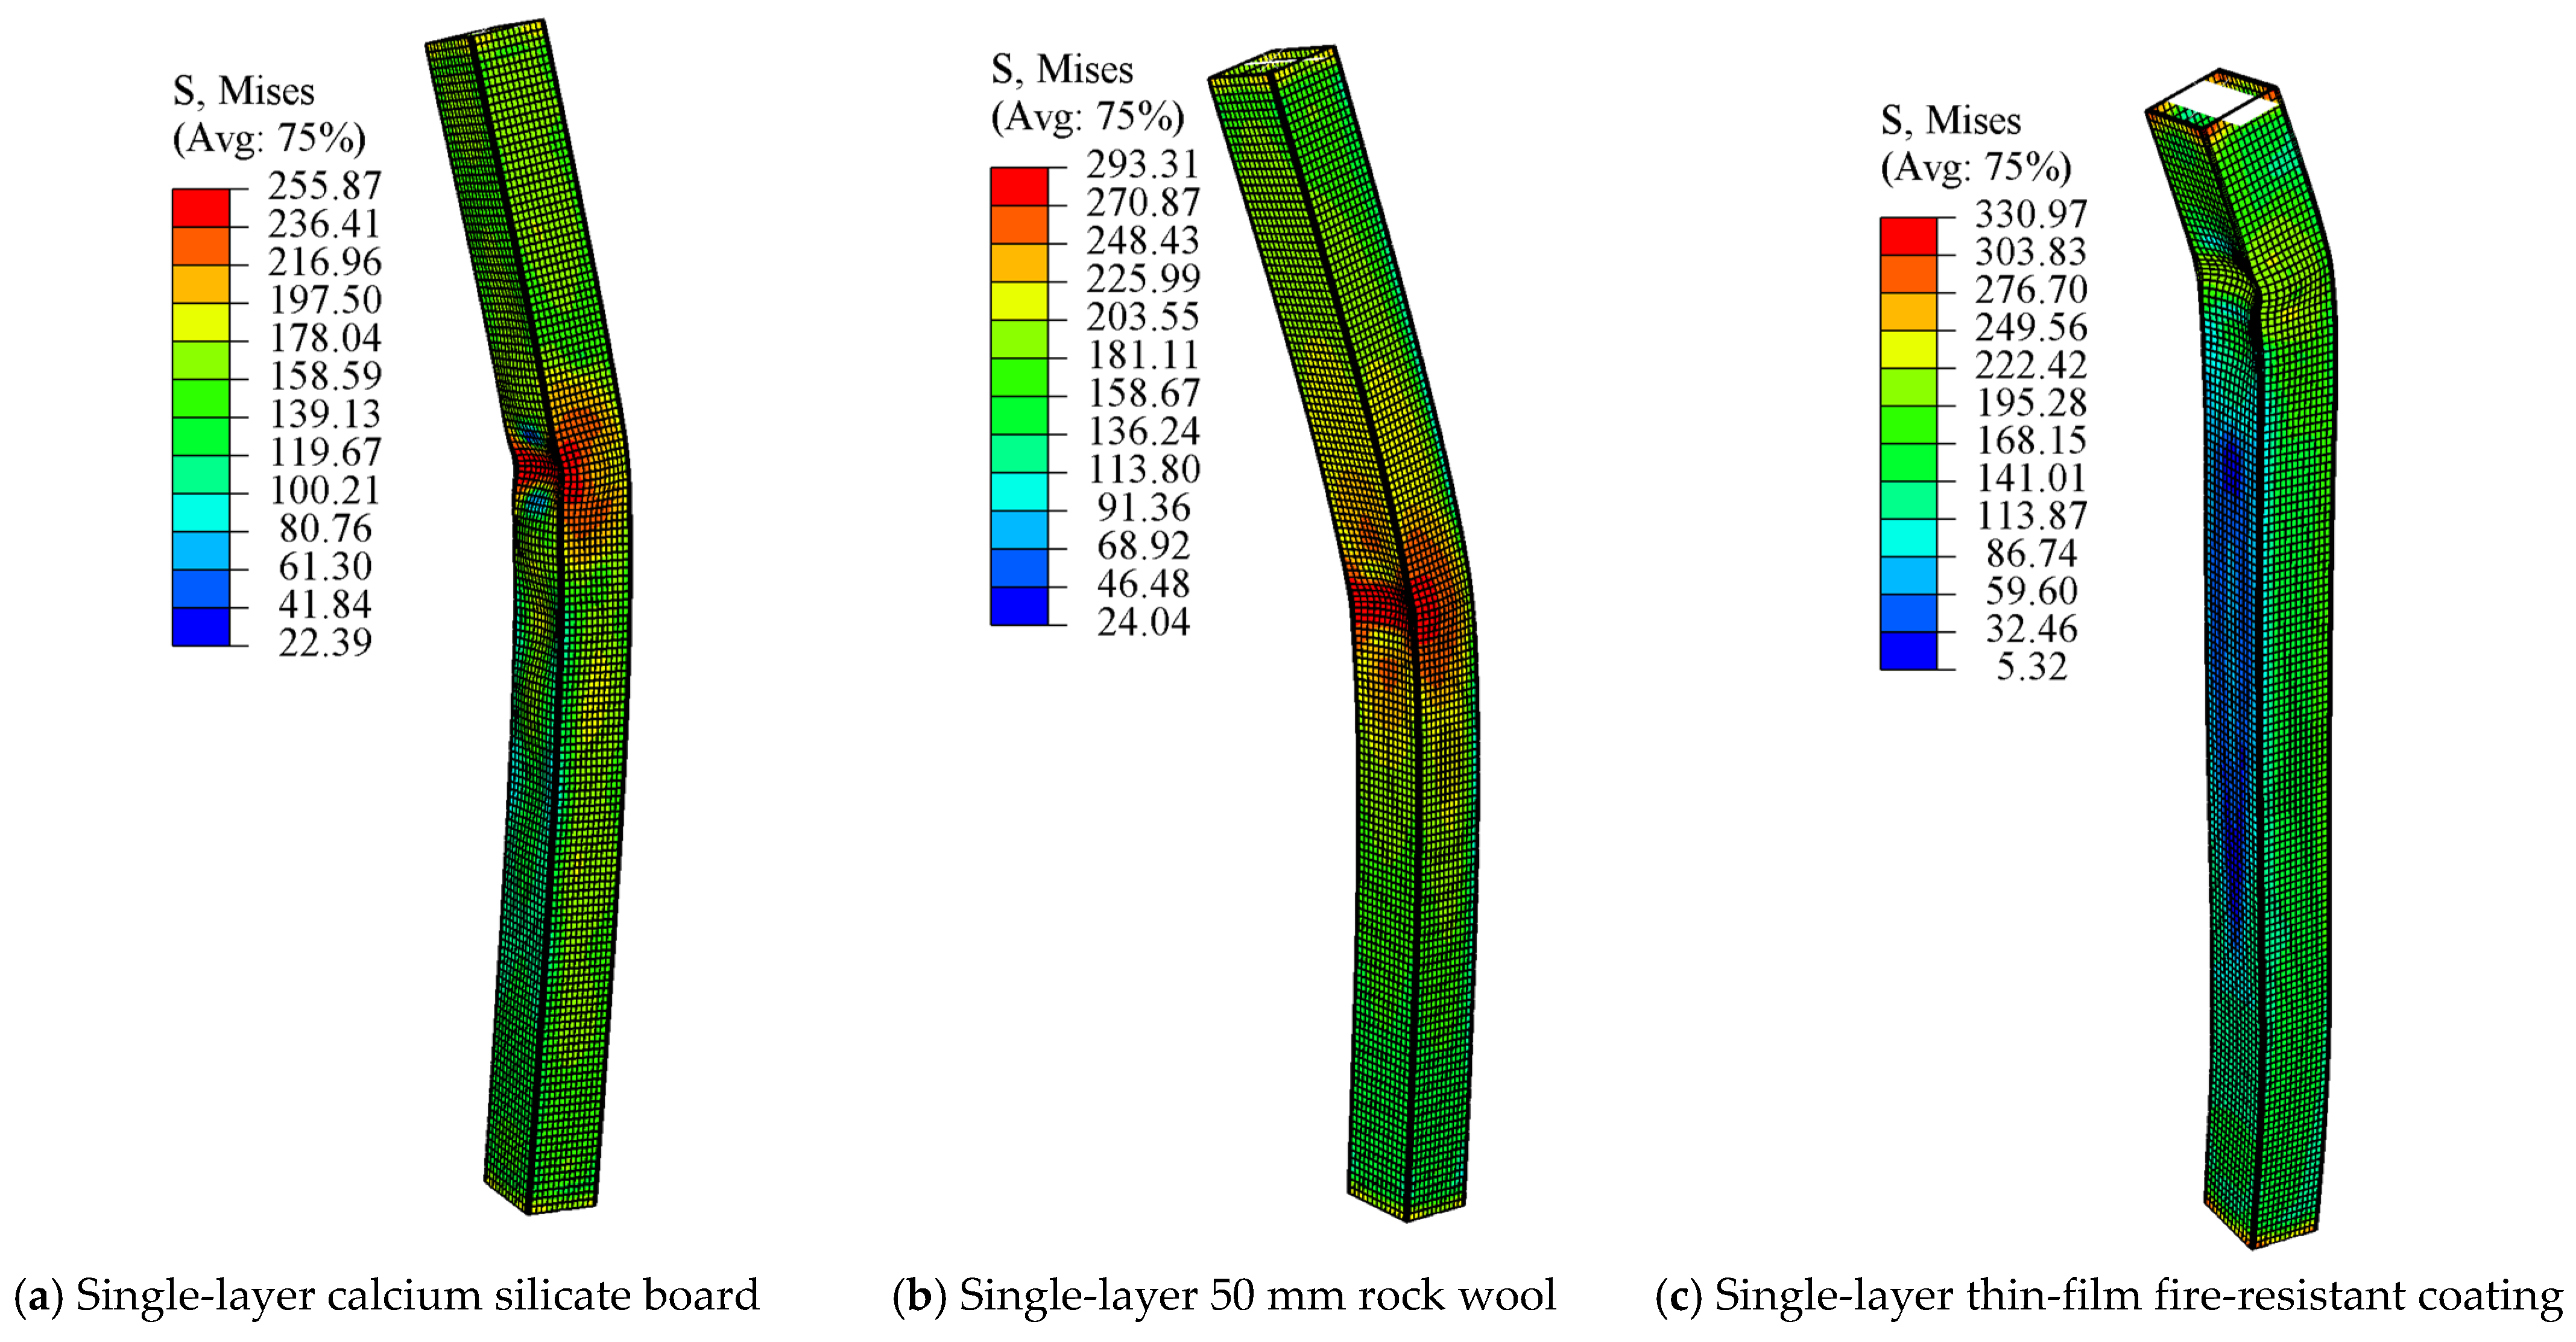
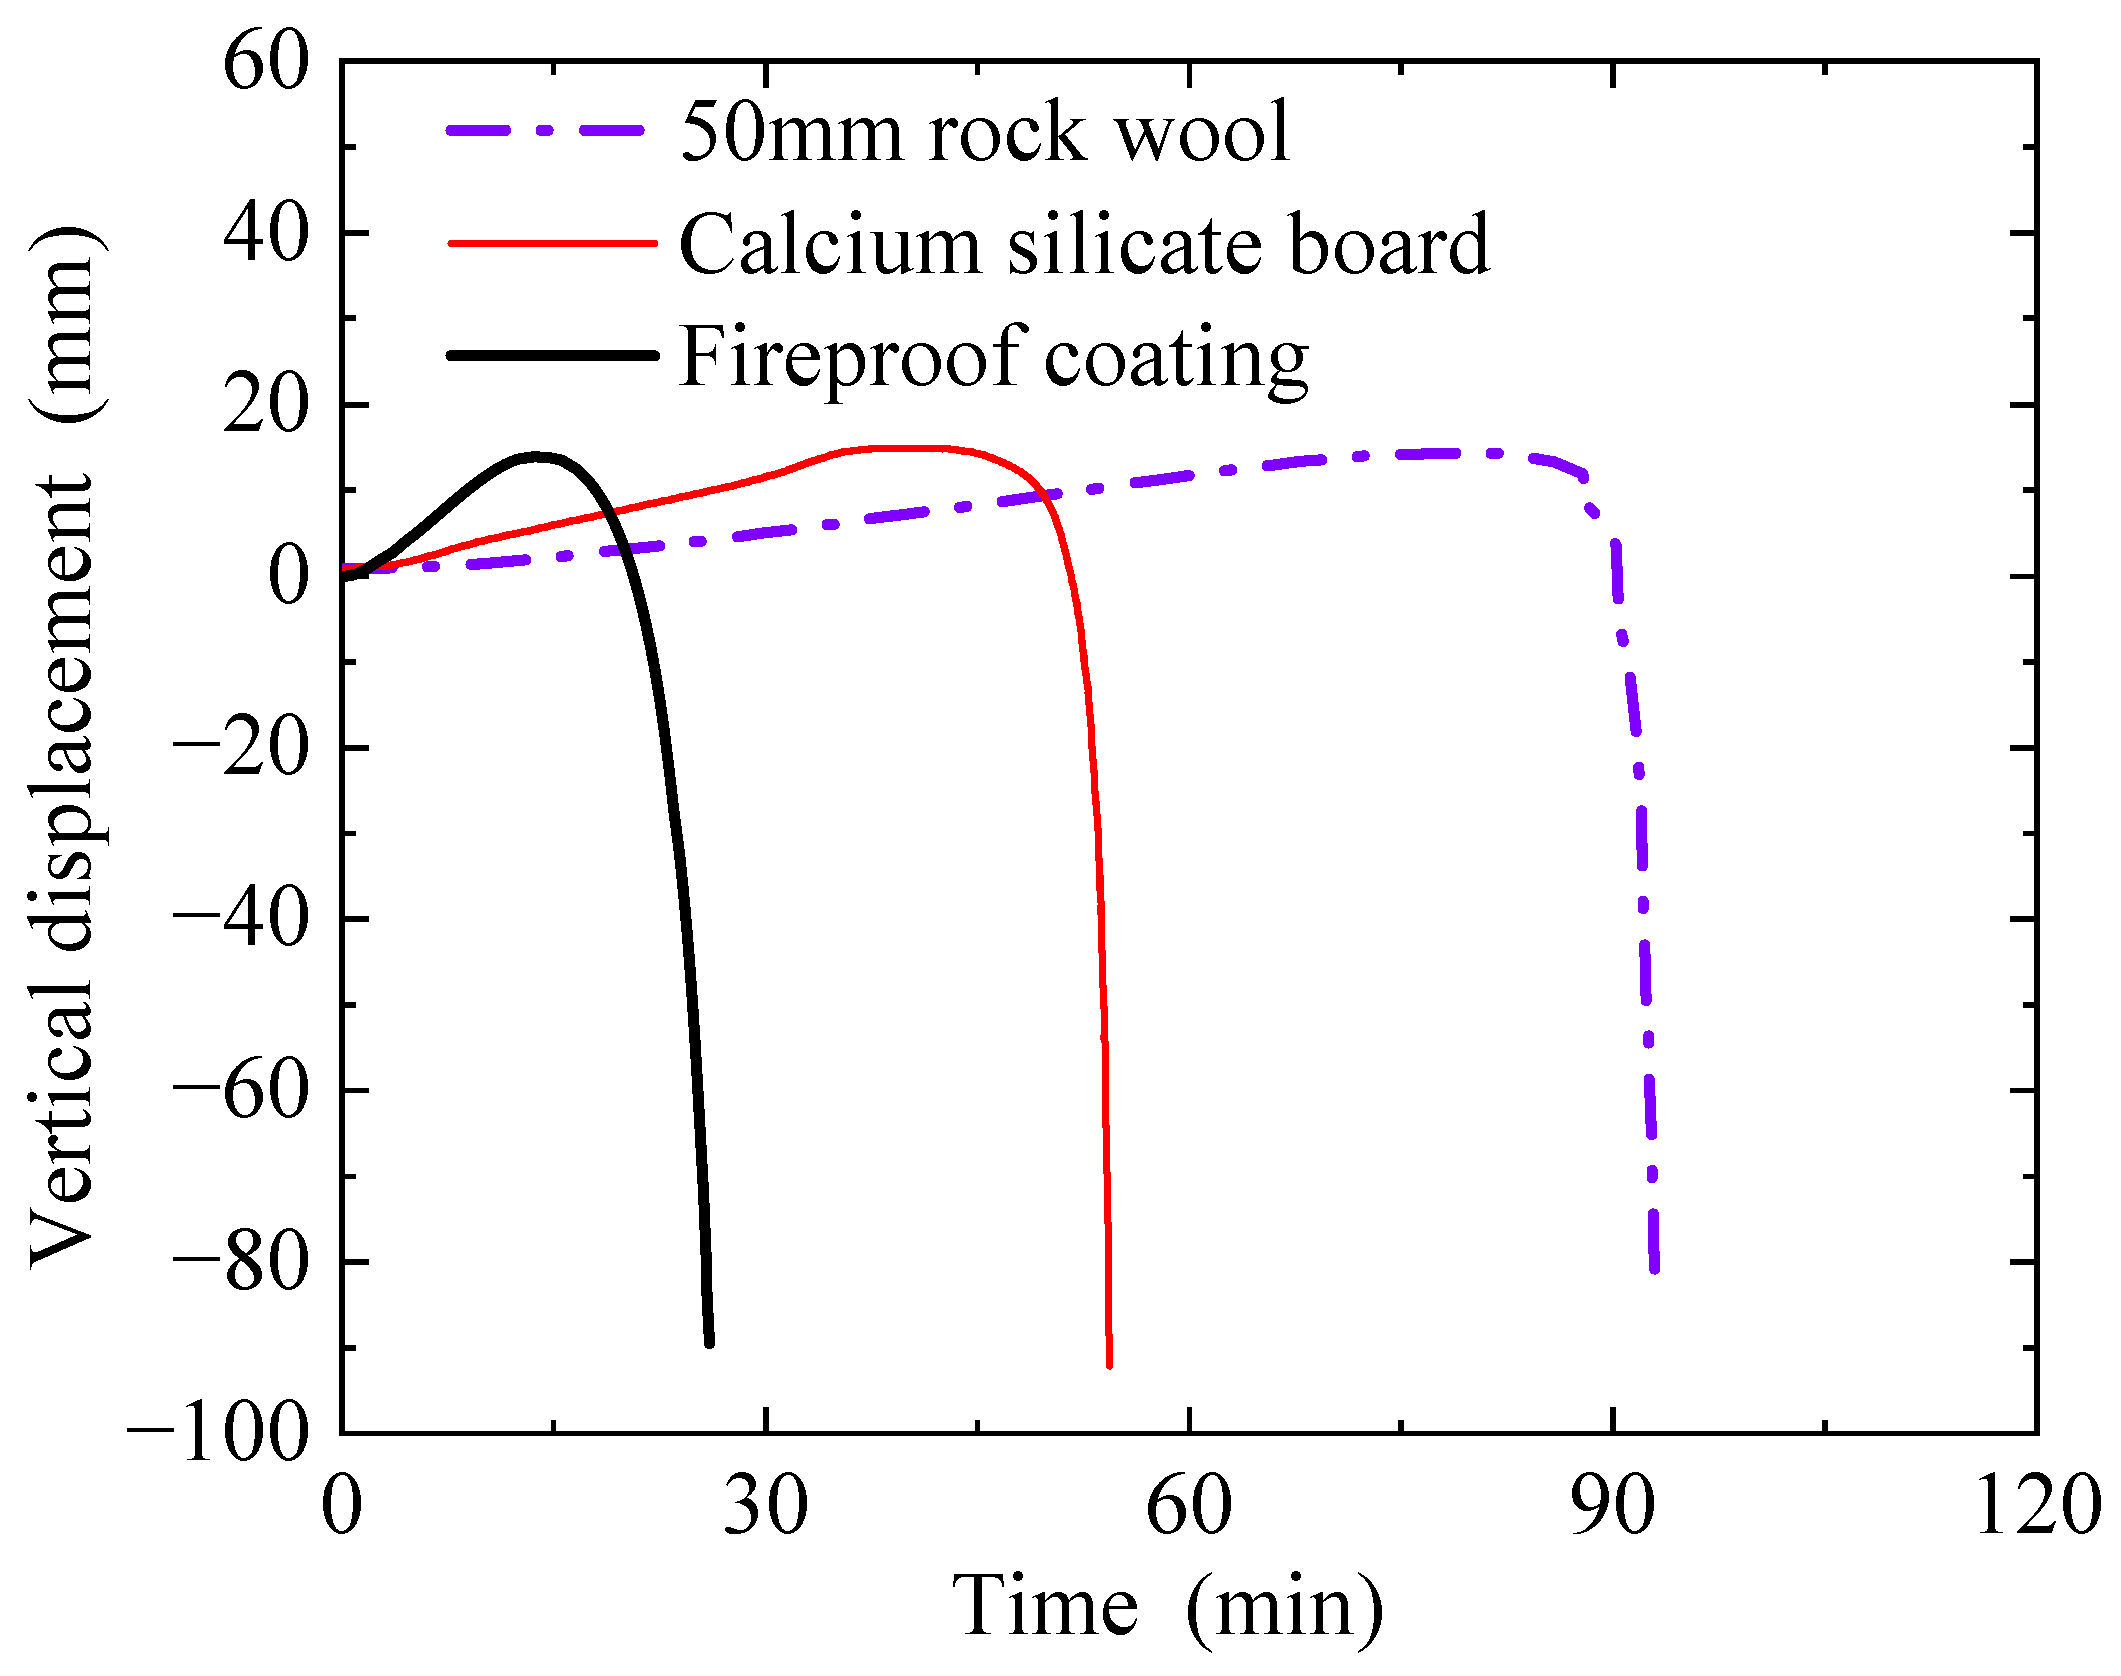
Since there is a significant discrepancy between the simulated fire resistance time and the experimental results (see Table 5), it is necessary to analyze and identify the main reasons for the large gap. Finite element simulations were conducted to test the fire resistance limits of the steel columns under the conditions of being wrapped separately with rock wool, fireproof board, and coating. The simulation results are shown in Figure 16 and Figure 17.
Without a protective layer, the steel column typically has a fire resistance time of 16 min. With a coating, it increases to 26 min; with a fireproof board, it increases to 53 min; and with 50 mm rock wool, it increases to 92 min. The steel column itself contributes 16 min [29], the coating adds 10 min, the fireproof board adds 37 min, and the 50 mm rock wool adds 76 min.
By summing these contributions, the fire resistance times for models BM1, BM2, and BM3 are estimated as follows: BM1 = 16 + 37 + 76 = 129 min; BM2 = 16 + 37 + 76 × 1.5 = 167 min; BM3 = 16 + 10 + 37 + 76 = 139 min. These estimates closely align with finite element simulation results: BM1 = 124 min; BM2 = 163 min; BM3 = 142 min.
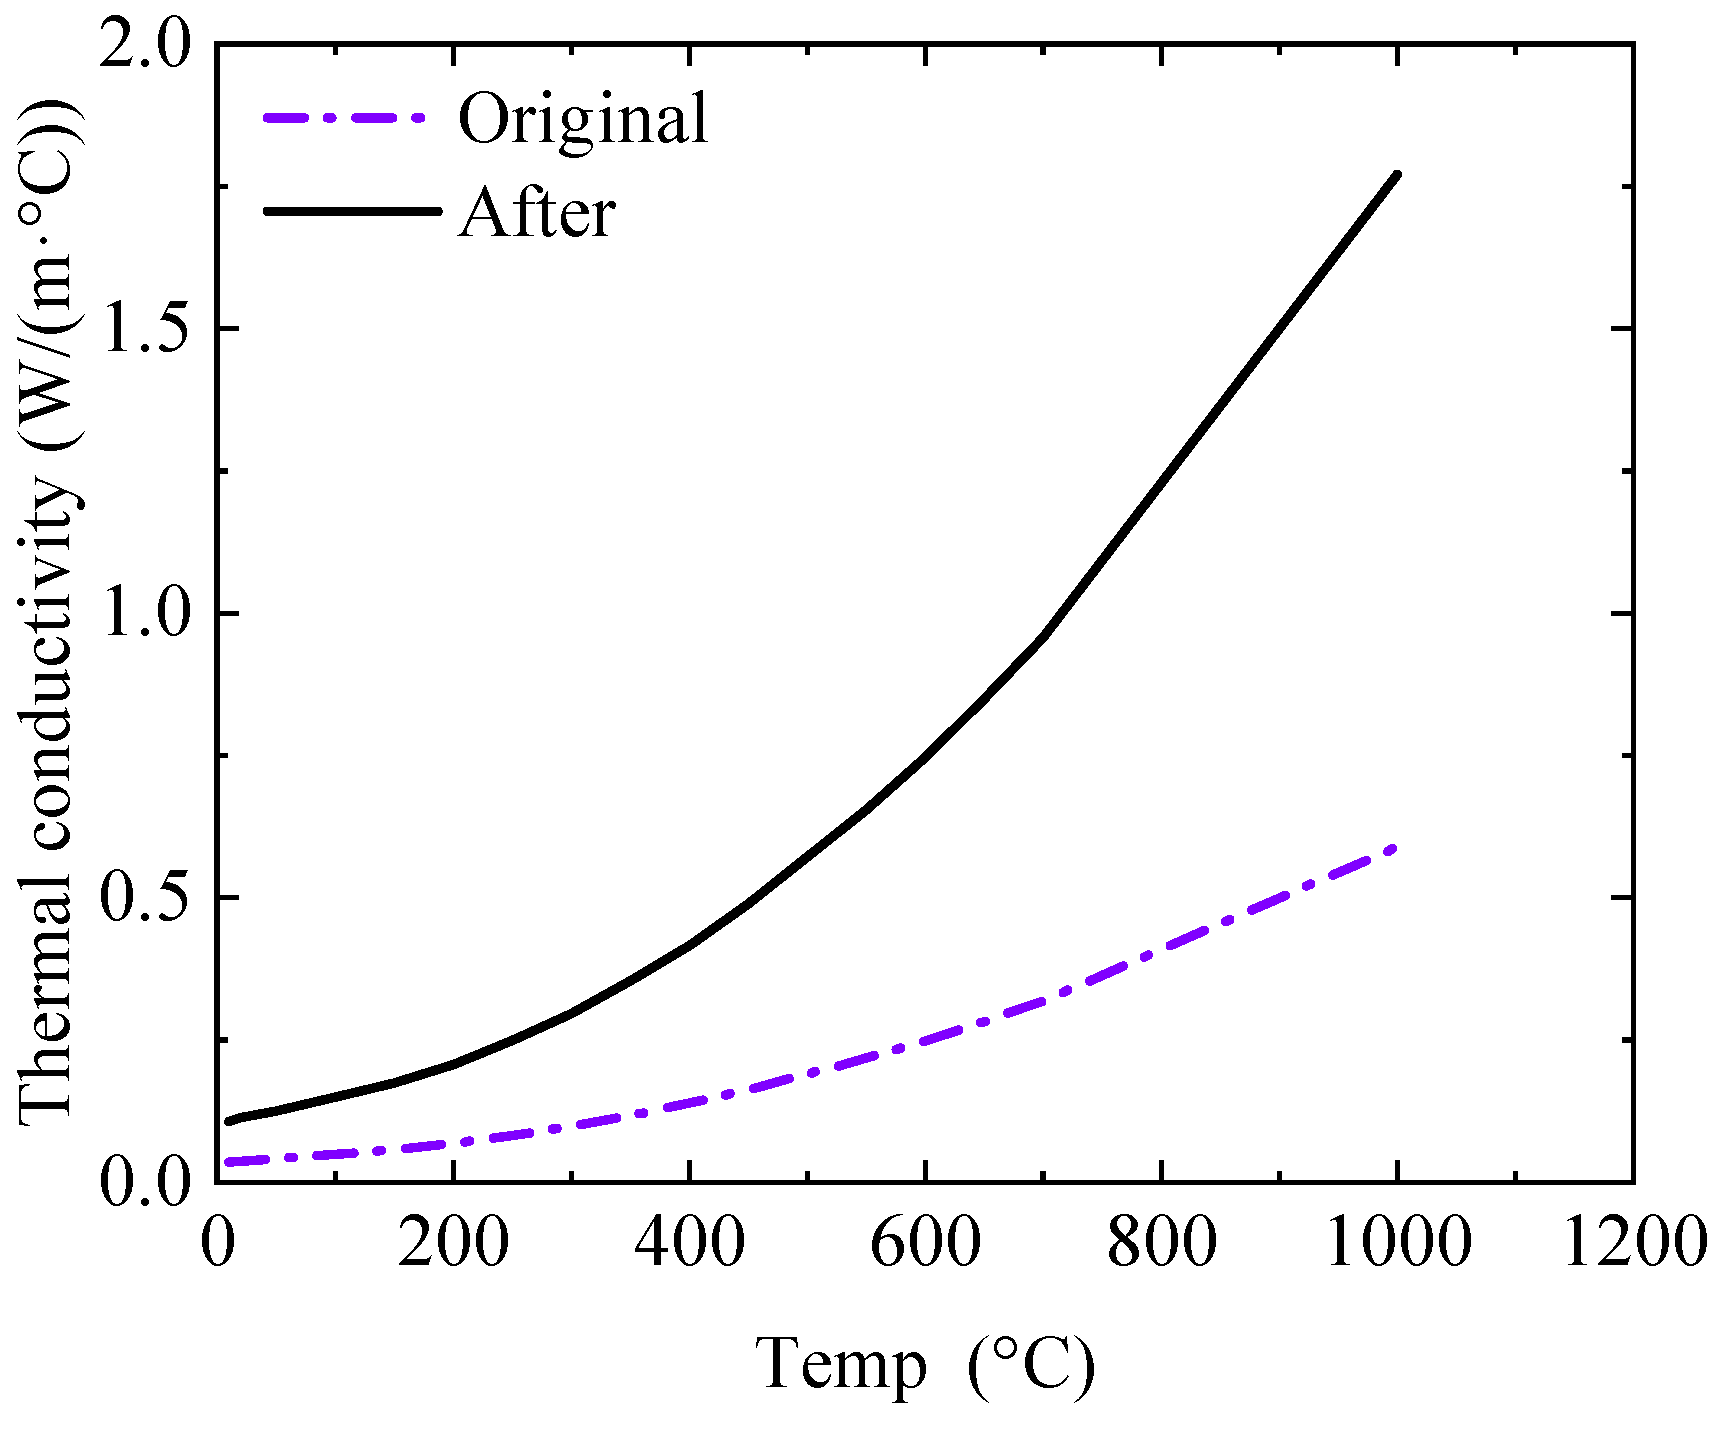
A comparison of the experimental results indicates that rock wool exhibits significant discontinuities during tests, leading to the formation of numerous gaps upon thermal shrinkage. This phenomenon is not considered in the finite element model, resulting in a substantial overestimation of rock wool’s fire resistance performance. To address this issue, this study adjusts the thermal parameters of rock wool to equivalently simulate its actual thermal resistance observed in experiments. Finite element simulation results reveal that when the thermal conductivity of rock wool is increased by a factor of 3, the fire resistance time of BM1 reduces to 88 min, the fire resistance time of BM2 reduces to 100 min, and the fire resistance time of BM3 reduces to 109 min, achieving equivalent performance, as shown in Table 6 and Figure 18. The comparison between the original thermal conductivity and the modified thermal conductivity is shown in Figure 19. This means that the shrinkage of rock wool has caused its thermal conductivity to increase to three times its original value, which is equivalent to a loss of 66.7% of its insulating capability.
Based on the finite element simulation results and equivalent analysis, a simplified formula for calculating the fire resistance limit of steel columns under composite protective layers is derived as follows:
B = T s + T r T s + T c T s + T t T s
where B is the fire resistance limit of the modular steel column, and T s , T r , T c , and T t represent the fire resistance limits of the steel column under the following conditions: T s : no protective layer, T r : rock wool as the protective layer, T c : calcium silicate board as the protective layer, and T t : fireproof coating as the protective layer. The expressions of T r , T c , and T t are derived from the fire protection layer thickness calculation formula in EN 1993-1-2 [30] (see Equation (6)), as follows:
d = λ t r e q ρ c T g 550 k
T r = d r ρ r c r T g 550 λ r
T c = d c ρ c c c T g 550 λ c
T t = d t ρ t c t T g 550 λ t
Herein, t r e q denotes the required fire resistance time (in seconds), T g represents the fire temperature, and k is a correction factor that is typically assigned a value of 1.0.

5. Conclusions

This study systematically investigated the impact of composite protective layers on the fire resistance of modular steel columns through fire resistance tests and finite element simulations and analyzed the relationship between the fire resistance of steel columns under single-layer and composite protective layers. The main research conclusions are as follows:
(1) Rock wool is prone to shrinkage under heating conditions, which may reduce its fire resistance performance. Therefore, during construction, efforts should be made to ensure that rock wool continuously wraps the surface of the steel column to form a complete insulation layer. If there are discontinuities in the rock wool, splicing should be added to compensate and enhance the overall fire resistance.
(2) Based on the comparison between test results and finite element simulation results, it was found that the shrinkage of rock wool led to a 66.7% loss in its own insulating capability.
(3) For steel column components wrapped with multiple protective layers, their fire resistance can be approximately equal to the simple sum of the fire resistance times of each single-layer protective layer. This finding provides a simplified calculation method for evaluating the fire resistance performance of composite protective layers.
(4) To further improve this study, the authors will explore the effects of other composite protective layers on the fire resistance of steel columns and validate the applicability of the simplified formula, thereby enhancing its universality and engineering application value.

Author Contributions

Conceptualization, X.Z.; Methodology, X.Y.Z.; Software, X.Y.Z. and W.L.; Investigation, W.L.; Resources, X.Z.; Writing—original draft, W.L.; Writing—review & editing, X.Y.Z.; Funding acquisition, X.Z. All authors have read and agreed to the published version of the manuscript.

Funding

This research received no external funding.

Data Availability Statement

The original contributions presented in the study are included in the article, further inquiries can be directed to the corresponding author.

Conflicts of Interest

Author Xinxin Zhang was employed by the company China Construction Science and Industry Corporation Ltd. The remaining authors declare that the research was conducted in the absence of any commercial or financial relationships that could be construed as a potential conflict of interest.

References

  1. Ding, Y.; Deng, E.-F.; Zong, L.; Dai, X.-M.; Lou, N.; Chen, Y. Cyclic tests on corrugated steel plate shear walls with openings in modularized-constructions. J. Constr. Steel Res. 2017, 138, 675–691. [Google Scholar] [CrossRef]
  2. Dao, T.N.; van de Lindt, J.W. Seismic performance of an innovative light-frame cold-formed steel frame for midrise construction. J. Struct. Eng. 2013, 139, 837–848. [Google Scholar] [CrossRef]
  3. Zhang, A.; Liu, X. The new development of industrial assembly high-rise steel structure system in China. In Proceedings of the 10th Pacific Structural Steel Conference (PSSC’13), Singapore, 8–11 October 2013; 2013; pp. 976–981. [Google Scholar]
  4. Lacey, A.W.; Chen, W.; Hao, H.; Bi, K. Review of bolted inter-module connections in modular steel buildings. J. Build. Eng. 2019, 23, 207–219. [Google Scholar] [CrossRef]
  5. Gatheeshgar, P.; Poologanathan, K.; Gunalan, S.; Shyha, I.; Sherlock, P.; Rajanayagam, H.; Nagaratnam, B. Development of affordable steel-framed modular buildings for emergency situations (COVID-19). Structures 2021, 31, 862–875. [Google Scholar] [CrossRef]
  6. Lacey, A.W.; Chen, W.; Hao, H.; Bi, K. Effect of inter-module connection stiffness on structural response of a modular steel building subjected to wind and earthquake load. Eng. Struct. 2020, 213, 110628. [Google Scholar] [CrossRef]
  7. Shan, S.; Pan, W. Collapse mechanisms of multi-story steel-framed modular structures under fire scenarios. J. Constr. Steel Res. 2022, 196, 107419. [Google Scholar] [CrossRef]
  8. Gomes, F.C.; Costa, P.M.P.E.; Rodrigues, J.P.C.; Neves, I.C. Buckling length of a steel column for fire design. Eng. Struct. 2007, 29, 2497–2502. [Google Scholar] [CrossRef]
  9. Franssen, J.-M.; Talamona, D.; Kruppa, J.; Cajot, L. Stability of steel columns in case of fire: Experimental evaluation. J. Struct. Eng. 1998, 124, 158–163. [Google Scholar] [CrossRef]
  10. Agarwal, A.; Choe, L.; Varma, A.H. Fire design of steel columns: Effects of thermal gradients. J. Constr. Steel Res. 2014, 93, 107–118. [Google Scholar] [CrossRef]
  11. Wang, J. The protective effects and aging process of the topcoat of intumescent fire-retardant coatings applied to steel structures. J. Coat. Technol. Res. 2016, 13, 143–157. [Google Scholar] [CrossRef]
  12. Yang, K.; Yu, Z.-H. Experimental research on the creep buckling of fire-resistant steel columns at elevated temperature. Steel Compos. Struct. 2013, 15, 163–173. [Google Scholar] [CrossRef]
  13. Alam, M.S.; Billah, A.M.; Quayyum, S.; Ashraf, M.; Rafi, A.; Rteil, A. Fire performance curves for unprotected HSS steel column. Steel Compos. Struct. Int. J. 2013, 15, 705–724. [Google Scholar] [CrossRef]
  14. Siligardi, C.; Miselli, P.; Francia, E.; Gualtieri, M.L. Temperature-induced microstructural changes of fiber-reinforced silica aerogel (FRAB) and rock wool thermal insulation materials: A comparative study. Energy Build. 2017, 138, 80–87. [Google Scholar] [CrossRef]
  15. Paudel, D.; Rinta-Paavola, A.; Mattila, H.-P. Multiphysics Modelling of Stone Wool Fire Resistance. Fire Technol. 2021, 57, 1283–1312. [Google Scholar] [CrossRef]
  16. Keerthan, P.; Mahendran, M. Thermal Performance of Composite Panels Under Fire Conditions Using Numerical Studies: Plasterboards, Rockwool, Glass Fibre and Cellulose Insulations. Fire Technol. 2013, 49, 329–356. [Google Scholar] [CrossRef]
  17. Steau, E.; Mahendran, M.; Poologanathan, K. Experimental study of fire resistant board configurations under standard fire conditions. Fire Saf. J. 2020, 116, 103153. [Google Scholar] [CrossRef]
  18. Wang, Y.; Chuang, Y.-J.; Lin, C.-Y. The Performance of Calcium Silicate Board Partition Fireproof Drywall Assembly with Junction Box under Fire. Adv. Mater. Sci. Eng. 2015, 2015, 642061. [Google Scholar] [CrossRef]
  19. Tsai, K.-C. Influence of substrate on fire performance of wall lining materials. Constr. Build. Mater. 2009, 23, 3258–3263. [Google Scholar] [CrossRef]
  20. Beh, J.H.; Yew, M.C.; Yew, M.K.; Saw, L.H. Fire Protection Performance and Thermal Behavior of Thin Film Intumescent Coating. Coatings 2019, 9, 483. [Google Scholar] [CrossRef]
  21. Puri, R.G.; Khanna, A.S. Intumescent coatings: A review on recent progress. J. Coat. Technol. Res. 2017, 14, 1–20. [Google Scholar] [CrossRef]
  22. GB/T 9978.1-2008; Fire—Resistance Tests—Elements of Building Construction—Part 1: General Requirements. Standards Press of China: Beijing, China, 2017. (In Chinese)
  23. GB/T 9978.7-2008; Fire—Resistance Tests—Elements of Building Construction—Part 7: Specific Requirements for Columns. Standards Press of China: Beijing, China, 2017. (In Chinese)
  24. GB50017-2017; Code for Design of Steel Structures. China Planning Press: Beijing, China, 2017. (In Chinese)
  25. GBT2614-2010; General Administration of Quality Supervision. Inspection and Quarantine of the People’s Republic of China: Beijing, China, 2010. (In Chinese)
  26. Song, T.Y. Research on Post-Fire Performance of Steel-Concrete Composite Beam-Column Joints; Tsinghua University: Beijing, China, 2010. [Google Scholar]
  27. Lie, T. Fire resistance of circular steel columns filled with bar-reinforced concrete. J. Struct. Eng. 1994, 120, 1489–1509. [Google Scholar] [CrossRef]
  28. GB/T11835-2007; Rock Wool, Slag Wool and Their Products for Thermal Insulation. General Administration of Quality Supervision, Inspection and Quarantine of the People’s Republic of China: Beijing, China, 2017. (In Chinese)
  29. Fan, G.M.; Wang, L.L.; Wang, W.H. Experimental study on insulating properties of fire-resistant plates commonly used in building under different fire conditions. J. Disaster Prev. Mitig. Eng. 2022, 42, 391–402. [Google Scholar]
  30. EN 1993-1-2; Eurocode 3: Design of Steel Structures—Part 1-2: General Rules—Structural Fire Design. European Committee for Standardization (CEN): Brussels, Belgium, 2005.
Figure 1. Cross-section of specimens.
Buildings 15 01730 g001
Figure 2. Installation of fire protection on specimens.
Buildings 15 01730 g002
Figure 3. Test setup and specimen installation.
Buildings 15 01730 g003
Figure 4. Test results of specimen BM1.
Buildings 15 01730 g004
Figure 5. Test results of specimen BM2.
Buildings 15 01730 g005
Figure 6. Test results of specimen BM3.
Buildings 15 01730 g006
Figure 7. Furnace temperature.
Buildings 15 01730 g007
Figure 8. Temperature profiles.
Buildings 15 01730 g008
Figure 9. Comparison of rock wool and steel pipe surface temps.
Buildings 15 01730 g009
Figure 10. Finite element models.
Buildings 15 01730 g010
Figure 11. Temperature field of BM1 in middle section.
Buildings 15 01730 g011
Figure 12. Temperature field of BM2 in middle section.
Buildings 15 01730 g012
Figure 13. Temperature field of BM3 in middle section.
Buildings 15 01730 g013
Figure 14. Stress contour of the model at instability.
Buildings 15 01730 g014
Figure 15. Comparison of vertical displacement−time curves at the top of the models.
Buildings 15 01730 g015
Figure 16. Stress contour plots at the time of model instability with only a single protective layer.
Buildings 15 01730 g016
Figure 17. Vertical displacement–time curves at the top of the models with a single protective layer.
Buildings 15 01730 g017
Figure 18. Simulation results after calculating the equivalent thermal conductivity of rock wool.
Buildings 15 01730 g018
Figure 19. Comparison of original thermal conductivity and thermal conductivity after adjustment.
Buildings 15 01730 g019
Table 1. Details of specimens.
No.Protection MethodHight
(mm)
Section Size
(mm)
Load Applied
(kN)
BM150 mm rock wool + 15 mm calcium silicate board3750300 × 250 × 122100
BM275 mm rock wool + 15 mm calcium silicate board3750300 × 250 × 122100
BM35.86 mm thin-film fireproof coating + 50 mm rock wool + 15 mm calcium silicate board3750300 × 250 × 122100
Table 2. Thermal parameters of rock wool.
Rock Wool
DensityConductivityTempSpecific HeatTempExpensionTemp
kg/m3 W / ( m ° C ) ° C J / ( kg ° C ) ° C 1 / ° C ° C
1000.03610900.00208.00 × 10−520
0.03820900.006508.00 × 10−51000
0.04250900.007258.00 × 10−51200
0.050100900.00800
0.058150900.001200
0.069200
0.083250
0.099300
0.118350
0.139400
0.163450
0.218550
0.249600
0.283650
0.319700
0.5901000
Table 3. Thermal parameters of Calcium Silicate Board.
Calcium Silicate Board
Density Conductivity k c Temp Specific   Heat c c TempExpensionTemp
kg/m3 W / ( m ° C ) ° C J / ( kg ° C ) ° C 1 / ° C ° C
10500.50 201100208.25 × 10−520
0.17035110012008.25 × 10−51200
0.09 80
0.01250
0.43360
0.04 385
0.25420
0.35880
0.50 920
Table 4. Thermal parameters of thin-film fire-resistant coating.
Thin-Film Fire-Resistant Coating
Density Conductivity   k c Temp Specific   Heat   c c TempExpensionTemp
kg/m3 W / ( m ° C ) ° C J / ( kg ° C ) ° C 1 / ° C ° C
12000.50 201100208.25 × 10−520
0.50 1200110012008.25 × 10−51200
Table 5. Comparison of fire resistance limits between experiments and finite element models.
No.Experimental Fire Resistance Limit
min
Simulated Fire Resistance Limit
min
BM186124
BM288163
BM3110142
Table 6. Comparison of fire resistance limits between experiments and finite element models after modified.
No.Experimental Fire Resistance Limit
Min
Simulated Fire Resistance Limit
min
BM18688
BM288100
BM3110110
Disclaimer/Publisher’s Note: The statements, opinions and data contained in all publications are solely those of the individual author(s) and contributor(s) and not of MDPI and/or the editor(s). MDPI and/or the editor(s) disclaim responsibility for any injury to people or property resulting from any ideas, methods, instructions or products referred to in the content.