Article

Reducing Building Energy Performance Gap: Integrating Agent-Based Modelling and Building Performance Simulation

1
Centre for Advanced Spatial Analysis, The Bartlett Faculty of the Built Environment, UCL, London WC1H 0QB, UK
2
Department of Architecture and Built Environment, University of Nottingham, Nottingham NG7 2RD, UK
*
Authors to whom correspondence should be addressed.
Buildings 2025, 15(10), 1728; https://doi.org/10.3390/buildings15101728
Submission received: 28 January 2025 / Revised: 17 April 2025 / Accepted: 14 May 2025 / Published: 20 May 2025
(This article belongs to the Section Building Energy, Physics, Environment, and Systems)

Abstract

The building energy performance gap (BEPG) remains a significant challenge, undermining the accuracy of energy simulations and complicating efforts to design energy-efficient buildings. This study addresses this issue by developing an adaptive occupant behaviour framework for office buildings, integrating agent-based modelling (ABM) with a building performance simulation (BPS) platform. Conventional BPS models often rely on deterministic assumptions and overlook the dynamic, stochastic nature of occupant interactions, such as window and blind operations. By incorporating occupant-driven behaviours, this research enhances the realism of energy predictions and provides insights into reducing the BEPG. Focusing on a multi-functional office building at the University of Nottingham, the study used empirical data to validate the model. The ABM framework simulated occupant behaviours influenced by factors like indoor and outdoor temperatures, solar radiation, clothing levels, and metabolic rates. Profiles generated by the ABM were integrated into the energy model, creating an Adjust model compared against a Base model with deterministic settings. Validation against measured boiler energy use showed that the Baseline model over-predicted consumption by roughly 45 %, whereas the behaviour-informed Adjust model cut the deviation to about 26 %, albeit under-predicting the total load. Statistical analyses revealed improvements in mean squared error (MSE) and root mean squared error (RMSE), although hourly energy predictions remained a challenge. Additionally, the Adjust model provided a more realistic representation of thermal comfort, reducing variability in the predicted mean vote (PMV) index from extreme values in the Base model to a more stable range in the Adjust model. However, the Adjust model also predicted higher indoor CO2 concentrations, particularly in individual offices, due to reduced ventilation associated with occupant actions. This study demonstrates the potential of integrating ABM with BPS models to address modelling discrepancies by capturing detailed and dynamic occupant interactions, emphasising the importance of adaptive behaviours in improving prediction accuracy and occupant well-being.

1. Introduction

In recent years, the global energy crisis has intensified, driven by rising temperatures, increasing population, and a persistent reliance on fossil fuels. The World Energy Outlook 2023, published by the International Energy Agency (IEA), highlights the urgent need to reduce carbon dioxide emissions and mitigate climate change [1]. In response, strategies such as improving energy efficiency and controlling future energy demand are now regarded as essential measures for lowering energy consumption and safeguarding the environment.
Buildings play a substantial role in this energy challenge. Operational energy use from buildings accounts for approximately 26% of global energy-related emissions and 30% of total energy consumption. While the adoption of efficient and renewable building technologies is growing and regulatory standards are becoming more stringent, further acceleration is necessary to meet the Net Zero Emissions (NZE) by 2050 scenario. In particular, all new constructions and 20% of existing buildings must be zero-carbon ready by 2030—a critical target that must be achieved within this decade [2]. Therefore, enhancing building energy efficiency and reducing overall consumption are urgent priorities.
To support these goals, building performance simulation (BPS) is commonly employed by designers during the early stages of construction planning. BPS involves using mathematical and computational models to simulate a building’s physical properties and operational control systems, enabling the prediction of energy consumption and thermal comfort performance [3]. This process allows engineers and designers to explore various energy-saving strategies and evaluate their technical and financial implications. However, since the 1990s, researchers have identified a persistent gap between simulated and actual energy consumption in buildings, known as the building energy performance gap (BEPG). This gap has attracted considerable attention, prompting widespread research into its causes and solutions.
The BEPG refers to the discrepancy between predicted and real-world building energy consumption [4]. A critical factor contributing to this gap is occupant behaviour, particularly actions such as window opening, blind adjustment, thermostat use, and the operation of personal devices. These behaviours can substantially impact heating, cooling, and lighting demands. In practice, occupant actions rarely align with standardised schedules, which often assume uniform occupancy patterns and predictable responses. As a result, deviations in behaviour lead to unanticipated energy use, undermining the reliability of energy simulations. Studies have shown that the BEPG not only casts doubt on the effectiveness of high-performance building designs but also erodes public confidence in energy efficiency initiatives. Addressing this issue requires a more detailed understanding of occupant interactions and their integration into building performance models to ensure buildings meet their energy targets [5].
The aim of this study is to develop an adaptive occupant behaviour framework for UK office buildings using agent-based modelling (ABM) to reduce the BEPG between actual and simulated building energy performance. To achieve this, the study sets out several objectives. First, it aims to identify and analyse key occupant behaviours—specifically window opening and blind adjustments—that have a significant impact on building energy use. Second, the study develops an ABM framework to simulate occupant responses to indoor and outdoor environmental conditions, including temperature, lighting, and comfort preferences. Third, this ABM is integrated with a non-open-source BPS platform, IES VE, to simulate both the building’s physical environment and occupant-driven operations.
In addition, the model is validated using empirical data from an occupied UK office building, allowing for the evaluation of prediction accuracy and model reliability. Finally, the study assesses how effectively the ABM-BPS integration reduces the performance gap compared to a baseline simulation model. To guide the investigation, two research questions are addressed: (1) How effectively can integrating an agent-based model with a non-open-source BPS platform (IES VE) reduce the BEPG in UK office buildings? and (2) How does incorporating detailed validation data, such as measured boiler usage and occupancy presence, enhance the accuracy of occupant behaviour-integrated simulations?
In the sections that follow, the literature review (Section 2) discusses the theoretical underpinnings of the study and highlights gaps in current research. The methodology section (Section 3) then explains how the ABM framework and IES VE model were developed and integrated. The results section (Section 4) presents a comparative analysis of model outcomes, followed by a discussion that addresses the research questions and explores broader implications. The paper concludes with a summary of key findings and recommendations for future research.

2. Literature Review

This section examines the critical role of occupant behaviour in building energy consumption, highlights gaps in current modelling approaches, and emphasises the potential of ABM to develop a validated framework for reducing the BEPG in office buildings.

2.1. Understanding Occupancy Behaviour

The energy consumption of a building is influenced by the interaction between its systems and its occupants. However, accurately predicting energy usage remains challenging due to the unpredictability of occupant behaviour, which often leads to errors in building energy simulations. Studies have shown that occupant-driven dynamics not only complicate electricity load forecasting but also contribute to heat losses and gains due to occupant actions within buildings [6,7,8]. A deeper understanding of how individuals interact with buildings is therefore crucial for reducing the gap between actual and predicted energy use. Such insights can also guide the development of more resilient architectural designs and promote energy-efficient behaviours [9].
Most existing building energy simulations rely on standard occupancy schedules and rule-based behaviour models, which often fail to capture the complexity and dynamics of real-world occupant behaviour. Occupant behaviour is inherently diverse, complex, and stochastic, making it difficult to model accurately [10]. Diversity refers to the varying behavioural traits of individuals under similar conditions, shaped by personal preferences and social backgrounds. Complexity arises from the multidisciplinary factors, such as psychological, cultural, and environmental influences, that shape behaviour. Stochasticity reflects the inherent variability in occupant actions, as people rarely behave in a predictable or repeatable manner.
Occupant behaviours can be broadly categorised into adaptive behaviours, such as adjusting thermostats, operating fans, or opening and closing windows and blinds, and non-adaptive behaviours, like using electronic devices or engaging in sedentary activities. Adaptive behaviours are particularly significant, as they are widely recognised for their substantial impact on building energy performance gaps (BEPG). By focusing on these occupant-driven interactions, building models can better reflect real-world scenarios and improve the accuracy of energy consumption predictions.

2.1.1. Adaptive Behaviour

Occupant adaptive behaviour refers to the actions and decisions individuals undertake within a building to maintain personal comfort. These actions may include operating windows, blinds, thermostats, lighting, and appliances [11]. For instance, if occupants feel overheated, they might open a window or adjust the cooling system to lower the indoor temperature. However, comfort perception varies across individuals due to psychological, cultural, and physiological factors, resulting in differing responses, even when general trends are observed.
Moreover, people’s attitudes toward adapting to their environment are influenced by multiple considerations, such as the availability of adjustable equipment and social hierarchy. Specifically, adaptive behaviours emerge from a combination of contextual environmental factors (e.g., temperature, humidity, air velocity), building-related factors (e.g., insulation quality, types of heating systems), psychological factors (e.g., comfort expectations, safety concerns, habits), physiological factors (e.g., age, gender, health), and social factors (e.g., interactions with other occupants). Together, these elements determine how frequently occupants change clothing for thermal comfort, open or close windows, and adjust thermostats—ultimately affecting indoor environmental quality and overall energy consumption [12].

2.1.2. Adaptive Behaviour Design Framework

The Contextual, Occupancy, and Building (COB) framework provides a structured approach for understanding and facilitating adaptive behaviours in buildings [13]. This framework considers how external conditions, occupant-specific attributes, and building characteristics interact to shape energy-related behaviours. By identifying these influences, the framework supports building designers and researchers in developing strategies to enhance energy efficiency through occupant-driven adjustments.
Contextual factors include external environmental conditions such as temperature, seasonal variations, solar exposure, and urban surroundings (e.g., noise, pollution, and outdoor views). These elements significantly influence how occupants perceive and interact with their environment. For example, seasonal changes in temperature or exposure to sunlight may prompt actions like opening windows or adjusting blinds to maintain thermal comfort.
Occupancy factors refer to the individual traits and behaviours of building users, encompassing psychological, physiological, and social dimensions. Psychological aspects, such as attitudes and beliefs about comfort, combine with physiological elements, such as health conditions and personal comfort preferences, to shape responses to indoor environmental conditions. Social dynamics, including cultural norms and societal expectations, also play a role in whether and how individuals engage in adaptive actions. For instance, an individual’s likelihood of adjusting thermostats or blinds may depend on their personal heat tolerance or cultural expectations surrounding energy use.
Building factors pertain to the operational and physical characteristics of the built environment. These include interior layout, control systems (e.g., HVAC interfaces, lighting controls), and design elements such as furniture arrangement and space functionality. The accessibility and usability of control systems, as well as the flexibility of building features, can either enable or constrain adaptive behaviours. For example, if HVAC controls are user-friendly and conveniently located, occupants are more likely to interact with them to maintain comfort.
While the COB framework provides a foundational structure for analysing adaptive behaviours, its application must be tailored carefully to specific contexts. Both climate and building typology significantly influence how occupants interact with their environment. For example, studies in temperate European office buildings, such as those conducted by [14] in Switzerland, indicate that the likelihood of window opening increases notably when indoor temperatures enter the low- to mid-20 °C range. However, thresholds may differ substantially in other climatic and regional contexts, highlighting the importance of context-specific calibration. Behaviour also varies by building type: in educational settings, classroom activities often limit the feasibility of adaptive actions during lessons, while in residential buildings, a wider range of preferences and design elements inform occupant behaviour.
Building on the COB framework, the following sections explore specific adaptive behaviours—namely, window and blind operations—that play a critical role in regulating indoor environmental conditions and building energy performance.

2.1.3. Window Operations

Windows serve as a key interface between a building’s interior and its external environment. When opened, they allow fresh air to circulate through a space, influencing both thermal conditions and indoor air quality. From an energy balance perspective, however, window openings can increase ventilation losses and lead to higher heating or cooling demands.
Quantitative studies exploring window operation in UK office buildings emphasise the critical role of outdoor temperature in predicting occupant behaviour [15]. Using probit analysis, researchers have found a strong correlation between outdoor temperature and the likelihood of window operation, suggesting that occupants are especially responsive to short-term fluctuations in air temperature. Another study, based on observations and survey data from five UK office buildings, identified two distinct window-opening modes: slightly opened to meet basic indoor air quality requirements, and fully opened to enhance natural ventilation for temperature regulation [16]. Interestingly, this dual-mode behaviour remained consistent across different seasons. The study also noted that during most of the heating season, the resulting ventilation rates frequently exceeded the minimum fresh air requirement, contributing to unnecessary energy consumption.
These findings highlight the need for control strategies that balance fresh air intake with energy efficiency. Despite the frequent emphasis on outdoor air temperature as the primary predictor of window use, there is no clear consensus among researchers regarding the dominant drivers of occupant decisions. While most studies focus on contextual indicators such as outdoor temperature, wind speed, and solar exposure, other influential factors remain understudied. For example, one study [14] proposes using indoor air temperature as a predictor; however, the interdependence between indoor temperature and window state introduces complexity, as opening a window alters the very variable being used for prediction. Additionally, occupant-specific factors such as mood, anxiety, and personal preferences are rarely incorporated into predictive models. These omissions may contribute to inconsistencies across studies and point to the need for more comprehensive approaches that integrate both contextual and occupant-level drivers.

2.1.4. Blind Controls

Blinds play a critical role in managing a building’s energy efficiency by influencing both solar gains and the demand for artificial lighting. By reducing solar radiation, blinds can lower cooling loads, while also affecting internal heat gains associated with electric lighting use.
In a 16-month study of a UK office building, Zhang and Barrett [17] found that occupants adjusted blinds infrequently, despite substantial fluctuations in daylight illuminance caused by changing cloud cover and solar angles. Further analysis revealed that solar altitude angle and solar radiation were the strongest predictors for blind adjustments. Specifically, occupants were more likely to raise, rather than lower, blinds when solar radiation reached approximately 150 W/m2—suggesting that glare avoidance, rather than heat reduction, was the more immediate concern at this threshold. However, the researchers also noted that awareness of being observed may have influenced occupant behaviour, as participants reportedly tended to adjust blinds more regularly in response to weather conditions.
In a separate investigation, time-lapse photography and image-recognition techniques were used to track blind movements in a high-rise office building [18]. Researchers used MATLAB 2024a to quantify the degree of shade openness over time, revealing that façade orientation significantly influenced blind usage. The south-facing façade exhibited the highest mean shade openness (MSO) and a shadow movement rate (SMR) five times greater than the north-facing façade. Despite these findings, the overall frequency of blind adjustments remained low, particularly in shared office spaces. This suggests that when control responsibility is distributed among multiple users, individual motivation to interact with the environment may decline.
These studies underscore the complex relationship between environmental conditions (e.g., solar gains, façade orientation) and occupant behaviour, emphasising the importance of adaptive blind control strategies tailored to specific building contexts.

2.2. Occupant Behaviours Modelling Methods

A variety of methods exist for modelling occupant behaviour in buildings, each with differing levels of complexity. This complexity can be described in terms of size—the number of components or variables included—and resolution—the level of detail or granularity in each component [19]. As illustrated in Figure 1, model complexity increases in tandem with both its size and resolution. The size, represented by the horizontal dimension of the diagram, indicates the number of components or variables. The resolution, shown on the vertical axis, indicates the number of states or levels of detail assigned to each component. In behavioural models, size refers to the number of predictive variables (e.g., indoor temperature, occupancy schedule), while resolution concerns the precision of these variables (e.g., time intervals). Larger models typically require finer resolution to accurately simulate each component’s behaviour.
Below are several commonly used occupant behaviour modelling methods in BPS, arranged in order of increasing complexity [20].
Schedule models predict occupant behaviour based on fixed times, such as working hours or scheduled breaks. These models simplify simulations by estimating internal gains, such as occupant presence and equipment use, according to predefined schedules that remain fixed throughout the simulation. While straightforward and computationally efficient, these models lack the flexibility to account for dynamic or unpredictable occupant behaviours.
Deterministic models use predefined behavioural rules to represent occupant actions as direct responses to specific environmental conditions. For example, such a model might predict that windows open automatically when the indoor temperature exceeds a specified threshold. These models typically incorporate more input variables than schedule-based models, such as indoor temperature or air velocity. However, because a single rule set is applied uniformly across all occupants and time steps, deterministic models may not account for individual differences and temporal variability. This limitation reduces their ability to reflect the diverse and dynamic nature of real-world occupant behaviour. Nonetheless, deterministic models remain one of the most commonly used approaches for simulating occupant behaviour in building energy modelling due to their simplicity and computational efficiency.
Data-based non-probabilistic models [21] rely on training data to derive behavioural patterns associated with environmental cues. Although these models produce deterministic results based on known inputs, their accuracy depends heavily on the quality and scope of the dataset used for training. While limited in their ability to capture variability, they are useful for reflecting real-world patterns that have been previously observed.
Probabilistic models [22] utilise probability distributions to simulate random or stochastic events. For example, these models may estimate the likelihood of an occupant turning on a light based on predictor variables such as occupancy status or time of day. A random number is then generated and compared with this probability to determine whether the action occurs. By incorporating this element of randomness, probabilistic models are better equipped than deterministic methods to capture the inherent variability and uncertainty of occupant behaviour.
Agent-based modelling (ABM) [23] represents systems as collections of autonomous, decision-making agents capable of reproducing complex and adaptive behaviours. ABM offers several key advantages: it captures emergent phenomena, provides an intuitive way to simulate interactions in complex systems, and is highly adaptable to varying conditions. These models can simulate nonlinear and discontinuous behaviours, as well as discrete interactions between agents, incorporating learning and adaptive strategies. ABM can also capture spatial interactions—such as agents moving between zones—which is particularly valuable when modelling occupant flow or inter-zonal comfort adjustments. ABM is well-suited for representing dynamic and multi-faceted occupant behaviours in detailed building performance simulations.
Most OB modelling methods vary in their suitability depending on the complexity of the scenario. Schedule models, for example, rely solely on time-based inputs and are effective for simulating simpler, non-adaptive behaviours. Deterministic models incorporate additional variables, such as indoor/outdoor temperature and air velocity, and therefore require greater model size and resolution. However, they still fall short in capturing the inherent variability and unpredictability of adaptive behaviours. As such, the selection of an appropriate modelling method should be guided by the complexity of the occupancy scenario and the level of detail needed to produce accurate and reliable energy performance predictions.

2.3. Previous Related Studies and Research Gaps

A growing body of work has coupled agent-based modelling (ABM) with building energy simulation, yet the scope, assumptions, and validation depth of these studies vary considerably. Alfakara and Croxford [24] linked an ABM to TAS to examine summer overheating in offices. Each agent was assigned an individual temperature setpoint preference and could open windows or adjust the air conditioning setpoint when discomfort arose; a “seniority” rule gave the highest-ranking occupant final control in shared rooms. Although the approach lowered predicted cooling loads, it modelled only setpoint preferences and offered no quantitative validation against measured data.
Moving toward data-driven control, Erickson et al. [25] deployed the SCOPES (Smart CO2, Occupancy, and Position Estimating Sensor) wireless camera network in a multifunctional building, achieving roughly 80% occupancy detection accuracy over a 48 h trial. They compared two predictive engines: a Multivariate Gaussian Model (MVGM) for short-horizon, real-time occupancy forecasts and an ABM that simulates individual movements based on building geometry for sensor-scarce contexts. Simulation results suggested that HVAC schedules informed by these predictions could cut energy use by about 14%. The authors, however, noted limitations stemming from the brief monitoring period and sensor calibration errors, recommending longer-term datasets to improve robustness.
Azar and Menassa [26] introduced social dynamics by classifying occupants as high, medium, or low energy consumers and allowing peer influence plus energy-saving prompts to shift those categories over time. While the model reproduced transitions between consumption classes, it lacked field validation and underscored the difficulty of collecting reliable occupant behaviour and end-use data.
Some studies have compared ABM outputs directly with measured behaviour. For example, Jia and Bharathy [27] monitored window, door, and blind actions in a single office testbed using smart sensor boards and paper surveys. Their ABM, which incorporated a utility-based decision rule, achieved about 83% agreement with observed actions, though high-frequency behaviours (e.g., door use every 15 min) remained challenging to capture. The single-room scope also limited direct validation of space-level energy impacts.
To integrate ABM with a mainstream simulation engine, Langevin et al. [28] created the Human and Building Interaction Toolkit (HABIT), coupling EnergyPlus through the Building Controls Virtual Test Bed (BCVTB). HABIT agents adjust clothing, use fans or heaters, and manipulate thermostats and windows. One-year field data from a Philadelphia office provided partial validation: fan and heater use predictions were reasonable, whereas window-opening behaviour was less accurate, pointing to the need for additional non-thermal behaviour data.
Finally, Zimmermann [29] proposed a multi-agent framework that links user activities to building controls in an open-plan university office. Users were grouped into roles and functional units, allowing tasks to shift dynamically throughout the day. Simulated adaptive HVAC strategies achieved energy savings comparable to those during standard working hours while maintaining comfort. Yet the study acknowledged limited modelling of occupant reactions to environmental changes (e.g., spontaneous window opening) and called for richer field datasets and broader building typologies to refine the model. Table 1 summarises the key findings and limitations of relevant studies.
Recent work clearly demonstrates that modelling occupant behaviour is essential for closing the building energy performance gap (BEPG). Early efforts relied on fixed schedules or simple rule-based controls, but more recent studies have coupled agent-based models (ABM) with simulation engines such as EnergyPlus, TAS, and IES VE. Alfakara and Croxford [24] (overheating control), Erickson et al. [25] (sensor-informed HVAC), and Langevin et al. [28] (HABIT toolkit) all report double-digit reductions in simulated cooling or heating demand once adaptive actions—primarily window opening or personal fan/heater use—are introduced. Validation studies (e.g., Jia et al. [27], 83% behavioural match rate) further confirm that ABM can reproduce real-world decisions more faithfully than deterministic or purely probabilistic methods.
Despite this progress, three research gaps remain. (1) Many models target a single action—typically window operation—while overlooking other influential responses such as blind adjustment, thermostat changes, or lighting choices. (2) Many frameworks treat occupants as homogeneous, ignoring psychological, social, and contextual drivers that shape individual comfort thresholds and decision hierarchies. (3) Field data are often short-term or limited to a single room, making it difficult to verify model accuracy at the building scale or across seasons.
Addressing these gaps is the focus of the present study. We develop an adaptive-behaviour framework for UK office buildings that (i) simultaneously models window and blind actions, (ii) embeds heterogeneous occupant attributes and a simplified interaction mechanism, and (iii) is validated against multi-week empirical data from an occupied commercial office. By integrating this enhanced ABM with a non-open-source BPS platform, we aim to deliver a more comprehensive and reliable tool for reducing the BEPG in practice.

3. Methodology

This section outlines how BPS using IES VE [30] was integrated with ABM, followed by a detailed description of the key settings and procedures used in both the BPS and ABM models.

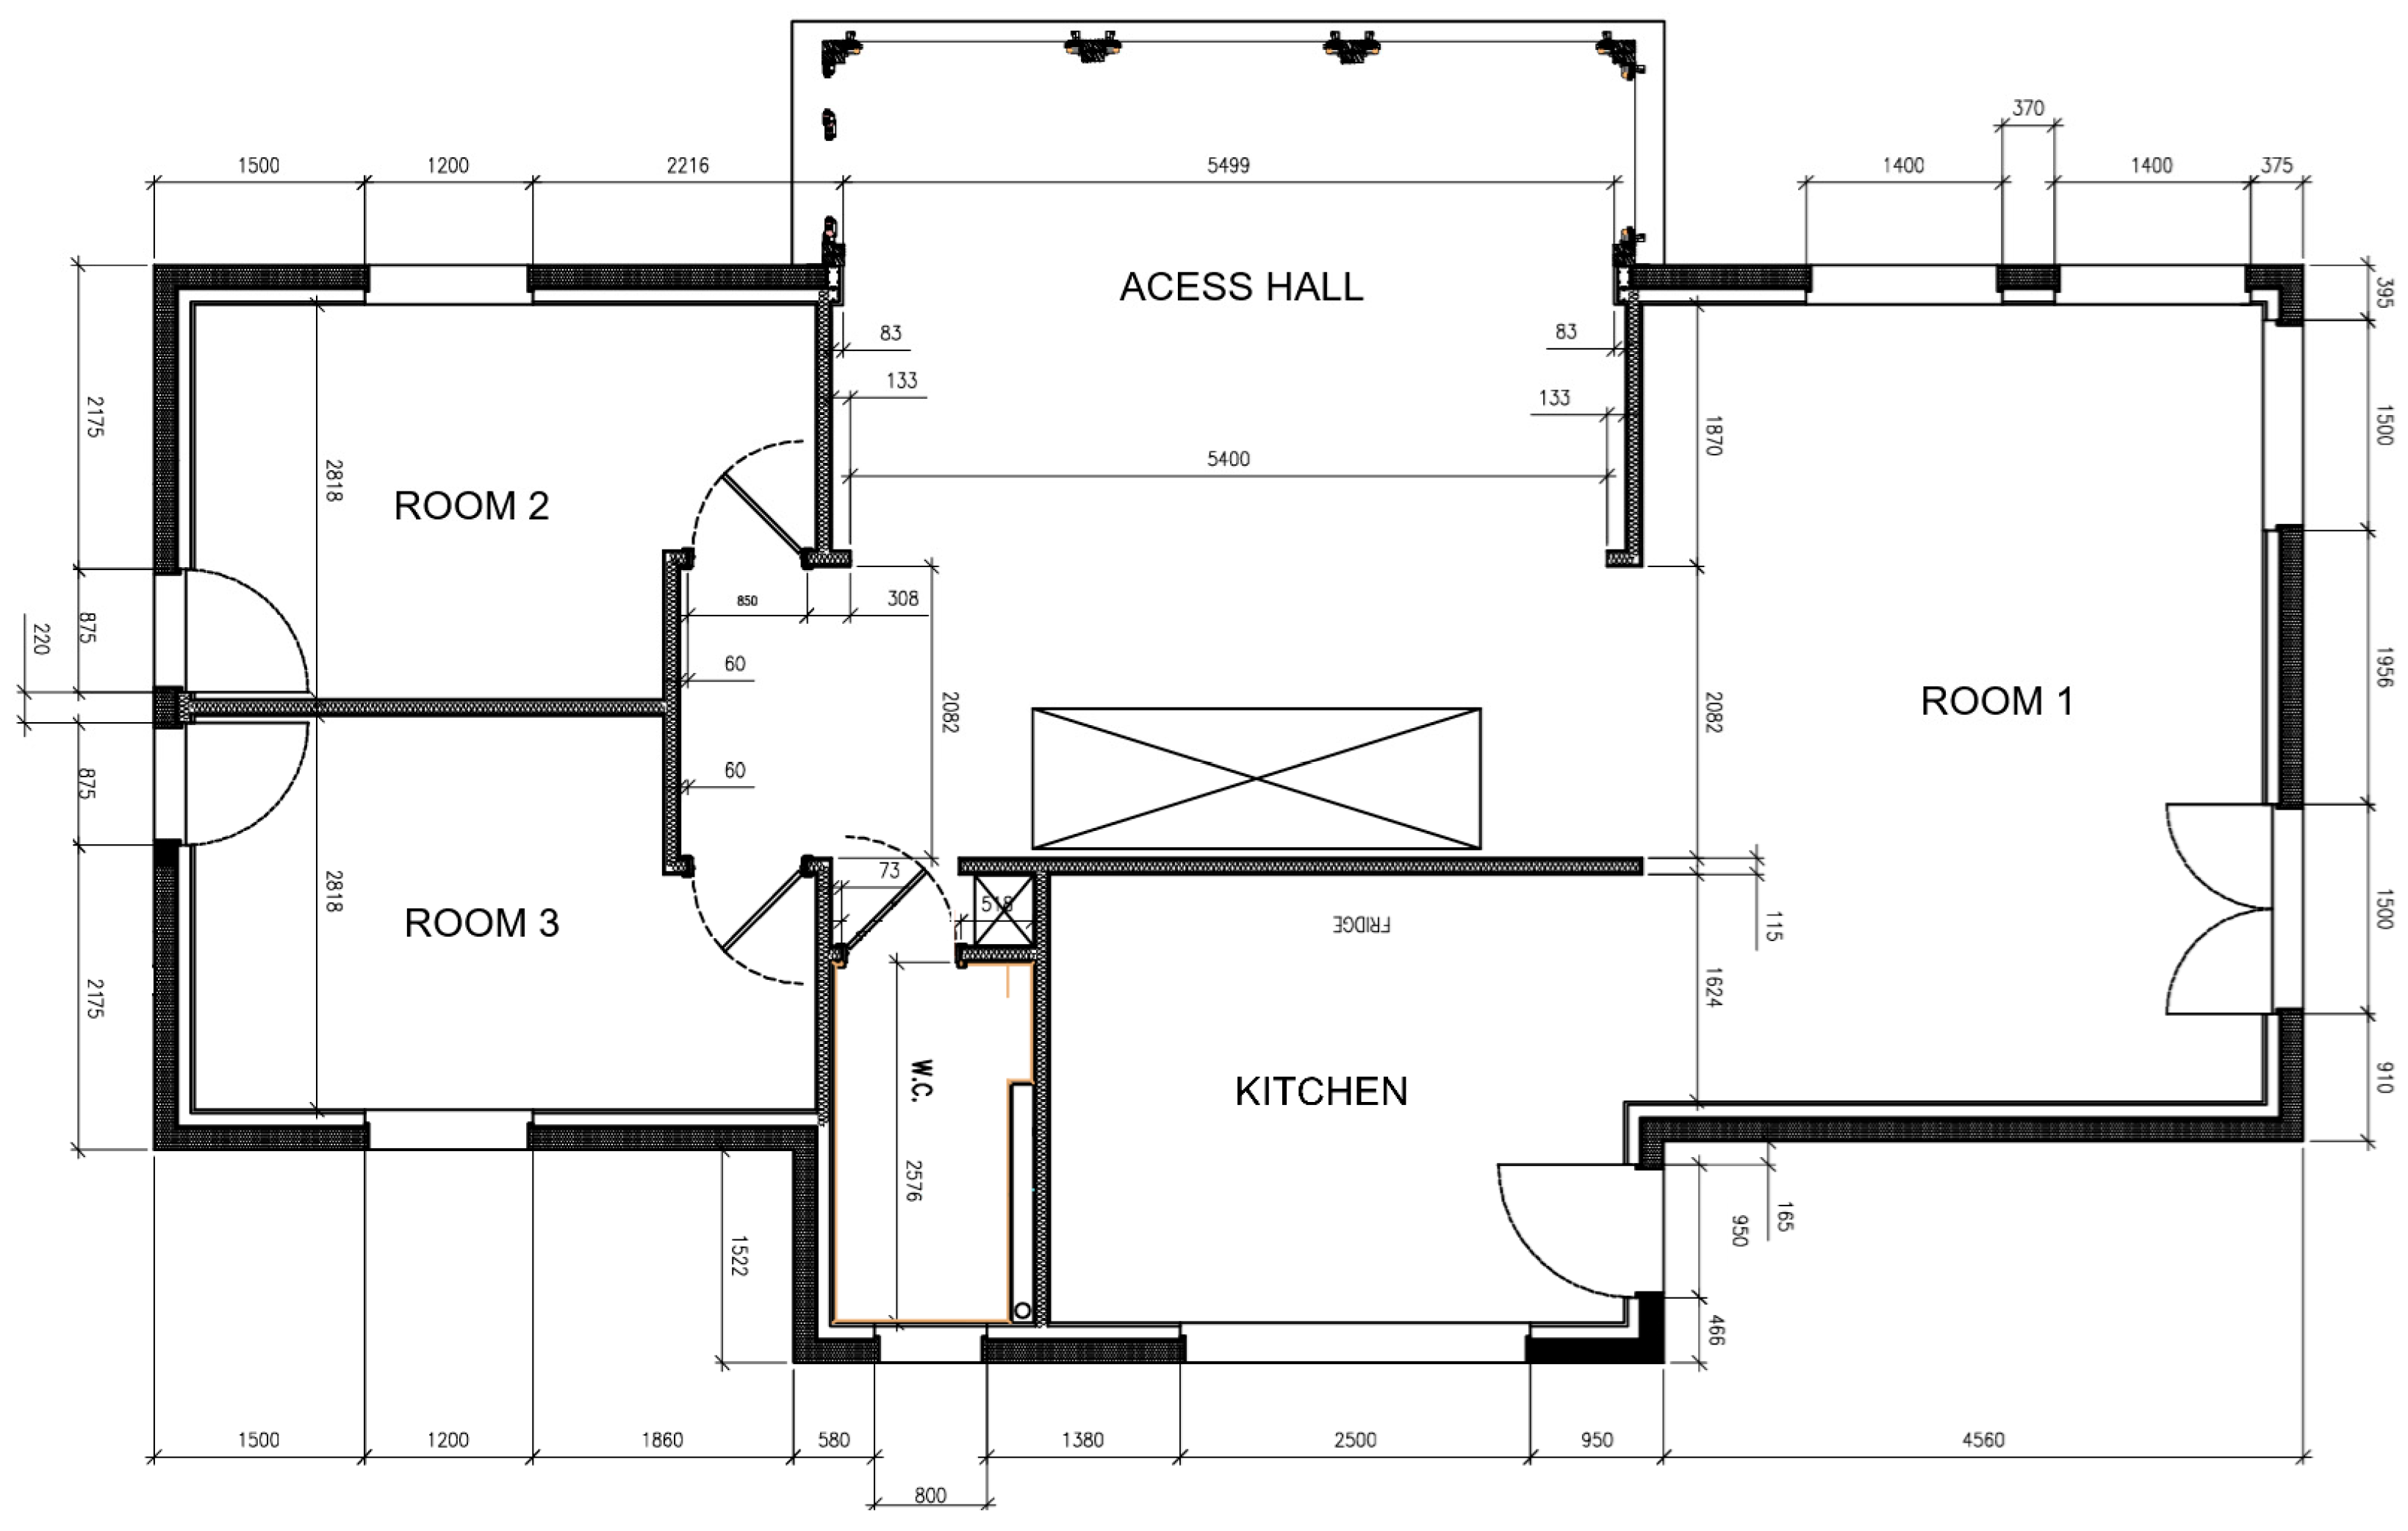
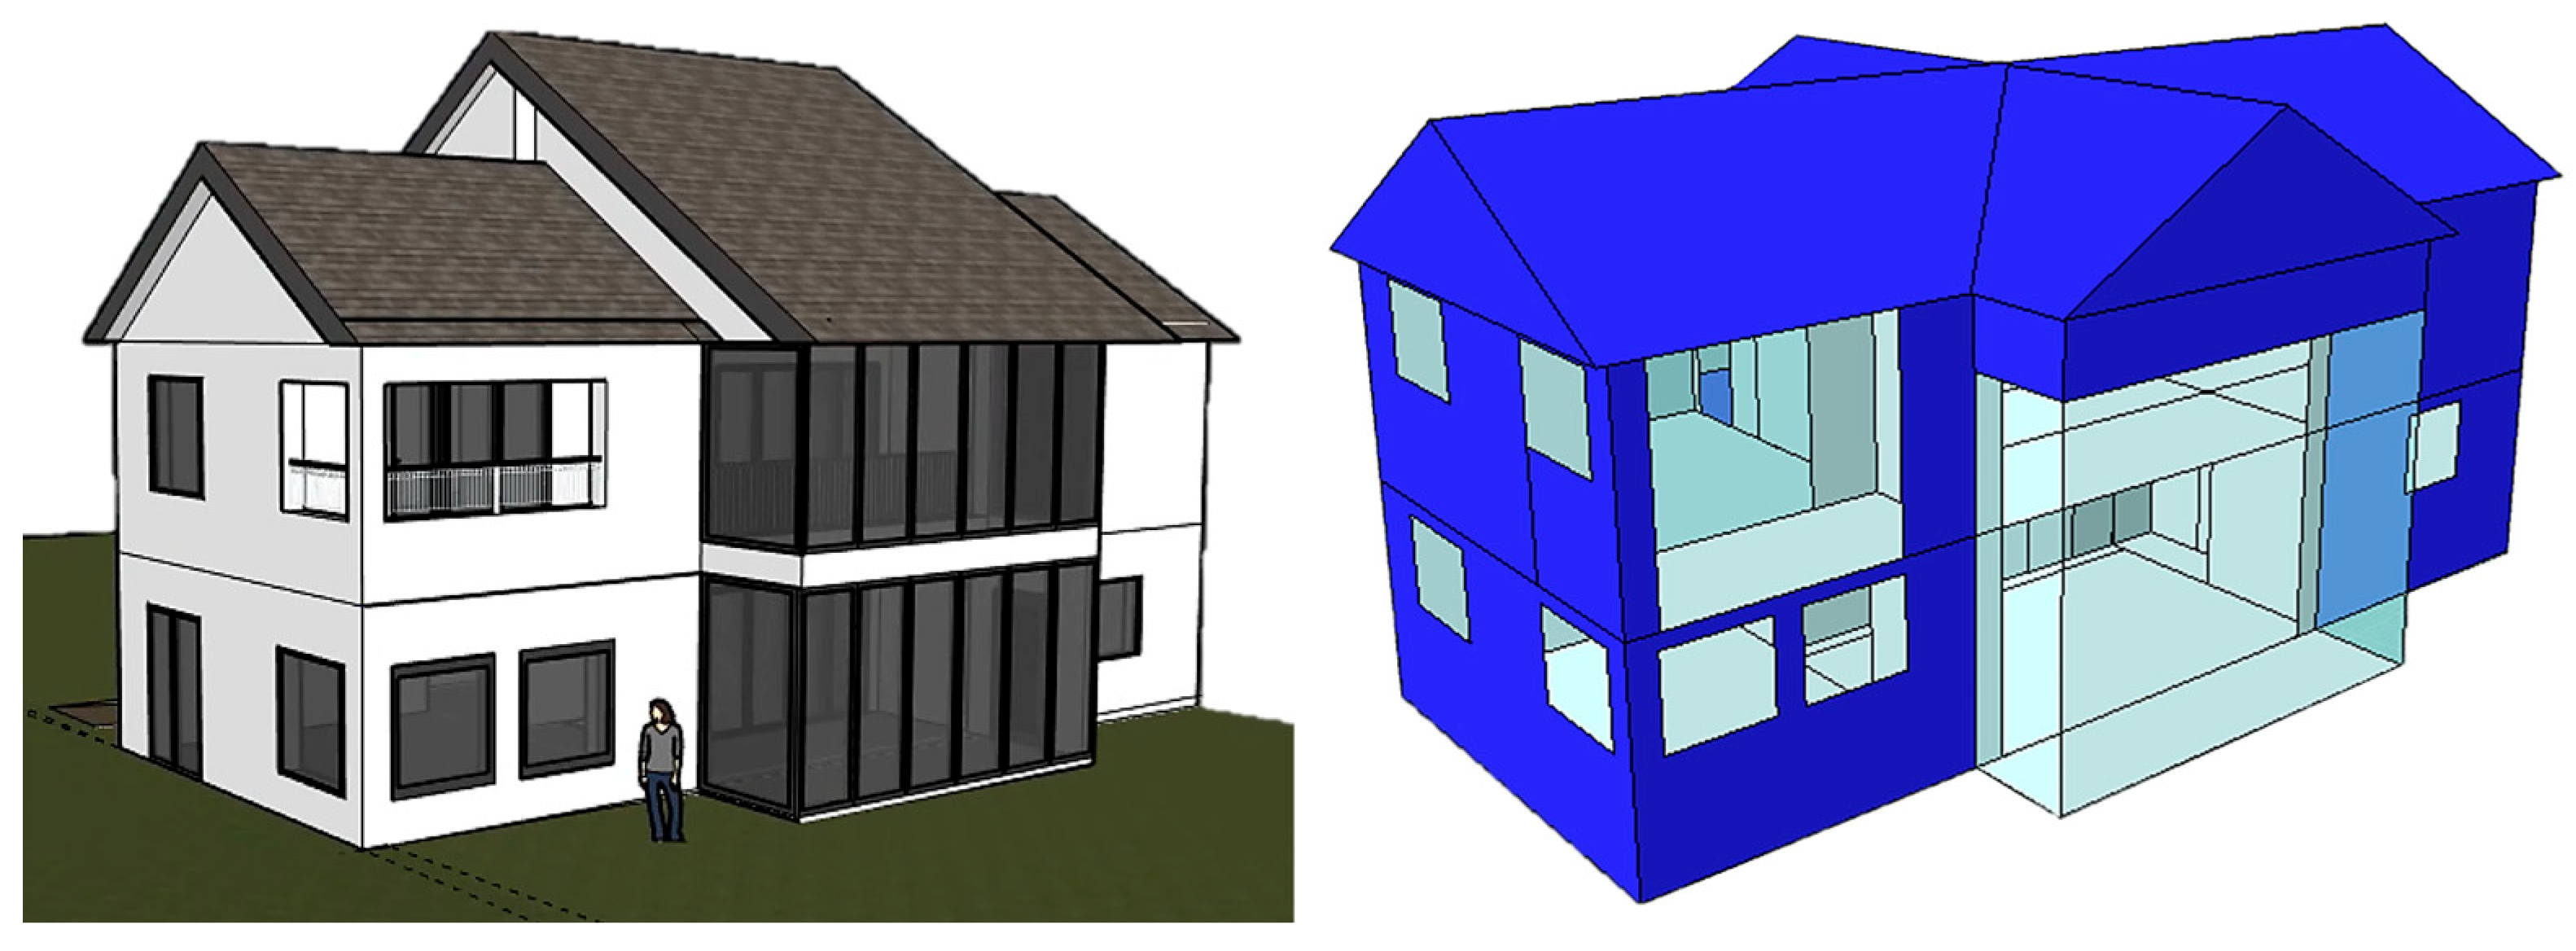
3.1. Case Study and Input Data

The case study involves a detached, three-story building with a basement, originally designed to meet Level 6 of the Code for Sustainable Homes (CfSH) standards [31]. Although the building was initially developed as a residential demonstrator to explore passive design strategies, it is now repurposed and actively used by research staff and PhD candidates as office space for various construction-related studies at the University of Nottingham. The dataset for this study includes CAD drawings, boiler unit values recorded during November 2015, and passive infrared (PIR) sensor data, which provides information on occupant presence patterns.
Boiler unit values were selected for detailed analysis because they reflect both space heating demand and domestic hot water usage, offering a comprehensive measure of the building’s thermal energy consumption. In the BPS environment, the domestic hot water usage is relatively stable for a fixed number of occupants, allowing the analysis to focus on space heating dynamics. Prior studies suggest that buildings using electrical HVAC systems pose challenges for validation due to the influence of plug loads and lighting. In contrast, boiler unit values provide a more direct and interpretable means for validating heating-related energy performance in this context.
To inform the simulation parameters, CIBSE Guide A: Environmental Design [32] was used. This guide outlines best practices for building fabric performance, HVAC system sizing, thermal comfort criteria, and energy consumption benchmarks. These recommendations ensured that the model development aligned with established design standards and contributed to the creation of a realistic, energy-efficient, and comfortable building environment.

3.2. The Interaction Between BPS and ABM

This research utilises two primary software tools: IES VE 2024 for building energy performance analysis and NetLogo 6.4.0 for occupant behaviour modelling. Figure 2 presents an overview of the workflow. The baseline IES VE model was constructed using the CAD drawings of the office building at the University of Nottingham. The model adhered to the design standards outlined in CIBSE Guide A to ensure accurate representation of the building’s physical and environmental characteristics. This digital model served as the foundation for the BPS process. The baseline simulation (Base model) was run in IES VE to generate the necessary contextual data—such as indoor temperatures, solar gains, and ventilation loads—and to establish a reference point for evaluating the building’s energy performance. This model represented the building’s default operation based on typical assumptions used in practice, including a fixed heating setpoint and rule-based controls, such as windows starting to open when indoor temperatures exceeded 22.5 °C. While this approach provided a standardised framework for comparison, it did not account for real-world, occupant-driven behaviours, which are often more variable.
In parallel, an occupant behaviour model was developed in NetLogo. Grounded in the literature and in CIBSE Guide A thermal-comfort guidelines, this ABM focused on adaptive behaviours such as window and blind operations. Contextual data from the Base model were used to estimate how occupants interact with building systems under varying environmental conditions. The resulting behavioural profiles were then integrated into IES VE, producing an Adjust model that accounts for occupant-driven adaptations and yields a more dynamic simulation of building energy performance.
By comparing the energy outcomes of the Base model and the Adjust model, we evaluate how effectively ABM-based adaptations reduce the BEPG between predicted and measured performance. It should be noted that the Base model’s simplified assumptions, particularly its deterministic window-opening rule, may introduce bias by overestimating ventilation-related heat losses, leading to inflated heating energy predictions. Therefore, the Base model serves as a conservative benchmark rather than an accurate reflection of actual building operations. Its primary function was to highlight the limitations of traditional modelling approaches and to assess the degree to which the occupant-adaptive Adjust model, developed using ABM, could reduce the discrepancy between simulated and actual energy use. While useful for comparison, the Base model’s reliance on overly simplified assumptions highlights the need for more realistic, behaviour-informed modelling frameworks.

3.3. BPS Modelling

Using CAD drawings, we created an IES VE model of an office building at the University of Nottingham. As mentioned, although originally designed as a residence, the structure now functions as office space: bedrooms have been converted to individual offices, and living areas to open-plan workspaces, while kitchens and toilets retain their original functions. Figure 3 shows the ground-floor layout, highlighting these adaptations.
To manage model complexity and account for limited design information, several simplifications were implemented. While the building features passive elements such as heat recovery systems, ground water cooling, and light pipes, the groundwater cooling system was excluded from the simulation to reduce model size and complexity. Incomplete design drawings necessitated a streamlined representation of the basement entrance. To reduce complexity, some interior partitions were merged into larger zones rather than modelling each small room or corridor separately. Architectural details like trim, mouldings, and minor design elements were omitted to streamline the model’s geometry. Rather than modelling exact frame sizes and mullion patterns, windows and doors were approximated as single-pane openings for ease of simulation. Figure 4 shows the IES VE model of the office building at the University of Nottingham, reflecting the structural adaptations and simplified design elements.
The construction materials and their thermal properties were integral to accurately modelling in IES VE. Table 2 provides a detailed breakdown of the materials used in the building’s construction, including components for external walls, internal partitions, glazing, roof, doors, and floors.
To inform the heating operation profile, the boiler unit values were first examined. Figure 5 presents the actual daily boiler unit value usage in the case study building over the period from 1 to 18 November, distinguishing between weekdays (blue bars) and weekends (orange bars). The data reveal a consistent pattern of higher boiler energy consumption on weekdays, typically ranging between 450 and 650 kWh, which reflects increased occupancy and extended operating hours. In contrast, weekends show significantly lower usage—around 330 kWh during the first weekend, indicating reduced building activity. However, higher values during the second weekend (e.g., 470 kWh on 14 November) suggest that factors such as colder weather, occupant presence, or fixed setback heating schedules influenced boiler operation. The peak observed on 13 November (approximately 640 kWh) may be attributed to particularly low outdoor temperatures.
These patterns emphasise the importance of incorporating differentiated weekday and weekend schedules in baseline simulations and highlight the influence of environmental and occupancy variables on heating energy demand. Additionally, the consistent baseline load even during weekends points to the presence of continuous heating or domestic hot water requirements. Nevertheless, the dataset is limited to a short time frame and lacks concurrent weather data, making it difficult to isolate the impact of temperature from occupancy effects. This analysis provides context for validating simulation models and underscores the need to capture both schedule-based and occupant-driven behaviours to reduce the building energy performance gap.
It should be noted that the 18-day period was selected due to data availability and its relevance to heating season conditions in Nottingham, UK. It was the only continuous span with complete, high-resolution data from both the boiler meter and PIR-based occupancy sensors. During this time, outdoor temperatures ranged between 4 °C and 17 °C, allowing assessment of model performance under a range of heating demands. While the timeframe limits seasonal generalizability, it served the study’s aim of demonstrating the impact of integrating ABM with BPS during a heating-dominant period.
In IES VE, the default temperature settings follow CIBSE Guide A, which recommends an operative temperature of 21–23 °C for office spaces during winter. Accordingly, a heating setpoint of 22.5 °C was assigned to all office rooms in this study. Internal heat gains—generated by occupant metabolism, lighting, and plug-in equipment—also have a substantial impact on the thermal environment and the building’s overall energy demand. Values for these gains were taken from a prior investigation of the same building, which quantified sensible and latent contributions from occupants and equipment under typical operating conditions [33].
Table 3 summarises the internal-gain assumptions used in the model, listing sensible and latent loads for occupants as well as heat gains from lighting and equipment at several occupant-density levels.
As mentioned previously, the default window- and blind-control rules in IES VE are deterministic. These assume that occupants will take specific actions once certain temperature or irradiance thresholds are reached, without accounting for individual preferences or variability in behaviour. For the window, the software employs a ramp function, represented as:
ramp(ta, 22.5, 0, 26, 1)
where ta is indoor air temperature (°C). The function outputs 0 when ta ≤ 22.5 °C and 1 when ta ≥ 26 °C, linearly interpolating in between; in practice, this is interpreted as windows starting to open at 22.5 °C and reaching the fully-open position by 26 °C.
For blinds, the control is defined by:
gt(ii, 250, 100)
with ii representing incident irradiance (W/m2). In IES VE, the gt operator returns a fractional value that rises from 0 at 250 W/m2 to 1 when ii exceeds 250 + 100 = 350 W/m2. Thus, the blinds begin to lower once irradiance surpasses 250 W m−2 and are fully closed by 350 W m−2, implicitly assuming occupants act solely to control glare or direct sunlight. These default settings provide a baseline scenario in which windows and blinds respond only to temperature or solar irradiance, respectively. While straightforward to implement, such deterministic models may oversimplify occupant interactions, neglecting other factors that influence real-world adaptive behaviours.

3.4. Behavioural Modelling

The behavioural decision model developed for this study primarily addresses the operation of windows and blinds. By concentrating on these adaptive behaviours, the model aims to capture occupant-driven variations that significantly impact indoor thermal conditions and energy use.
While simpler rule-based control algorithms, such as those in EnergyPlus’s Energy Management System (EMS), can simulate basic occupant actions like window opening based on temperature, they often fail to capture the complexity and variability of real-world behaviours. This study adopted ABM to explicitly represent individual differences—such as clothing, metabolic rate, and comfort thresholds—as well as occupant interactions in shared spaces. In office settings, where group dynamics strongly influence adaptive behaviours, ABM offers a more realistic and flexible approach to modelling occupant-driven adjustments, helping to better address the BEPG.

3.4.1. Setup of the Model

The model is designed to predict how occupants interact with the outdoor thermal environment and with one another, incorporating factors such as clothing levels and metabolic rates. These variables affect window and blind operations in each room individually, generating operation profiles that are later integrated into BPS. Rooms not used as offices—such as kitchens and restrooms—were excluded from the ABM due to insufficient data on how adaptive behaviours might manifest in these spaces.
Specifically, the model simulates a “discussion” among occupants, where agents individually evaluate their thermal comfort states—calculated based on personalised variables such as clothing insulation (clo) and metabolic rate (met)—and then collectively determine whether to engage in adaptive behaviours like opening windows or adjusting blinds. Occupants are assigned varying comfort preferences to represent individual diversity realistically. Those with significant deviations from baseline comfort are categorised as “low-environment-tolerant”, indicating a higher likelihood to initiate adaptive behaviours. In contrast, occupants with comfort levels near baseline are considered “high-environment-tolerant” and less inclined to alter their environment.
Interaction among occupants is explicitly modelled through assigning each occupant an “occupancy discussion” value, reflecting their likelihood to advocate for environmental adjustments. Low-environment-tolerant occupants receive lower values (indicating stronger motivation to alter their environment), while high-environment-tolerant occupants receive higher values (reflecting reluctance to change). Individual discussion values within a room are averaged to simulate a collective decision-making process. If this averaged “discussion” value surpasses a calculated probability threshold (based on indoor and outdoor conditions), occupants collectively decide whether to open windows or adjust blinds. This modelling explicitly captures individual agent interactions and collective decisions, aligning with core ABM principles.
Table 4 summarises the primary variables in the ABM model, including room identifiers, occupant attributes, and global environmental parameters. Variables are classified as static or dynamic depending on whether they remain constant (e.g., room capacity) or evolve over time (e.g., occupancy schedule).
In the initial setup, rooms, windows, and blinds were established independently. Because the model is not spatially oriented in precise dimensions, each of the five rooms was defined with identical grid sizes rather than their real-world layouts or dimensions. Windows and blinds were then assigned to each room according to predetermined characteristics, as shown in Table 5.
Within the model, “occupants” are represented as autonomous agents assigned to specific rooms. Their number is determined by the following equation:
Occupants = room capacity × occupancy-schedule
Here, room capacity indicates the maximum number of occupants allowable in a given room (e.g., 2 for individual offices and 8 for open-area offices), while the occupancy schedule is derived from IES VE and indicates the proportion of occupancy expected at any given time. Once generated, occupants are placed in their respective rooms, and occupant counts are dynamically updated to reflect real-time conditions.

3.4.2. Principles of the Model

The overall structure of this occupant behaviour model is guided by the Contextual, Occupancy, and Building (COB) framework, as illustrated in Figure 6. This framework underpins the coordination between environmental conditions (e.g., temperature, solar radiation), occupant attributes (e.g., clothing, metabolic rate), and building factors (e.g., room capacity, layout).
The probabilities governing window and blind operations are primarily based on logit regressions. For window openings, the model uses [34]:
logit(pw) = 0.171Top + 0.166Tout − 6.4
where Top is the operative temperature (°C) in a room and Tout is the outdoor temperature (°C). A ± 2 K deadband around the setpoint temperature (22.5 °C in this study) indicates that if Top is within 2 K of 22.5 °C, the likelihood of opening windows remains low; otherwise, the above equation determines the probability.
Occupants’ decisions to raise or lower blinds are also determined using logit regressions [17]. For instance, the probability of raising blinds (p) is modelled as:
logit(p) = −3.424 + 0.018 × Sal
logit(p) = −3.170 + 0.002 × Sr
For lowering the blinds, the logistic regression equations are:
logit(p) = −3.446 + 0.019 × Sal
logit(p) = −3.330 + 0.003 × Sr
where Sal represents the solar altitude angle of the sun, and Sr represents the solar radiation. These equations help quantify how occupants respond to varying sunlight conditions.
Beyond environmental parameters like outdoor temperature, occupant comfort also depends on personal factors, including clothing and metabolic rate [35]. Clothing insulation (clo) values range between roughly 0.8 and 1.0 in office contexts, with each 1 clo shift equating to a ±6 K perceived change in temperature. Similarly, metabolic rate (met) can influence occupants’ subjective warmth or coolness. Incorporating these personal variables ensures that the model captures a wider spectrum of adaptive behaviours, reflecting both environmental and individual differences that affect decisions on window and blind adjustments.
In the original building simulation, an operative temperature of 22.5 °C was universally applied in all office rooms. However, personal factors—such as clothing (clo) and metabolic rate (met)—can shift perceived temperatures for individual occupants. Recognising this, the present model assigns a random clothing value between 0.8 and 1.0 to each occupant, reflecting variations in how individuals dress and their resulting thermal comfort. Table 6 outlines the recommended winter comfort criteria for offices, including customary operative temperatures, activity levels, and clothing insulation values for general, small, and open-plan office environments.
Metabolic heat production (met) encompasses heat generated by the human body during various activities, with higher activity levels raising an individual’s perceived temperature. For instance, an individual sitting quietly at 1.0 met might be comfortable at 24 °C, but performing a light filing task at 1.2 met could lower their comfort point to around 22.8 °C. In office settings, met values typically vary between 0.7 (e.g., resting) and 2.0 (e.g., walking), paralleling the impact of clo in that an increase or decrease of 1 met roughly corresponds to a ±6 K shift in perceived temperature. Table 7 outlines the typical metabolic rates for various office activities, ranging from 0.7 met for resting (e.g., sleeping) to 3.8 met for higher-intensity tasks such as walking at 1.8 m/s, highlighting the variation in energy expenditure based on activity level.

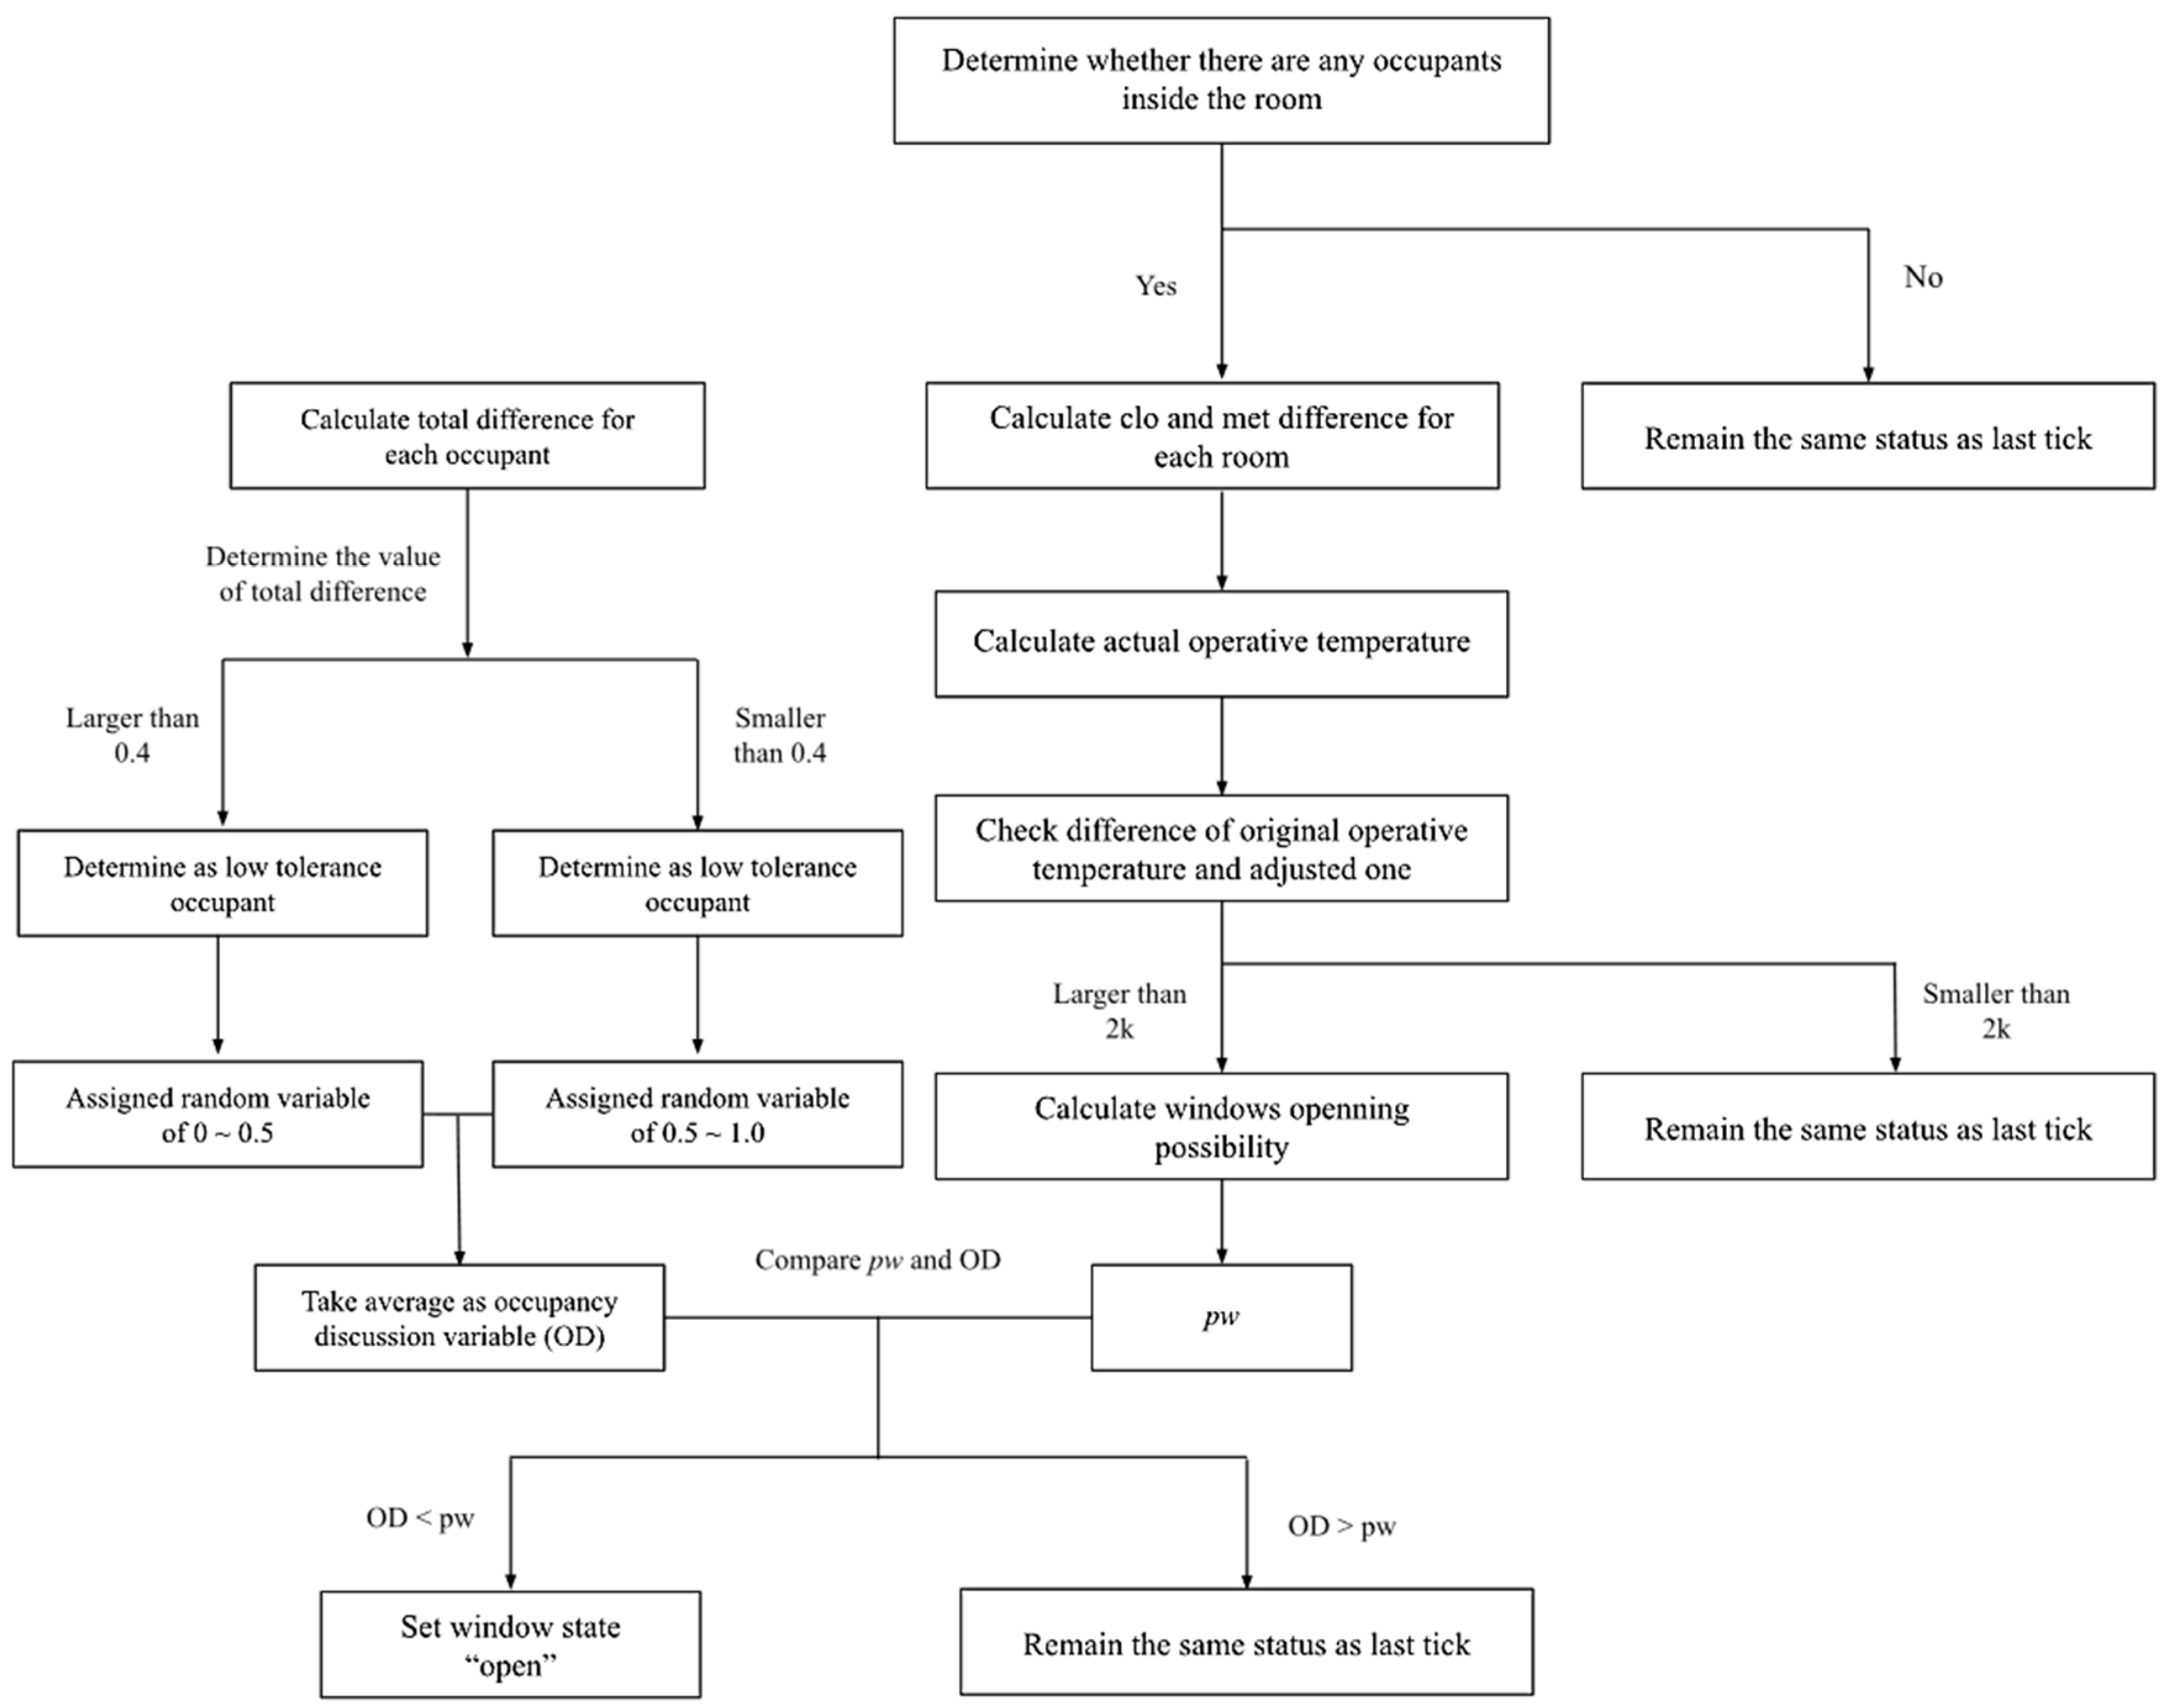
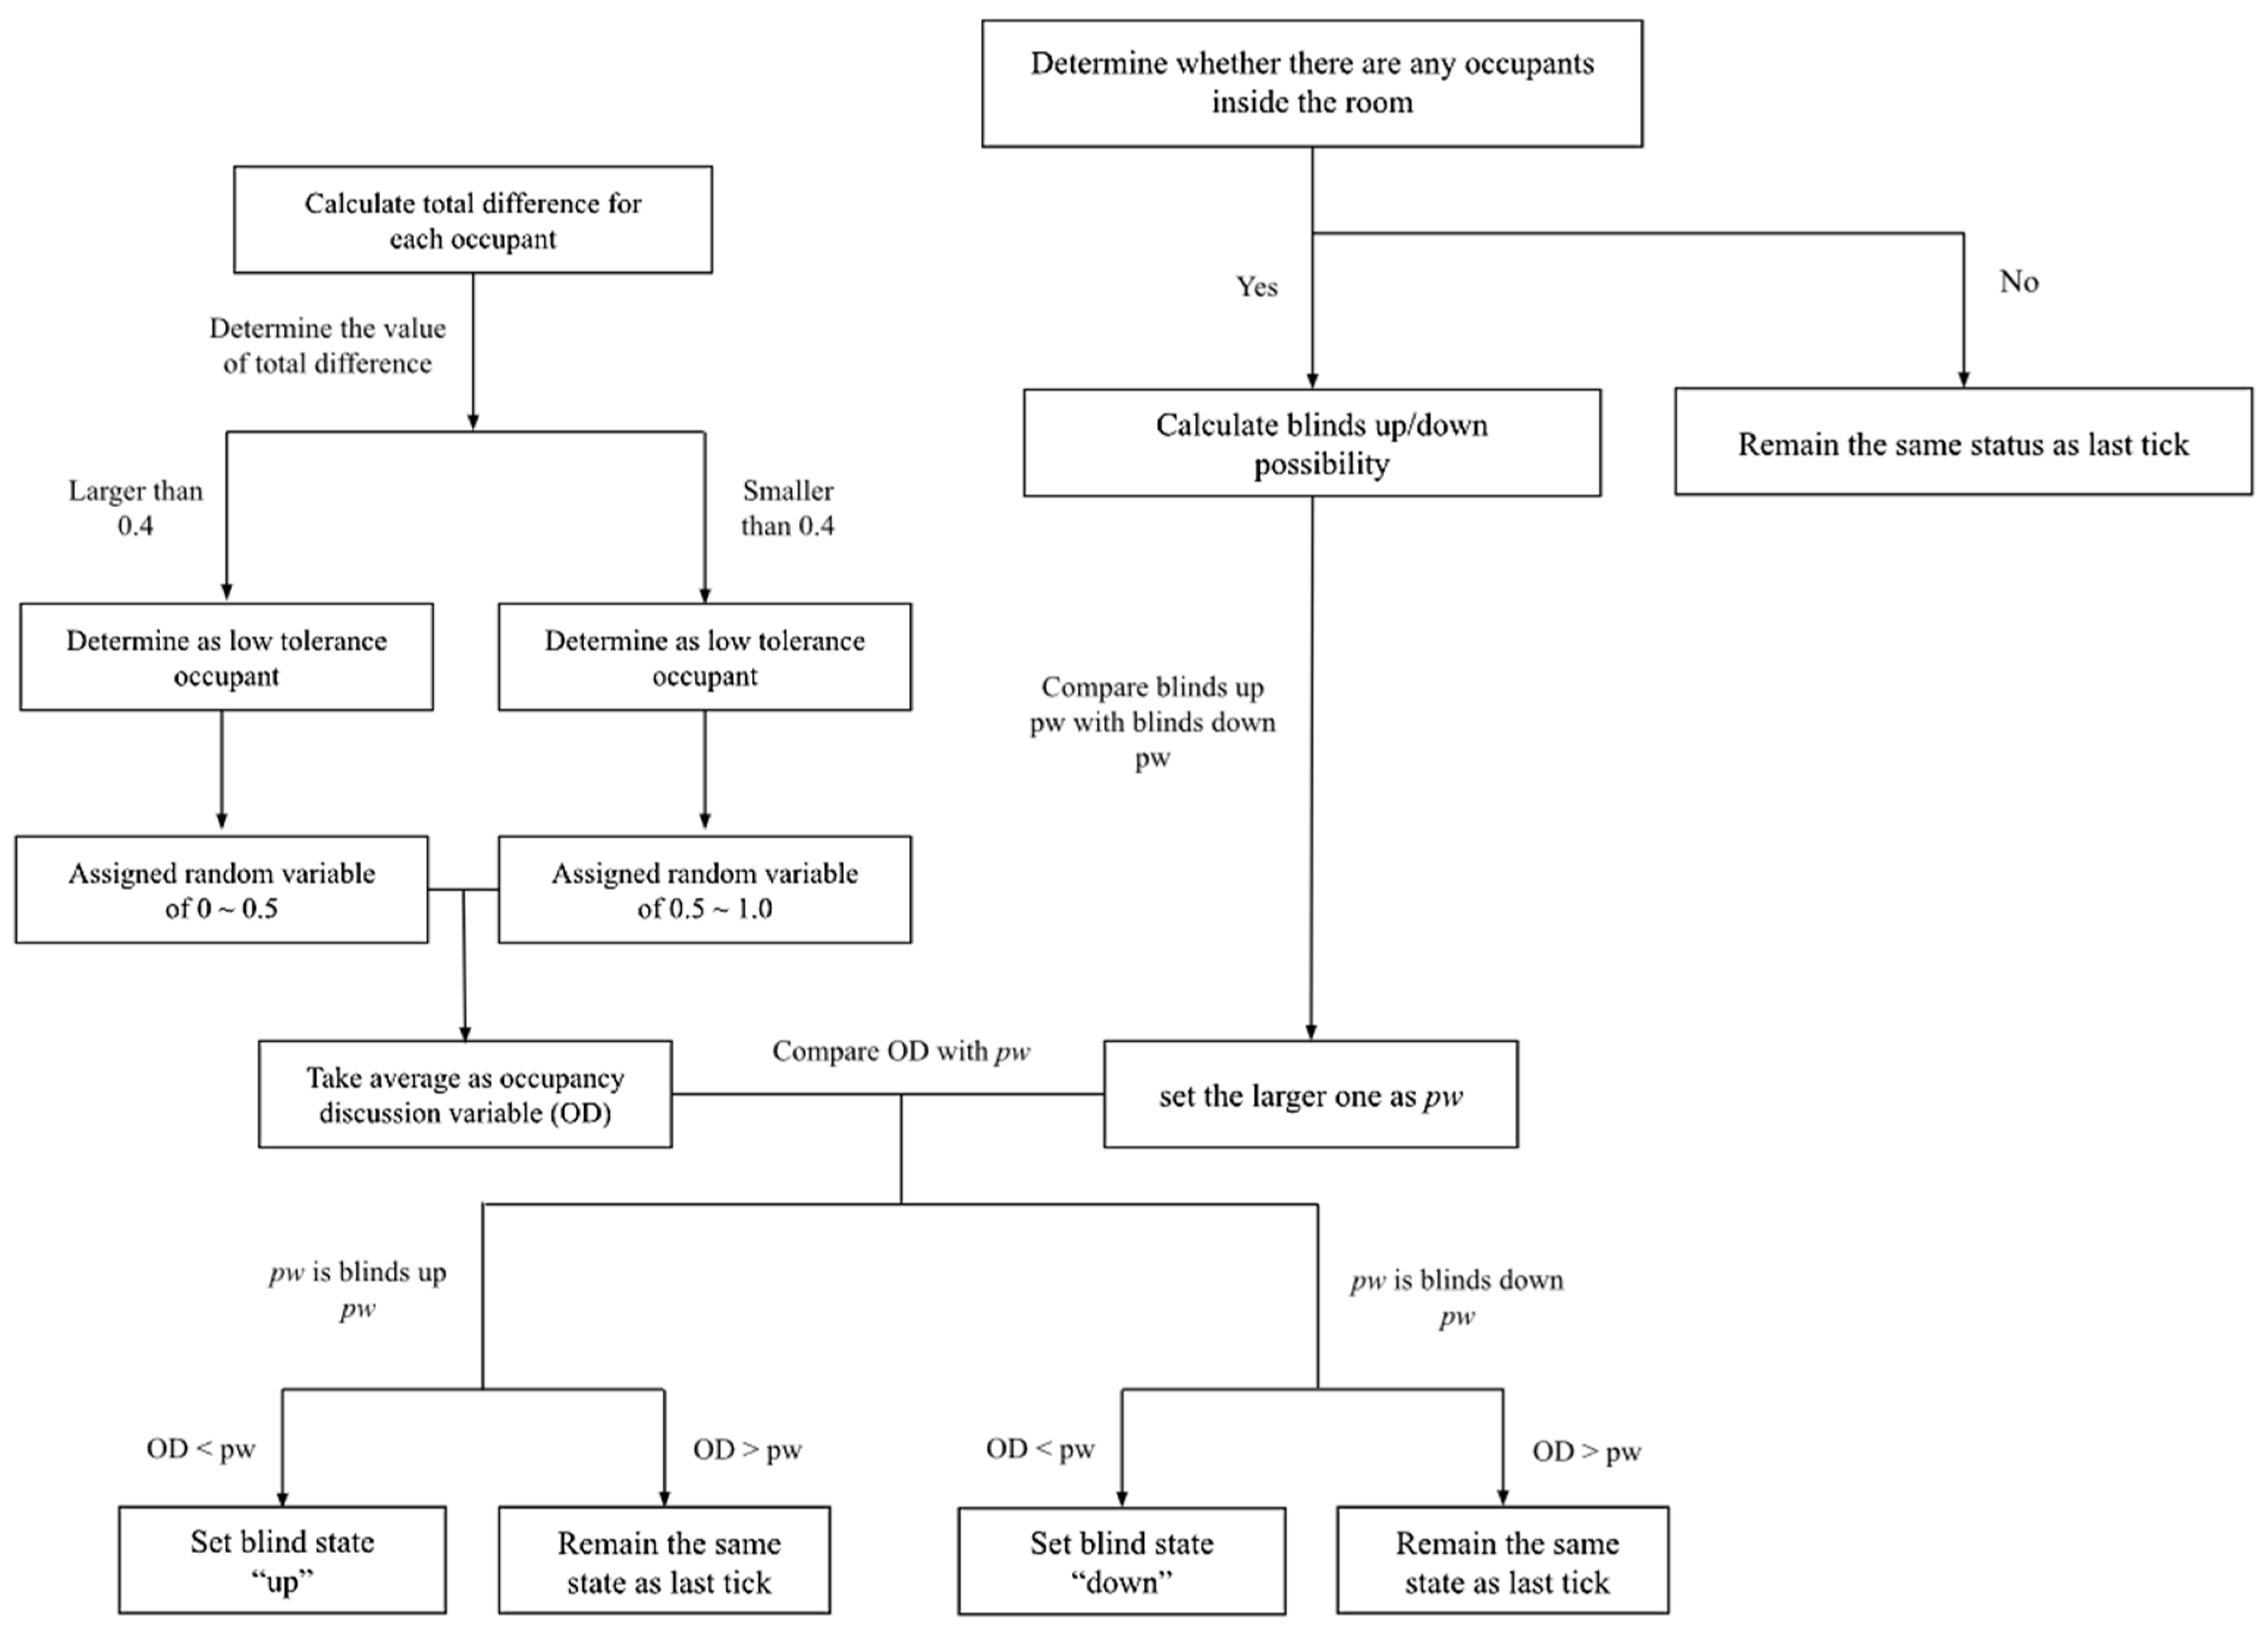
3.4.3. Decision-Making Procedures of the Model

Figure 7 illustrates the workflow by which occupants decide whether to open windows. The model first evaluated whether each room was occupied. If a room was unoccupied, the window state remained unchanged from the previous state. However, if occupants were present, the model proceeded to the next step, which involved calculating the differences in clothing insulation and metabolic heat production compared to standard values. Specifically, the clothing difference for each room ( c l o r o o m _ d ) was calculated by averaging the clothing values of all occupants and subtracting the baseline value of 0.9. Similarly, the metabolic heat production difference ( m e t r o o m _ d ) was determined by averaging the metabolic heat values of all occupants and subtracting the standard value of 1.2. The calculations are represented by the following equations:
c l o r o o m _ d = n c l o o c c u p a n t n 0.9
m e t r o o m _ d = n m e t o c c u p a n t n 1.2
In these equations, c l o r o o m _ d represents the clothing difference for the room, while m e t r o o m _ d refers to the metabolic heat production difference. The variables c l o o c c u p a n t and m e t o c c u p a n t correspond to the individual clothing and metabolic heat production values assigned to each occupant.
The next step involved adjusting the operative temperature for each room. The actual operative temperature ( t o p _ a c t u a l ) was determined by subtracting the combined clothing and metabolic differences from the baseline operative temperature ( t o p ), set at 22.5 °C. This adjustment was scaled by a factor of 6 K:
t o p _ a c t u a l = t o p c l o r o o m d + m e t r o o m d × 6 K
The model then evaluated the difference between the baseline operative temperature and the adjusted temperature. If this difference exceeded 2 K, the model calculated the probability of window opening, denoted as pw. If the difference was 2 K or less, the window state remained unchanged. For each occupant in the room, the model also calculated their individual clothing and metabolic differences:
c l o o c c u p a n t _ d = c l o o c c u p a n t 0.9
m e t o c c u p a n t _ d = m e t o c c u p a n t 1.2
d i f f e r e n c e o c c u p a n t = c l o o c c u p a n t _ d + m e t o c c u p a n t _ d
In these formulas, c l o o c c u p a n t _ d and m e t o c c u p a n t _ d represent the individual differences in clothing and metabolic heat production, respectively, while d i f f e r e n c e o c c u p a n t denotes the combined thermal difference for each occupant.
To incorporate agent-level interactions—a key characteristic of ABM—this model simulates a simplified consensus-based decision process within each room. Occupants classified as either high- or low-environment-tolerant engage in implicit negotiation by contributing individual “discussion values” that reflect their likelihood to advocate for environmental adjustment. These values are aggregated to determine a collective group decision. This simulates indirect interaction and negotiation among occupants, representing how group decisions in shared offices are influenced by differing comfort perceptions and individual tendencies. While not based on verbal communication, this consensus mechanism captures the heterogeneity and interdependence of agents, distinguishing the model from aggregate or deterministic approaches.
Based on the total difference ( d i f f e r e n c e o c c u p a n t ), occupants were categorised into two groups: high-environment-tolerant and low-environment-tolerant, using a threshold value of 0.4. This threshold was derived from a Python (version 3.12)-based experiment, which indicated that occupants with a total thermal difference exceeding 0.4 were more likely to feel discomfort, while those with differences below 0.4 were generally comfortable. Figure 8 illustrates the distribution of total thermal differences among occupants, reinforcing the assumption that a threshold of 0.4 serves as a reliable indicator of comfort levels.
It was assumed that low-environment-tolerant occupants were more likely to feel discomfort and, as a result, might take actions involving windows or blinds. To simulate the decision-making process for window operations, low-environment-tolerant occupants were assigned a random discussion value ranging between 0 and 0.5, while high-environment-tolerant occupants received a value between 0.5 and 1.0. These values represented the likelihood of each occupant advocating for action. The discussion values of all occupants in a room were averaged to simulate a group decision-making process. This average discussion value was then compared with pw, the calculated probability of window opening. If the average discussion value was less than pw, the window state was updated to “open”; otherwise, it remained unchanged from the previous state.
The process for determining blind adjustments followed a similar approach to that used for windows, as shown in Figure 9. The model first checked whether the room was occupied. If no occupants were present, the state of the blinds remained unchanged from the previous tick. If occupants were present, the probabilities for raising or lowering the blinds were calculated based on two key factors: solar radiation and solar altitude.
The overall probabilities for raising ( p w for blinds up) and lowering ( p w for blinds down) were calculated as the averages of their respective logit probabilities:
p w b l i n d s _ u p = l o g i t p b l i n d s _ u p _ S a l + l o g i t p b l i n d s _ u p _ S r 2
p w b l i n d s _ d o w n = l o g i t p b l i n d s _ d o w n _ S a l + l o g i t p b l i n d s _ d o w n _ S r 2
Here, l o g i t p b l i n d s _ u p _ S a l represents the probability of raising the blinds based on solar altitude, and l o g i t p b l i n d s _ u p _ S r represents the probability based on solar radiation. Similarly, l o g i t p b l i n d s _ d o w n _ S a l and l o g i t p b l i n d s _ d o w n _ S r represent the probabilities of lowering the blinds based on solar altitude and solar radiation, respectively.
The model then compared the calculated probabilities for raising and lowering the blinds, with the higher value being selected as the action’s determining probability (pw). This pw value was further compared to the occupancy discussion (OD) variable, which had been calculated during the window operation decision-making process. If the OD value was smaller than pw, the action of raising or lowering the blinds was taken. Otherwise, the state of the blinds remained unchanged from the previous tick.
These agent-to-agent interactions are central to the model’s ability to replicate emergent behaviours, enabling more nuanced simulations of how shared spaces are managed by occupants with varying adaptive responses.

4. Results and Discussion

This section presents and compares simulation outcomes. To streamline the graphical representation, most results focus on Ground Floor Individual Office 2 for model-to-model comparisons, along with a comparison between Ground Floor Individual Office 2 and the Ground Floor Open-Area Office to illustrate occupant behaviour differences in individual versus open-area workspaces.

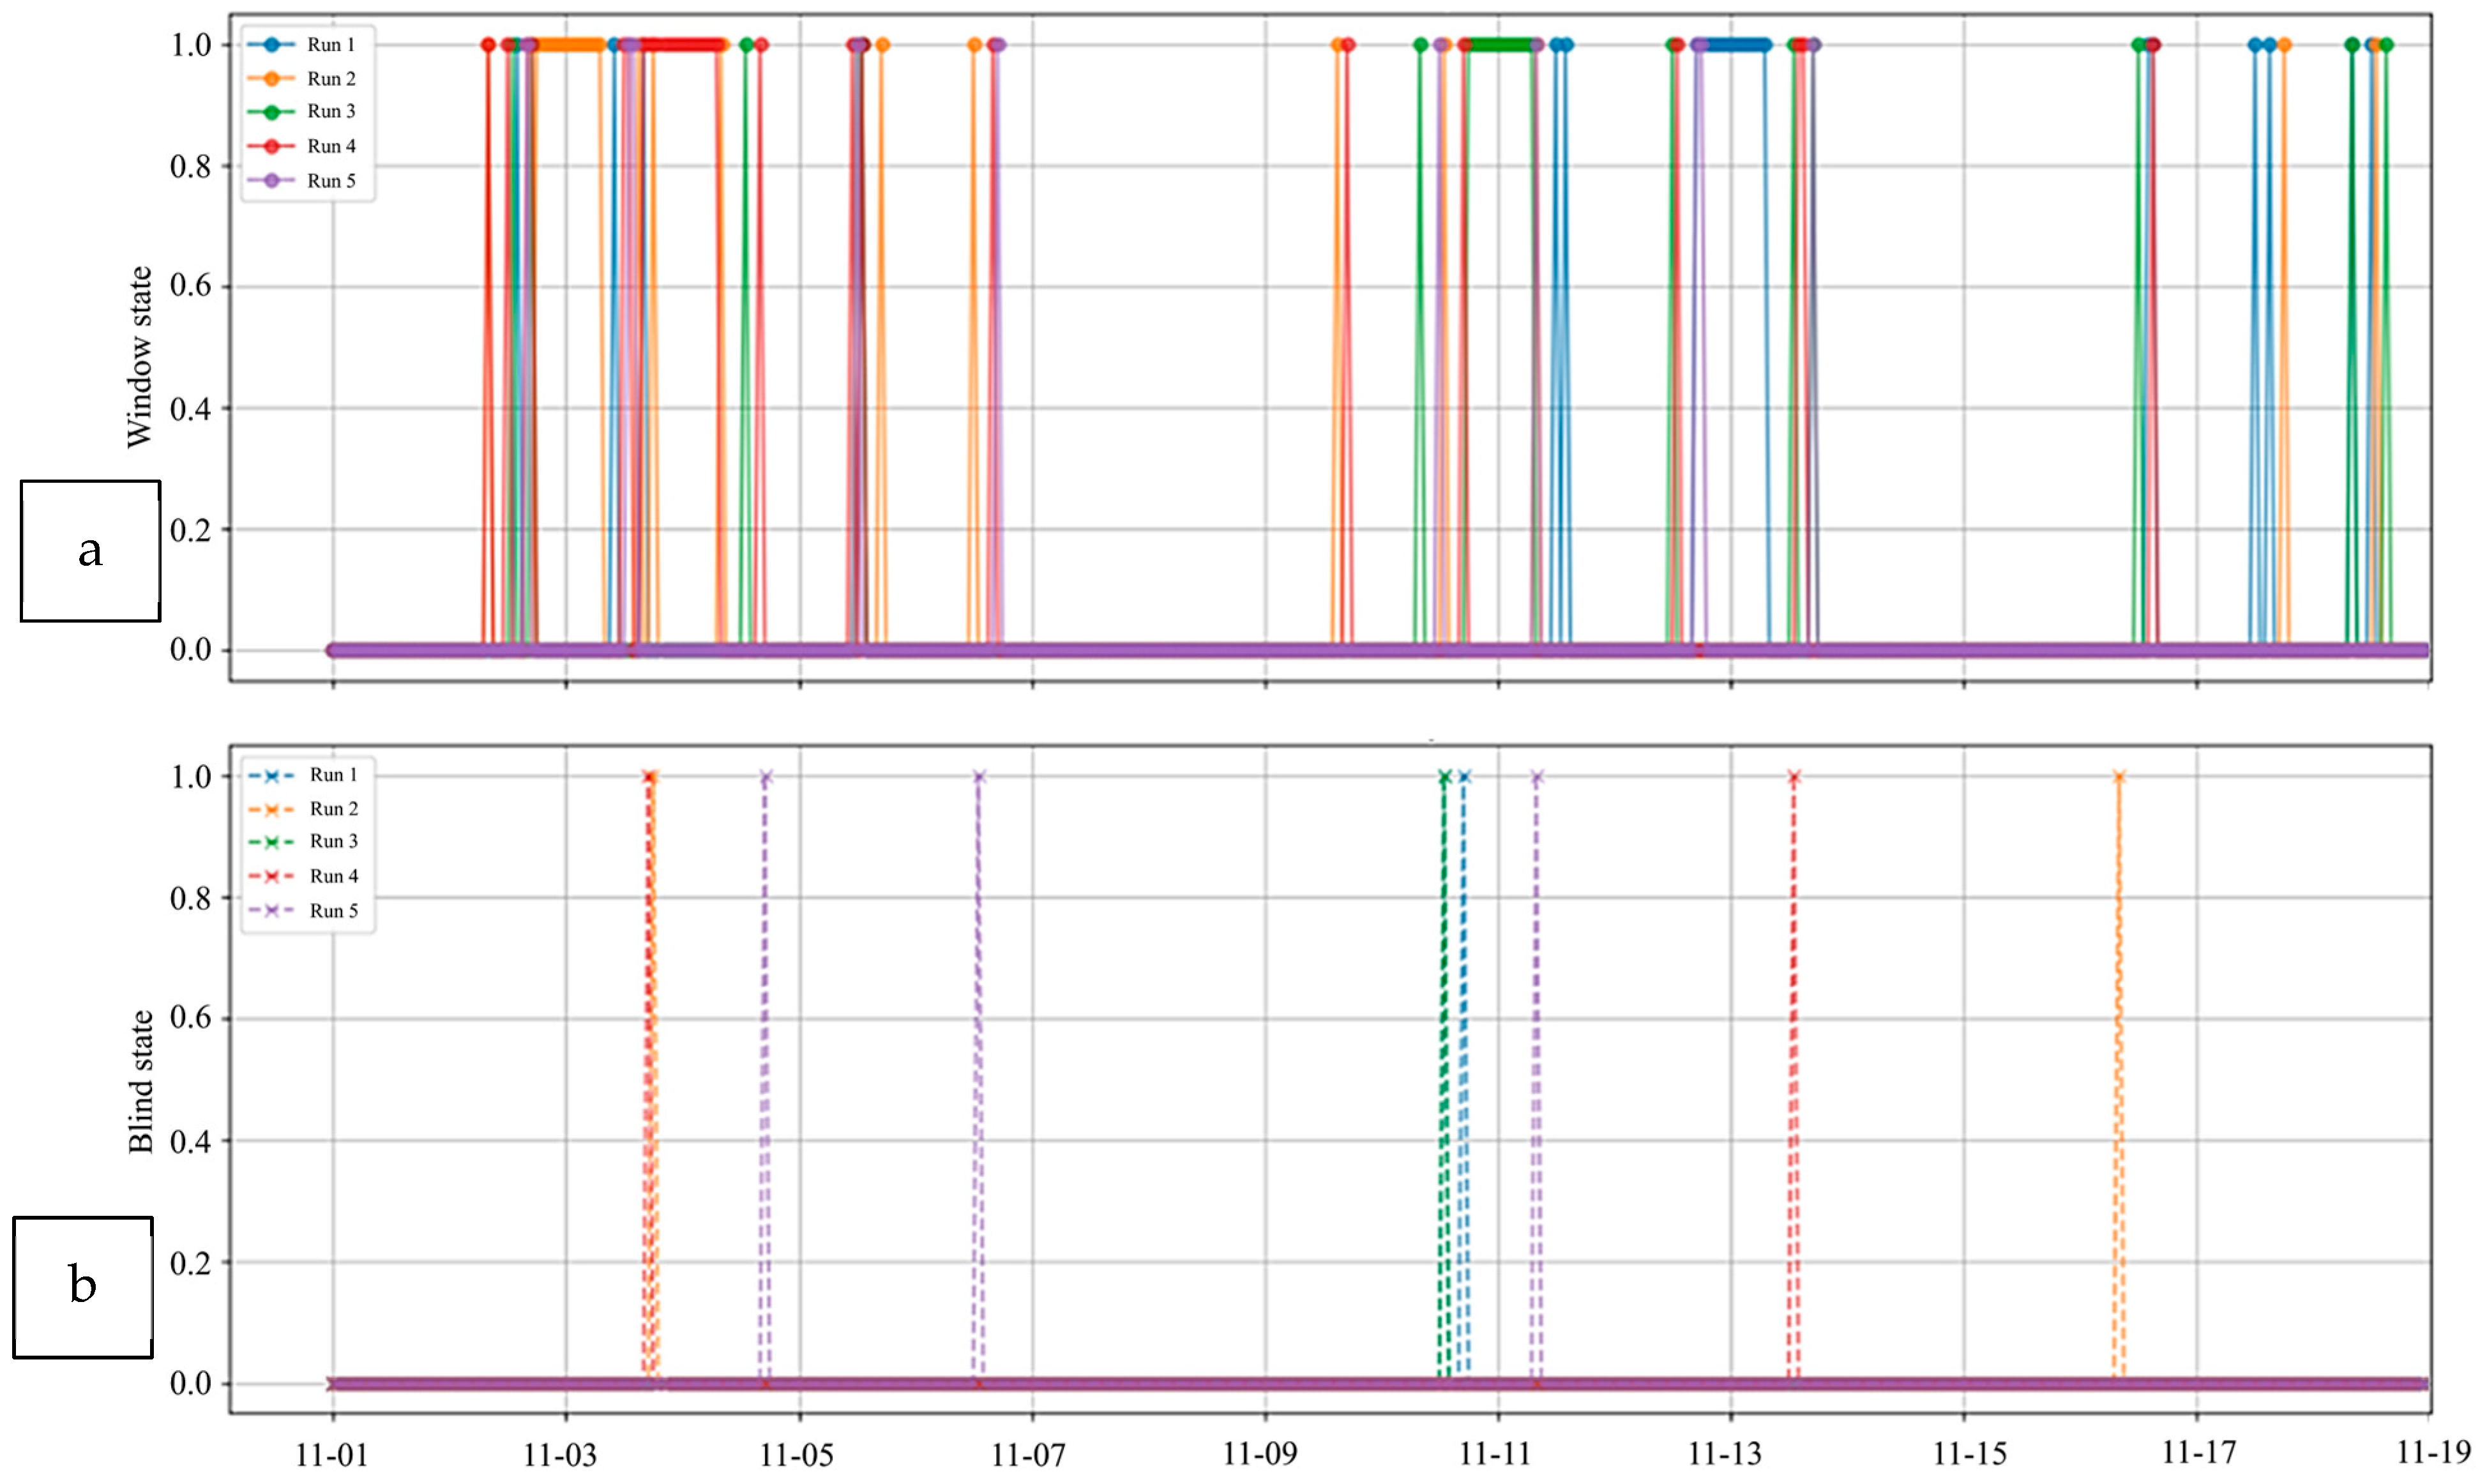
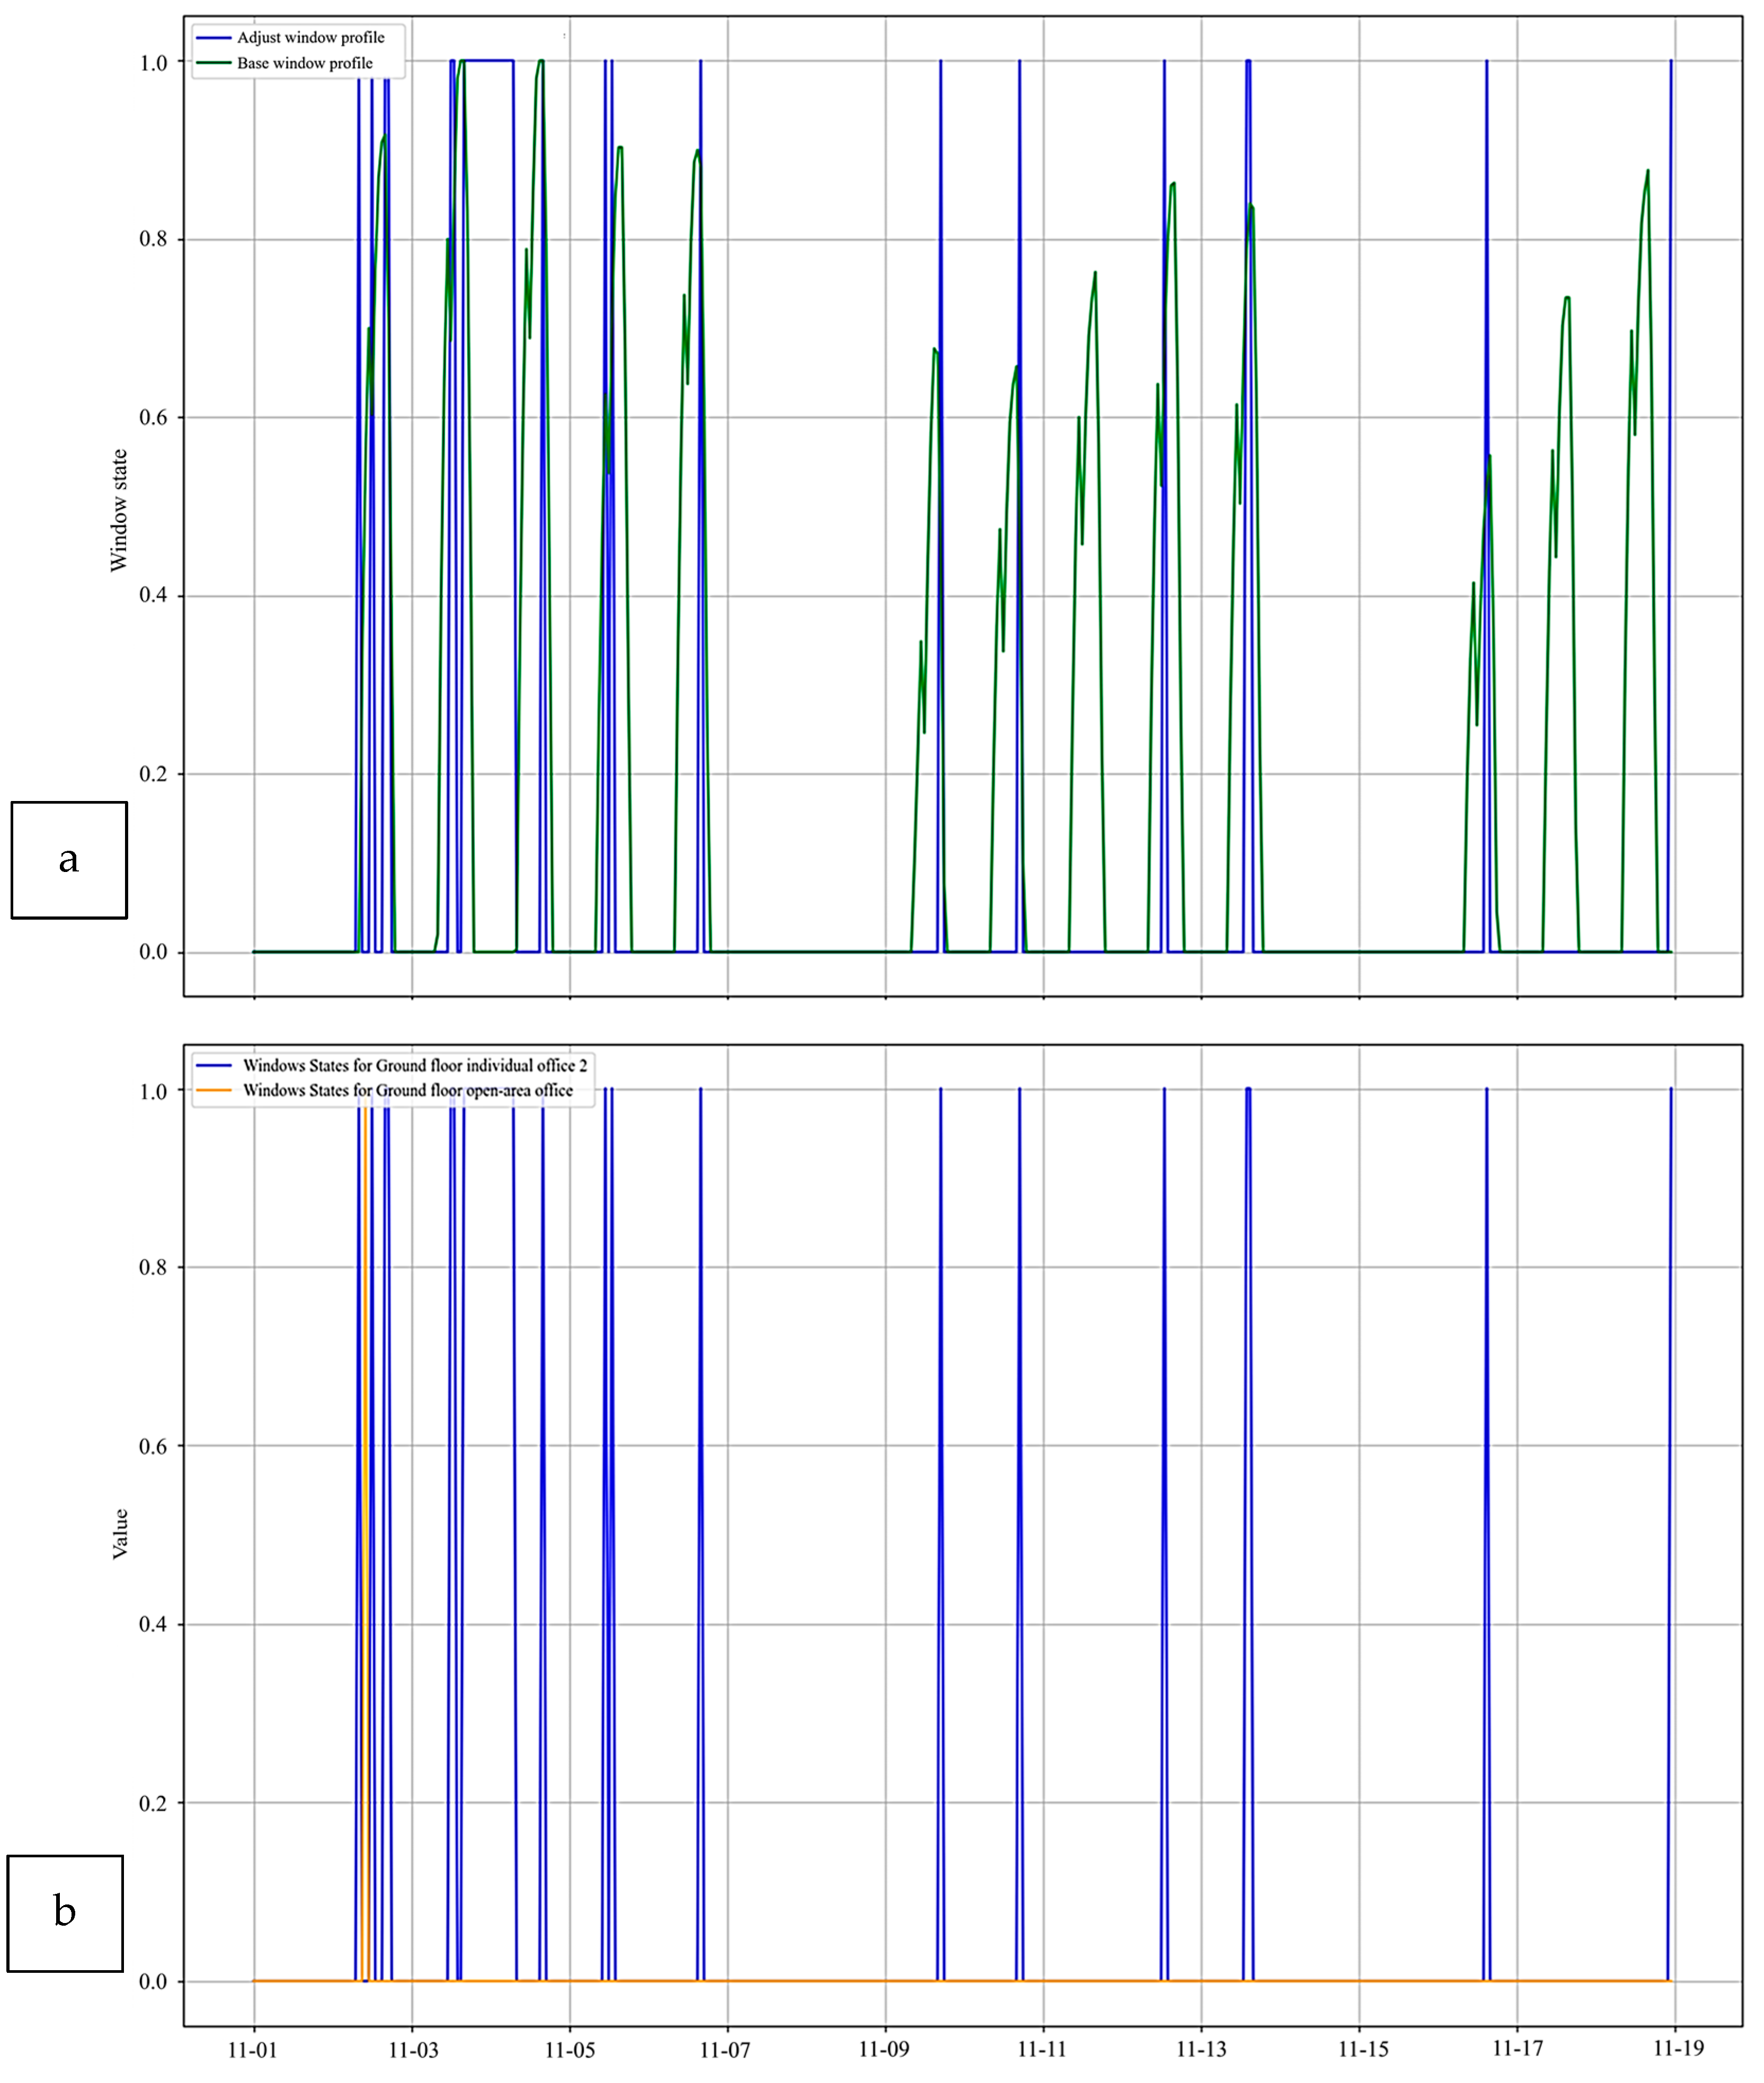
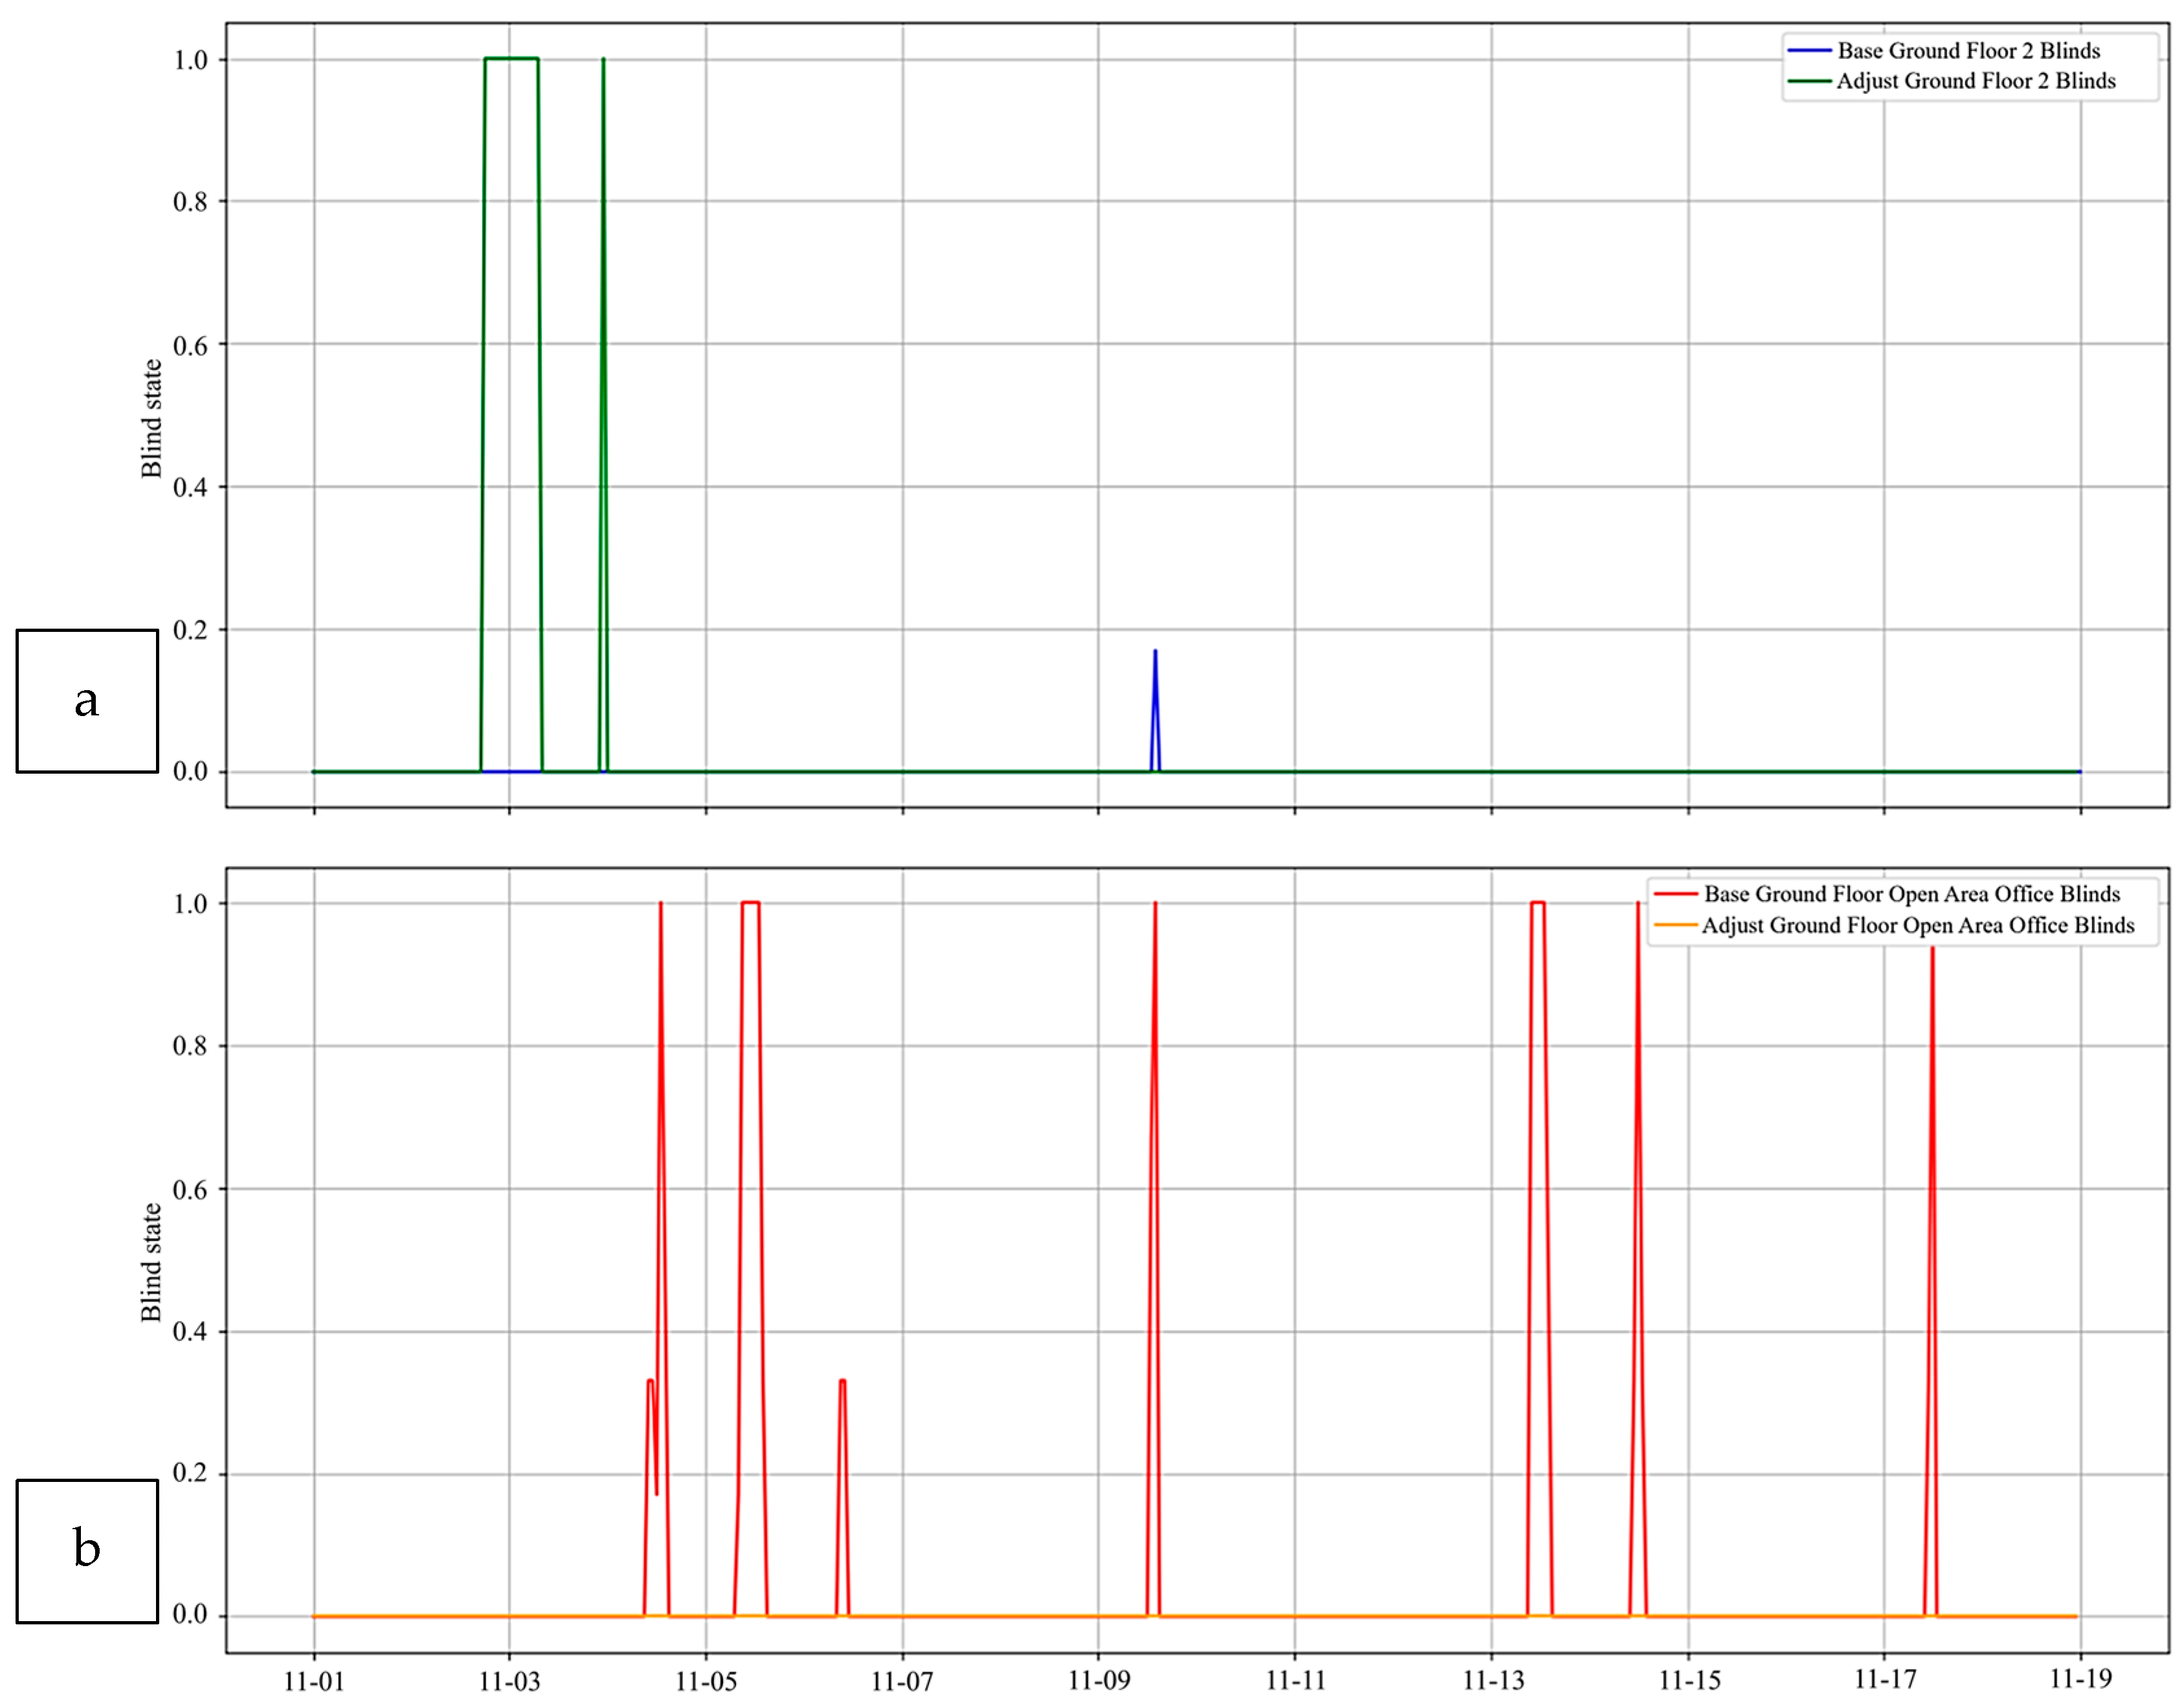
4.1. Comparisons of Windows and Blinds Profiles

Initially, the windows and blinds operation profiles from multiple ABM runs were evaluated. As shown in Figure 10, windows were operated more frequently than blinds. The frequency of window openings and blind lowering was relatively consistent across runs, except for Run 5, which showed a distinctly different pattern.
While window opening patterns overlapped considerably across runs, blind operations—particularly lowering—showed more variability. In this study, Run 4 was used to generate the Adjust model in IES VE. Figure 11 and Figure 12 illustrate the default (Base) versus ABM-driven (Adjust) profiles for windows and blinds, respectively. The Base model used a deterministic approach—windows opened whenever indoor temperatures exceeded 22.5 °C—resulting in more frequent window openings than in the Adjust model. Conversely, blinds were lowered more often in the Adjust model, which incorporated occupant comfort variables like clothing, metabolic rate, and a ±2 K temperature deadband, indicating that occupants did not react to temperature changes within that threshold.
Moreover, the Base model employed continuous values for window and blind states, with the proportion of open windows increasing steadily as temperature rose. The Adjust model, driven by logit regression, produced only binary outcomes for windows (open/closed) and blinds (raised/lowered), disregarding partial adjustments. A comparison of behaviour in individual offices versus open-area offices revealed fewer window and blind adjustments in the open-area configuration, which housed more occupants. This observation aligns with previous findings [18], suggesting that shared spaces may reduce the motivation or ability of individual occupants to enact environmental changes.

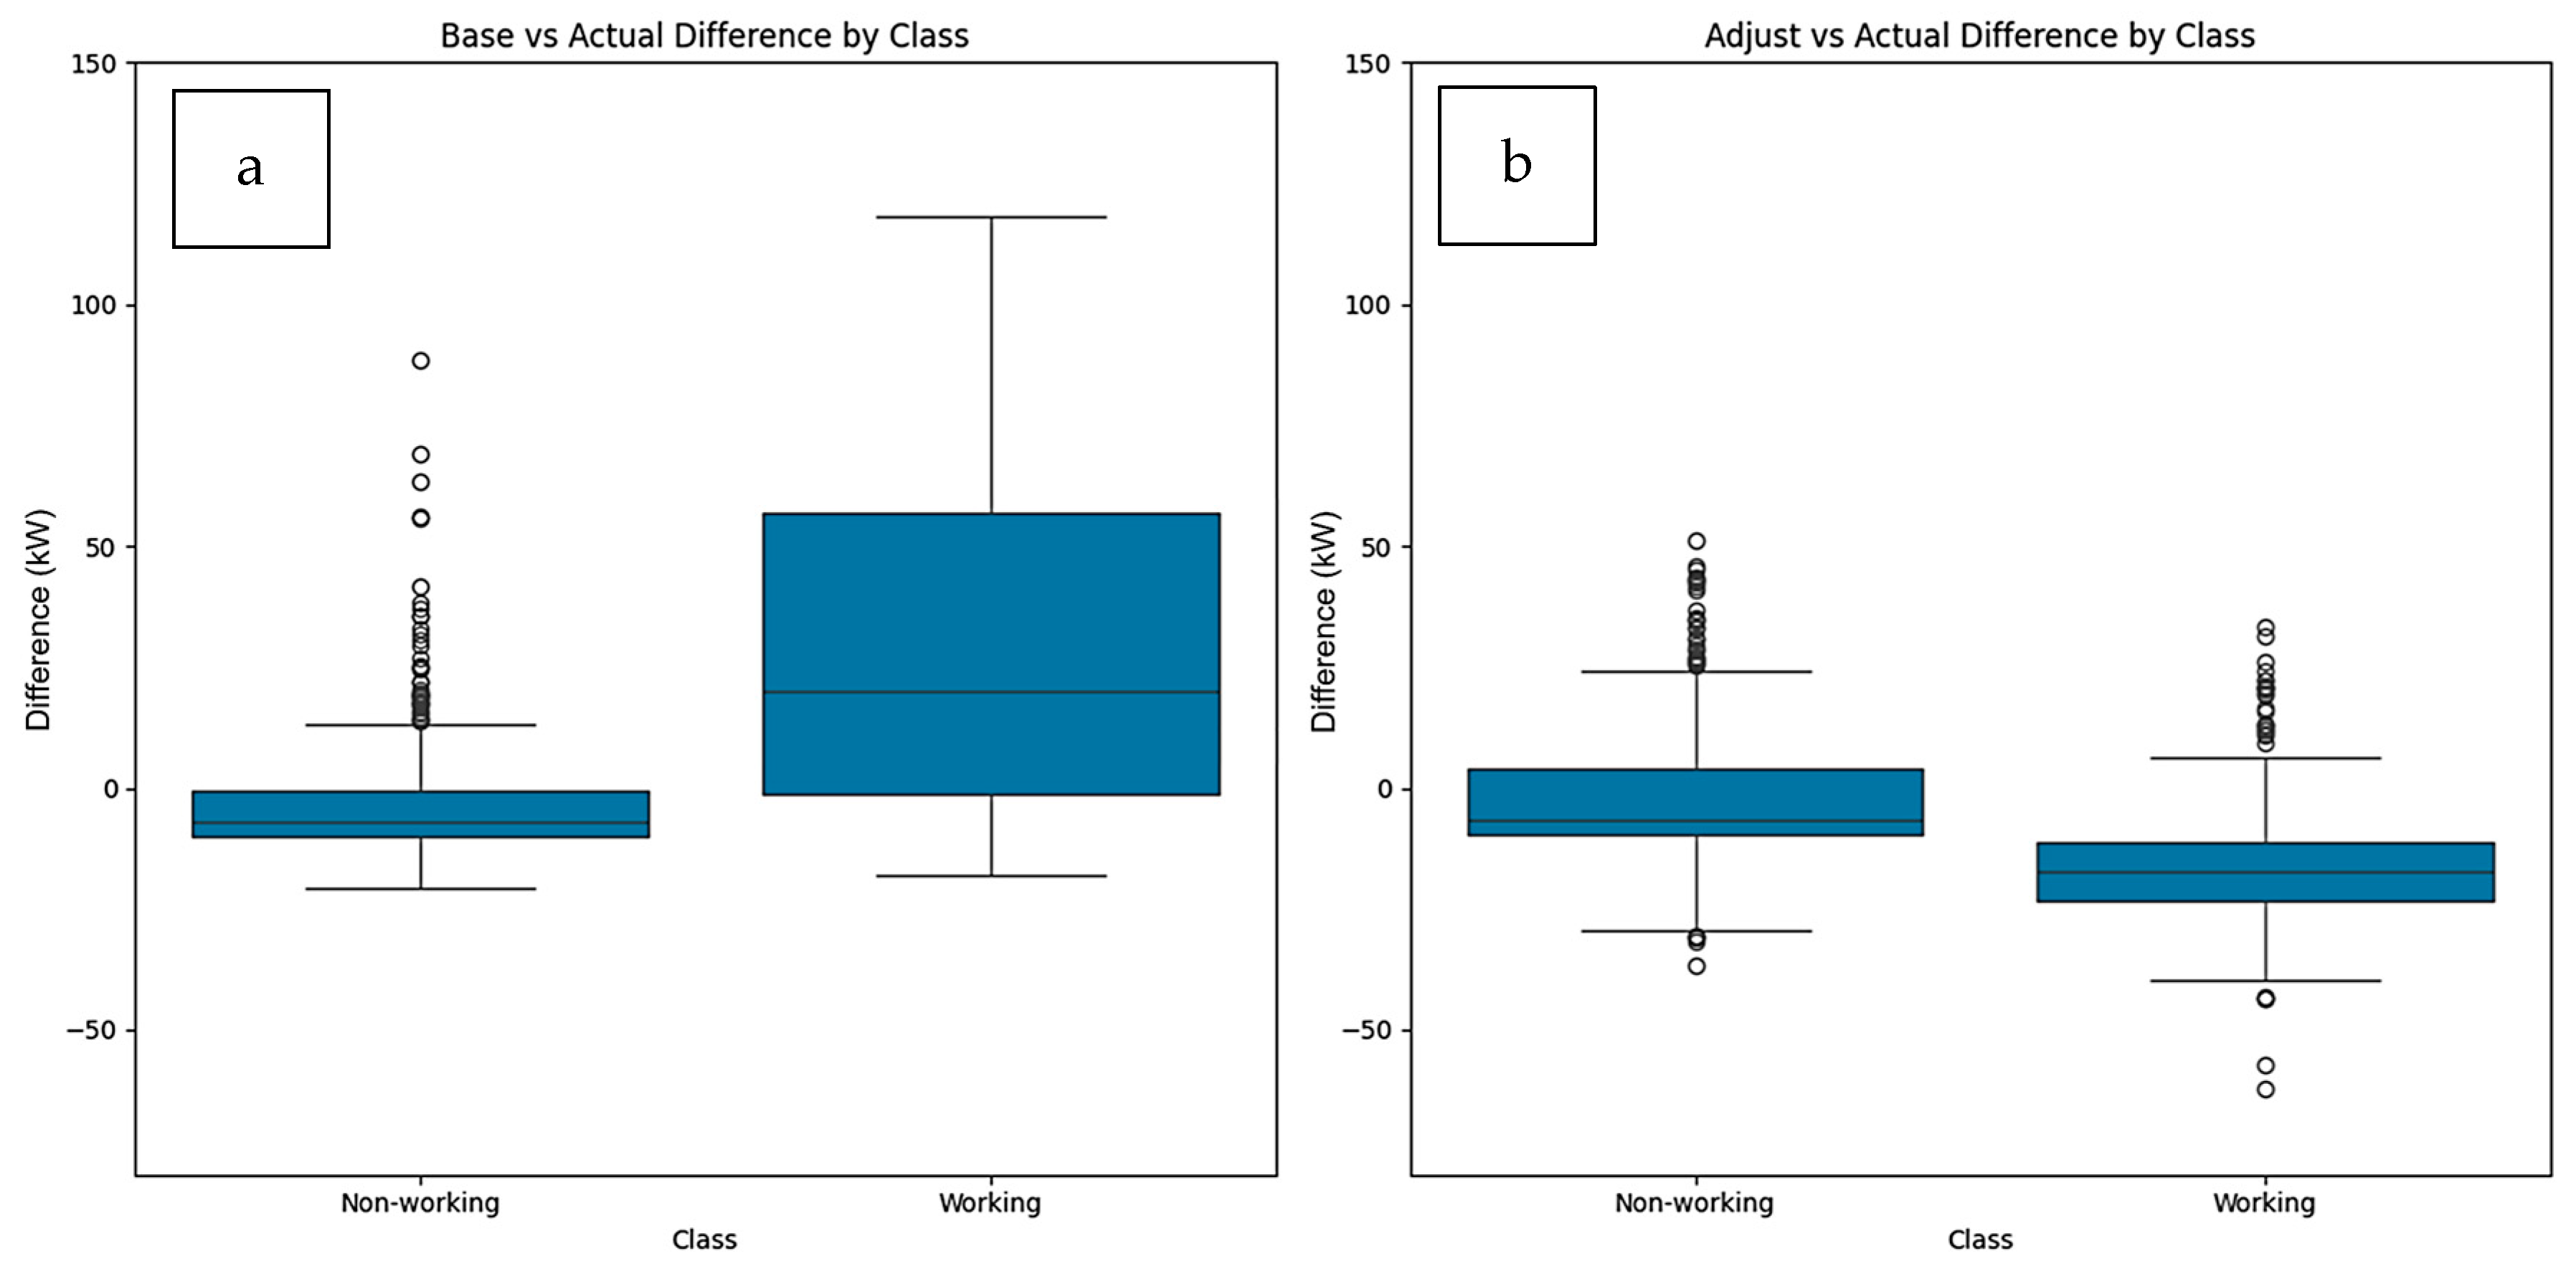
4.2. Overall Performance Comparisons Between Models

To evaluate how well occupant-driven profiles (developed through ABM) improve accuracy, the Adjust model’s windows and blinds settings were incorporated into IES VE, yielding predicted boiler unit values. Figure 13 illustrates a comparison of the Base model, the Adjust model, and actual boiler usage data from 1 November to 18 November.
In the Base scenario, the simulation produced 12.21 MWh of boiler energy against the metered 8.42 MWh—an over-prediction of +3.79 MWh (+45%). After occupant-adaptive profiles were introduced, the Adjust model output fell to 6.19 MWh, leaving a residual error of –2.23 MWh (–26%). Although the Adjust model now underestimates the bill, it more than halves the magnitude of the discrepancy compared with the Base case. This over-prediction in the Baseline contrasts with the under-prediction bias frequently reported in BEPG studies.
A closer look at the hourly usage data reveals further insights, as shown in Table 8. While both the mean squared error (MSE) and root mean squared error (RMSE) are lower for the Adjust model, there is still a notable discrepancy between the Adjust model’s predictions and real-world boiler usage.
To analyse hourly boiler usage, Figure 14 highlights the differences between the Base/Adjust model predictions and the actual boiler unit values. Red dots indicate “large differences”, identified as outliers in the discrepancies between predicted and actual values. These outliers were determined using the upper and lower bounds, calculated as follows:
Upper bound = Q3 + 1.5 × IQR
Lower bound = Q1 − 1.5 × IQR
Here, the interquartile range (IQR) represents the gap between the third quartile (Q3) and the first quartile (Q1). Any differences falling outside these bounds were classified as significant deviations between the simulated and actual boiler usage values.
The Base model exhibits considerable fluctuations in the difference between predicted and actual values, particularly around 3, 10, 11, and 17 to 19 November. These fluctuations indicate times when the predictions diverged significantly from the actual values, with multiple large deviations, represented by the red dots, pointing out that the Base model tends to generate outlier predictions, leading to substantial errors. In contrast, the Adjust model displayed more consistent performance, with smaller variations between predicted and actual values. While there were still some noticeable discrepancies on 3, 10, and 13 November, the overall error was lower than in the Base model. The lower number of red dots in the Adjust model signifies fewer large differences, making it a more reliable and accurate tool for predicting actual boiler usage.
Additionally, a comparison (Figure 15) of data during working and non-working hours reveals that the Base model generally overestimated actual values, particularly in working hours, with most of the differences being above zero. Moreover, the variance in working hours was much greater than in non-working hours, indicating lower stability in predictions. Although the Base model’s predictions were closer to actual values in non-working hours, many outliers were still present. In contrast, the Adjust model offered more consistent and reliable predictions, with differences closer to zero across both working and non-working hours, exhibiting less variability and fewer outliers. Overall, while the Base model performed somewhat better during non-working hours, the Adjust model proved to be more stable and accurate throughout both time periods.
The Base model exhibits pronounced fluctuations between predicted and actual values, especially around 3, 10, 11, and 17–19 November, indicating substantial deviations from real-world data. Multiple large differences, highlighted by red dots, reveal frequent outlier predictions and significant errors during these intervals. In contrast, the Adjust model demonstrates more stable performance, featuring smaller discrepancies between predicted and actual usage. Although some deviations occur around 3, 10, and 13 November, overall errors remain less severe compared to the Base model, as evidenced by the fewer red dots indicating outliers.
Further analysis categorises results into working and non-working hours. During working hours, the Base model generally overestimates usage, with a higher variance that signals less reliable predictions. Although its estimates align somewhat better with actual values in non-working hours, many outliers persist. Conversely, the Adjust model delivers consistent performance across both time categories, exhibiting lower variability and fewer outliers. Consequently, while the Base model may improve slightly when occupancy is lower, the Adjust model ultimately offers greater accuracy and stability overall.

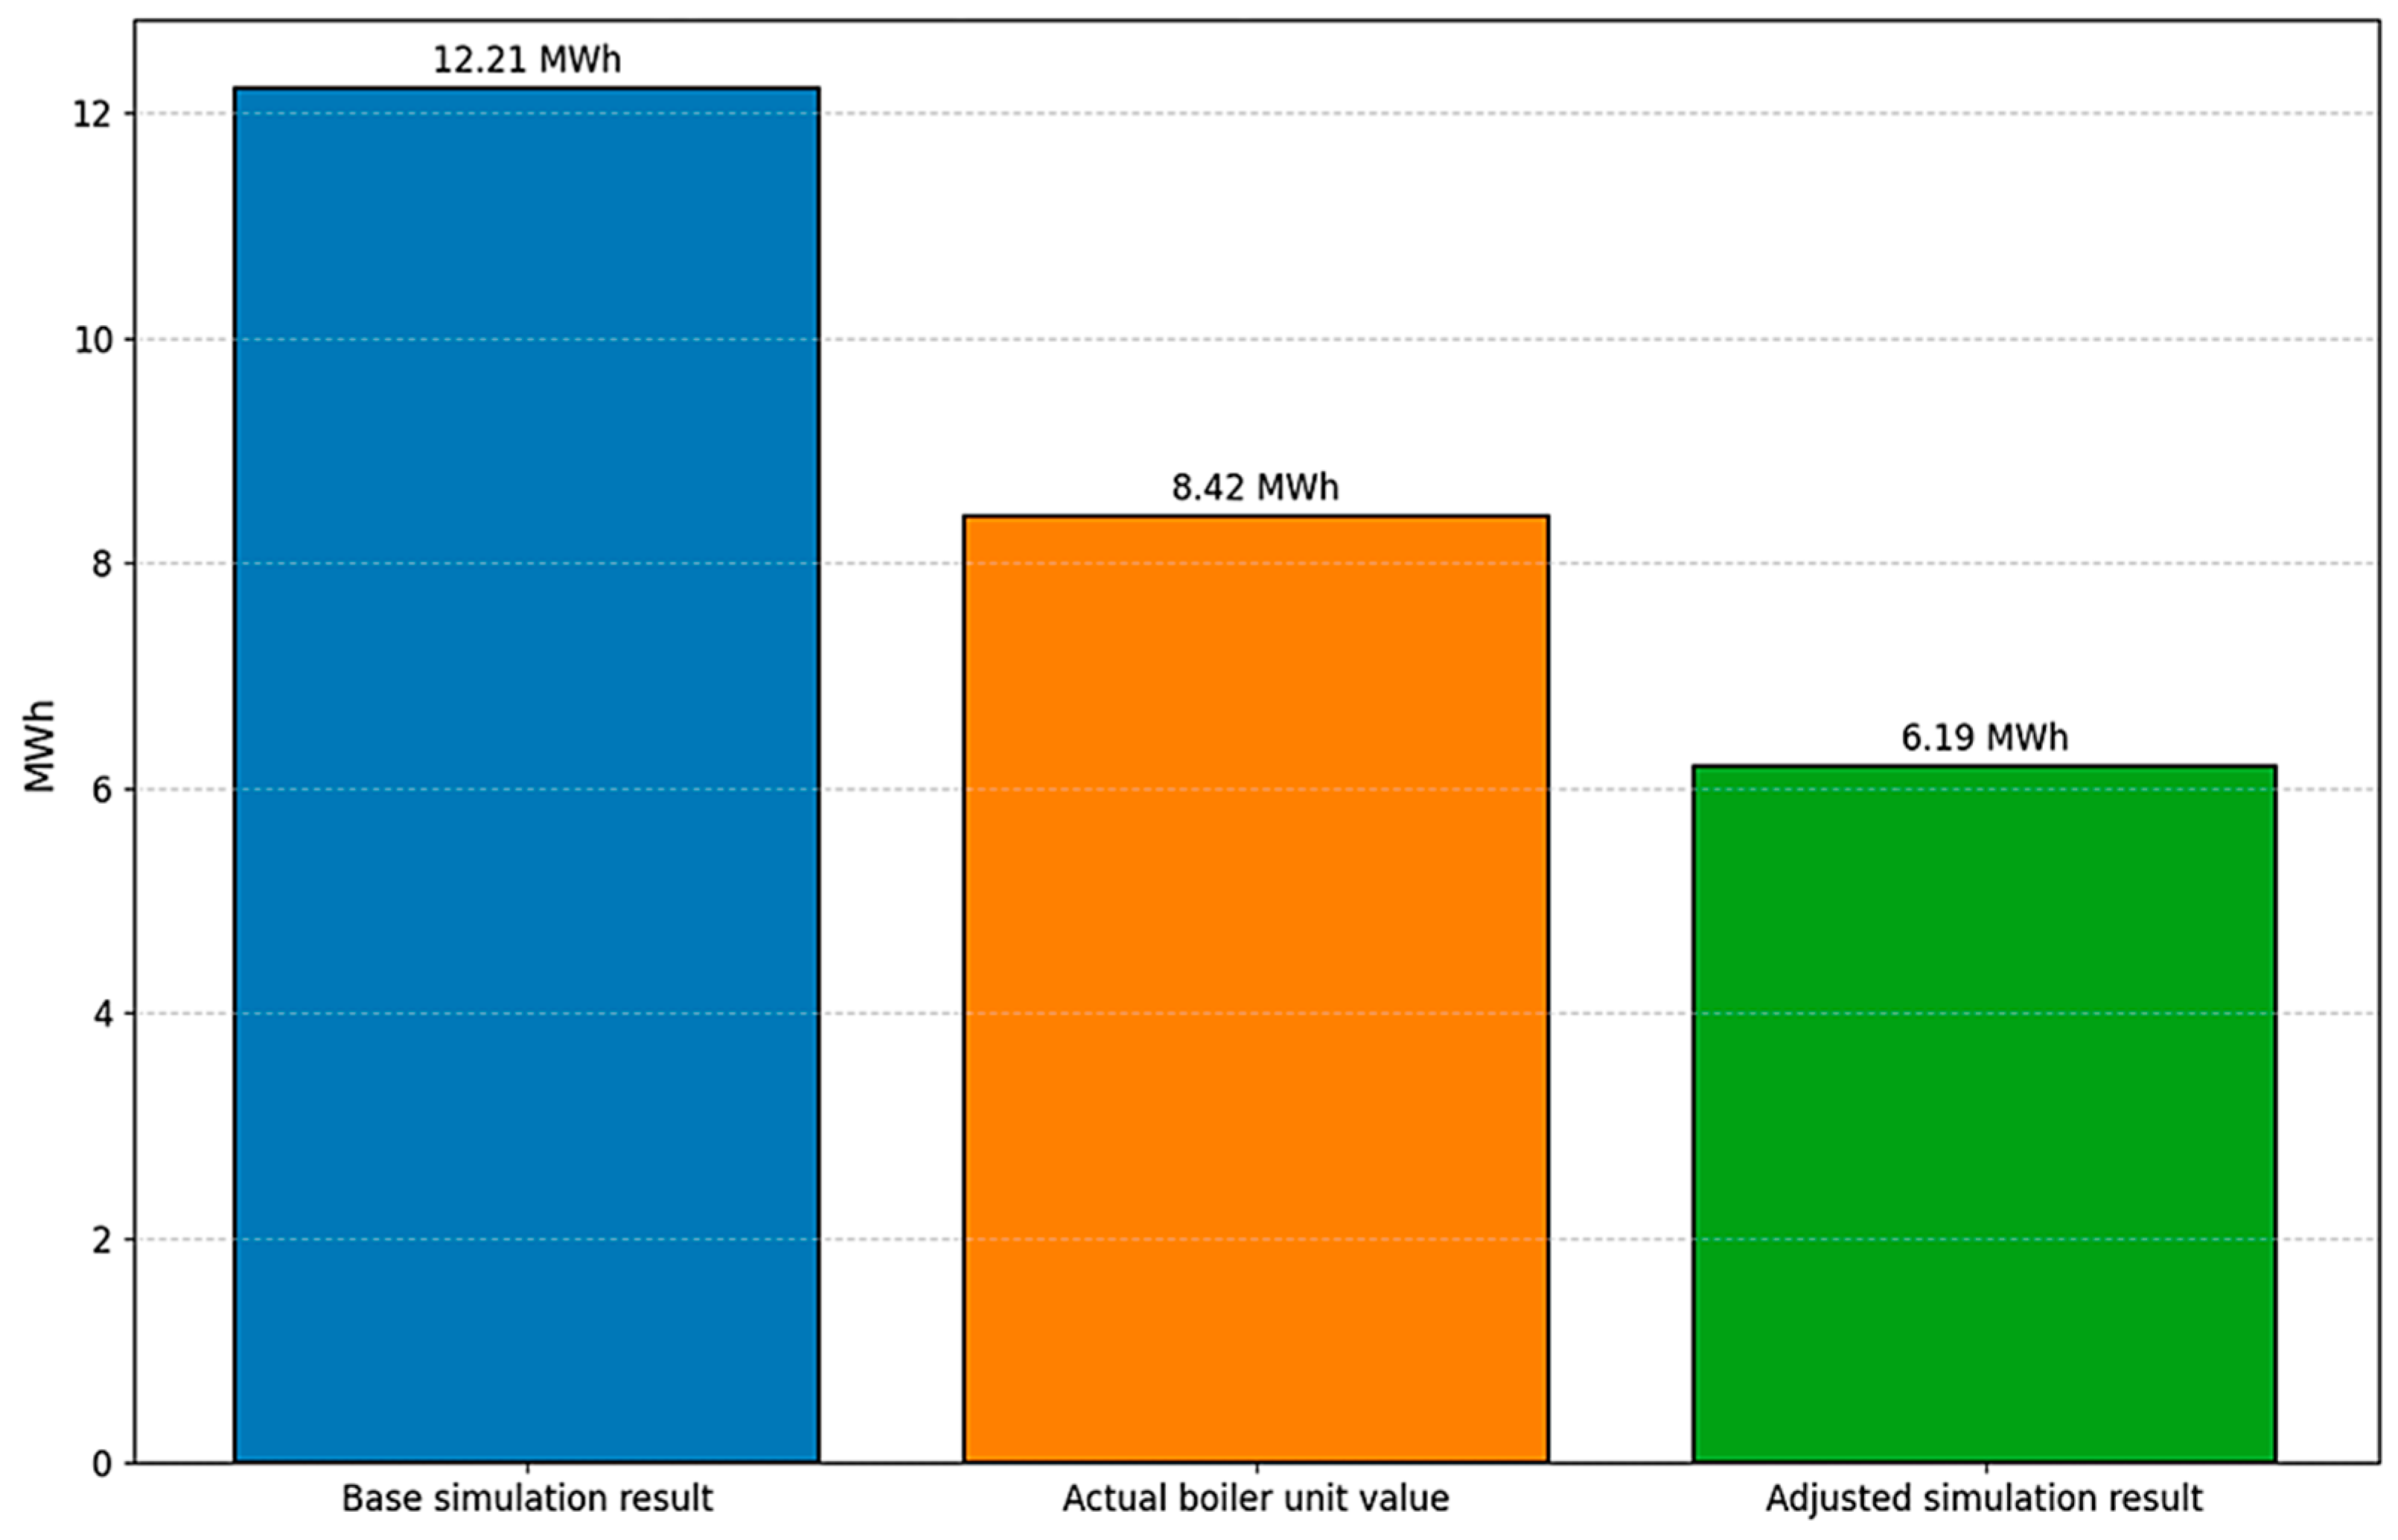
4.3. Comparison of Energy Balance

Adaptive occupant behaviours can alter the energy balance within a building, influencing heating or cooling demands. In this analysis, two components—external ventilation heat gain/losses and solar gain—are compared to illustrate the impact of occupant-driven actions. Inter-zone convection and internal conduction merely redistribute heat among rooms, whereas envelope conduction, ventilation exhaust, and solar irradiance determine the net load that the HVAC plant must offset.

4.3.1. External Ventilation Heat Losses
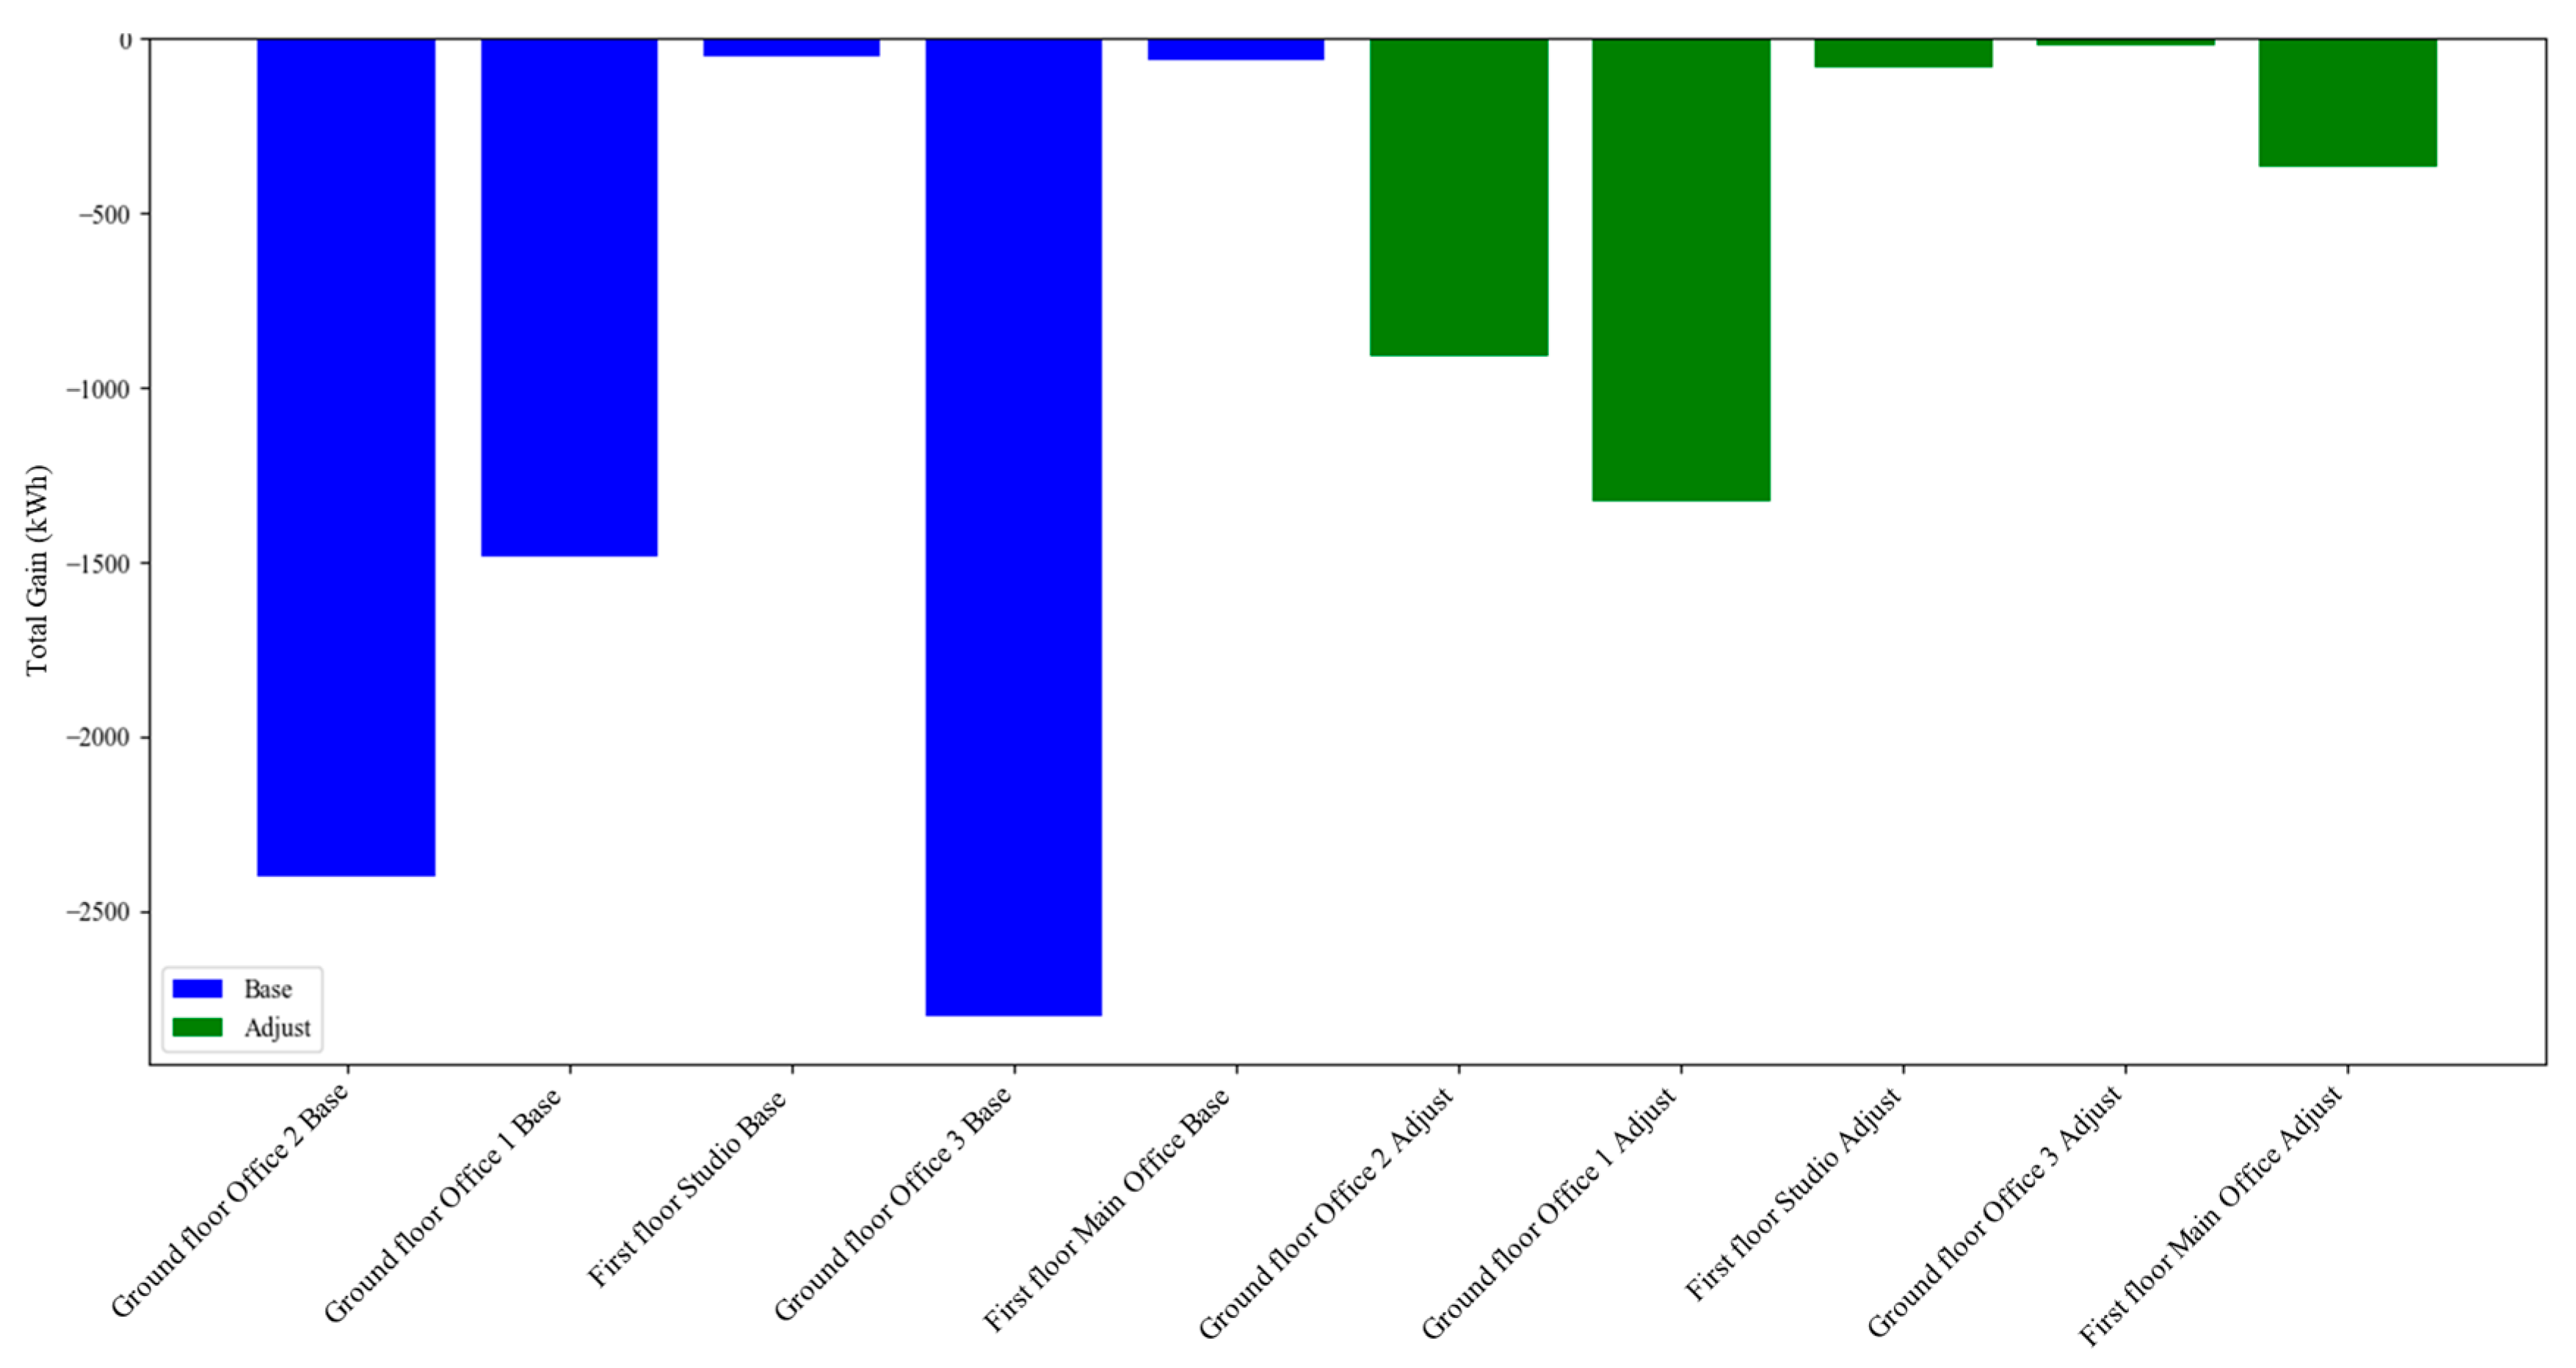
Figure 16 presents the total ventilation heat losses across different rooms. The Base model exhibits a total external ventilation heat gain of approximately −6795.82 kWh, indicating a substantial loss of heat. In contrast, the Adjust model records −2701.55 kWh, underscoring how adjusted window operation profiles significantly alter the building’s overall heat balance.

4.3.2. Solar Gain

Figure 17 compares solar gains between the Base and Adjust models. Differences are minimal, suggesting that changes to blind operation in the Adjust model did not markedly affect solar heat gains. Consequently, window operations appear to play a more prominent role than blinds in shaping the building’s energy dynamics.

4.3.3. Heating Plant Sensible Load

The total boiler unit value was used to calculate the heating plant sensible loads for both models. For the Base model, the heating plant sensible load was approximately 9.8 MWh, while for the Adjust model, it was significantly lower at 4.95 MWh. Notably, approximately 4.09 MWh of this gap (around 84%) is tied to changes in external ventilation heat loss, signifying that window operations—rather than blind adjustments—had the most significant effect on reducing the BEPG.
Figure 18 compares the heating plant sensible load in the Ground Floor Individual Office 2 and the Ground Floor Open-Area Office. The Base model reveals noticeable fluctuations and peaks, particularly in early and mid-November, whereas the Adjust model maintains a substantially lower and more stable load. This finding indicates that occupant adaptive behaviours in the Adjust model help preserve comfortable conditions without frequent heating.

4.4. Comparisons of Thermal Comfort and Indoor Air Quality

In addition to energy performance predictions, this study assesses thermal comfort and indoor air quality (IAQ) by comparing outputs from the Base model, which uses default deterministic window and blind operations, and the Adjust model, which provides a more realistic representation of occupant-driven window and blind behaviours.

4.4.1. Predicted Mean Vote (PMV)

The PMV index, which ranges from −3 (cold) to +3 (hot), evaluates thermal comfort by capturing factors such as clothing, activity level, air temperature, mean radiant temperature, air movement, and humidity. A PMV value of 0 corresponds to “neutral”, representing the most comfortable indoor thermal environment, while higher or lower values indicate discomfort, with occupants feeling either too warm or too cold.
The predictions (Figure 19) indicate that the Adjust model, with its occupant-driven adjustments to windows and blinds, maintains a more stable PMV value near 1 in both the Ground Floor Individual Office 2 and the Ground Floor Open-area Office. This suggests that the Adjust model provides a more realistic representation of thermal comfort. In contrast, the Base model exhibits significant fluctuations, particularly in the Ground Floor Individual Office 2, where PMV values occasionally reach extremes, indicating potential occupant discomfort.

4.4.2. Indoor Air Quality (IAQ)

IAQ predictions were made by analysing CO2 concentrations in different rooms (Figure 20). The Base model predicts consistently low and stable CO2 concentrations in both the Ground Floor Individual Office 2 and the Ground Floor Open-area Office, suggesting that the default window operation profiles provide adequate ventilation. In contrast, the Adjust model predicts significantly higher CO2 concentrations, particularly in the Ground Floor Individual Office 2, where levels approach 3500 ppm.
These values suggest insufficient ventilation under the Adjust model’s representation of window operations. The Ground Floor Open-area Office also exhibits elevated CO2 concentrations under the Adjust model, but these are lower than those predicted for the Individual Office. This difference is likely due to the better air dispersion in open-area offices, which are connected to other spaces on the ground floor.
The Adjust model predicts better thermal comfort by prioritising occupant-driven temperature adjustments. However, reduced window operation for ventilation leads to less fresh air exchange, especially in individual offices, resulting in elevated CO2 levels. This highlights a trade-off between maintaining comfort and ensuring adequate indoor air quality.

5. Conclusions and Future Works

This study developed and validated an adaptive occupant behaviour framework for a UK office building by integrating agent-based modelling (ABM) with a non-open-source building performance simulation (BPS) platform, IES VE. The findings demonstrated that incorporating realistic occupant-driven behaviours—particularly window and blind operations—significantly improved the accuracy of building energy usage predictions.
The Adjust model reduced discrepancies between simulated and actual boiler usage, dropping from 45.0% to 26.5%. Correspondingly, both the mean-squared error and root-mean-squared error fell markedly relative to the Base model. However, an analysis using MSE and RMSE metrics revealed that, despite significant reductions in both metrics, the Adjust model still struggled to accurately capture boiler usage on smaller time scales (per hour). This indicated that the validation data in this study helped identify the limitations of the Adjust model, addressing the second research question. While the validation highlighted the model’s performance improvements, it also underscored the need for further refinement of the ABM to achieve higher precision in hourly energy predictions.
The results also underscored the significant role of window operations in narrowing the BEPG, with the Adjust model demonstrating markedly lower ventilation-related heat losses than the Base model. Additionally, the Adjust model revealed that occupants in individual offices engaged in adaptive behaviours, such as window and blind adjustments, more frequently than those in open-area offices. These behaviour patterns directly influenced energy usage and contributed to the improved accuracy of the Adjust model’s predictions.
The results indicate that the Adjust model, with its occupant-driven adjustments to windows and blinds, maintains a more stable PMV value in both Ground Floor Individual Office 2 and the Ground Floor Open-area Office. In contrast, the Base model exhibits significant fluctuations, particularly in the Ground Floor Individual Office 2, where PMV values occasionally reach extremes, indicating potential occupant discomfort. The Adjust model predicted higher indoor CO2 concentrations, particularly in individual offices, due to reduced ventilation driven by occupant actions to maintain comfort. In some cases, CO2 levels exceeded acceptable thresholds, highlighting a trade-off between thermal comfort and indoor air quality. This demonstrates the need for more balanced strategies in future models to optimise both ventilation and temperature control.
This research highlights the potential of integrating ABM with IES VE to address the building energy performance gap (BEPG) by incorporating detailed occupant behaviours. The Adjust model demonstrated significant improvements in predicting energy performance, highlighting the importance of considering adaptive behaviours such as window and blind operations. However, future work should focus on refining the framework to enhance hourly prediction accuracy and balance thermal comfort with indoor air quality.
The study faced some limitations that provide opportunities for future improvement. The ABM relied on logit regressions to predict window and blind operations, producing binary outcomes (open/close or raise/lower) rather than capturing the degree of adjustments. Developing more detailed algorithms that account for proportional operations could enhance predictive accuracy. Moreover, the focus on contextual factors such as temperature, clothing, and metabolic rate overlooked psychological variables like mood, stress, and cognitive preferences, which are critical drivers of occupant behaviour. Incorporating these factors in future models could provide a more holistic representation of occupant interactions.
Additionally, the framework was limited to office spaces, excluding functional areas such as kitchens and toilets, due to insufficient literature on adaptive behaviours in these settings. Expanding the scope to include these areas would result in a more comprehensive understanding of occupant behaviour. Finally, the findings were specific to a single building and climate, limiting generalisability. Future research should validate the framework using a wider range of empirical data from diverse building types and climates to improve its applicability and precision across different scenarios. Future research could also enhance the ABM model by incorporating diverse data sources, such as real-world occupancy behaviour data. Leveraging resources like the ASHRAE Global Occupant Behavior Database, which offers insights into adaptive behaviour patterns across various climates, could refine and validate the Adjust model.

Author Contributions

Conceptualisation, C.-L.C.; methodology, C.-L.C.; software, C.-L.C.; validation, C.-L.C.; formal analysis, C.-L.C.; investigation, C.-L.C.; resources, C.-L.C. and J.C.; data curation, C.-L.C.; writing—original draft preparation, C.-L.C.; writing—review and editing, C.-L.C. and J.C.; visualisation, C.-L.C.; project administration, C.-L.C. All authors have read and agreed to the published version of the manuscript.

Funding

This research received no external funding.

Data Availability Statement

Data available on request due to restrictions.

Conflicts of Interest

The authors declare no conflicts of interest.

References

  1. International Energy Agency. World Energy Outlook 2023–Analysis. 2023. Available online: https://www.iea.org/reports/world-energy-outlook-2023 (accessed on 19 August 2024).
  2. International Energy Agency. Buildings-Energy System. 2023. Available online: https://www.iea.org/energy-system/buildings (accessed on 16 August 2024).
  3. Hong, T.; Langevin, J.; Sun, K. Building simulation: Ten challenges. Build. Simul. 2018, 11, 871–898. [Google Scholar] [CrossRef]
  4. de Wilde, P. The gap between predicted and measured energy performance of buildings: A framework for investigation. Autom. Constr. 2014, 41, 40–49. [Google Scholar] [CrossRef]
  5. Li, J.; Iulo, L.D.; Poerschke, U. A Review of the Energy Performance Gap between Predicted and Actual Use in Buildings. Build. Simul. 2023, 18, 3406–3413. [Google Scholar] [CrossRef]
  6. Zhang, W.; Wu, Y.; Calautit, J.K. A review on occupancy prediction through machine learning for enhancing energy efficiency, air quality and thermal comfort in the built environment. Renew. Sustain. Energy Rev. 2022, 167, 112704. [Google Scholar] [CrossRef]
  7. Najjar, M.K.; Figueiredo, K.; Hammad, A.W.; Tam, V.W.; Evangelista, A.C.J.; Haddad, A. A framework to estimate heat energy loss in building operation. J. Clean. Prod. 2019, 235, 789–800. [Google Scholar] [CrossRef]
  8. Tien, P.W.; Wei, S.; Liu, T.; Calautit, J.; Darkwa, J.; Wood, C. A deep learning approach towards the detection and recognition of opening of windows for effective management of building ventilation heat losses and reducing space heating demand. Renew. Energy 2021, 177, 603–625. [Google Scholar] [CrossRef]
  9. Hong, T.; Taylor-Lange, S.C.; D’oca, S.; Yan, D.; Corgnati, S.P. Advances in research and applications of energy-related occupant behavior in buildings. Energy Build. 2016, 116, 694–702. [Google Scholar] [CrossRef]
  10. Tien, P.W.; Wei, S.; Calautit, J.K.; Darkwa, J.; Wood, C. Real-time monitoring of occupancy activities and window opening within buildings using an integrated deep learning-based approach for reducing energy demand. Appl. Energy 2022, 308, 118336. [Google Scholar] [CrossRef]
  11. Ebuy, H.T.; El Haouzi, H.B.; Benelmir, R.; Pannequin, R. Occupant Behavior Impact on Building Sustainability Performance: A Literature Review. Sustainability 2023, 15, 2440. [Google Scholar] [CrossRef]
  12. Fabi, V.; Andersen, R.V.; Corgnati, S.; Olesen, B.W. Occupants’ window opening behaviour: A literature review of factors influencing occupant behaviour and models. Build. Environ. 2012, 58, 188–198. [Google Scholar] [CrossRef]
  13. Korsavi, S.S.; Montazami, A.; Brusey, J. Developing a design framework to facilitate adaptive behaviours. Energy Build. 2018, 179, 360–373. [Google Scholar] [CrossRef]
  14. Haldi, F.; Robinson, D. Interactions with window openings by office occupants. Build. Environ. 2009, 44, 2378–2395. [Google Scholar] [CrossRef]
  15. Wang, Z.; Calautit, J.; Tien, P.W.; Wei, S.; Zhang, W.; Wu, Y.; Xia, L. An occupant-centric control strategy for indoor thermal comfort, air quality and energy management. Energy Build. 2023, 285, 112899. [Google Scholar] [CrossRef]
  16. Warren, P.R.; Parkins, L.M. Window-opening behaviour in office buildings. Build. Serv. Eng. Res. Technol. 1984, 5, 89–101. [Google Scholar] [CrossRef]
  17. Zhang, Y.; Barrett, P. Factors influencing the occupants’ window opening behaviour in a naturally ventilated office building. Build. Environ. 2011, 50, 125–134. [Google Scholar] [CrossRef]
  18. Kapsis, K.; O'Brien, W.; Athienitis, A. Time-lapse Photography And Image Recognition To Monitor Occupant-controlled Shade Patterns: Analysis And Results. In Proceedings of the 13th Conference of International Building Performance Simulation Association, Chambéry, France, 26–28 August 2013. [Google Scholar] [CrossRef]
  19. Zeigler, B.P.; Kim, T.G.; Praehofer, H. Theory of Modelling and Simulation, 2nd ed.; Academic Press: New York, NY, USA, 2000. [Google Scholar]
  20. Gaetani, I. A Strategy for Fit-for-Purpose Occupant Behavior Modelling in Building Energy and Comfort Performance Simulation; Technische Universiteit Eindhoven: Eindhoven, The Netherlands, 2019. [Google Scholar] [CrossRef]
  21. Mahdavi, A.; Tahmasebi, F. Predicting People’s Presence in Buildings: An Empirically Based Model Performance Analysis. Energy Build. 2015, 86, 349–355. [Google Scholar] [CrossRef]
  22. Hunt, D. The Use of Artificial Lighting in Relation to Daylight Levels and Occupancy. Build. Environ. 1979, 14, 21–33. [Google Scholar] [CrossRef]
  23. Bonabeau, E. Agent-based modeling: Methods and techniques for simulating human systems. Proc. Natl. Acad. Sci. USA 2002, 99 (Suppl. S3), 7280–7287. [Google Scholar] [CrossRef]
  24. Alfakara, A.; Croxford, B. Using agent-based modelling to simulate occupants’ behaviors in response to summer overheating. Simulation 2014, 46, 90–97. [Google Scholar]
  25. Erickson, V.L.; Lin, Y.; Kamthe, A.; Brahme, R.; Surana, A.; Cerpa, A.E.; Sohn, M.D.; Narayanan, S. Energy efficient building environment control strategies using real-time occupancy measurements. In Proceedings of the ACM Workshop on Embedded Sensing Systems for Energy-Efficiency in Buildings, Berkeley, CA, USA, 3 November 2009; pp. 19–24. [Google Scholar] [CrossRef]
  26. Azar, E.; Menassa, C.C. Agent-based modelling of occupants and their impact on energy use in commercial buildings. J. Comput. Civ. Eng. 2012, 26, 506–518. [Google Scholar] [CrossRef]
  27. Jia, M.; Srinivasan, R.S.; Ries, R.; Bharathy, G. Exploring the validity of occupant behavior model for improving office building energy simulation. In Proceedings of the Winter Simulation Conference, Gothenburg, Sweden, 9–12 December 2018; pp. 3953–3964. [Google Scholar] [CrossRef]
  28. Langevin, J.; Wen, J.; Gurian, P.L. Including Occupants in Building Performance Simulation: Integration of an Agent-Based Occupant Behavior Algorithm with EnergyPlus; ASHRAE/IBPSA-USA: Atlanta, GA, USA, 2014. [Google Scholar]
  29. Zimmermann, G. Modeling and simulation of individual user behavior for building performance predictions. In Proceedings of the 2007 Summer Computer Simulation Conference, San Diego, CA, USA, 15–18 July 2007; pp. 913–920. [Google Scholar]
  30. Wang, Z.; Calautit, J.; Wei, S.; Tien, P.W.; Xia, L. Real-time building heat gains prediction and optimization of HVAC setpoint: An integrated framework. J. Build. Eng. 2022, 49, 104103. [Google Scholar] [CrossRef]
  31. Wei, S.; Tien, P.; Zhang, W.; Wei, Z.; Wang, Z.; Calautit, J.K. DeepVision based detection for energy-efficiency and indoor air quality enhancement in highly polluted spaces. J. Build. Eng. 2024, 84, 108530. [Google Scholar] [CrossRef]
  32. CIBSE. CIBSE Guide A: Environmental Design, 9th ed.; Chartered Institution of Building Services Engineers: London, UK, 2015. [Google Scholar]
  33. Tien, P.W.; Wei, S.; Calautit, J.K.; Darkwa, J.; Wood, C. A vision-based deep learning approach for the detection and prediction of occupancy heat emissions for demand-driven control solutions. Energy Build. 2020, 226, 110386. [Google Scholar] [CrossRef]
  34. Rijal, H.; Tuohy, P.; Humphreys, M.; Nicol, J.; Samuel, A.; Clarke, J. Using results from field surveys to predict the effect of open windows on thermal comfort and energy use in buildings. Energy Build. 2007, 39, 823–836. [Google Scholar] [CrossRef]
  35. Wei, S.; Tien, P.W.; Wu, Y.; Calautit, J.K. A coupled deep learning-based internal heat gains detection and prediction method for energy-efficient office building operation. J. Build. Eng. 2022, 47, 103778. [Google Scholar] [CrossRef]
Figure 1. Size and resolution.
Buildings 15 01728 g001
Figure 2. Methodology for integrating ABM with BPS using IES VE.
Buildings 15 01728 g002
Figure 3. Ground floor layout of the case study building.
Buildings 15 01728 g003
Figure 4. CAD and IES VE model of the case study office building.
Buildings 15 01728 g004
Figure 5. Actual daily boiler unit value usage in the case study building.
Buildings 15 01728 g005
Figure 6. COB framework.
Buildings 15 01728 g006
Figure 7. Process for determining window opening adjustments.
Buildings 15 01728 g007
Figure 8. Distribution of total thermal differences among occupants.
Buildings 15 01728 g008
Figure 9. Process for determining blind adjustments.
Buildings 15 01728 g009
Figure 10. Model outputs comparison between runs: (a) window and (b) blinds.
Buildings 15 01728 g010
Figure 11. (a) Comparison between Base and Adjust window profile (Ground floor office 2) and (b) comparison between window states for ground floor individual office and open area office.
Buildings 15 01728 g011
Figure 12. Comparison between Base and Adjust blinds profiles: (a) ground floor individual office, and (b) ground floor open area.
Buildings 15 01728 g012
Figure 13. Comparison of total boiler unit values: actual measurements vs. model predictions.
Buildings 15 01728 g013
Figure 14. Differences between actual boiler unit values and predicted values over time for (a) Base model and (b) Adjust model.
Buildings 15 01728 g014
Figure 15. Differences between actual and predicted boiler unit values for (a) Base model and (b) Adjust model, comparing working and non-working hours.
Buildings 15 01728 g015
Figure 16. Comparison of total external ventilation heat losses.
Buildings 15 01728 g016
Figure 17. Comparison of solar gains.
Buildings 15 01728 g017
Figure 18. Heating plant sensible load comparison between Base and Adjust models: (a) Ground floor office, (b) Ground floor open area.
Buildings 15 01728 g018
Figure 19. PMV comparison between Base and Adjust models: (a) Ground floor office, (b) Ground floor open area.
Buildings 15 01728 g019
Figure 20. CO2 concentration prediction comparison: (a) Ground floor office, (b) Ground floor open area.
Buildings 15 01728 g020
Table 1. Summary of previous ABM simulation studies.
StudyKey FindingsPrincipal Limitations
Alfakara and Croxford (2014) [24]Incorporating occupant-specific set-points and a seniority rule lowered simulated cooling demand during summer overheating.Considered only thermostat set-point preferences; no quantitative validation with measured data.
Erickson et al. (2009) [25]Real-time occupancy predictions (MVGM and ABM) indicated potential HVAC energy savings of ≈14 %.Very short monitoring period (48 h); sensor-calibration errors and false positives reduced data reliability.
Azar and Menassa (2012) [26]Peer influence and energy-saving prompts shifted occupants among high-, medium-, and low-consumption categories.Model outcomes not validated against field data; collecting reliable occupant behaviour and end-use data remains challenging.
Jia et al. (2018) [27]ABM reproduced window, door, and blind actions with ≈83 % accuracy in a single-office testbed.Hard to capture very frequent actions (e.g., door use every 15 min); single-room scope and lack of granular energy data limited validation.
Langevin et al. (2014) [28]HABIT accurately predicted personal fan and heater use; window-opening predictions were less reliable.Requires broader field datasets for non-thermal behaviours; additional validation needed for diverse climates and buildings.
Zimmermann (2007) [29]Behaviour-driven HVAC control in an open-plan office reduced energy use to levels comparable with regular weekday schedules.Limited representation of spontaneous reactions (e.g., manual window opening); more real-world data needed to refine and validate the model.
Table 2. Construction materials of the case study building.
MaterialComponentW/m2·K
External wall50 mm brick
Air cavity
100 mm expanded polystyrene insulation
Blockwork
0.299
Internal partition12 mm plasterboard
50 mm expanded polystyrene insulation
12 mm plasterboard
0.555
External GlazingDouble-glazed window1.590
RoofClay tile 150 mm timber joist (20% timber)
125 mm expanded polystyrene insulation
12 mm plasterboard
0.255
Door44 mm wooden1.874
Floor20 mm wooden flooring
120 mm wood
Fibre insulation board
70 mm screed
150 mm concrete
0.255
Table 3. Values for internal heat gains for the office.
Building TypeUseDensity of Occupation
/m2 per Person
Sensible Heat Gain/W·m−2Latent Heat Gain/W·m−2
PeopleLightingEquipmentPeople
OfficeGeneral420122515
81012207.5
126.712155
16512124
20412103
Table 4. Main variables in the ABM model.
TypeVariable NamesMeaningDynamic/Static
room-ownroom-indexTo identify different roomsStatic
room-sizeSize of each roomStatic
occupancy-scheduleOccupancy schedule of each roomDynamic
occupancy-capacityOccupancy capacity of each roomStatic
window-ownroom-indexTo assign windows to roomsStatic
window-stateStates of each windowDynamic
blind-ownroom-indexTo assign blinds to roomsStatic
blind-stateState of each blindDynamic
occupants-ownroom-indexTo assign occupants to roomsStatic
cloClothing value of each occupantStatic
metMetabolic rate of each occupantStatic
globalsoutdoor-temperatureOutdoor temperature of case study buildingDynamic
solar-gainSolar gain of each roomDynamic
solar-angleSolar angle of case study buildingDynamic
Table 5. Setup of rooms, windows and blinds.
Room NamesRoom-IndexOccupancy-CapacityRoom-SizeNumber of Windows and Blinds
First floor individual office 132204
First floor individual office 242244
Ground floor individual office 11213.54
Ground floor individual office 22213.54
General office5828.88
Table 6. Recommended comfort criteria for offices.
Room/Building TypesCustomary Operative Temperatures for Stated Activity and Clothing Levels in Winter
Temp/°CActivity/metClothing/clo
General/small offices21–231.20.9
Open-plan offices21–231.20.9
Table 7. Typical metabolic rate in offices.
ActivityMetabolic Rate/met
Restingsleeping0.7
reclining0.8
seated, quiet1
standing, relaxed1.2
Walking (on level)0.9 m·s−12.0
1.3 m·s−12.6
1.8 m·s−13.8
Office workreading, seated1
writing1
typing1.1
filing, seated1.2
filing, standing1.4
lifting/packing2.1
Table 8. Comparison of MSE and RMSE results.
MSERMSE
Base vs. Actual888.9929.82
Adjust vs. Actual331.3218.20
Disclaimer/Publisher’s Note: The statements, opinions and data contained in all publications are solely those of the individual author(s) and contributor(s) and not of MDPI and/or the editor(s). MDPI and/or the editor(s) disclaim responsibility for any injury to people or property resulting from any ideas, methods, instructions or products referred to in the content.

