Article

Effect of Steel Fiber on First-Cracking Behavior of Ultra-High-Performance Concrete: New Insights from Digital Image Correlation Analysis

1
College of Architecture, Changsha University of Science & Technology, Changsha 410076, China
2
State Key Laboratory of Bridge Safety and Resilience, College of Civil Engineering, Hunan University, Changsha 410082, China
3
Key Laboratory for Wind and Bridge Engineering of Hunan Province, College of Civil Engineering, Hunan University, Changsha 410082, China
*
Author to whom correspondence should be addressed.
Buildings 2025, 15(10), 1727; https://doi.org/10.3390/buildings15101727
Submission received: 22 April 2025 / Revised: 11 May 2025 / Accepted: 13 May 2025 / Published: 20 May 2025

Abstract

The first-cracking behavior of ultra-high-performance concrete (UHPC) is critical for the functionality and durability of its structures. However, determining the first-cracking strength by the linear limit point is challenging due to the nonlinear behavior before the initial crack. This study utilizes an improved Digital Image Correlation (DIC) technique to detect cracks and directly determine the first-cracking strength. The effect of steel fiber length, volume fraction, diameter, and shape on the first-cracking behavior was evaluated through direct tensile testing. Results indicate that incorporating steel fibers can enhance the first-cracking strength of UHPC to varying extents, ranging from 26.07% to 121.31%. Specifically, the length and volume fraction of steel fibers significantly affect the first-cracking strength, whereas the diameter and shape have minimal impact. The shape of steel fibers can influence the initial crack pattern due to stress concentration in deformed fibers. On the other hand, the inclusion of steel fibers can also negatively impact the first-cracking strength due to the introduction of air voids. Finally, considering both the positive and adverse effects of steel fibers, an updated predictive model for the first-cracking strength is proposed based on regression analysis of the experimental data. The proposed model can accurately predict the first-cracking strength of UHPC, fitting well with the existing data.

1. Introduction

Ultra-high-performance concrete (UHPC) is a cementitious composite material renowned for its exceptional strength and durability [1], with compressive strengths often exceeding 150 MPa [2]. However, this increased compressive strength can lead to a tendency toward brittle failure [3]. To address this brittleness, incorporating steel fibers into the UHPC matrix has proven effective [4]. Due to these exceptional properties, UHPC is widely used in various infrastructure applications, including prefabricated bridges and thin-walled structural elements such as Liquefied Natural Gas (LNG) storage tanks and nuclear waste containers [5,6,7]. Although UHPC exhibits enhanced tensile strength compared to conventional concrete, cracking can still occur when tensile stresses exceed its tensile strength. In structures such as LNG storage tanks and nuclear waste containers, where impermeability is crucial, the emergence of cracks can compromise UHPC’s functionality and even pose significant safety risks. As a result, precise measurement and prediction of the first-cracking performance of UHPC are essential for its engineering applications.
Currently, there are two primary methods to evaluate the first-cracking performance of UHPC: flexural tests and direct tensile tests (DTTs). The flexural test method for determining the first-cracking strength of UHPC is based on the standard ASTM C 1018 [8]. According to this standard, the “first cracking point” is identified based on the load–deflection curve where the curve first deviates from linearity. Essentially, this method is an indirect measurement of the initial crack based on the assumption that the linear limit point corresponds to the onset of cracking. Based on this method, there are inconsistent conclusions from various researchers regarding the influence of steel fiber on the first-cracking performance of UHPC. Studies conducted by Park et al. [9], Wu et al. [10], and Yoo et al. [11], using flexural tests, found that the first-cracking strength remained unaffected by the increases in fiber volume fraction or the variations in fiber shape. Similarly, Kang et al. [12] observed that fiber distribution had minimal impact on first-cracking strength in flexural tests, suggesting that the tensile strength of the cementitious matrix primarily influences the first cracking, with fibers becoming active only after the matrix cracks. In contrast, Meng and Khayat [13] reported that the first-cracking strength tended to increase with the increment of fiber volume fraction in flexural tests. These controversial test results may be attributed to the differences in how the linear limit point is designated. Strictly speaking, the load-deflection curve for concrete is nonlinear throughout [14]. Therefore, the establishment of this linear limit point is empirical and subjective, which may explain the discrepancies in the aforementioned controversial findings.
Compared to flexural tests, DTTs provide more reliable results for evaluating tensile performance, as they eliminate the need for complex calculations to derive the material’s tensile response [15]. However, there are still debates regarding the influence of fibers on the first-cracking performance of UHPC in DTTs. On the one hand, Donnini et al. [16] examined the tensile behavior of UHPC by varying the volume fraction of hooked steel fibers from 0% to 2.55%. Their findings suggested that fiber volume fraction did not influence the first-cracking strength. On the other hand, Shi et al. [17] and Zhang et al. [18] found that increasing the steel fiber volume fraction would enhance the first-cracking strength. It was important to note that the above-mentioned DTT studies did not explicitly define the method used to determine the first-cracking strength, which might explain the differing conclusions regarding the effect of steel fibers. Meanwhile, some researchers have proposed methods for defining the first-cracking strength. For instance, Pyo et al. [19] proposed using the linear limit point as the first-cracking strength, despite acknowledging that this point does not represent the actual appearance of cracks. Recognizing the distinction between the initial cracking point and the linear limit point, Park et al. [20] proposed an alternative method for strain-hardening UHPC. They recommended drawing two lines from the linear elastic and hardening segments of the stress–strain curve, with the intersection indicating the first cracking point, as illustrated in Figure 1. However, this intersection point method will result in a hypothetical first-cracking strength, as it does not correspond to an actual point on the stress–strain curve. Additionally, it had not been experimentally validated when Park et al. [20] initially proposed it. Both the linear limit point and the intersection point are indirect methods for determining the first-cracking strength. In summary, the use of indirect methods in DTTs to determine the first-cracking strength of UHPC may lead to conflicting results. Therefore, a more direct and precise method is required to accurately evaluate the ambiguous impact of steel fiber on first-cracking strength.
Given the uncertainty introduced by indirect methods for determining the first-cracking strength, direct approaches have been developed, such as Acoustic Emission (AE) and Digital Image Correlation (DIC). These methods can precisely identify the moment of crack initiation, allowing for an accurate determination of the corresponding load, which provides the first-cracking strength. When materials experience stress and microscopic failures, they release energy that generates transient elastic stress waves [22]. The AE technique captures and analyzes these waves to monitor the formation of internal microcracks. However, AE data cannot directly measure crack width. In contrast, DIC is a method for detecting and measuring cracks by analyzing the displacement field on the surface of an object, allowing for both crack detection and crack width measurement [23]. Due to its high precision, objectivity, and ease of use, DIC is widely employed in concrete structures [24,25]. Despite the extensive research on the impact of steel fibers on UHPC, there is limited investigation specifically examining their effect on first-cracking performance using direct crack monitoring techniques.
To accurately determine the first-cracking performance of UHPC, DTTs were conducted in this paper using a direct crack-detection method with DIC analysis. This study investigates the effect of steel fibers on the first-crack behavior, considering three types of steel fibers (straight, hooked, and corrugated), six different lengths of straight steel fibers (6, 10, 13, 16, 20, and 25 mm), three different diameters of fibers (0.2, 0.25, and 0.3 mm), and four different volume fractions of straight fibers (1, 2, 3, and 4%). These analyses provide a novel understanding of the impact of steel fibers on the first-cracking behavior of UHPC. Additionally, the measurement results of different methods for determining initial cracking performance were compared. Finally, a hybrid semi-theoretical and semi-empirical model was developed to predict the first-crack strength of UHPC.

2. Experimental Program

2.1. Raw Materials and Mixture Proportions

The proportions of the UHPC utilized in the specimens are detailed in Table 1. This mix design is consistent with the authors’ previous studies on UHPC [25,26], which have demonstrated its reliable mechanical properties and suitability for structural applications. The premix of the UHPC consisted of cement, silica fume, fly ash, quartz sand, quartz flour, and superplasticizer. In this study, an ordinary Type I Portland cement (P.O 52.5) was employed. Quartz sand, characterized by particle sizes ranging from 0.9 to 2.0 mm, was utilized. Additionally, quartz flour, possessing a density of 2.626 g/cm3 and an average particle size of 50.1 μm, was incorporated. To enhance the workability of the UHPC, a polycarboxylate-based, high-range, water-reducing admixture was introduced. It is noteworthy that a fixed water-to-binder ratio of 0.18 was maintained across all test specimens.
As shown in Figure 2, ten distinct types of steel fibers with a tensile strength of 2800 MPa were employed in this study. In detail, six types of straight steel fibers, each with an identical diameter of 0.2 mm and lengths of 6, 10, 13, 16, 20, and 25 mm, were utilized to investigate the impact of steel fiber length on the first-cracking strength. Furthermore, to explore the influence of fiber diameter on mechanical properties, the research incorporated two additional fibers with diameters of 0.25 mm and 0.3 mm, respectively, with an identical length of 16 mm. Apart from the straight fibers, two additional deformed fibers (hooked and corrugated), each with a length of 13 mm and a diameter of 0.2 mm, were included to investigate the impact of fiber shape. In Figure 2b, stress concentration points are presented in the deformed fibers, with the hooked fiber containing 4 stress concentration points and the corrugated fiber containing 6 stress concentration points, while the straight fibers do not exhibit any stress concentration points.
Table 2 provides details of 14 groups of UHPC mixtures utilized in this study. The mixture labeled as “Matrix” serves as the control group, aimed at assessing the performance of the UHPC matrix without steel fibers. For the rest of the mixtures, the naming of a group name consists of four parts. The first part represents the shape of steel fiber, where letters S, H, and C stand for straight, hooked, and corrugated steel fibers, respectively. The next three parts denote the diameter, length, and volume fraction of the steel fiber, respectively. For example, S-0.20-13-1% signifies UHPC containing straight fiber with a diameter of 0.20 mm and a length of 13 mm, with a fiber volume fraction of 1%. As summarized in Table 2, this study encompasses four parameters, which are steel fiber length, steel fiber volume fraction, steel fiber diameter, and steel fiber shape, respectively.

2.2. Test Methods and Preparation of Specimens

2.2.1. Flowability

According to the Chinese standards GB/T 2419-2005 [27], the flowability of all mixtures was measured. The mixtures were poured into a mini cone mold situated on an automated jolting apparatus. The mold was raised vertically and jolted 25 times. Subsequently, two diameters perpendicular to each other were measured, and the average value was recorded as flowability.

2.2.2. Compressive Testing

A universal testing machine with a maximum load capacity of 2000 kN was employed for compressive strength testing. Three 100 mm cubic specimens for compressive strength were tested in accordance with the Chinese standard GB/T 31387-2015 [28], and the mean values were reported as the representative compressive strength values for the group.

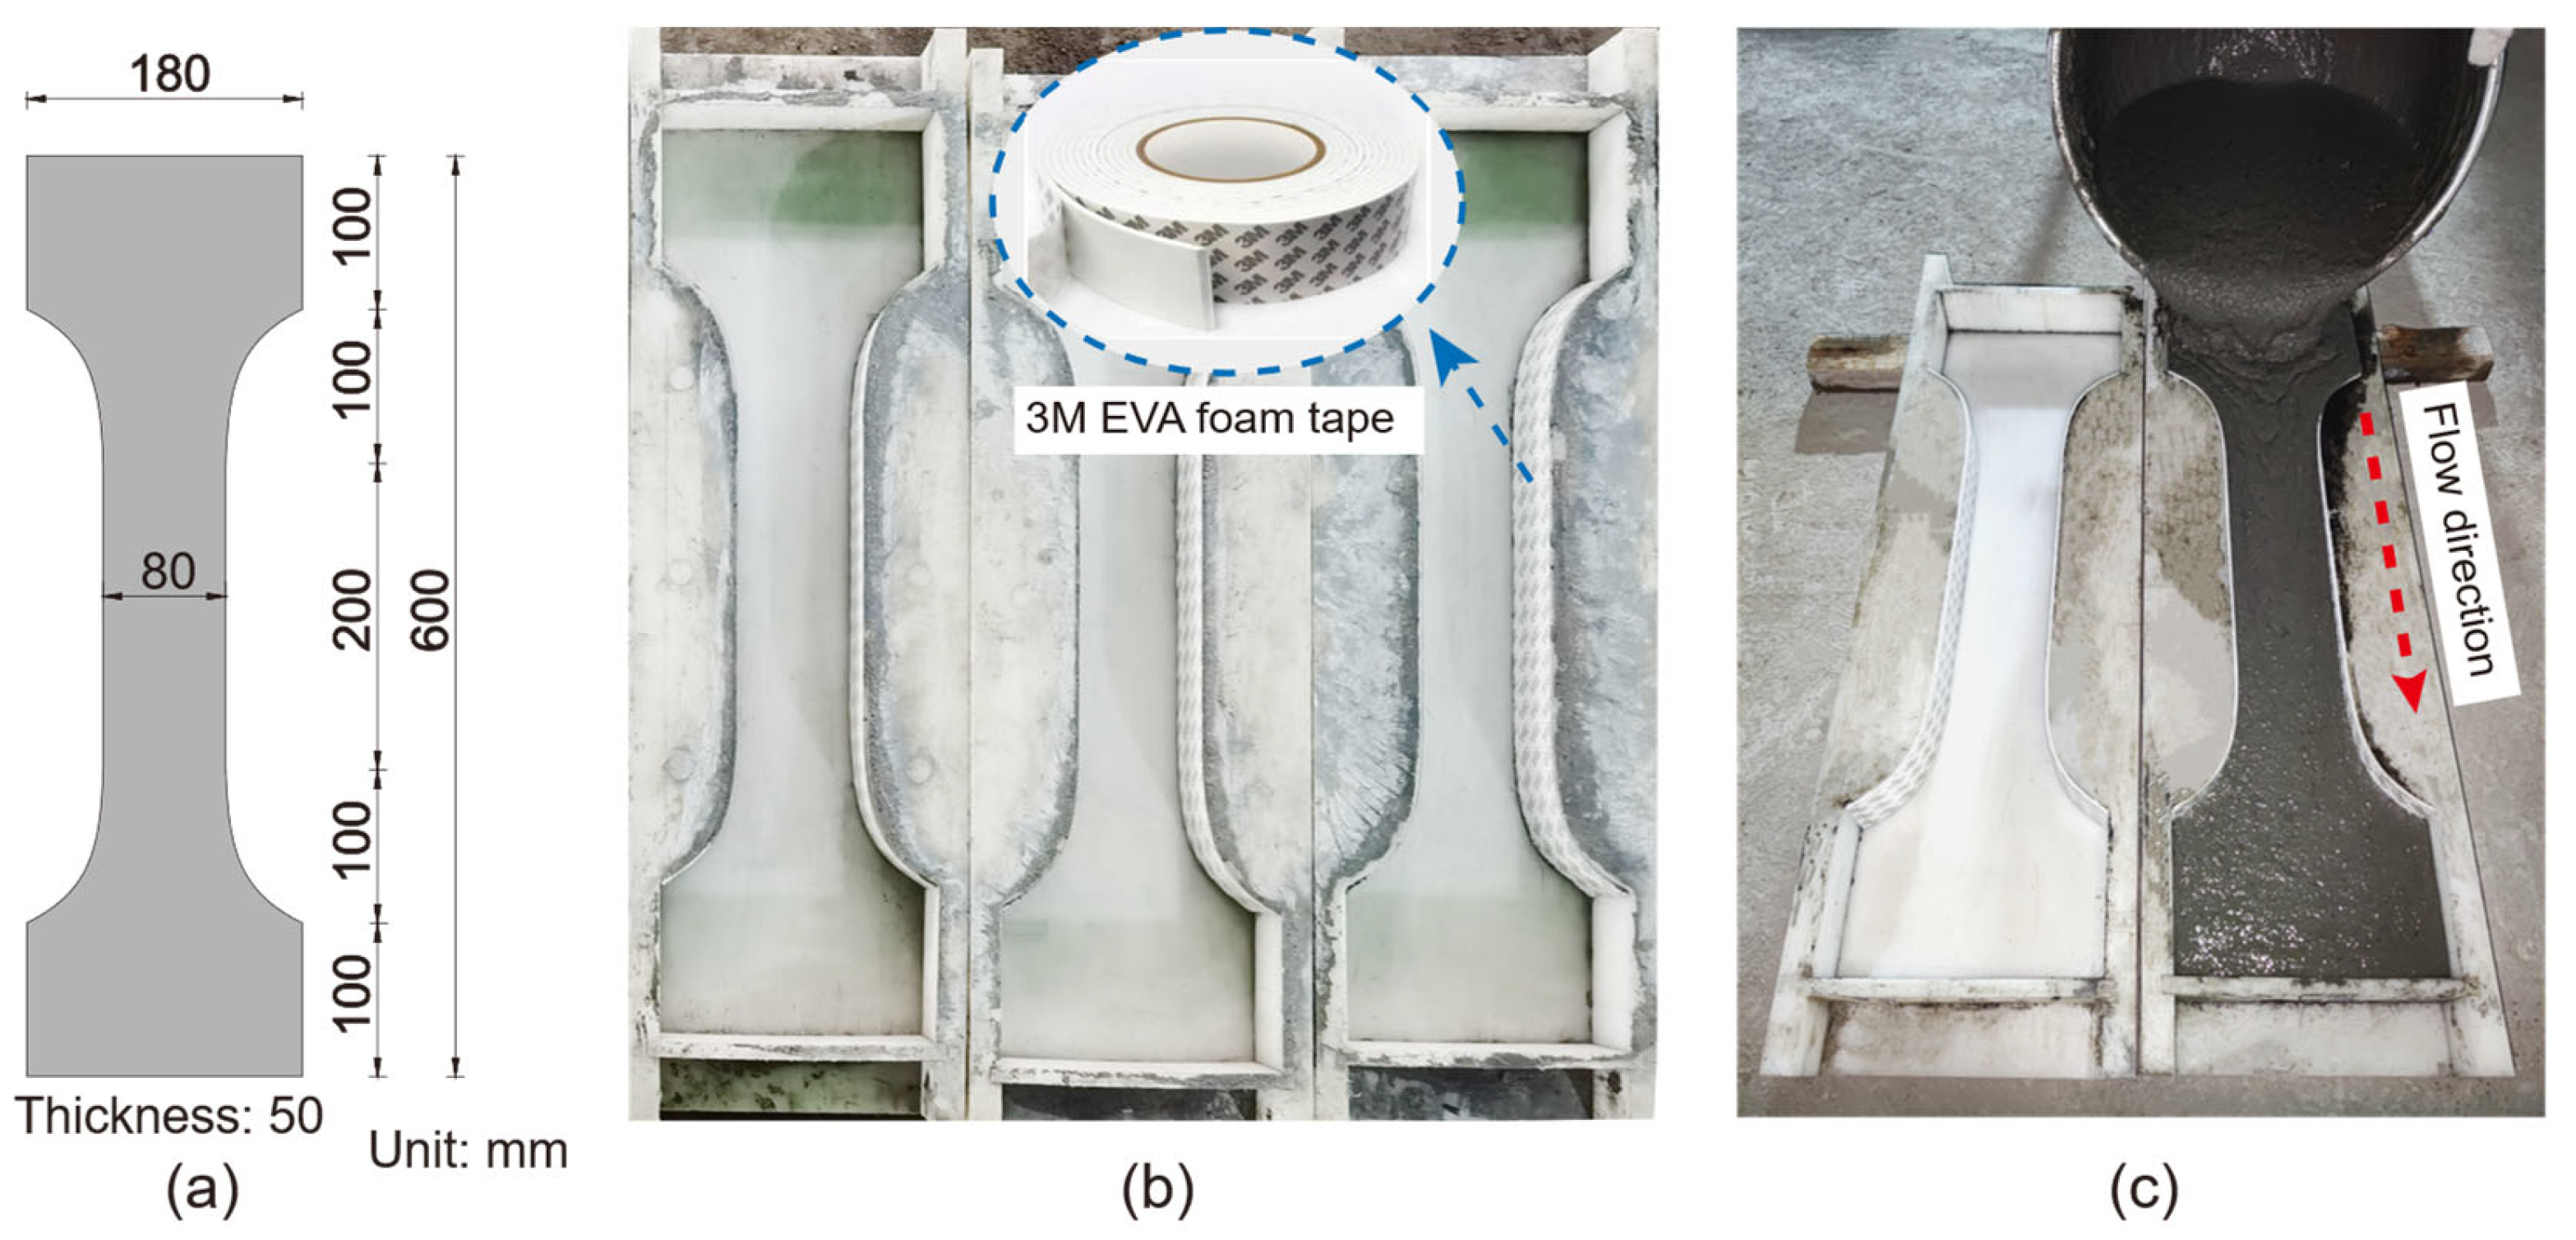
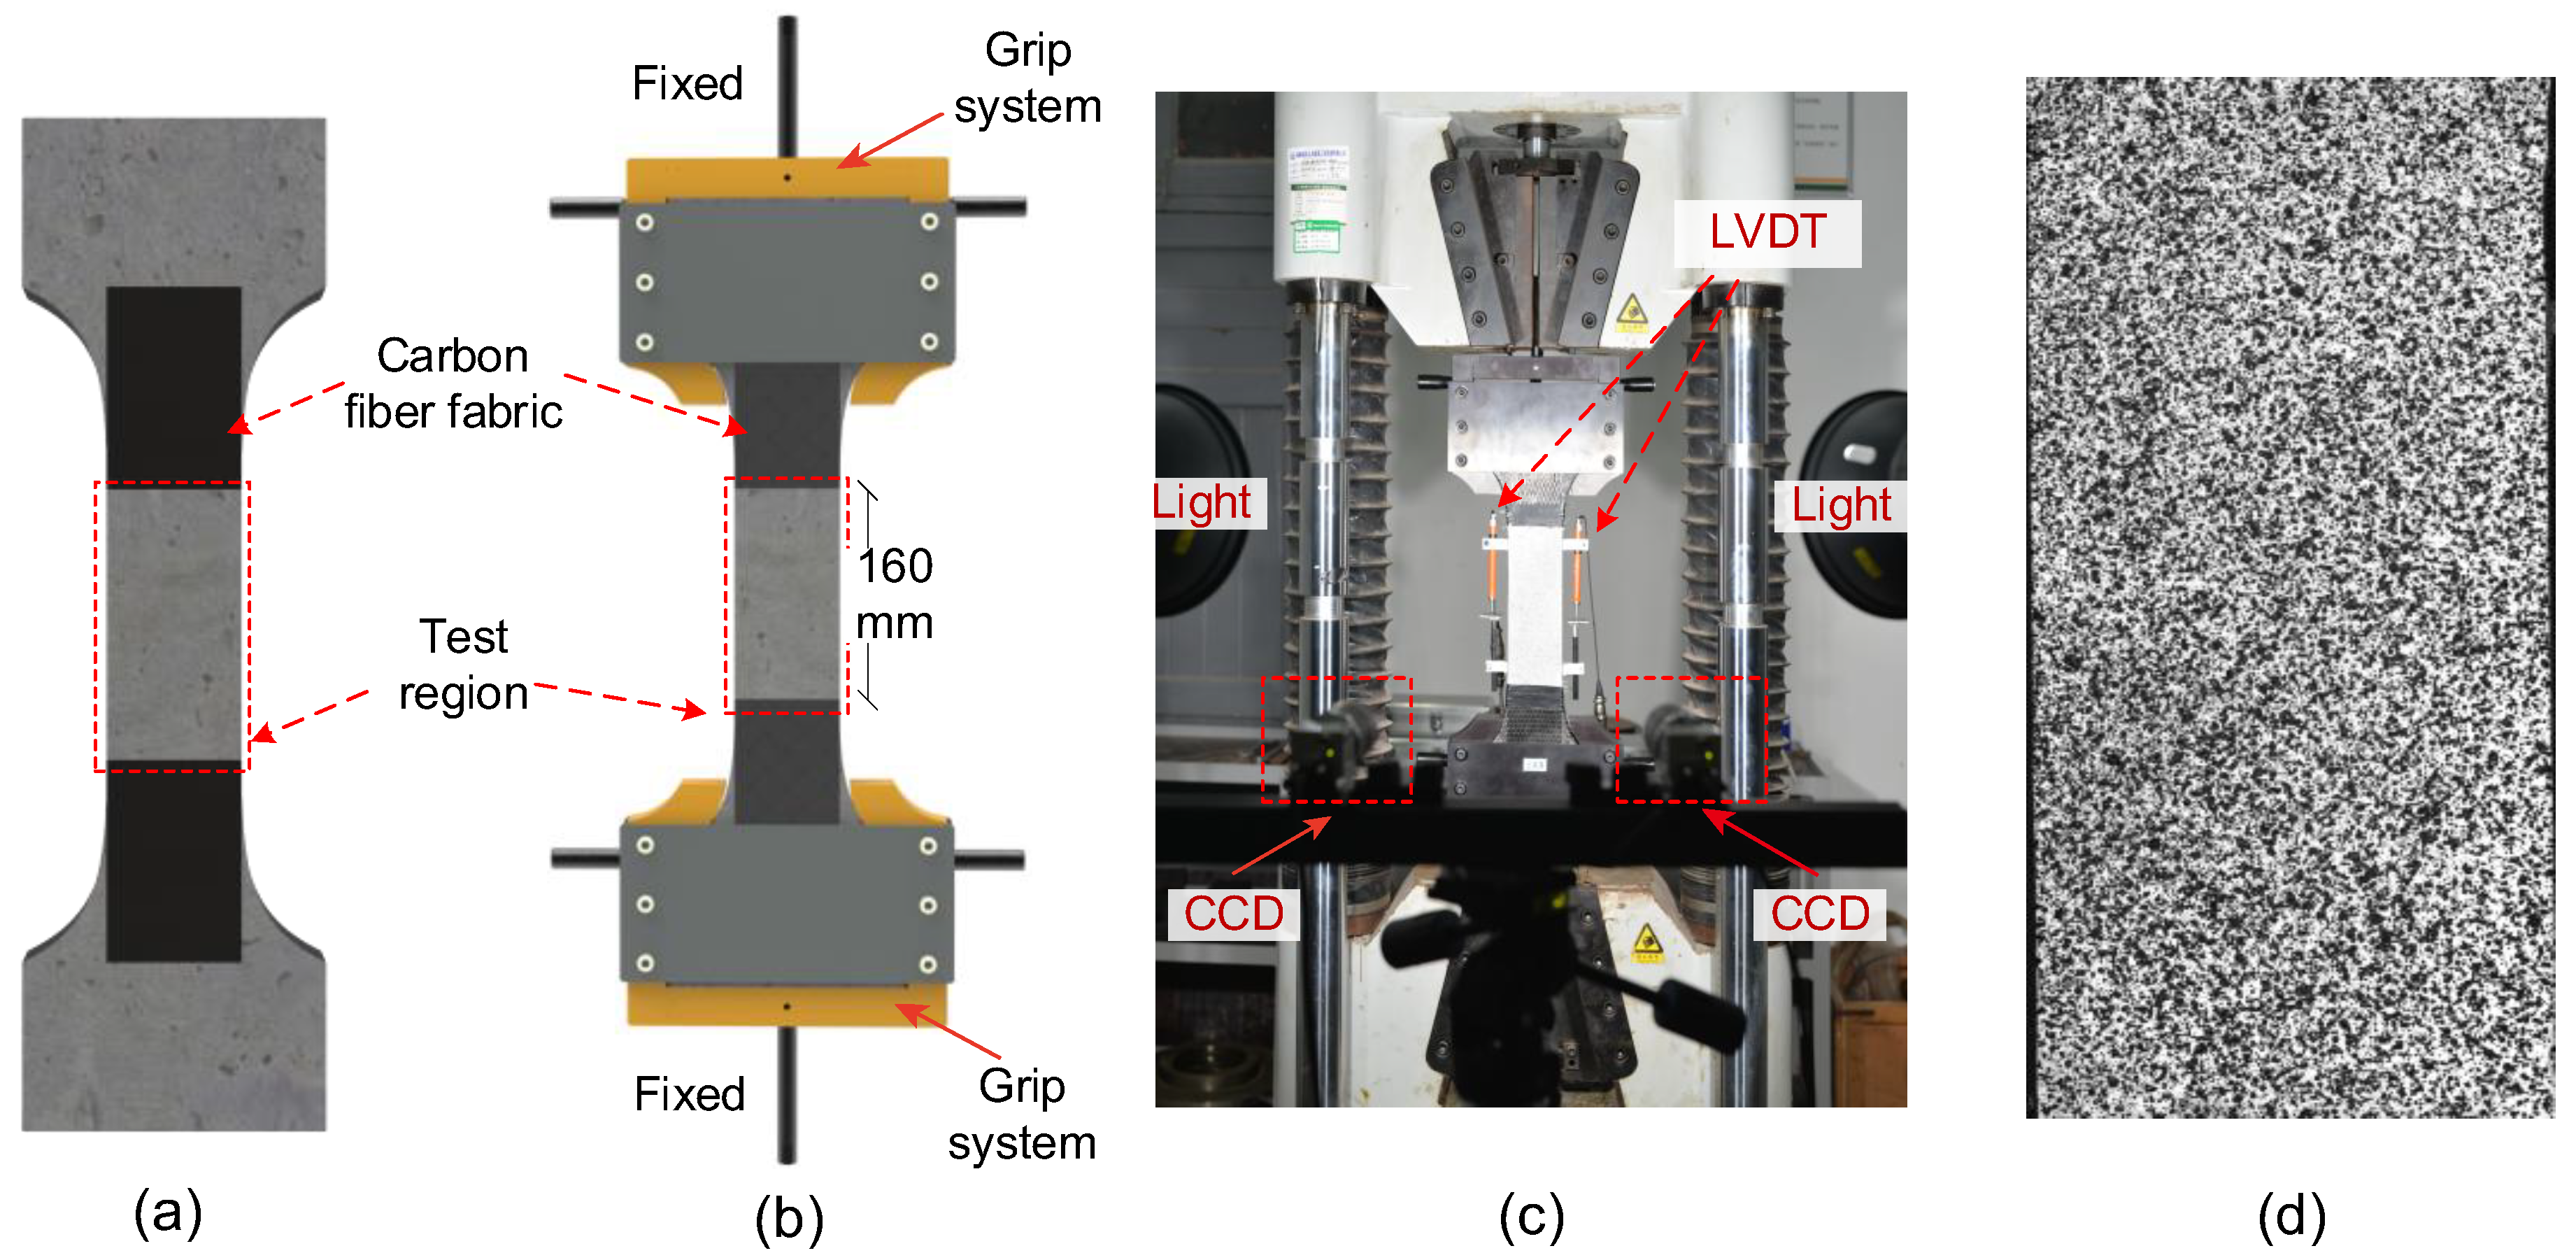
2.2.3. Direct Tensile Testing

As shown in Figure 3a, the specimens for DTT are dog-bone shaped, with a length of 600 mm. The cross-section at the ends measures 180 mm × 50 mm, while the cross-section at the gauge region measures 80 mm × 50 mm. To prevent stress concentration, Neuber’s spline [29] was adopted to design the transition from the wider end zone to the central width of the specimen. For UHPC, a large amount of cementitious materials and a low water-to-binder ratio contribute to considerable autogenous shrinkage [30,31]. It is worth noting that autogenous shrinkage may result in stress in UHPC restrained by molds or reinforcement bars, potentially leading to UHPC cracking [32]. In other words, shrinkage-induced stresses have a significant impact on the first-crack strength. To mitigate the effects of shrinkage-induced stresses on the initial cracking performance, it is necessary to relax the deformation resulting from hydration reactions. Therefore, as illustrated in Figure 3b, ethyl vinyl acetate (EVA) foam tape with a thickness of 5 mm was adhered to the inner sides of the molds. The casting method is depicted in Figure 3c. Considering the excellent flowability of UHPC, one end of the mold was initially raised during casting, allowing the mixture to flow from one end of the mold to the other. Once the UHPC filled the mold, the raised end was lowered. All specimens in this experiment were not vibrated during casting. After casting the UHPC, the specimens were covered with plastic sheets to prevent plastic shrinkage. Then, all specimens were de-molded after being cured at room temperature for 48 h, then subjected to steam curing at 90 ± 2 °C for another 48 h. They were subsequently removed from the heat-curing room and stored at room temperature until testing.
In this study, the VIC-3D™ system from the Correlated Solutions, Inc. (Irmo, SC, USA) non-contact, full-field strain-measurement system was used to observe the crack propagation and strain-field development of the specimens. The camera’s field of view was approximately 300 mm × 300 mm in this experimental test. The recordings from the dual cameras of the DIC system were synchronized through wired computer control at a sampling rate of 1 Hz. The system utilized two 12-megapixel Basler acA4112 cameras (Basler AG, Ahrensburg, Germany), each equipped with a 25 mm focal length lens. To ensure adequate and uniform lighting conditions, photographic lamps were used during the measurements. A high-contrast, random speckle pattern was applied to the surface of the UHPC specimens by spraying black paint over a white base coat, which provided optimal conditions for accurate DIC analysis.
Digital Image Correlation (DIC) is an optical measurement technique that tracks the movement of a random speckle pattern applied to the surface of a specimen to calculate full-field displacements and strains. By comparing digital images captured before and after deformation, the software (VIC-3D™) identifies the displacement of each subset of pixels, enabling the determination of local strain fields with high spatial resolution.
Dog-bone specimens commonly exhibit failure within the transition section. Despite the inclusion of transitional sections in the experimental samples, further measures were implemented to mitigate this issue. Carbon fiber cloth was utilized to reinforce the specimens at the transition section, as depicted in Figure 4a. As shown in Figure 4b, the boundary conditions at the ends of the DTT specimens were rigidly fixed to ensure stable crack propagation under consistent tensile deformation. In Figure 4c, the tensile tests were conducted using a universal testing machine, operating under displacement control, with a maximum load capacity of 600 kN. Prior to testing, careful verification of the loading alignment was carried out using Linear Variable Differential Transformers (LVDTs) placed symmetrically on both sides of the specimen. This ensured that axial deformation was evenly distributed and that eccentricity effects were minimized during the test. The displacement speed during testing was set at 0.05 mm/min. The load signal was measured using a load cell directly attached to the bottom of the crosshead. Subsequently, the data obtained from the load cell were utilized to compute the average tensile stress. Additionally, the deformation of the test region of the tensile specimen was obtained by LVDTs.

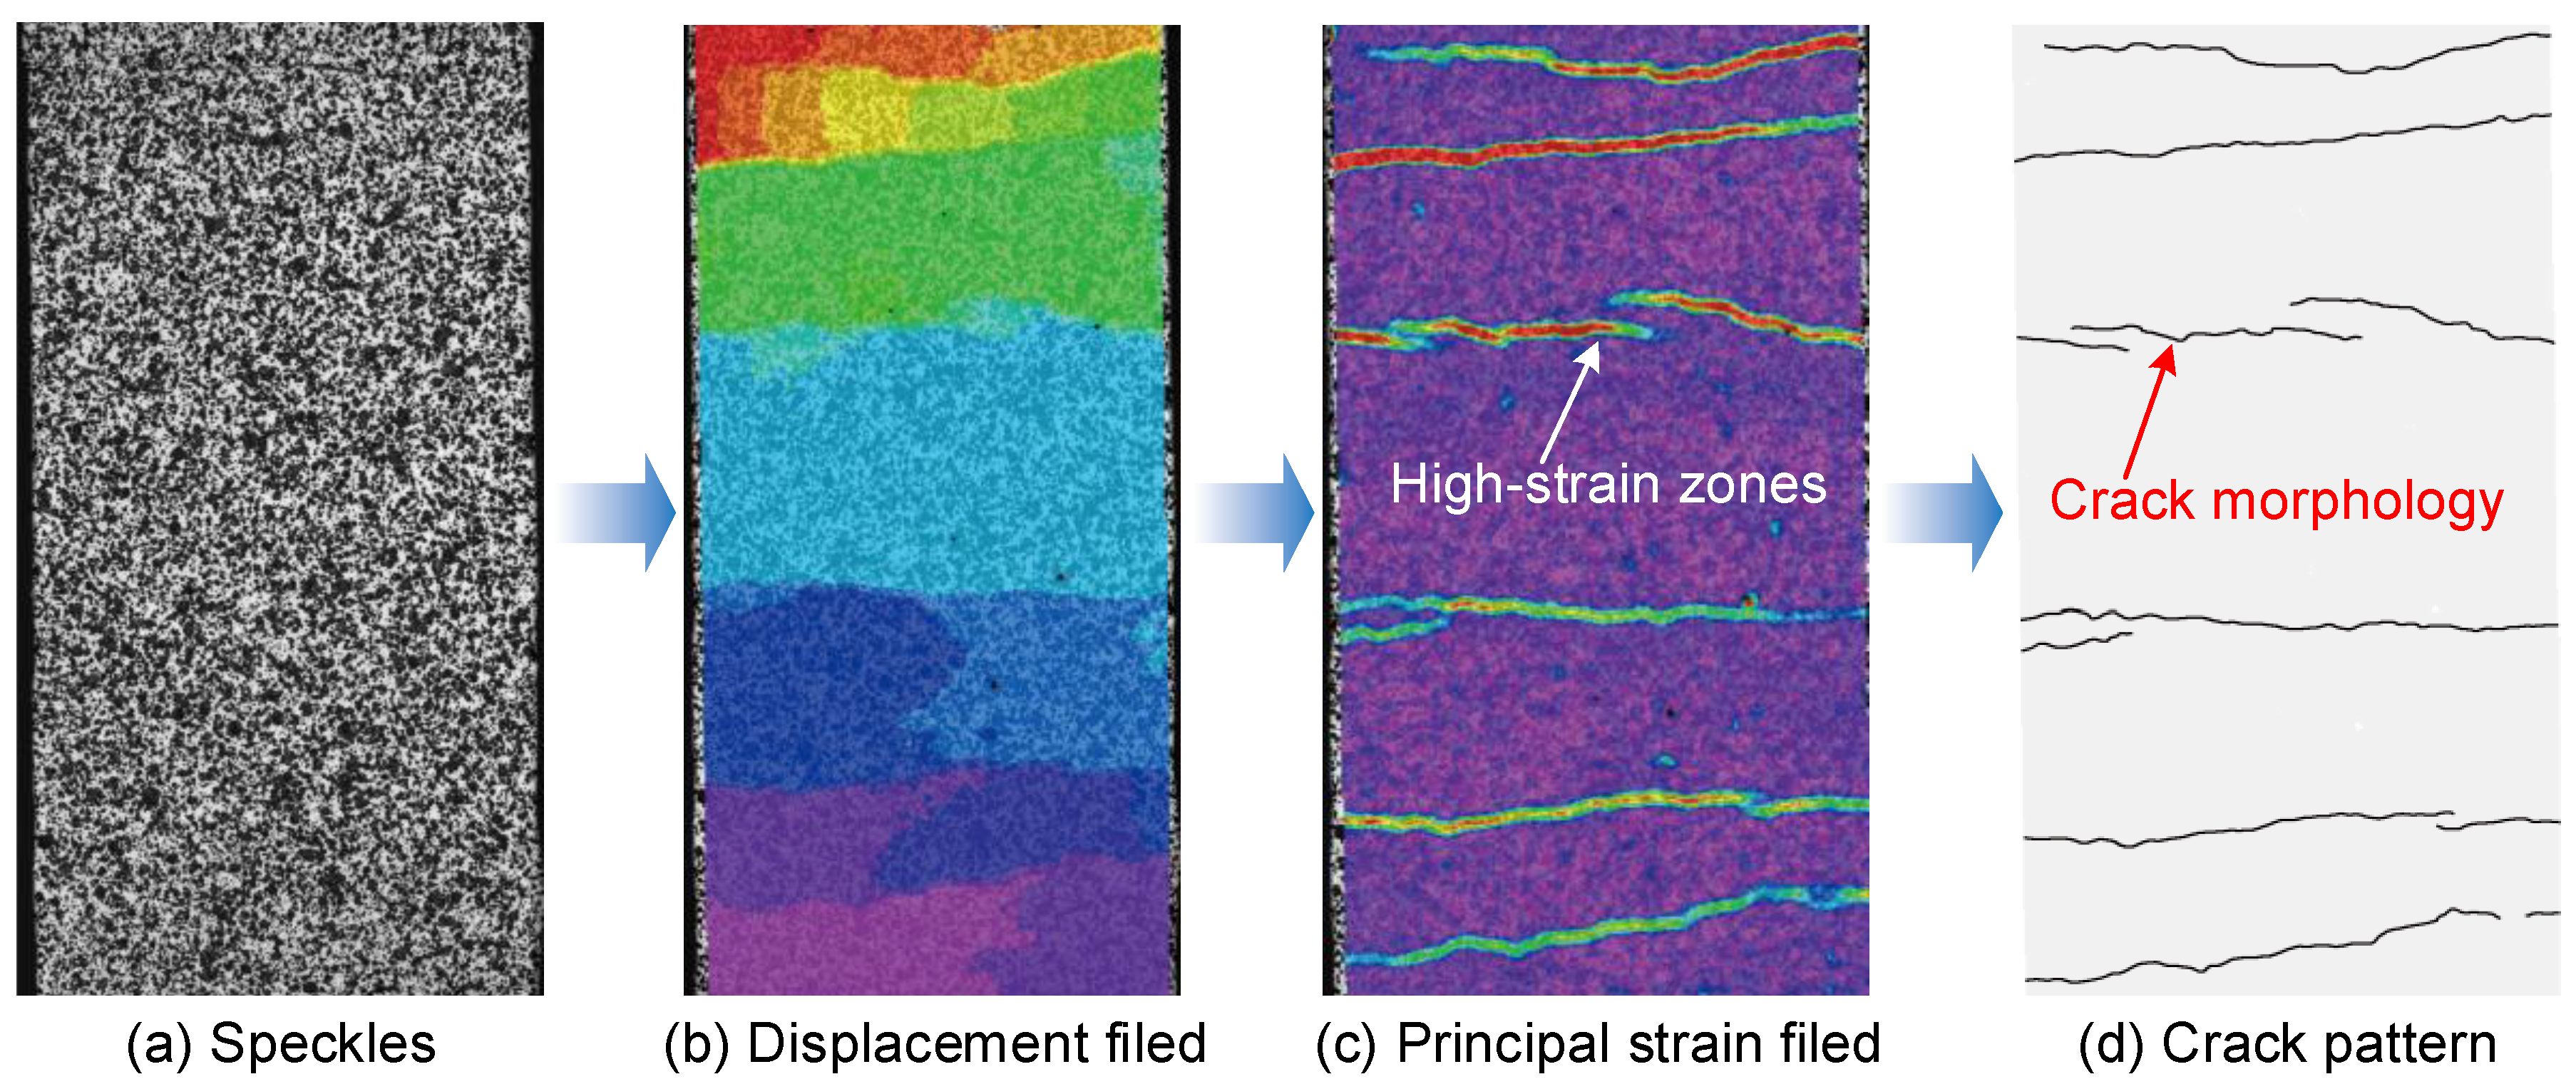
2.3. Crack Identification by Improved DIC Technology

As depicted in Figure 5, this study proposes a crack identification process based on DIC to determine the initial cracking of UHPC from strain fields. The specific procedure is as follows: Initially, as shown in Figure 5a, speckles need to be produced at the surface of the test region before testing. Secondly, the DIC software calculates a displacement field by tracking speckle patterns on the surface of the objective before and after deformation, thereby revealing the displacement vector at each surface point, as shown in Figure 5b. Subsequently, as depicted in Figure 5c, strains are typically computed using displacement gradients.
From the perspective of solid mechanics, surface cracks can be understood as discontinuities in displacements relative to an initially uncracked state. Cracks will appear as high-strain zones in the principal strain diagram due to the discontinuity in displacement resulting in elevated strains [33]. Thus, previous studies [34,35] suggest that cracks emerge where strain concentrations exist. However, such concentrations are not conspicuous at the onset of microcracks, posing challenges in crack detection, especially at the stage of crack initiation. To overcome this hurdle, further processing of the strain-field data should be conducted [23]. The improved method of directly extracting cracks in the major principal tensile strain field is developed using the well-established principles of Canny edges [36]. Ultimately, these steps refine broad zones of high strain into more defined lines representing cracks, as illustrated in Figure 5d. Through this process, DIC facilitates automated crack detection with high precision, mitigating the subjectivity and time-intensive nature associated with manual crack identification. The minimum detectable crack width using the Canny edge-based crack detector is approximately 0.02 pixels [23]. When the measurement area is 300 mm × 300 mm (the test region of DTT is 200 mm × 80 mm), corresponding to a resolution of 0.0015 mm, this is 6.6 times the resolution of the above manual crack observation (0.01 mm) instrument. Apart from the improved accuracy, another significant advantage of using DIC is the avoidance of the risk of missing the initial crack during the loading process. In this study, a subset size of 25 pixels and a step size of 1 pixel were adopted to ensure high spatial resolution and reliable strain field computation.

3. Results and Discussion

3.1. Effect of Steel Fiber on Flowability of UHPC

Good workability, which can be evaluated using flowability, is required to guarantee uniform dispersion and orientation of steel fibers in UHPC. As illustrated in Figure 6a, flowability decreases with an increase in fiber length. Notably, when the fiber length exceeds 16 mm, there is a significant reduction in flowability, indicating that fiber lengths above 16 mm require careful consideration due to their substantial impact on UHPC’s flowability. For the flowability impact of volume percentage of steel fibers, Figure 6b demonstrates that the flowability of the control group without steel fibers (“Matrix”) reaches the highest level at 240 mm. In contrast, incorporating steel fibers into other mixtures leads to varying degrees of decreased flowability in UHPC. Additionally, as the steel fiber volume fraction increases from 1% to 4%, the flowability gradually decreases. In Figure 6c, the flowability of UHPC with steel fibers of different diameters (0.20 mm, 0.25 mm, and 0.30 mm) is shown to be 209 mm, 211 mm, and 210 mm, respectively. This indicates that the diameter of steel fibers has a negligible impact on UHPC’s flowability. In terms of the shape of steel fibers, Figure 6d shows that compared to straight fibers, flowability is reduced by 5 mm for hooked-end fibers and by 9 mm for corrugated fibers, respectively.
The overall reduction in flowability for all specimens is attributed to the increased resistance among particles in fresh UHPC due to the presence of steel fibers. The incorporation of steel fibers will increase friction and cohesive forces while also consuming free water, contributing to this resistance [37]. Therefore, flowability decreases to varying degrees with the inclusion of steel fibers. Notably, fiber length and volume percentage significantly impact flowability, especially when the fiber length exceeds 16 mm and the fiber volume fraction is above 3%. For deformed fibers, this reduction is primarily due to the tendency of deformed fibers to entangle, increasing friction between the steel fibers and the UHPC paste [38]. Corrugated fibers, which exhibit more deformation than hooked-end fibers, result in a greater loss of flowability. In summary, among the four parameters studied, flowability is significantly affected by fiber length and volume percentage, followed by fiber shape. The diameter of the steel fibers appears to have a negligible impact on flowability.

3.2. Effect of Steel Fiber on Compressive Strength of UHPC

The measured compressive strengths of all test series are also summarized in Figure 6. As shown in Figure 6a, increasing the length of steel fibers initially results in higher compressive strength, but further increasing the length of steel fibers (beyond 16 mm) will lead to a decrease in strength. This trend can be explained by the dual effects of the fibers. On the one hand, steel fibers inhibit the initiation and propagation of vertical cracks in UHPC under compression, thereby enhancing strength. On the other hand, longer fibers reduce the flowability of fresh UHPC, compromising fiber dispersion and increasing the likelihood of entrapped air [39]. The resulting increase in porosity diminishes the packing density of the matrix and adversely affects compressive strength [40]. Similarly, Figure 6b illustrates that increasing the steel fiber volume fraction initially boosts compressive strength, which peaks at a 3% volume fraction and then diminishes at 4%. This observation aligns with findings reported in the cited literature [4,41]. Similar to the effect of fiber length, when the steel fiber volume fraction exceeds 3%, the decrease in flowability leads to the increased porosity due to more air, thereby reducing compressive strength.
At a steel fiber dosage of 2%, as shown in Figure 6c, the diameter of the fibers has a negligible impact on compressive strength, which ranges from 153.83 MPa to 156.29 MPa. Figure 6d shows that incorporating hooked and corrugated steel fibers results in strength decrements of 3.44 MPa and 6.01 MPa, respectively, compared to straight fibers. This phenomenon indicates that the shape of steel fibers also has a minor impact on compressive strength.
In summary, the length and volume percentages of steel fibers significantly influence the compressive strength of UHPC, while the shape of the fibers has a relatively minor effect. Additionally, the diameter of steel fibers has a negligible impact on the compressive strength of UHPC. It also should be noted that the inclusion of steel fibers has both positive and negative effects on the compressive strength of UHPC, considering the details of the length and volume percentage of steel fibers.

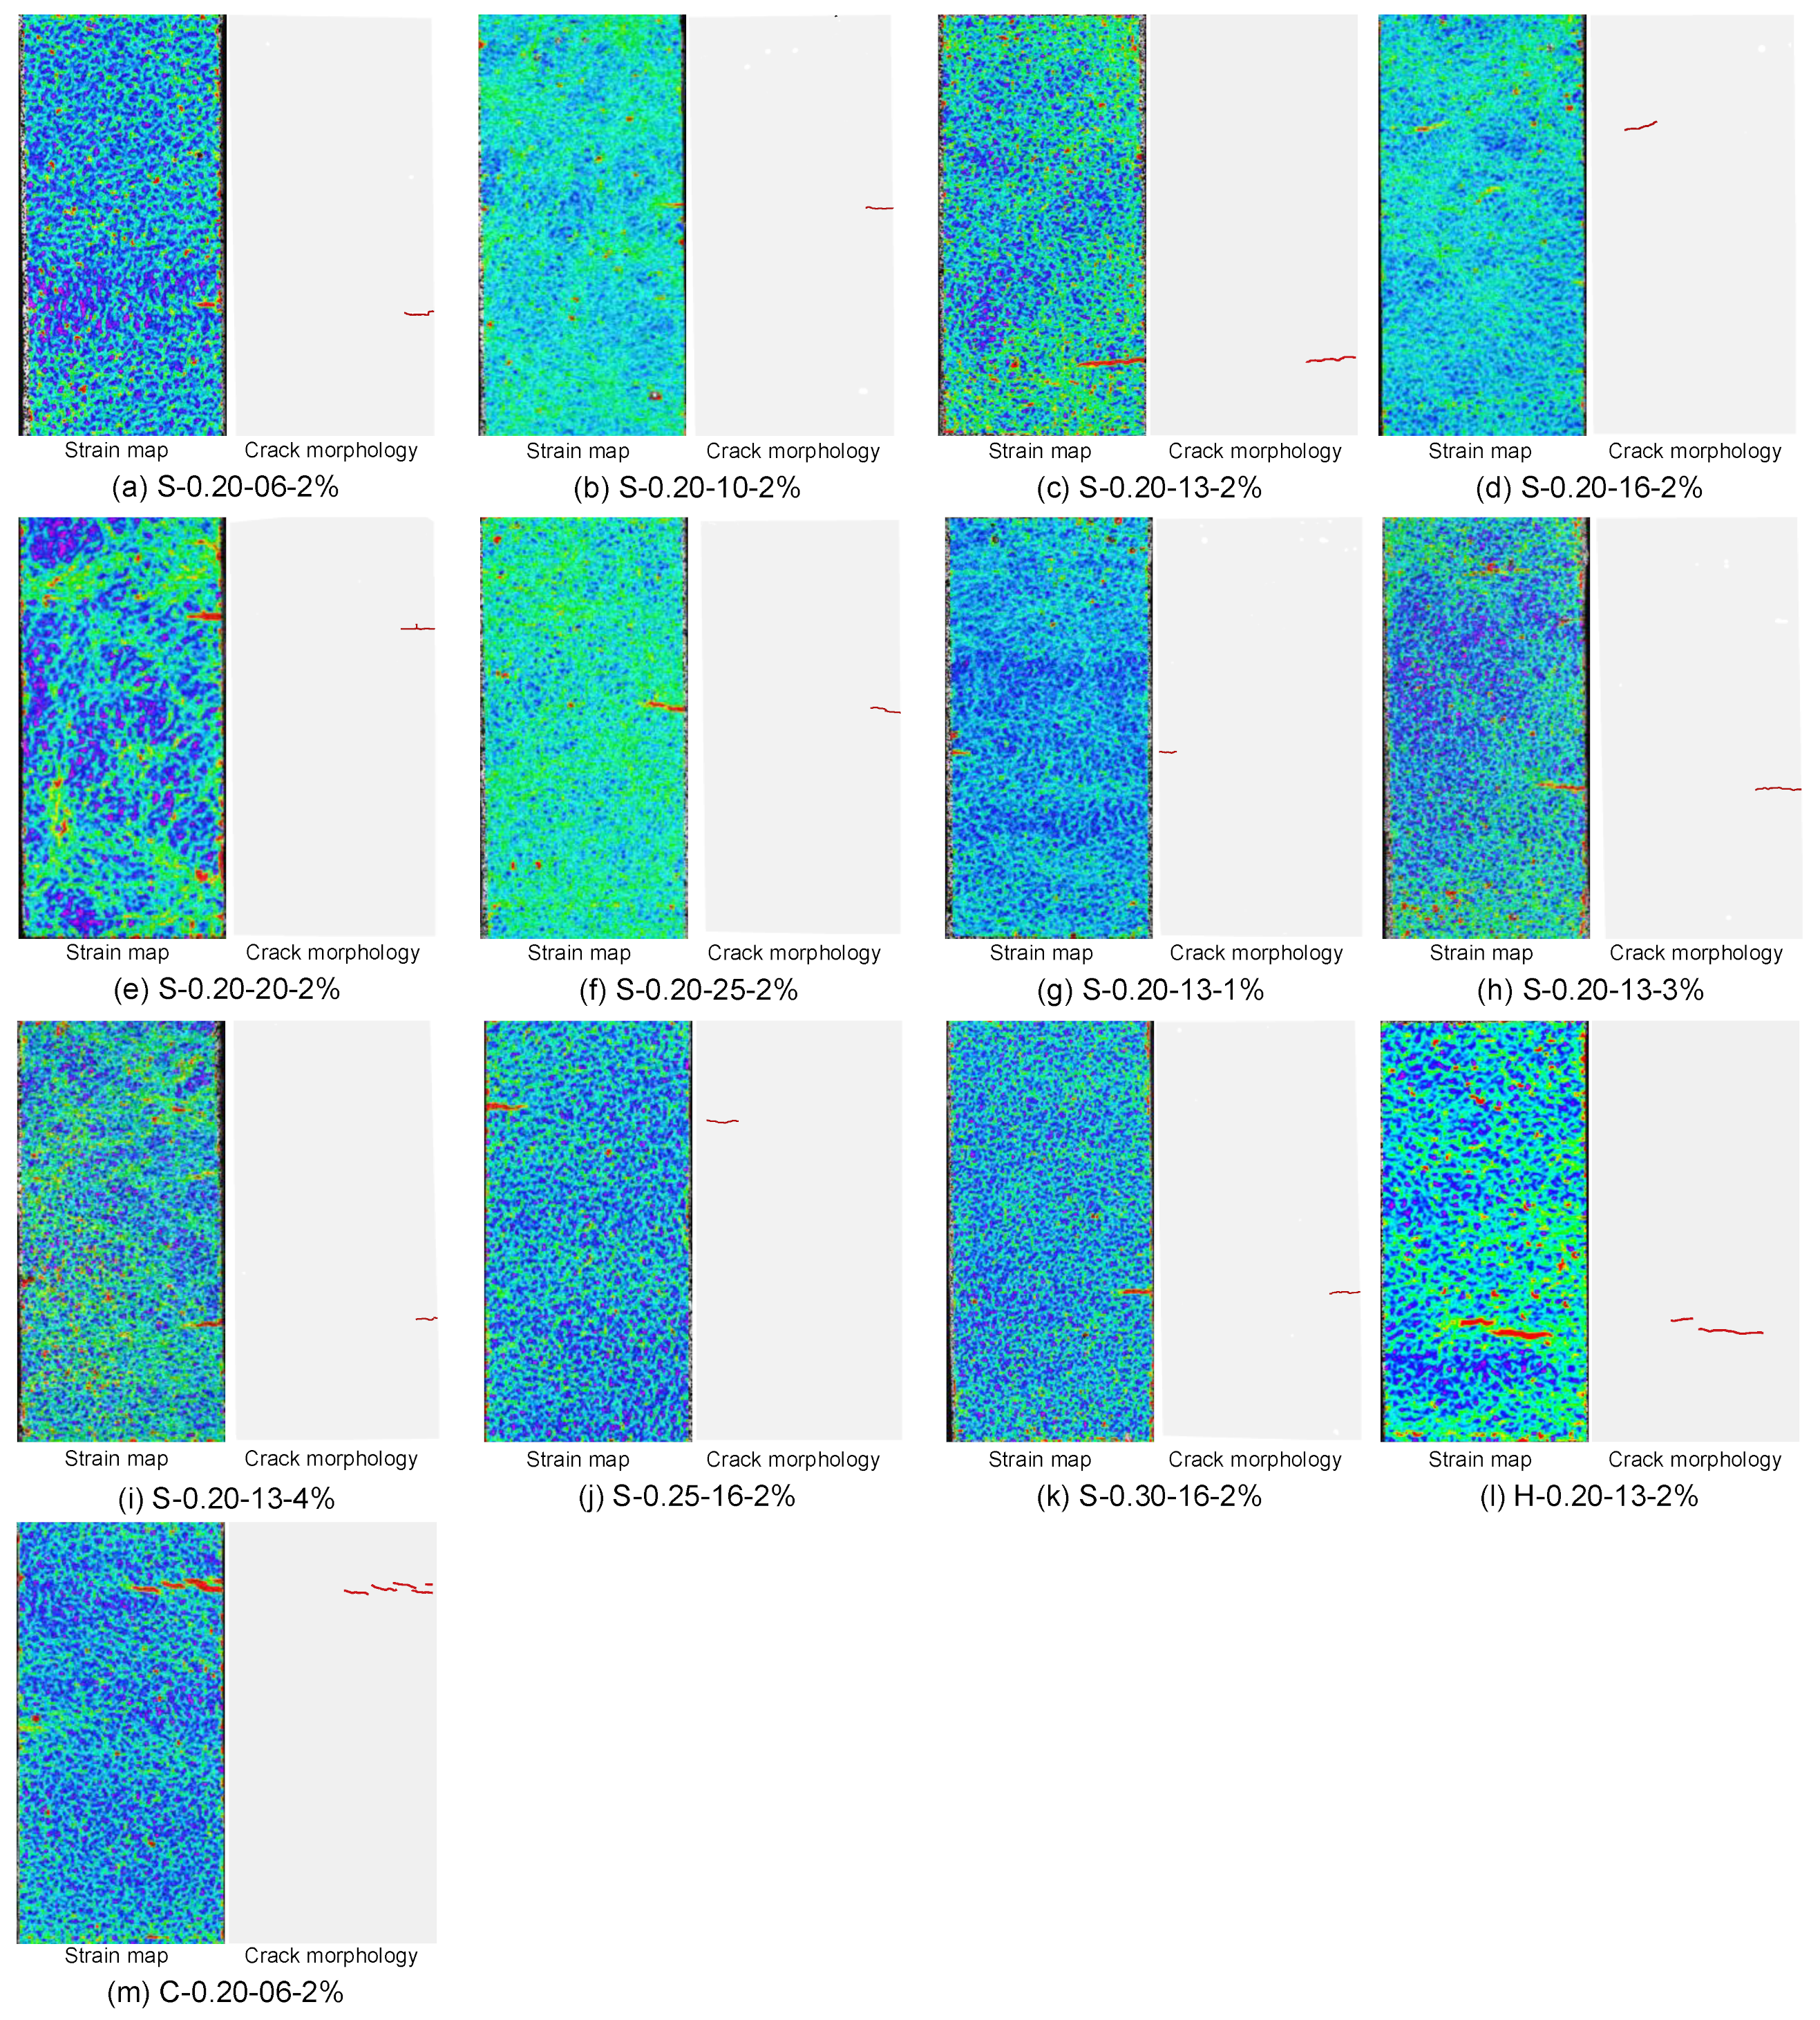
3.3. Initial Crack Pattern of UHPC

Initial crack pattern monitoring was conducted on specimens from all series. As shown in Figure 7, the experiments reveal that the length, volume, and diameter of all straight steel fibers have little impact on the initiation of cracking. However, the morphology of the initial cracks is notably influenced by the shape of the steel fibers. Therefore, this paper presents only the typical initial crack patterns of different fiber shapes. Figure 7 showcases the initial crack patterns associated with three distinct steel fiber shapes. In the case of straight fibers, as depicted in Figure 7a, the cracks predominantly align perpendicular to the stress direction and are continuous, with a crack width of approximately 0.004 mm obtained through DIC analysis. Figure 7l demonstrates that with hooked fibers, the crack orientation remains approximately perpendicular to the stress direction, yet two discontinuous cracks appear, with a width of about 0.003 mm. Figure 7m exhibits that corrugated fibers result in shorter and more discontinuous cracks than the other two fiber shapes, with cracks measuring approximately 0.004 mm in width.
In the UHPC matrix, stress concentration occurs at the bends of the shaped fibers. As illustrated in Figure 2b, stress concentration points are presented at the deformed regions of the steel fibers, while straight fibers do not exhibit stress concentration points. Each hooked fiber has four stress concentration points, while each corrugated fiber has six. These stress concentration points cause damage to the surrounding matrix [42]. As the number of stress concentration points increases, the cracks become shorter. The differing initial crack patterns for these three fiber shapes may be attributed to the number of stress concentration points.

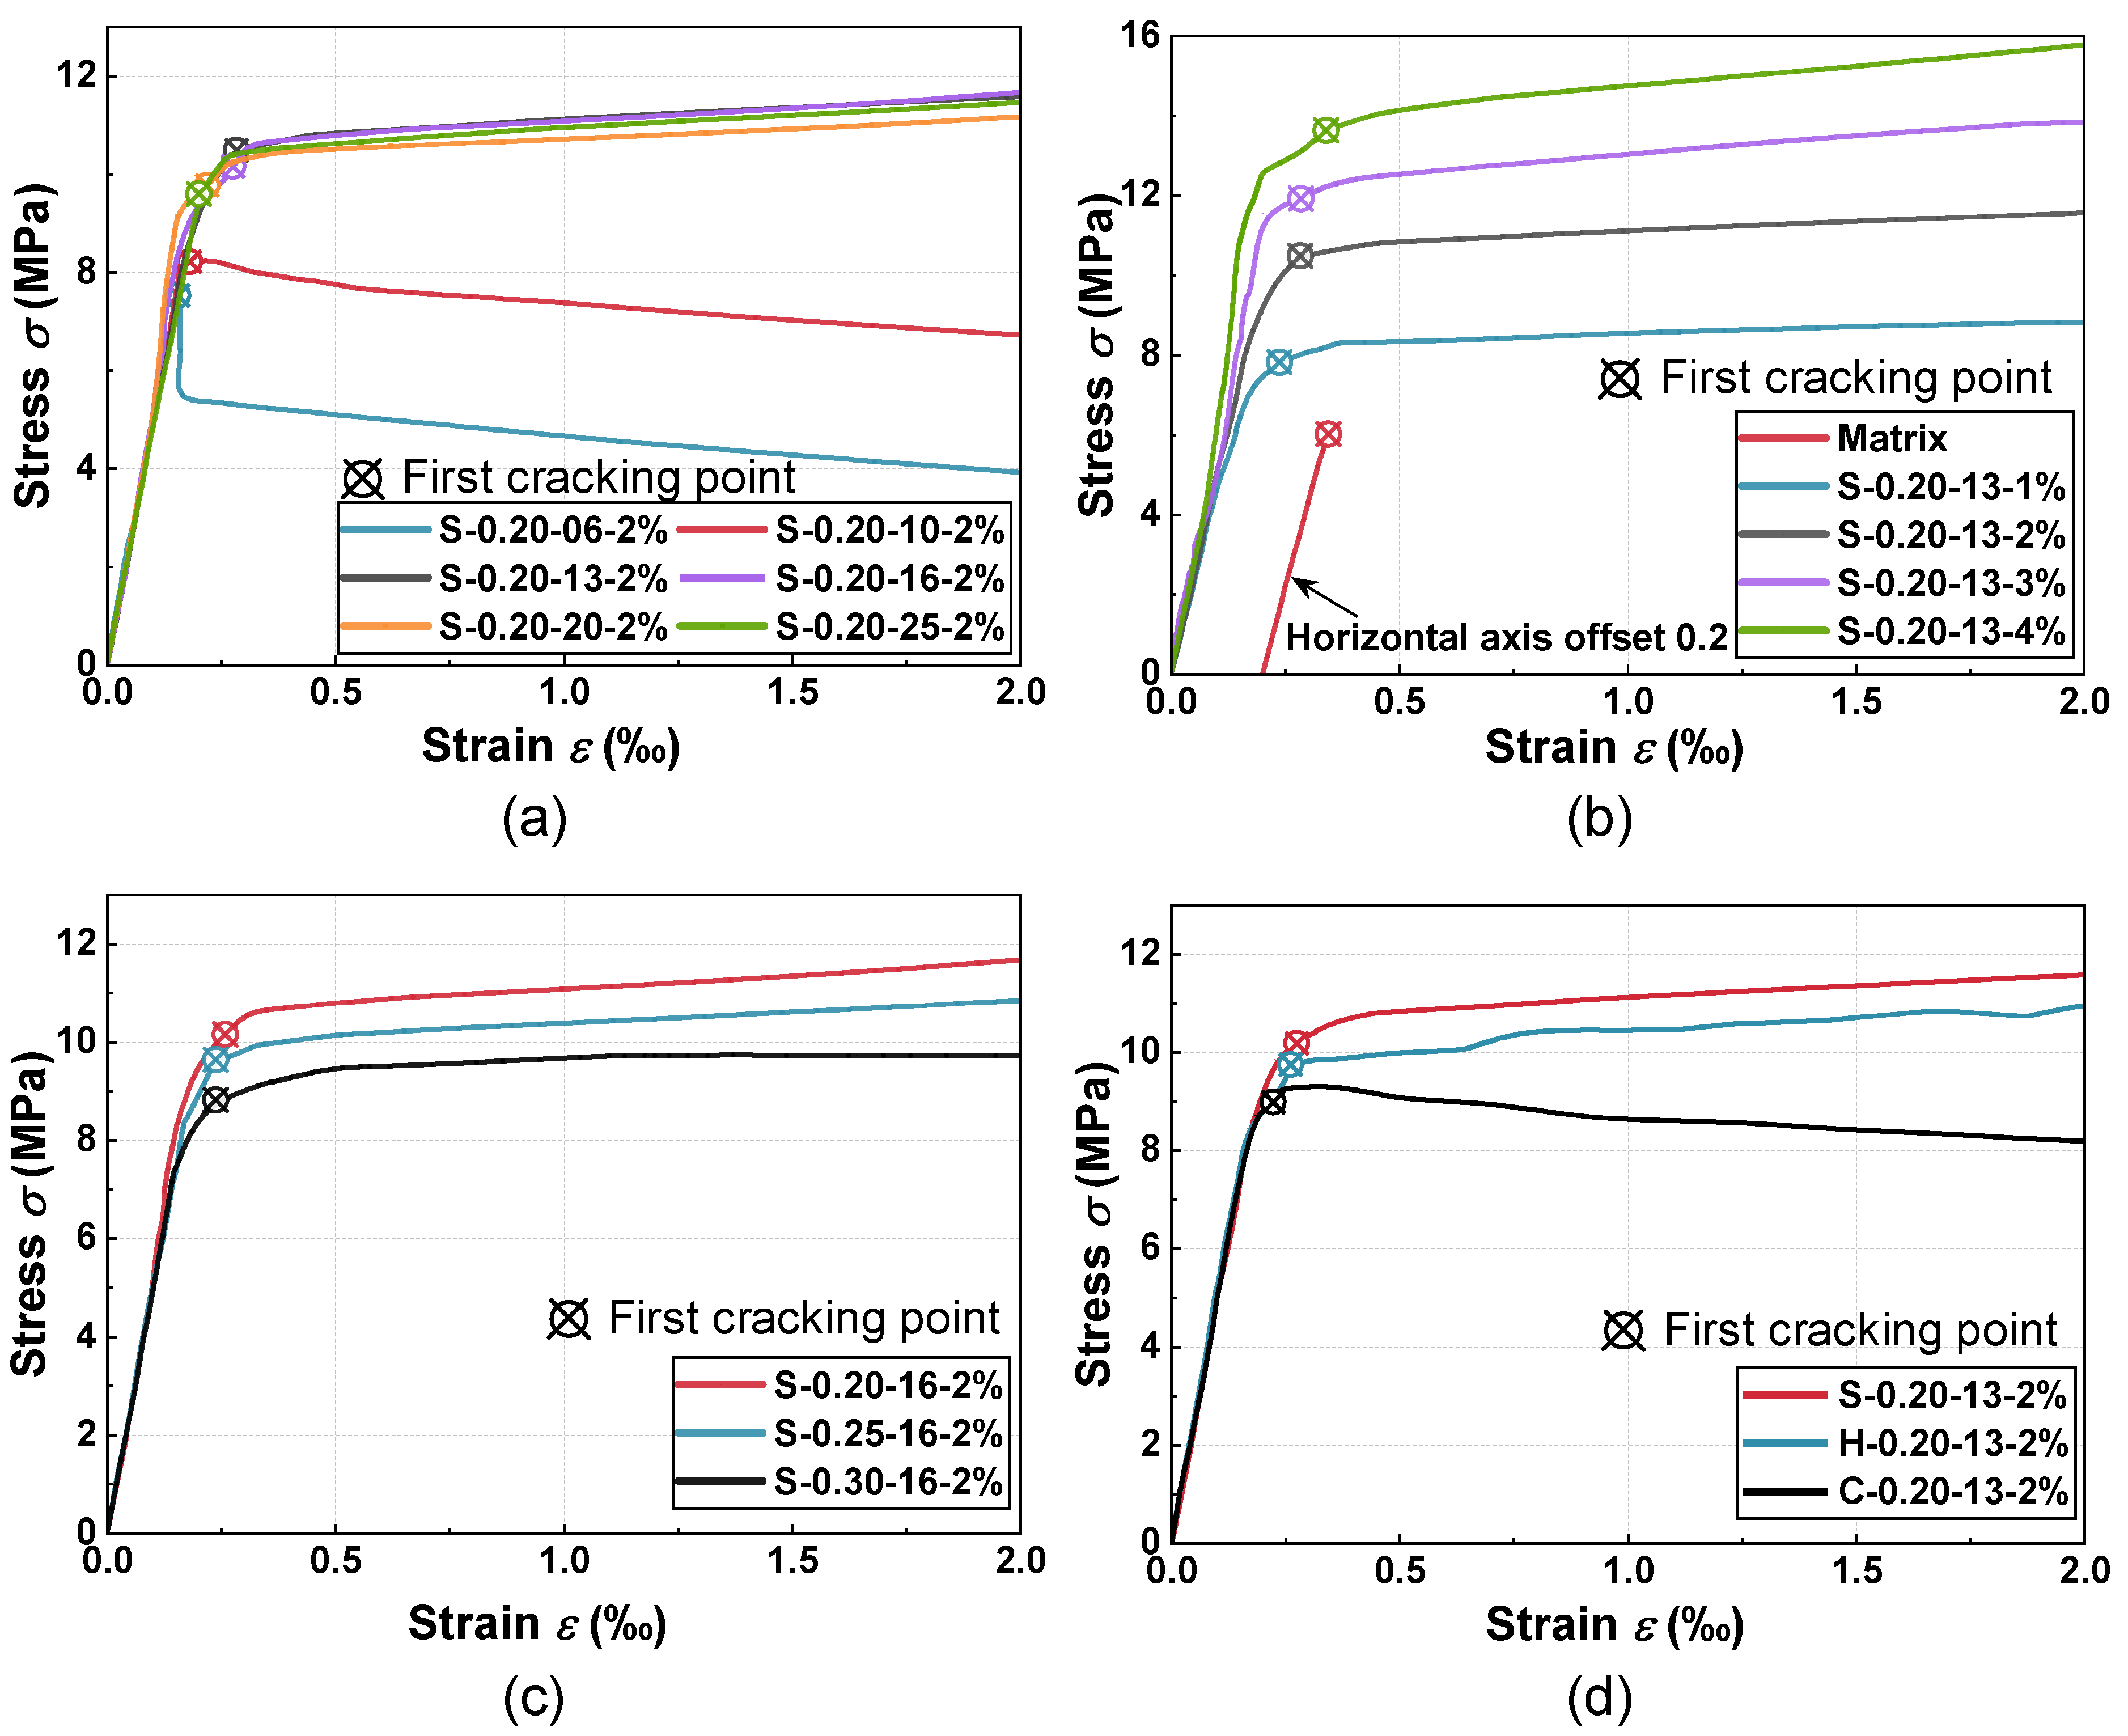
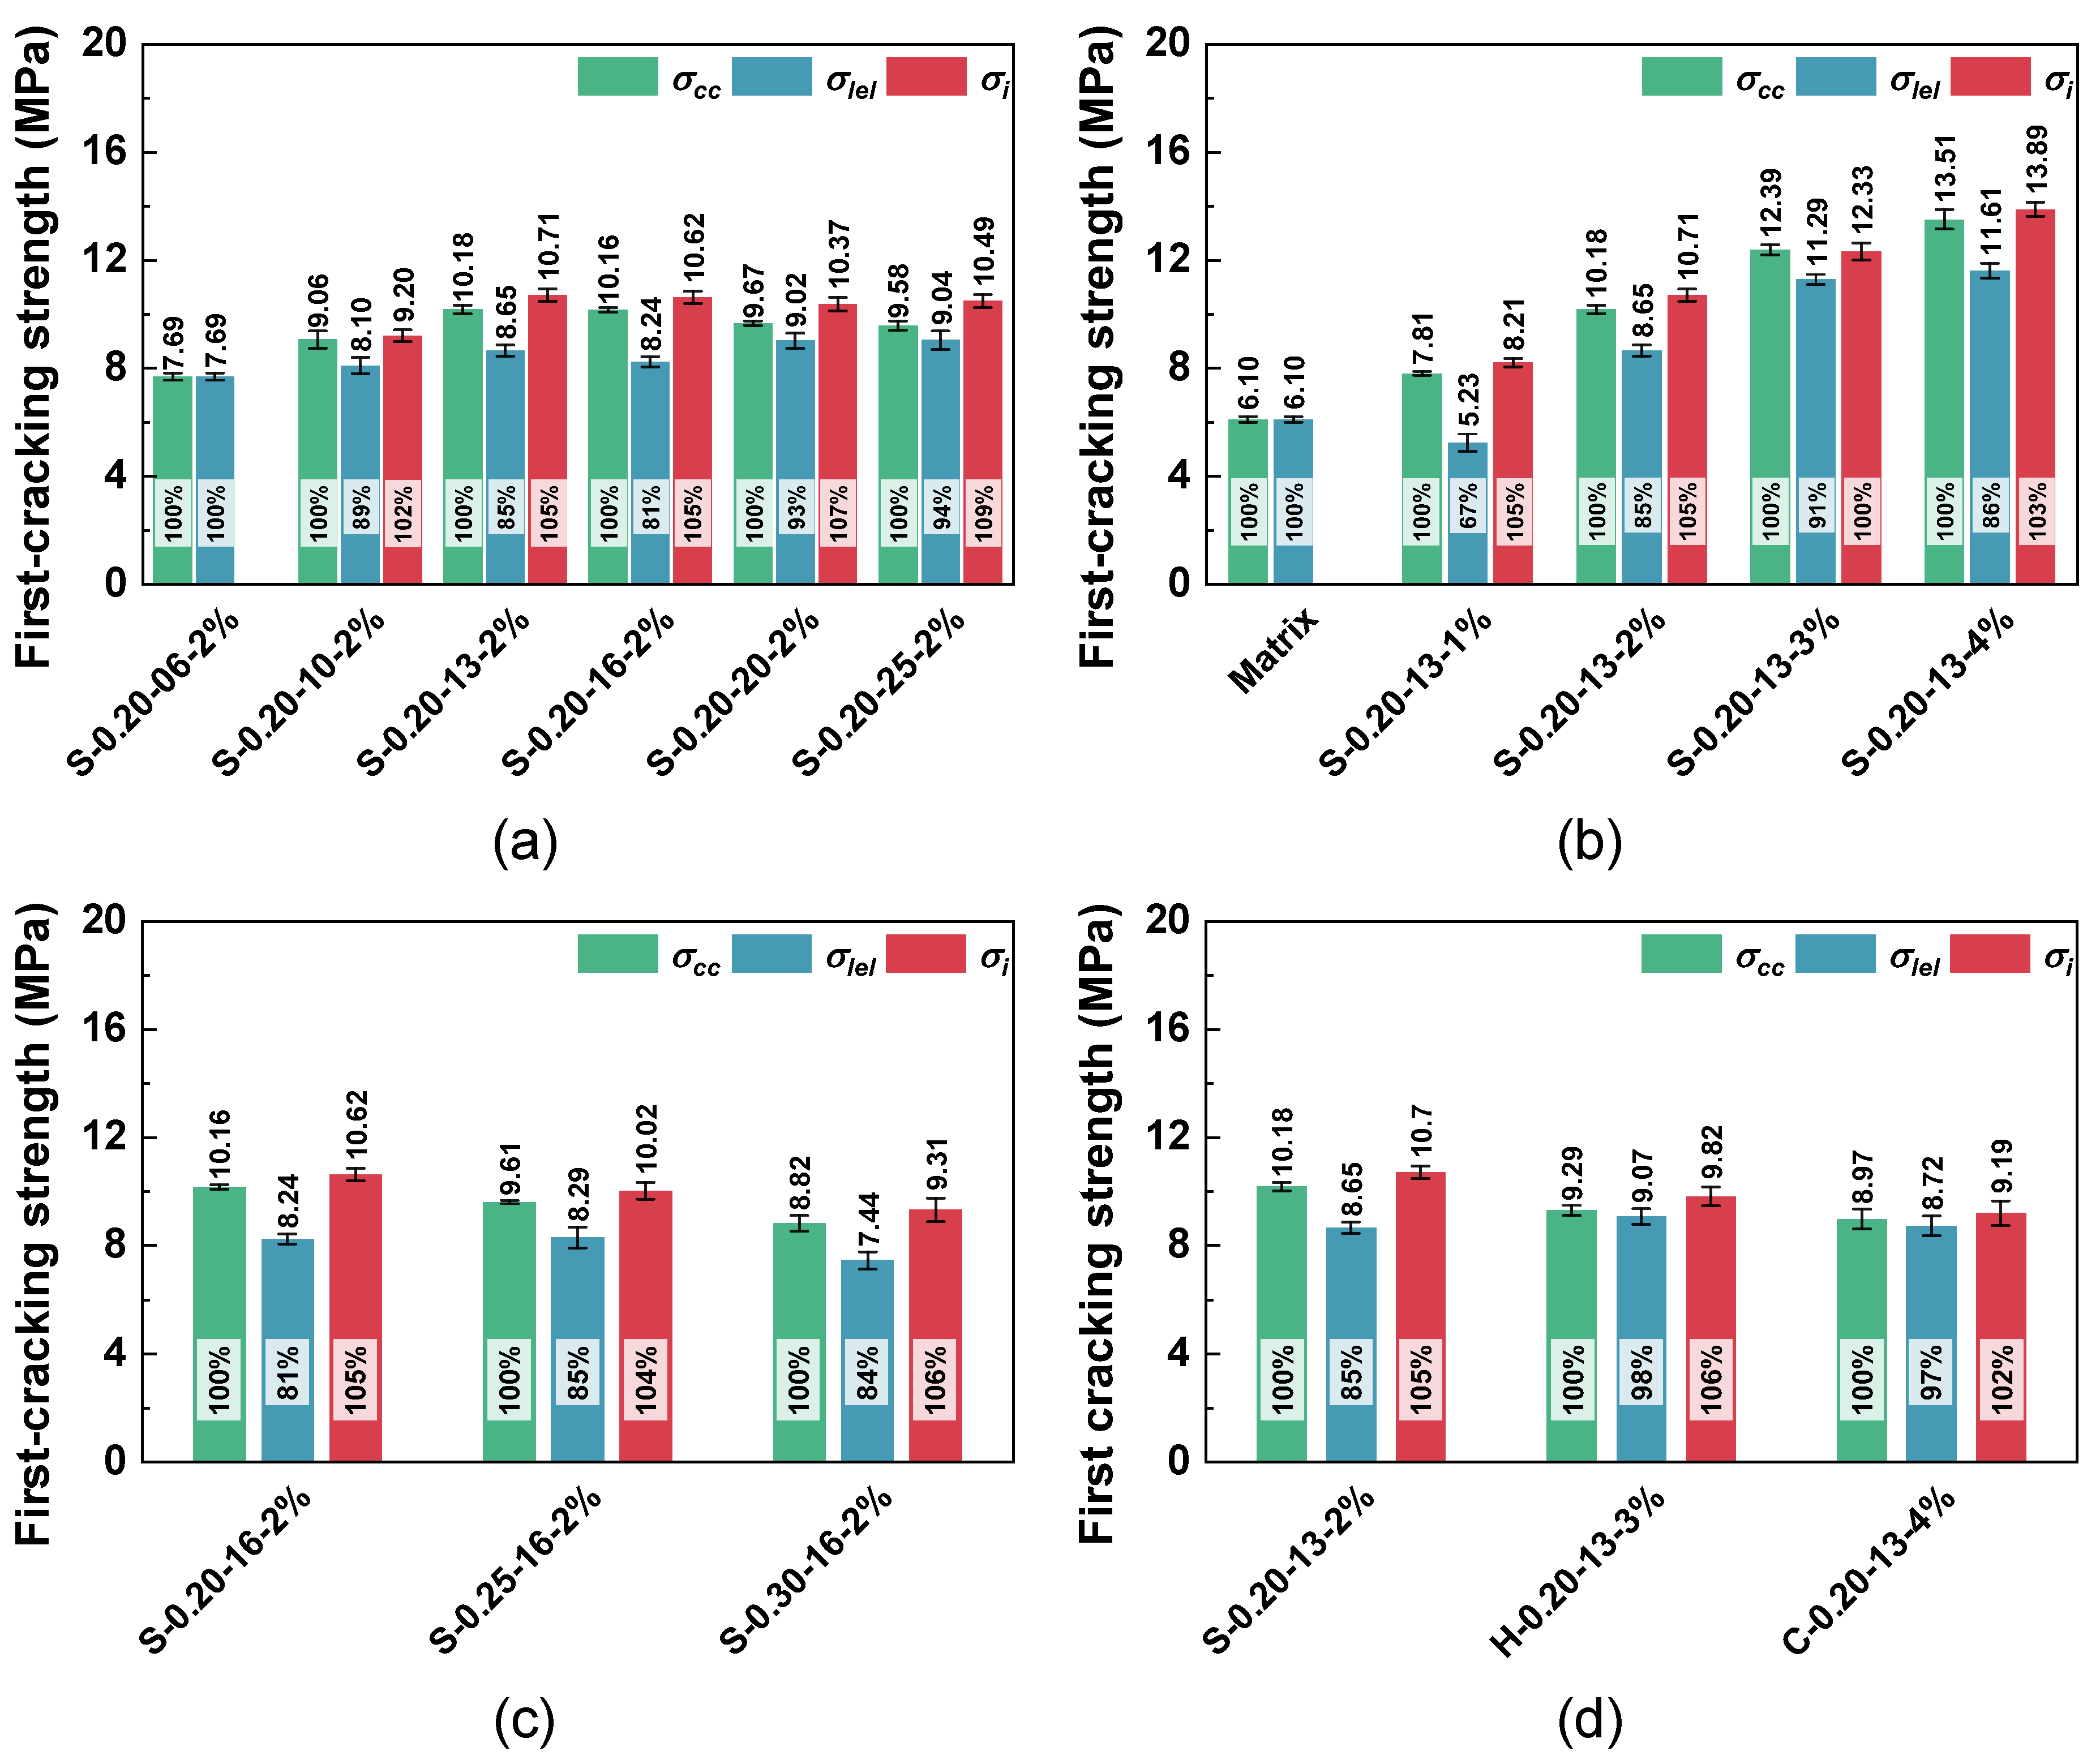
3.4. Effect of Steel Fiber on First-Cracking Behavior of UHPC

Figure 8 illustrates the average uniaxial tensile stress curves of UHPC with different fibers, and the first cracking points are marked. It is observed that regarding the initial cracking points for the Matrix group (Figure 8b) and S-0.20-06-2% (Figure 8a), the initial cracking occurs at the peak load, indicating pronounced brittleness. In contrast, for the other specimens, the initial cracking points appear in the nonlinear region. This observation aligns with the findings of Bian et al. [43] and Wang et al. [44], both of whom identified the onset of first cracking in UHPC within the nonlinear stage using Acoustic Emission (AE) monitoring. The first-cracking strength and corresponding strain (first-cracking strain) for the various series of specimens are determined using the methodology outlined in Section 2.3 and are presented in Table 3. Overall, the Matrix group exhibits the lowest first-crack strength, averaging 6.10 MPa. In contrast, other UHPC series incorporating steel fibers show varying degrees of enhancement in first-cracking strength.
As shown in Figure 8a, when the fiber length is greater than or equal to 10 mm, UHPC exhibits strain hardening behavior, where the strength does not decrease after first cracking. However, when the fiber length is 6 mm, strain softening behavior is observed. After cracks occur in UHPC, the stress at the crack locations is borne by the steel fibers, which play a bridging role. Strain hardening occurs when the bridging capacity of the fibers crossing the cracks is much larger than the initial tensile strength of UHPC. This indicates that the bridging effect of fibers is related to fiber length, with longer lengths providing greater anchorage force. The first-cracking strength increases with fiber length until it reaches its peak value at a length of 13 mm, with an average of 10.18 MPa. As discussed earlier, the increase in fiber length will lead to a loss of flowability, resulting in the introduction of more air. This will negatively affect the strength of the matrix. Therefore, as the length of steel fibers increases from 6 mm to 25 mm, the trend of first-cracking strength initially increases (from 6 mm to 13 mm) and then decreases (from 13 mm to 25 mm).
In Figure 8b, the Matrix group exhibits brittleness during axial tension without a descending segment, and its stress–strain curve is offset by 0.2 along the horizontal axis for clearer depiction. The other specimens exhibit strain hardening behavior. As the steel fiber volume fraction increases from 1% to 4%, the rise in initial cracking strength for each 1% increase in fiber volume fraction is 2.37 MPa, 2.21 MPa, and 1.11 MPa, respectively.
Figure 8c indicates that while the diameter of fibers has little effect on the slope of the linear segment of the stress–strain curve, it does affect the initial cracking strength. The first-cracking strength of S-0.25-16-2% and S-0.30-16-2% decreased by 0.55 MPa and 1.34 MPa, respectively, compared to S-0.20-16-2%. This indicates that an increase in the diameter of steel fibers leads to a decrease in the first-cracking strength. This phenomenon arises because of the following reason: at an equivalent volume fraction, smaller-diameter fibers yield a higher fiber count, improving the bond area and leading to a more significant reinforcement effect.
Figure 8d shows the effect of steel fiber shape on first-cracking performance. Notably, when corrugated fibers are incorporated, UHPC exhibits low strain hardening behavior. Compared to straight fibers, the first-crack strength of UHPC with hooked fibers and corrugated fibers is lowered by 0.89 MPa and 1.21 MPa, respectively. Pull-out tests of steel fibers indicate that hooked fibers have the highest tensile strength, followed by corrugated fibers and then straight fibers [45]. This discrepancy can be attributed to the fundamental differences in the testing methods. Pull-out tests primarily isolate the fiber–matrix interfacial bond behavior and evaluate parameters such as pull-out force and energy dissipation. In contrast, direct tensile tests reflect the composite action between the matrix and fibers and are highly sensitive to matrix integrity and internal stress distributions. Deformed fibers, due to their irregular geometries, tend to introduce pronounced stress concentrations at anchorage points during tensile loading, which can lead to premature microcracking of the matrix before significant fiber bridging is activated [46]. Therefore, despite their superior performance in pull-out tests, deformed fibers such as hooked and corrugated types were found to reduce the first-cracking strength in this study. Among them, corrugated fibers induced the most severe stress concentrations, resulting in the lowest cracking strength, while hooked fibers exhibited a similar, though slightly less adverse, effect. In contrast, straight fibers provided more uniform stress transfer and effectively delayed crack initiation, thereby contributing to higher first-cracking strength.
Previous studies by Park et al. [9], Wu et al. [10], and Yoo et al. [11], based on flexural tests in accordance with ASTM C1018, reported that first-cracking strength was largely unaffected by fiber volume fraction or type. In contrast, the present results from DTTs indicate that both parameters have a significant influence. This discrepancy underscores the limitations of using load–displacement data alone to characterize the initial cracking behavior of UHPC.

3.5. Comparison of First-Cracking Strength According to Different Methods

As shown in Figure 1, two indirect methods for determining the first-cracking strength of UHPC are presented: the linear elastic limit point value (σlel) and the intersection point value (σi) proposed by Park [20]. To compare these two methods with the method by DIC, Figure 9 presents the first-cracking strength values obtained by each method, with σcc representing the first-cracking strength determined by DIC. It is important to note that the intersection point method is not applicable to strain-softening UHPC. Consequently, there are no values for this method for the specimens Matrix and S-0.20-06-2% in Figure 9.
For the linear limit point method, the values of σlel and σcc are the same for strain-softening UHPC. However, for strain-hardening UHPC, σlel is lower than σcc, with the value of σlel/σcc ranging from 67% to 98%. On the other hand, for the intersection point method, σi is always higher than σcc, with the value of σlel/σcc ranging from 102% to 109%. In summary, for strain-softening UHPC, the linear elastic limit point method can be used to determine the first-cracking strength. For strain-hardening UHPC, the intersection point method can serve as a simplified approach to determine the first-cracking strength, but it should be noted that this method tends to slightly overestimate the actual cracking strength.

4. Establishment of a Model for Predicting the First-Crack Strength

4.1. Background

From the perspective of composite materials, the cracking strength of fibrous composites is derived from the contributions of both the matrix and the fibers. For a composite containing uniaxial continuous fibers, the tensile strength σcc can be expressed by the law of mixtures as in Equation (1):
σ c = σ m V m + σ f V f = σ m ( 1 V f ) + σ f V f
where σ and V represent the stresses and volume fractions, respectively, and the suffixes c, m, and f represent the composite, matrix, and fiber, respectively. Based on the above theory, Naaman [47] uses Equation (2) to estimate the cracking strength of fiber-reinforced cement composites:
σ c , 1 = σ m V m + α τ V f l f d f = σ m ( 1 V f ) + α τ V f l f d f
where α is a factor, which can be estimated by experimental result, and τ is the interfacial bond stress. Furthermore, Swamy and Mangat [48] use Equation (3) to estimate the cracking strength of concrete reinforced with discontinuous steel fibers, which considers matrix tensile strength, interfacial bond stress (τ) between fibers and matrix, volume fraction, and aspect ratio.
σ c , 2 = σ m 1 V f + 0.82 τ V f l f d f

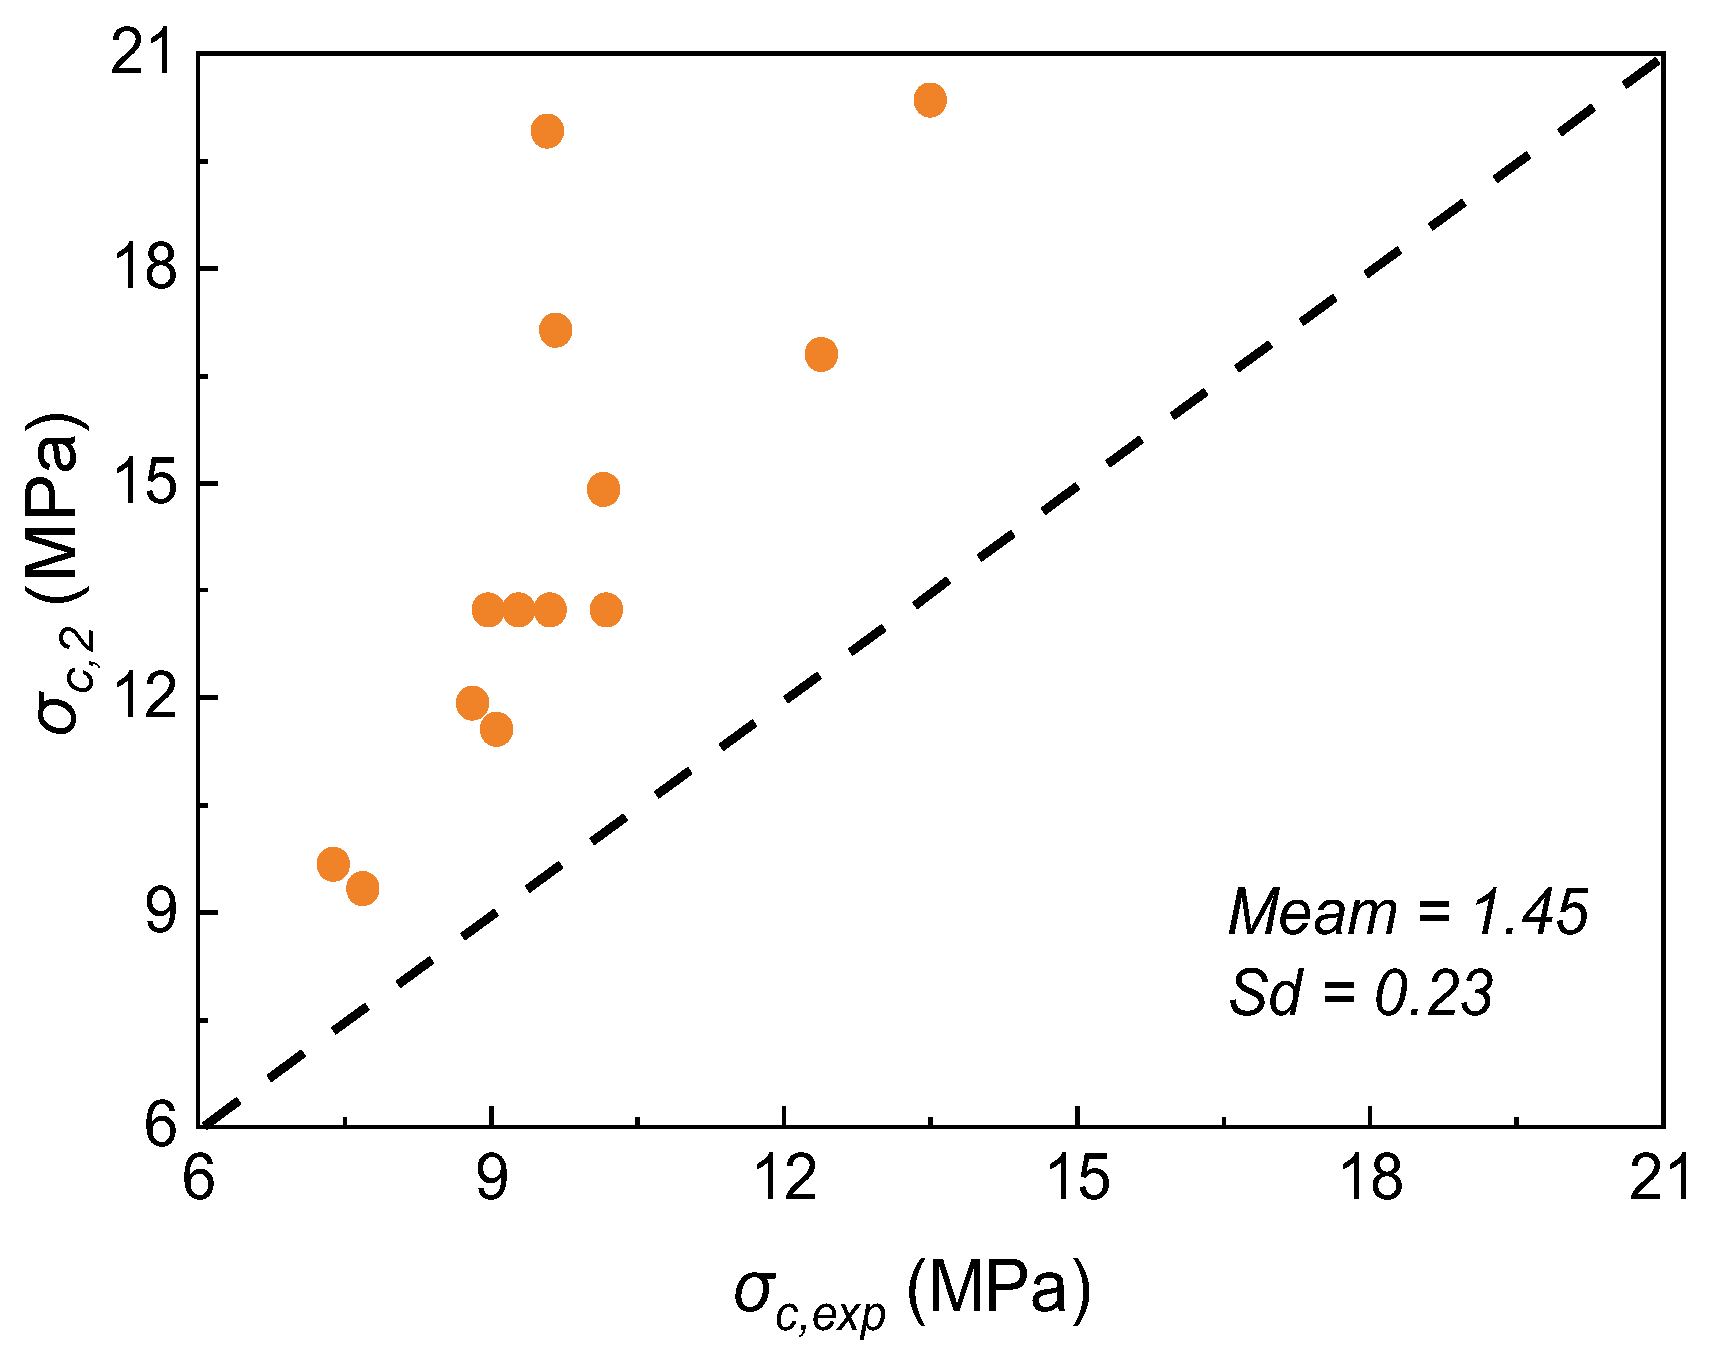
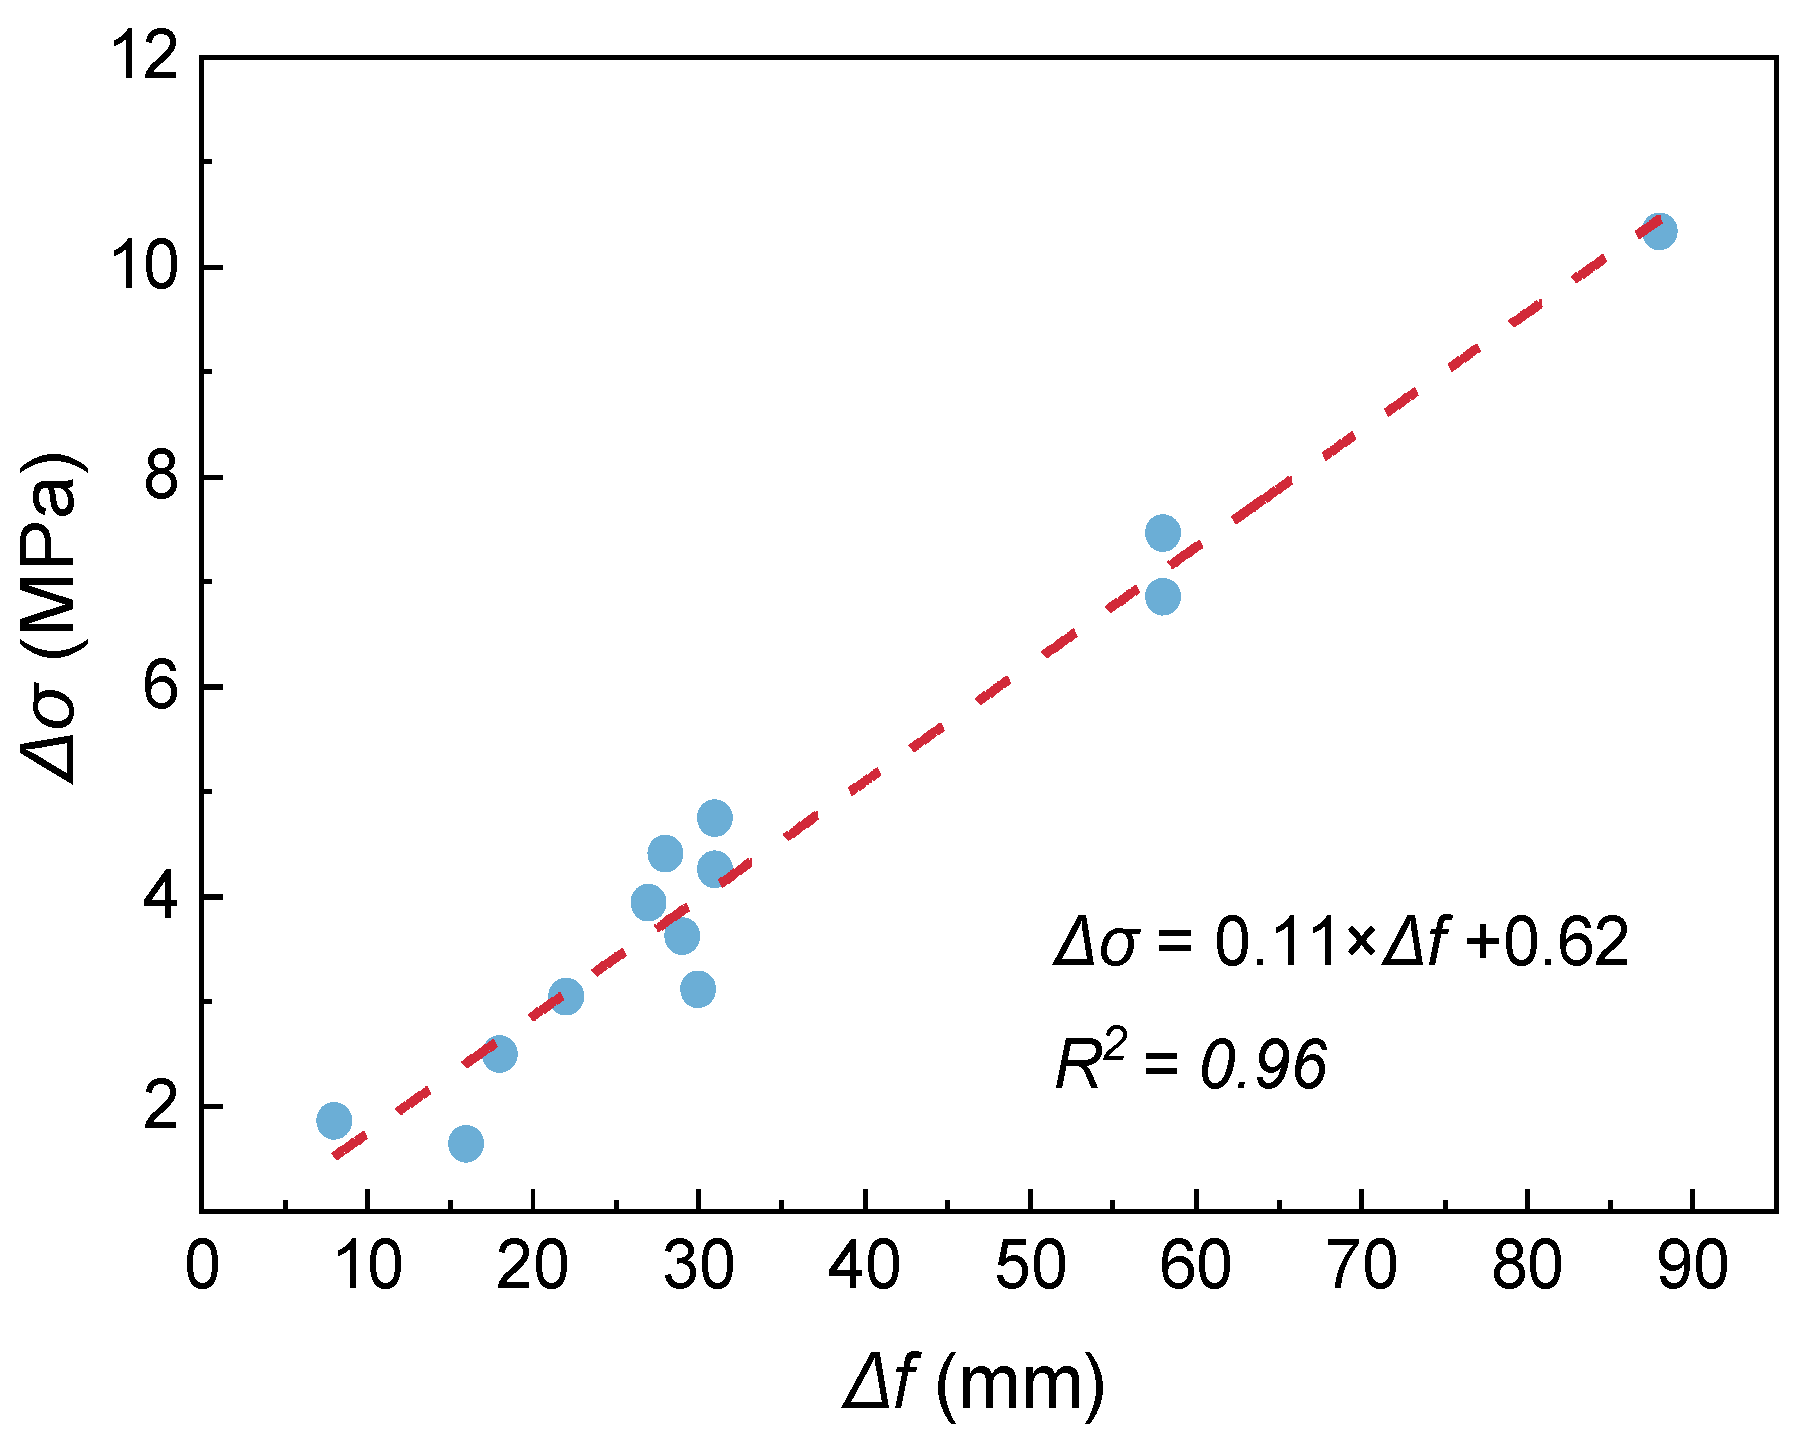
4.2. Establishment and Verification of Formula

Equations (2) and (3) both consist of contributions from the matrix and the fibers. However, both equations consider only the positive effect of the fibers, neglecting the negative impact of steel fibers on the matrix strength. As previously discussed, the analysis demonstrates that the incorporation of steel fibers reduces the flowability of UHPC. This decrease in flowability can lead to air entrapment within the material, which in turn adversely affects its mechanical properties. Therefore, a correlation can reasonably be inferred between reduced flowability and decreased first-cracking strength. By substituting the experimental data from this study into Equation (3), the derived models do not align closely with the experimental values, showing a mean deviation of 1.45 and a standard deviation of 0.23, as illustrated in Figure 10. It should be noted that according to Lee et al. [49], the value of τ is selected as 6.80 MPa. This value has been extensively validated and widely cited in subsequent studies [50,51], providing a reliable basis for its adoption in the present model. The results in Figure 10 indicate that neglecting the negative effect of steel fibers leads to inaccurate predictions of first-cracking strength.
To complement Equation (3) on the neglection of the negative impact of steel fibers on the matrix strength, this paper links the discrepancies observed in Equation (3) to the loss of UHPC’s flowability. Assuming that the predicted discrepancy Δσc is related to the loss of flowability Δfi, the relationship can be expressed as follows:
Δ σ c = σ c , 2 σ c , exp
where σc,2 is the first-cracking strength calculated by Equation (3), σc,exp represents the first-cracking strength obtained experimentally, and Δσc represents the difference between the two. The definition of flowability loss Δfi is shown in Equation (5):
Δ f i = f m a t r i x f i
where fmatrix represents the flowability of the UHPC matrix (without steel fiber) and fi represents the flowability of the UHPC with steel fibers. The results in Figure 11 show that Δfi and Δσc have a good linear relationship, and the fitted expression is Δ σ c = 0.11 Δ f + 0.62 , where the coefficient of determination (R2) is 0.96. Thus, the flowability loss is used to characterize the negative impact of steel fibers on the matrix strength, by defining a correction factor σre that equals to
σ r e = 0.11 Δ f + 0.62
Combining Equations (3) and (6), the revised equation is obtained as follows:
σ c , 3 = σ m 1 V f + 0.82 τ V f l f d f σ r e = σ m 1 V f + 0.82 τ V f l f d f 0.11 Δ f 0.62
To demonstrate the applicability of Equation (7), several axial tensile tests [43,44,52] were collected, where the first-cracking strength was determined by direct methods (DIC or AE). Detailed results are presented in Table 4. The results, shown in Figure 12, indicate that the model calculated using Equation (7) corresponds well with experimental data, having a mean of 1.07 and a standard deviation of 0.15. Therefore, the implementation of this updated prediction model, which considers the adverse effects of steel fibers, is validated as an effective method for predicting the first-crack strength of UHPC.

5. Conclusions

This study explores the effects of fiber length, volume fraction, diameter, and shape on the initial cracking behavior of UHPC using DIC technology. Additionally, the favorable and adverse role of steel fibers in influencing first-cracking performance is considered, leading to the establishment of an updated model for predicting the initial cracking strength of UHPC. The following conclusions can be drawn.
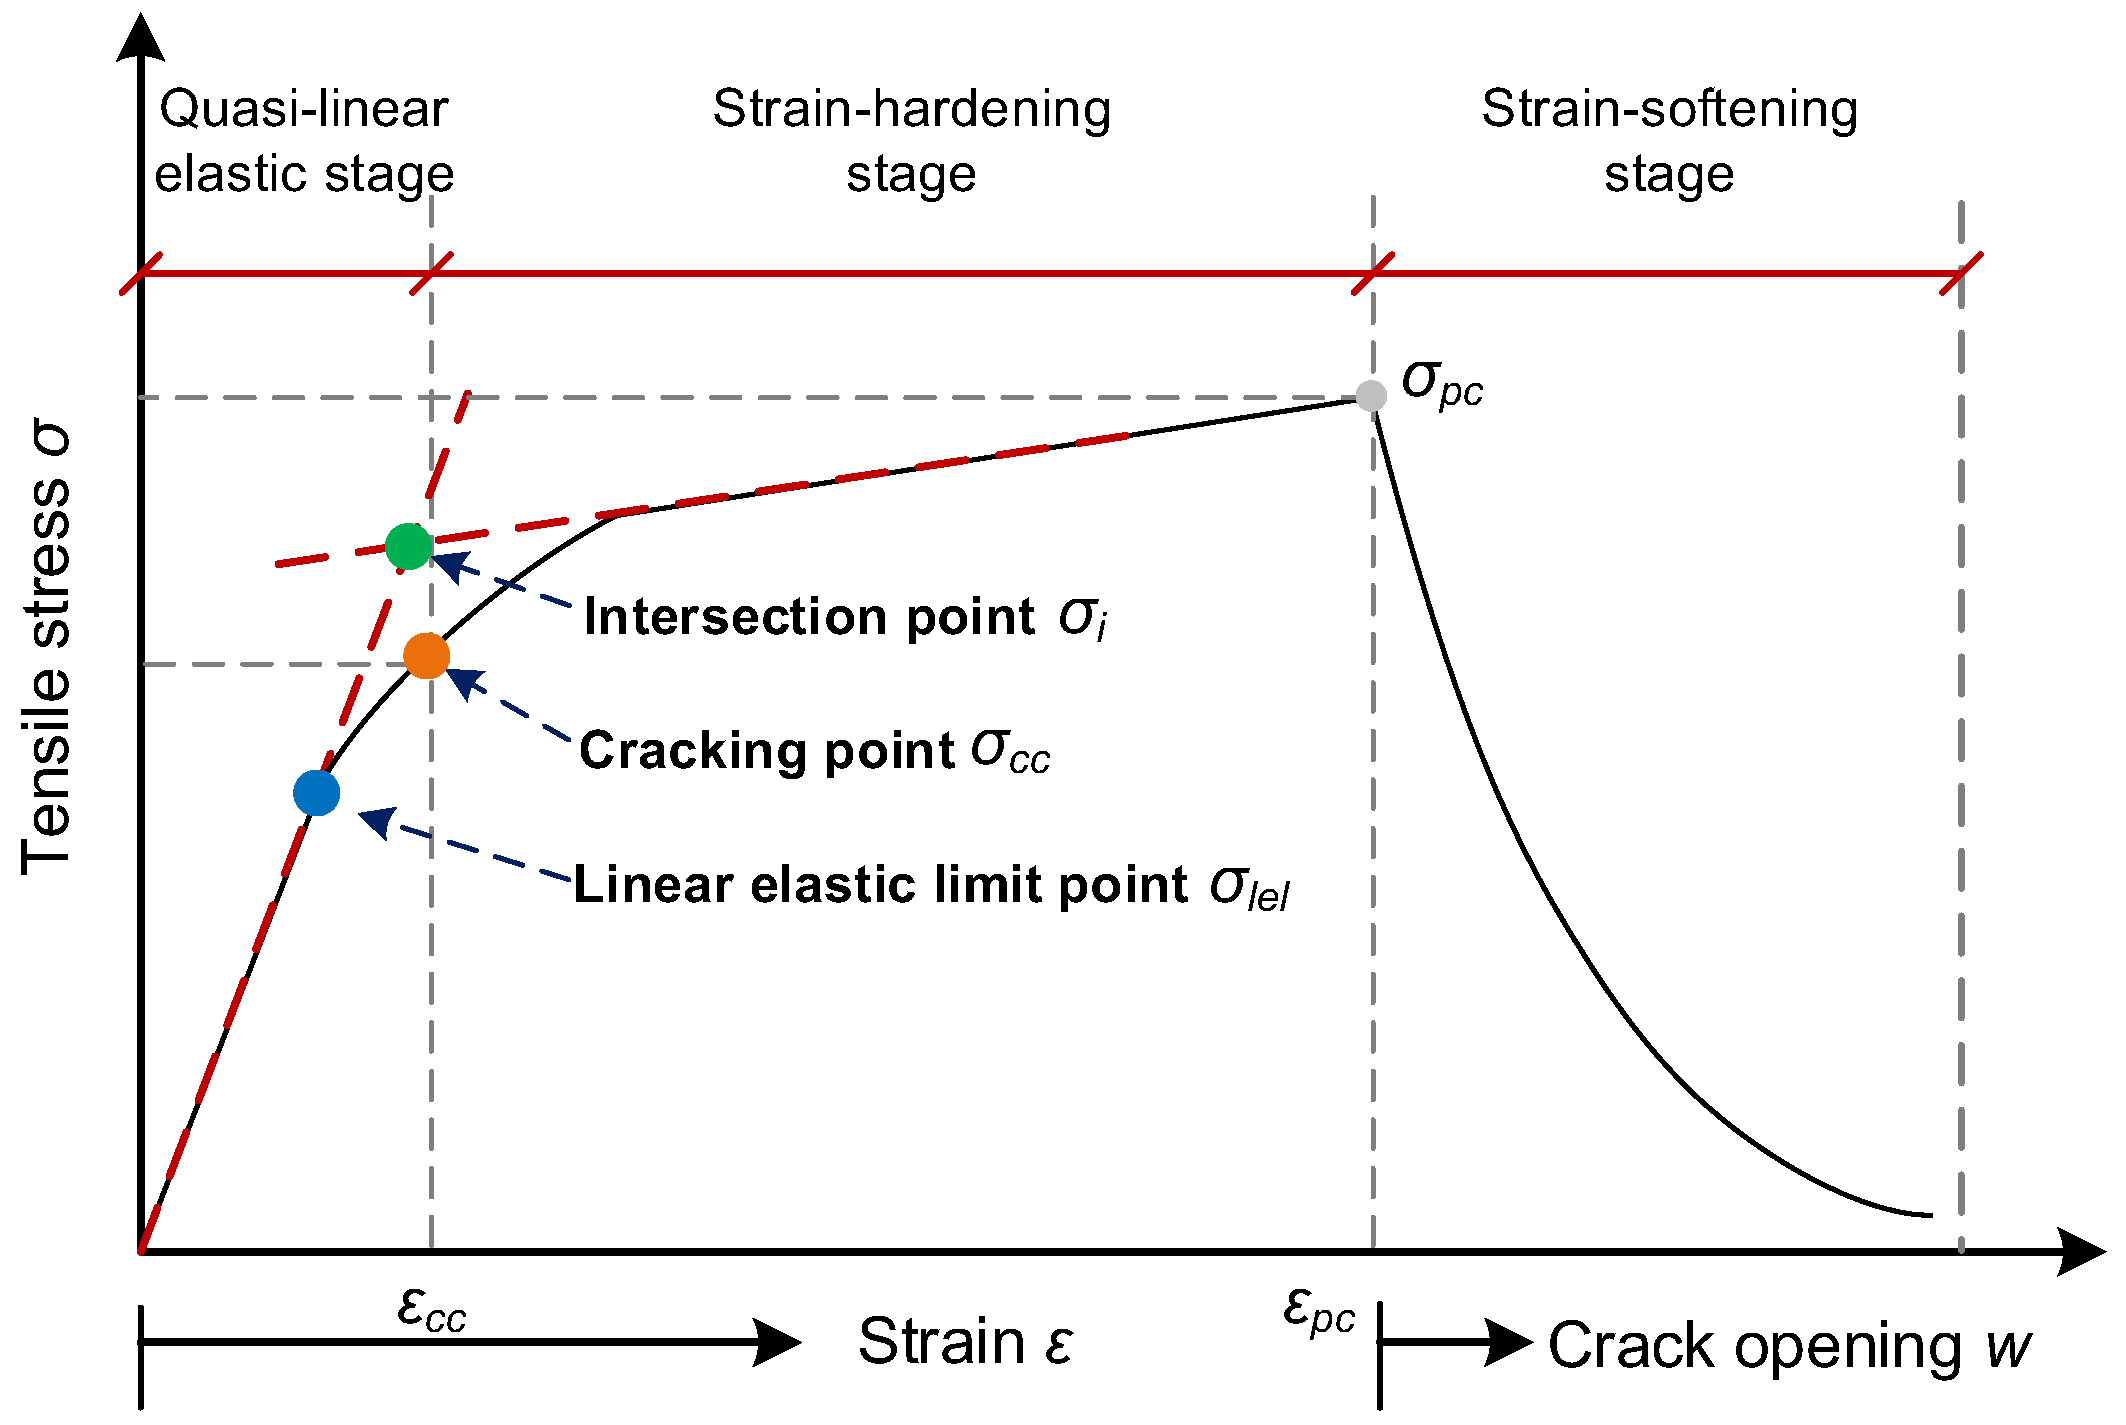
  • DIC analysis reveals distinctions between the first-cracking and linear limit points during DTT. Employing DIC technology reduces the uncertainty in manually pinpointing initial cracks or linear limit points, thus enabling objective determination of the initial cracking strength. Adopting the linear limit point as the benchmark for initial cracking leads to a more conservative design methodology for UHPC.
  • The length, volume fraction, diameter, and shape of steel fibers each contribute to the enhancement of the initial cracking strength, with improvements ranging from 26.07% to 121.31%. Among these parameters, fiber length and volume fraction exhibit a more pronounced influence, while the effects of diameter and shape are relatively modest.
  • Steel fibers can exert both favorable and adverse effects on the compressive and first-cracking strengths of UHPC. On the one hand, they reinforce the matrix, inhibit crack propagation, and enhance compressive strength; on the other hand, the incorporation of steel fibers also introduces air, which compromises the compactness of the packing system and reduces the matrix strength.
  • Stress concentration within steel fibers (such as corrugated or hooked-end fibers) affects both the first-cracking strength and the morphology of the resulting cracks. UHPC reinforced with corrugated fibers, which have more stress concentration points compared to straight and hooked-end fibers, exhibits a discontinuous crack pattern and the lowest initial cracking strength.
  • For strain-softening UHPC, the linear elastic limit point method can be used to determine the first-cracking strength. For strain-hardening UHPC, the intersection point method can serve as a simplified approach to determine the first-cracking strength, though it tends to slightly overestimate the actual cracking strength.
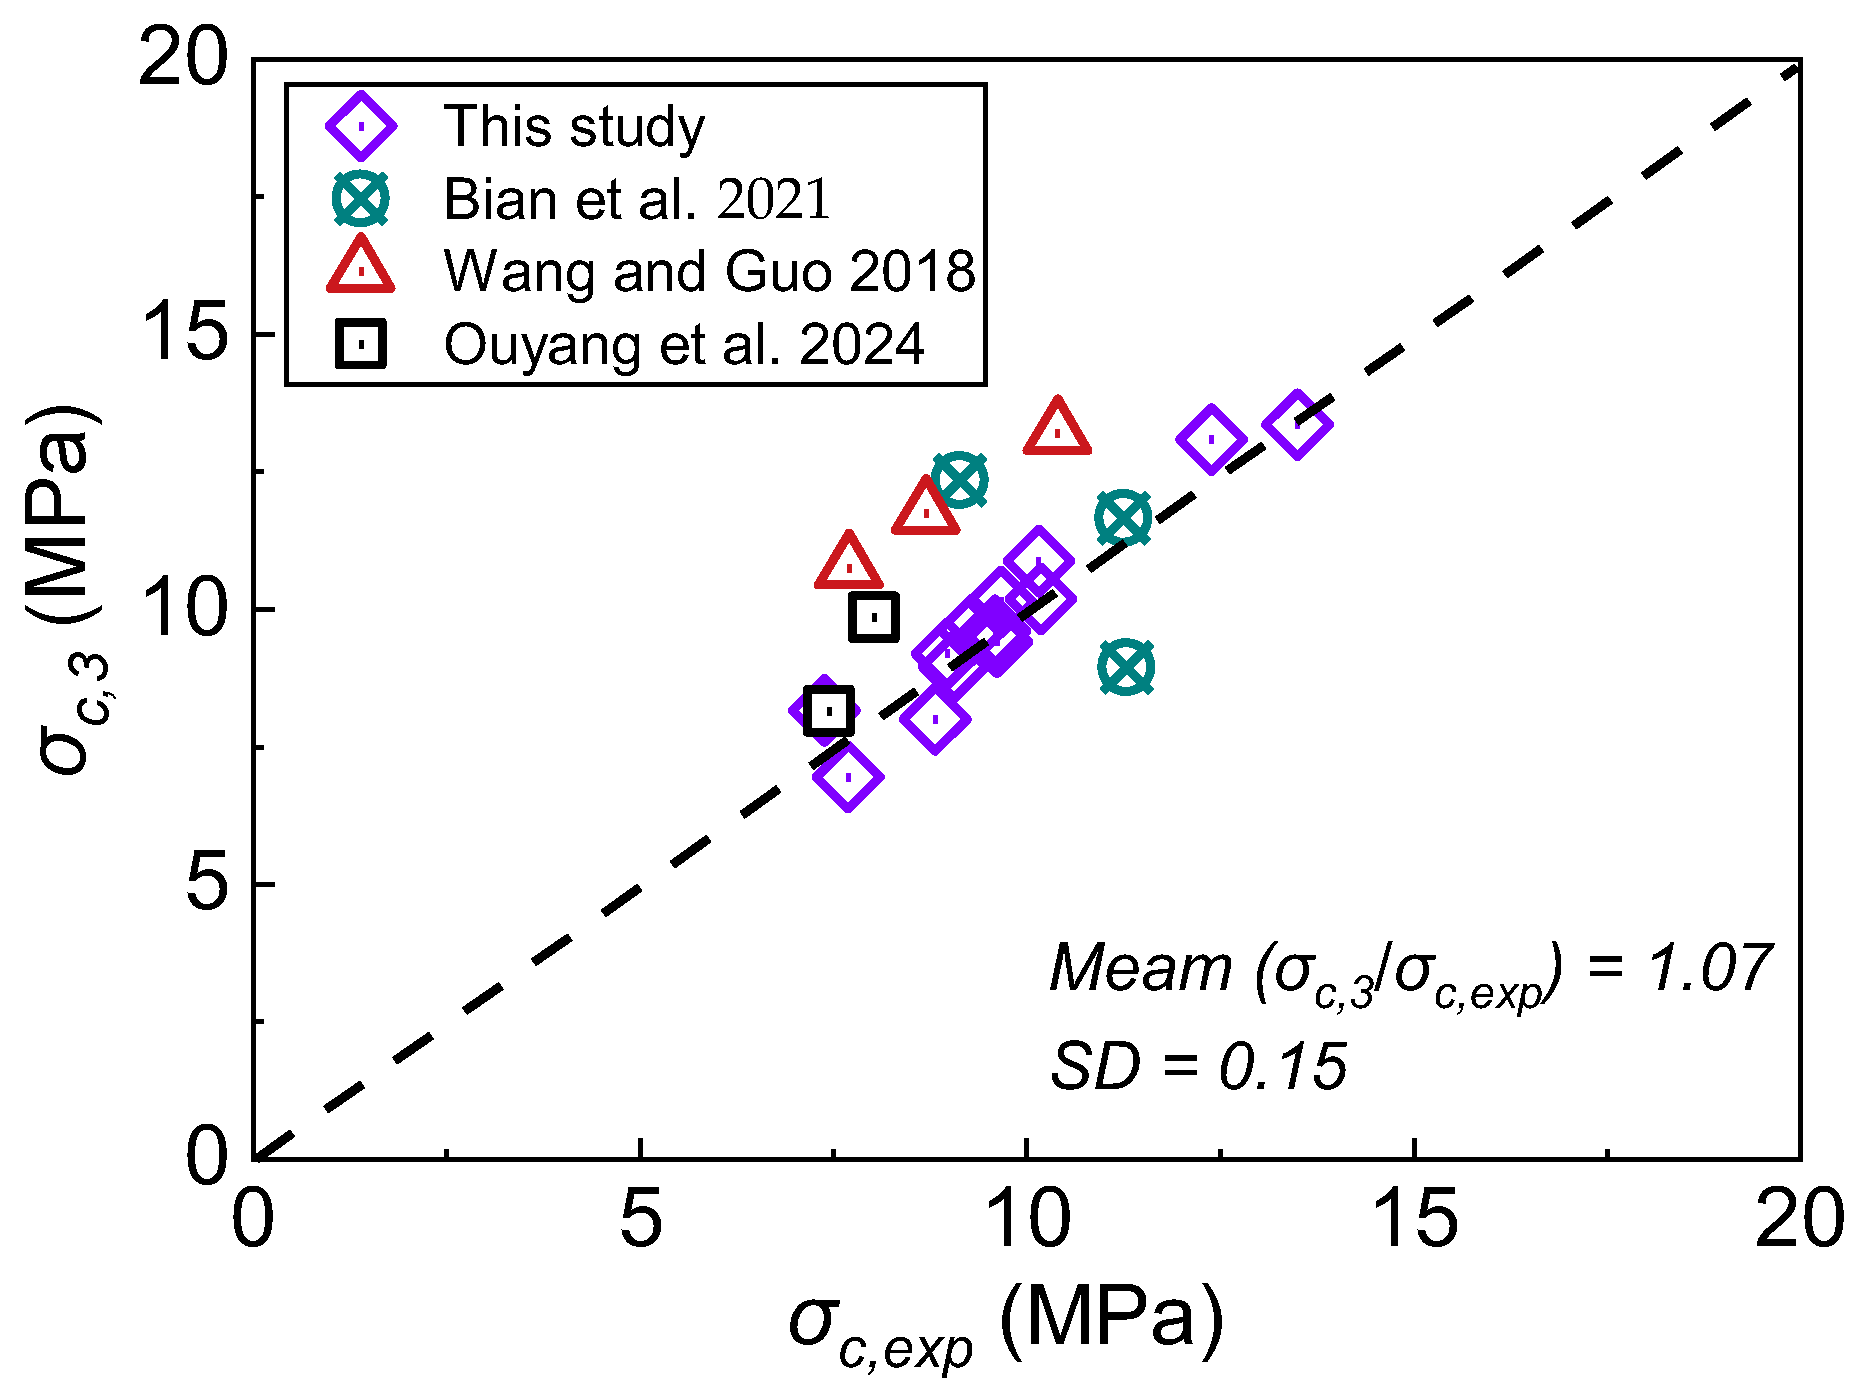
  • Considering that previous studies did not account for the adverse effects of steel fibers, this research proposes an updated formula that can predict the initial cracking strength of UHPC with reasonable accuracy, evidenced by a mean ratio of 1.07 and a standard deviation of 0.15.
Future investigations may focus on the relationship between air void content and first-cracking strength, considering the increased porosity resulting from fiber addition. Furthermore, the role of fiber distribution in influencing the cracking behavior of UHPC deserves further attention.

Author Contributions

Methodology, C.T.; Formal analysis, L.T.; Investigation, X.L., L.T. and C.T.; Writing—original draft, L.T.; Writing—review & editing, H.Z.; Supervision, H.Z.; Project administration, H.Z.; Funding acquisition, H.Z. All authors have read and agreed to the published version of the manuscript.

Funding

This research was supported by the National Natural Science Foundation of China under grant number 51978256 and 52278179, and by the Key Technology Projects in the Transportation Industry in Guangdong Province, under grant number 2022-QD2-06.

Data Availability Statement

The original contributions presented in the study are included in the article, further inquiries can be directed to the corresponding author.

Conflicts of Interest

The authors declare no conflict of interest.

References

  1. Yoo, D.-Y.; Banthia, N.; Yoon, Y.-S. Recent development of innovative steel fibers for ultra-high-performance concrete (UHPC): A critical review. Cem. Concr. Compos. 2024, 145, 105359. [Google Scholar] [CrossRef]
  2. Naaman, A.E.; Shah, S.P. Strain capacity of strain-hardening ultra-high-performance concrete with steel fibers. ACI Mater. J. 2022, 119, 171–180. [Google Scholar]
  3. Ritchie, R.O. The conflicts between strength and toughness. Nat. Mater. 2011, 10, 817–822. [Google Scholar] [CrossRef]
  4. Yoo, D.-Y.; Lee, J.-H.; Yoon, Y.-S. Effect of fiber content on mechanical and fracture properties of ultra high performance fiber reinforced cementitious composites. Compos. Struct. 2013, 106, 742–753. [Google Scholar] [CrossRef]
  5. Feng, J.; Fang, S.; Chen, M.; Fang, Z.; Liang, W. Effect of joint width on shear behaviour of wet joints using reactive powder concrete with confining stress. Eng. Struct. 2023, 293, 116566. [Google Scholar] [CrossRef]
  6. Kim, S.; Kim, M.-J.; Yoon, H.; Yoo, D.-Y. Effect of cryogenic temperature on the flexural and cracking behaviors of ultra-high-performance fiber-reinforced concrete. Cryogenics 2018, 93, 75–85. [Google Scholar] [CrossRef]
  7. Othman, H.; Sabrah, T.; Marzouk, H. Conceptual design of ultra-high performance fiber reinforced concrete nuclear waste container. Nucl. Eng. Technol. 2019, 51, 588–599. [Google Scholar] [CrossRef]
  8. ASTM C1018; Standard Test Method for Flexural Toughness and First-Crack Strength of Fiber Reinforced Concrete (Using Beam with Third-Point Loading). ASTM: West Conshohocken, PA, USA, 2017.
  9. Park, J.-J.; Yoo, D.-Y.; Park, G.-J.; Kim, S.-W. Feasibility of reducing the fiber content in ultra-high-performance fiber-reinforced concrete under flexure. Materials 2017, 10, 118. [Google Scholar] [CrossRef]
  10. Wu, Z.; Shi, C.; He, W.; Wu, L. Effects of steel fiber content and shape on mechanical properties of ultra high performance concrete. Constr. Build. Mater. 2016, 103, 8–14. [Google Scholar] [CrossRef]
  11. Yoo, D.-Y.; Kim, S.-W.; Park, J.-J. Comparative flexural behavior of ultra-high-performance concrete reinforced with hybrid straight steel fibers. Constr. Build. Mater. 2017, 132, 219–229. [Google Scholar] [CrossRef]
  12. Kang, S.T.; Lee, B.Y.; Kim, J.-K.; Kim, Y.Y. The effect of fibre distribution characteristics on the flexural strength of steel fibre-reinforced ultra high strength concrete. Constr. Build. Mater. 2011, 25, 2450–2457. [Google Scholar] [CrossRef]
  13. Meng, W.; Khayat, K.H. Effect of hybrid fibers on fresh properties, mechanical properties, and autogenous shrinkage of cost-effective UHPC. J. Mater. Civ. Eng. 2018, 30, 04018030. [Google Scholar] [CrossRef]
  14. Mindess, S.; Chen, L.; Morgan, D. Determination of the first-crack strength and flexural toughness of steel fiber-reinforced concrete. Adv. Cem. Based Mater. 1994, 1, 201–208. [Google Scholar] [CrossRef]
  15. Wille, K.; El-Tawil, S.; Naaman, A.E. Properties of strain hardening ultra high performance fiber reinforced concrete (UHP-FRC) under direct tensile loading. Cem. Concr. Compos. 2014, 48, 53–66. [Google Scholar] [CrossRef]
  16. Donnini, J.; Lancioni, G.; Chiappini, G.; Corinaldesi, V. Uniaxial tensile behavior of ultra-high performance fiber-reinforced concrete (uhpfrc): Experiments and modeling. Compos. Struct. 2021, 258, 113433. [Google Scholar] [CrossRef]
  17. Shi, Z.; Su, Q.; Kavoura, F.; Veljkovic, M. Uniaxial tensile response and tensile constitutive model of ultra-high performance concrete containing coarse aggregate (CA-UHPC). Cem. Concr. Compos. 2023, 136, 104878. [Google Scholar] [CrossRef]
  18. Zhang, Y.; Zhu, Y.; Qu, S.; Kumar, A.; Shao, X. Improvement of flexural and tensile strength of layered-casting UHPC with aligned steel fibers. Constr. Build. Mater. 2020, 251, 118893. [Google Scholar] [CrossRef]
  19. Pyo, S.; Kim, H.-K.; Lee, B.Y. Effects of coarser fine aggregate on tensile properties of ultra high performance concrete. Cem. Concr. Compos. 2017, 84, 28–35. [Google Scholar] [CrossRef]
  20. Park, S.H.; Kim, D.J.; Ryu, G.S.; Koh, K.T. Tensile behavior of ultra high performance hybrid fiber reinforced concrete. Cem. Concr. Compos. 2012, 34, 172–184. [Google Scholar] [CrossRef]
  21. Yang, J.; Chen, B.; Wu, X.; Xu, G. Quantitative analysis of steel fibers on UHPFRC uniaxial tensile behavior using X-CT and UTT. Constr. Build. Mater. 2023, 368, 130349. [Google Scholar] [CrossRef]
  22. Guo, J.-Y.; Wang, J.-Y.; Wu, K. Effects of self-healing on tensile behavior and air permeability of high strain hardening UHPC. Constr. Build. Mater. 2019, 204, 342–356. [Google Scholar] [CrossRef]
  23. Gehri, N.; Mata-Falcón, J.; Kaufmann, W. Refined extraction of crack characteristics in Large-scale concrete experiments based on digital image correlation. Eng. Struct. 2022, 251, 113486. [Google Scholar] [CrossRef]
  24. Qiu, M.; Qian, Y.; Dai, J.-G. Enhancing the flexural performance of concrete beams with 3D-printed UHP-SHCC permanent formwork via graded fiber volume fraction. Compos. Struct. 2024, 341, 118211. [Google Scholar] [CrossRef]
  25. Tu, L.; Zhao, H.; Qiao, D.; Hu, J.; Tan, C.; Ma, J.; Hu, Z.; Qiu, H.; Shao, X. Concept and flexural performance of non-prestressed steel plate-UHPC-NC composite girder bridge. Eng. Struct. 2024, 315, 118417. [Google Scholar] [CrossRef]
  26. Tu, L.; Zhao, H.; Tan, C.; Cao, J.; Yi, D.; Qiu, M. Prediction of tensile strain capacity of ultra-high performance concrete based on crack characteristics. Constr. Build. Mater. 2025, 458, 139632. [Google Scholar] [CrossRef]
  27. GB/T 2419-2005; Test Method for Fluidity of Cement Mortar. Standards Press of China: Beijing, China, 2005.
  28. GB/T 31387-2015; Reactive Powder Concrete. Standards Press of China: Beijing, China, 2015.
  29. Neuber, H. Der zugbeanspruchte Flachstab mit optimalem Querschnittsübergang. Forsch. Ingenieurwesen A 1969, 35, 29–30. [Google Scholar] [CrossRef]
  30. Kheir, J.; Klausen, A.; Hammer, T.A.; De Meyst, L.; Hilloulin, B.; Van Tittelboom, K.; Loukili, A.; De Belie, N. Early age autogenous shrinkage cracking risk of an ultra-high performance concrete (UHPC) wall: Modelling and experimental results. Eng. Fract. Mech. 2021, 257, 108024. [Google Scholar] [CrossRef]
  31. Liu, C.; Shen, D.; Yang, X.; Shao, H.; Tang, H.; Cai, L. Early-age properties and shrinkage induced stress of ultra-high-performance concrete under variable temperature and uniaxial restrained condition. Constr. Build. Mater. 2023, 384, 131382. [Google Scholar] [CrossRef]
  32. Zhu, Y.; Zhang, Y.; Hussein, H.H.; Liu, J.; Chen, G. Experimental study and theoretical prediction on shrinkage-induced restrained stresses in UHPC-RC composites under normal curing and steam curing. Cem. Concr. Compos. 2020, 110, 103602. [Google Scholar] [CrossRef]
  33. Ghorbani, R.; Matta, F.; Sutton, M.A. Full-field deformation measurement and crack mapping on confined masonry walls using digital image correlation. Exp. Mech. 2015, 55, 227–243. [Google Scholar] [CrossRef]
  34. Mobasher, B.; Li, A.; Yao, Y.; Arora, A.; Neithalath, N. Characterization of toughening mechanisms in uhpc through image correlation and inverse analysis of flexural results. Cem. Concr. Compos. 2021, 122, 104157. [Google Scholar] [CrossRef]
  35. Niu, Y.; Wei, J.; Jiao, C.; Miao, Q. A mesomechanics-based analysis on the flexural behavior of ultra-high-performance concrete (UHPC) with different steel fiber lengths. J. Mater. Res. Technol. 2022, 17, 3066–3079. [Google Scholar] [CrossRef]
  36. Canny, J. A computational approach to edge detection. IEEE Trans. Pattern Anal. Mach. Intell. 1986, PAMI-8, 679–698. [Google Scholar] [CrossRef]
  37. Martinie, L.; Rossi, P.; Roussel, N. Rheology of fiber reinforced cementitious materials: Classification and prediction. Cem. Concr. Res. 2010, 40, 226–234. [Google Scholar] [CrossRef]
  38. Yu, R.; Spiesz, P.; Brouwers, H. Mix design and properties assessment of ultra-high performance fibre reinforced concrete (UHPFRC). Cem. Concr. Res. 2014, 56, 29–39. [Google Scholar] [CrossRef]
  39. Wang, R.; Gao, X. Relationship between flowability, entrapped air content and strength of UHPC mixtures containing different dosage of steel fiber. Appl. Sci. 2016, 6, 216. [Google Scholar] [CrossRef]
  40. Fan, D.; Rui, Y.; Liu, K.; Tan, J.; Shui, Z.; Wu, C.; Wang, S.; Guan, Z.; Hu, Z.; Su, Q. Optimized design of steel fibres reinforced ultra-high performance concrete (UHPC) composites: Towards to dense structure and efficient fibre application. Constr. Build. Mater. 2021, 273, 121698. [Google Scholar]
  41. Yang, J.; Chen, B.; Nuti, C. Influence of steel fiber on compressive properties of ultra-high performance fiber-reinforced concrete. Constr. Build. Mater. 2021, 302, 124104. [Google Scholar] [CrossRef]
  42. Yoo, D.-Y.; Chun, B.; Kim, J.-J. Bond performance of abraded arch-type steel fibers in ultra-high-performance concrete. Cem. Concr. Compos. 2020, 109, 103538. [Google Scholar] [CrossRef]
  43. Bian, C.; Wang, J.-Y.; Guo, J.-Y. Damage mechanism of ultra-high performance fibre reinforced concrete at different stages of direct tensile test based on acoustic emission analysis. Constr. Build. Mater. 2021, 267, 120927. [Google Scholar] [CrossRef]
  44. Wang, J.-Y.; Guo, J.-Y. Damage investigation of ultra high performance concrete under direct tensile test using acoustic emission techniques. Cem. Concr. Compos. 2018, 88, 17–28. [Google Scholar] [CrossRef]
  45. Li, B.; Xu, L.; Shi, Y.; Chi, Y.; Liu, Q.; Li, C. Effects of fiber type, volume fraction and aspect ratio on the flexural and acoustic emission behaviors of steel fiber reinforced concrete. Constr. Build. Mater. 2018, 181, 474–486. [Google Scholar] [CrossRef]
  46. Banthia, N. A study of some factors affecting the fiber–matrix bond in steel fiber reinforced concrete. Can. J. Civ. Eng. 1990, 17, 610–620. [Google Scholar] [CrossRef]
  47. Naaman, A.E. A Statistical Theory of Strength for Fiber Reinforced Concrete; Massachusetts Institute of Technology: Cambridge, MA, USA, 1972. [Google Scholar]
  48. Swamy, R.; Mangat, P. A theory for the flexural strength of steel fiber reinforced concrete. Cem. Concr. Res. 1974, 4, 313–325. [Google Scholar] [CrossRef]
  49. Lee, Y.; Kang, S.-T.; Kim, J.-K. Pullout behavior of inclined steel fiber in an ultra-high strength cementitious matrix. Constr. Build. Mater. 2010, 24, 2030–2041. [Google Scholar] [CrossRef]
  50. Niu, Y.; Wei, J.; Jiao, C. Multi-scale fiber bridging constitutive law based on meso-mechanics of ultra high-performance concrete under cyclic loading. Constr. Build. Mater. 2022, 354, 129065. [Google Scholar] [CrossRef]
  51. Qu, S.; Zhang, Y.; Zhu, Y.; Huang, L.; Qiu, M.; Shao, X. Prediction of tensile response of UHPC with aligned and ZnPh treated steel fibers based on a spatial stochastic process. Cem. Concr. Res. 2020, 136, 106165. [Google Scholar] [CrossRef]
  52. Ouyang, X.; Huang, Y.; Hu, X.; Yin, J.; Shi, C. Evaluation of tensile failure behavior of ultra high performance concrete under double-edge wedge splitting and direct tension loadings. J. Build. Eng. 2024, 90, 109480. [Google Scholar] [CrossRef]
Figure 1. Various methods of detecting the first-cracking strength for UHPC [21].
Buildings 15 01727 g001
Figure 2. Various types of steel fibers: (a) different lengths of steel fibers; (b) different shapes of steel fibers; and (c) different diameters of steel fibers.
Buildings 15 01727 g002
Figure 3. Specimens of direct tensile test: (a) specimen dimension; (b) mold; and (c) casting process.
Buildings 15 01727 g003
Figure 4. Setup of direct tensile test: (a) specimen reinforced by carbon fiber fabric; (b) specimen with grip system; (c) picture of setup; and (d) speckle pattern.
Buildings 15 01727 g004
Figure 5. Concept of the automated crack detection.
Buildings 15 01727 g005
Figure 6. Effect of fiber on compressive strengths and flowability: (a) length; (b) volume fraction; (c) diameter; and (d) shape. Note: To better illustrate the impact of parameters, the results of S-0.20-13-2% and S-0.20-16-2% are repeated.
Buildings 15 01727 g006
Figure 7. Typical initial crack patterns of UHPC.
Buildings 15 01727 g007
Figure 8. Effect of fiber on first-cracking strengths: (a) length; (b) volume fraction; (c) diameter; and (d) shape. Note: to better illustrate the impact of parameters, the results of S-0.20-13-2% and S-0.20-16-2% are repeated.
Buildings 15 01727 g008
Figure 9. Comparison of first-cracking strength according to different methods: (a) length; (b) volume fraction; (c) diameter; and (d) shape. Note: σcc is the first-cracking strength determined by DIC; σlel is the first-cracking strength determined by the linear elastic limit point; and σi is the first-cracking strength determined by the intersection point.
Buildings 15 01727 g009
Figure 10. Comparison of experimental and predicted first-cracking strength by Equation (3).
Buildings 15 01727 g010
Figure 11. Fitting of the influence of flowability loss on initial cracking.
Buildings 15 01727 g011
Figure 12. Comparison of experimental and predicted first-cracking strength by the proposed method [43,44,52].
Buildings 15 01727 g012
Table 1. Mix proportions of UHPC matrix (unit: kg/m3).
CementSilica FumeFly AshQuartz SandQuartz FlourSuperplasticizerWater
772.1154.277.1848.4154.220.1180.5
Table 2. Details of UHPC mixtures.
NotationFiber TypeFiber Diameter
(mm)
Fiber Length
(mm)
Steel Fiber Volume Fraction (%)
Matrix////
S-0.20-06-2%Straight0.262
S-0.20-10-2%Straight0.2102
S-0.20-13-2%Straight0.2132
S-0.20-16-2%Straight0.2162
S-0.20-20-2%Straight0.2202
S-0.20-25-2%Straight0.2252
S-0.20-13-1%Straight0.20131
S-0.20-13-3%Straight0.20133
S-0.20-13-4%Straight0.20134
S-0.25-16-2%Straight0.25162
S-0.30-16-2%Straight0.30162
H-0.20-13-2%Hooked0.20132
C-0.20-13-2%Corrugated0.20132
Table 3. First-cracking behavior of UHPC.
NotationFirst-Crack Strength (MPa)First-Crack Strain (με)
Specimen 1Specimen 2Specimen 3Mean (Sd)Specimen 1Specimen 2Specimen 3Mean (Sd)
Matrix5.966.126.216.10 (0.10)138140141140 (1.25)
S-0.20-06-2%7.877.597.607.69 (0.13)202215216211 (6.38)
S-0.20-10-2%9.399.128.679.06 (0.30)249224219231 (13.12)
S-0.20-13-2%10.0710.4010.0810.18 (0.15)266272284274 (7.48)
S-0.20-16-2%10.0610.2510.1610.16 (0.08)273253252259 (9.67)
S-0.20-20-2%9.569.689.779.67 (0.09)262247240250 (9.18)
S-0.20-25-2%9.849.459.469.58 (0.18)236258233242 (11.15)
S-0.20-13-1%7.817.707.917.81 (0.08)256254228246 (12.75)
S-0.20-13-2%10.0710.4010.0810.18 (0.15)266272284274 (7.48)
S-0.20-13-3%12.5212.5212.1212.39 (0.19)278284276279 (3.40)
S-0.20-13-4%13.0213.5613.9013.50 (0.36)311313323316 (5.25)
S-0.20-16-2%10.0610.2510.1610.16 (0.08)273253252259 (9.67)
S-0.25-16-2%9.669.529.659.61 (0.06)249234232238 (7.59)
S-030-16-2%8.898.439.128.82 (0.29)243223249238 (11.12)
S-0.20-13-2%10.0710.4010.0810.18 (0.15)266272284274 (7.48)
H-0.20-13-2%8.969.659.259.29 (0.28)247236252245 (6.68)
C-0.20-13-2%8.599.189.158.97 (0.27)235228232232 (2.87)
Note: for better clarity, the results of S-0.20-13-2% and S-0.20-16-2% are repeated and shown in italics.
Table 4. Tensile properties of UHPC mixtures.
ResourceNotationσmdflfVfτ Δfσc,3σccσc,3/σcc
MPammmm%MPammMPaMPa
This paperS-0.20-06-2%6.100.20626.80166.947.690.90
S-0.20-10-2%6.100.201026.80188.959.060.99
S-0.20-13-2%6.100.201326.802210.1910.181.00
S-0.20-16-2%6.100.201626.803110.8710.161.07
S-0.20-20-2%6.100.202026.805810.139.671.05
S-0.20-25-2%6.100.202526.80889.629.581.00
S-0.20-13-1%6.100.201316.8088.167.391.11
S-0.20-13-3%6.100.201336.802813.0912.391.06
S-0.20-13-4%6.100.201346.805813.3513.500.99
S-0.25-16-2%6.100.251626.80299.429.610.98
S-0.30-16-2%6.100.301626.80308.008.820.91
H-0.20-13-2%6.100.201326.80279.649.291.04
C-0.20-13-2%6.100.201326.80319.208.971.02
Bian [43]High strain-hardening UHPFRC7.600.201626.803112.349.141.35
Low strain-hardening UHPFRC7.600.201326.802211.6611.251.04
Strain-softening UHPFRC7.600.201616.80228.9411.290.79
Wang [44]High strain-hardening UHPFRC7.700.20132.56.802513.2010.401.27
Low strain-hardening UHPFRC7.700.201326.802211.758.701.35
Strain-softening UHPFRC7.700.20131.56.801510.757.701.40
Ouyang [52]S-1-0.166.420.221316.8088.157.441.10
S-2-0.166.420.221326.80229.848.021.23
Disclaimer/Publisher’s Note: The statements, opinions and data contained in all publications are solely those of the individual author(s) and contributor(s) and not of MDPI and/or the editor(s). MDPI and/or the editor(s) disclaim responsibility for any injury to people or property resulting from any ideas, methods, instructions or products referred to in the content.

