Article

Probabilistic Prediction Model for Ultimate Conditions Under Compression of FRP-Wrapped Concrete Columns Based on Bayesian Inference

1
CCCC Third Highway Engineering Co., Ltd., Beijing 100020, China
2
School of Civil and Hydraulic Engineering, Huazhong University of Science and Technology, Wuhan 430074, China
3
School of Civil and Transportation Engineering, Hebei University of Technology, Tianjin 300401, China
*
Author to whom correspondence should be addressed.
Buildings 2025, 15(10), 1720; https://doi.org/10.3390/buildings15101720
Submission received: 15 April 2025 / Revised: 12 May 2025 / Accepted: 14 May 2025 / Published: 19 May 2025

Abstract

The compressive strength and ultimate strain of FRP-confined concrete cylinders are the key indicators for evaluating their mechanical properties. Accurate prediction of compressive strength and ultimate strain is essential for reliability analysis and design of such components. However, the existing ultimate condition under compression models lack sufficient prediction accuracy, and the results exhibit significant uncertainty. This study proposes a Bayesian model updating method based on Markov Chain Monte Carlo (MCMC) sampling to improve the prediction accuracy of the ultimate condition under compression for FRP-confined concrete cylinders and to quantify the uncertainty of the prediction results. First of all, 1016 sets of experimental data on the ultimate condition under compression of FRP-confined concrete cylinders from previous studies were collected. Subsequently, the probabilistic updating model and evaluation system were established based on Bayesian parameter estimation principle, MCMC sampling, WAIC, and DIC. Then, several representative empirical models for predicting the ultimate condition under compression are selected, and their prediction performance is evaluated using the experimental data. Finally, a Bayesian updating problem is established for typical ultimate condition under compression models, and the posterior distributions of model parameters are obtained using MCMC sampling to select the best model, and the prediction performance of the optimal model is assessed using the experimental data. The results show that, compared with existing empirical models, the Bayesian inference-based probabilistic calculation model provides predictions closer to the experimental values, while also reasonably quantifying the uncertainty of the ultimate condition under compression prediction.

1. Introduction

Reinforced concrete (RC) structures are inevitably affected by long-term loading and continuous environmental degradation during their service life, which can impair their mechanical properties. To ensure the overall safety of building structures, strengthening RC structures is crucial. Fiber-reinforced polymer (FRP) is a high-performance composite material composed of fiber reinforcement and a synthetic resin matrix. It possesses characteristics such as high strength, light weight, corrosion resistance, and ease of construction, making it widely used in the construction, retrofitting, and repair of civil engineering structures [1,2,3]. Studies have shown that lateral pressure can effectively constrain the circumferential expansion deformation of concrete. FRP-confined concrete cylinders utilize the high strength and high elastic modulus of FRP materials to subject the concrete to triaxial compression, thereby improving both the strength and ductility of the concrete [4]. Extensive experimental and theoretical research [5,6,7] has confirmed that FRP-confined concrete technology (including FRP wrapping and FRP tube confinement for concrete enhancement) can effectively improve the durability, safety, and mechanical performance of structures, and extend their service life. This technology has demonstrated excellent potential for structural reinforcement and other applications involving FRP-confined concrete.
The ultimate condition under compression typically refers to the state corresponding to the maximum axial compressive load that a concrete component can withstand. It reflects the bearing capacity and the changes in the mechanical behavior of the concrete component before failure. Researchers commonly use two core parameters, namely the ultimate compressive strength and the ultimate compressive strain, to describe the ultimate condition under compression of concrete components. However, due to the significant increase in strength and ultimate strain resulting from the confinement reinforcement provided by FRP materials, the mechanical behavior and ultimate condition under compression of FRP-confined concrete undergo significant changes under loading, and the ductility of FRP-confined concrete shows a significant improvement [8]. Zeng et al. [8] conducted an experimental study on the stress–strain behavior of polyethylene terephthalate (PET) fiber-reinforced polymer (FRP)-confined normal-strength, high-strength, and ultra-high-strength concrete. The results demonstrated that high- and ultra-high-strength concrete confined with PET FRP exhibited strain hardening–softening–hardening behavior. Lim and Ozbakkaloglu [9] found that concrete age has a minimal effect on the compressive strength and strain of FRP-confined concrete, with slight reductions observed as concrete ages beyond 28 days. Liao et al. [10] investigated the compressive behavior of ultra-high-performance concrete (UHPC) confined with FRP. Their study found that the addition of steel fibers significantly enhanced the first peak stress and ultimate strain, improving confinement efficiency and ductility. The research also highlighted the importance of FRP thickness, specimen size, and steel fiber content in determining the stress–strain response of FRP-confined UHPC. In addition, the mechanical behavior of FRP-confined concrete columns with different shapes varies. Zeng et al. [11] investigated the axial compression behavior of PET FRP-confined concrete in square stub columns by considering the effects of confinement thickness, corner radius, and specimen size. Their results showed that increasing the corner radius improves the uniformity of the confinement pressure, enhancing the concrete’s ultimate strength. Ye et al. [12] conducted a review of FRP-confined steel-reinforced concrete (FCSRC) structural members, with a focus on the effects of FRP tube shape. The results showed that square and rectangular FRP tubes are less efficient in confining concrete compared to circular tubes, particularly at the flat sides, which reduces their confinement effectiveness in practical applications. However, existing models struggle to accurately capture the stress reduction phenomenon [13]. To ensure structural safety and the rationality of design, it is necessary to specifically predict the behavior of FRP-confined concrete.
The main issue in the research on FRP-confined concrete cylinders is how to improve the overall mechanical performance of concrete cylinders, specifically, how to accurately predict their compressive strength and ultimate strain. To accurately predict their compressive strength and ultimate strain, many different stress–strain models have been developed. Early studies on FRP-confined concrete stress–strain models typically used steel-confined concrete models to analyze the mechanical behavior of FRP-confined concrete cylinders under axial loads. However, due to the differences in the mechanical properties between steel and FRP materials, this model could not accurately reflect the stress–strain characteristic [14,15,16]. Subsequently, researchers proposed calculation formulas for the ultimate compressive strength, ultimate strain at concrete failure, and stress–strain curves of FRP-confined concrete cylinders, based on studies of GFRP (glass fiber-reinforced polymer) and CFRP (carbon fiber-reinforced polymer). They established stress–strain models for FRP-confined concrete cylinders and identified the main factors affecting the mechanical properties of FRP-confined concrete cylinders, including the circumferential fracture strain of FRP materials, FRP material parameters, the ultimate stress of the core concrete, and the geometric parameters of the cross-section [17]. Furthermore, some studies have proposed calculation formulas for the peak stress, peak strain, ultimate stress, and ultimate strain of FRP-confined concrete cylinders with softening segments, along with corresponding models [18].
FRP-confined concrete stress–strain models are generally divided into three categories: empirical models obtained through regression analysis of experimental data, theoretical models derived from mechanical principles, and design-oriented models. Many existing models are empirical models established through regression analysis, fitting, and the simplification of experimental data. The initial compressive strength model is similar to the empirical model for the compressive strength of FRP-confined concrete proposed by Richart [19] in 1929. Although subsequent models differ in form, their mathematical essence is similar, and the calculation results are relatively stable. However, these models are all based on the fitting of experimental data, and their results represent point estimates for specific parameters, which may have some degree of deviation from the actual ultimate condition under compression. Therefore, the accuracy and completeness of the experimental data play a critical role in the establishment of the model. Additionally, in axial compression tests of FRP-confined concrete cylinders, due to variations in FRP materials, measurement errors, estimation errors, and changes in environmental conditions, it is impossible to precisely predict the ultimate condition under compression of FRP-confined concrete cylinders, and the prediction results exhibit significant uncertainty. These uncertainties are propagated through the model parameter identification process, leading to uncertain model predictions. Consequently, it is necessary to consider these uncertainties through identification of probabilistic parameters. For example, prior probability distributions can be assigned to measurement errors and model parameters, and their posterior probability distributions can be identified through Bayesian inference to quantify the uncertainty in model predictions.
Currently, many researchers have proposed various stress–strain models for FRP-confined concrete cylinders from different perspectives, achieving varying degrees of progress in prediction accuracy. Researchers have conducted experimental studies by controlling different variables and proposed new predictive models for forecasting the compressive strength and ultimate strain of FRP-confined concrete cylinders. However, comprehensive integration and unification of existing data are rarely performed, which limits the applicability of the current models. Furthermore, most existing models are data-driven. While they offer better prediction accuracy compared to traditional models, they are still based on a limited set of experimental data. These models often involve complex or uncertain information, with some parameters needing to be derived from empirical data, making them difficult to obtain through simplified calculation methods. These models are typically expressed in complex or undefined forms, and certain parameters require intricate computational methods, which are not easily obtained through experimentation. Both traditional models and data-driven models are deterministic models, where the predicted compressive strength and ultimate strain of FRP-confined concrete cylinders are given as single values. This overlooks the uncertain relationship between the model inputs and outputs under various unforeseen conditions and fails to reasonably quantify the uncertainty of the prediction results, which does not align with the practical application in engineering.
Bayesian inference has been proven to effectively quantify uncertainty by calculating the posterior distribution. Most of the existing predictive models are empirical formulas developed based on experimental data. These empirical formulas often fail to account for the influence of objective parameters, such as specimen size and fiber type, resulting in limited applicability. This study applies Bayesian inference to calibrate existing models, thereby improving their applicability and prediction accuracy. The results show that the Bayesian method cleverly combines prior information (subjective information) and test data (objective information) to infer the posterior distribution of model parameters. Probability density functions are used to represent parameter estimates, yielding statistical quantities such as mean, variance, and confidence intervals, which better predict the structural performance under load [13]. Moreover, the research results demonstrate that the probability model corrected through Bayesian inference significantly improves the prediction accuracy. It enhances the prediction accuracy of the compressive ultimate condition and the rationality of design decisions for FRP-confined concrete cylinders. The findings can provide a useful reference for engineering applications and future research.

2. Collection of Experimental Data

Many studies have conducted uniaxial compression tests on FRP-confined circular concrete cylinders. This study extensively surveys the existing literature and collects 1016 sets of experimental samples on the ultimate condition under compression of FRP-confined circular concrete cylinders [9,15,20,21,22,23,24,25,26,27,28,29,30,31,32,33,34,35,36,37,38,39,40,41,42,43,44,45,46,47,48,49,50,51,52,53,54,55,56,57,58,59,60,61,62,63,64,65,66,67,68,69,70,71,72,73,74,75,76,77,78,79,80,81,82,83,84,85,86,87,88,89,90,91]. Each data set includes the following information: the diameter of the concrete cylinder D ; the axial compressive strength of the unconfined concrete cylinder f c o ; the axial compressive strength of the FRP-confined concrete cylinder f c c ; the axial strain of the unconfined concrete cylinder ε c 0 ; the ultimate strain of the FRP-confined circular concrete cylinder ε c u ; the total thickness of the FRP material t f ; the elastic modulus of the FRP material E f ; and the circumferential fracture strain of the FRP material ε h , r u p . Furthermore, the collected experimental samples encompass various types of FRP materials, including CFRP, AFRP, BFRP, and GFRP.
The database in this study includes only unreinforced concrete specimens, excluding those with internal transverse or longitudinal reinforcement and those using fully wrapped FRP materials. Specimens with a length-to-diameter ratio greater than three were also excluded. The compressive strength of the unconfined concrete in the specimen ranges from 6.2 to 188.2 MPa, covering some high-strength concrete data. All specimens failed due to the rupture of the FRP material, and specimens that failed prematurely due to other reasons (such as loss of adhesion of the FRP material or excessive eccentricity) were excluded. The loading form applied was concentric axial load, excluding specimens subjected to eccentric or lateral loads. Specimens that failed to accurately record experimental results due to equipment, instrument errors, or insufficient material geometric properties were also excluded.
Table 1 presents the statistical information of the experimental database collected in this study.
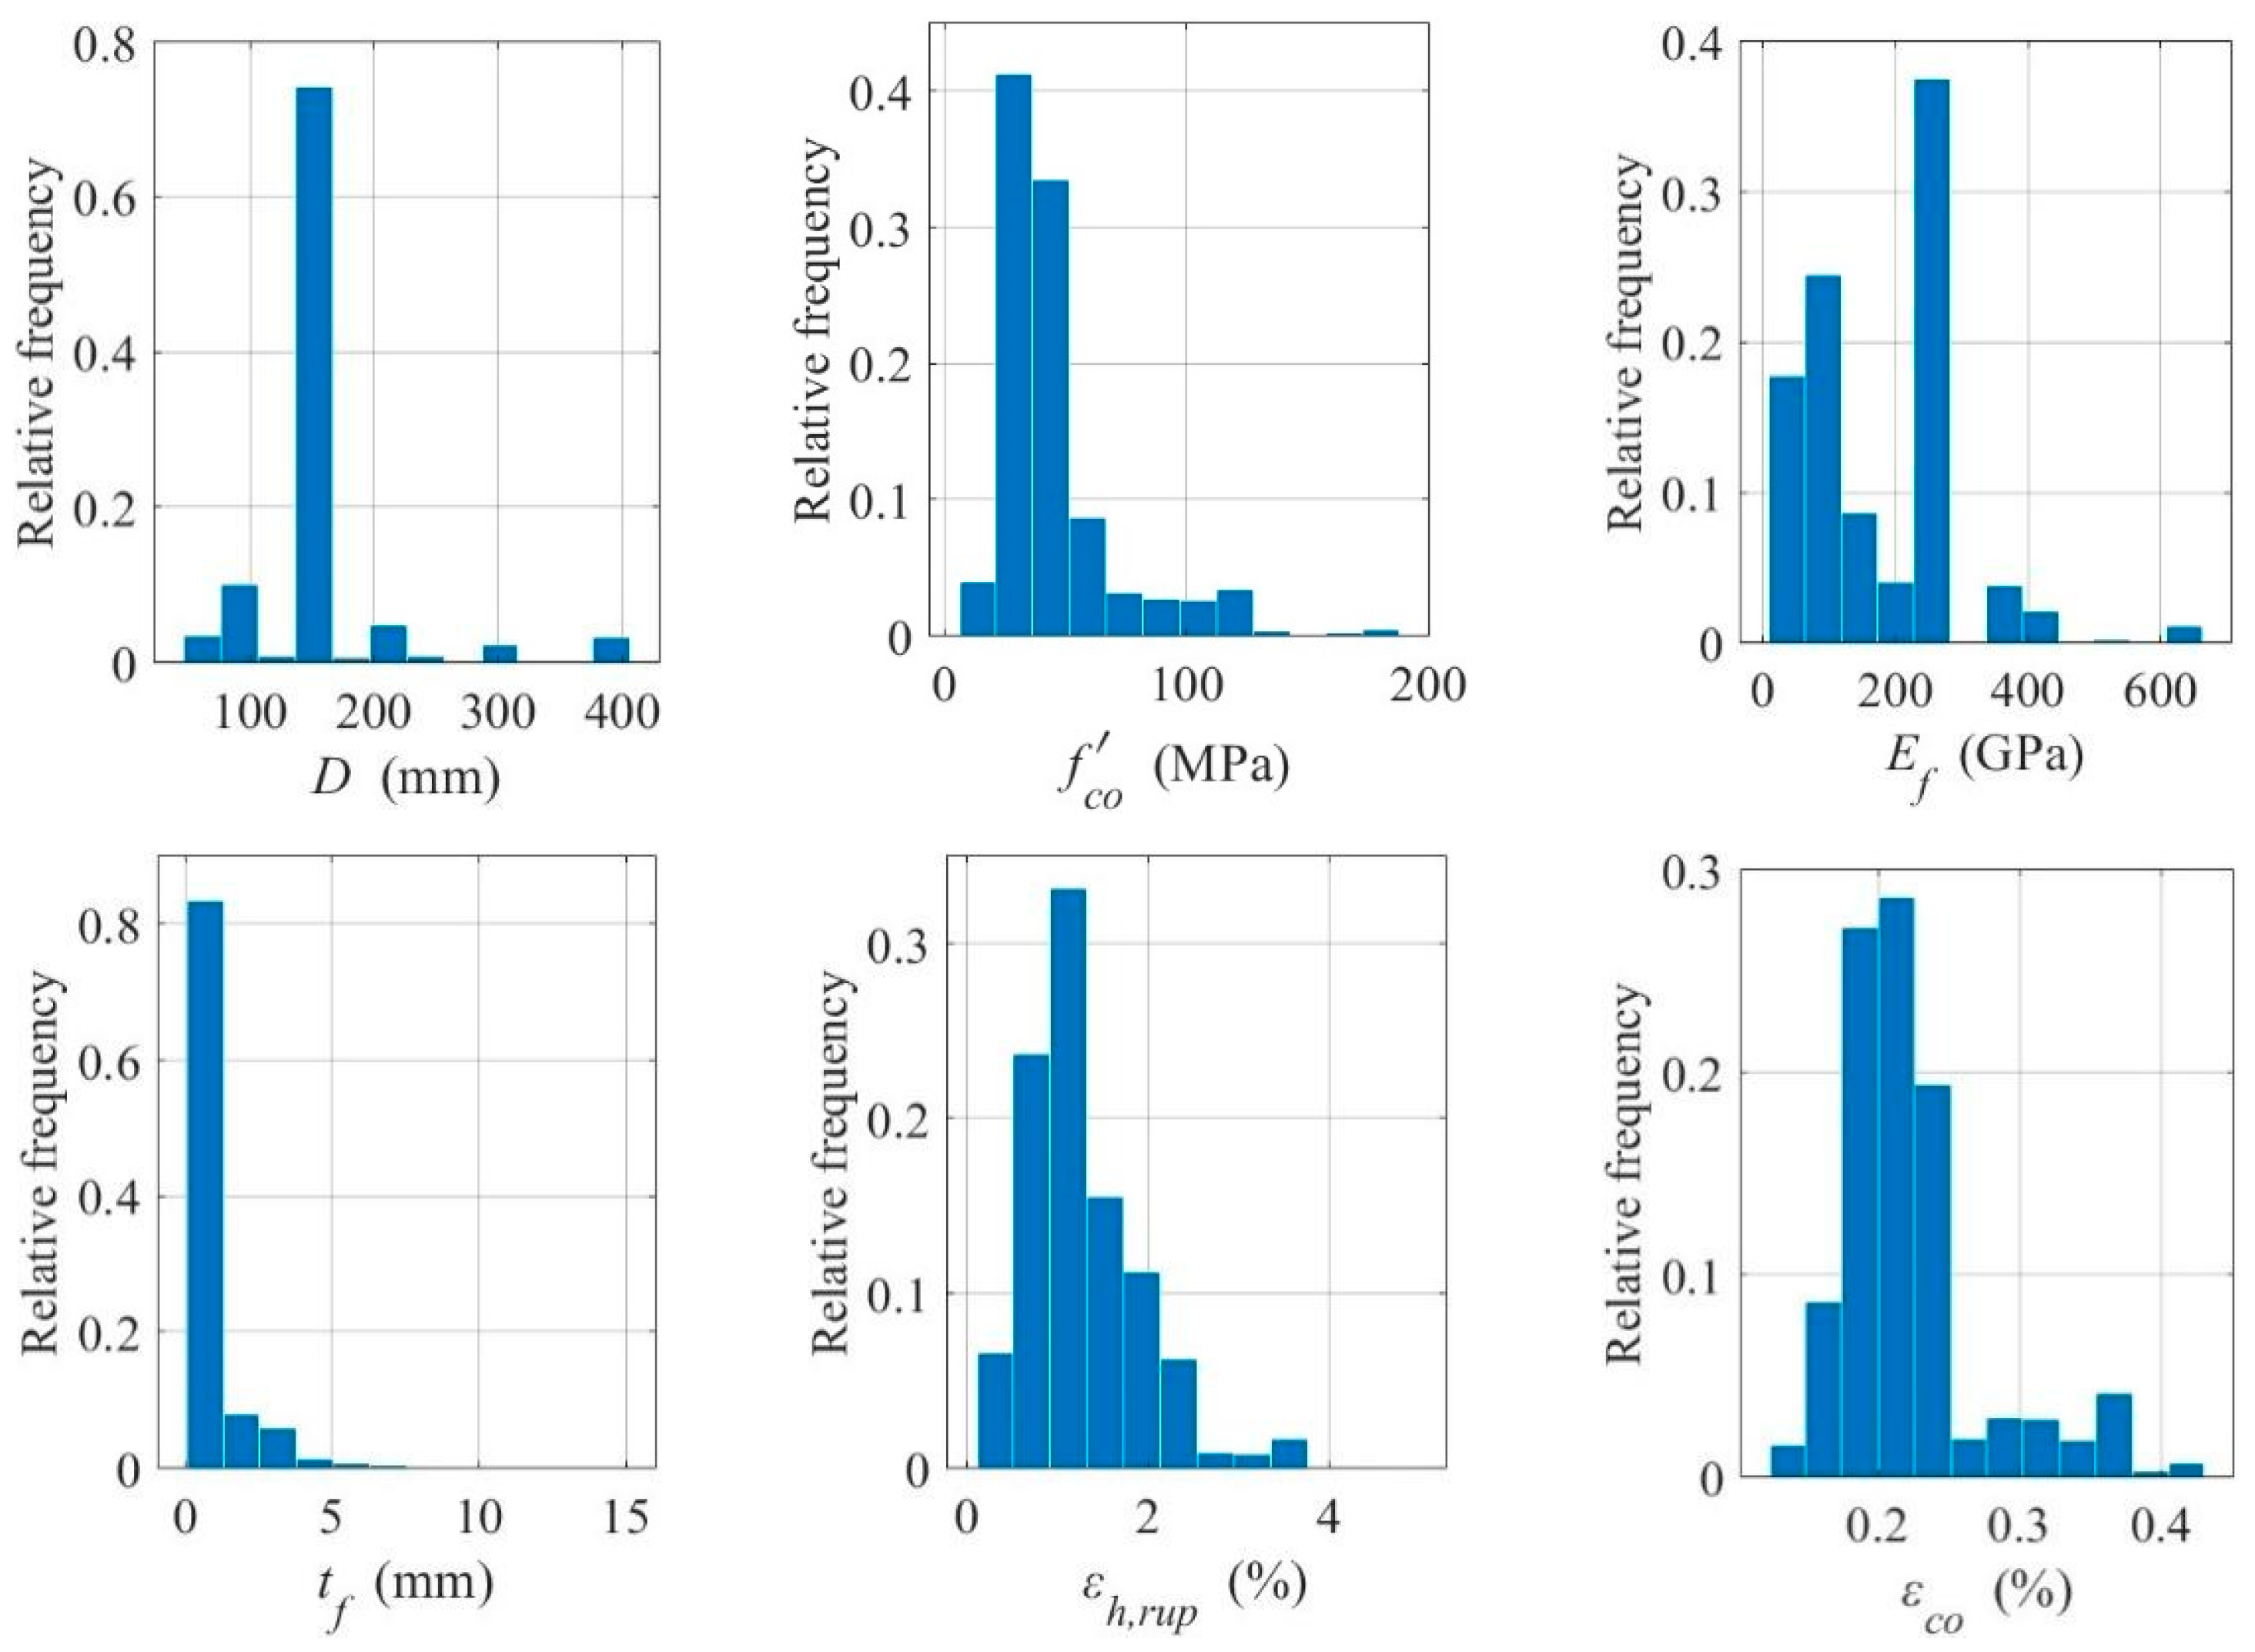
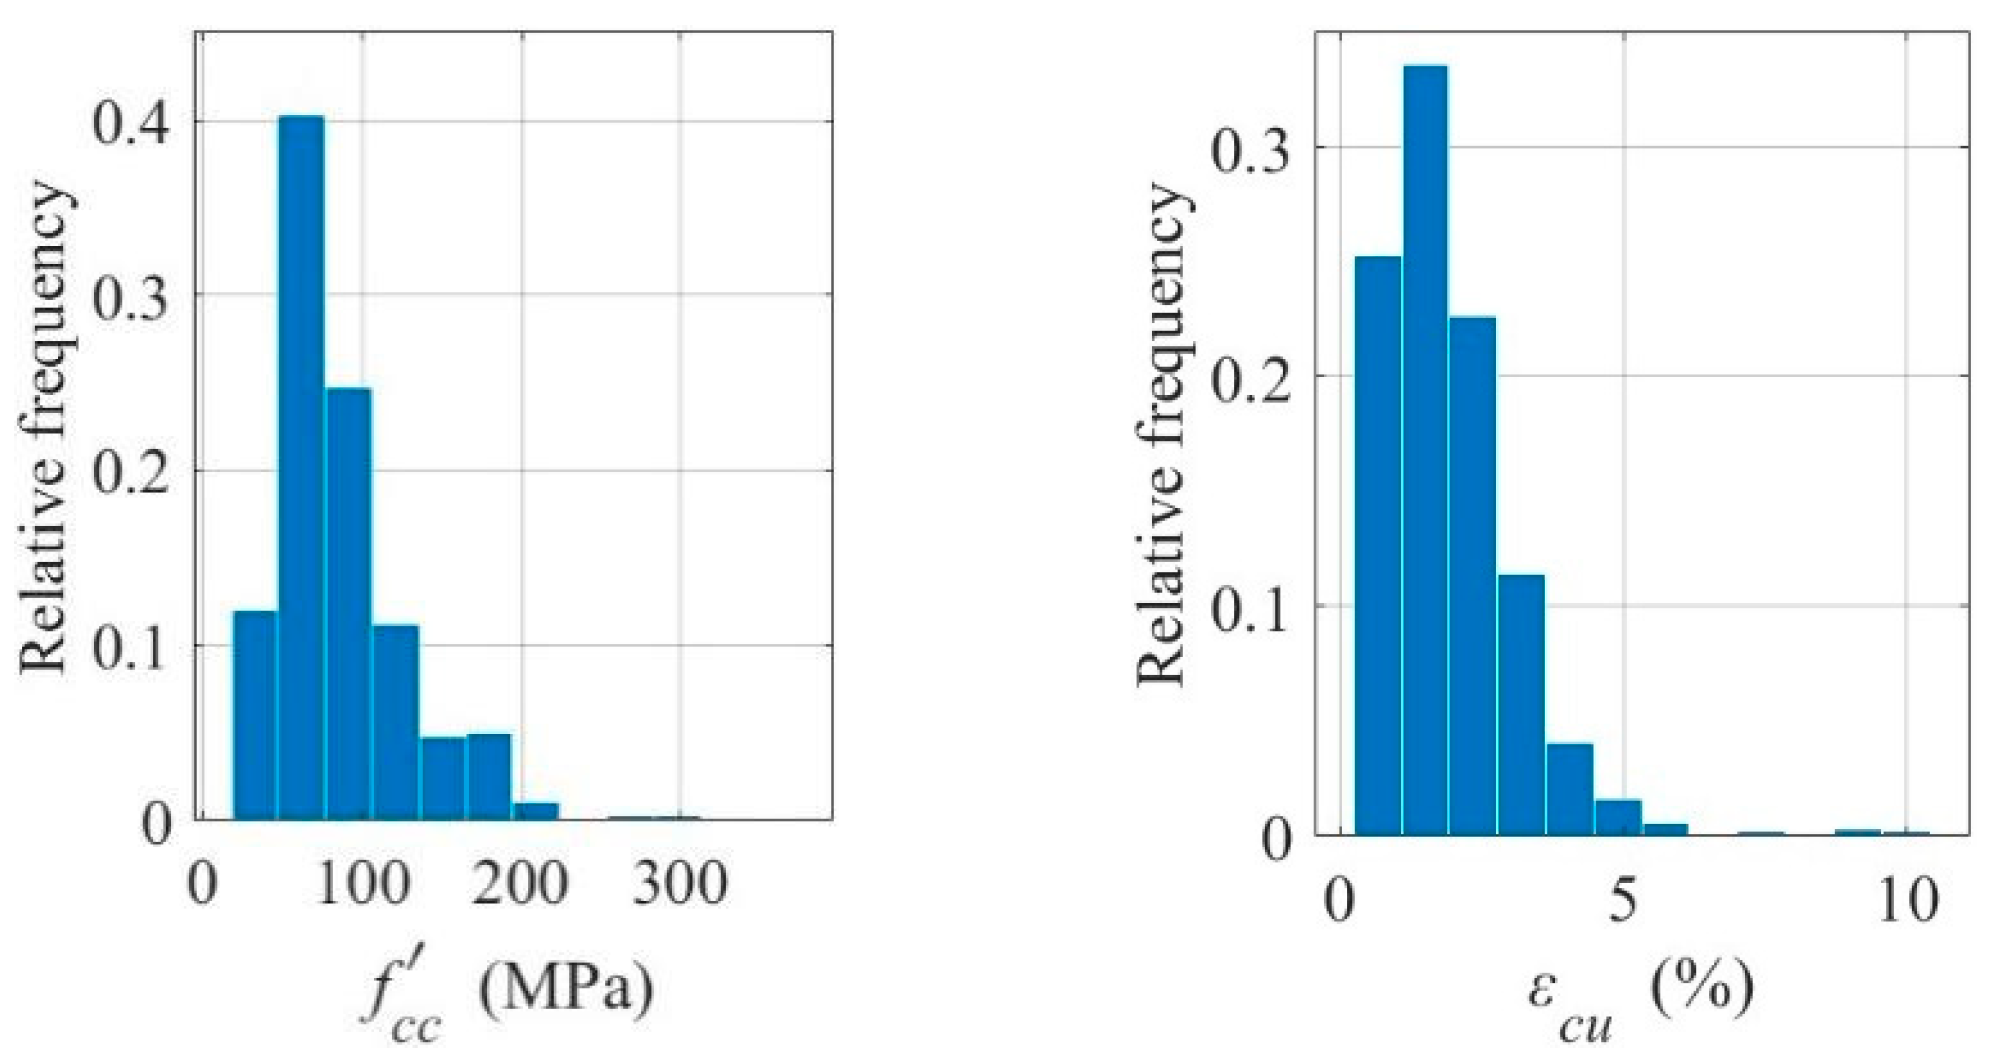
 Figure 1 and Figure 2 show the frequency distribution histograms of the relevant design variables and test variables. As seen from Table 1 and Figure 1 and Figure 2, the design variables included in the current database (such as geometric dimensions and mechanical properties) cover a wide range, indicating its substantial representativeness. In terms of geometric dimensions, the cylinder diameter ranges from 47 to 406.4 mm, and the thickness of the FRP material ranges from 0.06 to 15 mm. Regarding mechanical properties, the elastic modulus of the FRP material ranges from 10.3 to 663 GPa, the compressive strength of unconfined concrete cylinders ranges from 6.21 to 188.2 MPa, and the ultimate strain of unconfined concrete cylinders ranges from 0.12% to 0.43%. Therefore, evaluating compressive strength and ultimate strain based on this database is appropriate, and this database can also be used for probabilistic calibration of models and uncertainty quantification studies.
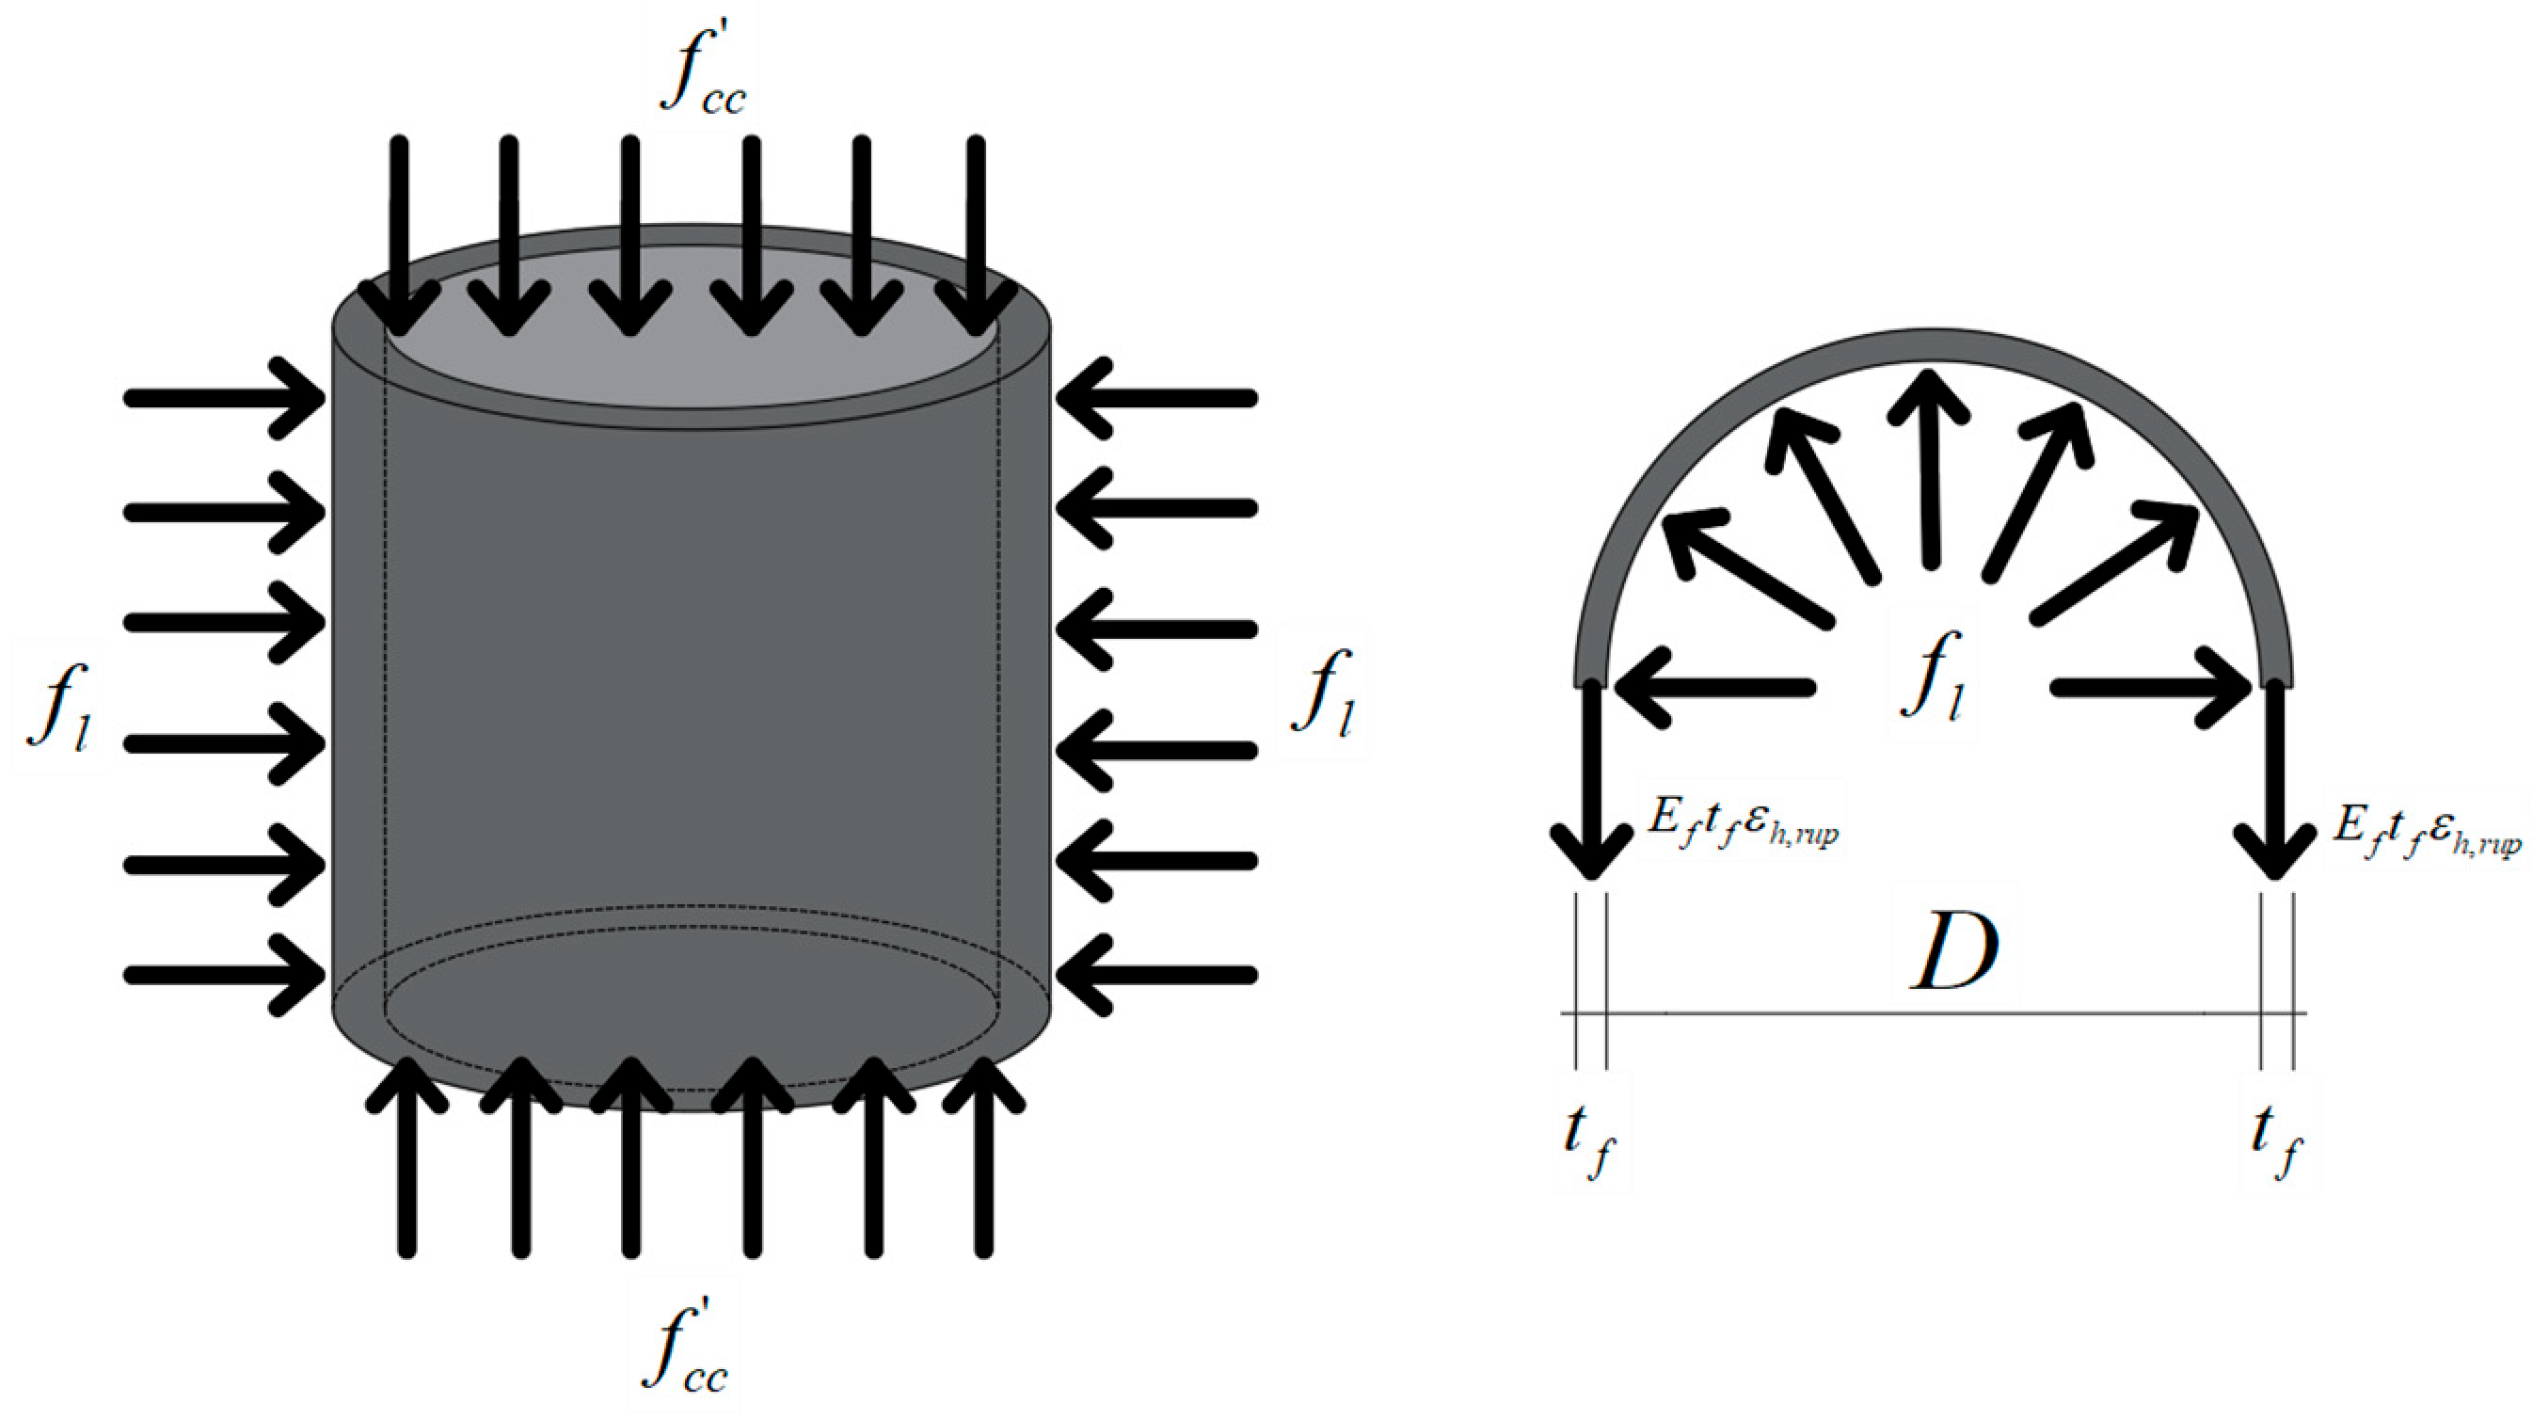
FRP-confined concrete cylinders provide confinement to the internal concrete through the circumferential load applied by the external FRP material, thereby enhancing the overall mechanical performance of the concrete cylinder. Figure 3 illustrates the confinement mechanism of FRP-confined concrete. Scholars around the world have proposed numerous studies on the compressive strength-bearing models for FRP-confined circular concrete cylinders. Existing strength models define several commonly used parameters, including the maximum confinement stress f l , confinement stiffness ratio ρ k , and ratio of strain ρ ε , where ρ k represents the stiffness of the FRP material relative to the core concrete, and ρ ε is a measure of the strain capacity of the FRP material. These two parameters were introduced by Teng et al. [92]. Additionally, Keshtegar [93] introduced the lateral stiffness ρ E and area ratio ρ a . Table 2 lists the expressions for these commonly used parameters, where D is the diameter of the circular concrete cylinder, f c o is the axial compressive strength of the unconfined concrete cylinder, f c c is the axial compressive strength of the FRP-confined circular concrete cylinder, ε c 0 is the axial strain of the unconfined concrete cylinder, ε c u is the ultimate strain of the FRP-confined circular concrete cylinder, t f is the total thickness of the FRP material, E f is the elastic modulus of the FRP material, and ε h , r u p is the circumferential fracture strain of the FRP material.
As shown in the expressions listed in Table 2, the commonly used composite variables in these models are typically formed by a combination of the mechanical properties of the FRP material and the confined concrete, along with the diameter of the concrete. Therefore, these composite variables can also be statistically analyzed using the combination of existing data to determine whether the collected data can be used to evaluate the current ultimate condition prediction models. The confinement ratio f l / f c o is a commonly used parameter in existing compressive strength models and is equal to the product of the confinement stiffness ratio ρ k and the ratio of strain ρ ε . According to the study by Teng et al. [92], the approximate value of 0.002 should not be used to calculate the confinement ratio. Instead, it should be calculated using the following formula (where f c o is in MPa):
ε c o = 9.37 × 10 4 f c o 4
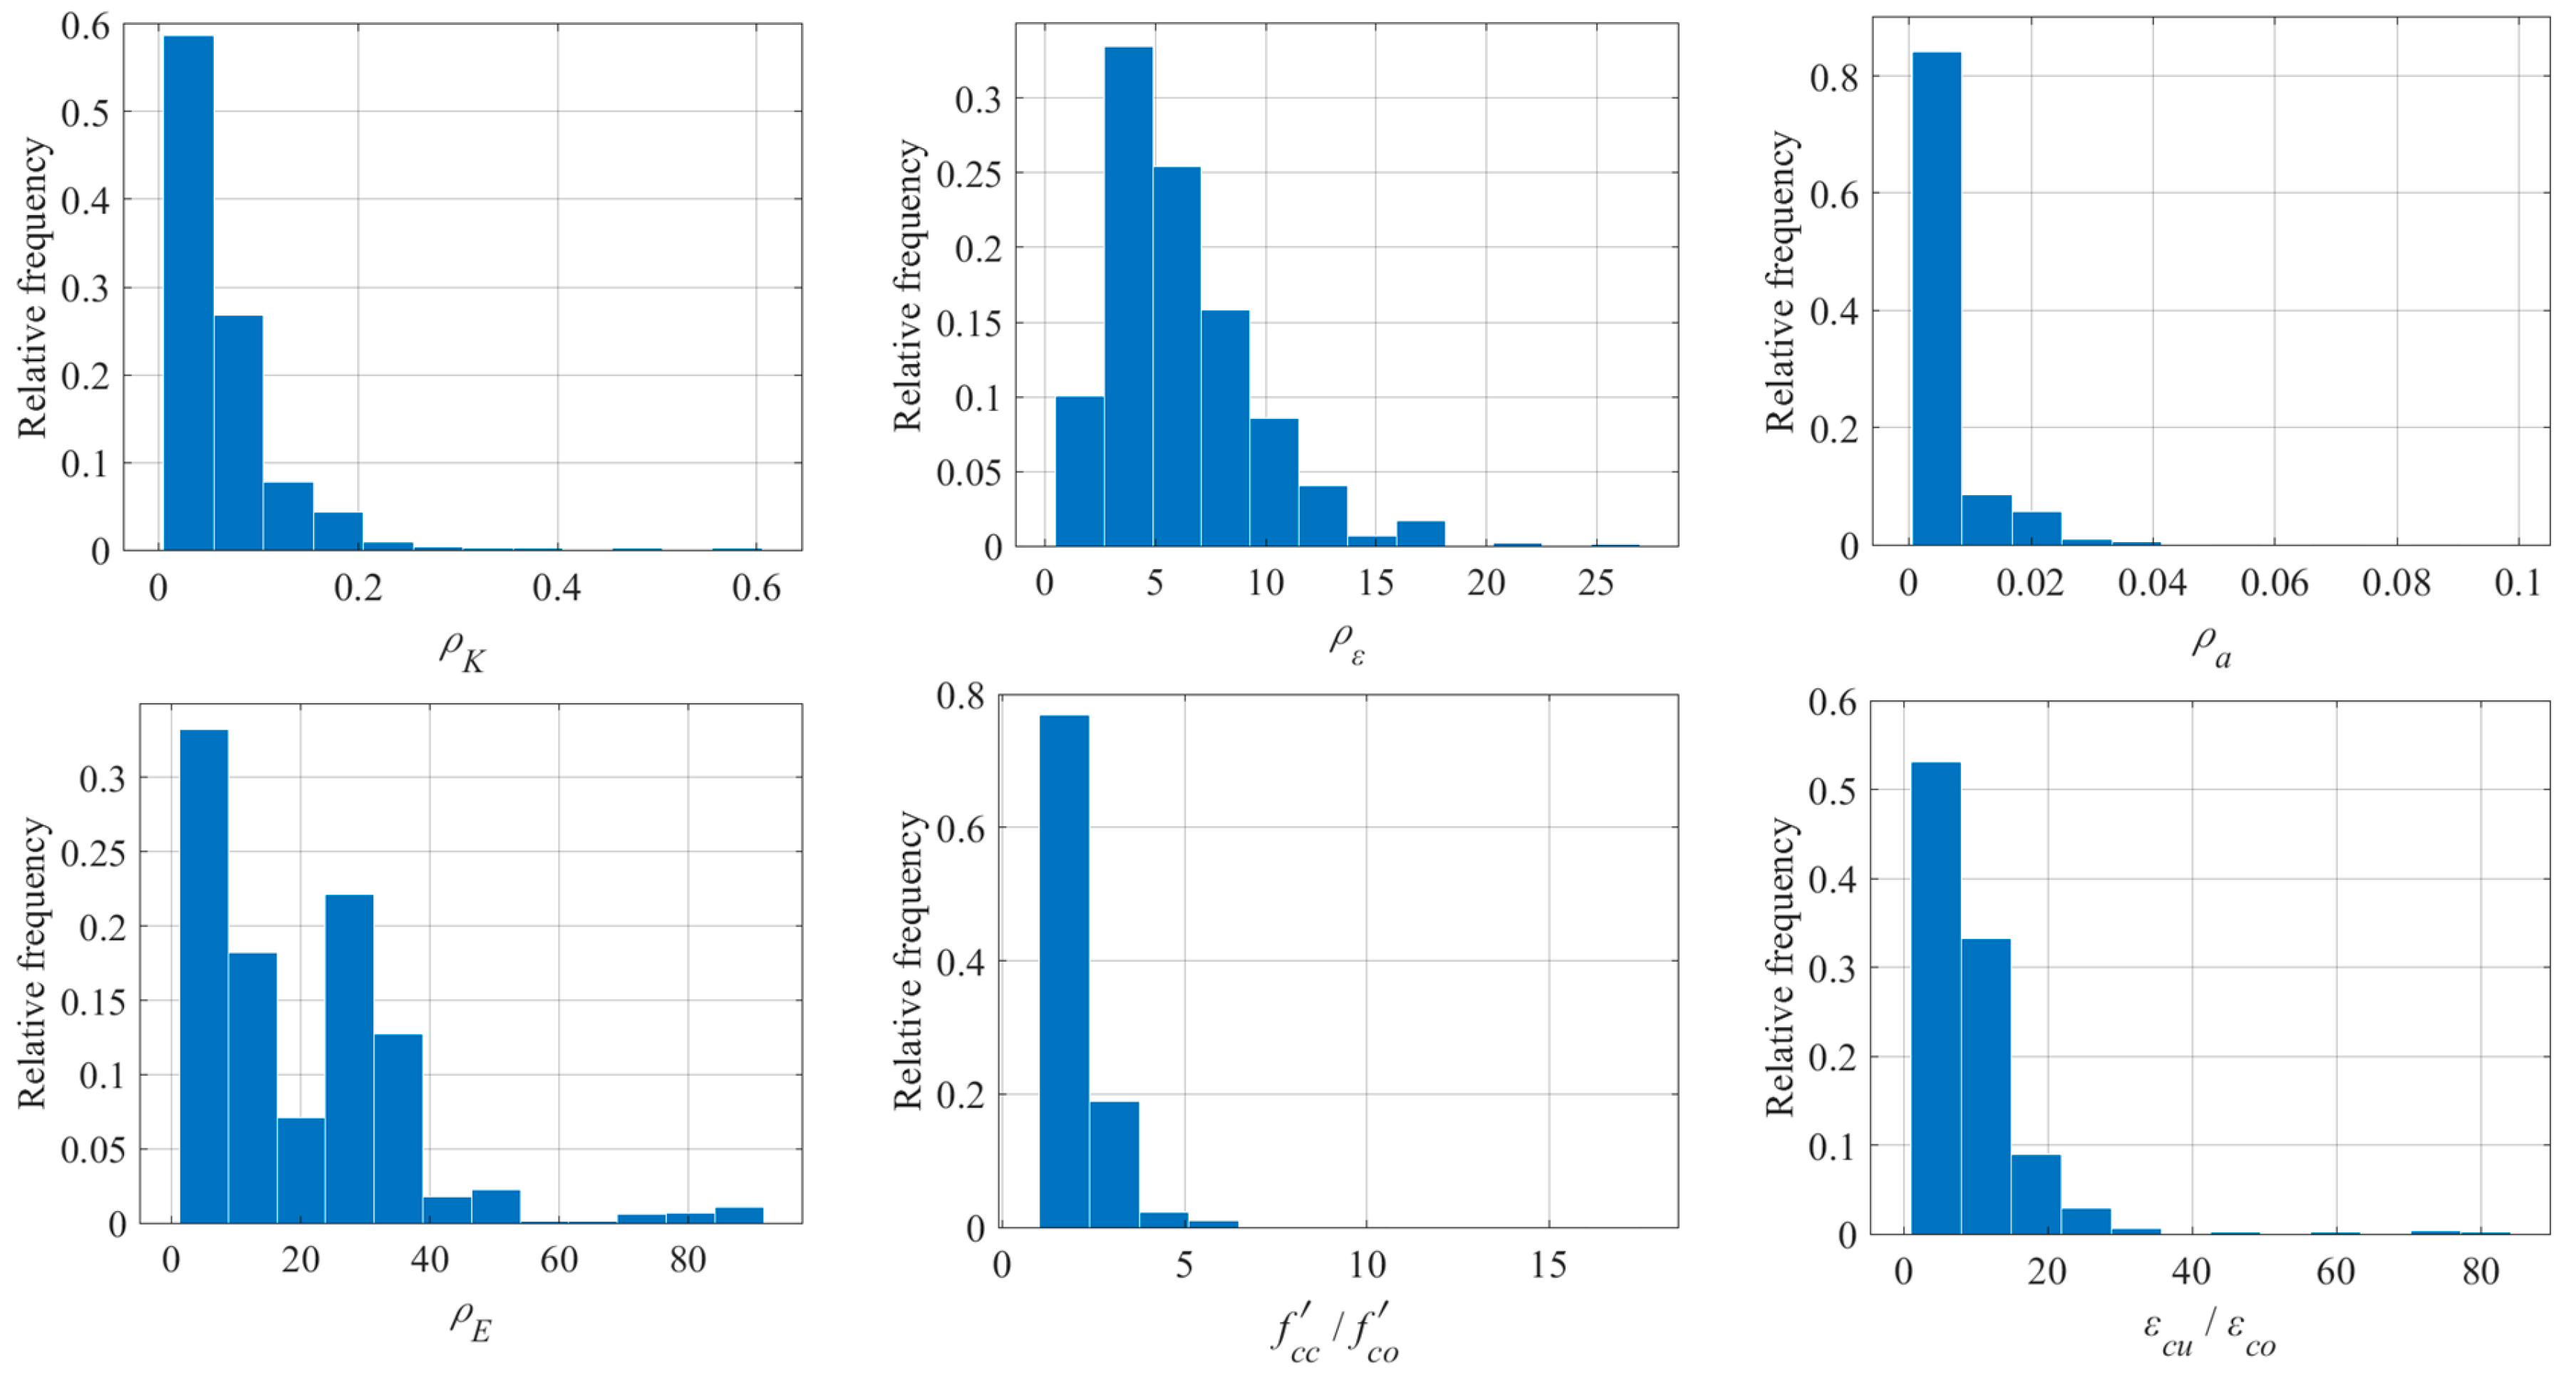
The statistical information of the commonly used composite parameters in the model is listed in Table 3. The table shows that the range of composite design variables in the database is wide, including the confinement stiffness ratio, ratio of strain, area ratio, and confinement stiffness, with ranges of 0.005 to 0.605, 0.464 to 26.946, 0.0006 to 0.099, and 1.190 to 91.689, respectively. The output variables, strength enhancement ratio and strain enhancement ratio, have ranges of 100.58% to 1746.8% and 105.5% to 8415.6%, respectively. It is evident that, after reinforcement with FRP materials, both the strength and ultimate strain of the concrete cylinders have increased to varying extents, indicating that FRP confinement can effectively improve the mechanical properties of the core concrete cylinders. Figure 4 presents the frequency distribution of each composite design variable.

3. Methodology

3.1. Bayesian Parameter Estimation

When performing reliable design of FRP-confined concrete cylinders, most existing models are deterministic, and the prediction results have significant uncertainty. Therefore, it is necessary to develop corresponding probabilistic models, which can typically be expressed by the following equation
y = M x , θ + ε
where y represents the output variable; x = x 1 , x 2 , denotes the corresponding input variable; M x , θ represents the model prediction term; θ indicates the parameter vector to be identified; and ε represents the error term, which is caused by various measurement errors. It is typically assumed that ε follows a Gaussian distribution with a mean of 0 and a variance of σ 2 .
When applying the above model, several assumptions must be made. In this study, the assumptions of additivity, homoscedasticity, and normality are adopted, implying that the error term is additive, has a constant variance independent of the variables, and follows a normal distribution [94,95,96]. A probabilistic model for the ultimate condition under compression of FRP-confined concrete cylinders can be established by treating the parameters in the model expression M x , θ as random variables that follow specific probability distributions. Accordingly, the first step is to determine the probability distributions of the model parameters, based on which the probability distribution of the output variable can be predicted.
In the theory of Bayesian inference, unknown parameters are treated as random variables, and probability distributions are used to represent prior assumptions about the parameters before observing the data. This probability distribution is referred to as the prior distribution. By incorporating observed data, our knowledge of the parameters can be updated, resulting in the posterior distribution. In this way, a more accurate inference of the parameter values can be achieved. Given a dataset D = x i , y i , i = 1 , 2 , , N e consisting of N e experimental observations, the posterior probability distribution of the model parameter θ can be calculated using Bayes’ theorem [97], as follows
p θ D , M = p D θ , M p θ M p D M
where θ = θ 1 , θ 2 , , θ d denotes the vector of model parameters; M represents the deterministic compressive strength model; p θ M is the prior probability distribution of the model parameters; p θ D , M is the posterior probability distribution of the model parameters; p D θ , M is the likelihood function of the model parameters given the experimental data D ; and p D M is the Bayesian evidence (also known as the marginal likelihood).
The posterior probability distribution of the parameter θ is proportional to the product of the likelihood function and the prior probability distribution. This proportional relationship implies that the posterior distribution p θ D , M can still be obtained by multiplying the likelihood function p D θ , M with the prior distribution p θ M [98,99], as expressed by
p θ D , M p D θ , M p θ M
In the Bayesian framework, the posterior probability distribution represents the updated probability distribution of the model parameters based on newly acquired information from observed data. However, this approach has certain limitations. For instance, it is often difficult to compute the likelihood function and the normalization constant of the posterior distribution. As a result, directly solving high-dimensional integrals to obtain the posterior probability density of the parameters is generally infeasible. To address this issue, the Markov Chain Monte Carlo (MCMC) method [97] is widely employed to estimate the posterior probability density in Bayesian inference. Assuming that n independent samples θ 1 , θ 2 θ n have been drawn from the posterior distribution p θ D , M using the MCMC method, statistical information of the posterior distribution—such as the mean vector and covariance matrix of the model parameter θ —can be calculated accordingly.

3.2. Model Selection and Evaluation Indicators

When refining existing models, it is often necessary to compare multiple models in order to select the one with the best predictive performance. In general, models with a larger number of parameters and greater complexity tend to exhibit better predictive capabilities. However, to avoid overfitting and excessive parameterization—which may reduce the model’s ability to generalize to new or future data—complex models are typically penalized through certain adjustment criteria. In this study, the Watanabe–Akaike Information Criterion (WAIC) [100] and the Deviance Information Criterion (DIC) [101] are employed to compare the performance of existing models. The model with the lower criterion value is preferred for Bayesian parameter refinement.
The Widely Applicable Information Criterion (WAIC) is a fully Bayesian approach that utilizes the entire posterior distribution.
W A I C = 2 l p p d + 2 p WAIC
The parameter expressions in the equation are given as follows:
l p p d = i = 1 n log 1 S s = 1 S p y i θ s
p WAIC = i = 1 n V s = 1 S ( log p ( y i θ s ) )
The Akaike Information Criterion (AIC) [102] is an indicator used to evaluate the goodness-of-fit of statistical models, based on the concept of entropy. It provides a trade-off between the complexity of the estimated model and its ability to fit the observed data, aiming to identify a model that best explains the data with the lowest number of free parameters. The Deviance Information Criterion (DIC), on the other hand, can be regarded as a partially Bayesian extension of the AIC. Its penalty for model complexity is data-driven. The value of DIC can be calculated as follows:
D I C = 2 log p ( y θ ^ Bayes ) + 2 p D I C
The parameter expressions in the equation are given as follows:
p D I C = 2 log p y θ ^ Bayes 1 S s = 1 S log p y θ S
Model comparison enables the selection of models with better predictive performance. To reasonably evaluate the predictive capability of the models, a quantitative assessment was further conducted in this study. Four statistical indicators were employed, including Mean Absolute Percentage Error (MAPE), Root Mean Square Error (RMSE), Coefficient of Variation (CV), and Coefficient of Determination (R2). The mathematical expressions of these indicators are given as follows [103,104,105]
R M S E = 1 n x y 2
M A P E = 1 n x y x × 100 %
R 2 ( X , Y ) = x x ¯ y y ¯ x x ¯ 2 y y ¯ 2 2
C O V = 1 n x y μ 2 / μ , μ = 1 n x y
where n denotes the number of data points; X and Y represent the vectors of experimental and predicted values, respectively; x refers to the experimentally measured compressive strength, y denotes the model-predicted compressive strength; and x ¯ and y ¯ are the mean values of the experimental and predicted results, respectively. The coefficient of determination ( R 2 ) ranges from 0 to 1. An R 2 value of 1 indicates perfect agreement between the predicted and experimental results, whereas R 2 = 0 implies no correlation between them. Although a value of R 2 = 1 reflects a strong linear relationship, it does not guarantee the perfection of the model predictions. Typically, RMSE and MAPE are used to assess the overall prediction error of a model, while a smaller CV value indicates lower dispersion in the predictions and thus higher predictive accuracy.

3.3. Bayesian Model Prediction

Inference based on the posterior probability distribution for model prediction is a commonly used approach. Once the posterior distribution of the model parameters is obtained, probabilistic predictions can be made for a given input variable x . In other words, the posterior distribution of the model parameters θ allows for the computation of the corresponding probability distribution of the output variable y for a specific input. The mean of this distribution can be considered the optimal prediction of y, while its variance provides an estimate of the credible interval (CI) for the response variable.
In Bayesian theory, integration over the posterior probability is required. The marginal integration of the posterior distribution can be expressed as follows:
p y x , D , M = p y x , θ , M p θ D , M d θ
In general, the computation of the posterior probability distribution p θ D , M becomes analytically intractable. To address this issue, a Markov Chain Monte Carlo (MCMC) method can be employed to draw a sufficiently large number of independent samples from the posterior distribution. Subsequently, the Monte Carlo Simulation (MCS) method is used to estimate the probability distribution of the parameter y [106]. Specifically, for a given model M , each sample point in the parameter space can be weighted according to its likelihood given the observed data. These sampled parameters can then be used to generate predictions for new input data.
In summary, by randomly sampling from the posterior distribution of the model parameters θ , a corresponding model prediction M x , θ i can be obtained for each sample. By incorporating a stochastic error term ε, a predicted value y i can be generated for that specific parameter sample. Repeating this process for all parameter samples yields a set of predicted output values y . To better understand the characteristics of the model, statistical features such as the mean and variance of these predicted values can be further computed. In addition, other statistical properties of the predictive distribution—such as quantiles—can also be derived. Once key quantiles, such as the 2.5%, 25%, 75%, and 97.5% percentiles, are obtained, the corresponding 50% and 95% credible intervals can be readily calculated.

4. Results and Discussions

4.1. Evaluation of Existing Deterministic Models

4.1.1. Evaluation of Prediction Models for Compressive Strength

In this study, eight representative models were selected from the literature [92,93,107,108,109,110,111], and their predictive performance was evaluated using an existing database. These eight models are deterministic compressive strength models proposed by different researchers, and their specific formulations are presented in Table 4.
Using these eight deterministic models, the axial compressive strength of FRP-confined concrete cylinders can be predicted and subsequently compared with the corresponding experimental results to evaluate the predictive performance of each model. Figure 5 illustrates the comparison between the predicted and experimental values of axial compressive strength for the eight deterministic models. The horizontal axis represents the experimentally measured compressive strength, while the vertical axis denotes the compressive strength predicted by the models. The red diagonal line indicates perfect agreement between predicted and experimental values. The closer the scatter points are to this diagonal line, the more accurate the model’s predictions, indicating a higher precision in estimating the compressive strength.
As shown in Figure 5, the Newman (1971) [112] and Toutanji (1999) [107] models tend to overestimate the axial compressive strength of FRP-confined concrete cylinders, whereas the Guralnick (2006) model [108] generally underestimates the compressive strength. The remaining models exhibit relatively good predictive performance when the compressive strength of the confined concrete is low, with the scatter points distributed symmetrically around the diagonal line. However, when the compressive strength is high, the predictive accuracy of all existing models deteriorates significantly.
In addition, the predictive performance of the eight compressive strength models was quantitatively evaluated. The detailed results of the statistical evaluation for each candidate model are summarized in Table 5.
As shown in Table 5, the Newman (1971) [112] model, being the earliest among the candidates, demonstrates relatively poor predictive accuracy. In contrast, the Keshtegar I (2017) model [93] exhibits the best predictive performance overall. This model consistently outperforms the others across all statistical indicators, with the remaining models falling short in at least one metric.
In terms of variability, the Teng (2009) model [92] yields the highest coefficient of variation (COV), reaching 20.445%, whereas the Keshtegar I (2017) model [93] shows the lowest COV, at 17.213%. Overall, among the eight candidate deterministic models, the Keshtegar I (2017) [93] model demonstrates the most reliable and accurate predictive capability.

4.1.2. Evaluation of Prediction Models for Ultimate Strain

In this section, seven representative models were selected from the literature, and their predictive performance was evaluated using an existing database. These seven models are deterministic ultimate strain models proposed by different researchers, and their specific formulations are presented in Table 6.
Using these seven deterministic models, the ultimate strain of FRP-confined concrete cylinders can be predicted and compared with the corresponding experimental results to evaluate the predictive performance of each model. Figure 6 presents the comparison between the predicted and experimental ultimate strain values for the seven deterministic models. The horizontal axis represents the experimentally measured ultimate strain, while the vertical axis denotes the ultimate strain predicted by the models. The red diagonal line indicates perfect agreement between predicted and experimental values. The closer the scatter points lie to this diagonal line, the closer the predicted values are to the experimental results, indicating higher predictive accuracy of the corresponding model for ultimate strain estimation.
As shown in Figure 6, the Mander (1998) [14] and Toutanji (1999) [107] models tend to underestimate the ultimate strain of FRP-confined concrete cylinders under axial loading. The remaining models exhibit better predictive performance at lower compressive strength levels, with the scatter points distributed relatively evenly on both sides of the diagonal line. However, as the compressive strength increases, the predictive accuracy of all existing models for ultimate strain significantly deteriorates. Furthermore, the predictive performance of the seven ultimate strain models was quantitatively evaluated, and the detailed statistical results of the evaluation are summarized in Table 7.
As shown in Table 7, the Teng (2009) model [92] exhibits relatively poor predictive performance, while the Toutanji (1999) model [107] demonstrates superior accuracy compared to the other models. Overall, the Toutanji (1999) model [107] outperforms the rest, as the remaining models show inferior performance in at least one of the evaluated metrics. In terms of model variability, the Mander (1998) model [14] yields the highest coefficient of variation (COV), reaching 52.4482%, whereas the Ozbakkaloglu (2013) model [109] presents the lowest COV value of 45.8763%. In summary, among the seven candidate deterministic models, the Toutanji (1999) model [107] exhibits the best predictive capability. Although both the compressive strength and ultimate strain models tend to show smaller prediction errors at lower concrete strength levels, their overall predictive performance for the collected experimental database remains unsatisfactory. This indicates a significant degree of uncertainty in their predictions. To enable a more reliable design of FRP-confined circular concrete cylinders, it is necessary to calibrate both the compressive strength and ultimate strain models using probabilistic approaches. Such methods can enhance predictive accuracy and provide a rational quantification of the associated uncertainty.

4.2. Bayesian Updating and Selection of the Models

4.2.1. Bayesian Updating and Selection of Prediction Models for Compressive Strength

In the process of model parameter identification based on Bayesian theory, it is essential to first select an appropriate model form. In this study, eight types of parameterized compressive strength models were collected from the existing literature [93,110], and their formulations are summarized in Table 8.
In general, model parameters θ can be considered as random variables following a certain probability distribution, which allows the prediction uncertainty of the probabilistic model, as expressed in Equation (2), to be properly interpreted. To determine the most appropriate probability distribution for the model parameters θ , Bayesian inference combined with the Markov Chain Monte Carlo (MCMC) method is adopted in this study.
The collected experimental data are randomly divided into two subsets—a training set and a testing set—in a ratio of 7:3. Given that the existing experimental database contains 1016 samples in total, 711 samples are selected as the training set, and the remaining 305 samples are used as the testing set. The training data are employed for the probabilistic calibration of the compressive strength models, while the testing data are used for evaluating and analyzing the predictive performance of the calibrated models. After data partitioning, a total of 50,000 independent samples are drawn from the posterior distributions of the model parameters using the Delayed Rejection Adaptive Metropolis–Hastings (DRAM) algorithm [113]. The sampling process is implemented via the MatDRAM toolbox [114] on the MATLAB 2023b software platform. Since the selected models are nonlinear in nature, the parameters θ are assumed to follow uncertain probability distributions. These distributions are characterized by their mean and standard deviation values, which are calculated and presented in Table 9 and Table 10, respectively.
When modifying existing models, it is generally necessary to compare multiple candidates in order to select the one with superior predictive performance. In general, models with a greater number of parameters and higher complexity tend to exhibit better predictive accuracy. However, to avoid overfitting and excessive parameterization—which may impair the model’s ability to generalize to future data—penalization adjustments are typically introduced for more complex models. Accordingly, the Akaike Information Criterion (AIC) and the Widely Applicable Deviance Information Criterion (WAIC) scores were calculated for the eight probabilistic models. When comparing Deviance Information Criterion (DIC) and WAIC, WAIC is often preferred due to its robustness in handling multimodal posterior distributions. This is because WAIC is computed using the full posterior distribution, whereas DIC is based on the posterior mean, which can sometimes lead to misleading conclusions. Moreover, DIC may fail in the presence of singular models. Therefore, WAIC is prioritized for model evaluation in this study. The DIC and WAIC scores of the eight selected models, along with the corresponding computational results, are summarized in Table 11. A visual comparison of these results is illustrated in Figure 7.
The results indicate that all models yield relatively consistent scores across different evaluation criteria, with only minor differences observed. Models with fewer parameters generally perform better in the evaluation, while the model with the largest number of parameters does not achieve the best performance. Considering both the DIC and WAIC scores comprehensively, Model 5 is selected as the preferred model for further modification.

4.2.2. Bayesian Updating and Selection of Prediction Models for Ultimate Strain

Eight types of parameterized ultimate strain models were collected from the existing literature [93,110], and their formulations are summarized in Table 12.
Similarly, by letting y = ln ( ε c c ε c o ) , all the aforementioned models can be expressed in the form of Equation (2). In the following analysis, Bayesian inference combined with the MCMC sampling method will again be employed to determine the posterior probability distributions of the model parameter θ .
Similarly, the collected experimental data are randomly divided into a training set and a testing set, with a ratio of 7:3. Given that the existing experimental database contains a total of 1016 samples, 711 samples are selected for the training set, and the remaining 305 samples are used for the testing set. The training data are utilized for the probabilistic calibration of the ultimate strain models, while the testing data serve for evaluating and analyzing the predictive performance of the calibrated models.
The sampling of posterior distributions follows the same procedure as described in Section 4.2.1. Additionally, the mean and standard deviation of the ultimate strain probabilistic model distributions are computed and presented in Table 13 and Table 14, respectively.
Similarly, the DIC and WAIC scores of the eight selected ultimate strain models, along with the corresponding computational results, are summarized in Table 15. A visual comparison of these results is illustrated in Figure 8.
The results show that, similar to the compressive strength models, all ultimate strain models yield relatively consistent scores across different evaluation criteria, with only minor differences observed. Models with fewer parameters generally perform better in the evaluation, while the model with the largest number of parameters does not achieve the best performance.
Taking into account both the DIC and WAIC scores, Model 5 is selected as the preferred model for further modification.

4.3. Model Comparisons

4.3.1. Comparisons of Predicting Compressive Strengths

After obtaining the posterior probability distribution of the model parameters, the Monte Carlo Simulation (MCS) method can be employed to predict the probability distribution of the response variable y ( f c c / f c o ) . Assuming that the parameter θ follows an uncertain probability distribution, the mean value of the MCS results can be regarded as the optimal prediction of the response variable within the probabilistic framework. Subsequently, the optimal prediction of the compressive strength can be derived using the model expression. Figure 9 presents a comparison between the predicted optimal values of compressive strength obtained from the probabilistic model and the corresponding experimental results. Overall, the scatter points of the revised model’s predictions are symmetrically distributed around the diagonal and exhibit a more concentrated pattern, indicating that the modified model yields predictions that are more consistent with the measured values than the original model. To further evaluate the predictive performance of the probabilistic model, statistical evaluation indicators were also computed for other models after probabilistic updating. The detailed results are summarized in Table 16.
By comparing the four statistical evaluation metrics presented in Table 5 and Table 16, it is evident that the predictive performance of the revised probabilistic model is significantly improved over the original version. Moreover, the RMSE, MAPE, R2, and COV values for all probabilistic models are nearly identical, indicating that their predictive performances are comparable. Based on the model selection results discussed in the previous section, Model 5 was chosen for comparison with the deterministic models presented earlier. The comparison results reveal that, after model updating, the RMSE of the probabilistic prediction was reduced by 13.02% compared to the minimum value before updating, the MAPE decreased by 1.89%, the R2 value increased by 3.96%, and the COV was reduced by 3.04%. According to the quantitative results in Table 16, it can be inferred that the revised model predictions are closer to the experimental values, thereby improving the goodness-of-fit, while reducing the model dispersion. Furthermore, the evaluation metrics for the training and testing sets differ only slightly, demonstrating the proposed probabilistic model’s strong generalization capability.
For the probabilistic predictions of compressive strength obtained from the revised model, the percentage of experimental compressive strength data falling within different confidence intervals is illustrated in Figure 10. It can be observed that the differences in sample proportions across various confidence levels are minimal, indicating that the uncertainty quantification of the predictions by the probabilistic model is reasonably accurate.
Figure 11 presents the probabilistic prediction results for Model 5. The prediction output is treated as a random variable, with the 50% and 95% confidence intervals represented by dark-gray- and light-gray-shaded regions, respectively. The red curve indicates the predicted mean values, while the scattered dots correspond to the experimental data. It can be observed that the experimental compressive strength values are evenly distributed on both sides of the predicted mean curve, suggesting that the probabilistic model does not exhibit any systematic tendency to overestimate or underestimate the compressive strength. Moreover, only a few experimental values fall outside the 95% confidence interval, and most of the values lie within the 50% interval. These observations indicate that the proposed probabilistic model is capable of effectively quantifying the uncertainty in predicting the compressive strength of FRP-confined circular concrete cylinders.
In addition, eight existing compressive strength models were selected for comparison, and their specific formulations are listed in Table 17.
To evaluate the accuracy of these models, their predicted values were compared with the experimental results. Figure 12 illustrates the comparison between the predicted and measured compressive strength values for each model.
As shown in Figure 12, Models A, B, and H tend to overestimate the axial compressive strength of FRP-confined concrete cylinders at lower strength levels. In contrast, the other models do not exhibit a clear tendency to overestimate or underestimate the compressive strength in this range, with the data points relatively evenly distributed on both sides of the diagonal line. However, at higher strength levels, except for Models A and B, which still show a relatively balanced distribution of data points around the diagonal, the remaining models display noticeable inaccuracies in prediction, with a general tendency to underestimate the compressive strength of the concrete.
The quantitative evaluation results for the candidate compressive strength models are summarized in Table 18. It can be observed that Model H performs significantly worse than the other models in terms of predictive accuracy. The remaining models show varying levels of accuracy across different evaluation metrics—some models perform well on certain indicators but fall behind on others. Among them, Model E demonstrates the best overall predictive performance, outperforming all other models across most evaluation criteria, with at least three indicators where the remaining models perform worse than Model E. In terms of model dispersion, except for Model H, Model D exhibits the highest coefficient of variation (COV) at 19.4770%, while Model F shows the lowest COV at 16.9079%. Overall, Model E can be considered the most reliable among the candidate models in terms of prediction accuracy.
Therefore, the predictive performance of the revised probabilistic Model 5 is compared with that of Model E. The comparison results show that the RMSE of Model 5 is 6.65% lower than that of Model E, the MAPE is reduced by 4.08%, the R2 value is increased by 2.09%, and the COV is reduced by 1.74%. These findings indicate that employing a probabilistic model for predicting the compressive strength of FRP-confined concrete cylinders can effectively improve prediction accuracy while reasonably quantifying the uncertainty associated with the results.

4.3.2. Comparisons of Predicting Ultimate Strains

Similarly, after obtaining the posterior probability distribution of the model parameters, the Monte Carlo Simulation (MCS) method can be employed to predict the probability distribution of the response variable y ( ε c c / ε c o ) . Assuming that the parameter θ follows an uncertain probability distribution, the mean value of the MCS results can be considered the optimal prediction of the response variable y in the probabilistic model. Based on the model formulation, the optimal prediction of the ultimate strain can then be obtained. Figure 13 presents a comparison between the predicted optimal values of ultimate strain from the probabilistic model and the corresponding experimental results. Overall, the scatter points of the revised model’s predictions are symmetrically and more tightly distributed around the diagonal, indicating that the revised model yields predictions that are closer to the experimental values than those of the uncorrected model. To further assess the predictive performance of the probabilistic model, statistical evaluation metrics were also computed for other models after probabilistic updating, with detailed results provided in Table 16.
By comparing the four statistical evaluation metrics in Table 7 and Table 19, it is evident that the predictive performance of the revised probabilistic model is significantly improved over the original version. Moreover, the RMSE, MAPE, R2, and COV values of all probabilistic models are nearly identical, indicating minimal differences in predictive performance among them. Based on the probabilistic model selection results presented in the previous section, Model 5 was selected for further comparison with the deterministic models. The comparison shows that the RMSE of the revised probabilistic model is reduced by 14.17% compared to the minimum value before updating, the R2 value is increased by 7.14%, and the COV is reduced by 0.24%. According to the quantitative results in Table 19, it can be inferred that the predictions from the revised model are closer to the experimental values, indicating both improved goodness-of-fit and reduced model dispersion. Additionally, the differences in evaluation metrics between the training and testing sets are minimal, which demonstrates the strong generalization capability of the proposed probabilistic model.
The R2 value increased by 7.14%, while the COV decreased by 0.24% compared to the uncorrected model. Based on the quantitative results presented in Table 19, it can be inferred that the revised model yields predictions that are closer to the experimental values, thereby improving the goodness-of-fit and reducing the prediction dispersion. In addition, the evaluation metrics for the training and testing datasets exhibit only minor differences, which demonstrates the strong generalization capability of the proposed probabilistic model.
For the probabilistic predictions of ultimate strain obtained from the revised model, the percentage of experimental data falling within different confidence intervals is illustrated in Figure 14. It can be observed that the differences in sample proportions across the various confidence levels are minimal, indicating that the probabilistic model provides a reasonable quantification of uncertainty in its predictions.
Figure 15 presents the probabilistic prediction results for Model 5. The prediction is treated as a random variable, with the 50% and 95% confidence intervals represented by dark-gray- and light-gray-shaded areas, respectively. The red curve denotes the predicted mean values, while the scattered points correspond to the experimental data. As shown in the figure, the experimental values of ultimate strain are evenly distributed on both sides of the predicted mean curve, indicating that the probabilistic model does not exhibit any systematic tendency to overestimate or underestimate the ultimate strain. Moreover, only a few experimental values fall outside the 95% confidence interval, and most of them lie within the 50% interval. This demonstrates that the proposed probabilistic model effectively captures the uncertainty associated with the prediction of ultimate strain in FRP-confined circular concrete cylinders.
In addition, eight ultimate strain models were selected for comparison, and their specific formulations are presented in Table 20.
The predicted values of the eight models were compared with the experimental results to evaluate the accuracy of each model. Figure 10 illustrates the comparison between the predicted and experimental values.
As shown in Figure 16, when the ultimate strain of the core concrete is relatively low, Model A tends to underestimate the ultimate strain of the concrete, while the other models neither significantly overestimate nor underestimate it, with the scatter points distributed relatively evenly around the diagonal line. However, when the core concrete exhibits higher ultimate strain, all models show reduced predictive accuracy for the ultimate strain, generally tending to underestimate the axial compressive strength of FRP-confined concrete cylinders.
The quantitative evaluation results of the ultimate strain models are summarized in Table 21. It can be observed that Model A exhibits relatively poor predictive performance, as indicated by its higher RMSE and MAPE values and lower R2 value. The accuracy of the remaining models varies across different indicators—some models perform well in certain metrics but poorly in others. Among all models, Model H demonstrates the best predictive capability, outperforming the others in terms of overall accuracy, with all remaining models being inferior to it in at least two evaluation metrics. Regarding the degree of dispersion, Model A shows the highest coefficient of variation (COV) at 53.5498%, while Model F has the lowest COV at 47.3828%. Overall, Model H is identified as having the most reliable predictive performance among the evaluated models.

5. Conclusions

This study proposes a Bayesian inference-based method for probabilistic calibration of ultimate state models for FRP-confined circular concrete cylinders under axial compression. The primary objective is to enhance the predictive accuracy of existing models and quantify the associated prediction uncertainties. Representative compressive strength and ultimate strain models were selected from the literature as candidate models, and a comprehensive experimental database comprising 1016 test results for FRP-confined concrete cylinders was compiled. Based on this dataset, the candidate models were evaluated and calibrated. The following conclusions can be drawn from the analysis:
  • The evaluation metrics adopted in this study indicate significant discrepancies in the predictive performance of different ultimate state models under axial compression. Among them, the compressive strength model proposed by Keshtegar I (2017) [93] (RMSE = 0.4484, MAPE = 13.3223, R2 = 0.874) and the ultimate strain model proposed by Toutanji (1999) [107] (RMSE = 3.6717, MAPE = 33.1218, R2 = 0.7876) exhibited relatively higher prediction accuracy. However, the overall performance of these models remains unsatisfactory when applied to the compiled experimental database, indicating substantial prediction uncertainty. Therefore, a probabilistic approach is necessary to calibrate the axial compression ultimate state models.
  • To prevent overfitting and over-parameterization—which may hinder the model’s ability to accommodate future data expansion—WAIC and DIC were employed for further comparison of the existing models. To improve predictive accuracy while accounting for inevitable uncertainties, a Bayesian approach was adopted by replacing deterministic model parameters with probabilistic ones. Subsequently, a Bayesian inference-based framework was proposed to calibrate the probabilistic models, where the Markov Chain Monte Carlo (MCMC) algorithm was utilized to generate probabilistic parameter characteristics. The predictive uncertainty of the calibrated models can then be quantified using the Monte Carlo Simulation (MCS) method.
  • After Bayesian inference-based calibration, the accuracy of the probabilistic prediction models improved significantly. Compared with the best-performing deterministic model prior to calibration, the RMSE of the calibrated compressive strength model decreased by 13.02%, the MAPE was reduced by 1.89%, the R2 value increased by 3.96%, and the COV decreased by 3.04%. For the ultimate strain model, the calibrated version achieved a 14.17% reduction in RMSE, a 7.14% increase in R2, and a 0.24% decrease in COV, compared to the lowest values among the original models. These results demonstrate that the calibrated probabilistic models are capable of effectively quantifying the uncertainty in the prediction of the axial compressive strength of FRP-confined concrete cylinders.
Based on the above analysis, the corrected prediction model for the ultimate condition under compression, developed using Bayesian inference, demonstrates a significant improvement in accuracy compared to the uncorrected model. The posterior distribution serves as the basis for model correction, enhancing the accuracy of the prediction results. These improved predictions can provide more reliable references for experimental studies and engineering design, offering a foundation for appropriate adjustments to the design parameters.

Supplementary Materials

The following supporting information can be downloaded at https://www.mdpi.com/article/10.3390/buildings15101720/s1.

Author Contributions

Methodology, J.-X.Z.; Software, H.-B.H.; Formal analysis, R.Z. and H.-B.H.; Investigation, F.C. and R.Z.; Data curation, D.L.; Writing—original draft, F.C.; Writing—review & editing, J.-X.Z.; Project administration, D.L. All authors have read and agreed to the published version of the manuscript.

Funding

This research was funded by [National Natural Science Foundation of China] grant number [52478310] and Tianjin Municipal Transportation Commission Science and Technology Development Plan Project [2023-50].

Data Availability Statement

The original contributions presented in the study are included in the article and Supplementary Material, further inquiries can be directed to the corresponding author.

Conflicts of Interest

Author Feng Cao and Ran Zhu was employed by the company CCCC Third Highway Engineering Co., Ltd. The remaining authors declare that the research was conducted in the absence of any commercial or financial relationships that could be construed as a potential conflict of interest.

References

  1. Kim, Y.J. State of the practice of FRP composites in highway bridges. Eng. Struct. 2019, 179, 1–8. [Google Scholar] [CrossRef]
  2. Monaldo, E.; Nerilli, F.; Vairo, G. Basalt-based fiber-reinforced materials and structural applications in civil engineering. Compos. Struct. 2019, 214, 246–263. [Google Scholar] [CrossRef]
  3. Tatar, J.; Brenkus, N.R. Performance of FRP-Strengthened Reinforced Concrete Bridge Girders after 12 Years of Service in Coastal Florida. J. Compos. Constr. 2021, 25, 04021028. [Google Scholar] [CrossRef]
  4. Siddika, A.; Mamun, M.A.A.; Alyousef, R.; Amran, Y.H.M. Strengthening of reinforced concrete beams by using fiber-reinforced polymer composites: A review. J. Build. Eng. 2019, 25, 100798. [Google Scholar] [CrossRef]
  5. Lai, M.H.; Liang, Y.W.; Wang, Q.; Ren, F.M.; Chen, M.T.; Ho, J.C.M. A stress-path dependent stress-strain model for FRP-confined concrete. Eng. Struct. 2020, 203, 109824. [Google Scholar] [CrossRef]
  6. Chan, C.W.; Yu, T.; Zhang, S.S.; Xu, Q.F. Compressive behaviour of FRP-confined rubber concrete. Constr. Build. Mater. 2019, 211, 416–426. [Google Scholar] [CrossRef]
  7. Maheswaran, J.; Chellapandian, M.; Arunachelam, N. Retrofitting of severely damaged reinforced concrete members using fiber reinforced polymers: A comprehensive review. Structures 2022, 38, 1257–1276. [Google Scholar] [CrossRef]
  8. Zeng, J.-J.; Ye, Y.-Y.; Gao, W.-Y.; Smith, S.T.; Guo, Y.-C. Stress-strain behavior of polyethylene terephthalate fiber-reinforced polymer-confined normal-, high- and ultra high-strength concrete. J. Build. Eng. 2020, 30, 101243. [Google Scholar] [CrossRef]
  9. Lim, J.C.; Ozbakkaloglu, T. Influence of concrete age on stress–strain behavior of FRP-confined normal- and high-strength concrete. Constr. Build. Mater. 2015, 82, 61–70. [Google Scholar] [CrossRef]
  10. Liao, J.; Yang, K.Y.; Zeng, J.-J.; Quach, W.-M.; Ye, Y.-Y.; Zhang, L. Compressive behavior of FRP-confined ultra-high performance concrete (UHPC) in circular columns. Eng. Struct. 2021, 249, 113246. [Google Scholar] [CrossRef]
  11. Zeng, J.-J.; Zhu, D.-H.; Liao, J.; Zhuge, Y.; Bai, Y.-L.; Zhang, L. Large-rupture-strain (LRS) FRP-confined concrete in square stub columns: Effects of specimen size and assessments of existing models. Constr. Build. Mater. 2022, 326, 126869. [Google Scholar] [CrossRef]
  12. Ye, Y.Y.; Zeng, J.J.; Li, P.L. A State-of-the-Art Review of FRP-Confined Steel-Reinforced Concrete (FCSRC) Structural Members. Polymers 2022, 14, 677. [Google Scholar] [CrossRef]
  13. Liao, J.; Zeng, J.-J.; Gong, Q.-M.; Quach, W.-M.; Gao, W.-Y.; Zhang, L. Design-oriented stress-strain model for FRP-confined ultra-high performance concrete (UHPC). Constr. Build. Mater. 2022, 318, 126200. [Google Scholar] [CrossRef]
  14. Mander, J.B.; Priestley, M.J.; Park, R.J. Theoretical stress-strain model for confined concrete. J. Struct. Eng. 1988, 114, 1804–1826. [Google Scholar] [CrossRef]
  15. Nanni, A.; Bradford, N.M. FRP jacketed concrete under uniaxial compression. Constr. Build. Mater. 1995, 9, 115–124. [Google Scholar] [CrossRef]
  16. Saadatmanesh, H.; Ehsani, M.R.; Li, M.-W. Strength and ductility of concrete columns externally reinforced with fiber composite straps. Struct. J. 1994, 91, 434–447. [Google Scholar]
  17. Youssef, M.N.; Feng, M.Q.; Mosallam, A.S. Stress–strain model for concrete confined by FRP composites. Compos. Part B Eng. 2007, 38, 614–628. [Google Scholar] [CrossRef]
  18. Wu, G.; Lu, Z. Study on the stress-strain relationship of FRP-confined concrete circular column without a strain-softening response. J. Build. Struct. 2003, 24, 1–9. [Google Scholar]
  19. Richart, F.E.; Brandtzæg, A.; Brown, R.L. Failure of Plain and Spirally Reinforced Concrete in Compression. 1929. Available online: https://www.ideals.illinois.edu/items/5270/bitstreams/20658/data.pdf (accessed on 13 May 2025).
  20. Harmon, T.; Slattery, K. Advanced composite confinement of concrete. Advanced Composite Materials in Bridges and Structures. In Proceedings of the 1st International Conference, Sherbrooke, QC, Canada, 1992; pp. 299–306. Available online: https://scholar.google.com/scholar?q=Harmon%20TG%2C%20Slattery%2C%20KT.%20Advanced%20composite%20confinement%20of%20concrete.%20In%3A%20Proc%20int%20conf%20advanced%20composite%20materials%20in%20bridges%20and%20structures%2C%20Canadian%20Society%20for%20Civil%20Engineering%3B%201992.%20p.%20299%E2%80%93316 (accessed on 13 May 2025).
  21. Yang, J.-Q.; Feng, P. Analysis-oriented models for FRP-confined concrete: 3D interpretation and general methodology. Eng. Struct. 2020, 216, 110749. [Google Scholar] [CrossRef]
  22. Jiang, T.; Teng, J.G. Analysis-oriented stress–strain models for FRP–confined concrete. Eng. Struct. 2007, 29, 2968–2986. [Google Scholar] [CrossRef]
  23. Pessiki, S.; Harries, K.A.; Kestner, J.T.; Sause, R.; Ricles, J.M. Axial behavior of reinforced concrete columns confined with FRP jackets. J. Compos. Constr. 2001, 5, 237–245. [Google Scholar] [CrossRef]
  24. Ozbakkaloglu, T.; Vincent, T. Axial compressive behavior of circular high-strength concrete-filled FRP tubes. J. Compos. Constr. 2014, 18, 04013037. [Google Scholar] [CrossRef]
  25. Hany, N.F.; Hantouche, E.G.; Harajli, M.H. Axial Stress-Strain Model of CFRP-Confined Concrete under Monotonic and Cyclic Loading. J. Compos. Constr. 2015, 19, 04015004. [Google Scholar] [CrossRef]
  26. Rochette, P.; Labossiere, P. Axial testing of rectangular column models confined with composites. J. Compos. Constr. 2000, 4, 129–136. [Google Scholar] [CrossRef]
  27. Smith, S.T.; Kim, S.J.; Zhang, H. Behavior and effectiveness of FRP wrap in the confinement of large concrete cylinders. J. Compos. Constr. 2010, 14, 573–582. [Google Scholar] [CrossRef]
  28. Dai, J.-G.; Bai, Y.-L.; Teng, J.G. Behavior and Modeling of Concrete Confined with FRP Composites of Large Deformability. J. Compos. Constr. 2011, 15, 963–973. [Google Scholar] [CrossRef]
  29. Kharel, G. Behavior and Modeling of Variably Confined Concrete; University of South Carolina: Columbia, SC, USA, 2001. [Google Scholar]
  30. Hong, W.K.; Kim, H.C. Behavior of concrete columns confined by carbon composite tubes. Can. J. Civ. Eng. 2004, 31, 178–188. [Google Scholar] [CrossRef]
  31. Wong, Y.L.; Yu, T.; Teng, J.G.; Dong, S.L. Behavior of FRP-confined concrete in annular section columns. Compos. Part B Eng. 2008, 39, 451–466. [Google Scholar] [CrossRef]
  32. Ozbakkaloglu, T.; Akin, E. Behavior of FRP-Confined Normal- and High-Strength Concrete under Cyclic Axial Compression. J. Compos. Constr. 2012, 16, 451–463. [Google Scholar] [CrossRef]
  33. Abdelrahman, K.; El-Hacha, R. Behavior of Large-Scale Concrete Columns Wrapped with CFRP and SFRP Sheets. J. Compos. Constr. 2012, 16, 430–439. [Google Scholar] [CrossRef]
  34. Almusallam, T.H. Behavior of normal and high-strength concrete cylinders confined with E-glass/epoxy composite laminates. Compos. Part B Eng. 2007, 38, 629–639. [Google Scholar] [CrossRef]
  35. Xie, T.; Ozbakkaloglu, T. Behavior of steel fiber-reinforced high-strength concrete-filled FRP tube columns under axial compression. Eng. Struct. 2015, 90, 158–171. [Google Scholar] [CrossRef]
  36. Zohrevand, P.; Mirmiran, A. Behavior of Ultrahigh-Performance Concrete Confined by Fiber-Reinforced Polymers. J. Mater. Civ. Eng. 2011, 23, 1727–1734. [Google Scholar] [CrossRef]
  37. Valdmanis, V.; De Lorenzis, L.; Rousakis, T.; Tepfers, R. Behaviour and capacity of CFRP-confined concrete cylinders subjected to monotonic and cyclic axial compressive load. Struct. Concr. 2007, 8, 187–200. [Google Scholar] [CrossRef]
  38. Campione, G.; Miraglia, N.; Scibilia, N. Comprehensive Behaviour of R.C. Members Strengthened With Carbon Fiber Reinforced Plastic Layers. WIT Trans. Built Environ. 2001, 57, 1–10. [Google Scholar]
  39. Piekarczyk, J.; Piekarczyk, W.; Blazewicz, S. Compression strength of concrete cylinders reinforced with carbon fiber laminate. Constr. Build. Mater. 2011, 25, 2365–2369. [Google Scholar] [CrossRef]
  40. Li, Y.; Yan, X.; Ou, J. Compressive Behavior and Non Linear Analysis of Self-Sensing Concrete-Filled FRP Tubes and FRP Steel Composite Tubes. In Proceedings of the Eighth International Symposium of Non-Metallic Fiber Reinforced Polymer (FRP) Reinforcement for Concrete Structures (FRPRCS-8), Patras, Greece, 16–18 July 2007; pp. 16–18. [Google Scholar]
  41. Xiao, Y.; Wu, H. Compressive behavior of concrete confined by carbon fiber composite jackets. J. Mater. Civ. Eng. 2000, 12, 139–146. [Google Scholar] [CrossRef]
  42. Berthet, J.F.; Ferrier, E.; Hamelin, P. Compressive behavior of concrete externally confined by composite jackets. Part A Exp. study. Constr. Build. Mater. 2005, 19, 223–232. [Google Scholar] [CrossRef]
  43. Al-Salloum, Y.; Box, P.O. Compressive Strength Models of Frp-Confined Concrete. In Proceedings of the 1st Asia-Pacific Conference on FRP in Structures, Hong Kong, China, 12–14 December 2007. [Google Scholar]
  44. Santarosa, D.; Campos, A.; Beber, A.J.; Campagnolo, J.L. Concrete columns confined with CFRP sheets. In Proceedings of the International Conference on FRP Composites in Civil Engineering, Hong Kong, China, 12–15 December 2001; pp. 301–308. [Google Scholar]
  45. Karabinis, A.I.; Rousakis, T. Concrete confined by FRP material: A plasticity approach. Eng. Struct. 2002, 24, 923–932. [Google Scholar] [CrossRef]
  46. Aire, C.; Gettu, R.; Casas, J.R.; Marques, S.; Marques, D. Concrete laterally confined with fibre-reinforced polymers (FRP): Experimental study and theoretical model. Mater. De Constr. 2010, 60, 19–31. [Google Scholar] [CrossRef]
  47. Watanabe, K.; Nakamura, R.; Honda, Y.; Toyoshima, M.; Fujimaki, T. Confinement Effect of FRP Sheet on Strength and Ductility of Concrete Cylinders Under Uniaxial Compression. In Non-Metallic (FRP) Reinforcement for Concrete Structures; CRC Press: London, UK, 1997. [Google Scholar]
  48. Suter, R.; Pinzelli, R. Confinement of Concrete Columns with FRP Sheets. Available online: https://trid.trb.org/View/500198 (accessed on 13 May 2025).
  49. Picher, F.; Rochette, P.; Labossiére, P. Confinement of concrete cylinders with creep. In Proceedings of the First International Conference on Composites in Infrastructure, Tucson, AZ, USA, 15–17 November 1996. [Google Scholar]
  50. Karam, G.; Tabbara, M. Corner effects in CFRP-wrapped square columns. Mag. Concr. Res. 2004, 56, 461–464. [Google Scholar] [CrossRef]
  51. Mirmiran, A.; Shahawy, M.; Samaan, M.; Echary, H.E.; Mastrapa, J.C.; Pico, O. Effect of column parameters on FRP-confined concrete. J. Compos. Constr. 1998, 2, 175–185. [Google Scholar] [CrossRef]
  52. Wang, L.-M.; Wu, Y.-F. Effect of corner radius on the performance of CFRP-confined square concrete columns: Test. Eng. Struct. 2008, 30, 493–505. [Google Scholar] [CrossRef]
  53. Au, C.; Buyukozturk, O. Effect of fiber orientation and ply mix on fiber reinforced polymer-confined concrete. J. Compos. Constr. 2005, 9, 397–407. [Google Scholar] [CrossRef]
  54. Wu, Y.-F.; Jiang, C. Effect of load eccentricity on the stress–strain relationship of FRP-confined concrete columns. Compos. Struct. 2013, 98, 228–241. [Google Scholar] [CrossRef]
  55. Howie, I.; Karbhari, V.M. Composites, Effect of tow sheet composite wrap architecture on strengthening of concrete due to confinement: I—Experimental studies. J. Reinf. Plast. Compos. 1995, 14, 1008–1030. [Google Scholar] [CrossRef]
  56. Wu, Y.-F.; Jiang, J.-F. Effective strain of FRP for confined circular concrete columns. Compos. Struct. 2013, 95, 479–491. [Google Scholar] [CrossRef]
  57. Carey, S.A. The Effects of Shape, Gap, and Scale on the Behavior and Modeling of Variably Confined Concrete; University of South Carolina: Columbia, SC, USA, 2003. [Google Scholar]
  58. Kono, S.; Inazumi, M.; Kaku, T. Evaluation of confining effects of CFRP sheets on reinforced concrete members. In Proceedings of the Second International Conference on Composites in Infrastructurenational Science Foundation, Tucson, AZ, USA, 5–7 November 1998. [Google Scholar]
  59. Liang, M.; Wu, Z.-M.; Ueda, T.; Zheng, J.-J.; Akogbe, R. Experiment and modeling on axial behavior of carbon fiber reinforced polymer confined concrete cylinders with different sizes. J. Reinf. Plast. Compos. 2012, 31, 389–403. [Google Scholar] [CrossRef]
  60. Micelli, F.; Modarelli, R. Experimental and analytical study on properties affecting the behaviour of FRP-confined concrete. Compos. Part B Eng. 2013, 45, 1420–1431. [Google Scholar] [CrossRef]
  61. Elsanadedy, H.M.; Al-Salloum, Y.A.; Alsayed, S.H.; Iqbal, R.A. Experimental and numerical investigation of size effects in FRP-wrapped concrete columns. Constr. Build. Mater. 2012, 29, 56–72. [Google Scholar] [CrossRef]
  62. Karantzikis, M.; Papanicolaou, C.G.; Antonopoulos, C.R.; Triantafillou, T.C. Experimental investigation of nonconventional confinement for concrete using FRP. J. Compos. Constr. 2005, 9, 480–487. [Google Scholar] [CrossRef]
  63. Park, J.-H.; Jo, B.-W.; Yoon, S.-J.; Park, S.-K. Experimental investigation on the structural behavior of concrete filled FRP tubes with/without steel Re-bar. KSCE J. Civ. Eng. 2011, 15, 337–345. [Google Scholar] [CrossRef]
  64. Abdollahi, B.; Bakhshi, M.; Motavalli, M.; Shekarchi, M. Experimental modeling of GFRP confined concrete cylinders subjected to axial loads. In Proceedings of the 8th International Symposium on Fiber Reinforced Polymer Reinforcement for Concrete Structures, Patras, Greece, 16–18 July 2007. [Google Scholar]
  65. Cui, C.; Sheikh, S. Experimental study of normal-and high-strength concrete confined with fiber-reinforced polymers. J. Compos. Constr. 2010, 14, 553–561. [Google Scholar] [CrossRef]
  66. Wang, Z.; Wang, D.; Smith, S.T.; Lu, D. Experimental testing and analytical modeling of CFRP-confined large circular RC columns subjected to cyclic axial compression. Eng. Struct. 2012, 40, 64–74. [Google Scholar] [CrossRef]
  67. Thériault, M.; Neale, K.W.; Claude, S. Fiber-reinforced polymer-confined circular concrete columns: Investigation of size and slenderness effects. J. Compos. Constr. 2004, 8, 323–331. [Google Scholar] [CrossRef]
  68. Benzaid, R.; Mesbah, H.; Chikh, N.E. FRP-confined Concrete Cylinders: Axial Compression Experiments and Strength Model. J. Reinf. Plast. Compos. 2010, 29, 2469–2488. [Google Scholar] [CrossRef]
  69. Ozbakkaloglu, T.; Lim, J.C.; Vincent, T. FRP-confined concrete in circular sections: Review and assessment of stress–strain models. Eng. Struct. 2013, 49, 1068–1088. [Google Scholar] [CrossRef]
  70. Ribeiro, F.; Sena-Cruz, J.; Branco, F.G.; Júlio, E. Hybrid FRP jacketing for enhanced confinement of circular concrete columns in compression. Constr. Build. Mater. 2018, 184, 681–704. [Google Scholar] [CrossRef]
  71. Teng, J.G.; Yu, T.; Wong, Y.L.; Dong, S.L. Hybrid FRP–concrete–steel tubular columns: Concept and behavior. Constr. Build. Mater. 2007, 21, 846–854. [Google Scholar] [CrossRef]
  72. Vincent, T.; Ozbakkaloglu, T. Influence of concrete strength and confinement method on axial compressive behavior of FRP confined high- and ultra high-strength concrete. Compos. Part B Eng. 2013, 50, 413–428. [Google Scholar] [CrossRef]
  73. Stanton, J.F.; Owen, L.D. The Influence of Concrete Strength and Confinement Type on the Response of FRP-Confined Concrete Cylinders; ACI Special Publication: Farmington Hills, MI, USA, 2006; Volume 238, pp. 347–362. [Google Scholar]
  74. Mandal, S.; Hoskin, A.; Fam, A. Influence of concrete strength on confinement effectiveness of fiber-reinforced polymer circular jackets. Aci Struct. J. 2005, 102, 383–392. [Google Scholar]
  75. De Lorenzis, L.; Micelli, F.; La Tegola, A. Influence of specimen size and resin type on the behaviour of FRP-confined concrete cylinders. In Proceedings of the First International Conference on Advanced Polymer Composites for Structural Applications in Construction, Southampton University, Southampton, UK, 15–17 April 2002; Thomas Telford: London, UK; pp. 231–240. [Google Scholar]
  76. Purba, B.K.; Mufti, A.A. Investigation of the behavior of circular concrete columns reinforced with carbon fiber reinforced polymer (CFRP) jackets. Can. J. Civ. Eng. 1999, 26, 590–596. [Google Scholar] [CrossRef]
  77. Ilki, A.; Kumbasar, N.; Koc, V. Low strength concrete members externally confined with FRP sheets. Struct. Eng. Mech. 2004, 18, 167–194. [Google Scholar] [CrossRef]
  78. Song, X.; Gu, X.; Li, Y.; Chen, T.; Zhang, W. Mechanical Behavior of FRP-Strengthened Concrete Columns Subjected to Concentric and Eccentric Compression Loading. J. Compos. Constr. 2013, 17, 336–346. [Google Scholar] [CrossRef]
  79. Bisby, L.; Take, W.; Caspary, A. Quantifying strain variation in FRP confined concrete using digital image correlation: Proof-of-concept and initial results. In Proceedings of the 1st Asia-Pacific Conf. on FRP in Structures, Hong Kong, China, 12–14 December 2007; pp. 599–604. [Google Scholar]
  80. Wang, P.; Cheong, K.K. RC columns strengthened by FRP under uniaxial compression. In Proceedings of the International Conference on FRP Composites in Civil Engineering, Hong Kong, China, 12–15 December 2001; pp. 327–334. [Google Scholar]
  81. Saenz, N.; Pantelides, C.P. Short and medium term durability evaluation of FRP-confined circular concrete. J. Compos. Constr. 2006, 10, 244–253. [Google Scholar] [CrossRef]
  82. Silva, M.A.; Rodrigues, C.C. Size and relative stiffness effects on compressive failure of concrete columns wrapped with glass FRP. J. Mater. Civ. Eng. 2006, 18, 334–342. [Google Scholar] [CrossRef]
  83. Akogbe, R.-K.; Wu, Z.-M.; Liang, M. Size Effect of Axial Compressive Strength of CFRP Confined Concrete Cylinders. Int. J. Concr. Struct. Mater. 2011, 5, 49–55. [Google Scholar] [CrossRef]
  84. Wang, Y.-F.; Wu, H.-L. Size Effect of Concrete Short Columns Confined with Aramid FRP Jackets. J. Compos. Constr. 2011, 15, 535–544. [Google Scholar] [CrossRef]
  85. Ilki, A.; Kumbasar, N.; Koc, V. Strength and deformability of low strength concrete confined by carbon fiber composite sheets. In Proceedings of the ASCE 15th Engineering Mechanics Conference, New York, NY, USA, 2–5 June 2002. [Google Scholar]
  86. Shehata, I.A.; Carneiro, L.A.; Shehata, L.C. Strength of short concrete columns confined with CFRP sheets. Mater. Struct. 2002, 35, 50–58. [Google Scholar] [CrossRef]
  87. da Silva, V.D.; Santos, J.M.C. Strengthening of axially loaded concrete cylinders by surface composites. In Proceedings of the International Conference Composites in Construction (CCC2001), Oporto, Portugal, 10–12 October 2001; pp. 257–262. [Google Scholar]
  88. Demers, M.; Neale, K.W. Strengthening of concrete columns with unidirectional composite sheets. In Proceedings of the 4th International Conference on Short and Medium Span Bridges, Halifax, NS, Canada, 8–11 August 1994; pp. 895–905. [Google Scholar]
  89. Owen, L.M. Stress-Strain Behavior of Concrete Confined by Carbon Fiber Jacketing; University of Washington: Seattle, WA, USA, 1998. [Google Scholar]
  90. Wu, G.; Wu, Z.S.; Lu, Z.T.; Ando, Y.B. Structural performance of concrete confined with hybrid FRP composites. J. Reinf. Plast. Compos. 2008, 27, 1323–1348. [Google Scholar] [CrossRef]
  91. Shahawy, M.; Mirmiran, A.; Beitelman, T. Tests and modeling of carbon-wrapped concrete columns. Compos. Part B Eng. 2000, 31, 471–480. [Google Scholar] [CrossRef]
  92. Teng, J.G.; Jiang, T.; Lam, L.; Luo, Y.Z. Refinement of a Design-Oriented Stress-Strain Model for FRP-Confined Concrete. J. Compos. Constr. 2009, 13, 269–278. [Google Scholar] [CrossRef]
  93. Keshtegar, B.; Ozbakkaloglu, T.; Gholampour, A. Modeling the behavior of FRP-confined concrete using dynamic harmony search algorithm. Eng. Comput. 2017, 33, 415–430. [Google Scholar] [CrossRef]
  94. Gardoni, P.; Der Kiureghian, A.; Mosalam, K.M. Probabilistic capacity models and fragility estimates for reinforced concrete columns based on experimental observations. J. Eng. Mech. 2002, 128, 1024–1038. [Google Scholar] [CrossRef]
  95. Song, X. Probabilistic calibration for rotation capacity models of shear tab connection under column loss scenarios. Eng. Struct. 2021, 229, 111592. [Google Scholar] [CrossRef]
  96. Liu, X.; Wu, T.; An, Y.Y.; Liu, Y. Probabilistic models of the strut efficiency factor for RC deep beams with MCMC method. Struct. Concr. 2020, 21, 917–933. [Google Scholar] [CrossRef]
  97. Lye, A.; Cicirello, A.; Patelli, E. Sampling methods for solving Bayesian model updating problems: A tutorial. Mech. Syst. Signal Process. 2021, 159, 107760. [Google Scholar] [CrossRef]
  98. Wan, H.P.; Ren, W.X. Stochastic model updating utilizing Bayesian approach and Gaussian process model. Mech. Syst. Signal Process. 2016, 70–71, 245–268. [Google Scholar] [CrossRef]
  99. Kruschke, J.K. Bayesian data analysis, Wiley interdisciplinary reviews. Cogn. Sci. 2010, 1, 658–676. [Google Scholar] [CrossRef]
  100. Watanabe, S. Asymptotic Equivalence of Bayes Cross Validation and Widely Applicable Information Criterion in Singular Learning Theory. J. Mach. Learn. Res. 2010, 11, 3571–3594. [Google Scholar]
  101. Spiegelhalter, D.J.; Best, N.G.; Carlin, B.P.; Van Der Linde, A. Bayesian measures of model complexity and fit. J. R. Stat. Soc. Ser. B (Stat. Methodol.) 2002, 64, 583–639. [Google Scholar] [CrossRef]
  102. Akaike, H. Information theory and an extension of the maximum likelihood principle. In Selected Papers of Hirotugu Akaike; Springer: Berlin/Heidelberg, Germany, 1998; pp. 199–213. [Google Scholar]
  103. Zhou, Y.; Zheng, S.; Huang, Z.; Sui, L.; Chen, Y. Explicit neural network model for predicting FRP-concrete interfacial bond strength based on a large database. Compos. Struct. 2020, 240, 111998. [Google Scholar] [CrossRef]
  104. Jahangir, H.; Eidgahee, D.R. A new and robust hybrid artificial bee colony algorithm—ANN model for FRP-concrete bond strength evaluation. Compos. Struct. 2021, 257, 113160. [Google Scholar] [CrossRef]
  105. Chen, S.-Z.; Zhang, S.-Y.; Han, W.-S.; Wu, G. Ensemble learning based approach for FRP-concrete bond strength prediction. Constr. Build. Mater. 2021, 302, 124230. [Google Scholar] [CrossRef]
  106. DiazDelaO, F.A.; Adhikari, S.; Flores, E.I.S.; Friswell, M.I. Stochastic structural dynamic analysis using Bayesian emulators. Comput. Struct. 2013, 120, 24–32. [Google Scholar] [CrossRef]
  107. Toutanji, H. Stress-strain characteristics of concrete columns externally confined with advanced fiber composite sheets. Mater. J. 1999, 96, 397–404. [Google Scholar]
  108. Guralnick, S.A.; Gunawan, L. Construction, Strengthening of reinforced concrete bridge columns with FRP wrap. Pract. Period. Struct. Des. Constr. 2006, 11, 218–228. [Google Scholar] [CrossRef]
  109. Ozbakkaloglu, T.; Lim, J.C. Axial compressive behavior of FRP-confined concrete: Experimental test database and a new design-oriented model. Compos. Part B Eng. 2013, 55, 607–634. [Google Scholar] [CrossRef]
  110. Sadeghian, P.; Fam, A. Improved design-oriented confinement models for FRP-wrapped concrete cylinders based on statistical analyses. Eng. Struct. 2015, 87, 162–182. [Google Scholar] [CrossRef]
  111. Keshtegar, B.; Sadeghian, P.; Gholampour, A.; Ozbakkaloglu, T. Nonlinear modeling of ultimate strength and strain of FRP-confined concrete using chaos control method. Compos. Struct. 2017, 163, 423–431. [Google Scholar] [CrossRef]
  112. Newman, K.; Newman, J. Failure theories and design criteria for plain concrete. In Conference, Structure, Solid Mechanics and Engineering Design, Southampton 1969; Wiley-Interscience: London, UK, 1971. [Google Scholar]
  113. Haario, H.; Laine, M.; Mira, A.; Saksman, E. DRAM: Efficient adaptive MCMC. Stat. Comput. 2006, 16, 339–354. [Google Scholar] [CrossRef]
  114. Kumbhare, S.; Shahmoradi, A. Matdram: A pure-matlab delayed-rejection adaptive metropolis-hastings markov chain monte carlo sampler. arXiv 2020, arXiv:2010.04190. [Google Scholar]
Figure 1. Frequency distribution of design parameter values in the database.
Buildings 15 01720 g001
Figure 2. Frequency distribution of axial compressive strength values and ultimate strain values in the database.
Buildings 15 01720 g002
Figure 3. Confinement mechanism in concrete.
Buildings 15 01720 g003
Figure 4. Frequency distribution of each composite design variable.
Buildings 15 01720 g004
Figure 5. Comparison of predicted compressive strength (MPa) and experimental values (MPa) for different models: (a) Newman Model (1971) [112]; (b) Toutanji Model (1999) [107]; (c) Guralick Model (2006) [108]; (d) Teng Model (2009) [92]; (e) Ozbakkaloglu Model (2013) [109]; (f) Sadeghian Model (2015) [110]; (g) Keshtegar Model I (2017) [93]; and (h) Keshtegar Model II (2017) [111].
Buildings 15 01720 g005
Figure 6. Comparison of predicted values and experimental values of ultimate strain selection: (a) Mander 1998 models [14]; (b) Toutanji 1999 models [107]; (c) Teng 2009 models [92]; (d) Ozbakkaloglu 2013 models [109]; (e) Sadeghian 2015 models [110]; (f) Keshtegar I 2017 models [93]; and (g) Keshtegar II 2017 models [111].
Buildings 15 01720 g006
Figure 7. Contrast graph of DIC and WAIC scores of existing compressive strength models.
Buildings 15 01720 g007
Figure 8. DIC and WAIC score comparison chart of existing ultimate strain models.
Buildings 15 01720 g008
Figure 9. Comparison of compressive strength values predicted by probabilistic Model 5 with test values.
Buildings 15 01720 g009
Figure 10. Percentage ratios of the experimental samples falling within the different level of credible intervals.
Buildings 15 01720 g010
Figure 11. Comparison between the predicted and measured compressive strength of probabilistic models.
Buildings 15 01720 g011
Figure 12. Comparisons between predicted and measured values for axial compressive strength models: (a) model A; (b) model B; (c) model C; (d) model D; (e) model E; (f) model F; (g) model G; and (h) model H.
Buildings 15 01720 g012
Figure 13. Comparison between predicted values and experimental values of ultimate strain probability model.
Buildings 15 01720 g013
Figure 14. The percentage of ultimate strain test samples falling within different confidence intervals.
Buildings 15 01720 g014
Figure 15. Comparison between the predicted and measured ultimate strain of probabilistic models.
Buildings 15 01720 g015
Figure 16. Comparisons between predicted and measured values for ultimate strain models: (a) model A; (b) model B; (c) model C; (d) model D; (e) model E; (f) model F; (g) model G; and (h) model H.
Buildings 15 01720 g016
Table 1. Statistical characteristics of the dataset.
ParameterUnitMinimum ValueMaximum ValueAverage ValueStandard DeviationTypes of Data
D mm47.00406.40158.2856.74Design variables
f c o MPa6.20188.2045.7526.46Design variables
ε c 0 %0.140.700.250.05Design variables
E f GPa10.30663.00170.03115.29Design variables
t f mm0.0615.000.911.23Design variables
ε h , r u p %0.104.981.290.64Design variables
f c c MPa17.80372.2085.5042.55Compressive strength
Table 2. Mathematical expressions of commonly used parameters in existing models.
ParametersDisplayed Formula
Maximum confinement stress f l f l = ρ k ρ ε f c o = 2 E f t f ε h , r u p D
Confinement stiffness ratio ρ k ρ k = 2 E f t f f c o / ε c o D
Ratio of strain ρ ε ρ ε = ε h , r u p ε c o
Lateral stiffness ρ E ρ E = 2 E f f c o / ε c o
Area ratio ρ a ρ a = t f D
Table 3. Statistical information of commonly used composite parameters of models.
ParameterUnitMinimum ValueMaximum ValueAverage ValueStandard Deviation
ρ k 0.0050.6050.0640.063Design variables
ρ ε 0.46426.9466.0963.315Design variables
ρ a 0.00060.0990.00570.0075Design variables
ρ E 1.19091.68919.74516.021Design variables
f c c / f c o 1.005817.4682.0991.268Ratio of strength enhancement
ε c u / ε c o 1.05584.1569.3017.966Ratio of strain enhancement
Table 4. Compressive strength prediction models from different studies.
VintagesSources of the ModelExpressions of the Model
1971Newman [112] f c c f c o = 1 + 3.7 f l f c o 0.86
1999Toutanji [107] f c c f c o = 1 + 3.5 f l f c o 0.85
2006Guralick [108] f c c f c o = 0.616 + f l f c o + 1.57 ( f l f c o + 0.06 ) 0.5
2009Teng [92] f c c f c o = 1 + 3.5 ( ρ k 0.01 ) ρ ε
2013Ozbakkaloglu [109] f c c f c o = 1 + 0.0058 K l f c o + 3.22 ( f l f c o f l o f c o )
2015Sadeghian [110] f c c f c o = 1 + ( 2.77 ρ k 0.77 0.07 ) ρ ε 0.91
2017Keshtegar I [93] f c c f c o = 1 + ( 4.63 + 0.93 ρ E 0.53 ρ ε 1.03 ) ( ρ a 0.82 ρ E 0.45 )
2017Keshtegar II [111] f c c f c o = 1 + ( 3.23 4.8 ρ k 2.5 ) ( f l f c o ) 0.95
Table 5. Detailed evaluation results for the predictive performances of the eight candidate existing models.
ModelRMSEMAPE (%)R2COV (%)
Newman 1971 [112]0.578621.45990.79118.641
Toutanji 1999 [107]0.529819.57380.82518.364
Guralick 2006 [108]0.663514.14310.72618.030
Teng 2009 [92]0.507614.60770.83920.445
Ozbakkaloglu 2013 [109]0.522113.94160.83018.727
Sadeghian 2015 [110]0.465314.14410.86518.794
Keshtegar I 2017 [93]0.448413.32230.87417.213
Keshtegar II 2017 [111]0.553714.38620.80918.522
Table 6. Ultimate strain prediction models taken from different studies.
VintagesSources of the ModelExpressions of the Model
1988Mander [14] ε c c ε c o = 1 + 5 f c c f c o 1
1999Toutanji [107] ε c c ε c o = 1 + 310.75 ε h , r u p + 1.90 f c c f c o 1
2009Teng [92] ε c c ε c o = 1.75 + 6.5 ρ k 0.8 ρ ε 1.45
2013Ozbakkaloglu [109] ε c c ε c o = 2 f c o 20 100 + 0.271 k l f c o 0.9 ε h , r u p ε c o
2015Sadeghian [110] ε c c ε c o = 1.5 + 6.78 ρ k 0.63 ρ ε 1.08
2017Keshtegar I [93] ε c c ε c o = 1.5 + 3.45 + 5.84 ρ E 0.6 ρ ε 0.69 ρ a 0.57 ρ ε 0.36
2017Keshtegar II [111] ε c c ε c o = 1 + 7.31 + 2.06 ρ ε 0.8 f l f c o 0.6
Table 7. Predictive performance evaluation results for ultimate strain candidate models.
ModelRMSEMAPE (%)R2COV (%)
Mander 1998 [14]4.710638.18160.650352.4482
Toutanji 1999 [107]3.671733.12180.787647.0089
Teng 2009 [92]4.746642.22760.645046.7718
Ozbakkaloglu 2013 [109]4.702132.85250.651645.8763
Sadeghian 2015 [110]4.092936.63430.736048.6897
Keshtegar I 2017 [93]4.100936.32970.735048.0683
Keshtegar II 2017 [111]4.098237.19400.735348.2143
Table 8. Eight types of existing compressive strength models for parameter identification.
NumberExpressions of the Model
Model 1 f c c f c o = 1 + θ 1 ρ k ρ ε θ 2
Model 2 f c c f c o = 1 + θ 1 ρ k θ 2 ρ ε θ 3
Model 3 f c c f c o = 1 + ( θ 1 + θ 2 ρ k θ 3 ) ρ ε θ 4
Model 4 f c c f c o = 1 + ( θ 1 + θ 2 ρ k θ 3 ) ( θ 4 + ρ ε θ 5 )
Model 5 f c c f c o = 1 + θ 1 ρ a θ 2 ρ E θ 3 ρ ε θ 4
Model 6 f c c f c o = 1 + ( θ 1 + θ 2 ρ a θ 3 ρ ε θ 4 ) ρ E θ 5
Model 7 f c c f c o = 1 + ( θ 1 + θ 2 ρ ε θ 3 ) ρ a θ 4 ρ E θ 5
Model 8 f c c f c o = 1 + ( θ 1 + θ 2 ρ E θ 3 ρ ε θ 4 ) ( ρ a θ 5 ρ E θ 6 )
Table 9. Mean values for the posterior samples of the probabilistic model parameters.
ModelAverage Value
θ 1 θ 2 θ 3 θ 4 θ 5 θ 6
Model 12.97400.9568
Model 23.34920.96450.9044
Model 30.00163.37660.96870.9018
Model 40.00284.86150.9651−0.50080.7837
Model 51.40040.80211.00640.8367
Model 6−0.00361.31870.76320.79421.0019
Model 7−1.10642.13730.70440.79921.0031
Model 84.96730.83310.84490.90490.78300.2234
Table 10. Standard deviation values for the posterior samples of the probabilistic model parameters.
ModelStandard Deviation
θ 1 θ 2 θ 3 θ 4 θ 5 θ 6
Model 10.03220.0100
Model 20.15800.01050.0227
Model 30.00920.17720.02390.0230
Model 40.01330.74590.02390.15850.0525
Model 50.10960.01390.00990.0202
Model 60.00220.11100.02630.03350.0102
Model 70.46230.35660.05170.01370.0099
Model 81.01800.15300.12620.03900.01480.1355
Table 11. DIC and WAIC scores for existing compressive strength models.
ModelDICWAIC
Model 1501.73501.75
Model 2484.76485.16
Model 3488.03489.05
Model 4504.27505.61
Model 5395.78396.78
Model 6396.35397.56
Model 7399.99405.11
Model 8394.30397.70
Table 12. Eight categories of existing ultimate strain models for parameter identification.
ModelExpressions of the Model
Model 1 ε c c ε c o = 1.5 + θ 1 ρ k ρ ε θ 2
Model 2 ε c c ε c o = 1.5 + θ 1 ρ k θ 2 ρ ε θ 3
Model 3 ε c c ε c o = 1.5 + ( θ 1 + θ 2 ρ k θ 3 ) ρ ε θ 4
Model 4 ε c c ε c o = 1 + ( θ 1 + θ 2 ρ k θ 3 ) ( θ 4 + ρ ε θ 5 )
Model 5 ε c c ε c o = 1.5 + θ 1 ρ a θ 2 ρ E θ 3 ρ ε θ 4
Model 6 ε c c ε c o = 1.5 + ( θ 1 + θ 2 ρ a θ 3 ρ ε θ 4 ) ρ E θ 5
Model 7 ε c c ε c o = 1 + ( θ 1 + θ 2 ρ a θ 3 ) ρ E θ 4 ρ ε θ 5
Model 8 ε c c ε c o = 1 + ( θ 1 + θ 2 ρ E θ 3 ρ ε θ 4 ) ( ρ a θ 5 ρ ε θ 6 )
Table 13. The average value of the posterior samples of the ultimate strain probability model parameters.
ModelAverage
θ 1 θ 2 θ 3 θ 4 θ 5 θ 6
Model 119.91060.8434
Model 29.65350.79141.1562
Model 30.236511.14880.92501.1292
Model 40.290911.58300.91970.14681.1020
Model 53.29530.61130.83921.1363
Model 60.23582.96950.68870.97001.0948
Model 7−0.02232.46890.51420.83091.1224
Model 83.17801.90450.9365−0.06710.57701.1704
Table 14. Standard deviation values of posterior samples of ultimate strain probability model parameters.
ModelAverage
θ 1 θ 2 θ 3 θ 4 θ 5 θ 6
Model 10.27990.0132
Model 20.58190.01250.0285
Model 30.05380.78300.03400.0289
Model 40.05980.96390.03400.14500.0331
Model 50.33630.01610.01160.0258
Model 60.05820.36900.02660.03560.0271
Model 70.01570.51050.05870.01220.0263
Model 81.59970.37290.03030.28070.01930.2476
Table 15. DIC and WAIC scores for existing ultimate strain models.
ModelDICWAIC
Model 1883.98884.07
Model 2728.85729.52
Model 3753.04754.63
Model 4736.98740.28
Model 5701.29703.97
Model 6735.09739.44
Model 7701.62704.06
Model 8707.55726.75
Table 16. Quantitative evaluation results of probabilistic model prediction performance.
ModelRMSEMAPE (%)R2COV (%)
Tr.Te.FullTr.Te.FullTr.Te.FullTr.Te.Full
10.440.420.4413.5813.5613.570.880.880.8818.4518.1918.36
20.440.410.4313.3613.5913.430.880.880.8818.2118.1118.17
30.440.410.4313.3713.6113.440.880.890.8818.2018.1118.16
40.440.410.4313.5413.7913.620.880.890.8818.3418.2918.31
50.390.390.3912.8013.7113.070.910.900.9116.4817.1816.69
60.390.390.3912.7113.5212.960.910.900.9116.4217.1916.65
70.390.390.3912.9613.7513.200.910.900.9116.5317.2916.76
80.380.390.3912.9414.0713.280.910.900.9116.3217.1616.57
Note: “Tr.” denotes the training set, “Te.” denotes the testing set, and “Full” represents the entire dataset.
Table 17. Eight types of compressive strength models for parameter identification.
ModelExpressions of the model
Model A f c c f c o = 1 + 3.18 ρ k 0.94 ρ ε 0.94
Model B f c c f c o = 1 + 3.48 ρ k 0.96 ρ ε 0.91
Model C f c c f c o = 1 + ( 2.39 ρ k 0.78 0.06 ) ρ ε
Model D f c c f c o = 1 + ( 1.58 ρ k 0.78 0.04 ) ( ρ ε 1.15 + 1.14 )
Model E f c c f c o = 1 + 1.86 ρ a 0.82 ρ E 0.92 ρ ε 0.89
Model F f c c f c o = 1 + 1.87 ρ a 0.81 ρ ε 0.87 ρ E 0.91
Model G f c c f c o = 1 + ( 0.85 + 1.40 ρ ε ) ρ a 0.82 ρ E 0.91
Model H f c c f c o = 1 + ( 8.39 ρ a 0.84 + 0.01 ρ ε 1.40 ) ρ E 0.75
Table 18. Detailed evaluation results for the predictive performances of the eight candidate models for compressive strength.
ModelRMSEMAPE (%)R2COV (%)
Model A0.444614.33580.877018.5321
Model B0.439513.95930.879818.3964
Model C0.466514.09960.864619.3157
Model D0.475914.24110.859119.4770
Model E0.417813.62540.891416.9850
Model F0.425613.63590.887316.9079
Model G0.430913.72350.884517.1881
Model H0.976439.09110.406828.0735
Table 19. Quantitative evaluation results of the prediction performance of ultimate strain probability model.
ModelRMSEMAPE (%)R2COV (%)
Tr.Te.FullTr.Te.FullTr.Te.FullTr.Te.Full
14.013.603.8941.7542.9842.110.760.750.7652.4250.2551.75
23.613.333.5335.3336.8035.770.810.790.8047.0947.2247.12
33.563.223.4636.7038.9637.380.810.800.8148.7749.0348.84
43.573.223.4736.0038.1036.630.810.800.8148.6748.6648.66
53.193.063.1535.4836.8935.900.850.820.8446.2944.5745.76
63.162.983.1137.0439.2337.700.850.830.8548.2247.0047.84
73.193.073.1535.4436.7035.820.850.820.8445.9843.8745.33
83.163.053.1337.2939.4837.950.850.820.8546.5346.0946.40
Note: “Tr.” denotes the training set, “Te.” denotes the testing set, and “Full” represents the entire dataset.
Table 20. Eight categories of ultimate strain models for parameter identification.
ModelExpressions of the model
Model A ε c c ε c o = 1.5 + 15.40 ρ k 0.73 ρ ε 0.73
Model B ε c c ε c o = 1 + 6.47 ρ k 0.65 ρ ε 1.15
Model C ε c c ε c o = 1 + ( 7.21 ρ k 0.58 0.07 ) ρ ε 1.03
Model D ε c c ε c o = 1.5 + ( 6.61 ρ k 0.61 0.06 ) ρ ε 1.09
Model E ε c c ε c o = 1 + ( 6.48 ρ k 0.59 0.03 ) ( ρ ε 1.07 + 0.24 )
Model F ε c c ε c o = 1.5 + 5.25 ρ a 0.57 ρ E 0.62 ρ ε 1.06
Model G ε c c ε c o = 1.5 + ( 0.03 + 5.97 ρ a 0.61 ρ E 0.65 ) ρ ε 1.05
Model H ε c c ε c o = 1.5 + ( 0.09 + 3.27 ρ a 0.4 ) ρ E 0.6 ρ ε 1.04
Table 21. Detailed evaluation results for the predictive performances of the eight candidate models for ultimate strain.
ModelRMSEMAPE (%)R2COV (%)
Model A4.644640.12810.660153.5498
Model B3.963333.11360.752547.3828
Model C4.171635.03730.725847.9544
Model D4.104536.03130.734548.3149
Model E4.161735.51690.727148.1133
Model F4.071337.05090.738848.4655
Model G4.001036.94610.747748.4765
Model H3.956839.02850.753347.9821
Disclaimer/Publisher’s Note: The statements, opinions and data contained in all publications are solely those of the individual author(s) and contributor(s) and not of MDPI and/or the editor(s). MDPI and/or the editor(s) disclaim responsibility for any injury to people or property resulting from any ideas, methods, instructions or products referred to in the content.

