Article

Bond Behavior Between Steel Bar and Reactive Powder Concrete Under Repeated Loading

1
State Grid Heilongjiang Electric Power Co., Ltd. Electric Power Research Institute, Harbin 150000, China
2
School of Civil Engineering and Architecture, Northeast Electric Power University, Jilin 132012, China
*
Author to whom correspondence should be addressed.
Buildings 2025, 15(8), 1305; https://doi.org/10.3390/buildings15081305
Submission received: 28 March 2025 / Revised: 10 April 2025 / Accepted: 15 April 2025 / Published: 16 April 2025
(This article belongs to the Special Issue Sustainable and Low-Carbon Building Materials and Structures)

Abstract

To investigate the influence of repeated loading on the bond behavior between steel bars and reactive powder concrete (RPC), this study conducted repeated loading tests on eight beam specimens and one static loading test as a control. The effects of stress levels and the number of repeated loading cycles on the bond behavior between steel bars and RPC were examined. The results indicate that the static failure mode was characterized by steel bar pull-out accompanied by significant plastic deformation, with no propagation of cracks in the RPC after their initiation, demonstrating the excellent crack control capability of RPC. After 10,000 cycles of repeated loading at a high stress level (Z = 0.9), the ultimate bond strength decreased by only 3.68%, indicating the superior fatigue resistance of the steel–RPC interface. Based on the analysis of slip accumulation effects, a constitutive model considering stress levels and the number of repeated loading cycles was established. This model can serve as a basis for the design of steel anchorage in RPC structures subjected to cyclic loading.

1. Introduction

Reactive Powder Concrete (RPC), as a new generation of ultra-high-performance cementitious material, achieves compressive strengths of 150–200 MPa and exceptional durability through optimized particle gradation (maximum particle size < 2 mm), the incorporation of steel fibers (1–3% by volume), and high-temperature curing (60–90 °C) [1]. Its dense microstructure not only endows RPC with superior frost resistance [2] and chloride ion penetration resistance but also makes it particularly advantageous in harsh environments such as marine zones and cold regions [3]. Currently, RPC has been successfully applied in power engineering [4], bridge construction, marine structures, and high-rise buildings [5]. Its lightweight nature and high durability significantly reduce the life-cycle cost of structures [6], positioning RPC as a key material for advancing low-carbon development in civil engineering [7]. In practical engineering applications, steel–RPC systems are subjected to coupled environmental effects. For instance, studies in Ref. [8] demonstrate that chloride ion erosion in marine environments accelerates bond degradation in conventional concrete, whereas RPC’s dense matrix delays this process. Furthermore, pull-out tests in Ref. [9] confirm that RPC retains over 90% of its bond strength after freeze–thaw cycles, significantly outperforming traditional concrete.
In reinforced concrete structures, the bond behavior between steel bars and concrete is a key mechanism ensuring their collaborative work and structural ductility [10,11]. Research on the bond behavior of traditional concrete (NC) has established classical theories covering concrete properties, concrete cover thickness [8], steel bar properties, and shape [12]. Due to the significantly lower water-to-binder ratio of RPC (0.16–0.2) compared to NC, and the bridging effect of steel fibers in the RPC matrix [13], the bond behavior between steel bars and RPC is fundamentally different from that of NC [14].
Existing research primarily investigates the bond characteristics between steel bars and RPC through static pull-out tests. It is widely recognized that bond length has the greatest impact on bond performance, followed by concrete strength, cover thickness, and steel bar diameter [15]. Piccinini et al. [16] conducted concentric pull-out tests on steel bars and RPC, showing that bond strength increases up to 28 days, following a similar trend to compressive strength. Qi et al. [17] conducted 96 pull-out tests, revealing that insufficient concrete cover thickness leads to splitting failure, while short bond lengths result in concrete cone failure. Wang et al. [18] found that due to the non-uniform distribution of bond stress over a large range, bond strength is inversely proportional to the ratio of bond length to steel bar diameter (l/d). Regarding the influence of steel fibers on bond strength, Bae et al. [19] demonstrated that RPC with 1% steel fiber volume fraction has twice the ultimate bond strength of plain RPC, but further increases in steel fiber content do not significantly enhance bond strength. Wang et al. [18] found that RPC with 2% and 2.5% steel fiber volume fractions exhibited similar bond performance, consistent with Bae’s findings. Alkaysi et al. [20] suggested that the variation in bond strength due to steel fiber content depends on the number of fibers bridging cracks rather than the compressive strength differences caused by fiber volume.
However, in practical engineering, the steel–concrete interface is often subjected to repeated loads such as traffic loads, wind vibrations, and earthquakes [21]. These loads can lead to bond stiffness degradation and increased slip [22], threatening the overall safety of structures [23]. Lemcherreq et al. [24] found that under repeated loading, the distribution of bond stress in NC along the bond length changes. Zhang et al. [25] designed 29 eccentric pull-out specimens of steel bars in ordinary concrete, conducting monotonic, repeated, and post-fatigue monotonic loading tests. The results showed that fatigue loading history increases bond stiffness and peak slip, and a bond stress-slip model considering fatigue loading history was proposed. Wu et al. [26] found that after repeated loading, the stiffness of the descending branch of the monotonic bond stress-slip curve of fiber-reinforced concrete generally decreases. Shang et al. [27] demonstrated that higher stress levels in repeated loading reduce the bond strength of steel bars in ordinary concrete. Shao et al. [28] used the beam-end test method recommended by ACI Committee 408 to study the effect of repeated loading on the bond behavior of steel bars in ultra-high-performance concrete (UHPC). The study showed that repeated loading accelerates the degradation of bond strength after bond softening. Gong et al. [29] conducted concentric pull-out tests to investigate the effects of loading patterns and concrete cover thickness on the bond behavior of steel bars in RPC. The results indicated that repeated loading significantly reduces the bond strength of steel bars, but increasing bond length or concrete cover thickness can mitigate this effect. These studies demonstrate that the bond behavior between steel bars and concrete is significantly influenced by load type (whether subjected to repeated loading), stress level, and the number of repeated loading cycles [30]. The service load conditions of steel–RPC structures are more complex than those of NC structures. However, there is limited research on the mechanisms by which stress levels and loading cycles affect the bond strength and slip development of steel–RPC interfaces. Moreover, the lack of constitutive models considering the coupling effects of stress levels and loading cycles hinders the refined design of RPC structures in repeated loading environments.
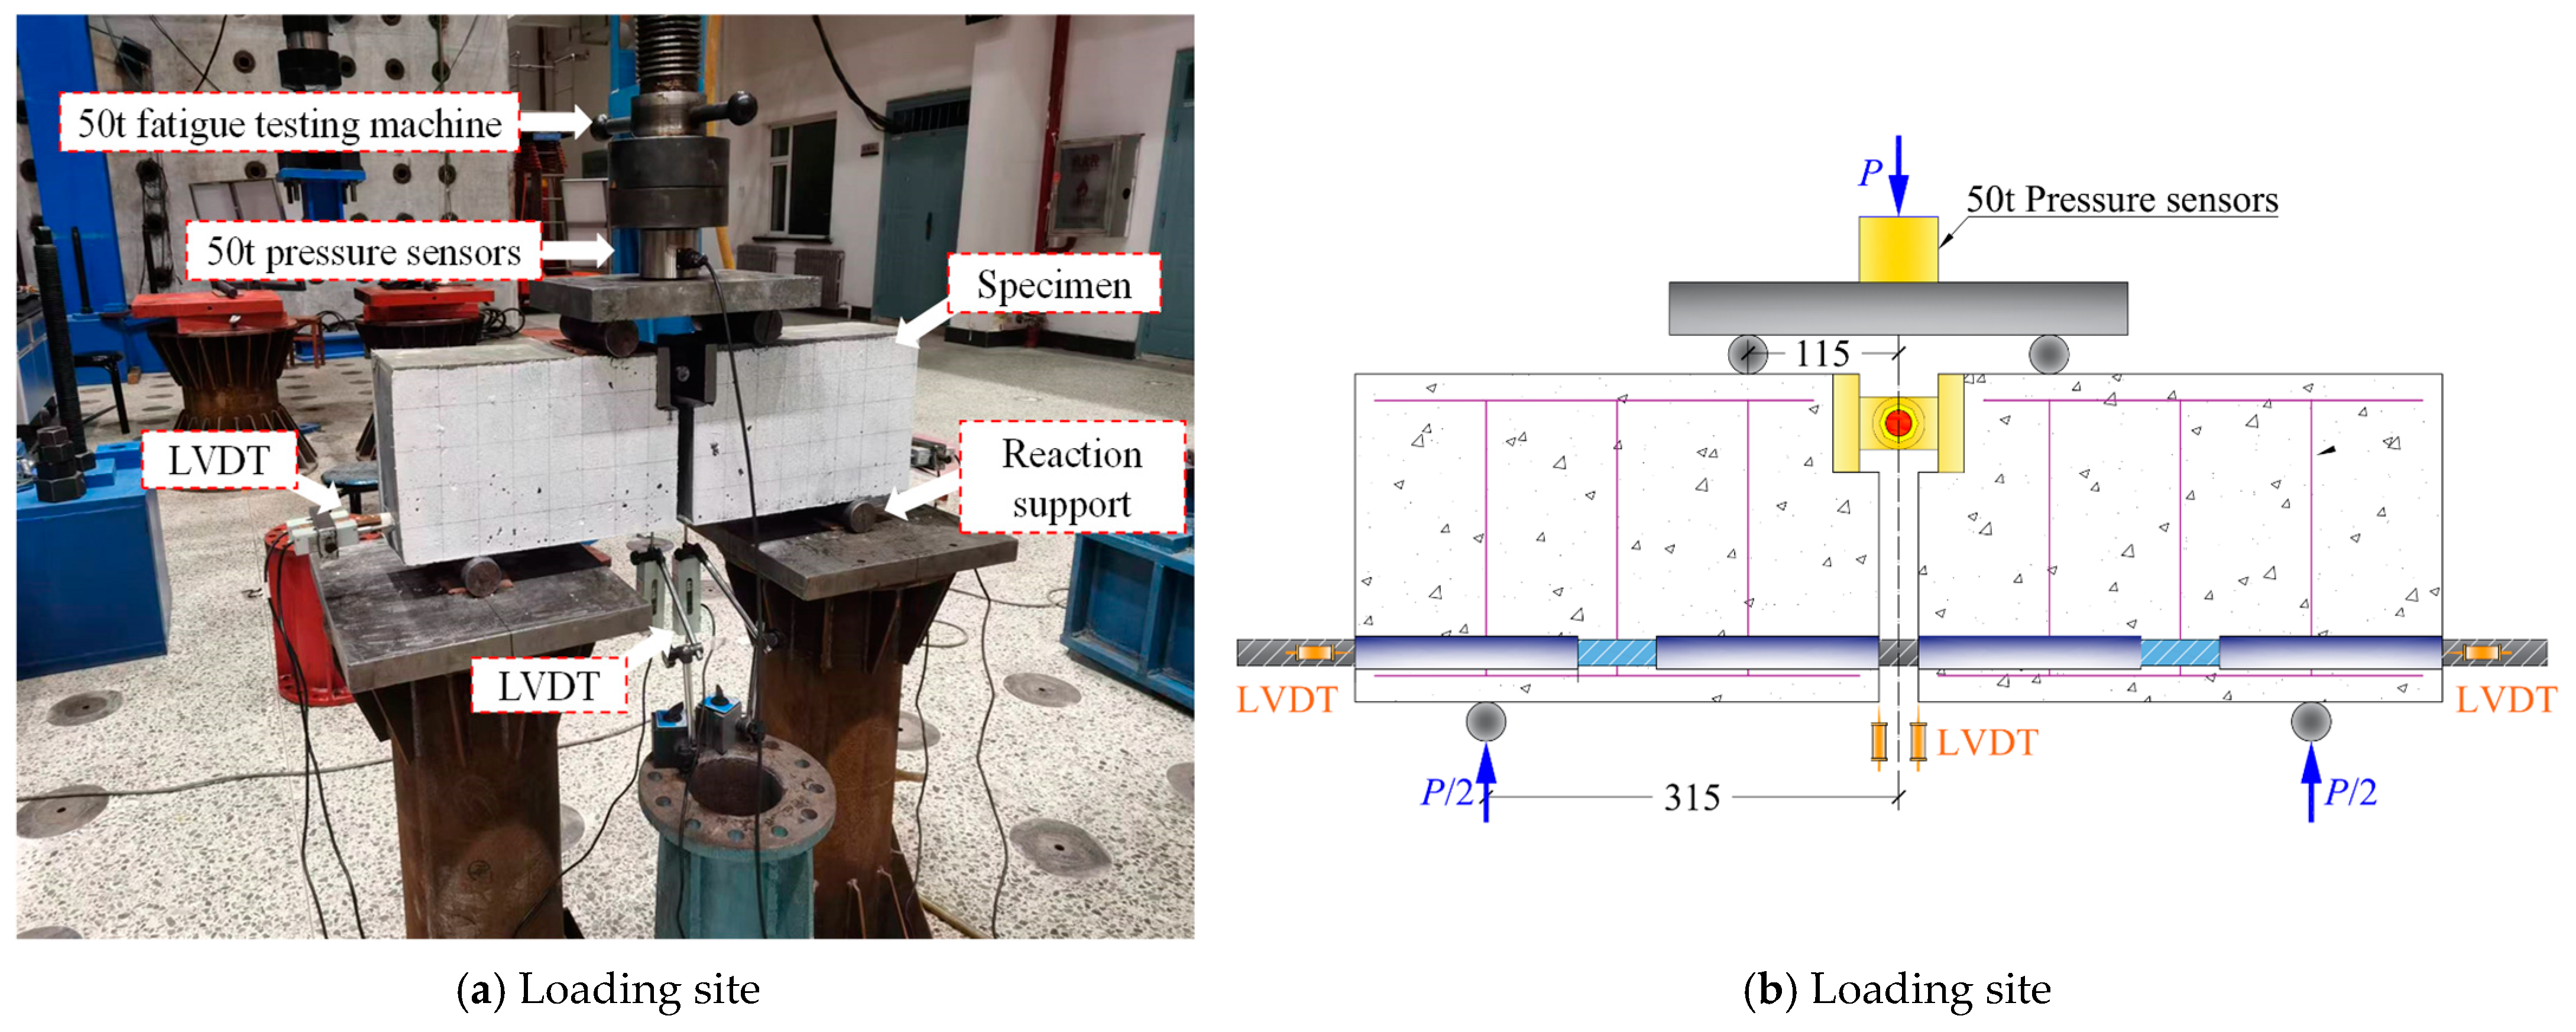
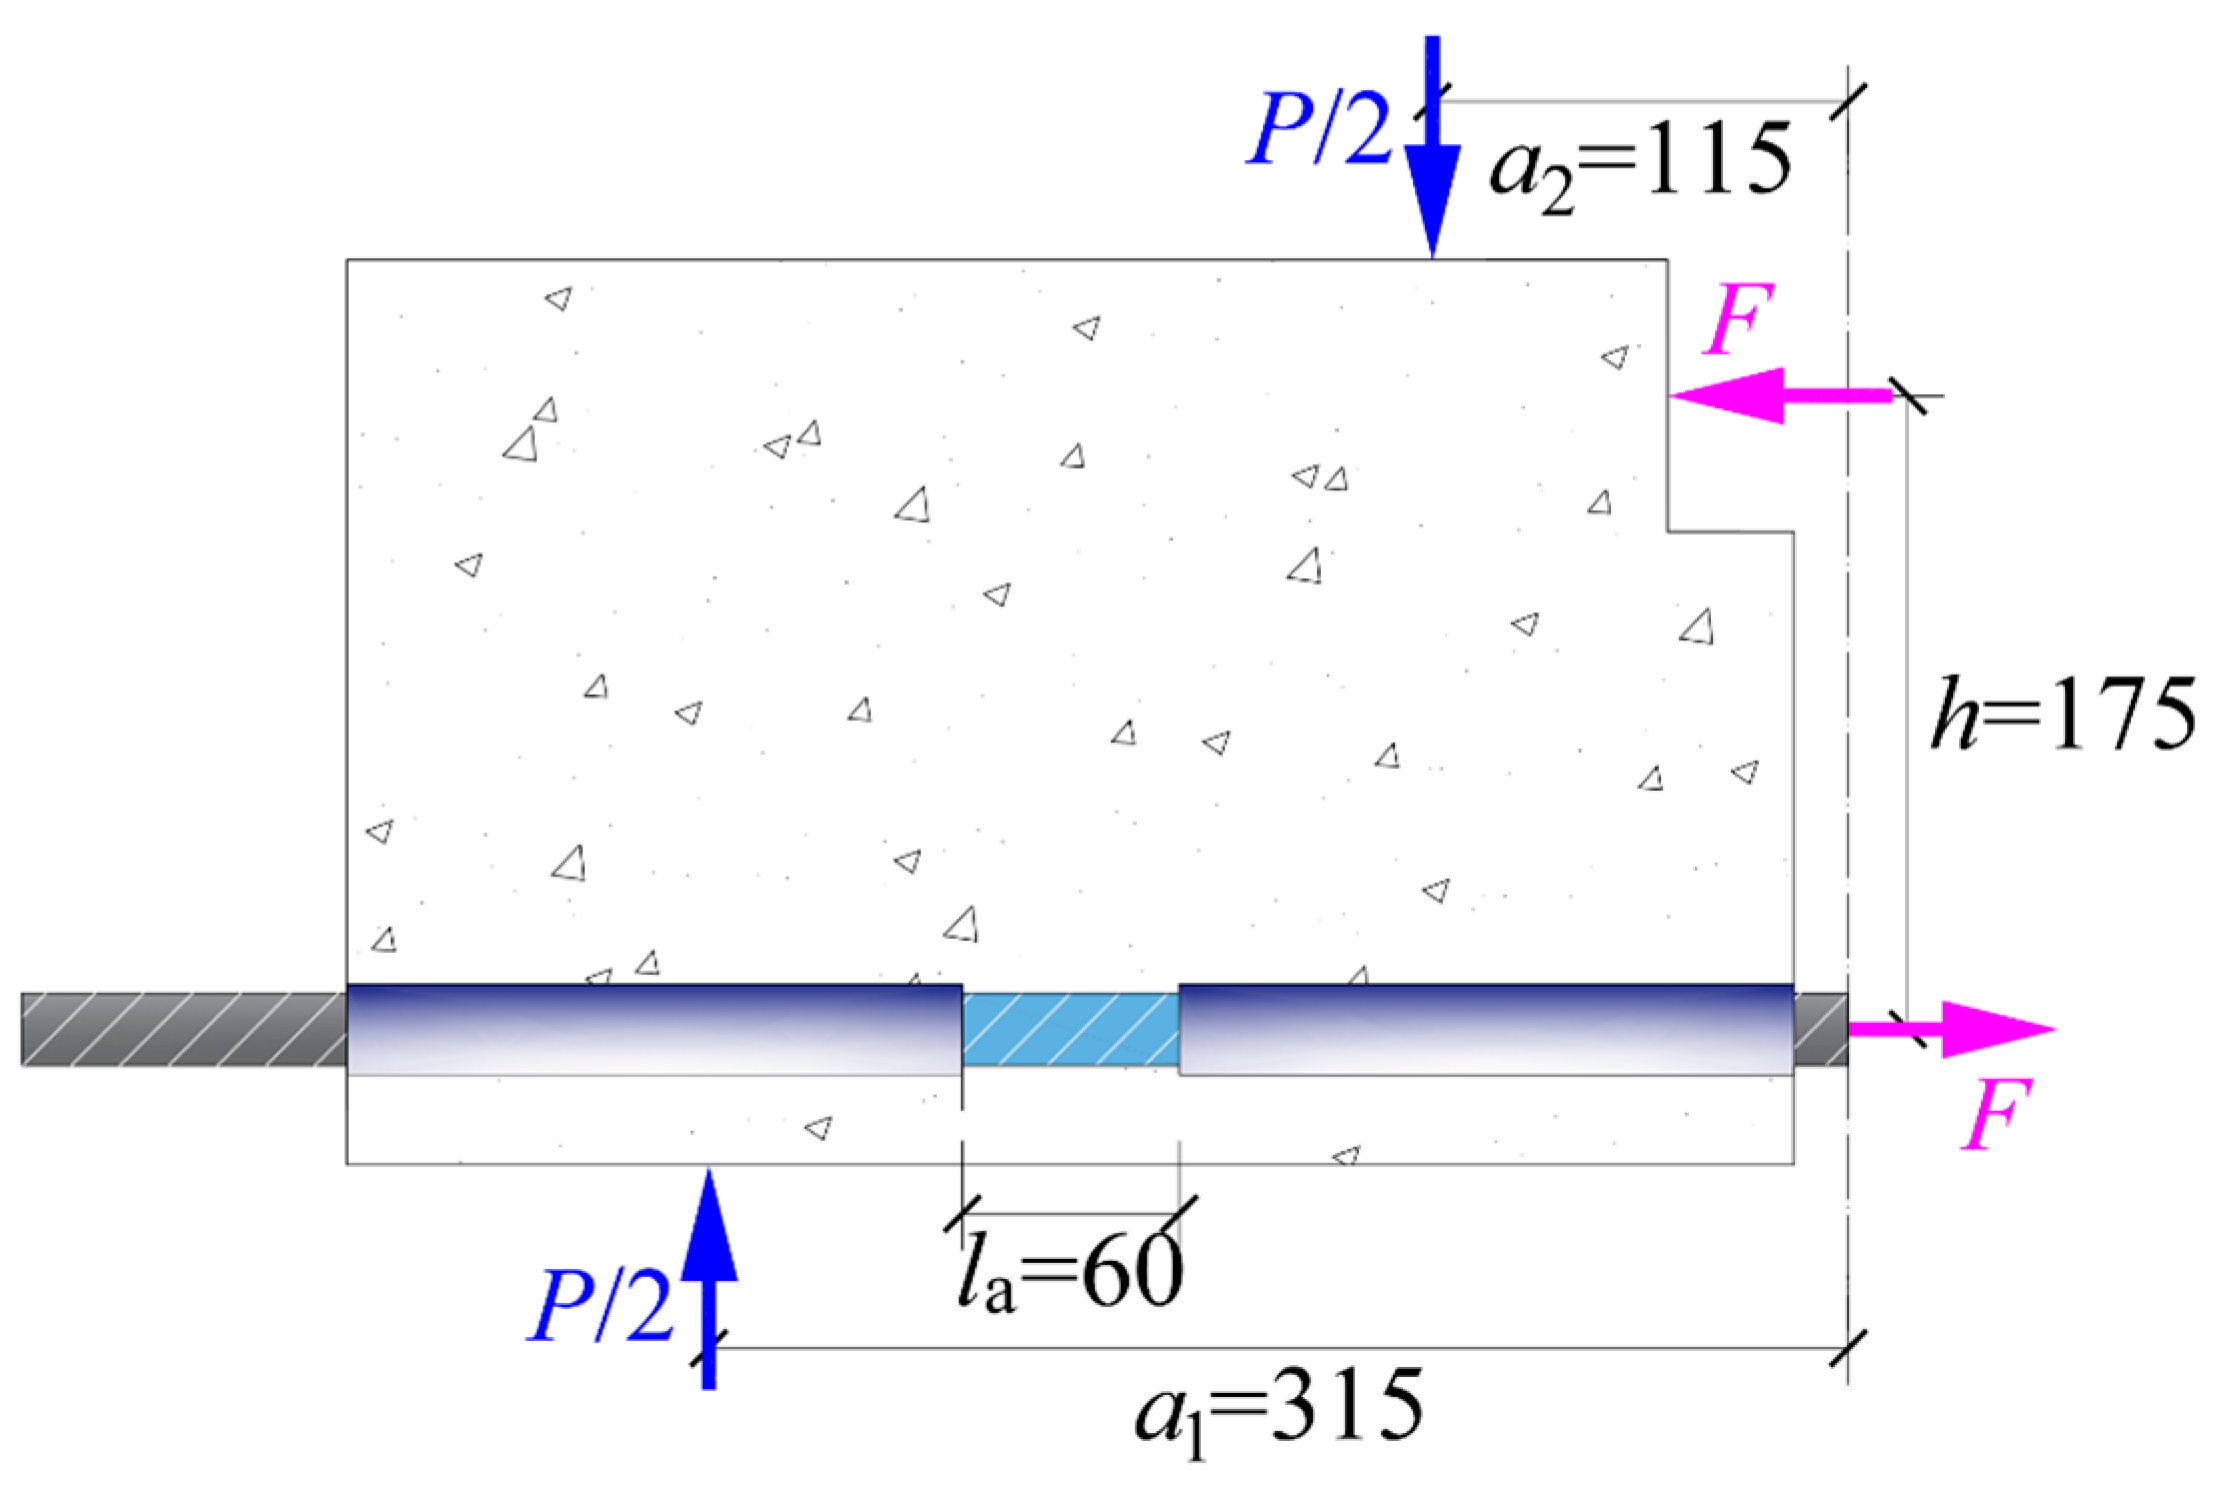
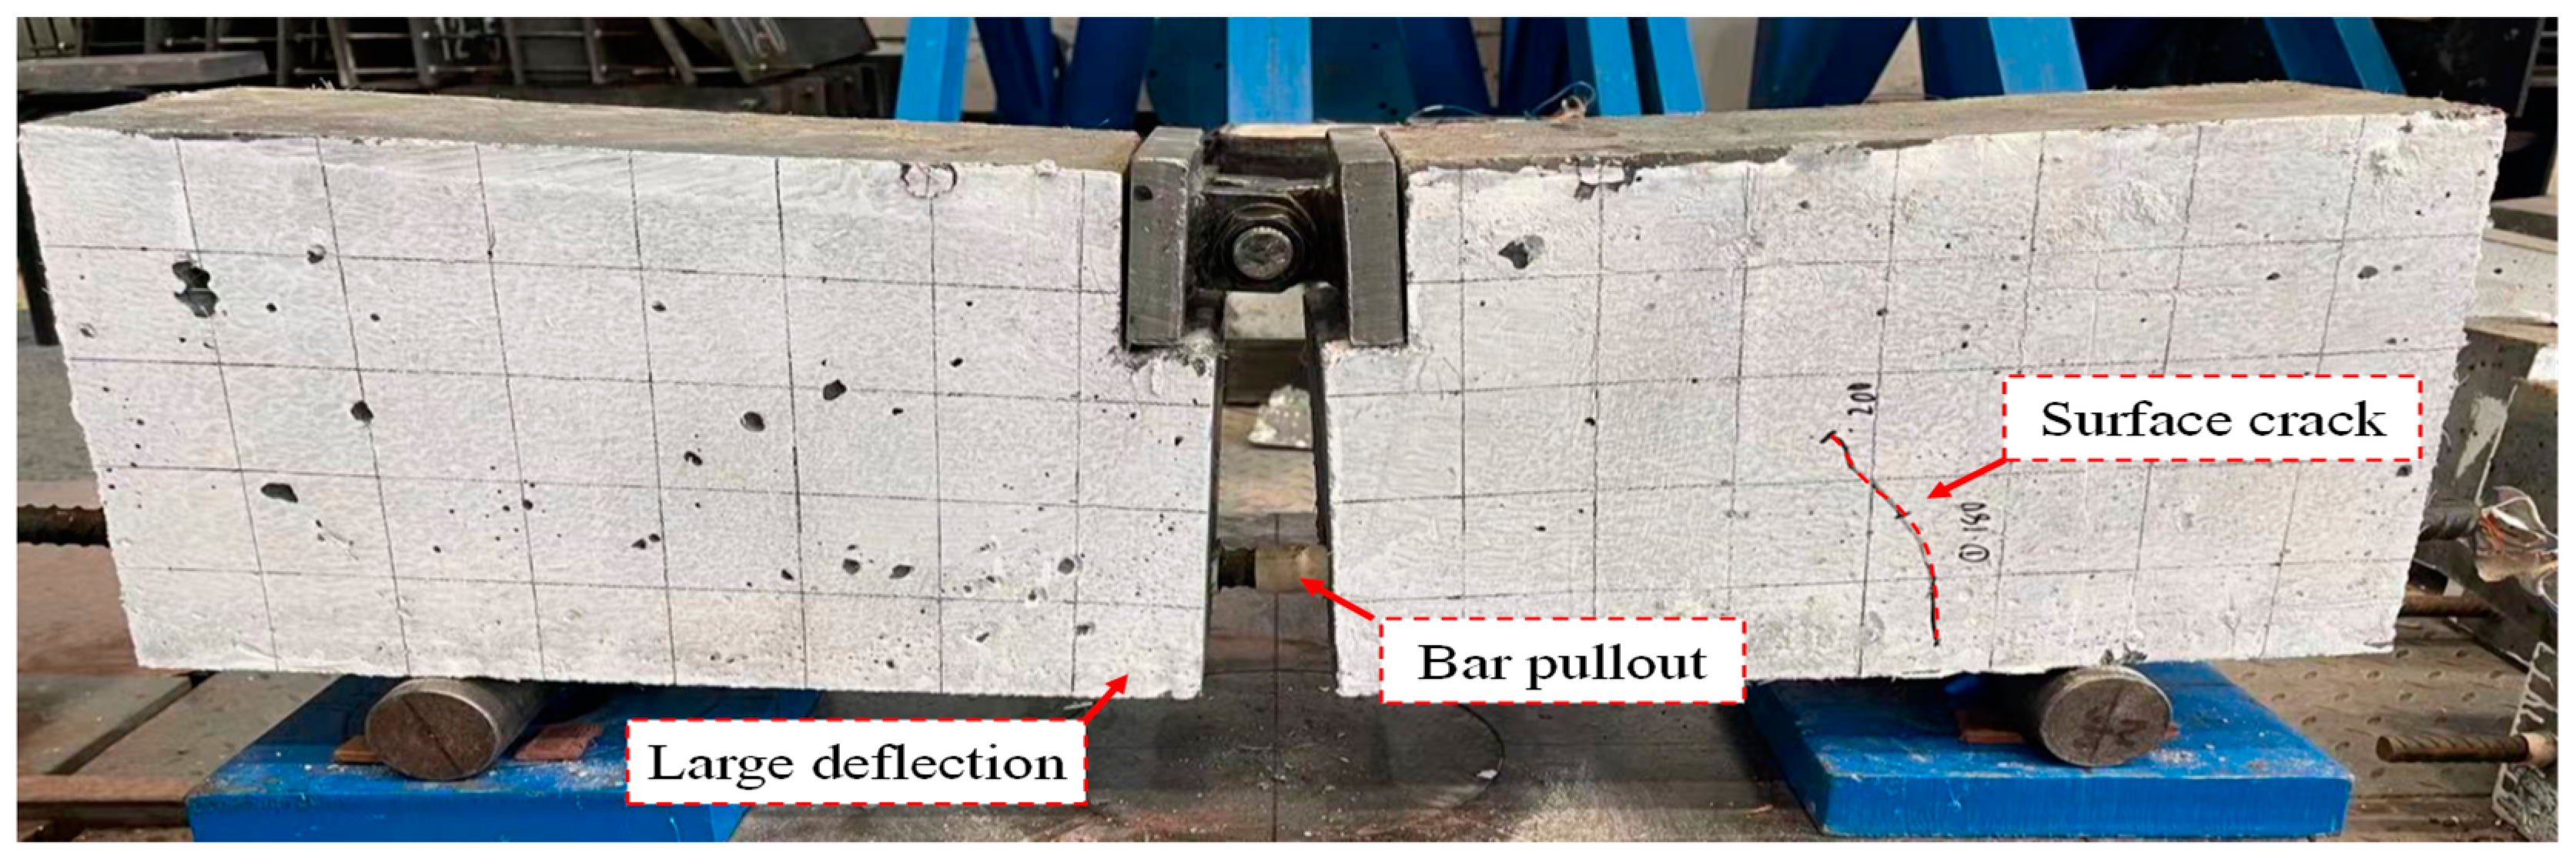
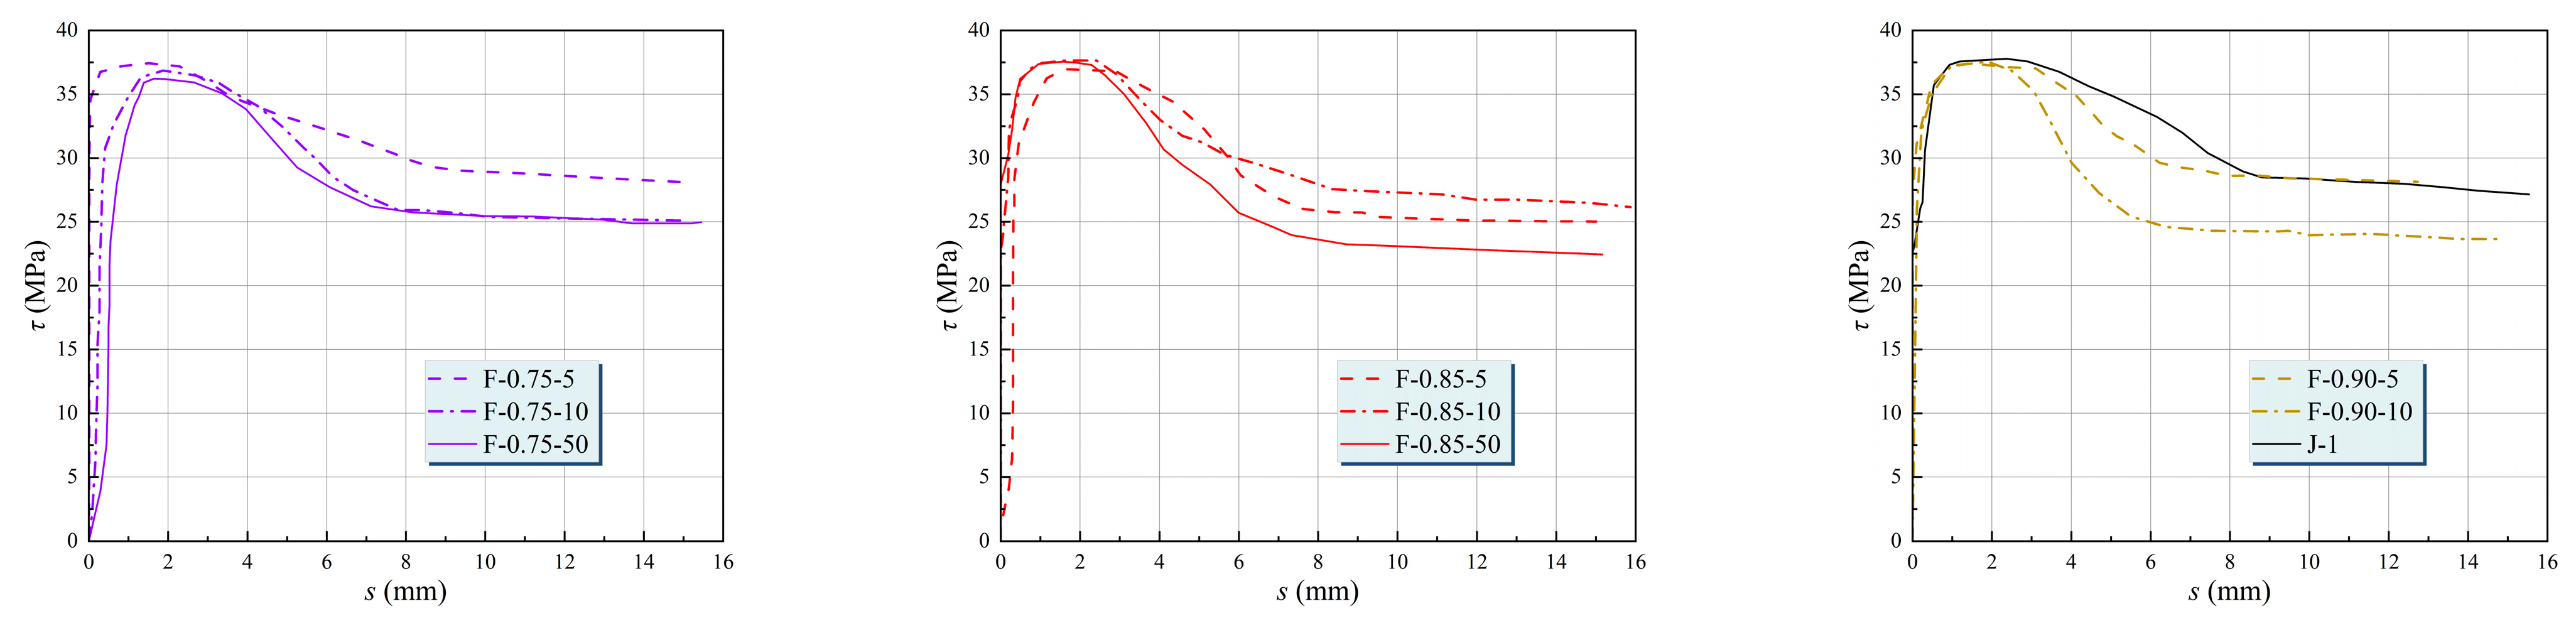
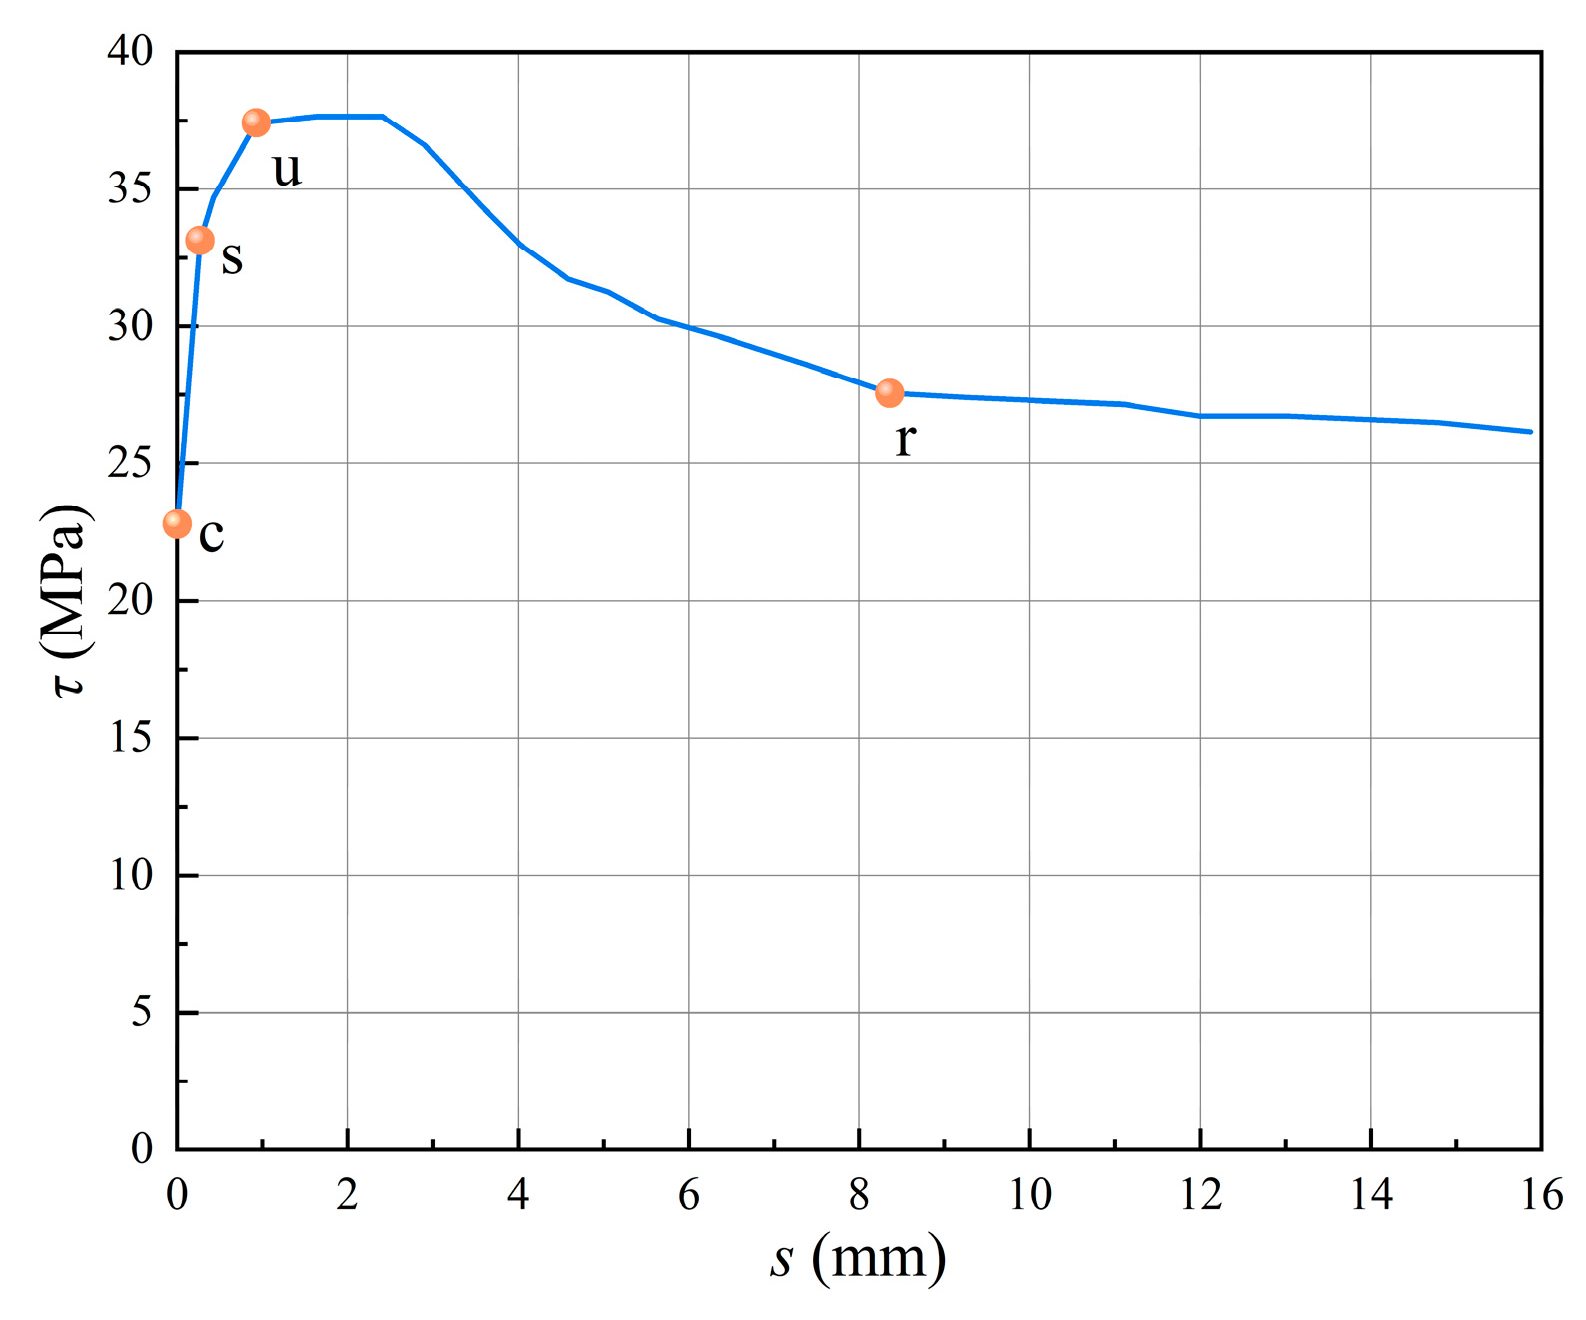
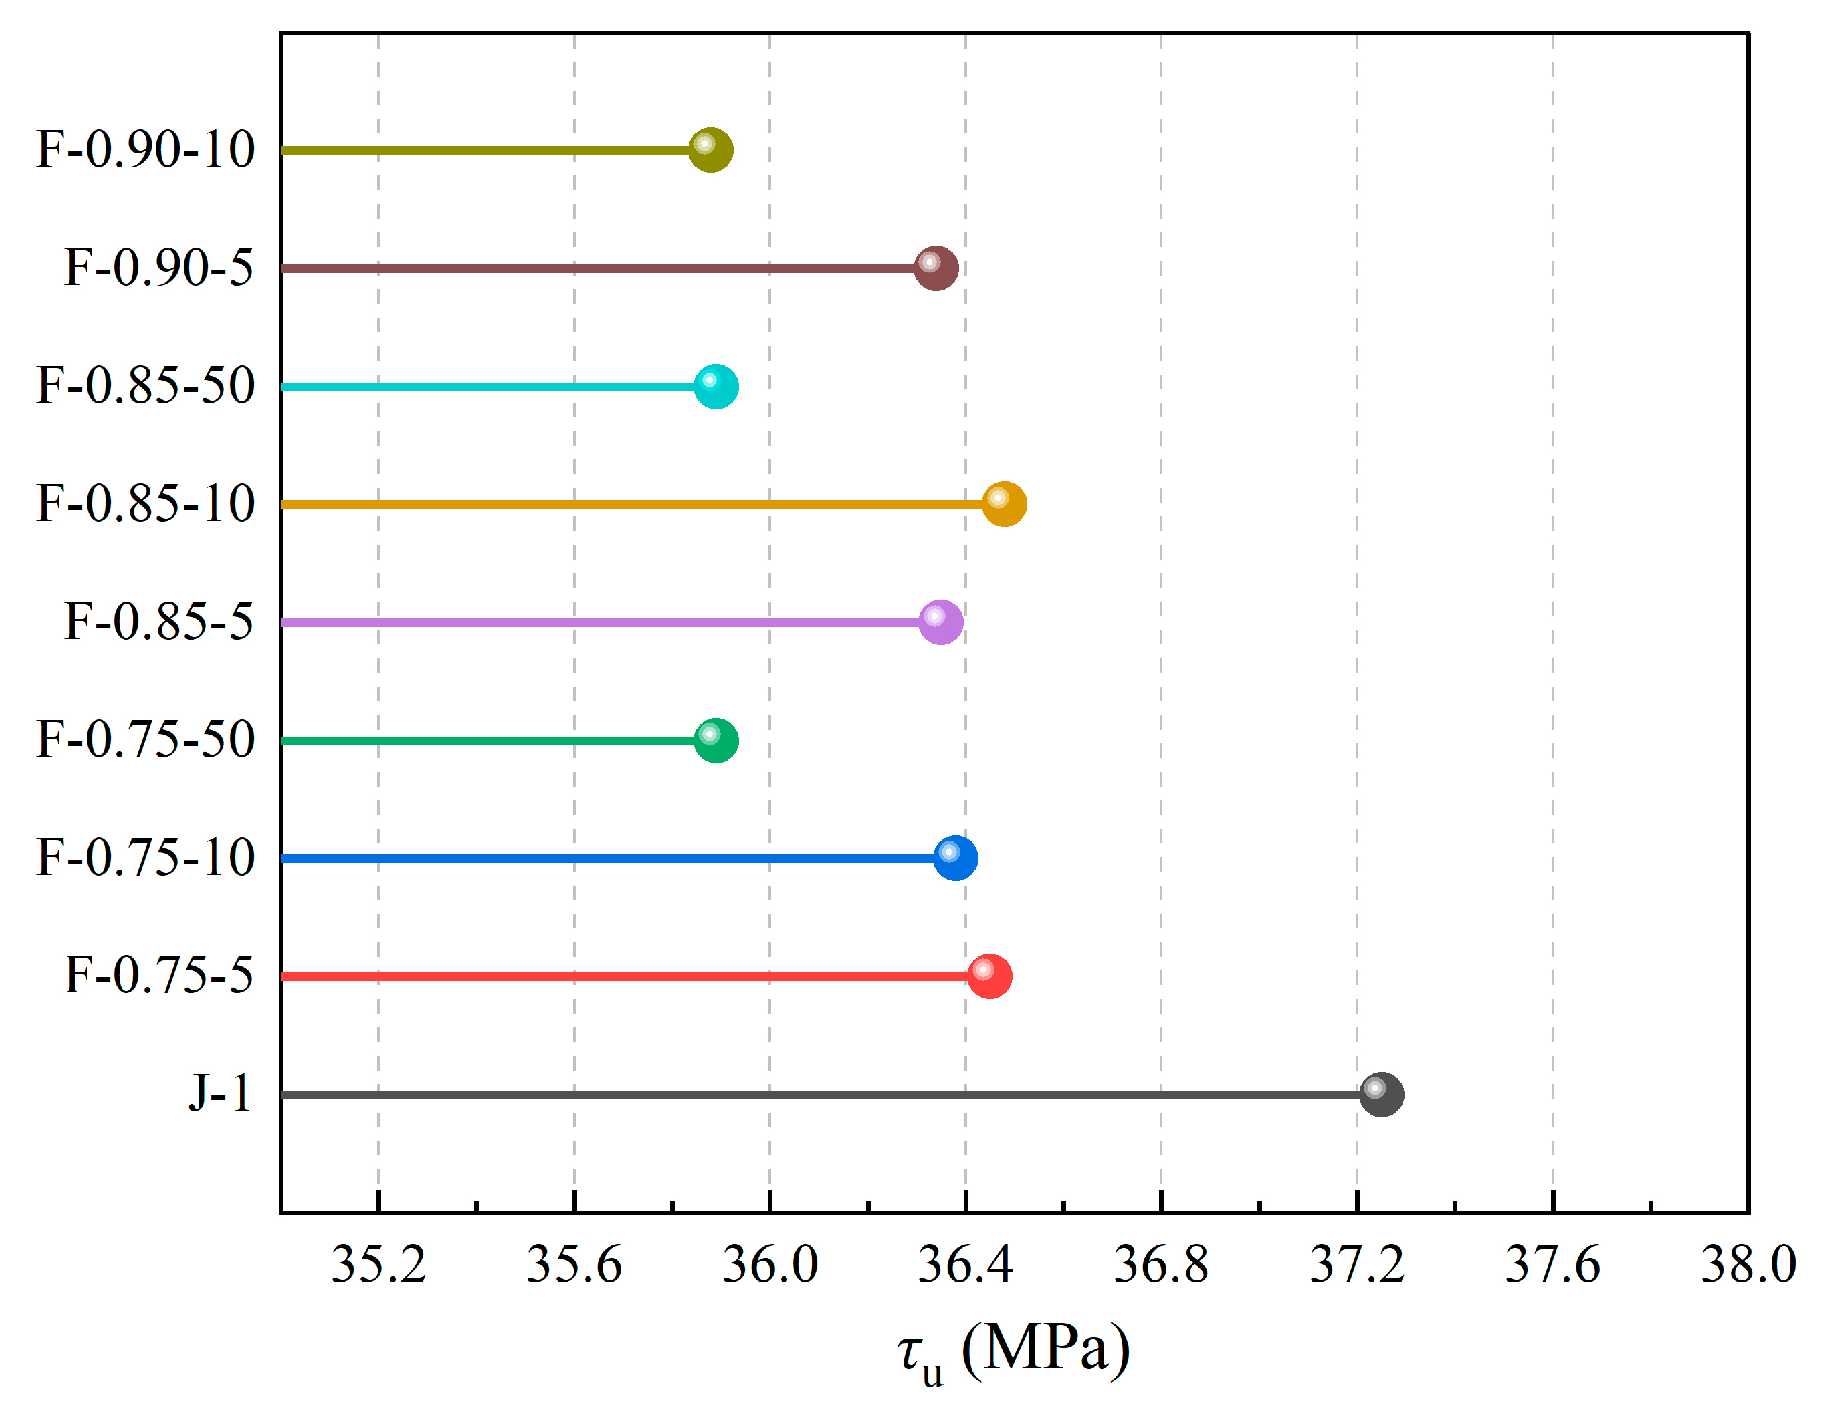
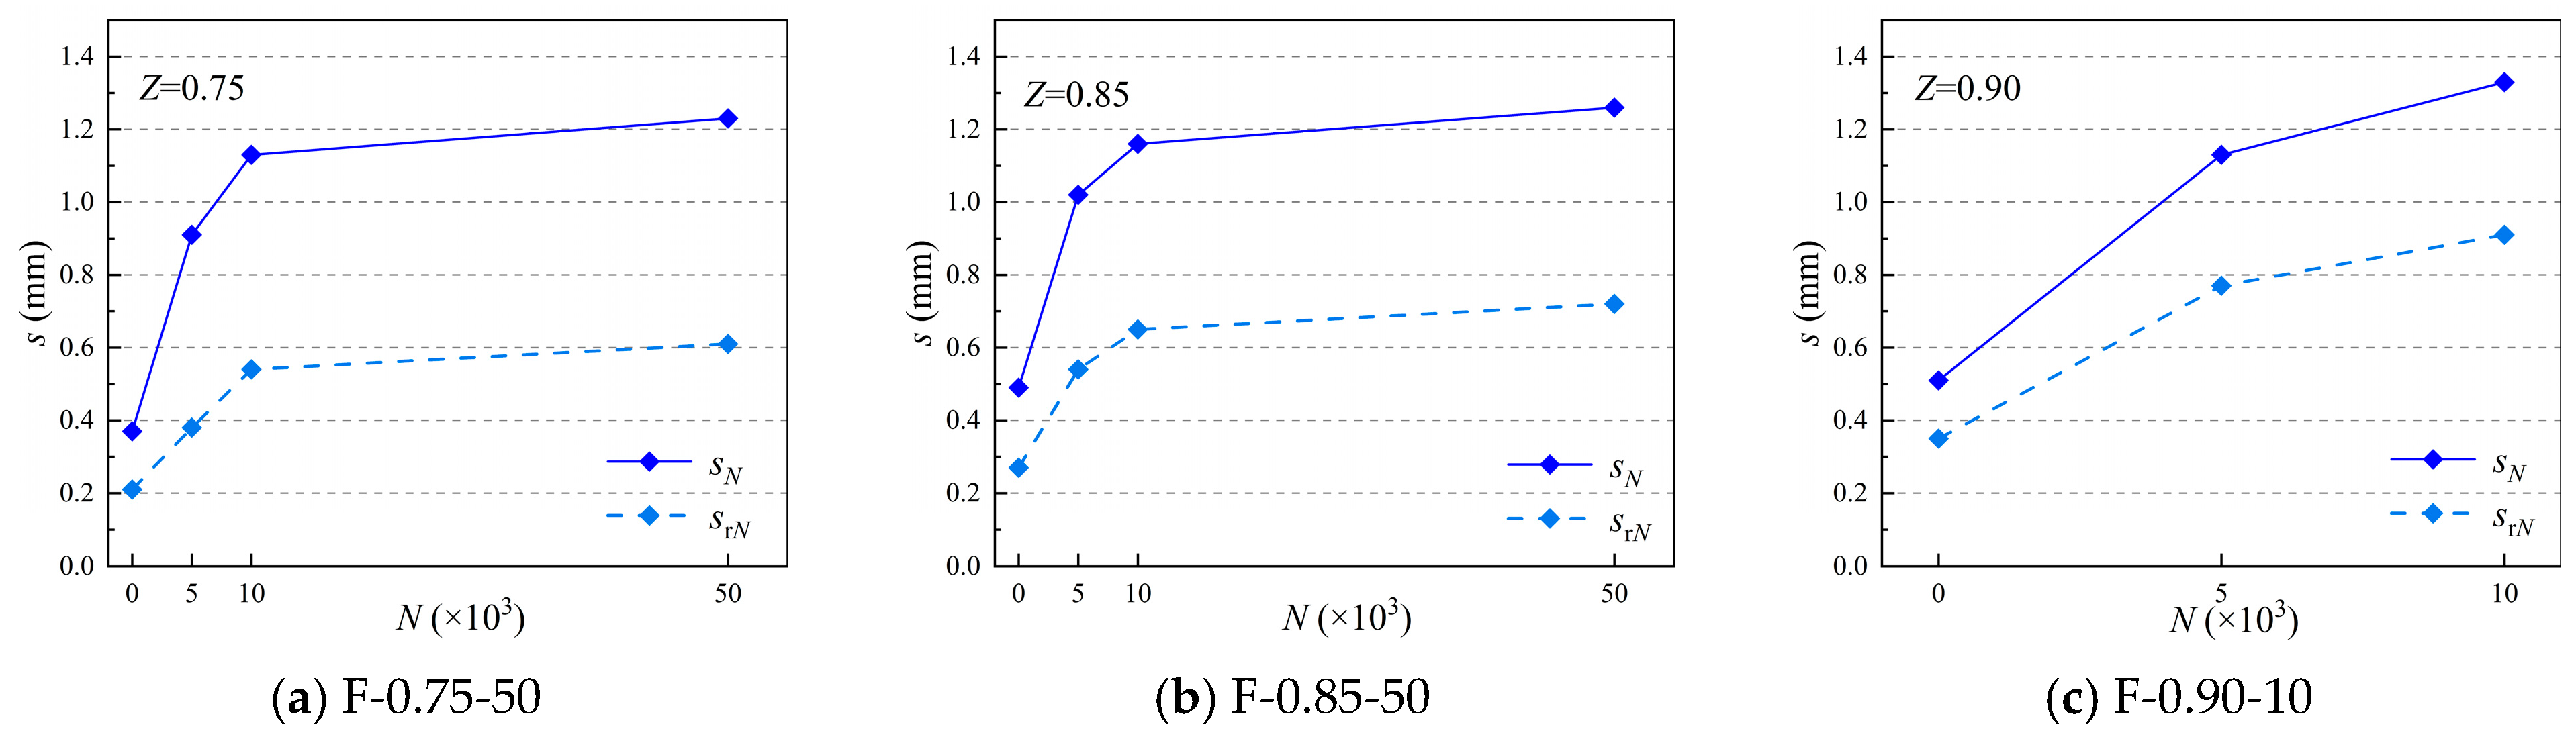
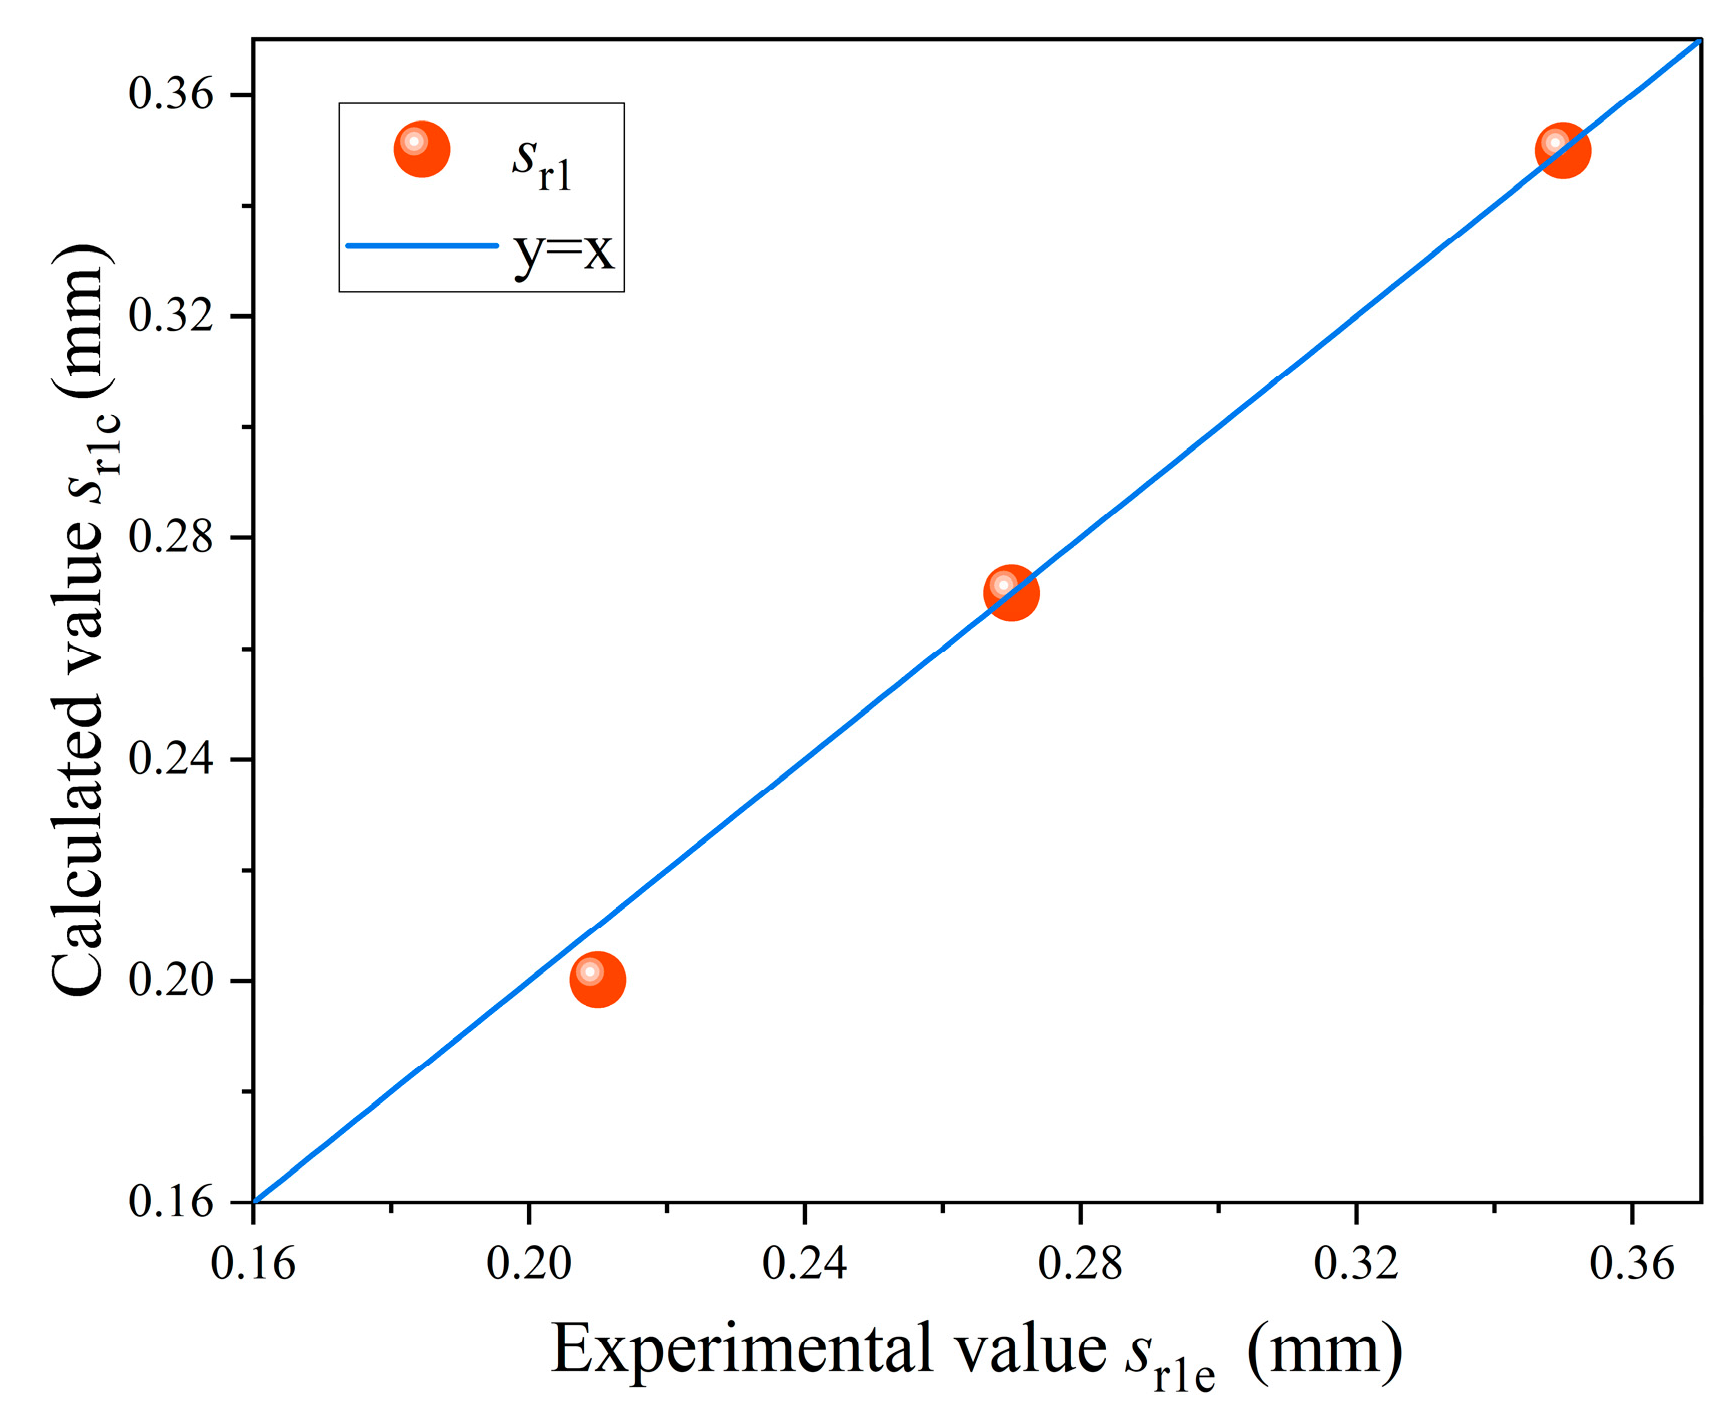
This study conducted multi-level repeated loading tests (stress levels 0.75–0.9, loading cycles 5 × 10³–5 × 10⁴) on eight beam specimens to investigate the influence of repeated loading on the bond behavior between steel bars and RPC. The multi-stage response characteristics of the bond stress-slip curve under repeated loading were revealed, and the effects of stress levels and loading cycles on ultimate bond strength were analyzed. A residual slip prediction model considering loading history was established, and a constitutive equation for the bond–slip behavior of steel–RPC under repeated loading was proposed. The research findings provide a theoretical basis for the design of RPC structures in fatigue-sensitive areas such as long-span bridges, high-rise buildings, and railway facilities.

2. Experimental Program

2.1. Material Properties

HRB400 grade steel bars with a diameter of 20 mm were used in the tests. Mechanical property tests of the steel bars were conducted according to the standard GB/T 228.1-2021 [31]. The yield strength of the steel bars was 451.57 MPa, and the ultimate tensile strength was 614.32 MPa, Modulus of elasticity 2 × 10⁵ MPa.
The raw materials for reactive powder concrete are cement, silica fume, quartz sand, steel fibers, and high-efficiency water-reducing agents. The water-to-binder ratio is 0.16. The cement used is P·O 42.5 ordinary Portland cement. The mineral composition is shown in Table 1.
Silica fume is microsilica powder with 95% silica content. The mineral composition and particle size percentage are shown in Table 2 and Table 3.
Quartz sand includes coarse, medium, and fine grain sizes, 20–40 mesh, 40–60 mesh, and 60–80 mesh. Its fineness modulus and density are shown in Table 4 and Table 5.
The steel fibers used are copper-coated steel fibers with a diameter of 0.2 mm and a length of 12 mm, with a volume fraction of 2%. The density is calculated as 7850 kg/m3.
The high-efficiency water-reducing agent has a water-reducing efficiency of 37%. The mix proportion of the RPC material is shown in Table 6.
In accordance with the standard GB/T 50081-2019 [32], compressive strength and splitting tensile strength tests were conducted on RPC specimens at 28 days of age. The specimen dimensions were 100 mm × 100 mm × 100 mm, and the average value of three specimens per group was taken. The measured cubic compressive strength of the RPC was 119.34 MPa, and the splitting tensile strength was 12.72 MPa.

2.2. Specimen Design

To investigate the effects of different stress levels and repeated loading cycles on the bond behavior between steel bars and RPC, nine beam specimens of steel–RPC were designed and fabricated. Repeated loading tests were conducted on these specimens, and the specimen parameters are shown in Table 7. The tests used the bond performance under static loading as a benchmark, considering three stress levels (0.75, 0.85, and 0.9) and three repeated loading cycles (5000, 10,000, and 50,000). The selection of stress levels 0.75–0.9 was based on the pre-test results: when Z < 0.7 the specimen did not show significant damage, whereas the static load damage mode shifted to sudden brittle fracture at Z > 0.95. The loading times of 5 × 10³–5 × 10⁴ times cover the typical requirements of bridge design codes for fatigue life members such as those in [33].
To better simulate the loading state of steel bars under repeated loading, hinged beam specimens were used. The dimensions and reinforcement details of the specimens are shown in Figure 1. The beam specimens had dimensions of 150 mm × 250 mm × 830 mm and consisted of two RPC beams. The two beams were spaced 30 mm apart and connected by upper steel hinges and bottom steel bars. The length of the bottom tensile steel bar in the beam specimens was 1000 mm, with a bond length la = 3d = 60 mm. To ensure uniform distribution of bond stress between the steel bar and RPC within the bond length, partial bonding was used during the test. To eliminate the influence of support reactions, the bond segment of the steel bar was placed in the middle of each RPC beam, and the steel bar outside the bond segment was covered with a 25 mm diameter PVC sleeve to isolate it from the RPC. The beam specimens were internally reinforced with stirrups and longitudinal bars, both made of HPB300 grade plain steel bars with a diameter of 10 mm.

2.3. Loading Device and Loading Program

The tests were conducted using a four-point bending test [34]. The loading was divided into static and repeated loading parts. The static tests were performed on a 500-ton electro-hydraulic servo pressure testing machine. The specific test procedure was as follows: (1) Pre-loading: The load was applied in three stages, with each stage increasing by 10 kN and holding for 10 min. (2) Load-controlled loading: The load was applied in 20 stages, with each stage increasing by 10 kN and holding for 5 min. (3) Displacement-controlled loading: The loading rate was 0.2 mm/min until specimen failure.
The repeated loading tests were conducted on a 50-ton fatigue testing machine, as shown in Figure 2. The specific test procedure was as follows: (1) Pre-loading: The same as in the static test. (2) First repeated loading: The load was increased in stages of 10 kN to the upper limit of the repeated load, then unloaded in stages of 10 kN to 0, with each stage held for 5 min. (3) Repeated loading phase: The loading frequency was 4 Hz, and the stress levels of the repeated loading were applied according to Table 3. (4) Static loading phase: When the specified number of loading cycles was reached, a static test was conducted until failure.
A 50-ton load cell was used to measure the test load. Displacement gauges were installed on the free end of the steel bar to measure the relative slip between the steel bar and RPC, with a range of 20 mm. Displacement gauges were also installed at the bottom of the specimen to measure the beam deflection, with a range of 50 mm. All load cells and displacement gauges were connected to a data acquisition system. The reaction force F of the steel hinge on the RPC beam and the bond stress τ were calculated using Equations (1) and (2). The calculation sketch is shown in Figure 3.
F = P 2 h a 1 a 2
τ = P ( a 1 a 2 ) 2 h π d l a
where P is the load applied to the beam; d is the diameter of the steel bar, d = 20 mm; la is the bond length of the steel bar, la = 60 mm; h = 175 mm; a1 = 315 mm; a2 = 115 mm.

3. Results and Discussion

3.1. Forms of Destruction

All specimens failed by steel bar pull-out during the static loading phase, and no fatigue failure occurred during the repeated loading phase. The typical final failure mode is shown in Figure 4. During the test, cracks appeared on the surface of the RPC and gradually developed, but the crack width was very small. When the steel bar and concrete experienced significant slip, the cracks stopped developing. At the time of steel bar pull-out failure, the cracks on the surface of the RPC did not develop significantly, and the crack width remained small. At this point, the slip of the steel bar was large, the spacing between the two RPC beams increased, and significant deflection occurred. A comparison of different loading conditions revealed that the damage was dominated by interfacial microslip at low stress levels (Z = 0.75), while the steel fiber bridging effect became the key mechanism to resist slip at Z ≥ 0.85 [13]. This is consistent with the findings of UHPC [28], but RPC showed superior crack control due to the denser matrix.

3.2. Bond Stress-Slip Curves

The bond stress-slip (τ-s) curve in the static loading stage after repeated loading is shown in Figure 5. According to the characteristics of this curve, combined with the test phenomenon, the curve is divided into five stages, as shown in Figure 6. (1) Slight slip phase (0~c): At the early stage of loading, no slip occurred between the reinforcement and the RPC, so the τ-s curve was perpendicular to the straight line of the x-axis. (2) Slip phase (c~s): With the increase of the load, the free end reinforcement began to slip slightly when the adhesive stress reached 23 MPa (approximately 0.61 τu), but the amount of slip was small. At this time, the bond stress increases rapidly and the slope is larger. (3) Splitting phase (s~u): When the bond stress reaches 32 MPa (roughly 0.84 τu), surface cracks form. The τ-s curve turns nonlinear, with bond stress growth slowing and slip increasing significantly. (4) Bond stress decline phase (u~r): After the bond stress reaches τu, the bond stress drops while slip accelerates, with minimal changes to surface cracks. (5) Residual slip phase (r~): When the bond stress decreases to 28 MPa (approximately 0.74 τu), the value of the slip reaches 8 mm. Reinforcement pulls out slowly with no new crack changes; bond stress stabilizes while slip persists.

3.3. Ultimate Bond Strength

The ultimate bond strength (τu) of each specimen is shown in Figure 7. The τu values of the eight F-series specimens subjected to repeated loading were all lower than that of the J-1 specimen subjected only to static loading, with an average value of 36.21 MPa. The τu of the J-1 specimen was 37.25 MPa. Among them, the F-0.9-10 specimen had the lowest τu, at 35.88 MPa, which was only 3.68% lower than that of the J-1 specimen. The increase in the number of repeated loading cycles and stress levels led to a decrease in the ultimate bond strength between the steel bar and RPC, but the decrease was not significant. This is because all specimens failed by steel bar pull-out during the static loading phase, and no fatigue failure occurred during the repeated loading phase. Therefore, although repeated loading and stress levels weakened the bond between the steel bar and RPC, these factors did not significantly reduce the ultimate bond strength. Compared with conventional concrete (NC), the bond strength attenuation of RPC under repeated loading (3.68%) was significantly lower than that of NC (the literature [25] reported NC attenuation of up to 15%), attributed to the bridging effect of the RPC dense matrix with steel fibers. In comparison with the UHPC study, the bond strength of the beam specimens in this paper is higher than the results of the pull-out specimens in the literature [28], indicating that the beam loading is closer to the actual stress state.

3.4. Slip During Repeated Loading Phase

The maximum slip SN and residual slip SrN under a certain number of repeated loading cycles are shown in Figure 8. It can be seen that SN and SrN increase with the number of repeated loading cycles, which is due to the accumulation of micro-plastic slip after each repeated loading cycle. As the stress level increases, the ratio SrN/SN under a certain number of repeated loading cycles also increases. This is because higher stress levels result in greater plastic slip after each loading cycle, and the recoverable slip after unloading is smaller, leading to an increase in SrN. The SN and SrN values for specimens under different stress levels are shown in Table 3.
s N = s 1 N b s r N = s r 1 N b r
Based on the observed patterns of SN and SrN in the tests, the data in Table 8 were fitted using Equation (3) where S1 is the maximum slip corresponding to the first loading cycle (mm); S1 is the residual slip corresponding to the first loading cycle (mm); and b and b1 are fitting coefficients, with b = 0.101 and b1 = 0.097.
From Table 8, it can be seen that when the stress level remains constant, SrN/SN is almost a constant. Therefore, it is assumed that Sr1 is a function of Z and S1. By fitting the experimental data in Table 9, the empirical formula for the residual slip Sr1 after the first loading cycle is given by Equation (5). The comparison between the calculated and experimental values of Sr1 is shown in Figure 9. The average value of Sr1c/Sr1e is 0.984, with a standard deviation of 0.022 and a coefficient of variation of 0.223. This formula can accurately predict the residual slip of steel–RPC after the first loading cycle.
s r 1 = 17.333 Z 2 27.633 Z + 11.516 s 1
According to the CEB-FIP-MC90 model for the bond–slip relationship of reinforced concrete [35], τ = τu(S/Sm1)a, 0 ≤ S < Sm1. S1 can be calculated using Equation (5):
s 1 = s m 1 τ / τ u 1 a
where τ is the bond stress under repeated loading, and τu and Sm1 are the ultimate bond stress and ultimate slip under static loading, respectively. According to the definition and Equation (1), it can be seen that τ/τu = P/Pu = Z. Therefore, as long as the stress level is known, the slip corresponding to the maximum stress in the first loading cycle can be calculated.

3.5. Establishment of Bond–Slip Constitutive Relationship for Steel–RPC Under Repeated Loading

3.5.1. Basic Form of τ-s Curve

Based on the characteristics of the τ-s curves obtained from the tests, the bond–slip curves of the beam specimens after a certain number of repeated loading cycles and those obtained from static tests are basically the same in form, and the ultimate bond strength and maximum slip are also similar. Therefore, a power function is used to express the bond–slip constitutive relationship under repeated loading. Since the ascending branch of the bond–slip relationship is more important and widely used, only the ascending branch is fitted in this study, as shown in Equation (6). According to Jia [36] research, τu and Sm1 can be calculated using Equations (7) and (8):
τ N = 0                                                                   s < s r N 1   τ N = τ u s s r N 1 s m 1 a N           s s r N 1
τ u = 2.675 + 0.711 c d 0.65 + 1.257 d l a ( 0.815 + 0.1 V f ) f rcu
s m 1 = 0.021 + 3.197 d l a ( 0.129 + 0.456 V f )
where c is the concrete cover thickness; Vf is the volume fraction of steel fibers in RPC; and frcu is the cube compressive strength of RPC.

3.5.2. Fitting of a N

By transforming Equation (6), we obtain:
lg τ N τ u = a N lg s s r N 1 s m 1
The values of a N after different stress levels and repeated loading cycles are summarized in Table 9. From Table 9, it can be seen that as the stress level increases and the number of repeated loading cycles increases, the value of aN gradually decreases, indicating that aN is a function of stress level and the number of repeated loading cycles. The experiment introduces stress level and loading cycle parameters based on the CEB-FIP model (static load only), making it more suitable for fatigue conditions.
Assuming that a1/aN is a function of stress level Z and the number of repeated loading cycles N , i.e.,:
a 1 / a N = c 0 Z c 1 N c 2
By transforming the above equation, we obtain:
lg a 1 a N = lg c 0 + c 1 lg Z + c 2 lg N
where c0, c1, and c2 are regression parameters. Through multiple regression analysis, we obtain:
lg c 0 = 0.045 ,   b 1 = 1.086 ,   b 2 = 0.072
a N = a 1 0.902 Z 1.086 N 0.072

3.5.3. Bond–Slip Constitutive Relationship Under Repeated Loading

The average bond stress-slip relationship between steel bars and RPC under repeated loading is given by Equation (13):
τ N = 0                                                                   s < s r N 1   τ N = τ u s s r N 1 s m 1 a N           s s r N 1
where τ u is calculated using Equation (7); Sm1 is calculated using Equation (8); Sr(N − 1) is calculated using Equation (4); and aN is calculated using Equation (12).

4. Conclusions

Through repeated loading tests on eight steel-RPC beam specimens and one static pull-out test as a control, the bond–slip constitutive relationship between steel bars and RPC was studied and the following conclusions were drawn:
(1)
All nine beam specimens failed by steel bar pull-out during the static loading phase. During the initial stage of static loading, cracks appeared on the surface of the RPC. However, at the time of steel bar pull-out failure, the cracks did not develop further, and the beam exhibited significant deflection.
(2)
The bond stress-slip curves obtained from the tests after repeated loading can be divided into five stages: micro-slip, slip, splitting, descending, and residual.
(3)
The ultimate bond strength decay rate of RPC was measured to be only 3.68%. At Z = 0.9 stress level, the ultimate bond strength decay rate of RPC was measured to be only 3.68%, which is significantly lower than the 15% decay rate of ordinary concrete. This excellent performance is mainly attributed to the effective inhibition of interfacial microcracks by the dense matrix of RPC and the bridging effect of steel fibers.
(4)
Due to the accumulation of micro-plastic slip caused by repeated loading, the maximum slip and residual slip under repeated loading increased with the number of loading cycles. The relationship between the maximum slip and residual slip after the first loading cycle was obtained by fitting the experimental data.
(5)
A bond–slip constitutive relationship for steel–RPC under repeated loading was proposed, providing a theoretical basis for the design and research of steel–RPC structures.

Author Contributions

D.Z.: Project administration, Writing—review and editing; Y.F.: Formal analysis, Data curation; R.H.: Supervision, Methodology; X.K.: Writing—original draft, Visualization; D.W.: Funding acquisition, Writing—review and editing; C.R.: Investigation. All authors have read and agreed to the published version of the manuscript.

Funding

This research was funded by State Grid Heilongjiang Electric Power Co., LTD. Electric power Research Institute, grant number SGHLDK00GKJS2400106.

Data Availability Statement

Dataset available on request from the authors.

Conflicts of Interest

Authors Dewen Zhang, Yanming Feng and Ruihui Han were employed by the company State Grid Heilongjiang Electric Power Co., Ltd. Electric Power Research Institute. The remaining authors declare that the research was conducted in the absence of any commercial or financial relationships that could be construed as a potential conflict of interest.

Correction Statement

This article has been republished with a minor correction to the readability of table 7. This change does not affect the scientific content of the article.

References

  1. Sohail, M.G.; Wang, B.; Jain, A.; Kahraman, R.; Ozerkan, N.G.; Gencturk, B.; Dawood, M.; Belarbi, A. Advancements in Concrete Mix Designs: High-Performance and Ultrahigh-Performance Concretes from 1970 to 2016. J. Mater. Civ. Eng. 2018, 30, 04017310. [Google Scholar] [CrossRef]
  2. Wang, D.; Zhang, H.; Chen, P.; Ju, Y.; Guo, P. Study on freeze-thaw resistance and pore structure deterioration of fly ash reactive powder concrete based on low-field NMR relaxation. Case Stud. Constr. Mater. 2025, 22, e04334. [Google Scholar] [CrossRef]
  3. Gong, J.; Ma, Y.; Fu, J.; Hu, J.; Ouyang, X.; Zhang, Z.; Wang, H. Utilization of fibers in ultra-high performance concrete: A review. Compos. Part B Eng. 2022, 241, 109995. [Google Scholar] [CrossRef]
  4. Ju, Y.; Zhao, J.; Wang, D.; Song, Y. Experimental study on flexural behaviour of reinforced reactive powder concrete pole. Constr. Build. Mater. 2021, 312, 125399. [Google Scholar] [CrossRef]
  5. Yoo, D.-Y.; Yoon, Y.-S. A Review on Structural Behavior, Design, and Application of Ultra-High-Performance Fiber-Reinforced Concrete. Int. J. Concr. Struct. Mater. 2016, 10, 125–142. [Google Scholar] [CrossRef]
  6. Ju, Y.; Zhang, H.; Wang, D.; Kong, X.; Ma, Y.; Zhang, X.; Bai, J. Effect of mineral admixtures on the resistance to sulfate attack of reactive powder concrete. J. Clean. Prod. 2024, 440, 140769. [Google Scholar] [CrossRef]
  7. Sanjuán, M.Á.; Andrade, C. Reactive Powder Concrete: Durability and Applications. Appl. Sci. 2021, 11, 5629. [Google Scholar] [CrossRef]
  8. Wang, D.; Han, L.; Kang, M.; Wan, M.; Ju, Y. Influence of corrosion on the bond performance of reinforcements and basalt fibre high strength concrete. Case Stud. Constr. Mater. 2022, 17, e01394. [Google Scholar] [CrossRef]
  9. Wang, D.; Liu, K.; Kang, M.; Han, L. Experimental study on the bond performance between ultra-high performance concrete and steel bar under freeze-thaw cycles. Case Stud. Constr. Mater. 2024, 20, e03401. [Google Scholar] [CrossRef]
  10. Zheng, Y.; Fan, C.; Ma, J.; Wang, S. Review of research on Bond–Slip of reinforced concrete structures. Constr. Build. Mater. 2023, 385, 131437. [Google Scholar] [CrossRef]
  11. Zhang, H.; Li, H.; Lin, T.; Shen, Z.; Feng, Q. Experimental investigation on influence of embedment length, bar diameter and concrete cover on bond between reinforced bars and steel fiber reinforced concrete (SFRC). Case Stud. Constr. Mater. 2024, 21, e03742. [Google Scholar] [CrossRef]
  12. Shunmuga Vembu, P.R.; Ammasi, A.K. A Comprehensive Review on the Factors Affecting Bond Strength in Concrete. Buildings 2023, 13, 577. [Google Scholar] [CrossRef]
  13. Roy, M.; Hollmann, C.; Wille, K. Influence of volume fraction and orientation of fibers on the pullout behavior of reinforcement bar embedded in ultra high performance concrete. Constr. Build. Mater. 2017, 146, 582–593. [Google Scholar] [CrossRef]
  14. Huang, Y.; Liu, Y. Review of Bond-Slip Behavior between Rebar and UHPC: Analysis of the Proposed Models. Buildings 2023, 13, 1270. [Google Scholar] [CrossRef]
  15. Wang, D.; Han, L.; Ju, Y.; Zeng, C.; Li, Z. Bond behavior between reinforcing bar and reactive powder concrete. Struct. Concr. 2021, 23, 2630–2642. [Google Scholar] [CrossRef]
  16. Piccinini, Â.C.; Filho, L.C.P.d.S.; Filho, A.C. Bond of Reinforcement in Reactive Powder Concrete at Different Ages. ACI Mater. J. 2021, 118, 169–176. [Google Scholar] [CrossRef]
  17. Qi, J.; Cheng, Z.; John Ma, Z.; Wang, J.; Liu, J. Bond strength of reinforcing bars in ultra-high performance concrete: Experimental study and fiber–matrix discrete model. Eng. Struct. 2021, 248, 113290. [Google Scholar] [CrossRef]
  18. Wang, R.; Ma, B.; Chen, X. Experimental study on bond performance between UHPC and steel bars. J. Build. Eng. 2023, 79, 107861. [Google Scholar] [CrossRef]
  19. Bae, B.-I.; Choi, H.-K.; Choi, C.-S. Bond stress between conventional reinforcement and steel fibre reinforced reactive powder concrete. Constr. Build. Mater. 2016, 112, 825–835. [Google Scholar] [CrossRef]
  20. Alkaysi, M.; El-Tawil, S. Factors affecting bond development between Ultra High Performance Concrete (UHPC) and steel bar reinforcement. Constr. Build. Mater. 2017, 144, 412–422. [Google Scholar] [CrossRef]
  21. Su, T.; Wu, J.; Zou, Z.; Yuan, J. Bond Performance of Steel Bar in RAC under Salt-Frost and Repeated Loading. J. Mater. Civ. Eng. 2020, 32, 04020261. [Google Scholar] [CrossRef]
  22. Abbass, W.; Siddiqi, Z.A.; Aslam, F.; Hussain, R.R.; Ahmed, S. Bond behaviour of high-strength concrete flexural member under low cyclic fatigue loading. Fatigue Fract. Eng. Mater. Struct. 2013, 36, 602–613. [Google Scholar] [CrossRef]
  23. Daud, S.A.; Forth, J.P.; Nikitas, N. Time-dependent behaviour of cracked, partially bonded reinforced concrete beams under repeated and sustained loads. Eng. Struct. 2018, 163, 267–280. [Google Scholar] [CrossRef]
  24. Lemcherreq, Y.; Zanuy, C.; Vogel, T.; Kaufmann, W. Strain-based analysis of reinforced concrete pull-out tests under monotonic and repeated loading. Eng. Struct. 2023, 289, 115712. [Google Scholar] [CrossRef]
  25. Zhang, W.; Zhang, Y.; Li, H.; Gu, X. Experimental investigation of fatigue bond behavior between deformed steel bar and concrete. Cem. Concr. Compos. 2020, 108, 103515. [Google Scholar] [CrossRef]
  26. Wu, Z.; Deng, M.; Zhang, M.; Zhang, W.; Liu, J. Bond behavior between highly ductile fiber-reinforced concrete (HDC) and deformed rebar under repeated and post-repeated monotonic loading. Structures 2024, 67, 106933. [Google Scholar] [CrossRef]
  27. Shang, H.; Yang, J.; Huang, Y.; Fan, L.; Wang, R. Study on the bond behavior of steel bars embedded in concrete under the long-term coupling of repeated loads and chloride ion erosion. Constr. Build. Mater. 2022, 323, 126498. [Google Scholar] [CrossRef]
  28. Shao, Y.; Tich, K.L.; Boaro, S.B.; Billington, S.L. Impact of fiber distribution and cyclic loading on the bond behavior of steel-reinforced UHPC. Cem. Concr. Compos. 2022, 126, 104338. [Google Scholar] [CrossRef]
  29. Gong, Y.; Wang, Z.; Huang, B.; Shan, Y. Experimental Study on the Performance of Lap-Spliced Steel Bars in Ultrahigh-Performance Concrete. J. Mater. Civ. Eng. 2024, 36, 04023519. [Google Scholar] [CrossRef]
  30. Li, Q.-H.; Luo, A.-M.; Huang, B.-T.; Wang, G.-Z.; Xu, S.-L. Bond behavior between steel bar and strain-hardening fiber-reinforced cementitious composites under fatigue loading. Eng. Struct. 2024, 314, 118354. [Google Scholar] [CrossRef]
  31. GB/T 228.1-2021; Metallic Materials-Tensile Testing-Part 1: Method of Test at Room Temperature. Standards Press of China: Beijing, China, 2021.
  32. GB/T 50081-2019; Standard for Test Methods of Concrete Physical and Mechanical Properties. China Architecture & Building Press: Beijing, China, 2019.
  33. EN 1992-1-1:2004; Eurocode 2: Design of Concrete Structures—Part 1-1: General Rules and Rules for Buildings. European Committee for Standardization: Brussels, Belgium, 2004.
  34. Guo, Y.-C.; Cai, Y.-J.; Xie, Z.-H.; Xiao, S.-H.; Zhuo, K.-X.; Cai, P.-D.; Lin, J.-X. Experimental investigation of GFRP bar bonding in geopolymer concrete using hinged beam tests. Eng. Struct. 2025, 322, 119036. [Google Scholar] [CrossRef]
  35. Jiang, D.; Qiu, H. Bond-slip basic constitutive relation model betweenrebar and concrete under repeated loading. Eng. Mech. 2012, 29, 93–100. (In Chinese) [Google Scholar] [CrossRef]
  36. Jia, F. Experimental Study on Bond Proporties Beween Steel Bar and Reactive Powder Concrete. Ph.D. Thesis, Beijing Jiaotong University, Beijing, China, 2013. Available online: https://kns.cnki.net/kcms2/article/abstract?v=DMKM_QUxZ7BIqTmy19nGd8dNAkwOMcgUXlesh8McKiZ2QAW-it_QtoZjj2B8W8lhLldw3eNzB-pU-raE4yzrPbYpOu1oEf28nLn09jG077Pk_GkT2VcjkM0WuI7dDSM6cvHVI2BbX0XRNQj3dXmMP6Qam-AAUE_oB7Odx4CBSd4kgsyIO877b0ih_ERf5m2NB-yXqRMi_kogHZyxNjksRW-Ed4L_Lcvn&uniplatform=NZKPT&language=CHS (accessed on 16 April 2013).
Figure 1. Dimensions of the specimen.
Buildings 15 01305 g001
Figure 2. Loading device.
Buildings 15 01305 g002
Figure 3. Calculation sketch.
Buildings 15 01305 g003
Figure 4. Final form of damage to the specimen.
Buildings 15 01305 g004
Figure 5. Bond stress-slip (τ-s) curve.
Buildings 15 01305 g005
Figure 6. Bond stress-slip characteristic curve.
Buildings 15 01305 g006
Figure 7. Ultimate bond strength of the specimen.
Buildings 15 01305 g007
Figure 8. Slip of the specimen under repeated loading.
Buildings 15 01305 g008
Figure 9. Comparison of Sr1 calculated and tested values.
Buildings 15 01305 g009
Table 1. Main minerals in cement.
CompositionTricalcium SilicateDicalcium SilicateTetracalcium FerroaluminateTricalcium Aluminate
Proportional situation60.418.58.57.6
Table 2. Mineral composition of silica fume (%).
CompositionSiO2Fe2O3LO.IMgOFe2O3Al2O3FCCaOSO3Na2O
Proportional situation82.11.91.41.41.81.00.80.50.30.2
Table 3. Silica fume particle size percentage (%).
Particle Size μm<2<1<0.5<0.3<0.1
Ratio case10093744813
Table 4. Quartz sand grain size and fineness modulus.
Mesh Size Particle Size (mm)Modulus of Fineness (Mx)
10~201.7~0.854.34
20~400.85~0.482.53
40~700.428~0.2121.64
Table 5. Measured density of quartz sand.
Classification40~70 Mesh20~40 Mesh10~20 Mesh
Apparent density (kg/m3) 265026402630
Stacking density (kg/m3)136513251370
Table 6. RPC proportion design (kg/m3).
CementSFCoarse SandMedium SandFine SandSteel FiberWater ReducerWater
792.79185.96702.32337.26169.231579.79156
Table 7. Specimen design.
Specimen ZNTest Type
J-11-Static load test
F-0.75-50.755 × 10³Repeated loads + static damage
F-0.75-100.7510 × 10³Repeated loads + static damage
F-0.75-500.7550 × 10³Repeated loads + static damage
F-0.85-50.855 × 10³Repeated loads + static damage
F-0.85-100.8510 × 10³Repeated loads + static damage
F-0.85-500.8550 × 10³Repeated loads + static damage
F-0.90-50.905 × 10³Repeated loads + static damage
F-0.90-100.9010 × 10³Repeated loads + static damage
Note: Z represents the stress level, Z = P/Pu, where Pu is the load corresponding to the maximum bond stress in the static test (J-1), and P is the load applied in the repeated loading test. N represents the number of repeated loading cycles. J-1 is the control static test used to determine the value of N . For example, the specimen F-0.75-5 is named as follows: F indicates fatigue test, Z = 0.75, N = 5 × 10³. The F-0.90-50 specimen was also prepared, but the test failed, so it is not included in the analysis.
Table 8. SN and SrN of specimens under different stress levels.
NZ = 0.75Z = 0.85Z = 0.90
SNSrNSrN/SNSNSrNSr/SSNSrNSrN/SN
10.370.210.5410.490.270.5510.510.350.686
50000.910.380.4181.020.540.5291.130.770.681
10,0001.130.540.4781.160.650.5601.330.910.684
50,0001.230.610.4961.260.720.571
average value 0.483 0.553 0.684
Table 9. aN values corresponding to different stress levels and repeated loading cycles.
NaN
Z = 0.75Z = 0.85Z = 0.90
10.1700.1700.170
50000.1460.1280.121
10,0000.1320.1170.103
50,0000.1190.111
Disclaimer/Publisher’s Note: The statements, opinions and data contained in all publications are solely those of the individual author(s) and contributor(s) and not of MDPI and/or the editor(s). MDPI and/or the editor(s) disclaim responsibility for any injury to people or property resulting from any ideas, methods, instructions or products referred to in the content.

