Article

Impact of Wood on Perception of Transient and Steady-State Indoor Thermal Environments

by
Denise (Blankenberger) Gravelle
1,
Jason Stenson
2,3,*,
Mark Fretz
2,3 and
Kevin Van Den Wymelenberg
4
1
Quinn Evans, Washington, DC 20037, USA
2
Energy Studies in Buildings Laboratory, College of Design, University of Oregon, Eugene, OR 97403, USA
3
Institute for Health in the Built Environment, College of Design, University of Oregon, Eugene, OR 97403, USA
4
College of Architecture, University of Nebraska-Lincoln, Lincoln, NE 68588, USA
*
Author to whom correspondence should be addressed.
Buildings 2025, 15(10), 1698; https://doi.org/10.3390/buildings15101698
Submission received: 18 March 2025 / Revised: 10 May 2025 / Accepted: 15 May 2025 / Published: 17 May 2025
(This article belongs to the Section Building Energy, Physics, Environment, and Systems)

Abstract

Wood is often used as an interior surface finish in buildings, including exposed cross-laminated timber panels and other structural mass timber members. Building occupants generally have a positive reaction to visible wood elements used in building interiors due to the visual qualities associated with wood being a natural material. This study aims to identify any thermal comfort impacts of wood interior environments using subjective occupant-reported perceived thermal sensation during two experiments conducted in a climate chamber fitted with either white-painted gypsum wallboard or unfinished laminated Douglas Fir wall panels. In the first experiment, the thermal environment was continually varied while the visual stimulus of the wall type remained constant. Irrespective of wood or white wall treatment type, thermal history played a significant role in the perceived thermal comfort of participants under continually modulating temperatures. In the second experiment, a slightly warm steady-state thermal environment was maintained while one of the two wall treatments was revealed from behind a black curtain. While the shift in thermal sensation toward neutral was greater with wood walls than with white walls, the difference was not found to be statistically significant and appears to diminish after 15 min of exposure to the new visual surroundings.

1. Introduction

With people spending only about 10% of their time outdoors in the U.S. and Canada during summer, and as little as 2–4% in winter [1], conditioning indoor thermal environments can have a significant impact on energy use, with buildings accounting for 40% of all energy consumption in the U.S. [2]. Globally, one-third of the energy demand in buildings is used for space heating, while space cooling has been the fastest-growing end-use in buildings, with electricity demand from space cooling increasing by 33% between 2010 and 2018 [3]. Meanwhile, even with the amount of time people spend indoors, thermal comfort standards typically strive for only 80% occupant acceptability based on a 10% dissatisfaction for general whole-body thermal discomfort, with an additional 10% dissatisfaction from local partial-body discomfort [4]. This stems in part from human thermal perception varying across any given building’s occupant population and thermal perception being influenced by an individual’s thermal experience, expectations, and preferences [5]. Moreover, physical and physiological factors of thermal adaptation have been shown to only account for about half of the variance between objective measures and subjective evaluation of thermal comfort, implying psychological factors play an important role in the perception of thermal comfort [6].
Wood surface qualities have been studied for esthetic preference, attempting to understand how people view and value the natural features of wood, and how these esthetics factor into the industrial processes of grading, sorting, and producing a final product. The appearance of knots in Scots pine, for example, comes down to a balance of harmony and activity, with the likelihood of acceptance of a given surface composition increasing with the combined evaluation of these two preferential categories [7]. There is a generally positive reaction to wood interiors, and they have an impact on emotional state [8]; wood rooms are regarded as being warm, comfortable, relaxing, natural, and inviting [9]; however, an intermediate level of wood interior surface area in some space types is preferred over an all-wood interior [10]. Multiple senses do factor into the evaluation of a material. Tactile warmth, for example, is perceived as distinct from visual warmth for many materials; however, visual perception dominates other senses regarding the overall perception of thermal characteristics of materials [11]. This aligns with human visual preference more broadly, where the level of naturalness in a scene being viewed strongly predicts its preference over more man-made content [12]. Since humans visually perceive wood in yellow and red hues [13], the hue-heat hypothesis (HHH), which suggests that color can impact human temperature perception [14], is thought to apply and account for occupants feeling warmer in wood environments than those of other materials [15], as well as feeling warmer in environments with more wood than less wood [16]. Physiologic response to wood interiors has also been paired with subjective response. Sakuragawa et al. [17] and Tsunetsugu et al. [18] both found a significant decrease in blood pressure related to the preference of wood wall panels over white steel wall panels and the preference of wood wall paneling ratio, respectively. Both studies evaluated the effects of the visual stimulus over a brief 90 s period, limiting the direct applicability of these findings to longer-term physiologic response effects relevant to thermal comfort indoors.
Thermal history can refer to long-term adaptation to environmental conditions that a person becomes accustomed to, like the thermal comfort perceptions of people used to naturally ventilated buildings or air-conditioned ones [19,20], or the level of seasonal space heating to which they are accustomed [21,22,23]. Short-term thermal experience can also influence perceived thermal comfort. Moving from indoors to outdoors or vice versa can often provide a perceptible step change, inducing a change in thermal sensation and a thermal adaptation response [24,25]. This combined thermoregulatory and psychological response is not linear, and thermal sensation has been found to overshoot before rebounding, with step change transitions to a colder environment resulting in a thermal sensation response that can be as much as twice that of the same magnitude step change to a warmer environment [26,27]. In fact, thermal comfort after transitioning from one thermal environment to another is more strongly associated with the temperature difference between the two spaces than with the temperature of either one [28]. The contrast of two thermal environments amplifies thermal sensation and even thermal acceptance, with slight improvements in a non-neutral environment resulting in a significant increase in thermal satisfaction [29].
The physical characteristics of an environment have also been shown to influence thermal sensation. Rohles and Wells [30] were puzzled by the control group in a two-chamber step-change experiment, where control group subjects experienced the same thermal conditions in both chambers but consistently reported that thermal sensation felt cooler in one chamber than the other. The identified difference between the two chambers was their size and appearance. In a follow-up experiment, non-thermal features of the chambers were examined by embellishing the décor of one chamber, including the addition of wood paneling. The results of this second experiment substantiated the notion that interior design elements can influence thermal sensation [30]. Less is known regarding how short-term thermal experience affects thermal comfort within a single space, where the temperature is transient over time and the physical environment is static; though, standards do limit cyclic and drifting operative temperature changes by time period [4].
This study investigates the impact of wood interiors on perceived thermal comfort in a controlled climate chamber using two experiments that employ unfinished wood or white-painted walls as a visual stimulus. First, under a continually variable transient thermal environment with a constant wall covering, and second, under a steady-state thermal environment with a change in wall covering treatment over time.

2. Materials and Methods

Human factors testing was conducted 19 February–26 March 2018 (first experiment) and 18 July–11 August 2018 (second experiment) at the Energy Studies in Buildings Laboratory, Portland, OR, USA using the Climate Chamber (interior dimensions = 3.7 m long × 2.4 m wide × 2.9 m high; 8.88 m2 and 25.75 m3). Sixteen full-height reversible wall panels were prepared and mounted to cover three walls of the chamber. Each panel was 0.6 m wide, “white”-painted gypsum wall board on one side (Benjamin Moore Crème Brulee 2022-70 with a matte-finish, Benjamin Moore, Montvale, NJ, USA) and “wood” on the other to simulate cross-laminated timber (unfinished laminated and sanded 2 × 6 (38 mm × 140 mm) Douglas Fir dimensional lumber oriented vertically). The chamber ceiling comprises white perforated metal panels and the floor is covered in gray vinyl tile.
Ambient environmental conditions were recorded at a height of 0.8 m (Kestrel 5400 Heat Stress Tracker, Kestrel Instruments, Boothwyn, PA, USA), and study participant responses were collected on an iPad and browser-based questionnaire (Qualtrics, Provo, UT, USA).
All participants were in good health and informed of the nature of the study and gave written consent to be participants. All research protocols were approved by the University of Oregon Institutional Review Board (protocol # 12012017.001). Identities of participants were not recorded in the resulting dataset.

2.1. First Experiment

During the first experiment, two occupants wearing typical indoor winter attire (1.0 clo) would enter the chamber at the ambient conditions of the laboratory (door to the chamber open; chamber HVAC systems off) and be seated at side-by-side workstations (1.0 met), facing either white or wood walls. Participants experienced two 80 min periods in the chamber with a 15 min break in between. Over each period in the chamber, with relative humidity maintained at 25 ± 5%, the air temperature was continually modulated, either from ~24 °C up to ~32 °C and back down again or from ~24 °C down to ~16 °C and back. During the second 80 min period, occupants would experience the opposite temperature swing. Participants returned for a second day during the same morning or afternoon time period and repeated the experiment, this time with the opposite wall treatment (white or wood), and the opposite temperature sequence first (hot or cold). The order of these exposures was randomized using a 2 × 2 factorial design. At 20 min intervals, participants reported their Thermal Sensation Vote (TSV) on the ASHRAE 7-point scale (cold (−3), cool (−2), slightly cool (−1), neutral (0), slightly warm (+1), warm (+2), hot (+3)) [4].
Twenty-nine participants were recruited (16 female, 13 male; age 21–33). The first 11 participants returned for a third day, repeating the conditions they experienced on their initial visit, as timestamps were not logged with their questionnaire responses, which were required to link these data to the environmental conditions at the time the response was given.

2.2. Second Experiment

During the second experiment, a single occupant would enter the preconditioned chamber wearing typical summer attire (0.5 clo) and be seated (1.0 met) in the center of the chamber with a table to one side and facing a black curtain covering three walls. Participants spent a single 60 min period in the chamber. At 40 min, a researcher would enter the chamber, pull back the black curtain revealing either the white or wood walls, and leave the chamber (Figure 1). Steady-state environmental conditions were maintained in the chamber throughout the experiment, equivalent to a Predicted Mean Vote of +0.5 PMV (27.5 °C ± 0.5 °C, 40% RH ± 5%). Participants reported thermal sensation after entering the chamber and at 5 min intervals after the first 20 min. A series of semantic differential bipolar adjective word pairs evaluated on a 7-point scale was also included in the questionnaire at two time points: upon entering the chamber (black curtain) and once more after the wall treatment was revealed (white or wood). Word pairs selected assessed visual, tactile, thermal, affective, and preferential qualities, and were based on previous investigations of the perception of wood and other materials [9,11].
Fifty-six participants were recruited and participated; data from 33 participants (14 female, 19 male; age 18–64) were included in the dataset analyzed (white, n = 15; wood, n = 18). Data validation was performed using questionnaire response timestamps, and four key experimental time points required response time accuracy: upon entering the chamber (black curtain), just before wall treatment reveal (black curtain), just after wall treatment reveal (white or wood), and 15 min after wall treatment reveal (white or wood). Participants were prompted to take each section of the questionnaire by an iPad timeclock alarm, but actual response timing relied on participants self-administering and self-advancing through segments of the full questionnaire. This method relied too heavily on participants for logistical timing and reliable data collection, resulting in a smaller analyzed sample size.

2.3. Statistical Analysis

All statistical analyses were conducted in R [31]. A Shapiro–Wilk test was used to determine sample distribution normality, and the Mann–Whitney U test was used to determine statistical significance.

3. Results

3.1. First Experiment

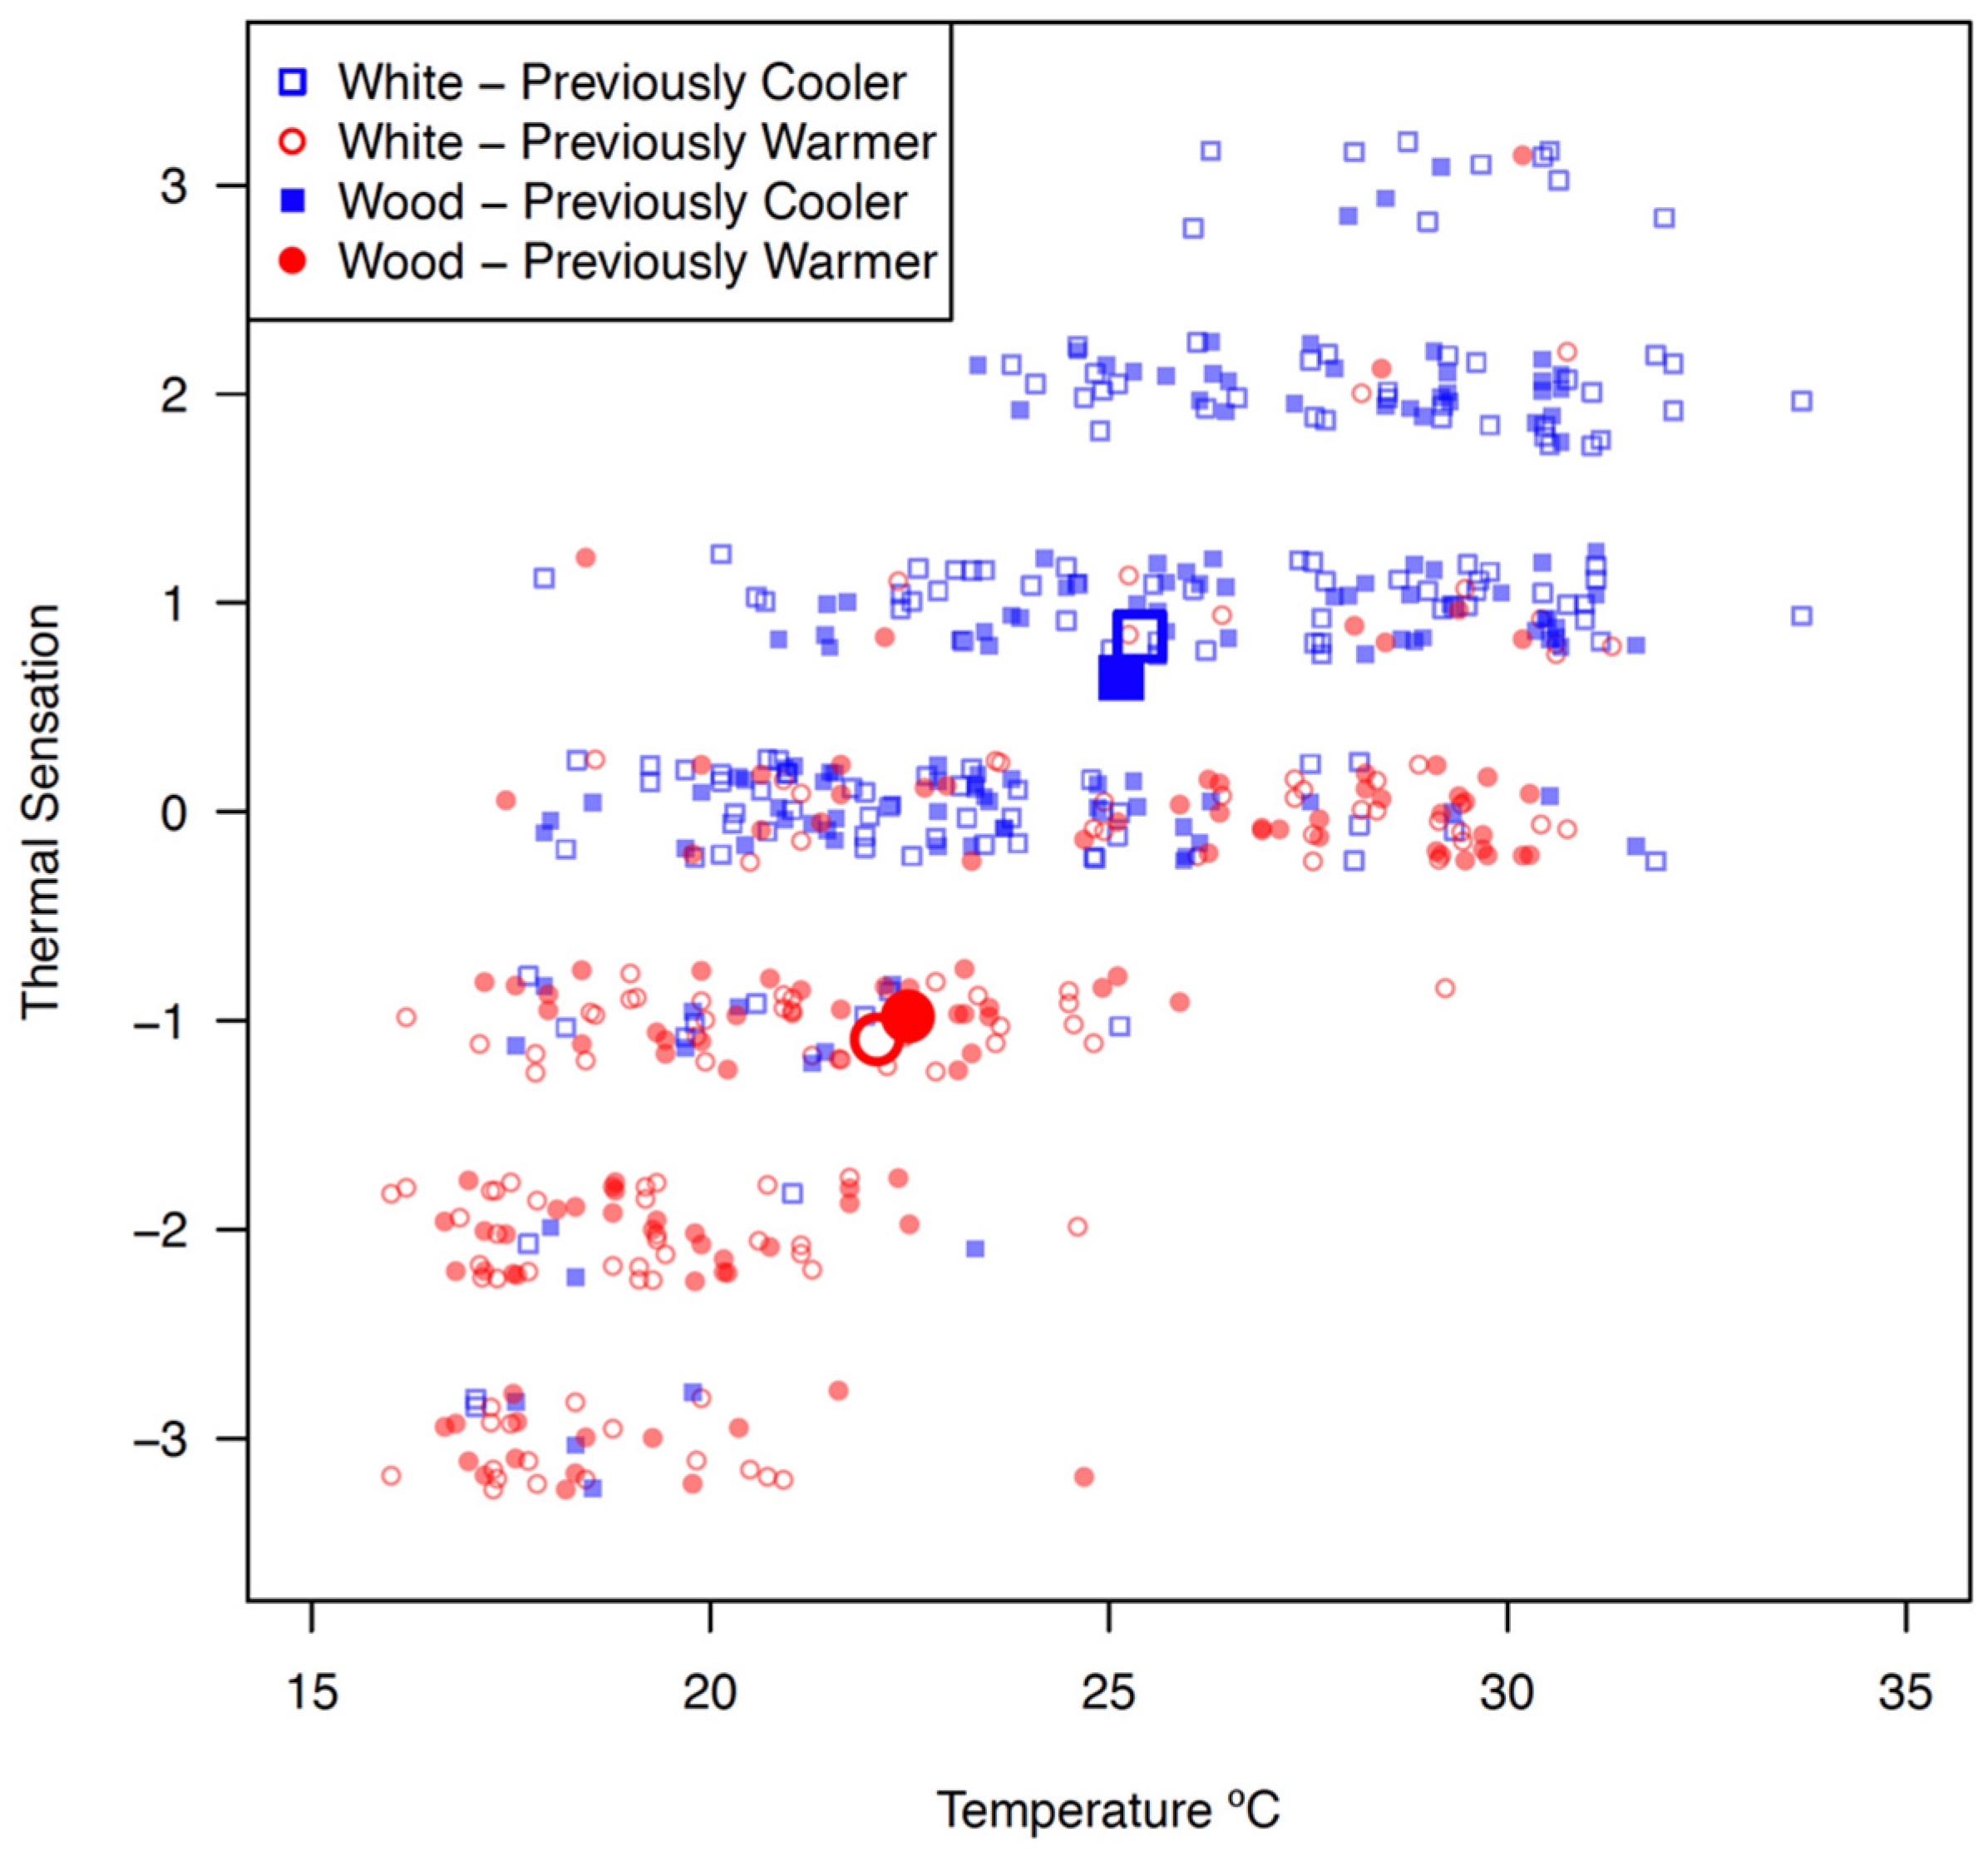
In the first experiment, air temperature in the chamber was continuously modulated and 29 participants experienced transient thermal comfort conditions, both above and below the comfort zone, and with both white and wood walls on different days. Figure 2 shows the Thermal Sensation Vote plotted by air temperature in the chamber at the time the subjective thermal comfort response was given in the white or wood-clad chamber. Additionally, it groups responses based on whether it was cooler or warmer in the chamber 15 min prior to the time the response was recorded. The type of wall treatment (white or wood) was not found to have a significant effect on perceived thermal comfort in the first experiment; however, the environmental conditions of the experiment demonstrate the impact thermal history has on current perceptions of thermal comfort.
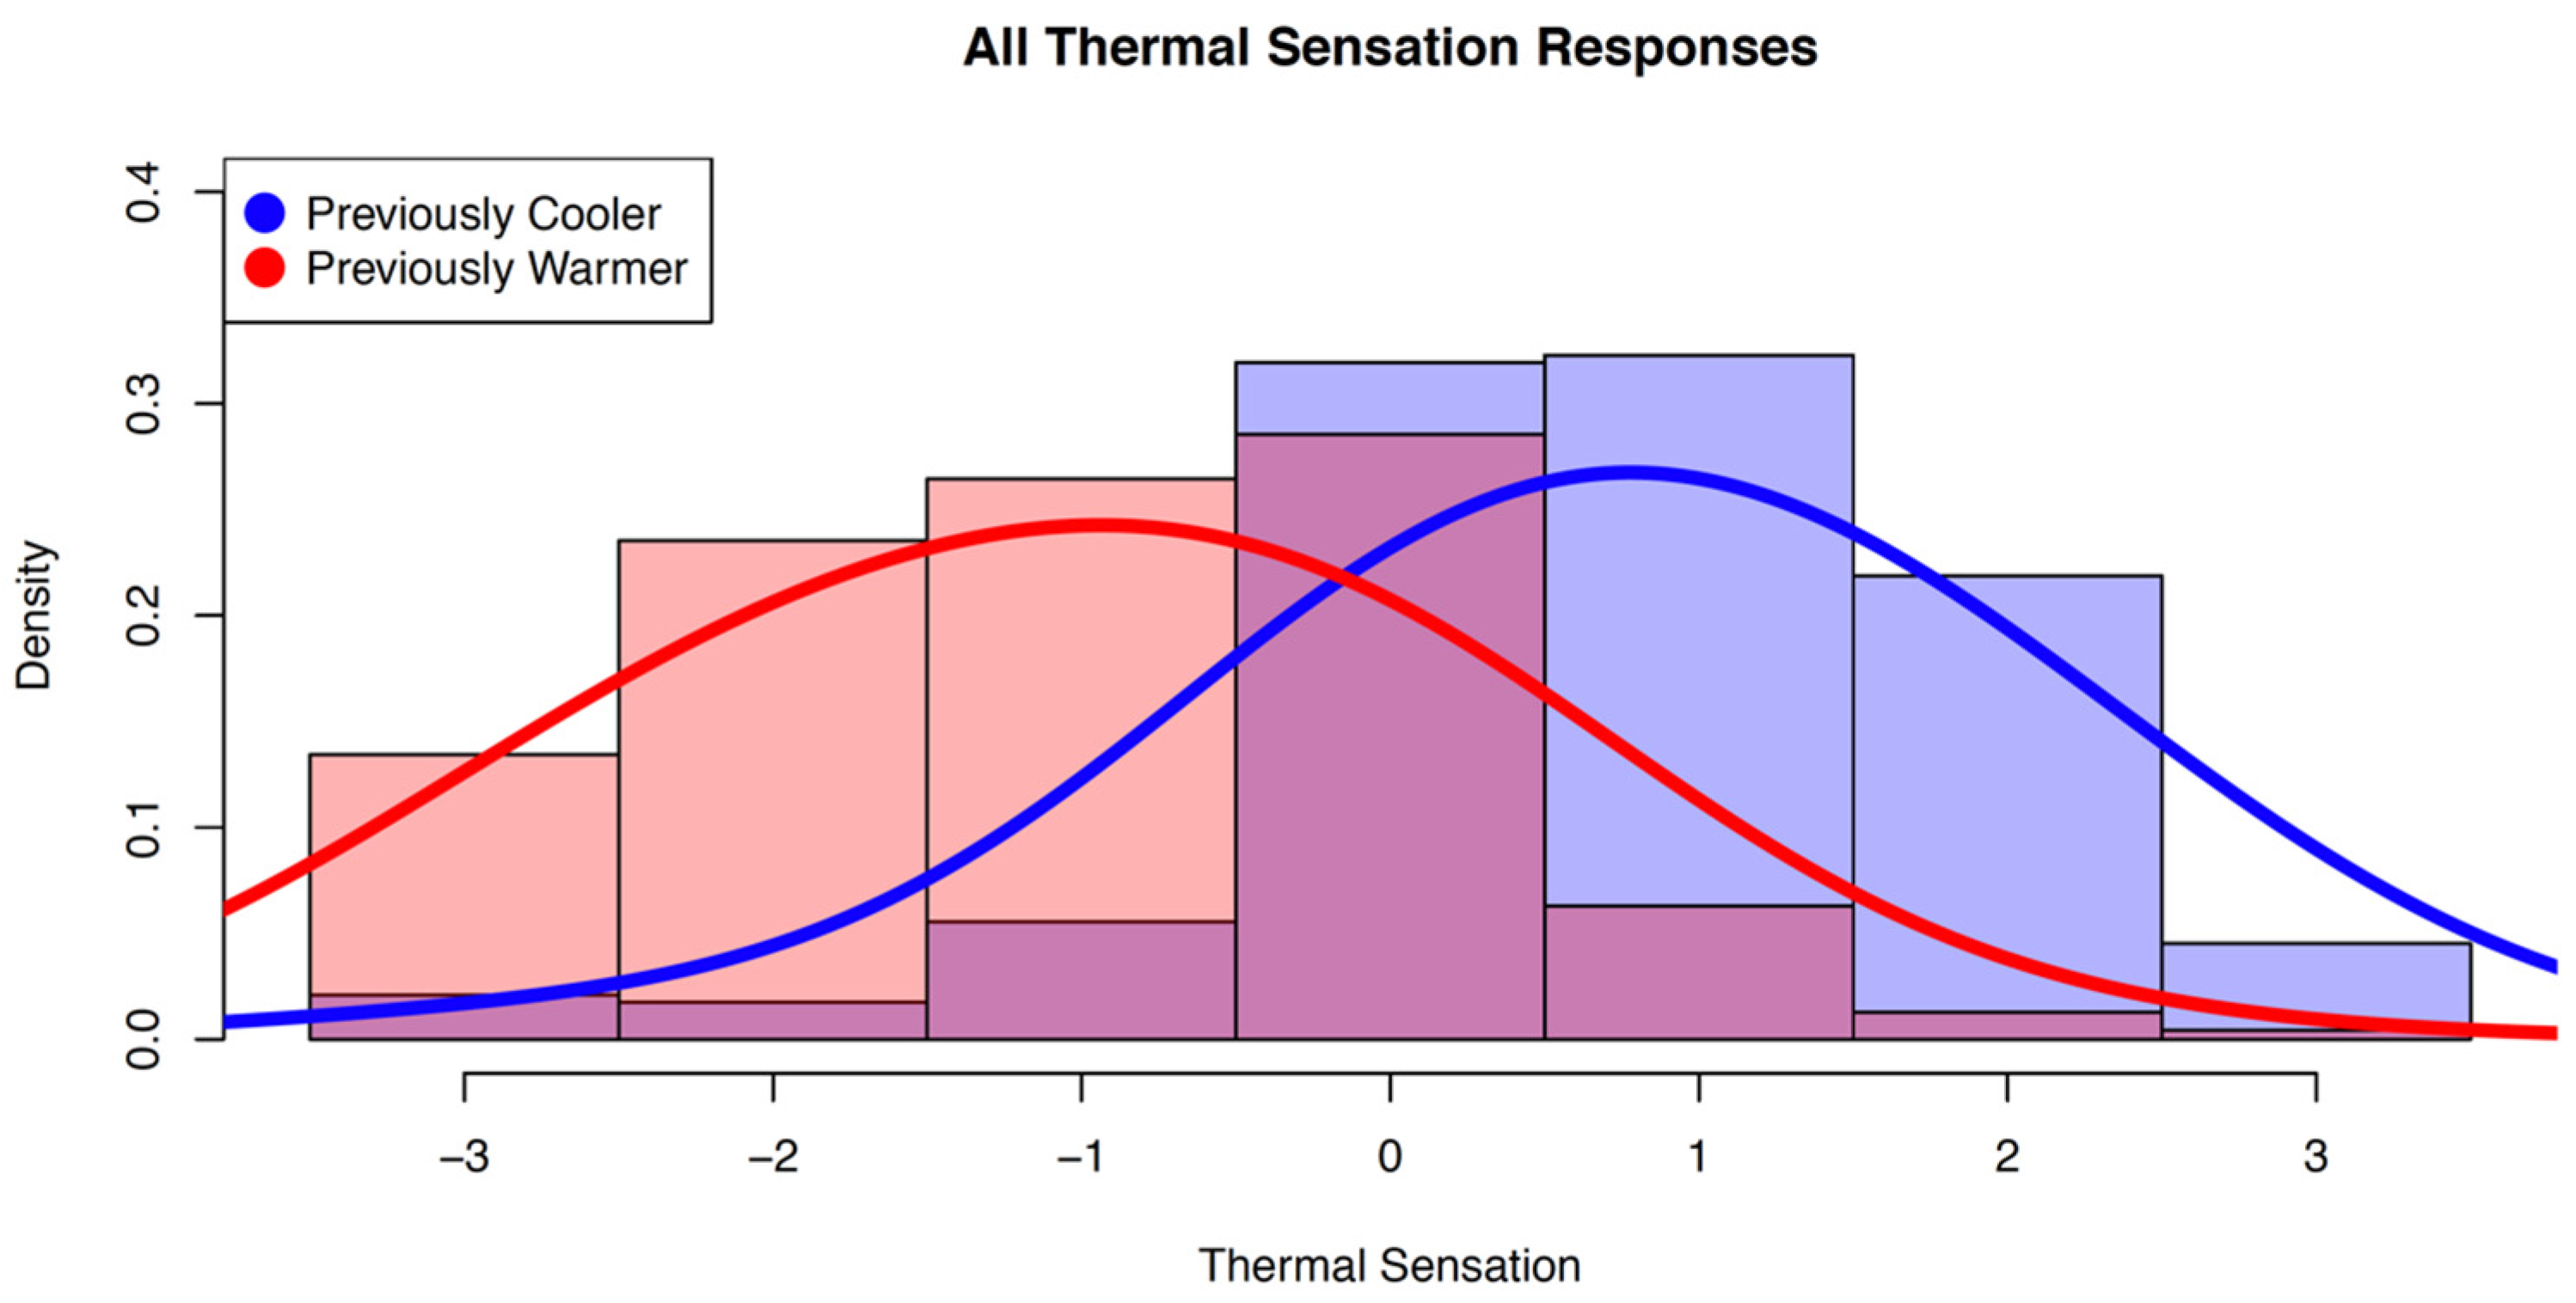
Irrespective of wood or white wall treatment type, thermal history played an important role in the perceived thermal comfort of participants in the first experiment under continuously modulating temperatures. Figure 3 shows the distribution of all TSV grouped by whether the air temperature was cooler or warmer than present 15 min prior to the participant response. Participants (N = 29) were more likely to feel slightly warm (Mdn = 1) if the environment was previously cooler, and more likely to feel slightly cool (Mdn = −1) if the temperature was warmer 15 min before (U = 10,228, p < 0.001).
Furthermore, the temperatures at which participants reported their thermal sensation as “neutral” (TSV = 0) were higher (Mdn = 27.3 °C) for those that had previously experienced warmer temperatures, and lower (Mdn = 22.8 °C) if they were previously exposed to cooler temperatures (U = 1497.5, p < 0.001). Figure 4 shows the temperature distribution when a “neutral” (TSV = 0) thermal sensation response was given and is grouped by thermal history being cooler or warmer.

3.2. Second Experiment

In the second experiment, a steady-state thermal environment equivalent to +0.5 PMV was maintained in the chamber. As participants acclimated to the thermal condition of the chamber, their visual surroundings within the chamber were altered, from a black curtain to either white or wood walls. Figure 5 shows the mean TSV at four key time points during the experiment. The change in mean TSV from just before the reveal of the wall treatment to after (5 min apart) resulted in a reduction of 0.44 TSV (Mdn ∆ = −1) for the group that viewed the wood walls (n = 18) and a reduction of 0.20 TSV (Mdn ∆ = 0) for the group that viewed the white walls (n = 15). However, the wood wall treatment was not found to have a significant effect over that of the white wall treatment on perceived thermal comfort in the second experiment (U = 94.5, p = 0.052 (one-tailed)). Additionally, any influence the difference in wall treatment may have had just after it was revealed appears to diminish after 15 min of exposure to the new visual surroundings near the end of the experiment.
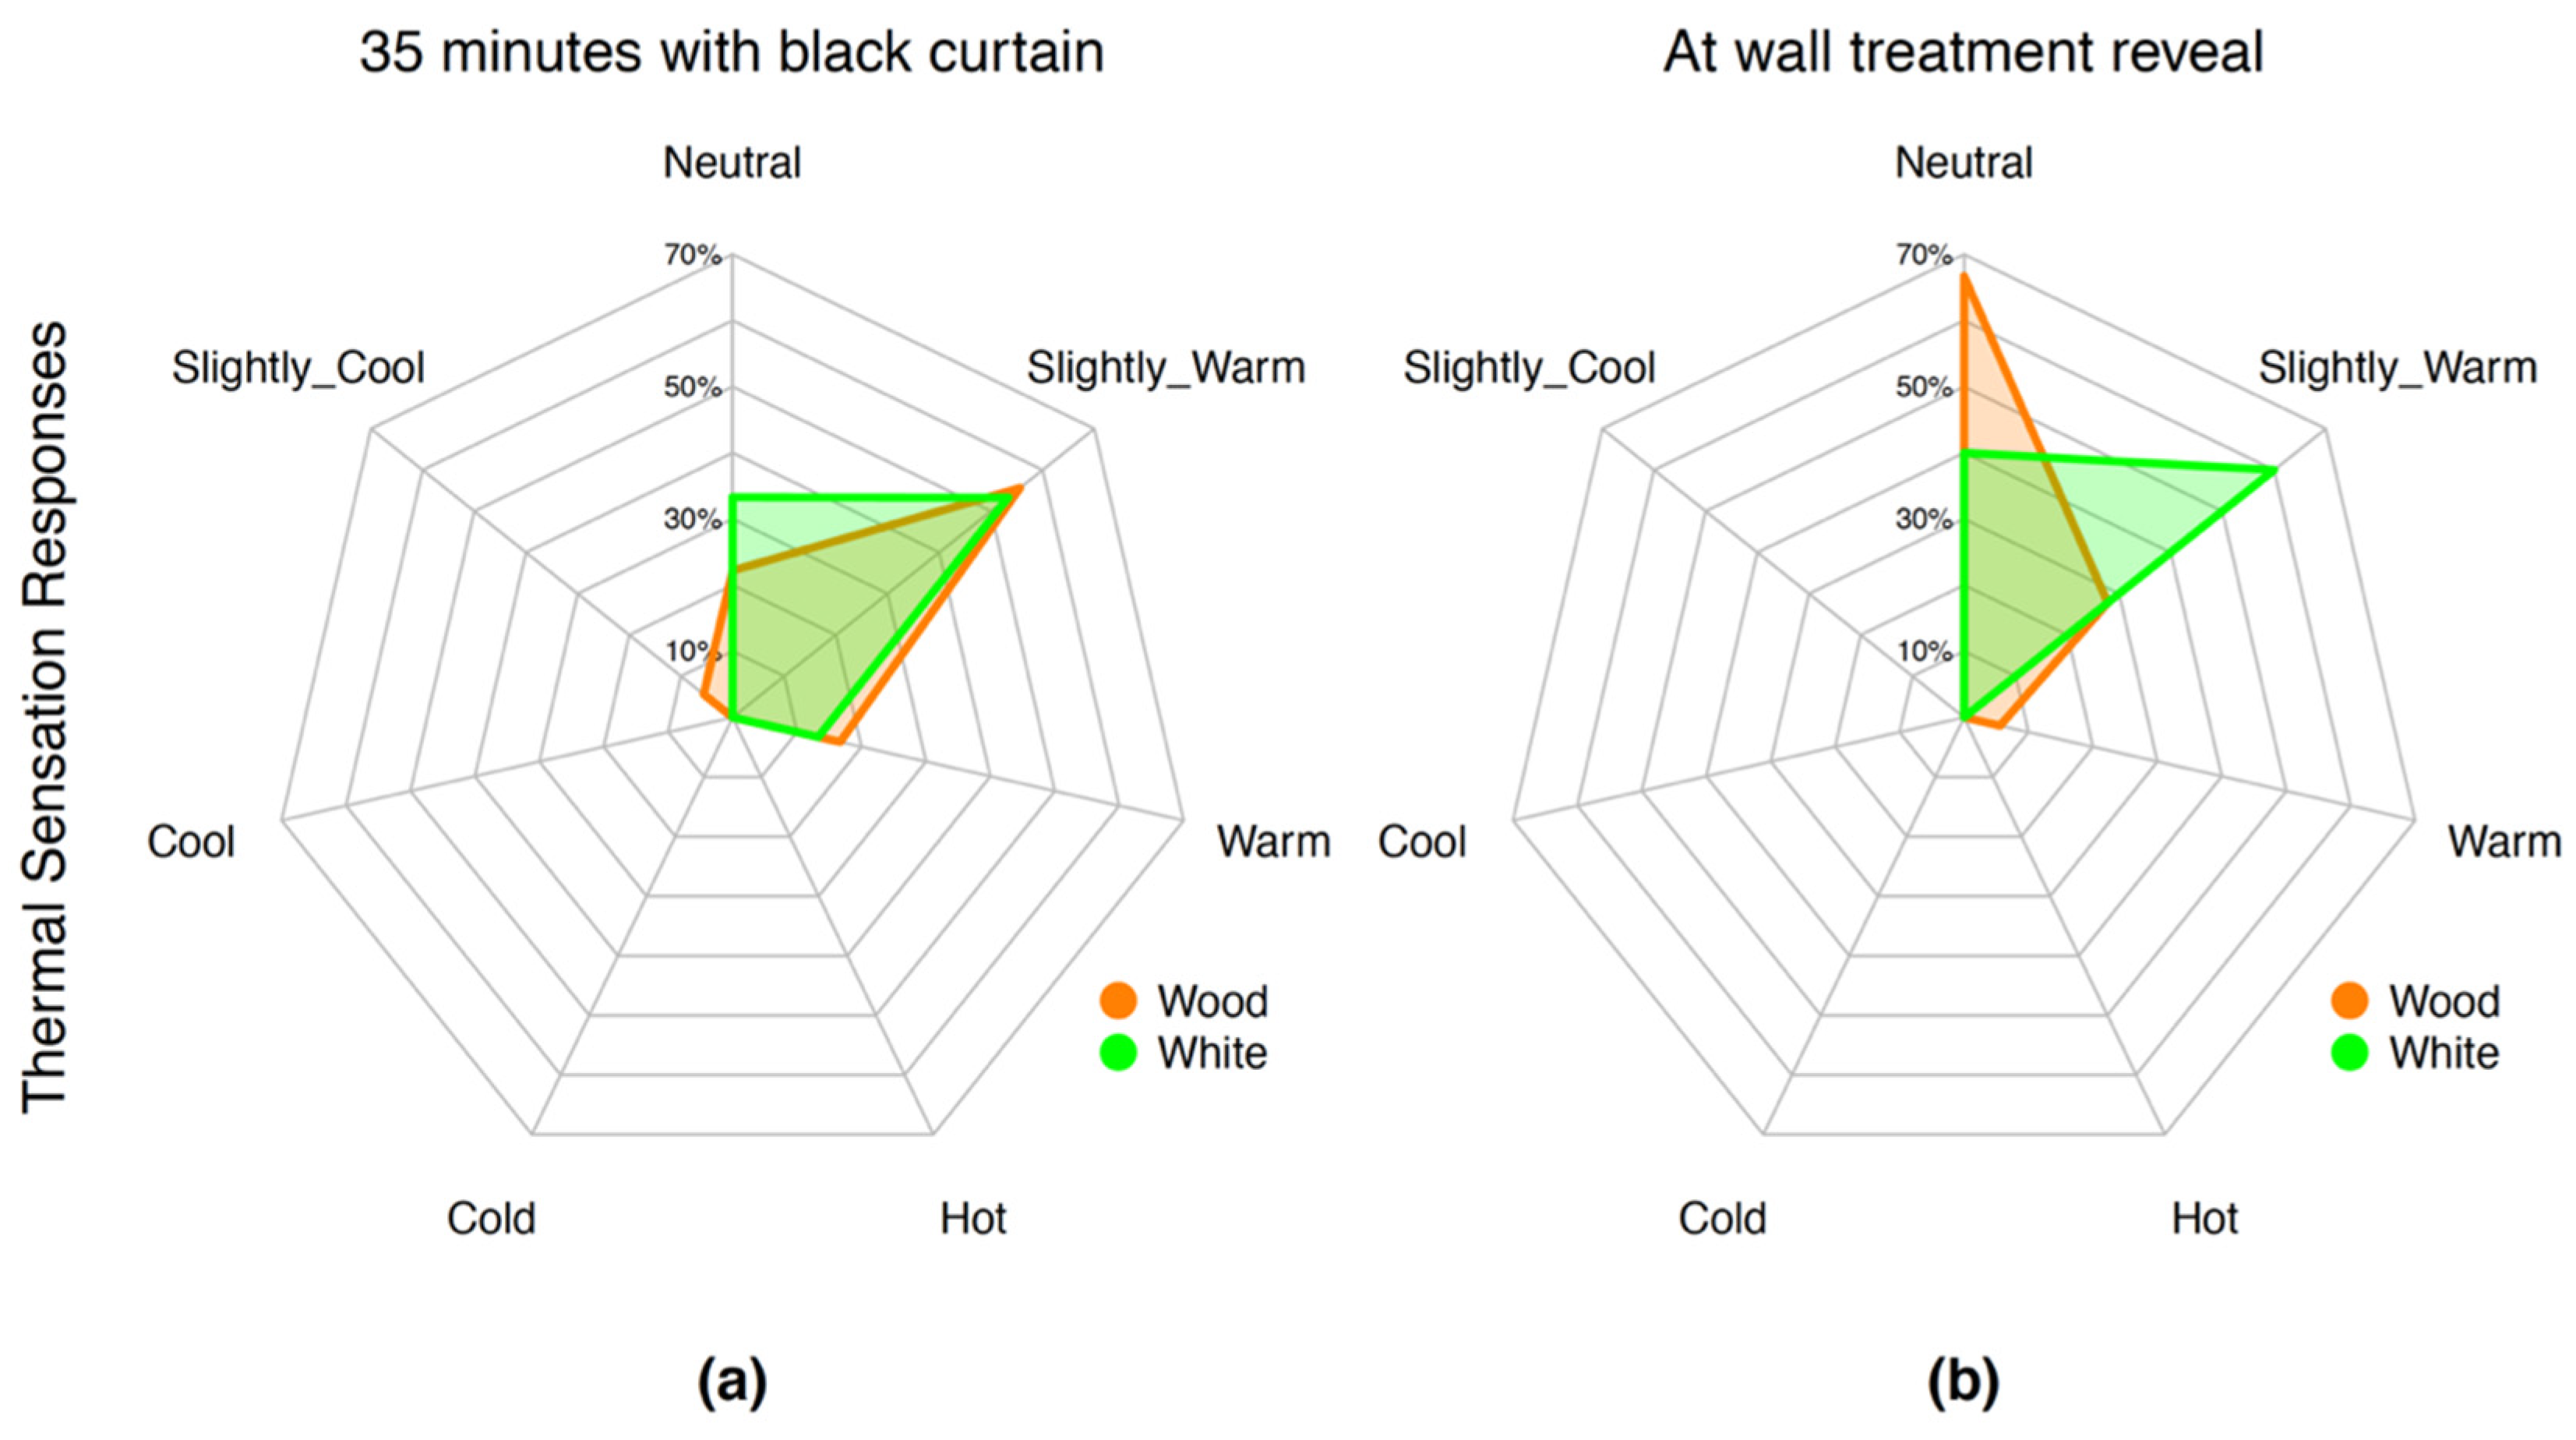
Thermal Sensation Vote response data are ordinal, and Figure 6 shows TSV responses before and after the wall treatment, revealing the percentage of each group (white or wood). The median and mode for both groups after 35 min in the chamber viewing the black curtain was “slightly warm” (TSV = +1). At the wall treatment reveal, the median and mode for the group viewing white walls remained unchanged; for the group viewing the wood walls, the median and mode changed to “neutral” (TSV = 0) with 66.7% of participants reporting this TSV after the reveal.
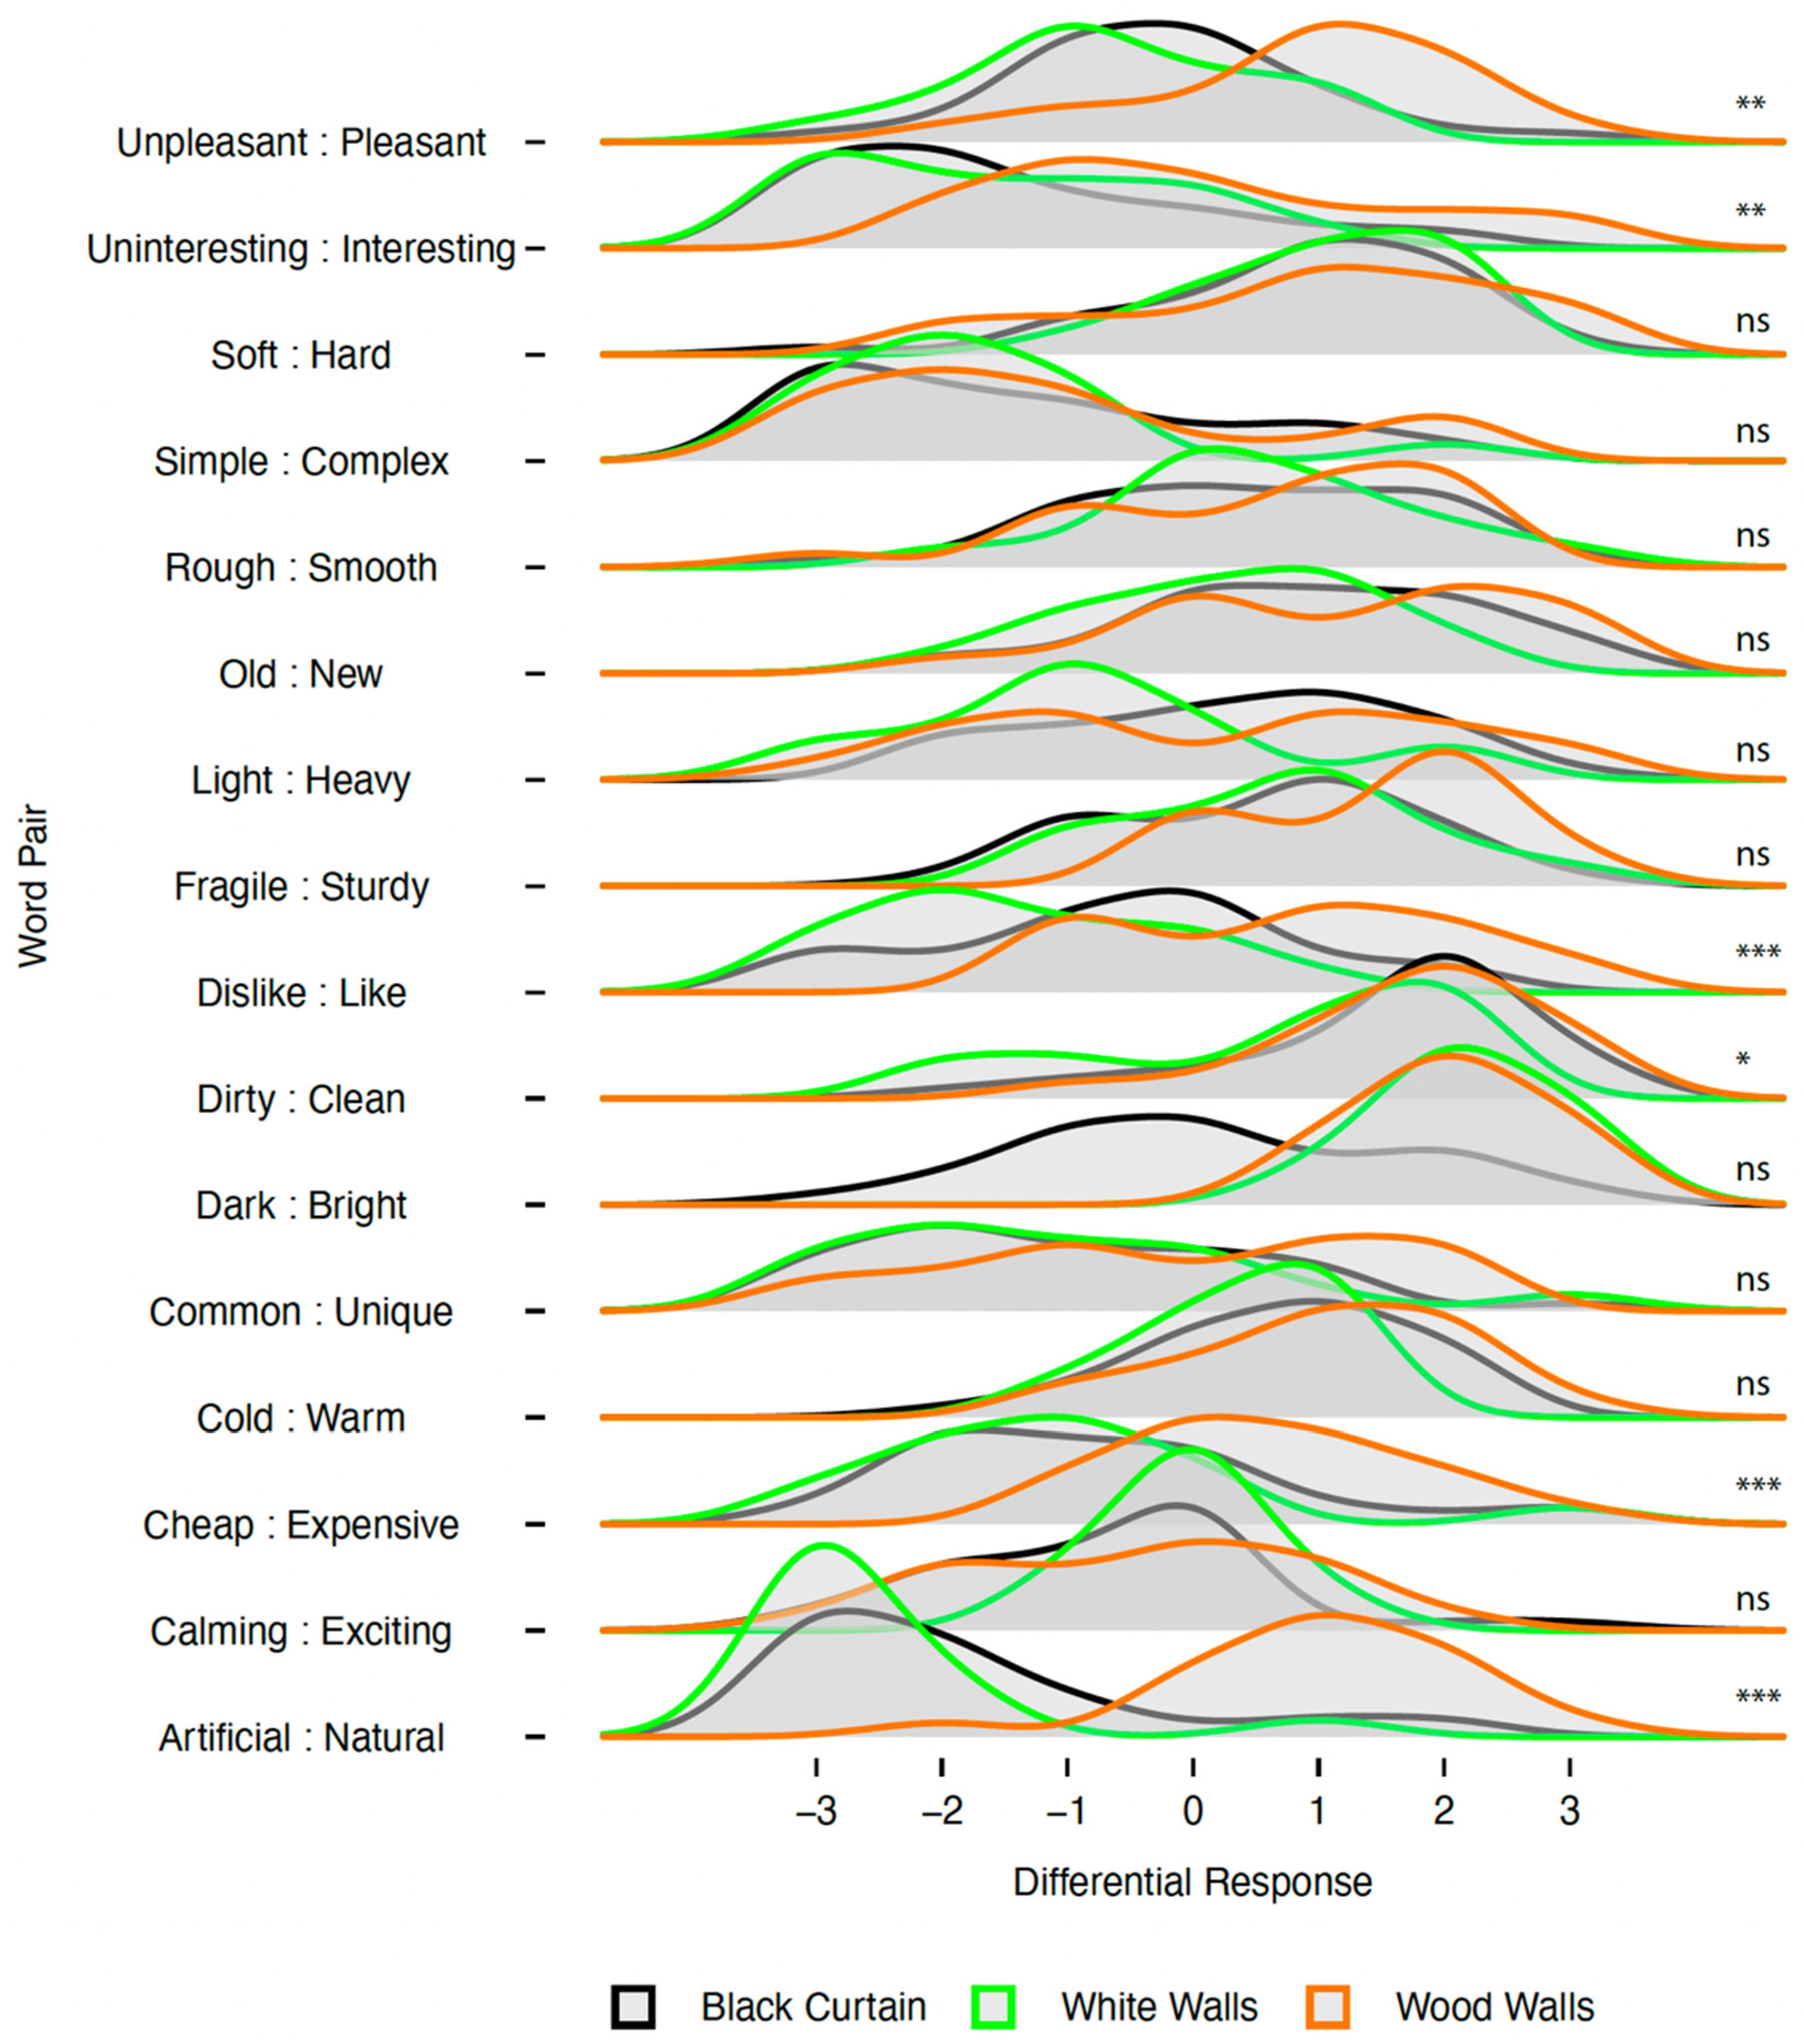
Upon entering the chamber during the second experiment, participants evaluated the black curtain condition using a series of 16 semantic differential bipolar adjective word pairs. The same word pairs were used to evaluate the wood or white wall condition once revealed. Figure 7 shows the distribution of the aggregate response from both groups (N = 33) for the black curtain, as well as distributions for the group that received the white walls (n = 15) and the group that received the wood walls (n = 18). When comparing white and wood wall treatments, 6 of 16-word pairs were found to result in a significant difference. The word pair “Artificial : Natural” received the greatest differential response between white (Mdn = −3; “Artificial”) and wood (Mdn = +1; “Natural”), (U = 10, p < 0.001). “Dislike : Like” had the next largest differential response between white (Mdn = −2; “Dislike”) and wood (Mdn = +1; “Like”), (U = 35, p < 0.001). Other word pairs resulting in a significant difference include: “Cheap : Expensive”, “Unpleasant : Pleasant”, “Uninteresting : Interesting”, and “Dirty : Clean”.

4. Discussion

The approach of the first experiment was to vary thermal comfort conditions over time, well outside the comfort zone and back again, while participants viewed distinctly different visual surroundings. The intent was to identify any effects that the wall treatment might have on subjectively perceived thermal comfort across a wide range of thermal conditions. This study design may have muted the potential influence of the wall treatment by overstimulating with thermal extremes. As a result of these dynamic experimental thermal conditions; however, it was possible to relate participant-reported current thermal sensation response and environmental temperature to the temperature 15 min prior. Participants were more likely to perceive their level of thermal comfort to be neutral (TSV = 0) when the thermal environment moved toward thermal neutrality than away from it, including at temperatures well outside the comfort zone.
These findings suggest that one’s thermal history influences the current perception of thermal comfort. This is consistent with step-change thermal comfort studies [26,27,28,29], where people physically move from one thermal environment to another, but applies most specifically to thermal comfort in spaces with one or more thermal comfort criteria that fluctuate throughout the day. This result suggests that building programmatic organization and HVAC system design may be able to utilize and advantage occupant thermal history and a transient thermal environment, potentially improving overall thermal comfort and/or reducing energy use.
The second experiment employed a steady-state thermal environment equivalent to +0.5 PMV. This is on the boundary of the ASHRAE standard comfort zone, and midway between the “neutral” (0) and “slightly warm” (+1) Thermal Sensation Vote options available to participants on the questionnaire. The intent was to present an either-or decision for participants who found themselves between the two choices. However, this also limits identifying actual thermal sensations for these individuals. The chosen thermal environmental conditions paired with ordinal data from the ASHRAE 7-point scale, and a small sample size may have posed limitations to the identification of an effect from the wall treatment in the second experiment. A researcher entering the chamber to pull back the curtain could have influenced several factors and subjective responses at the time point of the reveal, but this occurrence was consistent across both groups.
Revealing the white or wood walls from behind the black curtain elicited an initial reduction in mean TSV for both groups toward neutral, with the reduction for the group viewing the wood walls being about twice that of the group viewing the white walls. The difference in TSV reduction between the two groups was not found to be significant but would correspond to a perceived temperature difference of about 0.5 °C, holding all other thermal comfort criteria constant. The group with the larger reduction in TSV, viewing first the black curtain followed by wood walls, would correspond to about a 1 °C perceived temperature difference at the time of the reveal.
The difference in perceived thermal comfort between wall treatment types may be related to the attitude participants expressed toward these materials through the semantic differential bipolar adjective word pairs, where wood walls received a more positive response than white walls overall, and was significant for pairs such as “Dislike : Like” and “Unpleasant : Pleasant” that show clear visual preference. This aligns with findings in previous studies involving the appearance of wood [7,9]. Previous studies revealing visual stimuli, including wood, focused on a very short response period of 90 s [17,18]. TSV reported 15 min after the visual stimulus was revealed in this experiment supports that there is perhaps a short-term nature to the influence of our visual surroundings regarding perceived thermal comfort, and this is an area where more research is needed.

5. Conclusions

Subjective perceptions of thermal comfort with wood and white walls were investigated in transient and steady-state thermal environments using a climate chamber. The impact of thermal history during the transient thermal environment experiment was found to overwhelm any effect there might have been from the difference in the visual surroundings of the chamber. The steady-state experiment used a black curtain over the wall treatment prior to revealing either the wood or white walls. A difference in thermal sensation was observed between the two groups at the time of the reveal, with the group receiving the wood wall treatment moving closer to “neutral” from “slightly warm” than the group receiving the white walls, but this was not found to be statistically significant. Just after the wall treatment was revealed, a visual characteristic assessment of the two materials by participants identified several areas where wood walls were preferred over white walls. After 15 min with new visual surroundings, the difference between the reported thermal sensation of the two groups abated. Psychological and physiological response pathways to the visual stimulus of a natural material such as wood are complex, and the extent to which visible wood in indoor environments may influence our perceived state of thermal comfort is still not well understood.

Author Contributions

Conceptualization, D.G. and K.V.D.W.; methodology, D.G., J.S., M.F. and K.V.D.W.; validation, K.V.D.W.; formal analysis, J.S.; investigation, D.G., J.S., M.F. and K.V.D.W.; resources, D.G., J.S., M.F. and K.V.D.W.; data curation, D.G. and J.S.; writing—original draft preparation, D.G. and J.S.; writing—review and editing, D.G., J.S., M.F. and K.V.D.W.; visualization, J.S.; supervision, K.V.D.W.; project administration, K.V.D.W.; funding acquisition, K.V.D.W. All authors have read and agreed to the published version of the manuscript.

Funding

This research was funded by the United States Department of Agriculture, Agricultural Research Service [USDA ARS Agreement 58-0202-5-001].

Data Availability Statement

The de-identified data supporting the conclusions of this article will be made available by the authors on request.

Acknowledgments

The authors would like to acknowledge Stefano Shiavon at University of California, Berkeley, Pat Lombardi and Christopher Minson at University of Oregon for consultation during this project; and note that this research was conducted while author Denise (Blankenberger) Gravelle was a graduate student employed in the Energy Studies in Buildings Laboratory at the University of Oregon.

Conflicts of Interest

Author Denise (Blankenberger) Gravelle is currently employed by the company Quinn Evans. The remaining authors declare that the research was conducted in the absence of any commercial or financial relationships that could be construed as a potential conflict of interest.

References

  1. Leech, J.A.; Nelson, W.C.; Burnett, R.T.; Aaron, S.; Raizenne, M.E. It’s about time: A comparison of Canadian and American time–activity patterns. J. Expo. Sci. Environ. Epidemiol. 2002, 12, 427–432. [Google Scholar] [CrossRef] [PubMed]
  2. U.S. Energy Information Administration (EIA). Monthly Energy Review, U.S. Energy Flow. 2018. Available online: https://www.eia.gov/totalenergy/data/monthly/pdf/mer.pdf (accessed on 25 March 2020).
  3. International Energy Agency (IEA). 2019 Global Status Report for Buildings and Construction. Available online: https://www.unenvironment.org/resources/publication/2019-global-status-report-buildings-and-construction-sector (accessed on 25 March 2020).
  4. American Society of Heating, Refrigerating and Air Conditioning Engineers. ANSI/ASHRAE Standard 55-2017, Thermal Environmental Conditions for Human Occupancy; ASHRAE: Atlanta, GA, USA, 2017. [Google Scholar]
  5. De Dear, R.; Brager, G.S. Developing an adaptive model of thermal comfort and preference. ASHRAE Trans. 1998, 104, 145–167. [Google Scholar]
  6. Nikolopoulou, M.; Steemers, K. Thermal comfort and psychological adaptation as a guide for designing urban spaces. Energy Build. 2003, 35, 95–101. [Google Scholar] [CrossRef]
  7. Broman, N.O. Aesthetic properties in knotty wood surfaces and their connection with people’s preferences. J. Wood Sci. 2001, 47, 192–198. [Google Scholar] [CrossRef]
  8. Zhou, Y.; Zhao, X.; Feng, Y.; Xuan, C.; Yang, C.; Jia, X. Effects of Visual Perception of Building Materials on Human Emotional States and Cognitive Functioning in a Physical Learning Environment. Buildings 2025, 15, 1163. [Google Scholar] [CrossRef]
  9. Rice, J.; Kozak, R.A.; Meitner, M.J.; Cohen, D.H. Appearance wood products and psychological well-being. Wood Fiber Sci. 2007, 38, 644–659. [Google Scholar]
  10. Nyrud, A.Q.; Bringslimark, T.; Bysheim, K. Benefits from wood interior in a hospital room: A preference study. Archit. Sci. Rev. 2014, 57, 125–131. [Google Scholar] [CrossRef]
  11. Wastiels, L.; Schifferstein, H.N.; Heylighen, A.; Wouters, I. Relating material experience to technical parameters: A case study on visual and tactile warmth perception of indoor wall materials. Build. Environ. 2012, 49, 359–367. [Google Scholar] [CrossRef]
  12. Kardan, O.; Demiralp, E.; Hout, M.C.; Hunter, M.R.; Karimi, H.; Hanayik, T.; Yourganov, G.; Jonides, J.; Berman, M.G. Is the preference of natural versus man-made scenes driven by bottom–up processing of the visual features of nature? Front. Psychol. 2015, 6, 471. [Google Scholar] [CrossRef]
  13. Masuda, M. Visual characteristics of wood and the psychological images (in Japanese). Mokuzai Gakkaishi J. Jpn. Wood Res. Soc. 1992, 38, 1075–1081. [Google Scholar]
  14. Mogensen, M.F.; English, H.B. The Apparent Warmth of Colors. Am. J. Psychol. 1926, 37, 427–428. [Google Scholar] [CrossRef]
  15. Kim, S.; Jin, D.; Yun, B.Y.; Nam, J.; Kim, S. Assessing thermal comfort in wooden buildings: A visual perceptual analysis through physiological characterization. Energy Build. 2024, 324, 114918. [Google Scholar] [CrossRef]
  16. Kim, S.; Yun, B.Y.; Choi, J.Y.; Kim, Y.U.; Kim, S. Quantification of visual thermal perception changes in a wooden interior environment using physiological responses and immersive virtual environment. Build. Environ. 2023, 240, 110420. [Google Scholar] [CrossRef]
  17. Sakuragawa, S.; Miyazaki, Y.; Kaneko, T.; Makita, T. Influence of wood wall panels on physiological and psychological responses. J. Wood Sci. 2005, 51, 136–140. [Google Scholar] [CrossRef]
  18. Tsunetsugu, Y.; Miyazaki, Y.; Sato, H. Physiological effects in humans induced by the visual stimulation of room interiors with different wood quantities. J. Wood Sci. 2007, 53, 11–16. [Google Scholar] [CrossRef]
  19. Wu, Y.; Jiang, A.; Liu, H.; Li, B.; Kosonen, R. Climate chamber investigation of the effect of indoor thermal histories on thermal adaptation in different seasons. Energy Built Environ. 2024, 5, 455–463. [Google Scholar] [CrossRef]
  20. Buonocore, C.; De Vecchi, R.; Scalco, V.; Lamberts, R. Influence of recent and long-term exposure to air-conditioned environments on thermal perception in naturally-ventilated classrooms. Build. Environ. 2019, 156, 233–242. [Google Scholar] [CrossRef]
  21. Wu, Y.; Liu, H.; Chen, B.; Li, B.; Kosonen, R.; Jokisalo, J.; Chen, T. Effect of long-term thermal history on physiological acclimatization and prediction of thermal sensation in typical winter conditions. Build. Environ. 2020, 179, 106936. [Google Scholar] [CrossRef]
  22. Luo, M.; Ke, Z.; Ji, W.; Wang, Z.; Cao, B.; Zhou, X.; Zhu, Y. The time-scale of thermal comfort adaptation in heated and unheated buildings. Build. Environ. 2019, 151, 175–186. [Google Scholar] [CrossRef]
  23. Ning, H.; Wang, Z.; Ji, Y. Thermal history and adaptation: Does a long-term indoor thermal exposure impact human thermal adaptability? Appl. Energy 2016, 183, 22–30. [Google Scholar] [CrossRef]
  24. Jiang, Y.; Xie, Y.; Niu, J. Short-term dynamic thermal perception and physiological response to step changes between real-life indoor and outdoor environments. Build. Environ. 2024, 251, 111223. [Google Scholar] [CrossRef]
  25. Vellei, M.; Le Dréau, J. A novel model for evaluating dynamic thermal comfort under demand response events. Build. Environ. 2019, 160, 106215. [Google Scholar] [CrossRef]
  26. De Dear, R.J.; Ring, J.W.; Fanger, P.O. Thermal sensations resulting from sudden ambient temperature changes. Indoor Air 1993, 3, 181–192. [Google Scholar] [CrossRef]
  27. Nagano, K.; Takaki, A.; Hirakawa, M.; Tochihara, Y. Effects of ambient temperature steps on thermal comfort requirements. Int. J. Biometeorol. 2005, 50, 33–39. [Google Scholar] [CrossRef]
  28. Wu, Y.C.; Mahdavi, A. Assessment of thermal comfort under transitional conditions. Build. Environ. 2014, 76, 30–36. [Google Scholar] [CrossRef]
  29. Ji, W.; Cao, B.; Geng, Y.; Zhu, Y.; Lin, B. Study on human skin temperature and thermal evaluation in step change conditions: From non-neutrality to neutrality. Energy Build. 2017, 156, 29–39. [Google Scholar] [CrossRef]
  30. Rohles, F.H.; Wells, W.V. The role of environmental antecedents on subsequent thermal comfort. ASHRAE Trans. 1977, 83, 21–29. [Google Scholar]
  31. R Core Team. R: A Language and Environment for Statistical Computing; R Foundation for Statistical Computing: Vienna, Austria, 2017; Available online: https://www.R-project.org/ (accessed on 25 March 2020).
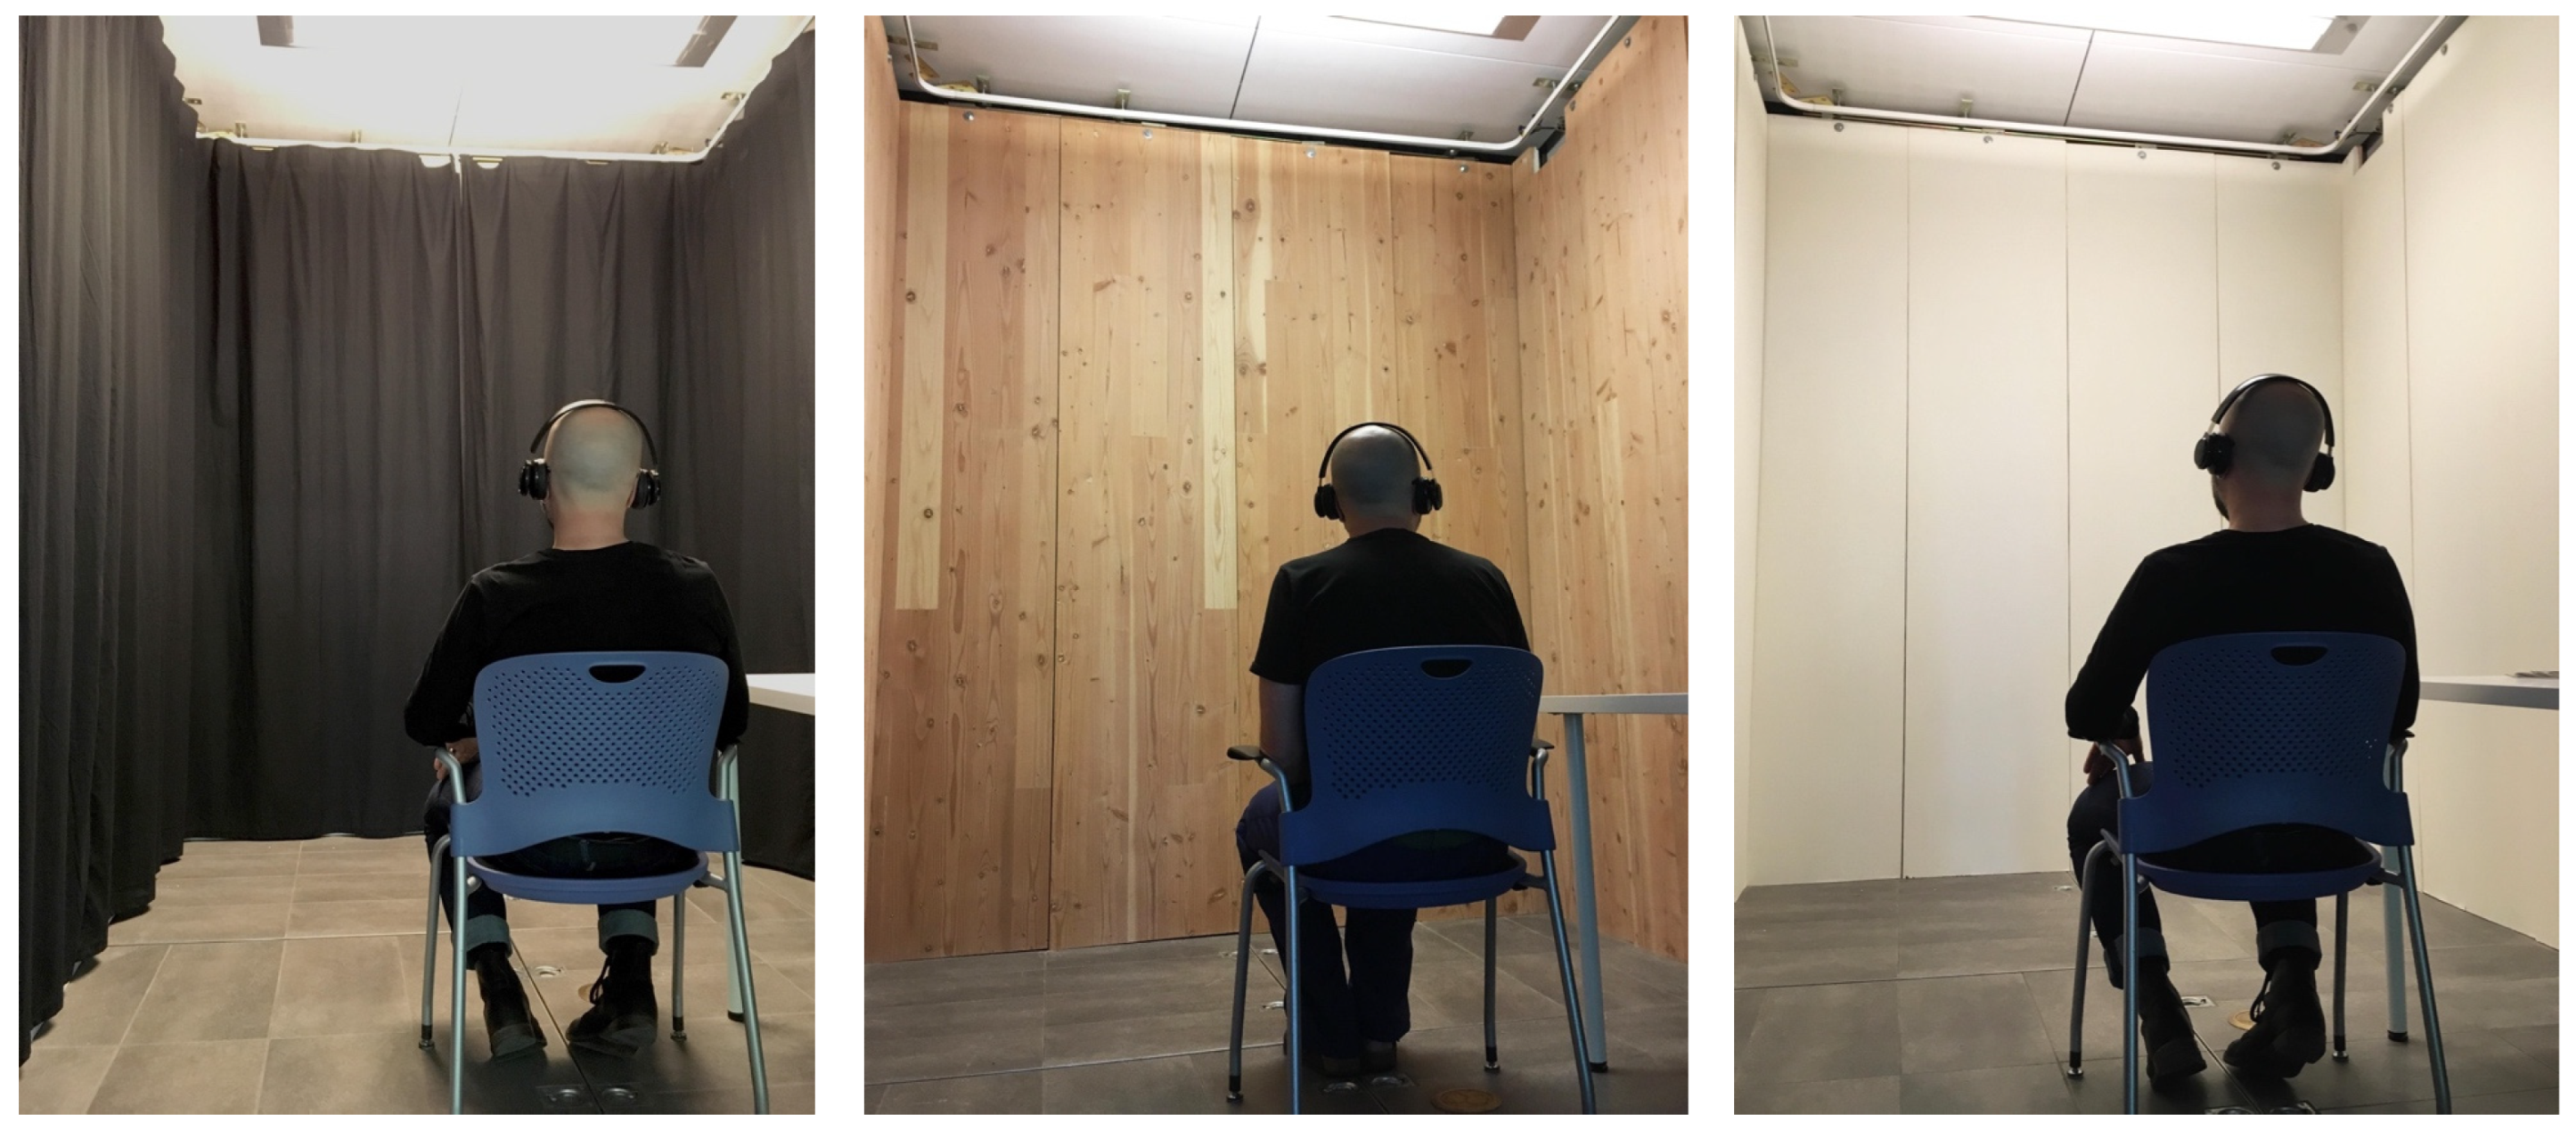
Figure 1. Second experiment. A researcher demonstrates the participant seating position in the climate chamber with the black curtain (left) that all participants viewed upon entering the chamber before either the wood (center) or white (right) wall conditions were revealed from behind the curtain.
Buildings 15 01698 g001
Figure 2. First experiment. Thermal Sensation Vote by temperature, grouped by wall treatment and whether it was previously cooler or warmer 15 min prior to response for all participants (N = 29). Large points indicate the group mean.
Buildings 15 01698 g002
Figure 3. First experiment. Distribution of all participant (N = 29) thermal sensation responses with transient temperature, grouped by previous temperatures being cooler (blue) or warmer (red) 15 min prior.
Buildings 15 01698 g003
Figure 4. First experiment. Air temperature for “neutral” (0) thermal sensation responses for all participants (N = 29) with transient temperature, grouped by previous temperatures being cooler (blue) or warmer (red) 15 min prior.
Buildings 15 01698 g004
Figure 5. Second experiment. Mean Thermal Sensation Vote (white, n = 15; wood, n = 18) over experiment runtime with steady-state thermal comfort conditions.
Buildings 15 01698 g005
Figure 6. Second experiment. Thermal sensation response by percentage (white, n = 15; wood, n = 18) with steady-state thermal comfort conditions and (a) black curtain and (b) at wall treatment reveal.
Buildings 15 01698 g006
Figure 7. Second experiment. Semantic differential word pair responses with steady-state thermal comfort conditions with black curtain (N = 33), and at treatment reveal of white walls (n = 15) or wood walls (n = 18). p values are indicated by ns, not significant (p > 0.05); * p < 0.05; ** p < 0.01; *** p < 0.001.
Buildings 15 01698 g007
Disclaimer/Publisher’s Note: The statements, opinions and data contained in all publications are solely those of the individual author(s) and contributor(s) and not of MDPI and/or the editor(s). MDPI and/or the editor(s) disclaim responsibility for any injury to people or property resulting from any ideas, methods, instructions or products referred to in the content.