Article

Research on Concrete Crack and Depression Detection Method Based on Multi-Level Defect Fusion Segmentation Network

1
School of Civil Engineering, Hubei University of Technology, Wuhan 430000, China
2
School of Environment and Civil Engineering, Dongguan University of Technology, Dongguan 523808, China
3
Faculty of Civil Engineering, Universiti Teknologi Malaysia, Skudai 81310, Johor, Malaysia
4
School of Mechanical Science, Engineering Huazhong University of Science and Technology, Wuhan 430074, China
*
Authors to whom correspondence should be addressed.
Buildings 2025, 15(10), 1657; https://doi.org/10.3390/buildings15101657
Submission received: 7 April 2025 / Revised: 2 May 2025 / Accepted: 8 May 2025 / Published: 14 May 2025
(This article belongs to the Special Issue Advanced Research on Cementitious Composites for Construction)

Abstract

:
Cracks and dents in concrete structures are core defects that threaten building safety, but the existing YOLO series algorithms face a huge bottleneck in complex engineering scenarios. Tiny cracks are susceptible to background texture interference, leading to misjudgment. The traditional detection frame has difficulty in accurately characterizing the dent geometry, which affects the quantitative damage assessment. In this paper, we propose a Multi-level Defect Fusion Segmentation Network (MDFNet) to break through the single-task limitation through the detection segmentation synergy framework. We improve the anchor frame strategy of YOLOv11 and enhance the recall of small targets by combining Copy–Pasting, and then enhance the pixel-level characterization of crack edges and dent contours by embedding the Head Attention-Expanded Convolutional Fusion Module (HAEConv) in U-Net with squeeze-and-excitation (SE) channel attention. Joint detection loss and segmentation loss are used for task co-optimization. On our self-constructed concrete defect dataset, MDFNet significantly outperforms the baseline model. In terms of accuracy, the MDFNet Dice coefficient is 92.4%, an improvement of 4.1 percentage points compared to YOLOv11-Seg. Our mean Intersection over Union (mIoU) reaches 81.6%, with strong generalization ability under complex background interference. In terms of engineering efficacy, the model achieves a processing speed of 45 frames per second (FPS) for 640 × 640 images, which is able to meet real-time monitoring requirements. The experimental results verify the feasibility of the model in the research field of crack and dent detection in concrete structures.

1. Introduction

Concrete is a basic building material that supports the core of buildings, bridges, and many other structures, with the main advantages of excellent durability, high strength, and versatility, making it an indispensable component for research on structural engineering [1,2]. The key to the overall performance and service life of structural engineering is the quality of the concrete surface, which may contain a variety of defects such as cracks, dents, etc., which are usually triggered by inappropriate factors such as mixing processes, pouring methods, curing conditions, and environmental exposures [3], and the long-term use of concrete structures is inevitably accompanied by defect detection and reinforcement [4,5] and maintenance at a later stage. Therefore, accurate detection and assessment of concrete surface defects are important in ensuring the structural integrity of buildings and infrastructure.
However, in practice, conventional inspection has many limitations in detecting concrete surface defects [6]. Visual inspection, despite being widely used [7], is highly dependent on the inspector’s experience and subjective judgment, which can easily lead to inconsistency in assessment results. Non-Destructive Testing (NDT) techniques, such as ultrasonic inspection and infrared thermography, although capable of providing more objective data, also face many challenges. These methods typically require long operating times and specialized equipment, are often less efficient when faced with inspecting large surface areas, and they often rely on manual data interpretation. In contrast, image-processing-based techniques show more advantages in detecting concrete surface defects. For example, edge-detection methods are capable of identifying the boundaries of objects in an image [8,9]; intensity-thresholding methods differentiate defective areas from normal ones by means of brightness thresholding [10]; and filters [11] and spectral analysis methods [12] allow for image segmentation. The application of these image techniques makes the process of detecting concrete surface defects more efficient while improving the accuracy and consistency of the detection.
On this basis, with the rapid development of the application of deep learning in defect detection, the use of convolutional neural network (CNN) methods is superior to traditional methods in defect detection [13]. Many classical and efficient network structures, such as ResNet [14] and U-Net [15], are widely used in many fields, and these networks have powerful feature extraction capabilities. It is worth noting that a multi-model synergistic strategy can further enhance the performance [16]; the AlexNet model [17] is used for training, and the robustness of sliding window detection is enhanced by combining probability maps and parameter optimization to achieve automated detection of concrete surface crack morphology in field environments. This method shows strong adaptability in practical application scenarios. In [18], the Faster R-CNN [19] algorithm is used to detect the crack region and is combined with tubularity flow field (TuFF) and distance transform method (DTM) algorithms to further locate the specific region. Although these algorithms show realistic results in crack segmentation, the detection effect of a single model is still unsatisfactory, suggesting that multi-model synergy may be the key to improving the performance, and this idea of optimizing the network structure inspired subsequent research. In [20], crack segmentation performance was evaluated by comparing four deep learning models. The experimental findings indicate that the model utilizing U-Net in conjunction with SENet [21] as the encoder backbone demonstrates superior overall performance. This suggests that choosing the appropriate network structure is crucial for improving the detection accuracy. The segmentation principle of U-Net is particularly suitable for pixel-level identification of complex surface defects. In [22], a crack classification and segmentation method based on custom CNN and U-Net models is proposed and optimized in conjunction with a laser calibration strategy. The synergistic application of multiple techniques significantly improves the detection performance and becomes an efficient integrated solution. However, combining the above schemes, there are still some challenges: (1) Balance between accuracy and efficiency: traditional image processing methods are computationally efficient but find it difficult to deal with complex morphological defects; and the computation time of deep learning models is generally more than 200 ms/frame. (2) Multi-scale defect detection: the recall rate of the Faster R-CNN for small defects (area < 50 px2) is less than 40%. (3) Adaptation to the actual scene: the detection accuracy of the existing methods decreases by more than 25% under the interference of strong noise and shadows.
In the field of target detection, the YOLO family of models (e.g., YOLOv5, YOLOv6 [23], and YOLOv7 [24]) has become a popular mainstream framework. These models are able to accurately locate the target and have excellent recognition of defects with irregular shapes and complex distributions. The YOLO family of frameworks is extremely efficient and robust and is able to accurately identify the target while ensuring the detection speed. In [25], real-time detection of fruit posture was achieved by optimizing the YOLOv5 algorithm and combining it with transfer learning methods, verifying the flexibility and practicality of the YOLO model in different application scenarios. YOLOv3 and YOLOv5 perform well in the target detection task, but they have limited recognition of small defects, and the single detection mechanism lacks the ability to model the spatial structure of the defective region and contextual information in depth, leading to weak robustness of detection in complex backgrounds.
Therefore, this paper proposes a novel accurate framework for concrete structural defect detection that can effectively solve these problems. The main contributions of this paper are as follows:
(1)
An innovative deep learning model, Multi-level Defect Fusion Segmentation Network (MDFNet), combined with an improved U-shaped structure and target detection technique, is proposed to achieve efficient and accurate concrete defect detection.
(2)
The HAEConv module and SE module are introduced for feature enhancement, which improves the model’s ability to identify defective regions, such as cracks and dents, and optimizes jump connections to enhance the fusion of global features with local details. YOLOv11 is used for target detection and is combined with the Copy–Pasting strategy to optimize the segmentation task, which effectively improves the segmentation accuracy and enhances the bounding box accuracy of the target detection branch, achieving two-way optimization. And the Copy–Filing strategy reduces reliance on large amounts of data, to a certain extent.
(3)
A high-quality dataset covering different kinds of concrete defects is constructed and experimentally verified under multiple complex backgrounds, which provides reliable data support for subsequent research. The effectiveness of the proposed method is verified through experimental analyses, and the results show that MDFNet outperforms the existing methods in several evaluation metrics, especially in defect segmentation accuracy, which provides an efficient and robust solution for detecting concrete surface defects in complex scenarios.

2. Related Works

In recent years, defect detection methods based on different technical routes have emerged one after another. Based on the CNN basic method: research with a convolutional neural network as the core continues to optimize the feature extraction capability and significantly improves the segmentation effect by enhancing the crack edge features. Based on YOLO series improvement: the real-time advantage of the target detection framework is widely used. A Visual Attention Network (VAN) and Large Convolutional Attention Module (LCA) [26] are introduced into the YOLOv8 model, which effectively improves the local feature adaptation of concrete surface cracks. Innovative applications based on Transformer: with the breakthrough of Transformer [27] in the field of NLP, its global modelling capability is introduced to visual tasks. Vision Transformer [28] and Swin Transformer [29] convert images to sequence inputs by Patch Embedding, In that paper [30] design boundary-aware modules to dynamically adjust feature dimensions to focus on crack details. Methods based on the combination of CNN segmentation framework and Transformer [31,32] combine the local modelling capability of CNN with the global modelling capability of Transformer through a two-branch structure, thus significantly improving the segmentation accuracy while maintaining the computational efficiency.
Despite the progress made by the above methods, there are still inherent limitations in the different technical routes; CNN-based methods, which rely on local convolutional operations, are inadequate for global feature modelling. With YOLO-based methods, the anchor frame mechanism leads to missed detection of tiny defects. Transformer-based methods come with high computational complexity and lack of spatial a priori knowledge. In order to balance the advantages of different techniques, this study proposes a two-branch fusion architecture, where the detection branch enhances the localization accuracy by improving the anchor frame generation strategy of YOLO and combining it with the attention mechanism. The segmentation branch enhances the crack detail restoration ability by fusing the jump connection and boundary sensing module of U-Net. Cross-branch interaction achieves fine-grained segmentation guided by the detection frame through the feature alignment module to solve the complex texture and small target detection problem.

3. Methodology

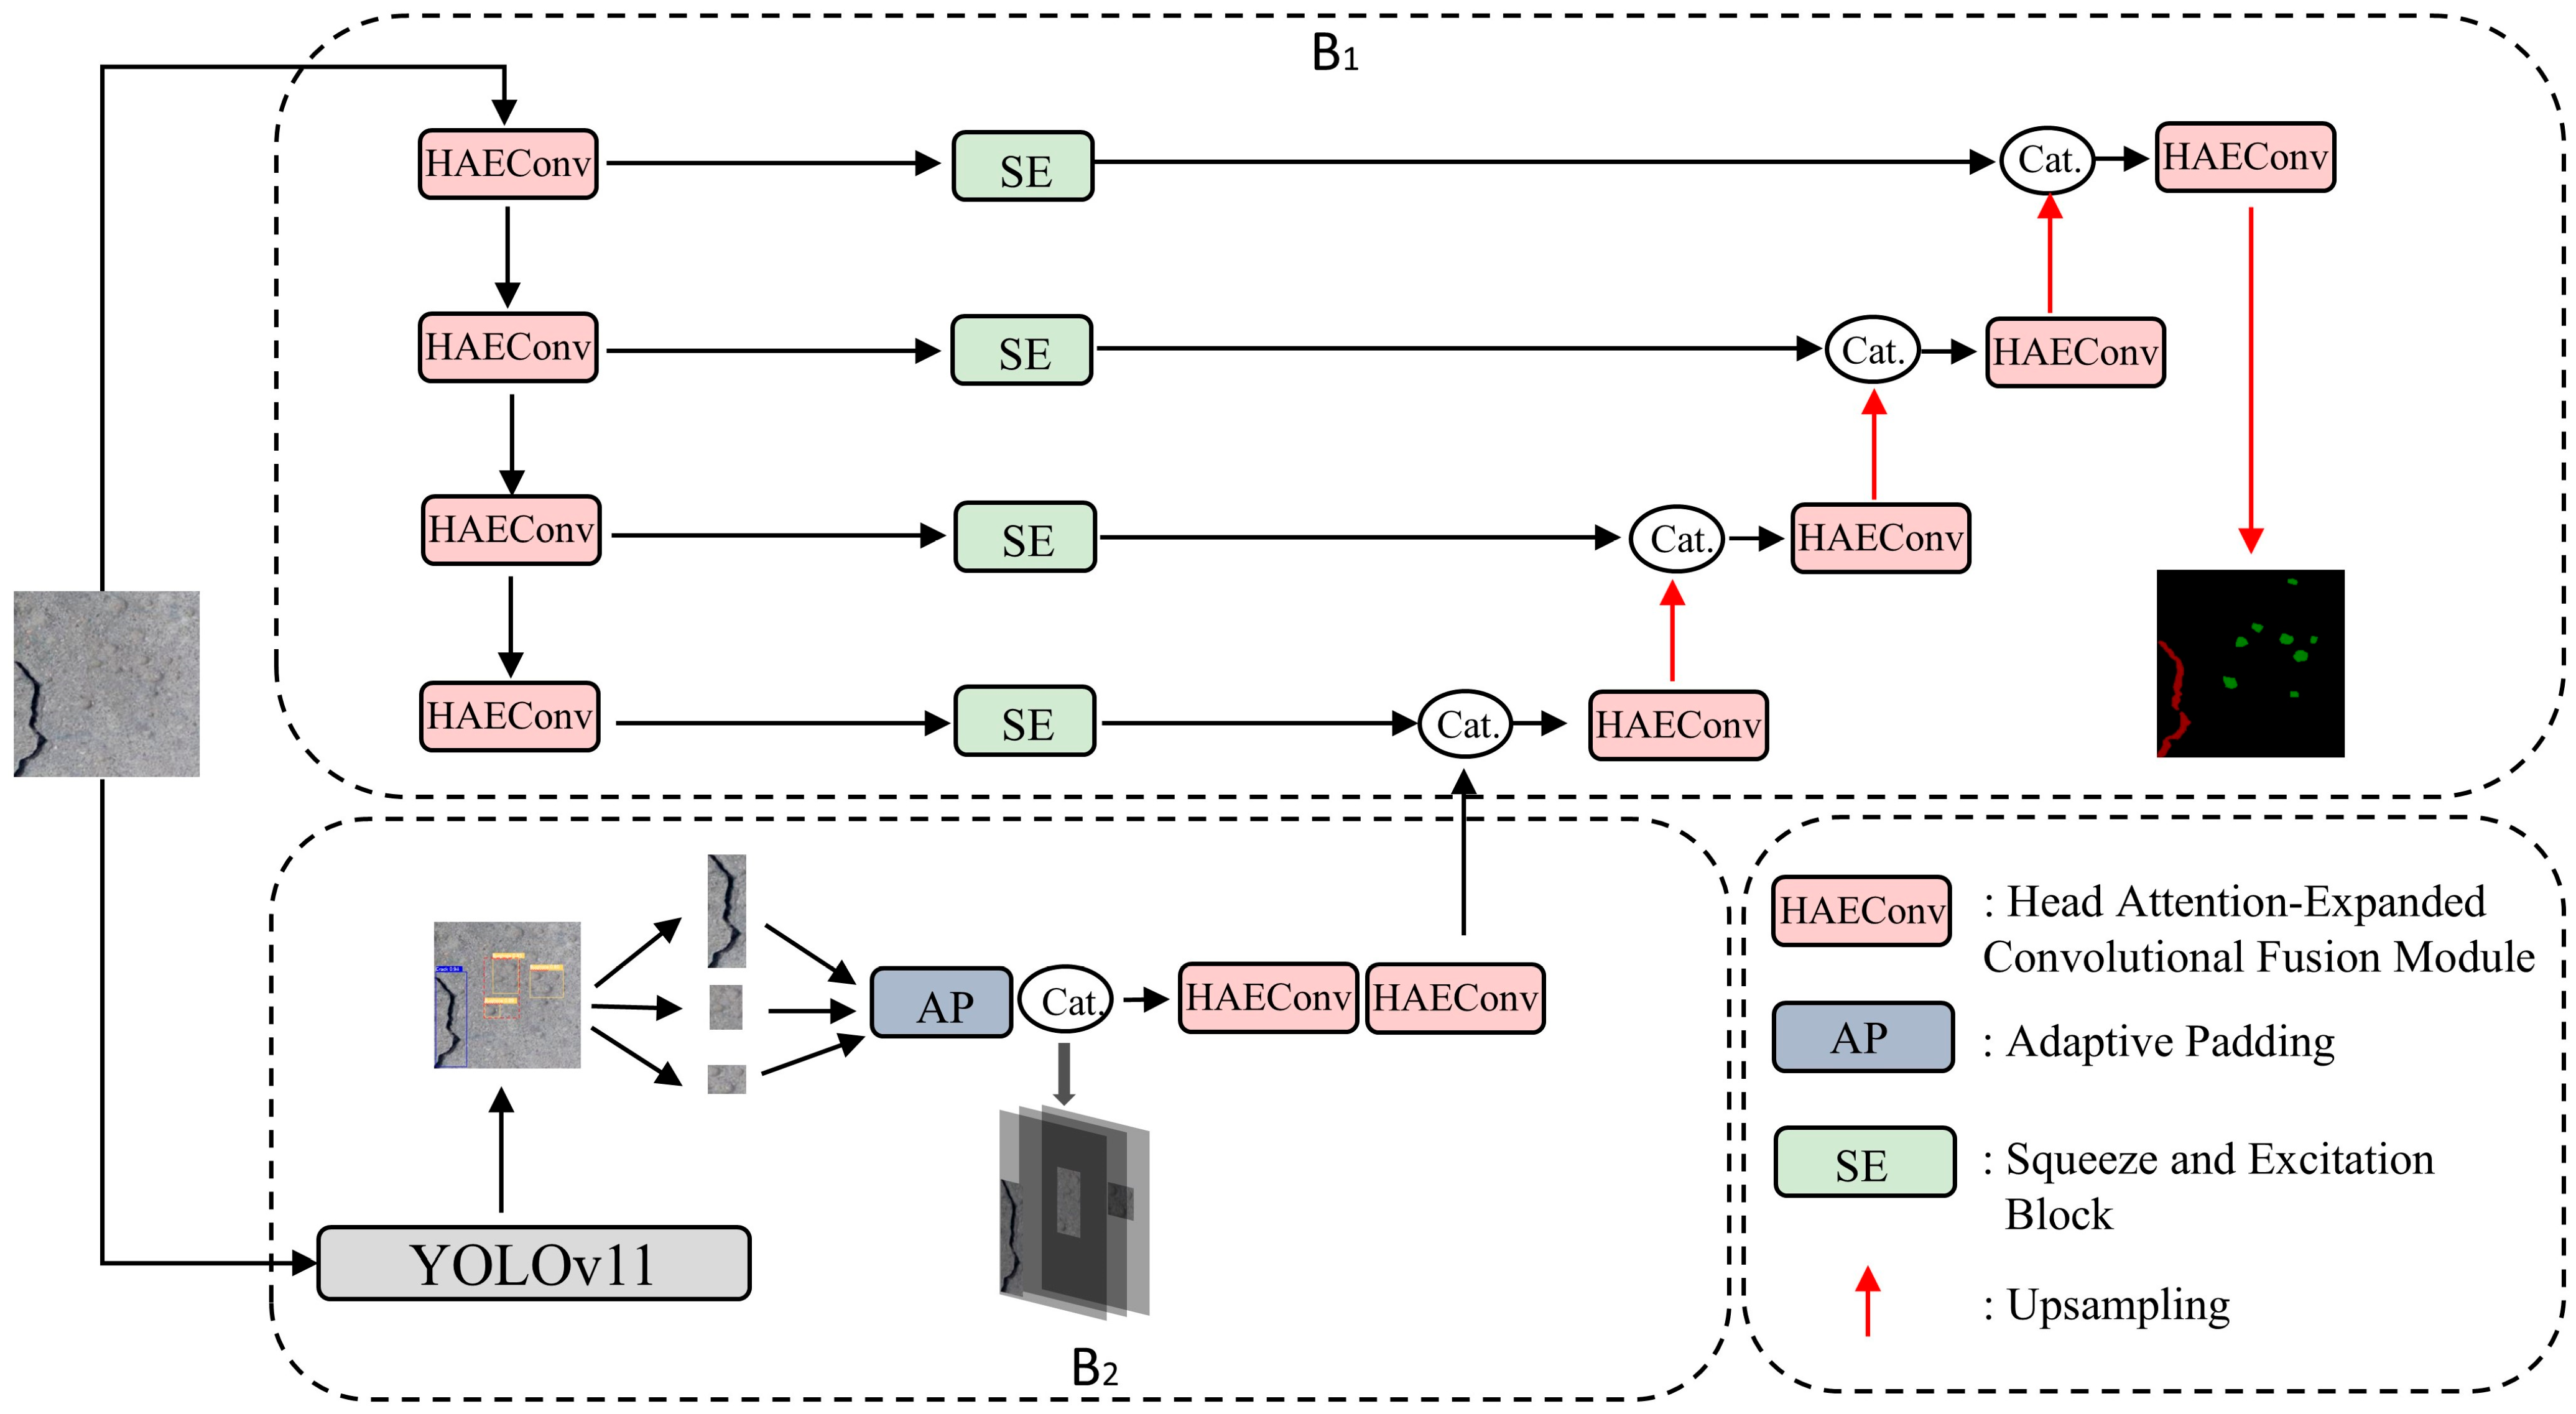
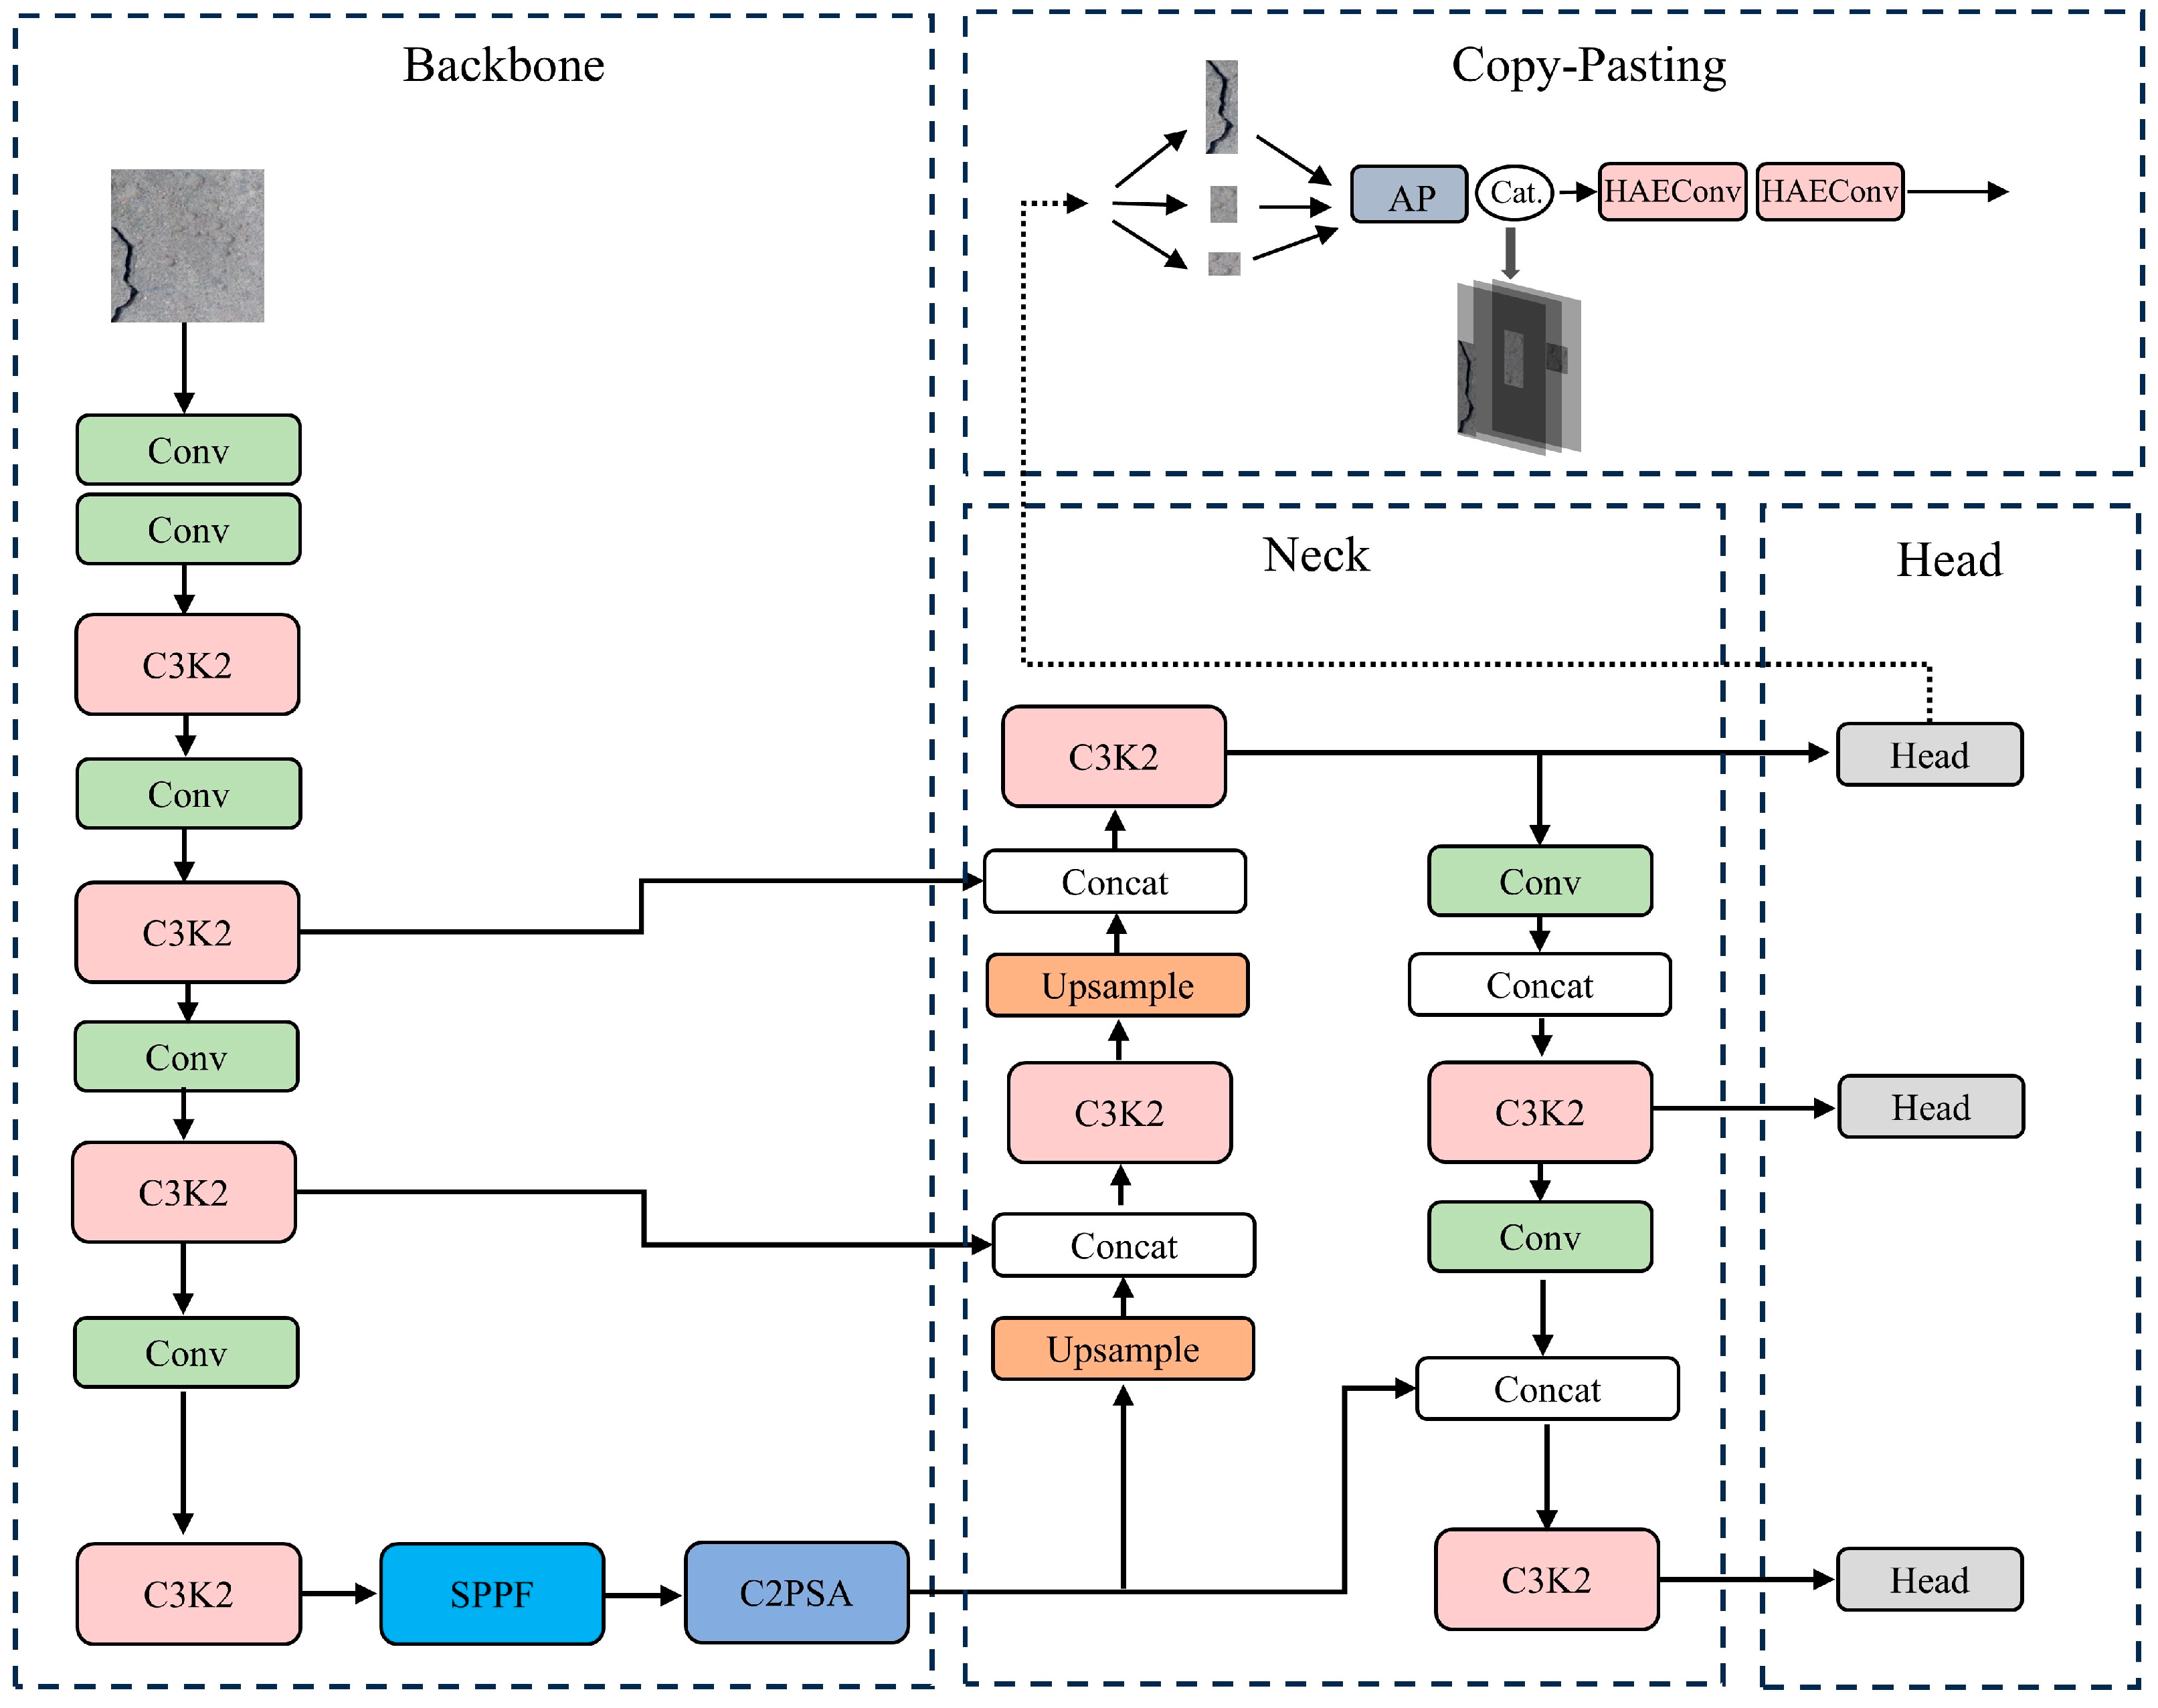
3.1. Multi-Level Defect Fusion Segmentation Network

Our approach is based on the improved segmentation model MDFNet, which significantly enhances the segmentation performance through a modular design combined with an improved U-shaped structure and target detection techniques. As shown in Figure 1, Module B1 is based on the improved U-shaped network. The HAEConv module, which incorporates convolution and multi-head attention mechanisms, is adopted as the core HAEConv module, which combines convolution and multi-attention mechanism and is adopted as the core feature extraction unit. The SE module is introduced to optimize the jump connection, which achieves the balance between global feature modelling and local detail capturing. Module B2 carries out the detection of defective regions through the pre-trained YOLOv11 model. YOLOv11 is used to locate the bounding boxes of cracks and dents, which provides global contextual cues for the segmentation branch and effectively improves the attention of the segmentation task to the target region; at the same time, the pixel-level information generated by the segmentation branch is able to optimize the accuracy of the bounding boxes of the target detection branch through region correction, achieving bidirectional enhancement. The YOLOv11 model combines the Copy–Pasting strategy to crop, process and splice the target region. In order to enhance the model’s ability to model global contextual information, we design the C3A module, which is a fusion of convolution and the multi-head attention mechanism, and use it as the core unit of encoder and decoder responsible for multi-scale feature extraction and reconstruction, which ensures the effective use of multi-scale information.

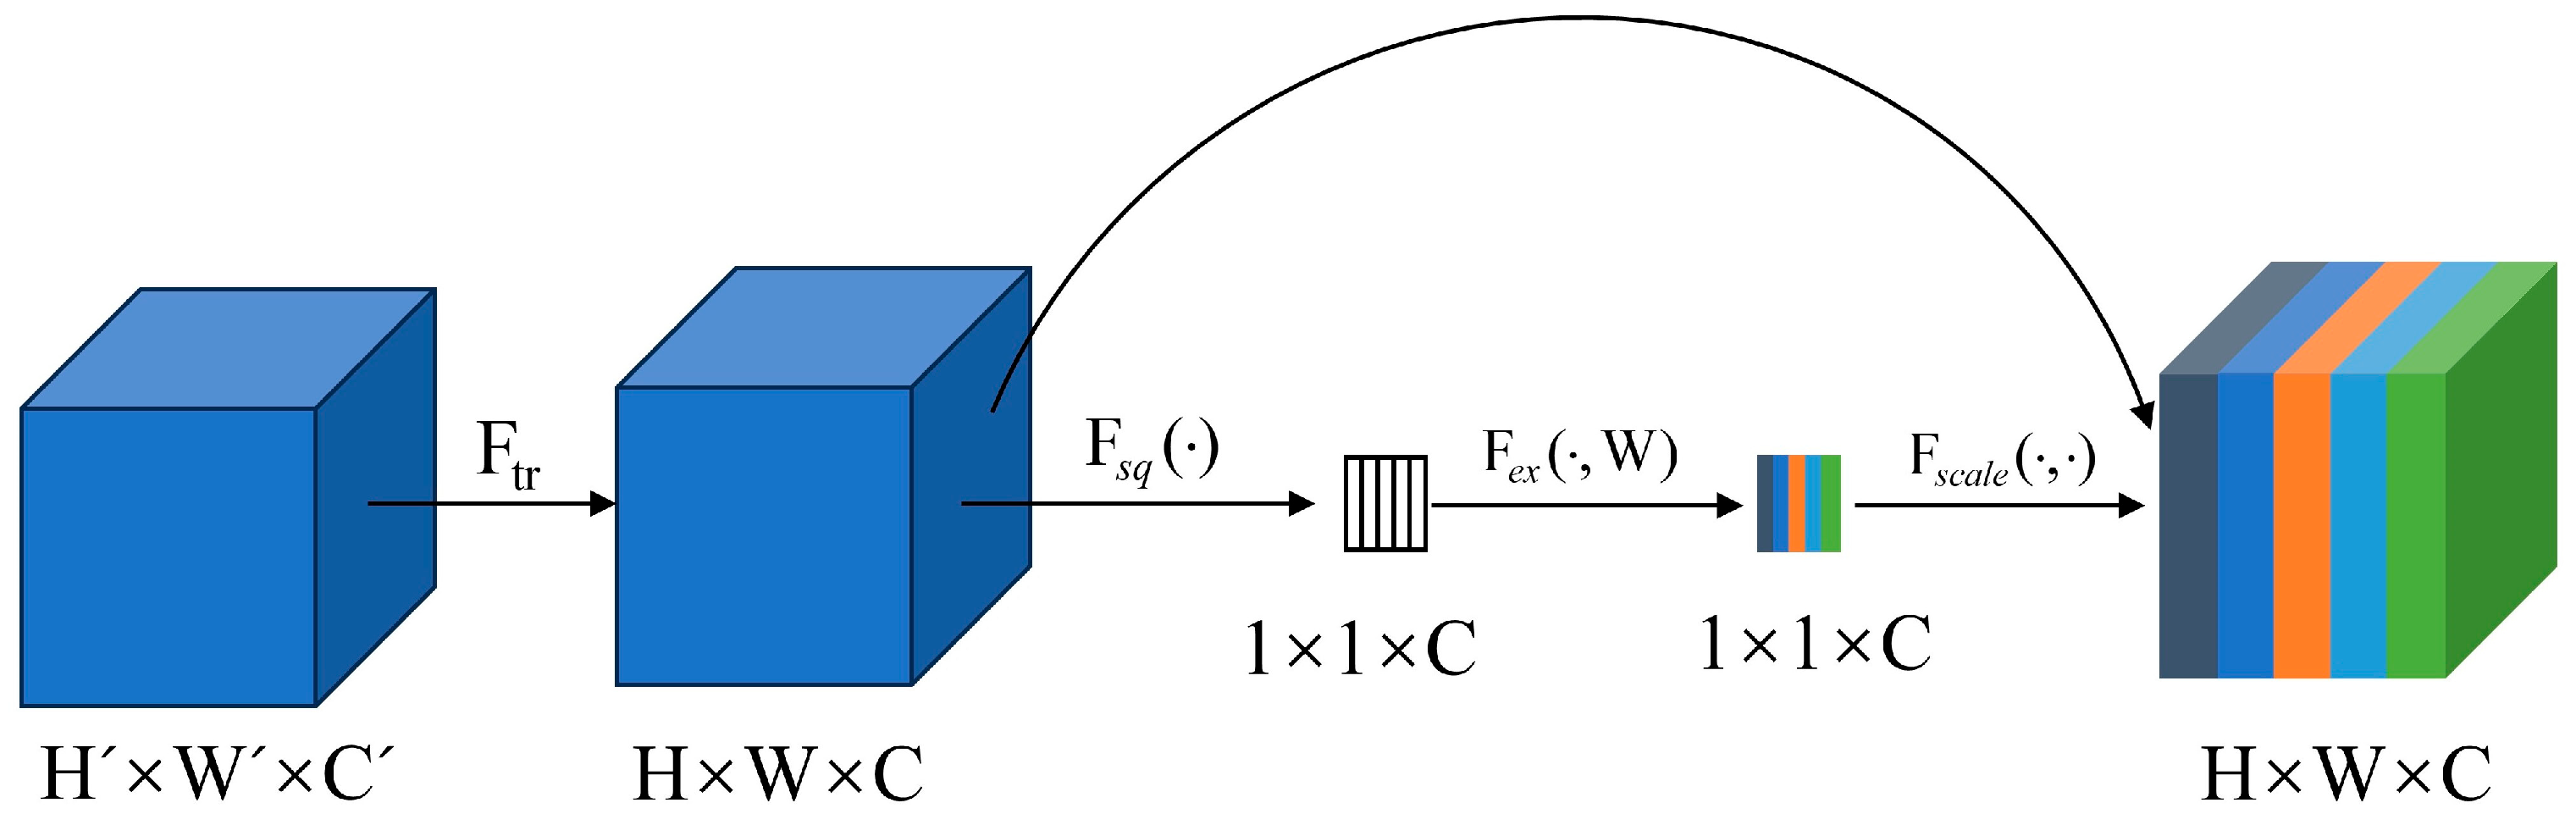
3.2. Squeeze-and-Excitation

The squeeze-and-excitation (SE) module significantly improves the feature representation capability by adaptively adjusting the weights of the feature channels. As shown in Figure 2, in its working principle, the global feature information of each channel is firstly compressed into a scalar by global average pooling, and the scalar is generated by the fully connected layer and activation function corresponding to different weights, which are assigned to the channels of the input feature map, respectively. In our model, MDFNet, the SE module acts as the jump-connection part of the U-shaped structure and assigns larger weights to the defective part and smaller weights to the background noise part, thus improving the segmentation accuracy and robustness of the model. By dynamically adjusting the channel weights, the SE module helps the model to focus on the key features, especially in complex scenarios. In addition, the SE module improves the expressive power of the network without adding too much computational burden, thus maintaining high efficiency while improving the model performance. This fusion of global and local features can greatly improve the overall performance of our model.
Module B2 acts as a target region enhancement module, complementing B1 to further improve the segmentation accuracy. B2 uses the pre-trained YOLOv11 detection model to detect defective regions in the input image, as shown in Figure 3. The overall structure of YOLOv11 is similar to the previous version in that the image is initially down-sampled with convolutional layers. These convolutional layers are the basis for extracting image features, and as the number of layers in the network increases, the size of the image will get smaller but the number of channels will increase. The core architecture of YOLOv11 is composed of three modules: C2PSA, C3K2 and CBS. Among them, C2PSA is improved from the C2F module, which innovatively introduces the point-level spatial attention (PSA) mechanism. This module maps the features to the high-dimensional space through the multi-head attention mechanism to capture more complex feature associations, which significantly improves the feature extraction capability and representation learning effect of the model. The C3K2 module [33] is an optimized version of C2F, compared to C2F which only uses a single Bottleneck structure. The ‘k2’ in C3k2 implies that it uses two small convolutions instead of the original one large convolution (e.g., YOLOv11 [34]), and C3K2 introduces a multi-layer Bottleneck, which enhances the model’s nonlinear modelling capability and further optimizes the feature fusion efficiency. In addition, CBS (Conv-BN-SiLU), as a base component, combines convolution, batch normalization and the SiLU activation function, which ensures the computational efficiency while improving the stability and feature representation of the network. We crop the original image and extract the target area using the coordinate information of the prediction box generated by YOLOV11’s prediction head. To ensure that the cropped regions are consistent in size, we used Copy–Pasting, which processes the target regions to a uniform size and pastes them onto a preset background. These processed regions are stitched into a complete image, and feature extraction is performed by two HAEConv modules. Eventually, the feature maps extracted by module B2 are fused with the bottom-most feature maps of the U-shaped structure in module B1 to further enrich the feature expressiveness of the model.
This dual-module design gives MDFNet significant advantages. The improvement of the B1 module of MDFNet model significantly enhances its feature extraction ability when segmenting complex images, and its performance is outstanding when dealing with multi-scale and globally dependent features. The B2 module adopts the target region enhancement strategy, which effectively reduces the background interference and focuses the attention on the defective region, significantly improving the segmentation accuracy. The HAEConv module combines the convolution and multi-attention mechanism, which not only retains the efficient characteristics of convolution but also introduces a stronger global modelling capability, which significantly improves the ability to capture complex texture and boundary details and characteristics. The introduction of the SE attention mechanism enhances the transfer and integration of features, allowing the model to concentrate on critical information with greater precision.
The innovative design of the MDFNet enables it to have higher robustness and accuracy in complex backgrounds and multi-target scenarios and achieves superior feature fusion through modular design, making it ideal for defect detection and segmentation task capability through modular design, providing an efficient and accurate solution for defect detection and segmentation tasks.

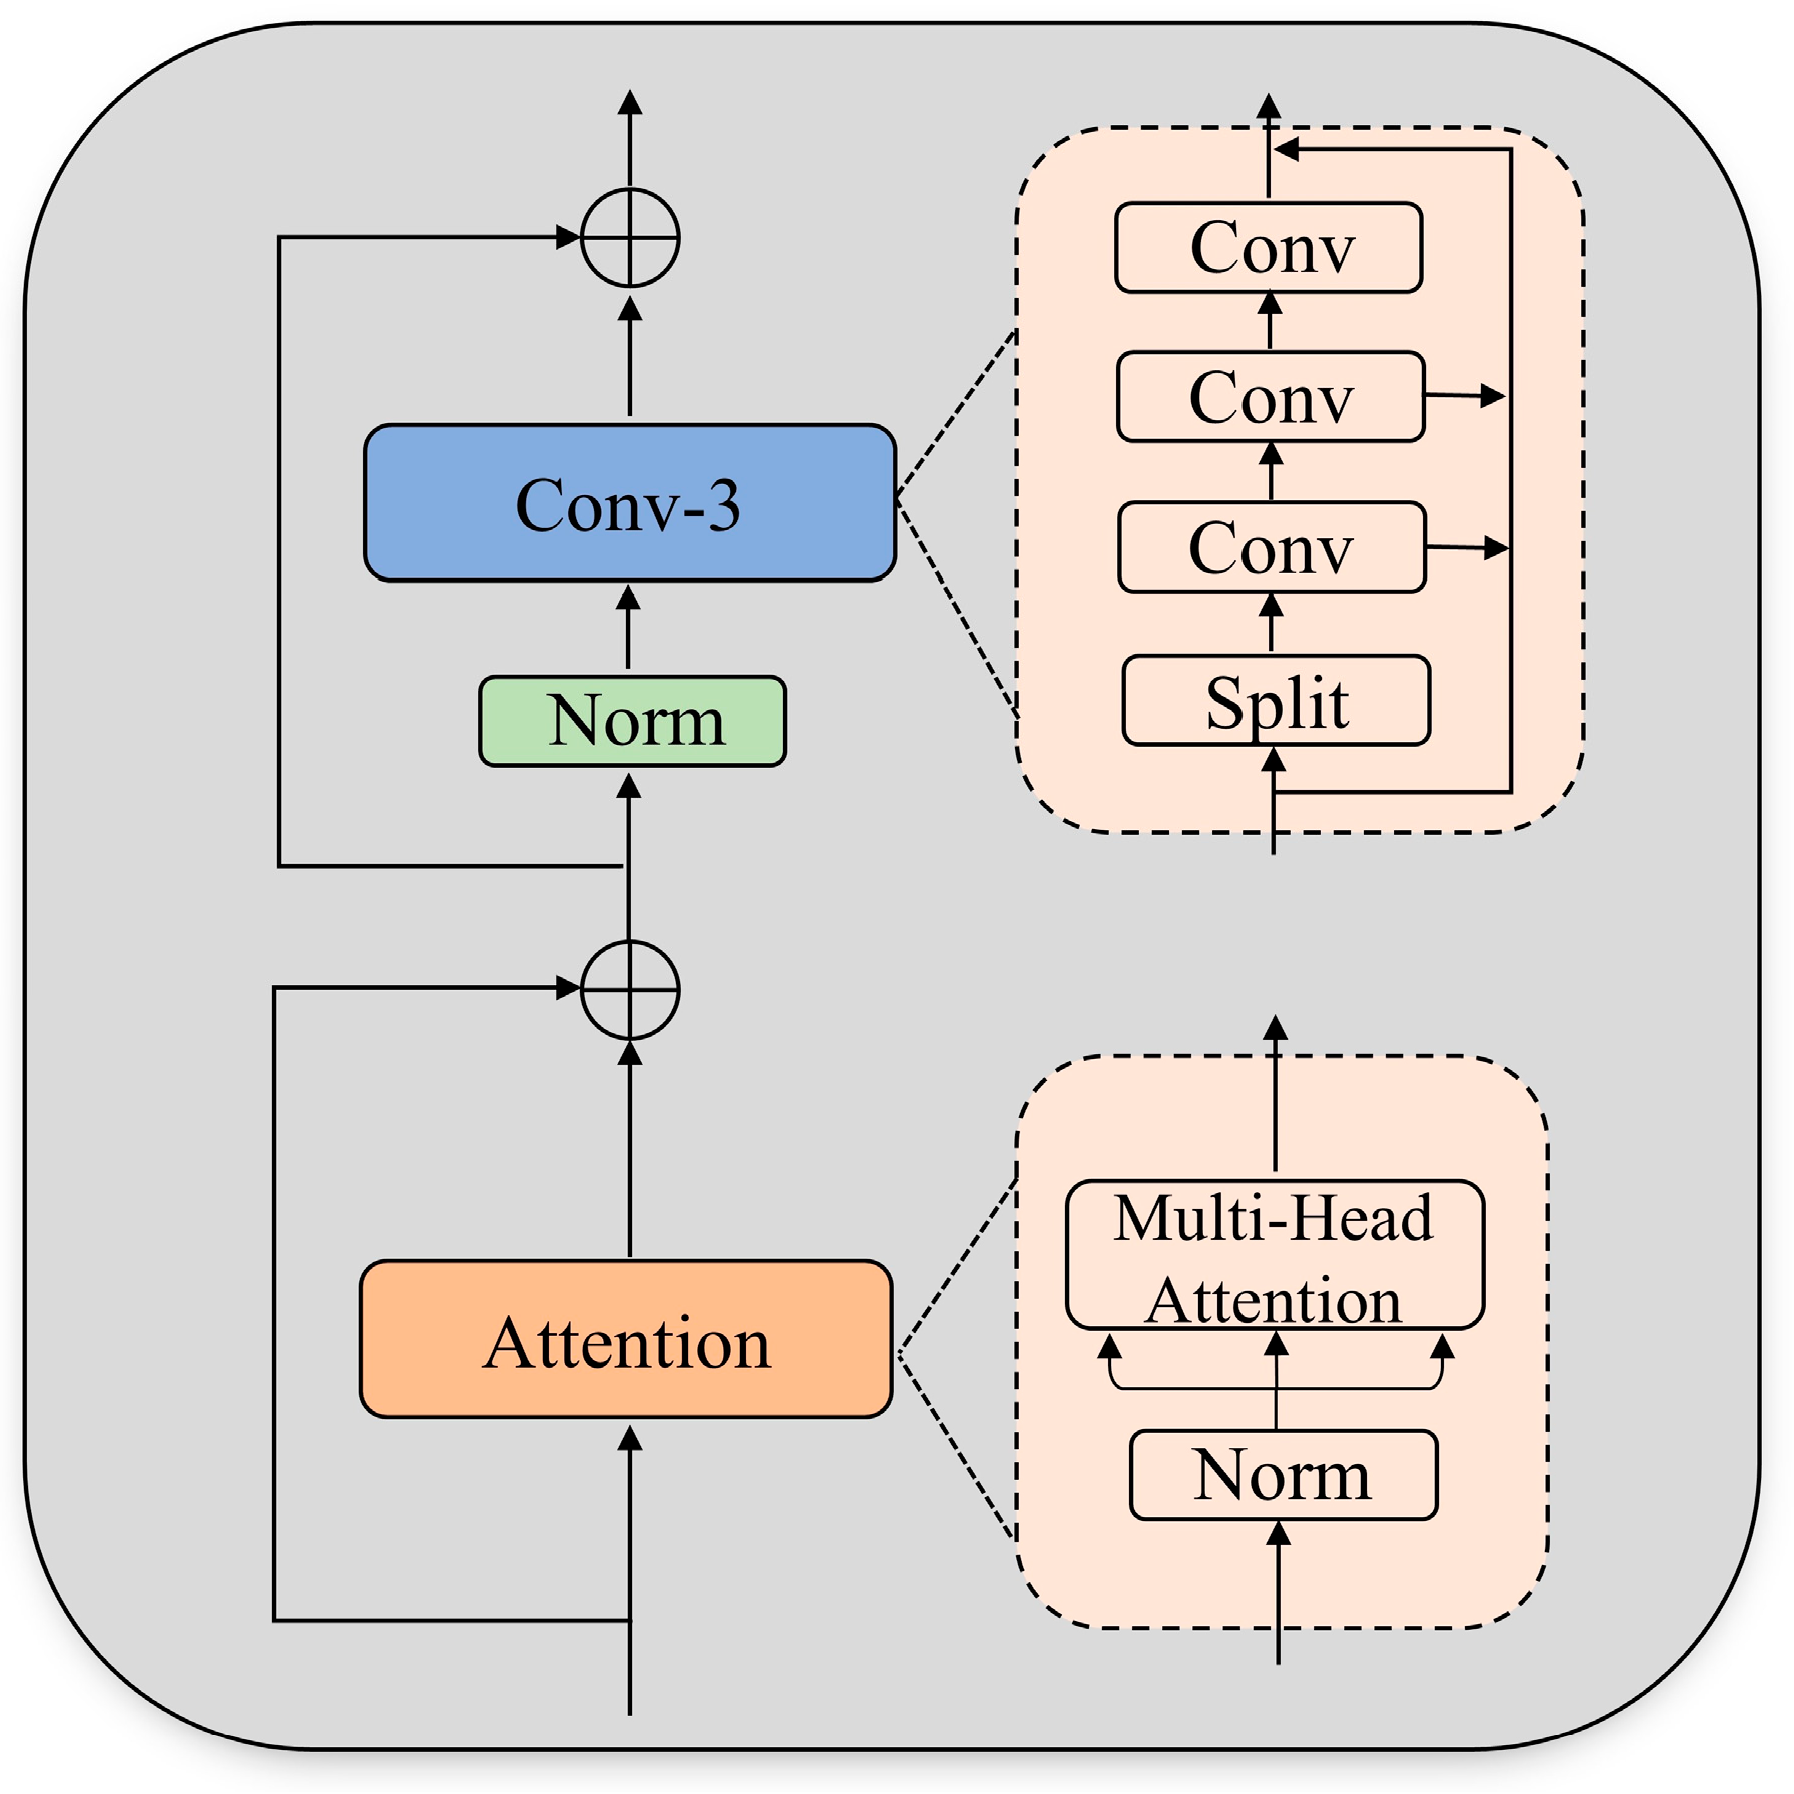
3.3. B1 Head Attention-Expander Convolutional Fusion Module

The HAEConv module, as the core feature extraction unit of MDFNet, efficiently integrates convolution operation with multi-head attention mechanism, significantly improving the model’s ability in both global information modeling and local detail capture. As shown in Figure 4, this module consists of a Conv-3 convolution unit and attention enhancement unit, which work together to achieve multi-level feature learning. The Conv-3 convolution unit consists of three cascaded convolutional layers and adopts a progressive feature extraction strategy. The first layer captures low-level local features (such as edges and textures), the second layer deepens feature abstraction ability, and the third layer aggregates high-order semantic information to provide rich semantic information for subsequent processing. The attention enhancement unit includes a normalization layer and a multi-head attention mechanism. Firstly, the feature map distribution is adjusted through the normalization layer to improve training stability. Then, multi-head attention is used to calculate long-range correlations between features and capture key context. Finally, the original features are retained through residual connections and overlaid with the attention output. Finally, after normalization optimization, they are fused with Conv-3 output to further enhance detail-expression ability. The HAEConv module combines the local computational efficiency of convolution with the global dynamic modeling ability of attention to achieve accurate feature expression against complex backgrounds or multi-objective scenes. In terms of gradient optimization, residual connections and normalization layers effectively alleviate the problems of gradient vanishing and feature degradation. In terms of performance improvement, the closed-loop design of bidirectional information flow (local → global → local) synchronously enhances detail preservation and semantic understanding ability, becoming a key component for improving segmentation model performance. This design not only balances computational efficiency and accuracy but also provides flexibility for model deployment through a modular structure.

3.4. B2 Copy–Pasting

Module B2 Copy–Pasting uses an automatic cropping method and adaptive filling strategy, with detection and feature enhancement as the core, and achieves accurate extraction and feature enhancement of defective regions in the input image through the pre-trained YOLOv11 model and subsequent optimization processing. As shown in Figure 5, firstly, the module adopts the bounding box optimization method, and the YOLO series model often generates multiple overlapping or redundant prediction frames when detecting multiple small targets, and this redundancy may increase the complexity of the subsequent processing and affect the model performance. And because the number of prediction frames has a small impact on the model accuracy and FPS, we finally choose three prediction frames for the automatic cropping method with an adaptive filling strategy and optimize the prediction frames with the nearest neighbor fusion method. The target regions after adaptive filling are pasted to a predefined background and stitched together in rows or columns to form a complete image containing all target regions.
Finally, this spliced image is subjected to deep feature extraction by the two HAEConv modules to further refine the multiscale information and global semantic relationship of the target region. Finally, the feature map extracted by module B2 is fused with the bottom-most feature map of the U-shaped structure in module B1, which combines the target-enhanced features of B2 with the global structural features of B1 to improve the model’s sensitivity to defective regions and its overall semantic expressiveness. This process maximizes the retention and utilization of defective region information through prediction frame optimization, padding, splicing and feature fusion strategies, which significantly improves the segmentation performance of the model in complex scenes.

3.5. Function Loss

In the context of detecting defects on concrete surfaces, we employ the Dice loss function and the Intersection over Union (IoU) loss function. These metrics are widely utilized for assessing the efficacy of segmentation models, primarily focusing on quantifying the extent of overlap between the predicted segmentation outcomes and the actual labels. The following is a detailed description of the two functions.
The Dice loss function is derived from the Dice coefficient and is primarily employed to assess the degree of similarity between the predicted segmentation and the actual segmentation. It has better robustness against small targets or unbalanced samples (e.g., surface defects such as cracks or dents). The lower the Dice loss (1—Dice coefficient), the greater the overlap between the predicted results and the true segmentation region. IoU (Intersection over Union) is another measure of how much the prediction overlaps with the true segmentation region, reflecting the intersection of the two true segmentation regions as overlaps, reflecting the proportion of the intersection of the two in the union set. The formula is as follows:
L D i c e = 1 2 P G P + G
L I o U = 1 P G P G
L = a L D i c e + β L I o U
P G is the intersection area of the predicted region and the real region, P G is the concatenation area of the predicted region and the real region, and P and G are the areas of the predicted region and the real region. The goal of the combined loss function is to simultaneously optimize the segmentation model’s ability to detect small targets and the accuracy of the overall segmentation. By adjusting a and β , a certain performance can be biased according to the task requirements.

4. Experimental Results and Analysis
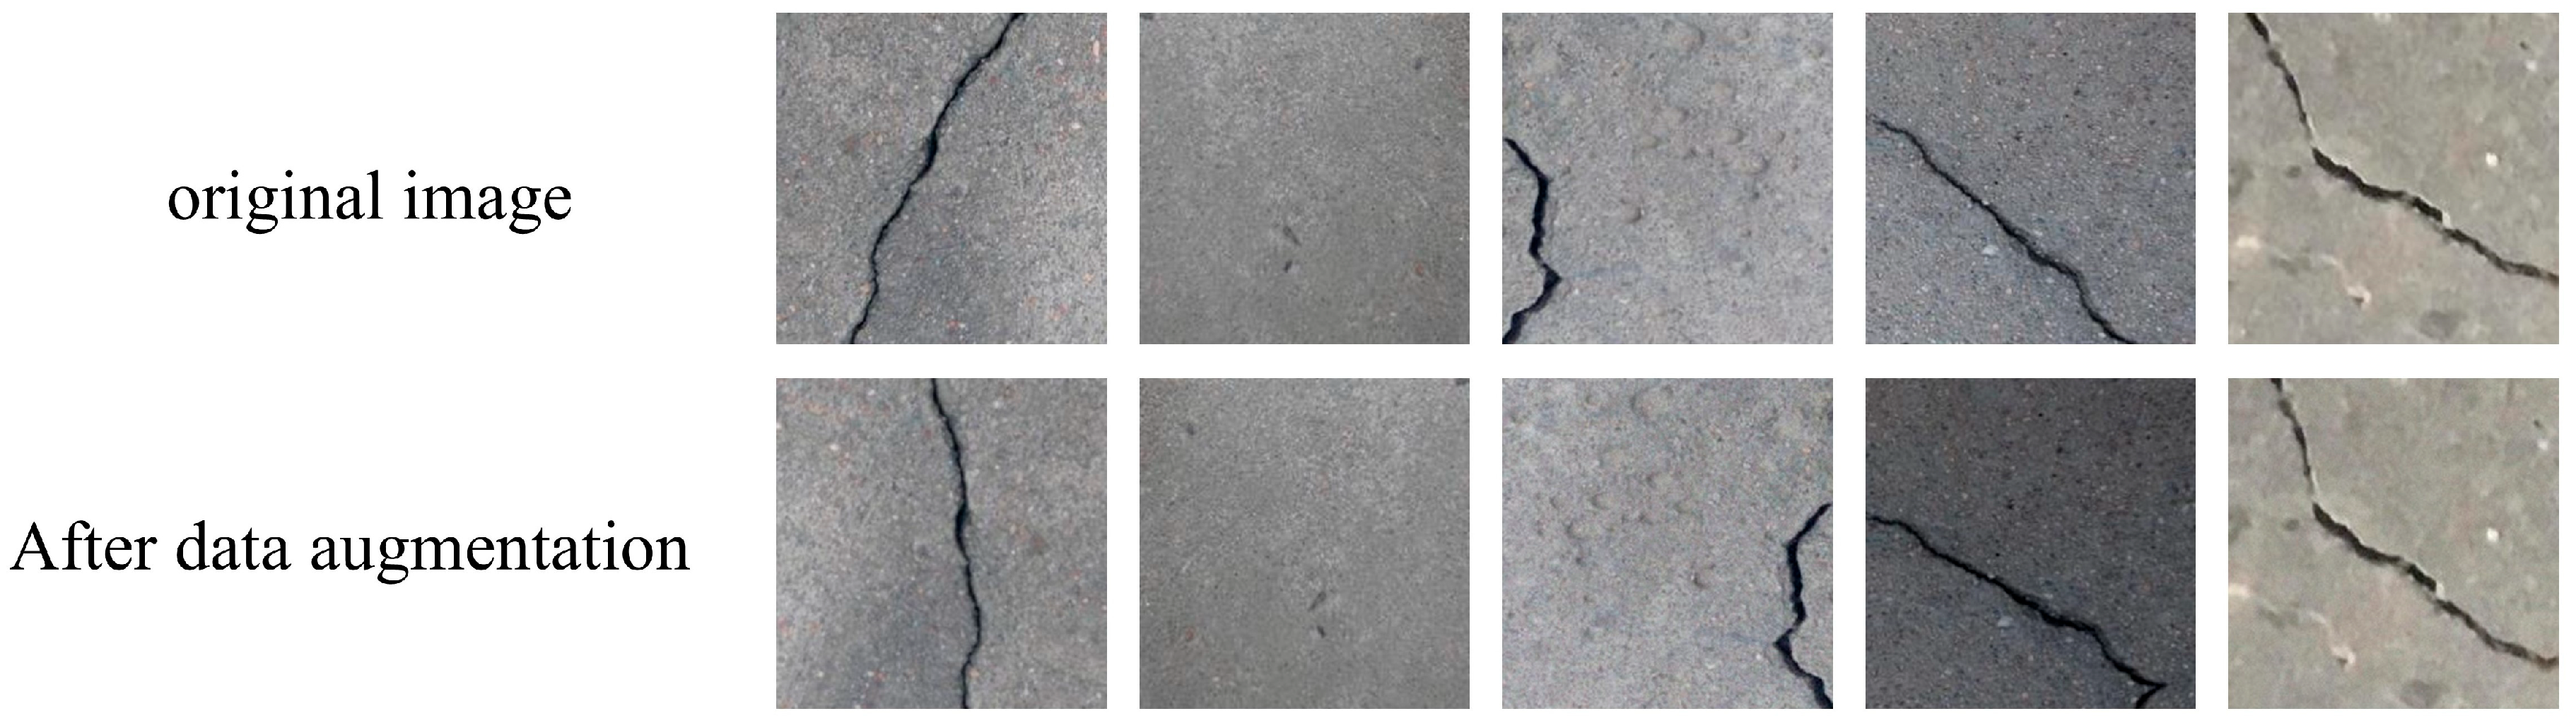
4.1. Datasets

The dataset utilized in this research was gathered by our team directly at the project site, with the objective of ensuring both the authenticity and representativeness of the data. The data collection covered a wide range of environmental conditions, including different weather, light, and different aging and damage states of the concrete surface. The dataset contains a large number of images of concrete surface defects, mainly including cracks, dents and other common defect types. All images were taken at a close distance between the concrete surface and the camera to ensure clarity and detail presentation. A total of about 1000 raw images of 2500 × 3000 pixels were captured from the surfaces of multiple concrete buildings, which cover a wide range of defect types and different surface conditions.
To facilitate subsequent model training and evaluation, we trimmed the original images and generated sub-images with a resolution of 640 × 640 pixels for each specific defect. Although the expected defect regions may not be exactly matched in some of the pruned images, these data are still representative. In order to accurately annotate each defect region, we used the image annotation tool ‘labelme’ to accurately annotate targets such as cracks and dents and generated corresponding defect masks. Subsequent to the labeling process, to ensure the robustness of the training process, we adopted a dual validation mechanism: (1) Early stopping strategy: Continuously monitor the validation set loss (Dice + IoU composite index), and if there is no improvement for 20 consecutive rounds, stop training and roll back to the optimal weight. (2) The 50% cross validation mechanism: Divide the training set into training/validation/retention test sets at 70%/20%/10%, and loop five times to ensure balanced data distribution. The distribution of types in the dataset is shown in Table 1. This division is implemented to facilitate a comprehensive evaluation of the model at various stages of its development. To further enhance the diversity of the dataset and to improve the robustness of the model, as shown in Figure 6, data enhancement techniques were employed to increase the data volume from the original 1000 sheets to 2500 sheets. The data enhancement methods include rotating, panning, mirror flipping, scaling, color adjustment and other methods, and some random noises are added to simulate the variations in the real environment and enhance the generalization ability of the model.
Throughout the model training process, the predictions generated by the model are juxtaposed with the manually annotated true labels. A thorough assessment of the model’s performance is conducted, utilizing widely recognized performance metrics, such as Mean Average Precision (MAP), the Dice coefficient, mean Intersection over Union (mIoU), and Frames Per Second (FPS). These metrics collectively offer a comprehensive representation of the model’s efficacy in detection and segmentation tasks and provide a multi-dimensional evaluation.

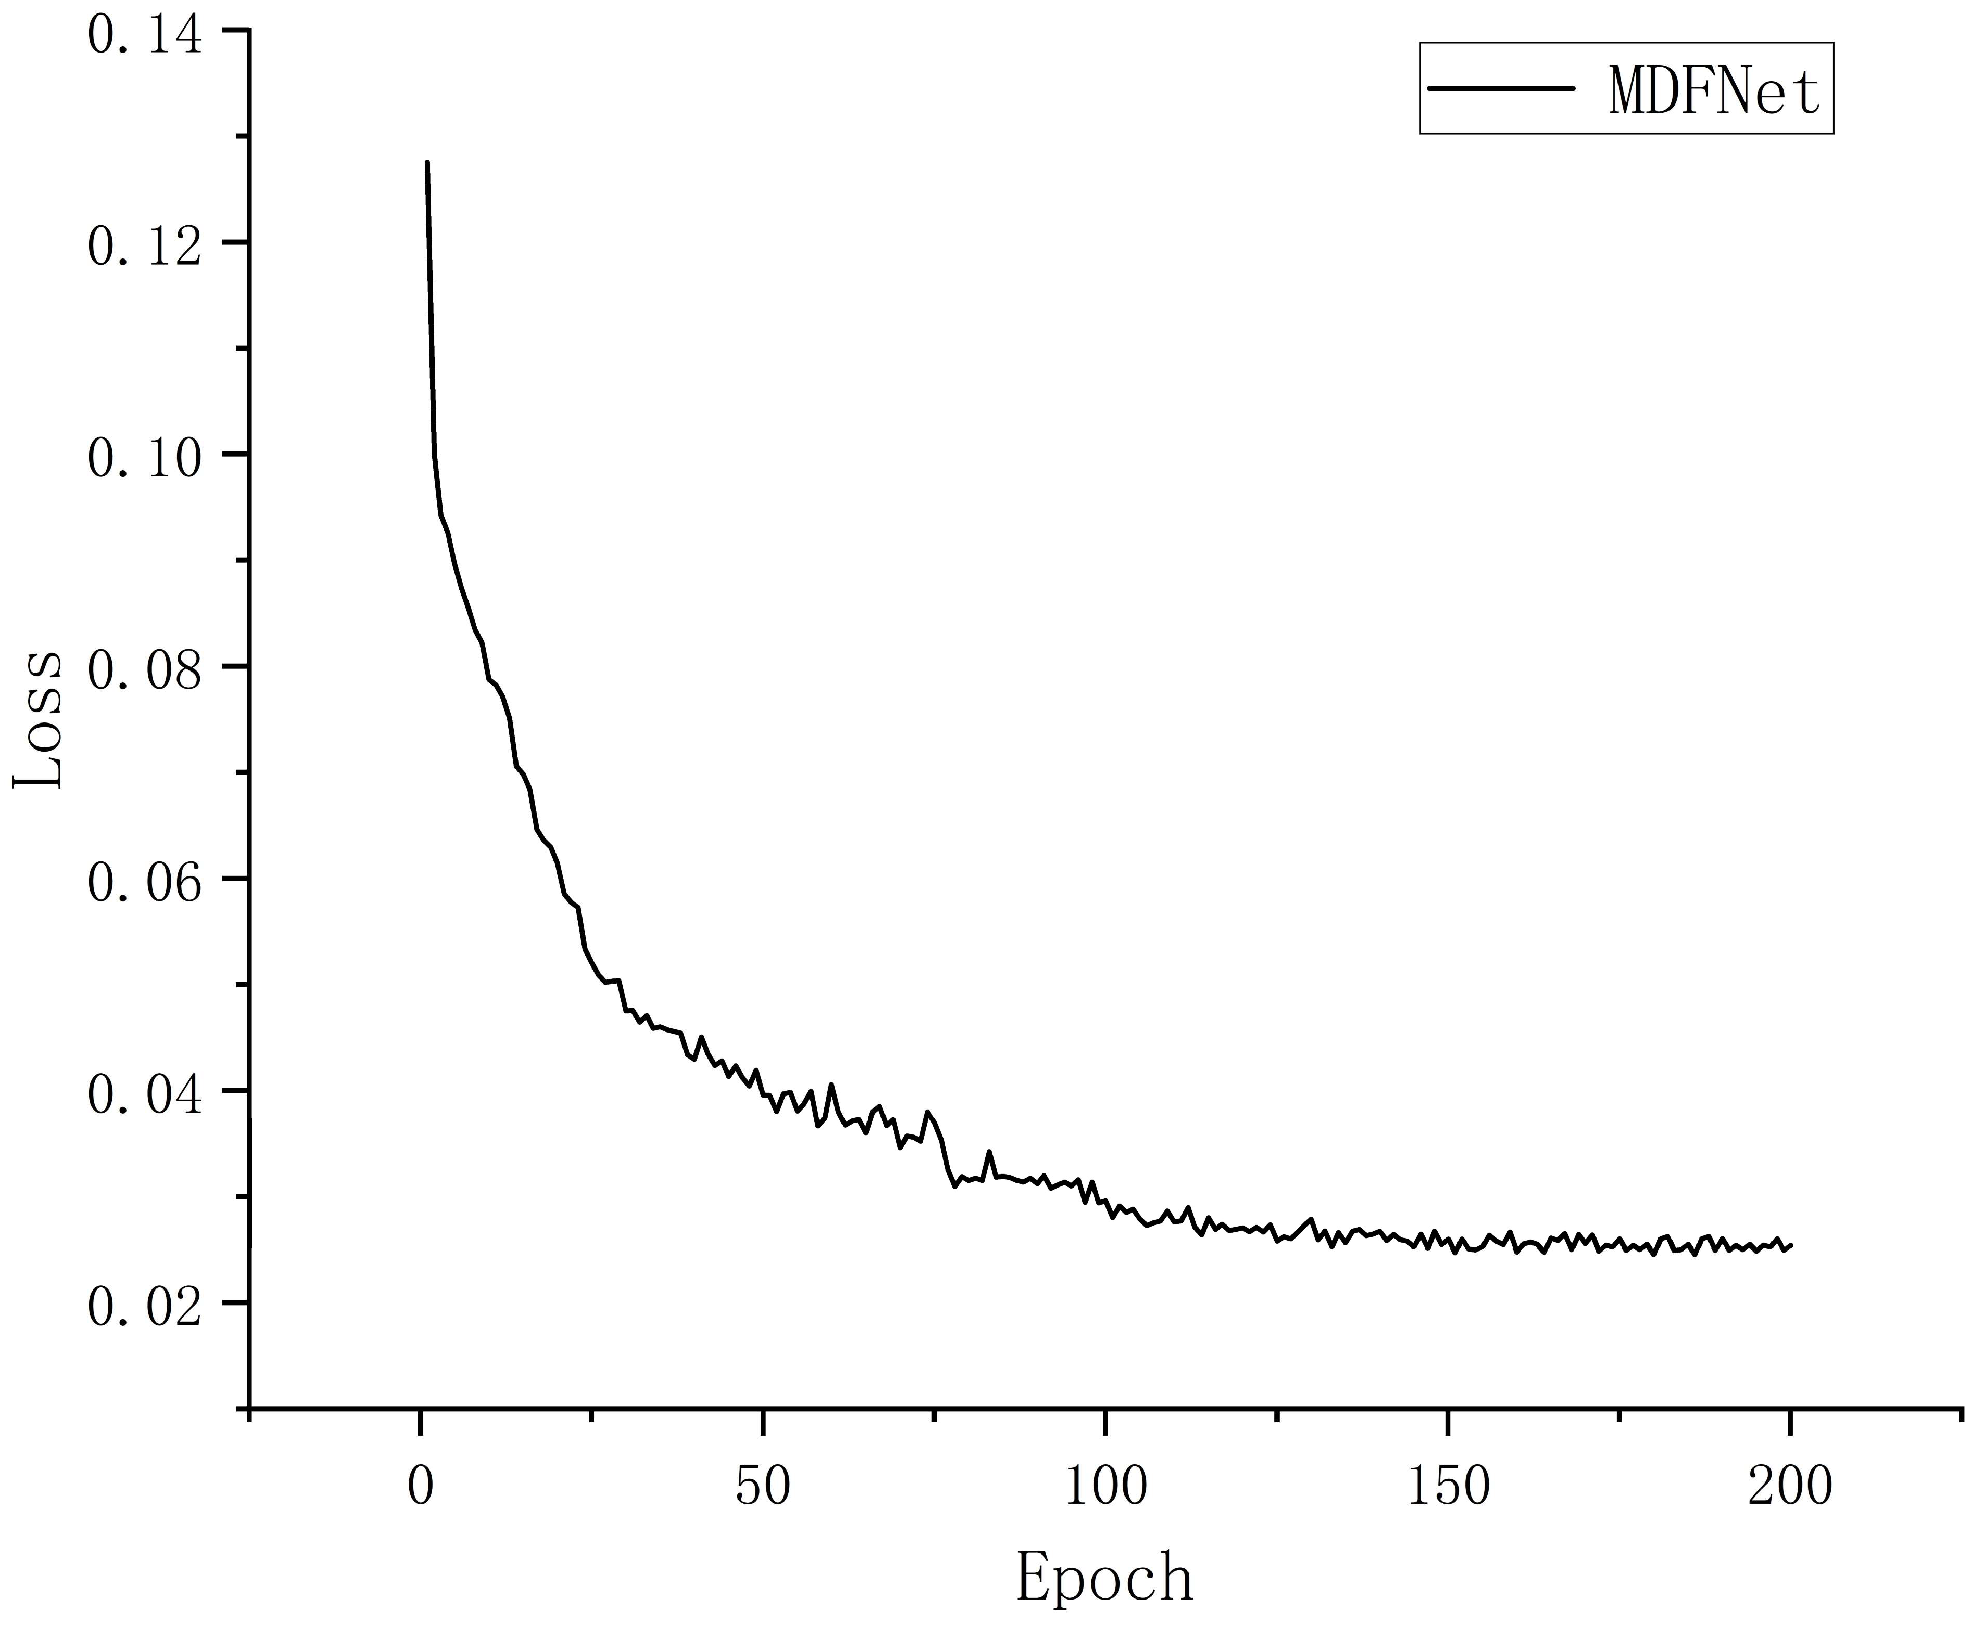
4.2. Experimental Details

The MDFNet model was trained in the Pytorch framework, using NVIDIA GTX 4080 GPUs to accelerate the computation, and the training process used the AdamW optimizer [35], which introduces weight decay (L2 regularization) to prevent overfitting, and the CosineAnnealingLR scheduler. In the training optimization process, we set the momentum decay factor to 1 × 10⁻⁴, the learning rate decay factor to 0.1, the batch size to 16, the number of training rounds to 300, and the initial learning rate of the model to 1 × 10⁻⁵; in the loss function, the weighting factors a and β are determined by systematic hyperparameter tuning. We perform grid search experiments on the validation set for the combinatorial space ( α [ 0.1 , 0.9 ] ,   β = 1 α , step size 0.1). As shown in Table 2, the 0.5:0.5 configuration achieves an optimal balance between precision (86.7%) and recall (89.2%), minimizing the composite error metric E = 0.7 × F P + 0.3 × F N .
In the specific training process, the YOLOv11 module uses pre-training weights and does not participate in joint training in this experiment. The pre-training of the YOLOv11 module uses the SDNET2018 dataset, which contains rich images of concrete defects, for optimizing the model’s detection capability and ensuring the accuracy of the output prediction frames. By freezing the parameters of the YOLOv11 module, we only utilize the target detection results (e.g., prediction frames) provided by it as inputs to the segmentation module, thus reducing the consumption of computational resources and avoiding the interference of the detection task on the segmentation task. The MDFNet model loss curve is shown in Figure 7.

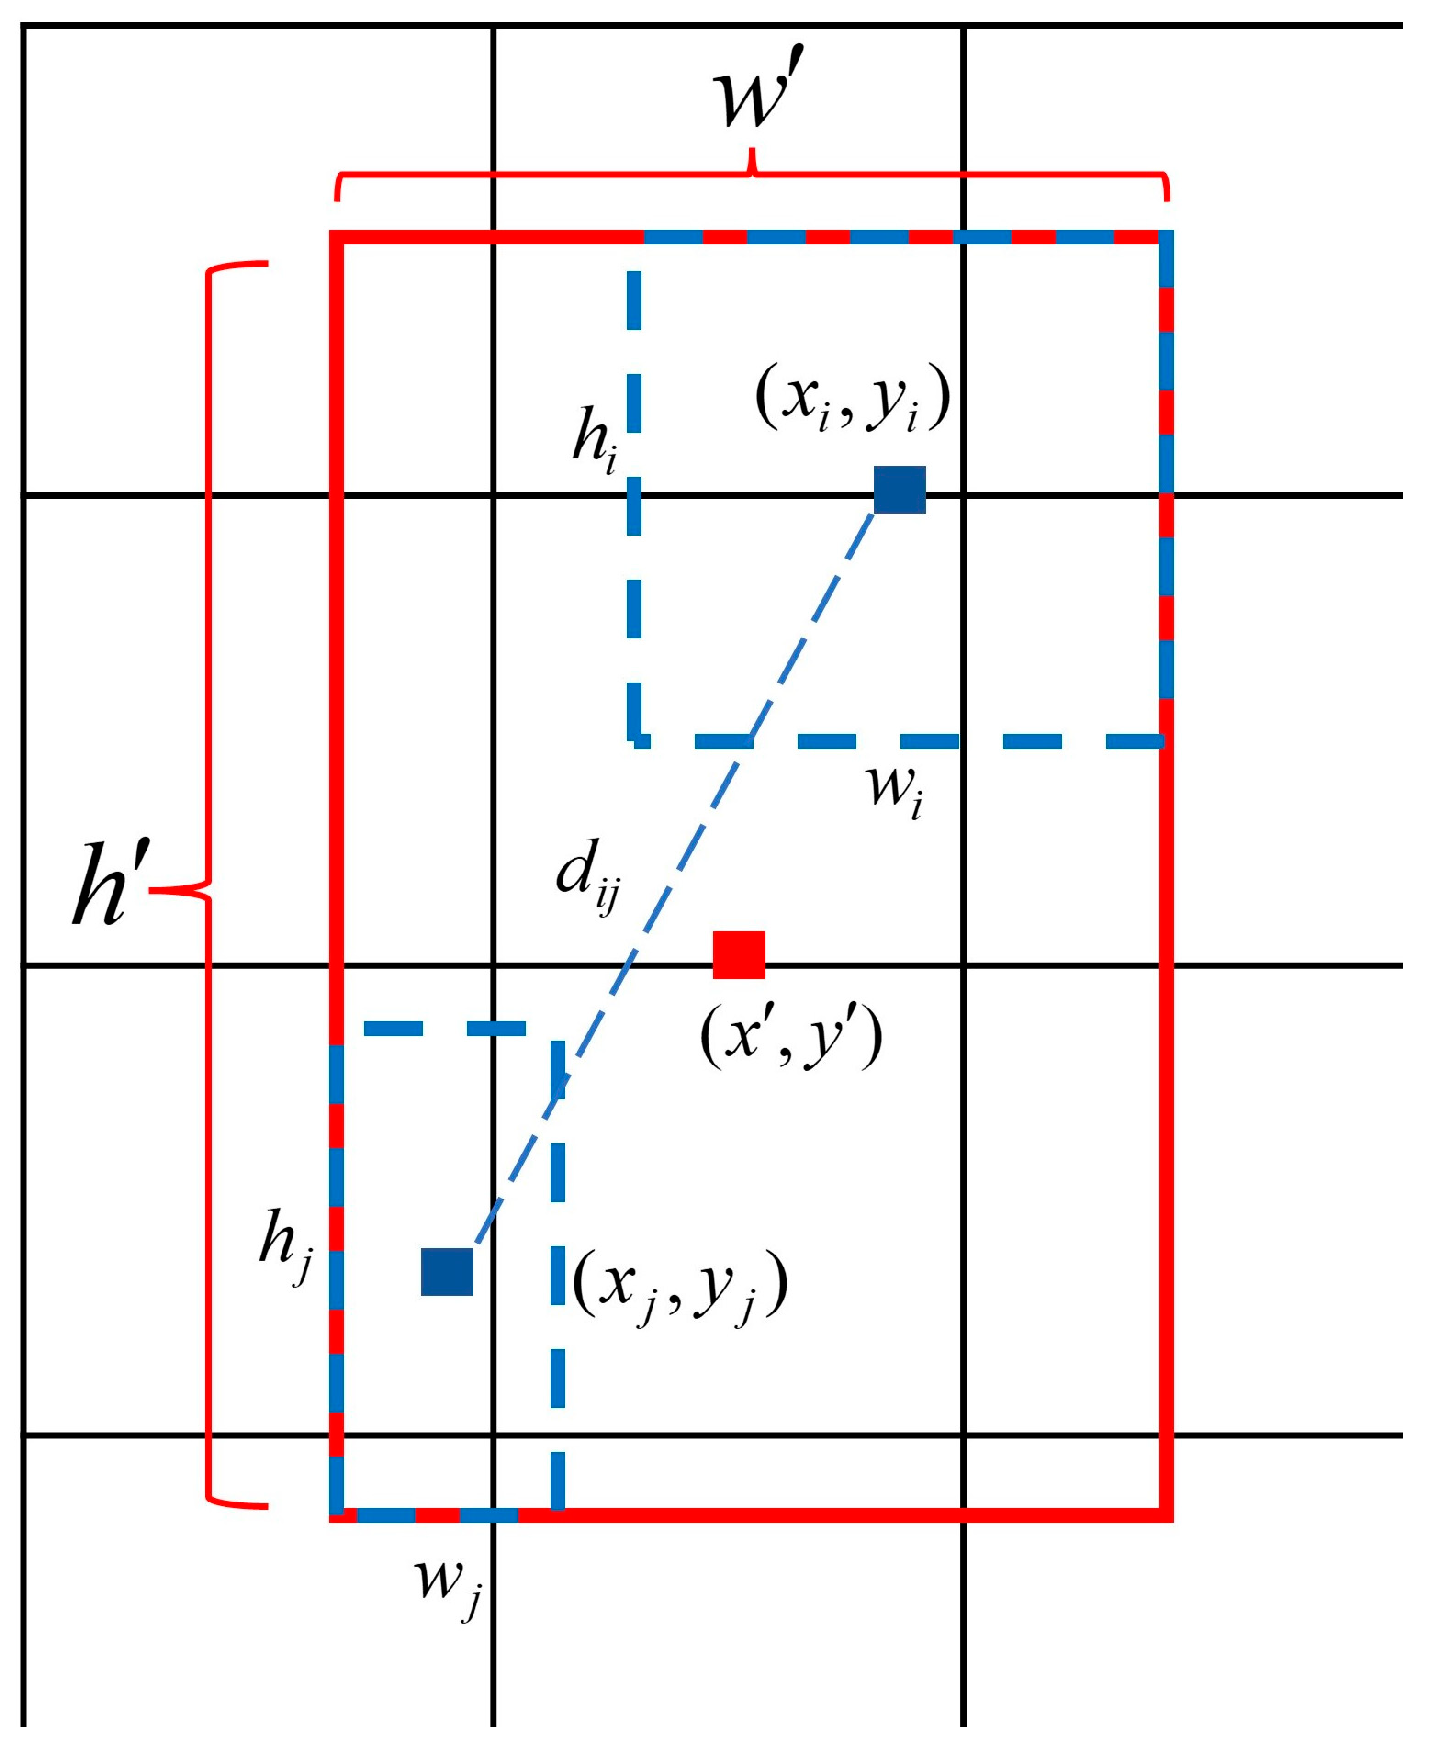
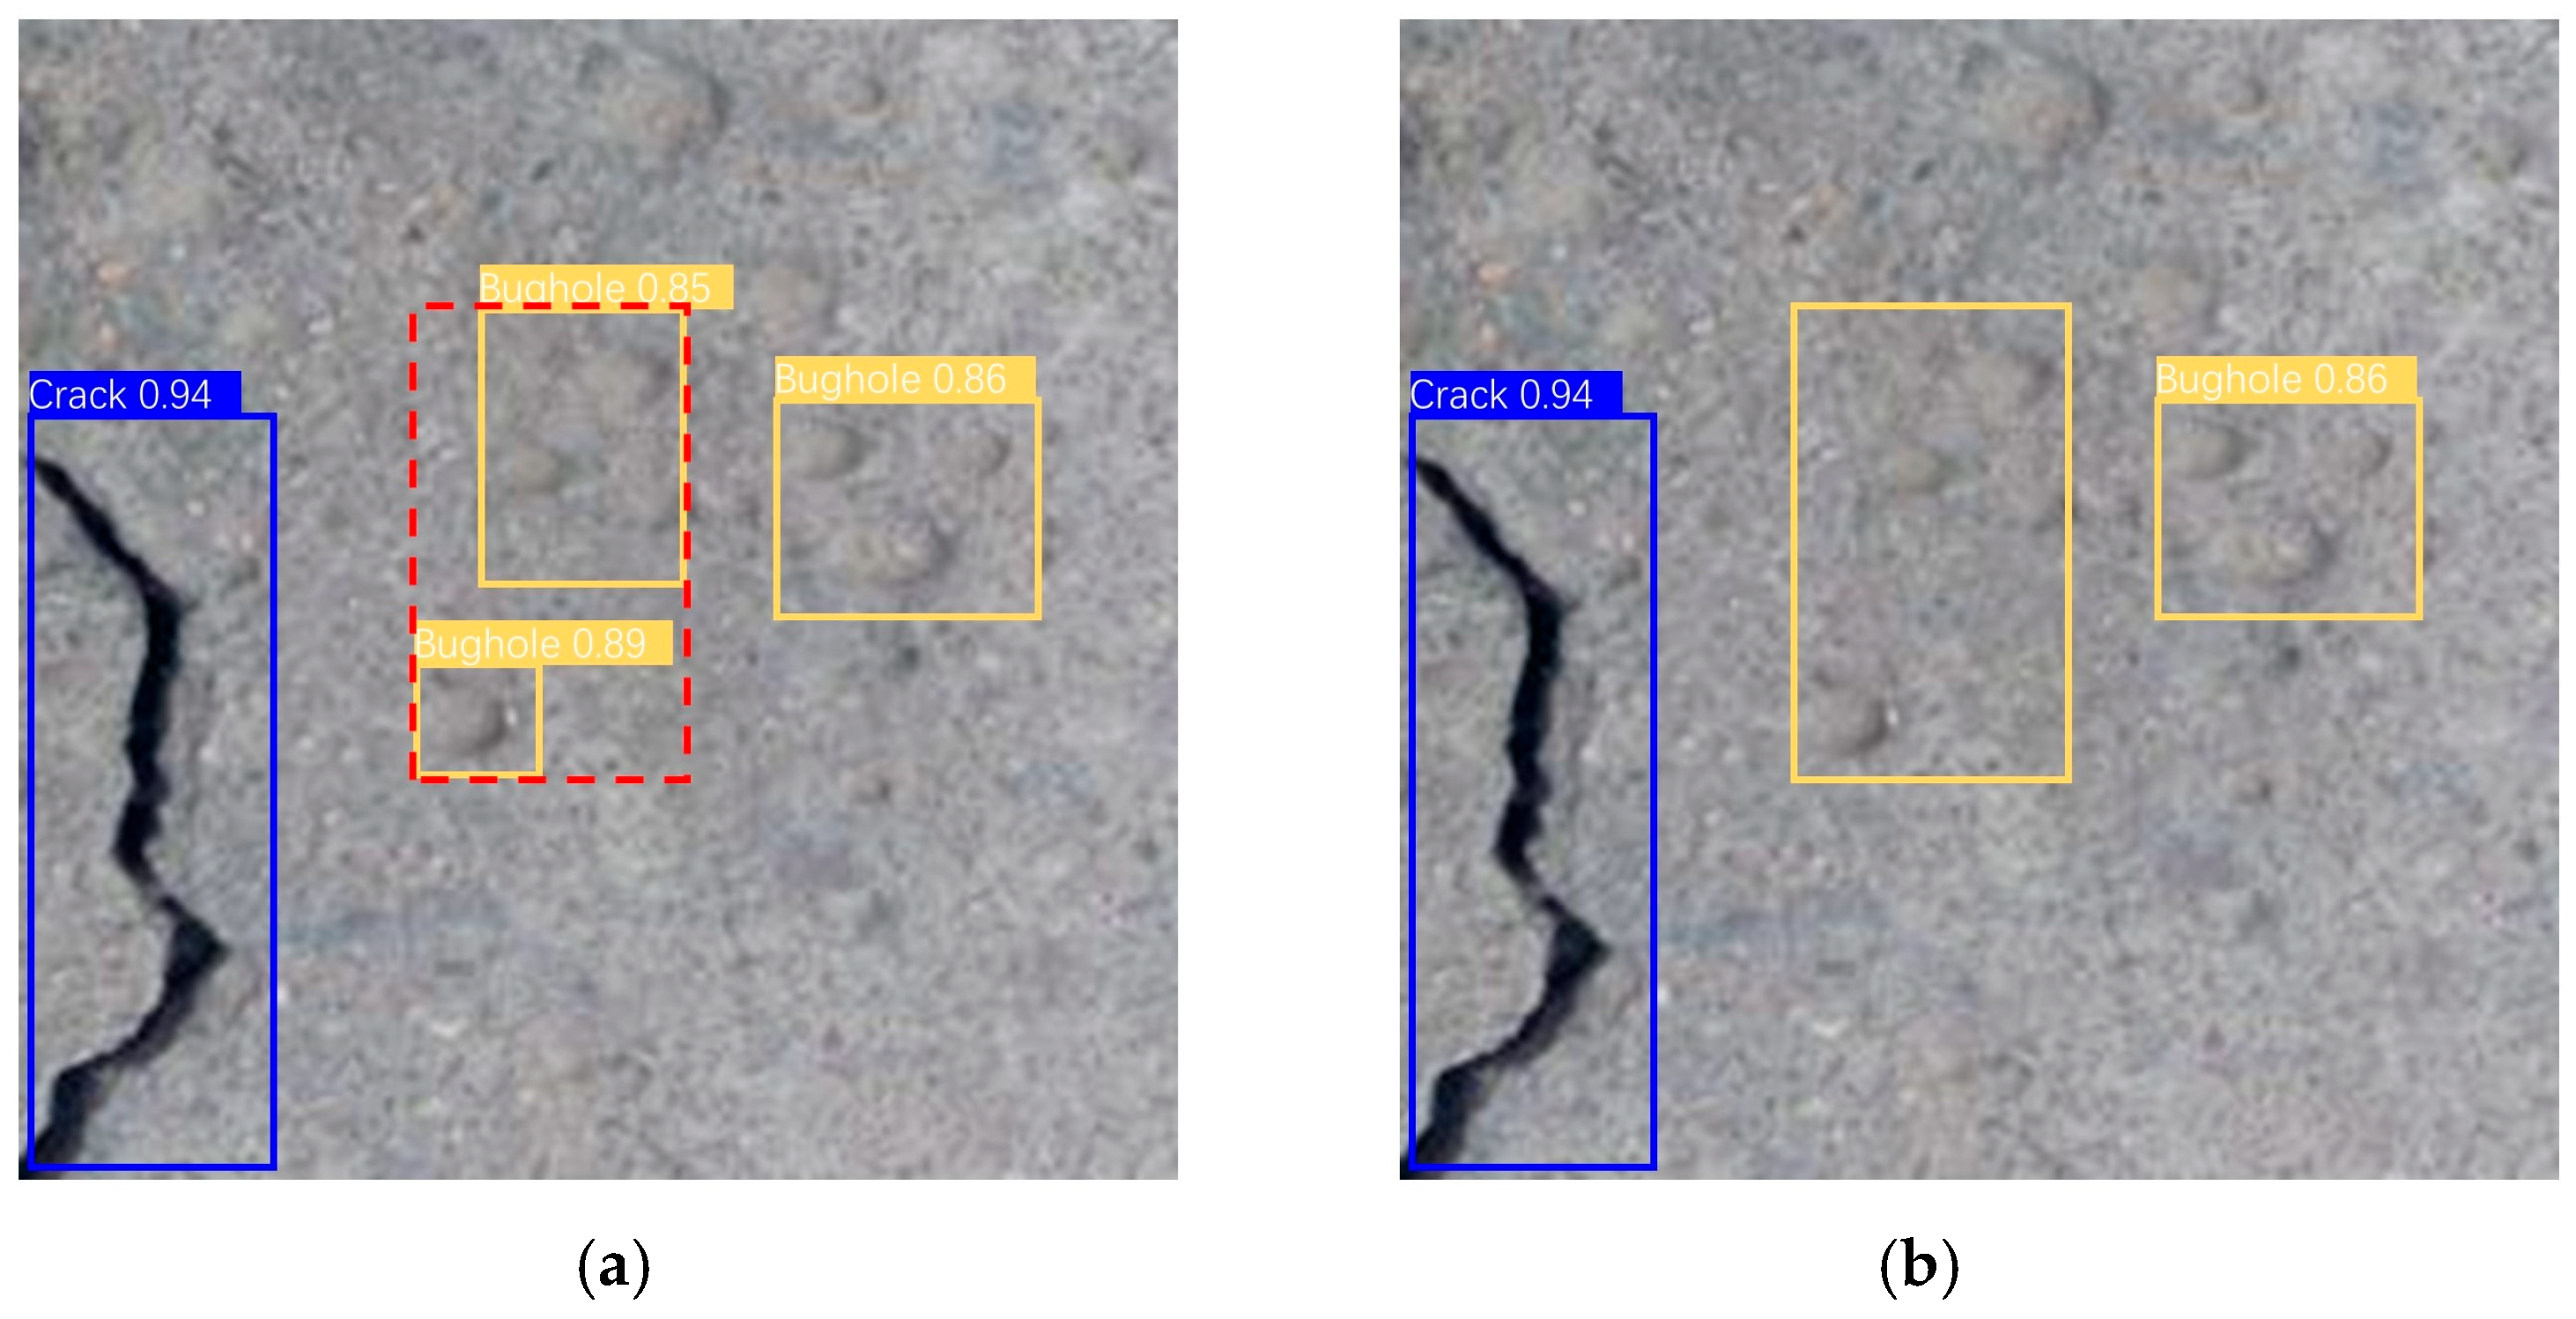
4.3. Prediction Box Fusion

Figure 8 illustrates the processing flow of YOLOv11 when the number of prediction frames is more than three; i.e., the prediction results are simplified by fusing similar prediction frames. The derivation process of prediction box fusion is shown in Appendix A, Formulas (A1)–(A7). Specifically, each prediction frame is represented by the coordinates of its center point and its width and height information. When the quantity of prediction frames surpasses three, the system computes the Euclidean distance between the centroid coordinates of all prediction frames. Subsequently, it identifies the two frames exhibiting the smallest distances, which are then sequentially fused. The new prediction frame after fusion takes the weighted average of the centroids of the two frames as the new centroid, and the sum of the width and height of the two frames as the new width and height, thus generating a more representative prediction frame. This process is repeated until the number of prediction frames is reduced to three. Through this strategy, redundant information can be effectively integrated to avoid the interference of too many prediction frames on the subsequent processing and at the same time to ensure the completeness and accuracy of the features of the target area.

4.4. Ablation Experiment

As shown in Table 3, we can visualize the specific impact of each module on the model performance. The Baseline model using U-Net has a Dice of 80.1%, a MAP of 78.5%, a mIoU of 71.3%, and an FPS of up to 67, which suggests that the speed is fast but the accuracy is low. Compared to Baseline, adding only the B2 module (M1) improves Dice by 6.7 percentage points, MAP by 8.7 percentage points, and mIoU by 4.9 percentage points; adding only the SE module (M2) improves Dice by 3.7 percentage points, MAP by 2.3 percentage points, and mIoU by 2 percentage points; and adding the HAEConv module alone (M3), Dice improves by 4.4 percentage points, MAP by 6.9 percentage points, and mIoU by 3.5 percentage points; the FPSs of M1, M2, and M3 are 48, 52, and 51, respectively. It can be seen that the introduction of each module can improve the segmentation and detection accuracy while sacrificing a certain degree of real-time performance. On this basis, we also experimented with combinations of modules. Combining the HAEConv and B2 modules (M4) improves Dice by 9.4 percentage points, MAP by 12.7 percentage points, and mIoU by 6.3 percentage points, suggesting that the combination is better able to take advantage of the strengths of each module and improve model accuracy. Another combination scheme, the combination of HAEConv and SE modules (M5), results in a 10-percentage point increase in Dice, a 14.8 percentage point increase in MAP, and a 7.4 percentage point increase in mIoU, which is also a greater improvement than when single modules are used. Finally, when HAEConv, SE, and B2 are all integrated to form a MDFNet, the model performance is optimal: Dice improves by 12.3 percentage points over Baseline, MAP increases by 17.1 percentage points, and mIoU goes up by 10.3 percentage points, but with an FPS of 45. Although there is a reduction in speed, in application scenarios that require high accuracy, this sacrifice is acceptable. Overall, this set of ablation experimental data show that the Baseline model, although good in real time, is not accurate enough; the use of any module alone can significantly improve the accuracy, while the combination of modules, especially the full module integration, has a more substantial increase in accuracy, fully demonstrating the synergy between the modules.

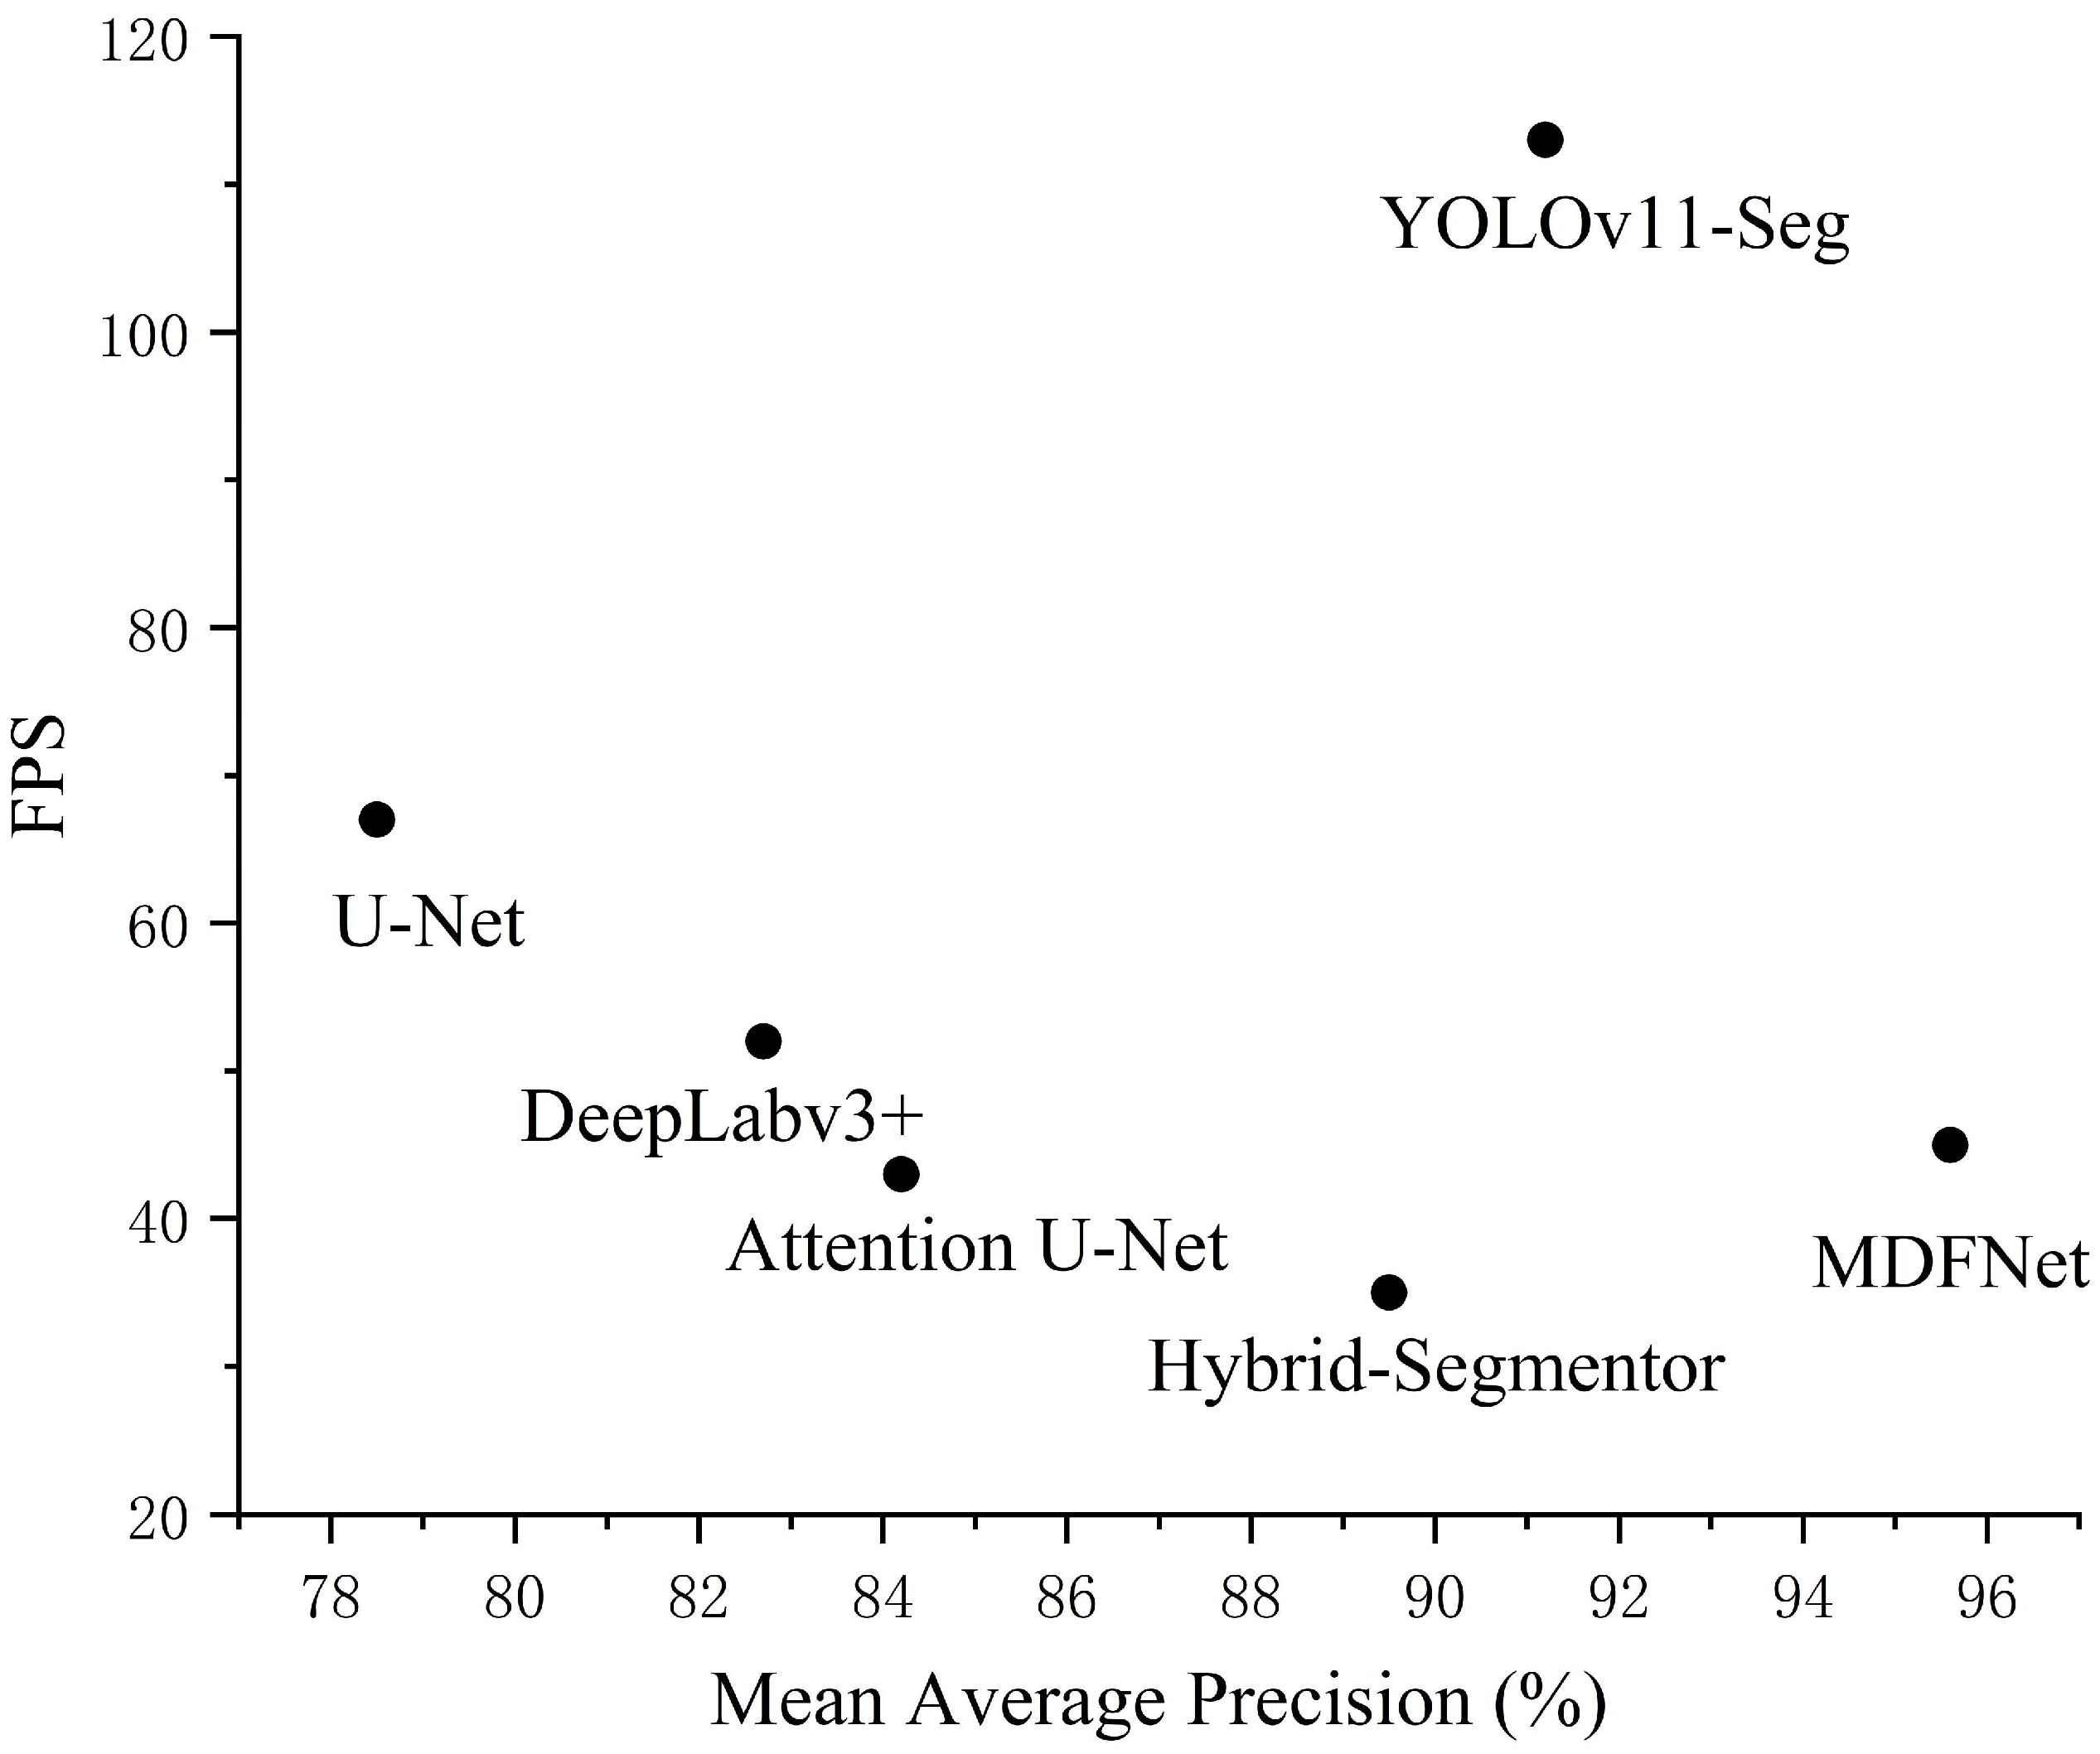
4.5. Comparison Experiment

To validate the performance of MDFNet in the task of concrete surface defect segmentation (cracks and dents), we conducted comparative experiments with U-Net, DeepLabv3+, Attention U-Net [36], YOLOv11-Seg, and Hybrid-Segmentor [37], and used Dice, FPS, MAP, and mIoU as evaluation indexes, as shown in Table 4. The results show that U-Net is more stable in mIoU (80.1%), but the MAP is lower due to the lack of target region optimization; DeepLabv3+ improves the mIoU to 75.9% by multi-scale feature extraction, but the computational complexity is higher; Attention U-Net enhances the Dice and MAP with the help of Attention (85.1% and 84.2%), but the mIoU is slightly lower (74.4%), and the MAP is slightly lower than that of DeepLabv3+ (82.3% and 82.7%); YOLOv11-Seg combines target detection to improve Dice and MAP (88.6% and 91.2%), but the mIoU is only 76.1% due to the lack of global modelling capability; Hybrid-Segmentor introduces a self-attention model at the encoder level, and the mIoU reaches 78.4%, but the FPS is only 35. In contrast, MDFNet combines the advantages of the U-structure and the target detection module to achieve 92.4%, 95.6%, and 81.6% on Dice, MAP, and mIoU, respectively, and achieves better global segmentation results in complex contexts. In addition, on the NVIDIA RTX 4080 graphics card, there is a significant difference in the FPS of each model, in which YOLOv11-Seg has the highest computational efficiency (FPS 113), U-Net is the second most efficient (FPS 67), and DFSNet is the most computationally intensive due to the fusion of the YOLO11 target detection, adaptive padding, multi-attention (HAEConv), and SE modules with a FPS of 45, but its high accuracy advantage makes it more suitable for high-precision segmentation tasks in complex scenes. As shown in Figure 9, accuracy is also prioritized in the trade-off between FPS and accuracy as accuracy is prioritized in engineering to meet real-time monitoring requirements.

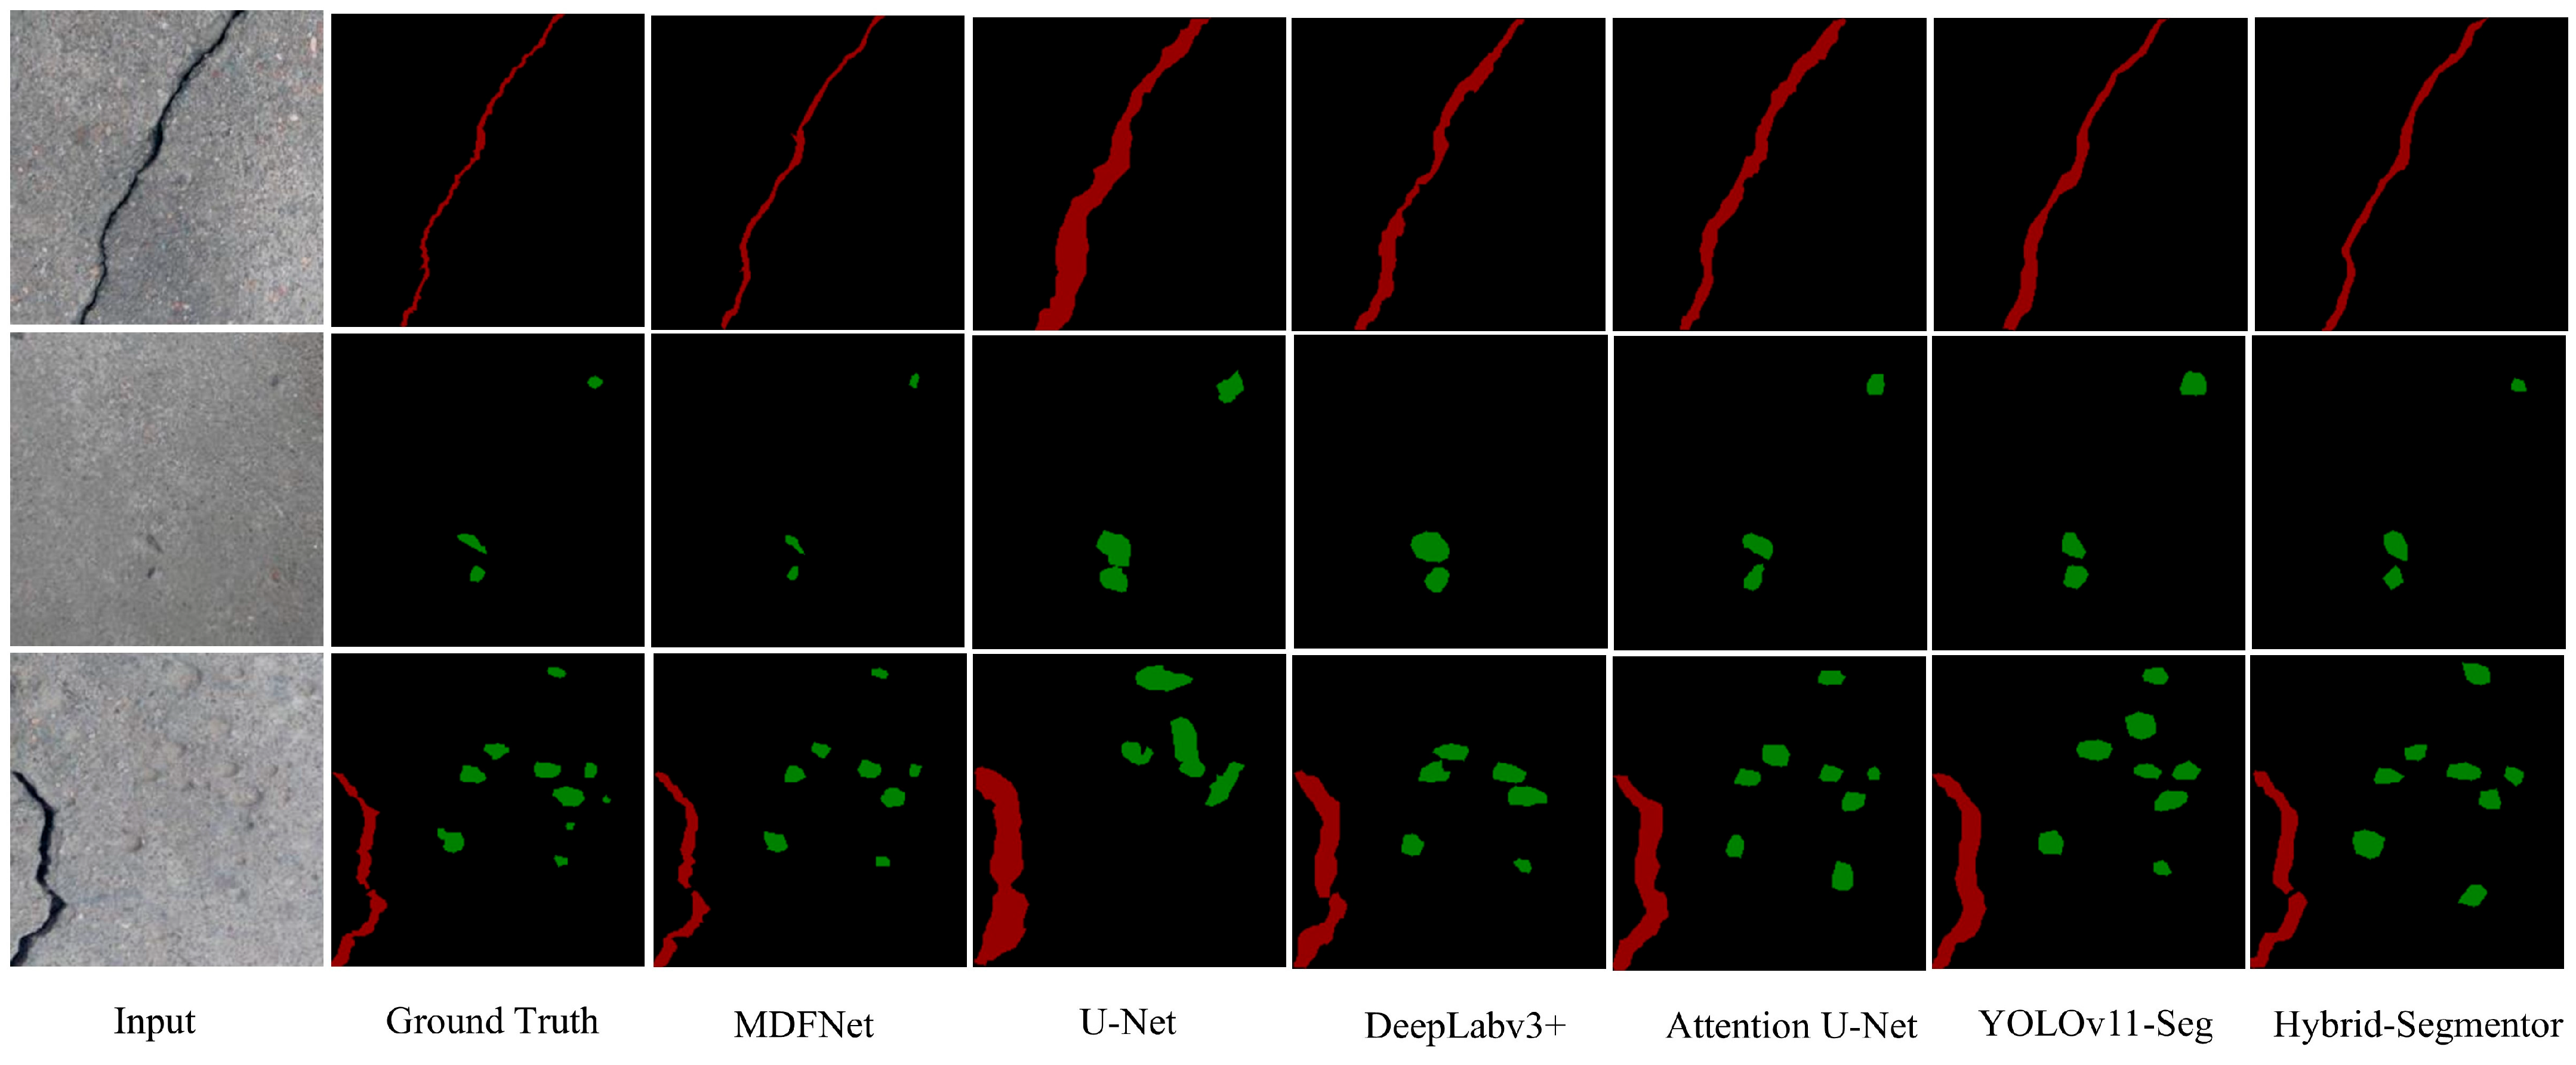
4.6. Visualization Comparison

As shown in Figure 10, to verify the superiority of MDFNet in concrete surface defect segmentation tasks, we visualized and analyzed its prediction results with U-Net, DeepLabv3+, Attention U-Net, Hybrid Segmentor, and YOLOv11. U-Net is stable in global contour capture, but it is prone to missing small dents and blurred boundaries; DeepLabv3+ accurately describes the boundaries of large cracks based on multi-scale features, but the segmentation of small defects is incomplete and prone to misclassification in complex backgrounds; Attention U-Net enhances the attention to defect areas through attention mechanisms, but its handling of small crack branches and complex indentation boundaries is still insufficient; YOLOv11 can accurately locate defect areas, but the segmentation is rough and can only generate block predictions, with poorly detailed descriptions. Compared to Hybrid Segmentor, MDFNet performs the best through collaborative optimization of global modeling and object detection, accurately capturing the shape and small branches of cracks, clearly segmenting the boundaries of dents, and effectively suppressing false positives and false negatives. Its segmentation results are closer to real labels, demonstrating strong detail capture and global modeling capabilities, providing a reliable solution for defect segmentation in complex scenes.

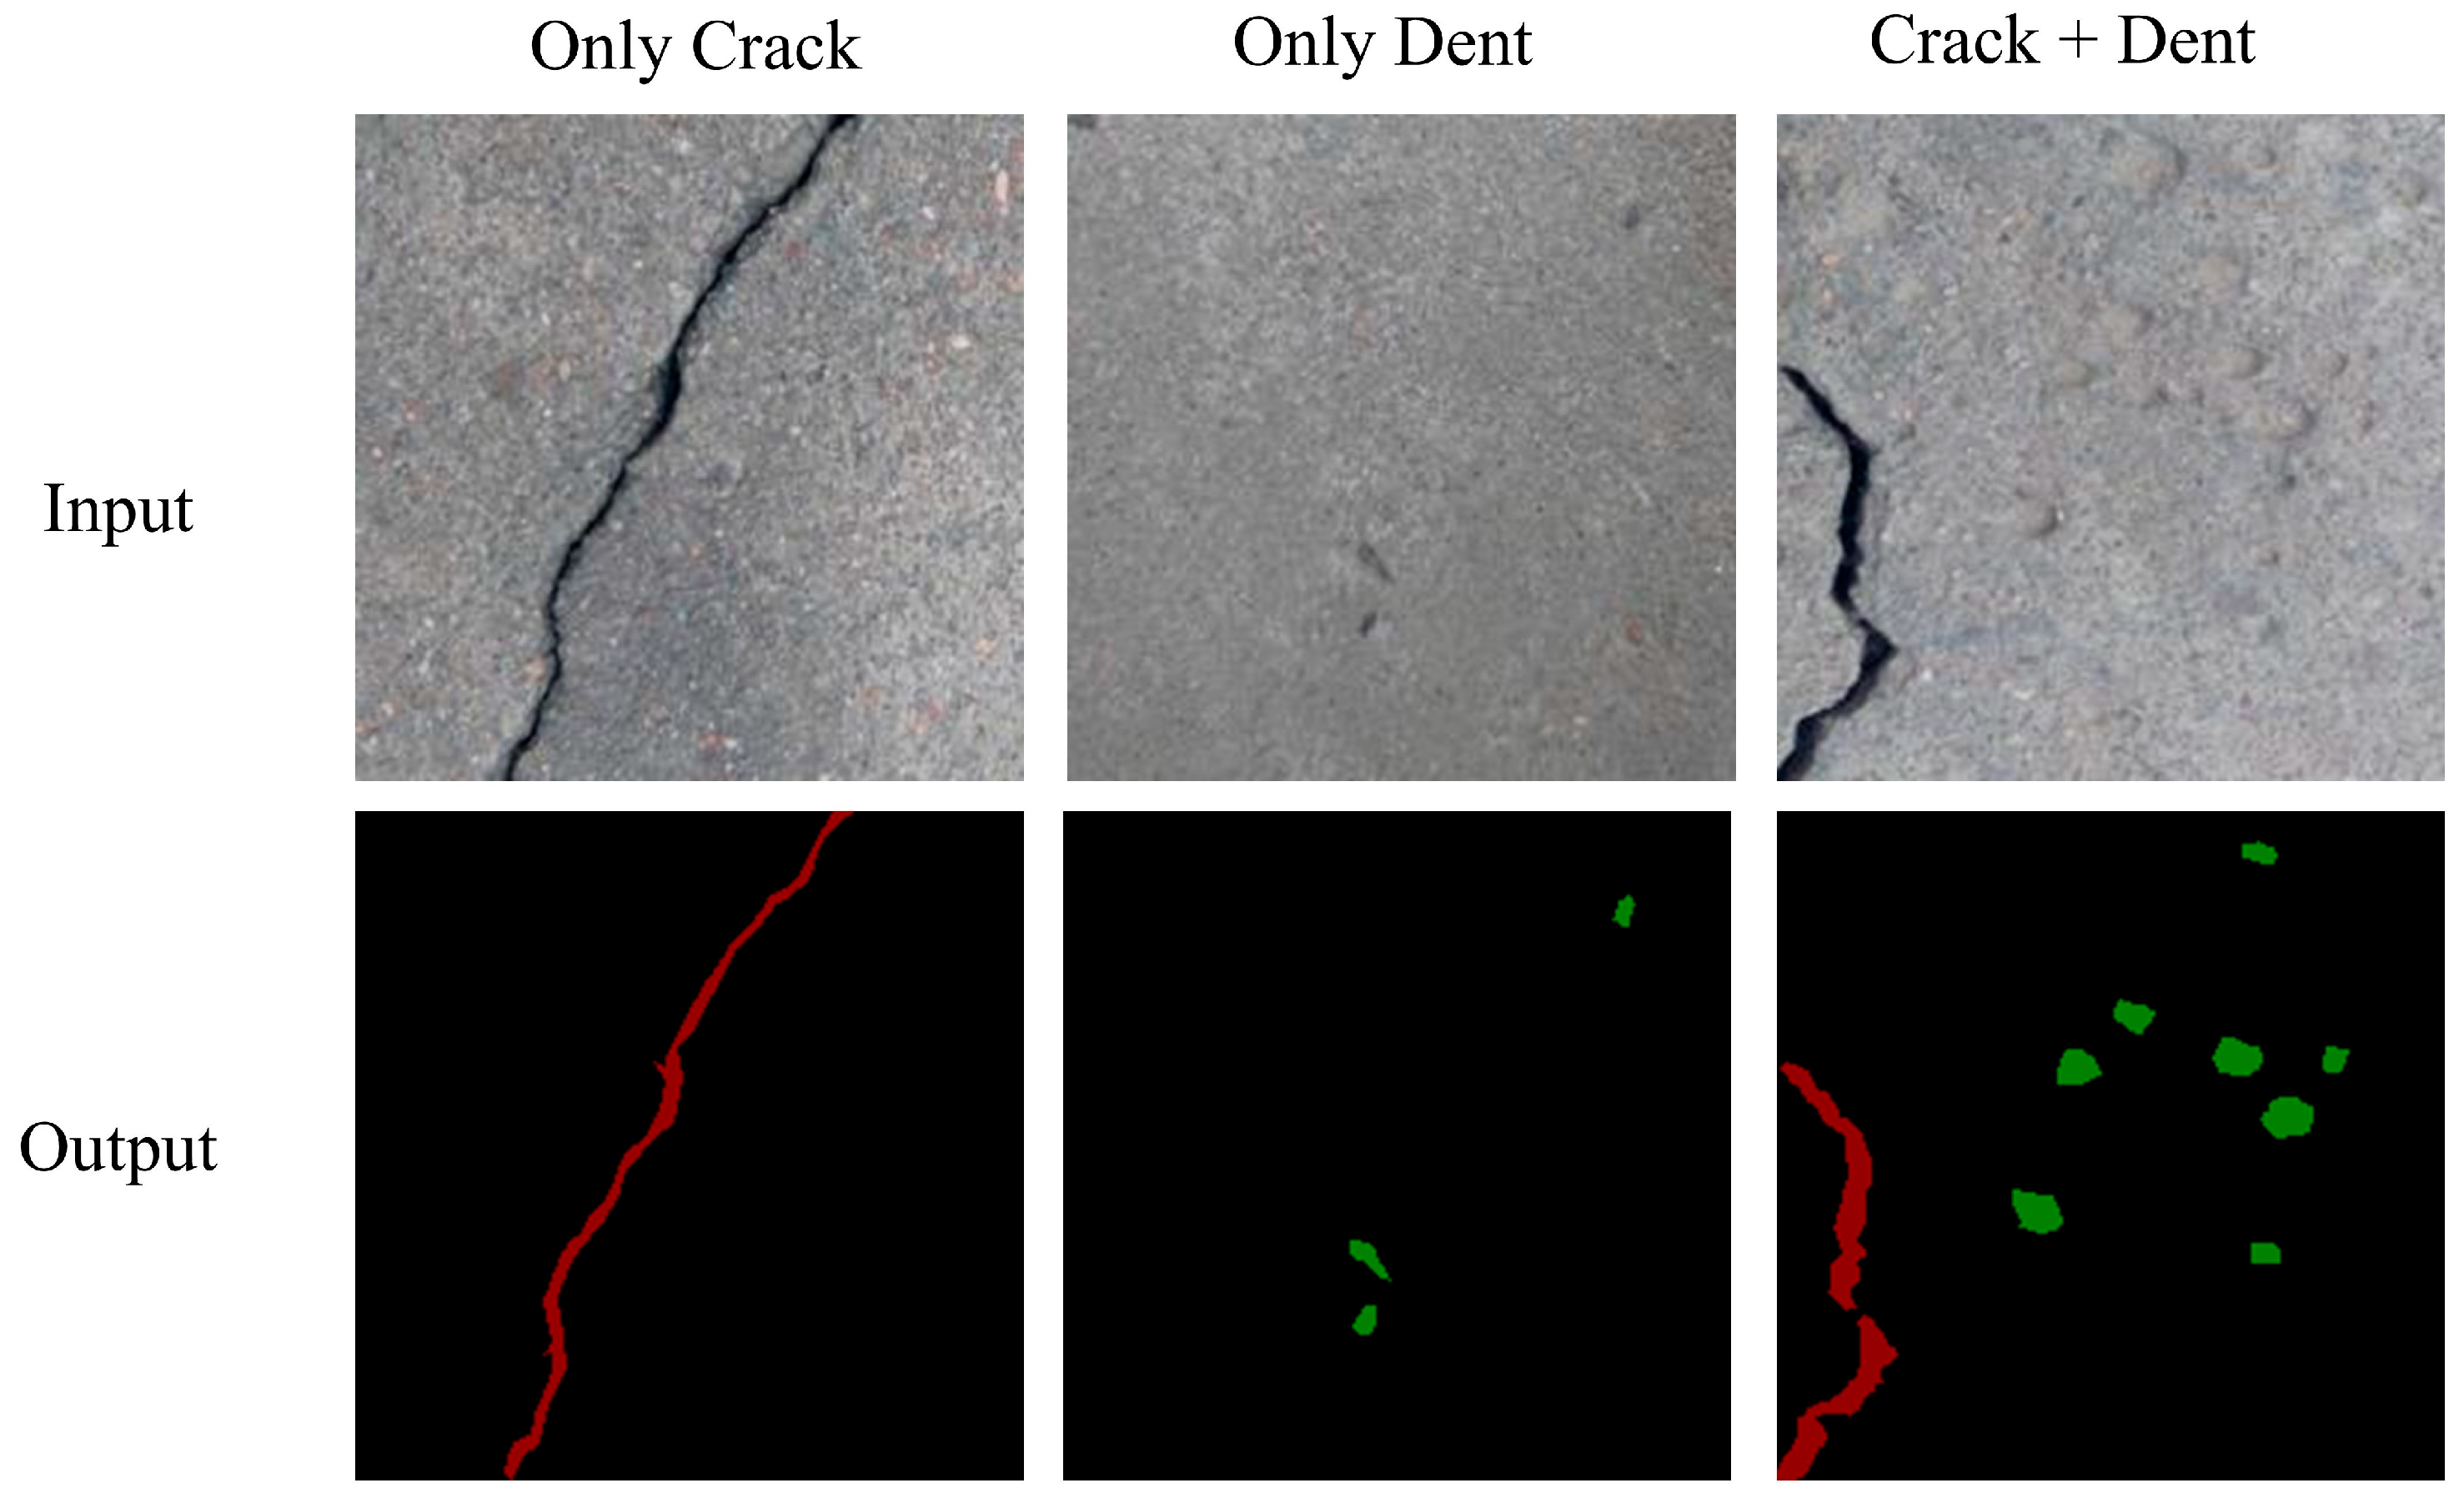
4.7. Model Output Visualization

To comprehensively verify the performance of MDFNet, we conducted input-output visualization analysis on three types of defect scenarios, including crack only, dent only, and mixed defect scenarios with both cracks and dents. As shown in Figure 11, in scenes with only cracks, MDFNet can accurately capture the main and small branches of cracks and effectively suppress interference features in complex backgrounds, resulting in clearer segmentation results and avoiding missed detections; in scenarios with only dents, the model utilizes an object detection module to accurately locate the dent area, while combining global contextual modeling capabilities to clearly depict the boundaries and shapes of dents, significantly suppress noise, and completely segment small dent defects. By combining the global feature extraction of the U-shaped structure with the region optimization of the object detection module, it can accurately identify cracks and dents simultaneously, achieving a balance between detail processing and global expression, and avoiding segmentation errors caused by multi-target interference. These results fully demonstrate that MDFNet has significant advantages in crack and dent defect segmentation tasks, demonstrating excellent robustness and applicability in both single target and multi-objective scenarios. Although MDFNet performs well in most scenarios, the segmentation results may not be accurate enough when the lighting is uneven or multiple defects are close together. It indicates that there is still room for improvement when the model copes with complex situations such as low contrast and multi-target interference, and the performance can be further optimized by finer feature extraction or a multi-scale strategy in the future.

5. Discussion

This research introduces the MDFNet deep detection network to tackle the challenges associated with inadequate multi-scale defect recognition capabilities, particularly the propensity for false detections of cracks, as well as the elevated missed detection rates of small targets, such as dents, prevalent in current detection methodologies. The network incorporates YOLOv11 as an auxiliary detection branch to bolster its efficacy in identifying surface defects in concrete. Additionally, a concrete defect dataset comprising 2500 high-resolution images has been developed, encompassing two predominant defect types: cracks and dents. The experimental findings reveal that MDFNet achieved a Dice coefficient of 92.4%, a mean average precision (mAP) of 95.6%, and a mean intersection over union (mIoU) of 81.6%, demonstrating superior performance in defect detection and segmentation tasks. MDFNet significantly surpasses the benchmark models across several key evaluation metrics, including YOLOv11 Seg (+3.8%) and Hybrid Segmentor (+4.8%), further affirming its enhanced capabilities in these tasks. Visual analyses indicate that MDFNet effectively mitigates the false detection rate of cracks and the missed detection rate of dents. Moreover, it was observed that the critical modules within MDFNet enhance accuracy while concurrently reducing inference speed. Future research may investigate lightweight strategies, such as channel pruning and knowledge distillation, to decrease the model’s parameter count and computational complexity, thereby rendering it more suitable for deployment in resource-constrained environments.

6. Conclusions

The MDFNet model achieves precise segmentation and feature enhancement of defect areas in input images through the collaborative design of modules B1 and B2. Module B1 adopts an improved U-shaped architecture, integrates the HAEConv module for multi-scale feature extraction, and optimizes skip connections by combining SE attention mechanisms, significantly improving the joint modeling ability of the model for global structure and local details. Module B2 uses a pre-trained YOLOv11 model to detect and depict defect areas, combined with an adaptive copy–paste strategy to ensure scale consistency of defect areas and generate target enhanced feature maps. Subsequently, the two-level HAEConv module further extracts deep semantic features. Finally, the basic feature map of module B1 is fused with the target-enhanced feature map of module B2, achieving a unified representation of global context and local defect features, significantly improving the segmentation performance of the model in complex backgrounds and multi-target scenes.
Despite MDFNet’s improvement in detection accuracy, its increased computational complexity leads to a reduction in FPS (frame rate), which can trigger significant constraints in real-world deployments. For example, on edge devices such as the Jetson Xavier NX, model inference is slower than YOLOv11, mainly stemming from the computational overhead of the HAEConv module’s multi-head attention. At the same time, the growth in the number of parameters leads to an increase in memory footprint, which may limit its application on resource-constrained devices such as mobile or embedded systems. The dependence of specific operators (e.g., high-dimensional feature mapping for HAEConv) on specific hardware acceleration libraries (e.g., CUDA) may further affect the compatibility of cross-platform deployments. Future work will incorporate techniques such as quantization, pruning or hardware-aware neural network search (NAS) to optimize real-time performance.

Author Contributions

Conceptualization, Z.Y., H.F. and Y.L.; methodology, Z.Y. and Y.L.; software, H.F., J.T. and C.-K.M.; validation, Z.Y. and Y.Z.; formal analysis, Z.Y.; investigation, J.T.; writing—original draft preparation, Z.Y.; resources, C.-L.C.; writing—review and editing, C.-K.M.; visualization, C.-L.C.; supervision, Y.Z. All authors have read and agreed to the published version of the manuscript.

Funding

The authors acknowledge the funding support from Universiti Teknologi Malaysia, Potential Academic Staff [Q.J130000.2722.03K62].

Institutional Review Board Statement

Not applicable.

Informed Consent Statement

Not applicable.

Data Availability Statement

For data supporting the results of this study, please contact the author for communication. Due to privacy, these data have not been made public.

Conflicts of Interest

The authors declare no conflicts of interest.

Appendix A

The B2 Copy–Pasting formula is as follows:
d i j = ( x i x j ) 2 + ( y i y j ) 2
x         y w       h =               x i + x j 2                                                             y i + y j 2       x i x j + w i + w j 2                   y i y j + h i + h j 2
When calculating the Euclidean distance d i j between the centroids of each prediction frame, the closest prediction frames are merged in order of distance from smallest to largest until three prediction frames are retained. The new prediction frame arises after merging ( x , y , w , h ) , where ( x i , y i ) and ( x j , y j ) are the coordinates of the centroids of the prediction frames, ( w j , h j ) and ( w i , h i ) are the width and height of the prediction frames, ( x , y ) are the coordinates of the centroids of the merged new prediction frames, and ( w , h ) are the width and height of the new prediction frames.
The target region is cropped from the original image by taking the coordinates of the new prediction frame ( x min : y min , x max : y max ) . To ensure the consistency of the size of the cropped regions, a Copy–Pasting strategy is used, where the cropped target regions are placed onto a background of predefined size, and the width of the filled edges is automatically calculated to ensure that the target regions maintain their original proportions and avoid feature distortion due to scaling. The filled regions are normalized to a uniform size, pasted onto the predefined background in turn, and stitched together to form a complete image containing all target regions. The formula is as follows:
w c r o p = I [ x min : x max ] ,   h c r o p = I [ y min : y max ] ,   I c r o p = I [ w c r o p , h c r o p ]
s = min ( W t w c r o p , H t h c r o p )
w = s w c r o p ,   h = s h c r o p
p w = W t w 2 ,   p h = H t h 2
I c r o p is the new prediction frame area, h c r o p is the height of the new prediction frame area, w c r o p is the width of the new prediction frame area, s is the filling ratio, W t and H t are the standard size of the target area (e.g., 640), h c r o p and w c r o p are scaled to obtain w and h , p w and p h are the background filling areas, and I c r o p is filled on the standard background image to generate the same size of the fill image I p a d d i n g n ( n = 1 , 2 , 3 ) . Concatenate the filled images I p a d d i n g n together as I f i n a l , as shown in Equation (A7):
I f i n a l = c o n c a t [ I p a d d e d 1 , I p a d d e d 2 , I p a d d e d 3 ]

References

  1. Fu, H.; Tian, J.; Chin, C.-L.; Liu, H.; Yuan, J.; Tang, S.; Mai, R.; Wu, X. Axial compression behavior of GFRP-steel composite tube confined seawater sea-sand concrete intermediate long columns. Eng. Struct. 2025, 333, 120157. [Google Scholar] [CrossRef]
  2. Fu, H.; Guo, K.; Wu, Z.; Mai, R.; Chin, C.-L. Experimental Investigation of a Novel CFRP-Steel Composite Tube-Confined Seawater-Sea Sand Concrete Intermediate Long Column. Int. J. Integr. Eng. 2024, 16, 466–475. [Google Scholar] [CrossRef]
  3. Khan, S.M.; Atamturktur, S.; Chowdhury, M.; Rahman, M. Integration of Structural Health Monitoring and Intelligent Transportation Systems for Bridge Condition Assessment: Current Status and Future Direction. IEEE Trans. Intell. Transp. Syst. 2016, 17, 2107–2122. [Google Scholar] [CrossRef]
  4. Fu, H.; Zhao, H.; Pan, Z.; Wu, Z.; Chin, C.-L.; Ma, C.-K. Behaviour of corroded circular steel tube strengthened with external FRP tube grouting under eccentric loading: Numerical study. Structures 2023, 56, 104810. [Google Scholar] [CrossRef]
  5. Fu, H.; Zhang, J.; Wu, Z.; Chin, C.-L.; Ma, C.-K. Nonlinear analysis of axial-compressed corroded circular steel pipes reinforced by FRP-casing grouting. J. Constr. Steel Res. 2023, 201, 107689. [Google Scholar] [CrossRef]
  6. König, J.; Jenkins, M.; Mannion, M.; Barrie, P.; Morison, G. What's cracking? A review and analysis of deep learning methods for structural crack segmentation, detection and quantification. arXiv 2022, arXiv:2202.03714. [Google Scholar]
  7. Phares, B.M.; Rolander, D.D.; Graybeal, B.A.; Washer, G.A. Reliability of visual bridge inspection. Public Roads 2001, 64, 22–29. [Google Scholar]
  8. Li, P.; Xia, H.; Zhou, B.; Yan, F.; Guo, R. A method to improve the accuracy of pavement crack identification by combining a semantic segmentation and edge detection model. Appl. Sci. 2022, 12, 4714. [Google Scholar] [CrossRef]
  9. Han, H.; Deng, H.; Dong, Q.; Gu, X.; Zhang, T.; Wang, Y. An advanced Otsu method integrated with edge detection and decision tree for crack detection in highway transportation infrastructure. Adv. Mater. Sci. Eng. 2021, 2021, 9205509. [Google Scholar] [CrossRef]
  10. Konig, J.; Jenkins, M.D.; Mannion, M.; Barrie, P.; Morison, G. Weakly-Supervised Surface Crack Segmentation by Generating Pseudo-Labels Using Localization With a Classifier and Thresholding. IEEE Trans. Intell. Transp. Syst. 2022, 23, 24083–24094. [Google Scholar] [CrossRef]
  11. Liang, J.; Gu, X.; Chen, Y. Fast and robust pavement crack distress segmentation utilizing steerable filtering and local order energy. Constr. Build. Mater. 2020, 262, 120084. [Google Scholar] [CrossRef]
  12. Adhikari, R.S.; Moselhi, O.; Bagchi, A. Image-based retrieval of concrete crack properties for bridge inspection. Autom. Constr. 2014, 39, 180–194. [Google Scholar] [CrossRef]
  13. Di Benedetto, A.; Fiani, M.; Gujski, L.M. U-Net-based CNN architecture for road crack segmentation. Infrastructures 2023, 8, 90. [Google Scholar] [CrossRef]
  14. He, K.; Zhang, X.; Ren, S.; Sun, J. Deep residual learning for image recognition. In Proceedings of the IEEE Conference on Computer Vision and Pattern Recognition, Las Vegas, NV, USA, 27–30 June 2016; pp. 770–778. [Google Scholar]
  15. Ronneberger, O.; Fischer, P.; Brox, T. U-Net: Convolutional Networks for Biomedical Image Segmentation. In Medical Image Computing and Computer-Assisted Intervention–MICCAI 2015; Navab, N., Hornegger, J., Wells, W., Frangi, A., Eds.; Springer: Cham, Switzerland, 2015; Volume 9351, Lecture Notes in Computer Science. [Google Scholar] [CrossRef]
  16. Kim, B.; Cho, S. Automated Vision-Based Detection of Cracks on Concrete Surfaces Using a Deep Learning Technique. Sensors 2018, 18, 3452. [Google Scholar] [CrossRef] [PubMed] [PubMed Central]
  17. Krizhevsky, A.; Sutskever, I.; Hinton, G.E. ImageNet Classification with Deep Convolutional Neural Networks. In Advances in Neural Information Processing Systems; Pereira, F., Burges, C.J., Bottou, L., Weinberger, K.Q., Eds.; Curran Associates, Inc: Red Hook, NY, USA, 2012; Volume 25, Available online: https://proceedings.neurips.cc/paper_files/paper/2012/file/c399862d3b9d6b76c8436e924a68c45b-Paper.pdf (accessed on 25 January 2020).
  18. Kang, D.; Benipal, S.S.; Gopal, D.L.; Cha, Y.-J. Hybrid pixel-level concrete crack segmentation and quantification across complex backgrounds using deep learning. Autom. Constr. 2020, 118, 103291. [Google Scholar] [CrossRef]
  19. Ren, S.; He, K.; Girshick, R.; Sun, J. Faster R-CNN: Towards Real-Time Object Detection with Region Proposal Networks. In Advances in Neural Information Processing Systems; Cortes, C., Lawrence, N., Lee, D., Sugiyama, M., Garnett, R., Eds.; Curran Associates, Inc.: Red Hook, NY, USA, 2015; Volume 28, Available online: https://proceedings.neurips.cc/paper_files/paper/2015/file/14bfa6bb14875e45bba028a21ed38046-Paper.pdf (accessed on 18 January 2020).
  20. Shi, Z.; Jin, N.; Chen, D.; Ai, D. A comparison study of semantic segmentation networks for crack detection in construction materials. Constr. Build. Mater. 2024, 414, 134950. [Google Scholar] [CrossRef]
  21. Hu, J.; Shen, L.; Sun, G. Squeeze-and-excitation networks. In Proceedings of the IEEE Conference on Computer Vision and Pattern Recognition, Salt Lake City, UT, USA, 18–23 June 2018; pp. 7132–7141. [Google Scholar]
  22. Wang, Z.; Jin, L.; Wang, S.; Xu, H. Apple stem/calyx real-time recognition using YOLO-v5 algorithm for fruit automatic loading system. Postharvest Biol. Technol. 2022, 185, 111808. [Google Scholar] [CrossRef]
  23. Li, C.; Li, L.; Jiang, H.; Weng, K.; Geng, Y.; Li, L.; Ke, Z.; Li, Q.; Cheng, M.; Nie, W.; et al. YOLOv6: A single-stage object detection framework for industrial applications. arXiv 2022, arXiv:2209.02976. [Google Scholar]
  24. Wang, C.Y.; Bochkovskiy, A.; Liao, H.Y.M. YOLOv7: Trainable bag-of-freebies sets new state-of-the-art for real-time object detectors. In Proceedings of the IEEE/CVF Conference on Computer Vision and Pattern Recognition, Vancouver, BC, Canada, 17–24 June 2023; pp. 7464–7475. [Google Scholar]
  25. Nyathi, M.A.; Bai, J.; Wilson, I.D. Deep Learning for Concrete Crack Detection and Measurement. Metrology 2024, 4, 66–81. [Google Scholar] [CrossRef]
  26. Terven, J.; Córdova-Esparza, D.M.; Romero-González, J.A. A comprehensive review of yolo architectures in computer vision: From yolov1 to yolov8 and yolo-nas. Mach. Learn. Knowl. Extr. 2023, 5, 1680–1716. [Google Scholar] [CrossRef]
  27. Vaswani, A.; Shazeer, N.; Parmar, N.; Uszkoreit, J.; Jones, L.; Gomez, A.N.; Kaiser, Ł.; Polosukhin, I. Attention is All you Need. In Advances in Neural Information Processing Systems; Guyon, I., Luxburg, U.V., Bengio, S., Wallach, H., Fergus, R., Vishwanathan, S., Garnett, R., Eds.; Curran Associates, Inc.: Red Hook, NY, USA, 2017; Volume 30, Available online: https://proceedings.neurips.cc/paper_files/paper/2017/file/3f5ee243547dee91fbd053c1c4a845aa-Paper.pdf (accessed on 18 January 2025).
  28. Dosovitskiy, A.; Beyer, L.; Kolesnikov, A.; Weissenborn, D.; Zhai, X.; Unterthiner, T.; Dehghani, M.; Minderer, M.; Heigold, G.; Gelly, S.; et al. An Image is Worth 16x16 Words: Transformers for Image Recognition at Scale. arXiv 2021, arXiv:2010.11929. [Google Scholar]
  29. Liu, Z.; Lin, Y.; Cao, Y.; Hu, H.; Wei, Y.; Zhang, Z.; Lin, S.; Guo, B. Swin Transformer: Hierarchical Vision Trans-former using Shifted Windows. In Proceedings of the 2021 IEEE/CVF International Conference on Computer Vision (ICCV), Montreal, QC, Canada, 10–17 October 2021; pp. 9992–10002. [Google Scholar]
  30. Tao, H.; Liu, B.; Cui, J.; Zhang, H. A Convolutional-Transformer Network for Crack Segmentation with Boundary Awareness. In Proceedings of the 2023 IEEE International Conference on Image Processing (ICIP), Kuala Lumpur, Malaysia, 8–11 October 2023; pp. 86–90. [Google Scholar] [CrossRef]
  31. Zhou, J.; Zhao, G.; Li, Y. Vison Transformer-Based Automatic Crack Detection on Dam Surface. Water 2024, 16, 1348. [Google Scholar] [CrossRef]
  32. Han, X.; Zheng, J.; Chen, L.; Chen, Q.; Huang, X. Semantic segmentation model for concrete cracks based on parallel Swin-CNNs framework. Struct. Health Monit. 2024, 23, 3731–3747. [Google Scholar] [CrossRef]
  33. Dong, X.; Liu, Y.; Dai, J. Concrete Surface Crack Detection Algorithm Based on Improved YOLOv8. Sensors 2024, 24, 5252. [Google Scholar] [CrossRef] [PubMed]
  34. Khanam, R.; Hussain, M. Yolov11: An overview of the key architectural enhancements. arXiv 2024, arXiv:2410.17725. [Google Scholar]
  35. Loshchilov, I.; Hutter, F. Fixing weight decay regularization in adam. arXiv 2017, arXiv:1711.05101. [Google Scholar]
  36. Oktay, O.; Schlemper, J.; Folgoc, L.L.; Lee, M.; Heinrich, M.; Misawa, K.; Mori, K.; McDonagh, S.; Hammerla, N.Y.; Kainz, B.; et al. Attention U-Net: Learning Where to Look for the Pancreas. arXiv 2018, arXiv:1804.03999. [Google Scholar]
  37. Goo, J.M.; Milidonis, X.; Artusi, A.; Boehm, J.; Ciliberto, C. Hybrid-Segmentor: Hybrid approach for automated fine-grained crack segmentation in civil infrastructure. Autom. Constr. 2025, 170, 105960. [Google Scholar] [CrossRef]
Figure 1. The network structure of MDFNet.
Buildings 15 01657 g001
Figure 2. The structure of SE block.
Buildings 15 01657 g002
Figure 3. The structure of YOLOv11 and copy–pasting module.
Buildings 15 01657 g003
Figure 4. HAEConv block structure.
Buildings 15 01657 g004
Figure 5. The legend demonstrates the prediction box fusion method.
Buildings 15 01657 g005
Figure 6. Enhanced visualization of image data for training.
Buildings 15 01657 g006
Figure 7. MDFNet model training loss curve.
Buildings 15 01657 g007
Figure 8. When the YOLO11 prediction box is greater than 3, the processing flow of the prediction box. (a) Before fusion; (b) after fusion.
Buildings 15 01657 g008
Figure 9. Comparison of performance trade-offs between FPS and MAP for different models.
Buildings 15 01657 g009
Figure 10. Comparison of prediction results among U-Net, DeepLabv3+, Attention U-Net, YOLOv11-SEG, Hybrid-Segmentor and MDFNet.
Buildings 15 01657 g010
Figure 11. Output results of the MDFNet model.
Buildings 15 01657 g011
Table 1. The distribution of training, validation, and testing datasets is displayed. The ‘Only cracks’, ‘Only dents’, and ‘Including cracks and dents’ categories contain 1107, 761, and 632 images, respectively, and each category is divided into training/validation/retention test sets at a ratio of 70%/20%/10%.
TypeTrainingValidationTesting
Only cracks775111221
Only dents53276153
Including cracks and dents44363126
Table 2. Experiments on tuning weighting factors in loss functions.
α:βPrecisionRecallF1-ScoreFP RateFN Rate
0.3:0.782.4%91.2%86.50.180.09
0.5:0.586.7%89.2%87.90.120.11
0.7:0.390.1%83.6%86.70.070.16
Table 3. Results of MDFNet model ablation experiment.
ModelModuleEvaluation
HAEConvSEB2Dice (%)MAP (%)mIoU (%)FPS
Baseline 80.178.571.367
M1 86.887.276.248
M2 83.880.873.352
M3 84.585.474.851
M4 89.591.277.646
M5 90.193.378.750
MDFNet92.495.681.645
Table 4. Comparison experiment between MDFNet and other models.
ModelDice (%)MAP (%)mIoU (%)FPS
U-Net80.178.571.367
DeepLabv3+82.382.775.952
Attention U-Net85.184.274.443
YOLOv11-Seg88.691.276.1113
Hybrid-Segmentor87.689.578.435
MDFNet92.495.681.645
Disclaimer/Publisher’s Note: The statements, opinions and data contained in all publications are solely those of the individual author(s) and contributor(s) and not of MDPI and/or the editor(s). MDPI and/or the editor(s) disclaim responsibility for any injury to people or property resulting from any ideas, methods, instructions or products referred to in the content.

