Article

Experimental Study on Punching Shear Behavior of Ultra-High-Performance Concrete (UHPC) Slabs

1
College of Civil Engineering, Fuzhou University, Fuzhou 350025, China
2
Faculty of Engineering, Pharos University, Alexandria 21648, Egypt
3
Faculty of Engineering, Tanta University, Tanta 31527, Egypt
4
Department of Civil Engineering, Toronto Metropolitan University, Toronto, ON M5B 2K3, Canada
*
Author to whom correspondence should be addressed.
Buildings 2025, 15(10), 1656; https://doi.org/10.3390/buildings15101656
Submission received: 22 April 2025 / Revised: 10 May 2025 / Accepted: 12 May 2025 / Published: 14 May 2025

Abstract

:
This study assesses the punching shear characteristics of ultra-high-performance concrete (UHPC) slabs in two phases. The initial phase involved experimental tests to determine the critical thickness differentiating punching shear failure and flexural failure modes. Subsequently, the second phase further explored the punching shear behavior of UHPC slabs by analyzing various key parameters. The experimental findings indicated that as the thickness of the slabs increased, the punching shear capacity exhibited nearly linear enhancement, surpassing the improvement seen in bending capacity. Thus, a critical thickness of at least 100 mm was identified as the threshold distinguishing punching shear failure from flexural failure. Additionally, an increase in slab thickness significantly elevated the cracking load of the UHPC slabs. While a higher reinforcement ratio of 3.5% slightly increased the first cracking load, it greatly enhanced the ultimate capacity. The addition of steel fibers also contributed to improvements in both cracking and ultimate loads, albeit to a limited extent. The use of a granite powder substitute, comprising 10% of the mass of silica fume, had minimal impact on the punching shear capacity of the UHPC slabs. Finally, a comparison is drawn between the experimental results for punching shear capacity and those obtained from various theoretical models. This comparison highlights significant discrepancies in the results, stemming from the differing parameters employed in the proposed theoretical models. Among the prediction models, the JSCE model provided the most balanced and conservatively accurate estimation of punching shear capacity, effectively incorporating the effects of slab thickness, reinforcement ratio, and fiber content, thus highlighting its potential as a reliable reference for future design recommendations. This information will serve as a valuable reference for future research and practical applications related to UHPC bridge decks and slabs.

1. Introduction

Flat slabs are regarded as one of the most advantageous flooring systems in reinforced concrete structures due to their lower construction costs and the simplicity of installing utility services. Nevertheless, because they transfer loads over a limited area of the supporting columns, they are susceptible to punching shear failure. This failure mode is also a significant concern for the deck slabs of reinforced concrete bridges, particularly owing to the localized loads from truck traffic. Punching shear failure is characterized by a sudden and brittle collapse that occurs unexpectedly on the compression side of the slab. Consequently, some building codes permit the use of specialized reinforcement to counteract the punching shear stress, while others do not allow the addition of extra reinforcement to resist punching shear [1,2,3,4,5,6].
The mechanism of shear transfer in reinforced concrete flat slabs without shear reinforcement is fundamentally dependent on the shear resistance provided by the un-cracked concrete within the compression zone, aggregate interlock at the interface, and the dowel action resulting from the flexural reinforcement that crosses the crack. Consequently, the compressive strength of the concrete emerges as a critical factor influencing the shear resistance of the flat slab against punching failure [7,8]. It was found that the inclination of the punching failure surface varied based on the concrete strength [9]. Furthermore, as flexural cracks develop before the onset of punching shear failure at the column’s location, the influence of aggregate interlock is significantly reduced.
Over the years, numerous techniques for enhancement and strengthening have been developed to increase the punching shear resistance of reinforced concrete flat slabs. These techniques include using traditional shear reinforcement, which may take the form of single or multiple-leg stirrups, swimmer shear bars, bent-up bars, inclined stirrups, inclined shear band reinforcement, post-installed reinforcement, steel links, steel assemblies, external steel plates with shear studs anchored in steel, an external layer of SHCC, steel shear heads, shear studs with either single or double heads, helical reinforcement, and external CFRP/GFRP stirrups or rods, as well as externally bonded CFRP/GFRP laminates, strips, and mesh reinforcement [10,11,12,13,14,15,16,17,18,19,20,21,22,23,24,25,26,27,28,29,30,31,32]. While these retrofitting techniques enhance the punching shear strength of flat slabs, the capacity for deformation remains constrained. An alternative approach involves the application of ultra-high-performance fiber reinforced concrete (UHPFRC) overlay, which has the potential to enhance both the flexural and shear strength, as well as the ductility of the existing flat slabs [33,34,35,36,37,38,39].
Ultra-high-performance concrete (UHPC) represents a category of advanced cementitious materials characterized by outstanding mechanical properties, enhanced ductility, remarkable durability, and a notably high capacity for energy absorption. The incorporation of steel fibers in UHPC serves to improve both pre-crack and post-crack tensile strengths, as well as to augment its ductility [40]. Incorporating steel fibers in fiber-reinforced concrete (FRC) slabs significantly improves the performance of slab–column connections, as these fibers enhance tensile strength, ductility, and energy dissipation capabilities [41,42]. Furthermore, Ultra-High-Performance Fiber-Reinforced Concrete (UHPFRC) mixtures resulted in enhanced initial stiffness, improved punching shear strength, and greater deformation capacity, along with a modification in the failure mode of the slab [43]. The steel fibers enhance the tensile strength and toughness of concrete through a bridging mechanism, resulting in improved punching shear capacity [44,45]. The bridging effects of steel fibers in UHPC can mitigate the brittle characteristics of two-way slabs with punching shear failure. Under the same reinforcement ratio, the ductility index of steel-reinforced slabs was far higher than that of FRP-reinforced UHPC slabs due to the yielding of steel bars [46].
Currently, research on UHPC materials and their engineering applications is increasingly prevalent. UHPC has been utilized in various applications, including cast-in-place grout material for bridge connections and decks [47,48,49,50,51], and strengthening of existing structures [34,52]. Concerning bridge decks, those constructed from conventional concrete often exhibit certain drawbacks, including susceptibility to early cracking and diminished durability. These issues can lead to increased maintenance and rehabilitation expenses, potentially compromising the overall safety of the structure. The utilization of UHPC for bridge deck construction can significantly enhance durability, allowing for a reduction in deck thickness, which in turn decreases deadweight. This presents notable economic advantages for long-span bridge designs. Nevertheless, the reduction in thickness raises concerns regarding the potential for brittle failures due to punching shear, an important consideration that warrants careful attention.
UHPC has gained significant attention for its application in thin bridge slabs due to its superior mechanical properties and durability. Several projects worldwide have successfully implemented UHPC in bridge construction, showcasing its benefits. For instance, the U.S. I-35W St. Anthony Falls Bridge, located in Minneapolis, Minnesota, exemplifies a project utilizing UHPC for its cast-in-place forms and deck panels. The use of UHPC has contributed to the bridge’s longevity and reduced maintenance costs. Another example is the Solaire Bridge in New York City, which integrates UHPC for its lightweight yet robust deck system, allowing for efficient construction and enhanced performance over time. Additionally, the Hegau Bridge in Germany demonstrates the successful application of UHPC for both structural elements and aesthetic features, benefiting from the material’s high tensile strength and resistance to environmental factors [53].
Limited research has been undertaken regarding the punching shear characteristics of flat slabs constructed solely from UHPC [54,55]. The study indicates that the punching shear strength of UHPC slabs is primarily influenced by the cracking strength of UHPC, rather than its ultimate tensile strength [56]. Due to the high cost of UHPC, certain researchers have explored its partial application in column areas, while utilizing normal concrete (NC) in other sections to create a hybrid NC/UHPC flat slab [37,57].
During bridge decks’ loading, bending, and punching, shear actions interact, leading to potential failure modes in UHPC slabs, which may manifest as either flexural or punching shear failure. From an engineering design perspective, punching shear failure is characterized as a brittle failure that should be mitigated. Consequently, this paper initially presents an experimental study to determine the critical thickness of UHPC slabs that delineate flexural failure from punching shear failure. Following this, the influence of key parameters on the punching shear performance was examined. Based on the findings from the tests, a calculation method for assessing the punching shear capacity of UHPC bridge decks was proposed, offering valuable insights for engineering applications and further investigations into UHPC slabs.

2. Experimental Program

The primary aim of the experimental program is to ascertain the critical thickness of UHPC slabs that distinguish flexural failure from punching shear failure and to study the effect of governing parameters on punching shear strength. Typically, the loading area and thickness of the slab predominantly influence the punching shear behavior of concrete slabs. Accordingly, the experimental program consists of two phases: Phase I and Phase II. Thus, Phase I focuses solely on the impact of slab thickness and includes a comparison with one normal-strength concrete (NSC) slab alongside the UHPC slabs. On the other hand, Phase II investigates the effect of governing parameters, including the reinforcement ratio of the slab tensile reinforcing steel, the substitution rate of granite powder, and the internal steel fiber volumetric ratio, on punching shear strength.

2.1. Specimen Characterizations

The test matrix includes eleven square two-way slab specimens, of which ten are constructed from UHPC. In contrast, the remaining slab is made from normal-strength concrete (NSC) for comparison purposes. These slabs are divided into two groups corresponding to two phases. Phase I includes five UHPC slabs along with one NSC slab, while Phase II contains five UHPC slabs. All slab specimens have planar dimensions of 1200 mm by 1200 mm, with a center-to-center span of 1000 mm in both directions. For the slabs of Phase I, the thicknesses of the UHPC slabs vary, measuring 50 mm, 65 mm, 75 mm, 85 mm, and 100 mm, respectively. In contrast, the NSC concrete slab has a thickness of 100 mm. It is worth mentioning that the thickness parameter was established based on structural requirements dictated by load-bearing calculations and serviceability criteria.
All specimens are reinforced in both directions with a single layer of rebar, specifically Φ12@90 mm, positioned at the bottom of the slabs, maintaining a concrete cover thickness of 15 mm. The range of reinforcement was selected based on recommendations of design standards and previous research that indicate optimal performance characteristics in similar applications. By analyzing existing literature and empirical data, we aimed to identify a range that balances structural integrity with material efficiency, ensuring that the slabs can withstand anticipated loads while minimizing excess material use. Table 1 provides a summary of the test matrix for all slabs in both Phase I and Phase II. For the slabs of Phase I, the thicknesses of all UHPC slabs are kept at 50 mm. Meanwhile, the reinforcement ratio of the slab tensile reinforcing steel was varied (0%, 1.34%, and 3.5%), the substitution rate of granite powder was switched at this phase to 10%, and the internal steel fiber volumetric ratio varied (0%, 1%, 2%, and 3%). The inclusion of steel fibers was determined by evaluating their impact on enhancing tensile strength and ductility in concrete. The specific content range was chosen after conducting preliminary tests that demonstrated significant improvements in performance metrics at those concentrations.
In summary, the chosen tested slab configurations and parameters were not arbitrarily selected; they are based on a combination of empirical evidence, theoretical frameworks, and adherence to design requirements aimed at optimizing both safety and functionality in practical applications.
The mixing proportion of UHPC, as primarily referenced in [58] and illustrated in Table 2, shows that 10% of the silica fume mass was substituted with granite powder. In comparison, steel fibers were incorporated at a mass ratio of 2%. Steel fibers were added at the end of the mixing process to mitigate agglomeration. Subsequently, the UHPC mixture was poured into the formwork, followed by manual vibration and smoothing. The curing process for the specimens comprised three distinct stages: (1) Natural curing stage. Upon finishing the fabrication of the specimens, all were covered with plastic sheeting, and this natural curing phase lasted for 48 h. (2) Steam curing stage. Following the natural curing phase, all formworks were removed, and the specimens, along with the mechanical materials, were sealed with plastic sheeting. This steam curing phase lasted for 72 h, during which the internal temperature was maintained at 98 ± 5 °C and the internal humidity exceeded 95%. For the steam treatment of concrete slabs, it is crucial to ensure uniform temperature distribution throughout the entire volume of the slabs during the heat and moisture treatment process. Temperature variations can lead to gradients that may adversely affect the mechanical properties and overall strength of large specimens. To achieve uniformity, several strategies have been implemented: (a) utilizing a well-designed steam chamber that allows for consistent heat distribution to minimize temperature differentials; (b) employing thermocouples at various locations within the slab to help in monitoring temperature variations in real-time, ensuring adjustments can be made as needed; (c) ensuring that slabs are positioned optimally within the treatment chamber, which also aids in achieving even exposure to steam and heat. By addressing these factors, it is possible to mitigate the risks associated with temperature gradients, thereby enhancing the strength and durability of concrete slabs subjected to steam treatment. (3) Natural curing stage. After the steam curing was completed, the plastic sheeting was removed, and water was regularly sprinkled over the specimens for 7 days to ensure the surface remained moist.
The three-stage curing regime adopted in this study (initial natural curing, followed by controlled steam curing, and final moist curing) was designed to ensure uniform strength development and reduce internal stress gradients within the UHPC matrix. While multi-stage curing processes inherently introduce the potential for variability in hydration and microstructure development [59,60], the observed low coefficient of variation (COV ≈ 4%) in compressive and flexural strength results indicates that the adopted curing method provided a high level of consistency across specimens. Similar observations were reported by Brühwiler and Bastien-Masse [34], who noted that well-controlled curing protocols in UHPC production led to low strength variability and enhanced structural reliability. Nevertheless, minor variations in temperature or moisture gradients during steam curing could still contribute to localized differences in strength, and such effects should be further investigated in future work using non-destructive techniques.
During the casting process of the slab specimens, standard cubes and prisms were concurrently cast and cured alongside the specimens to determine the mechanical properties of the concrete used. The average cubic compressive strength of UHPC was recorded at 120.34 MPa with a coefficient of variation COV of 0.036, with an elastic modulus of 38.33 GPa, and a flexural strength of 20.71 MPa with a coefficient of variation COV of 0.041. In contrast, the average cubic compressive strength of C50 concrete was measured at 50.15 MPa with a coefficient of variation COV of 0.044, while its elastic modulus was 36.88 GPa. Regarding the tensile steel reinforcing bars, the average yield strength was determined to be 410.6 MPa with a coefficient of variation COV of 0.021, the average tensile strength was 513.7 MPa with a coefficient of variation COV of 0.022, and the average elastic modulus was 201.8 GPa.

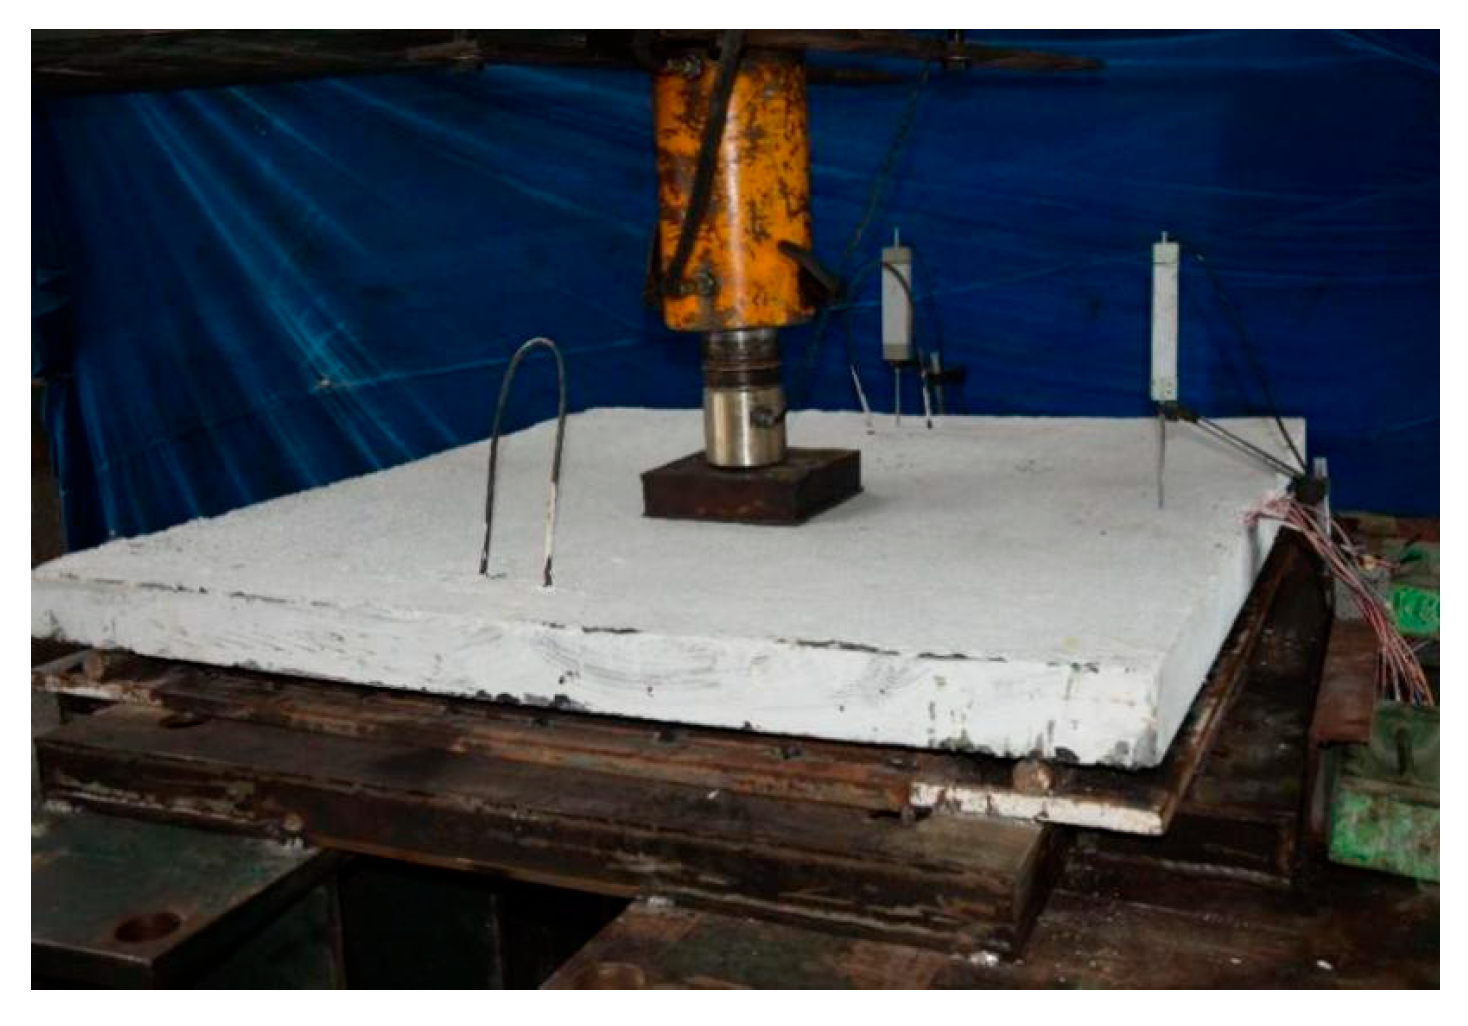
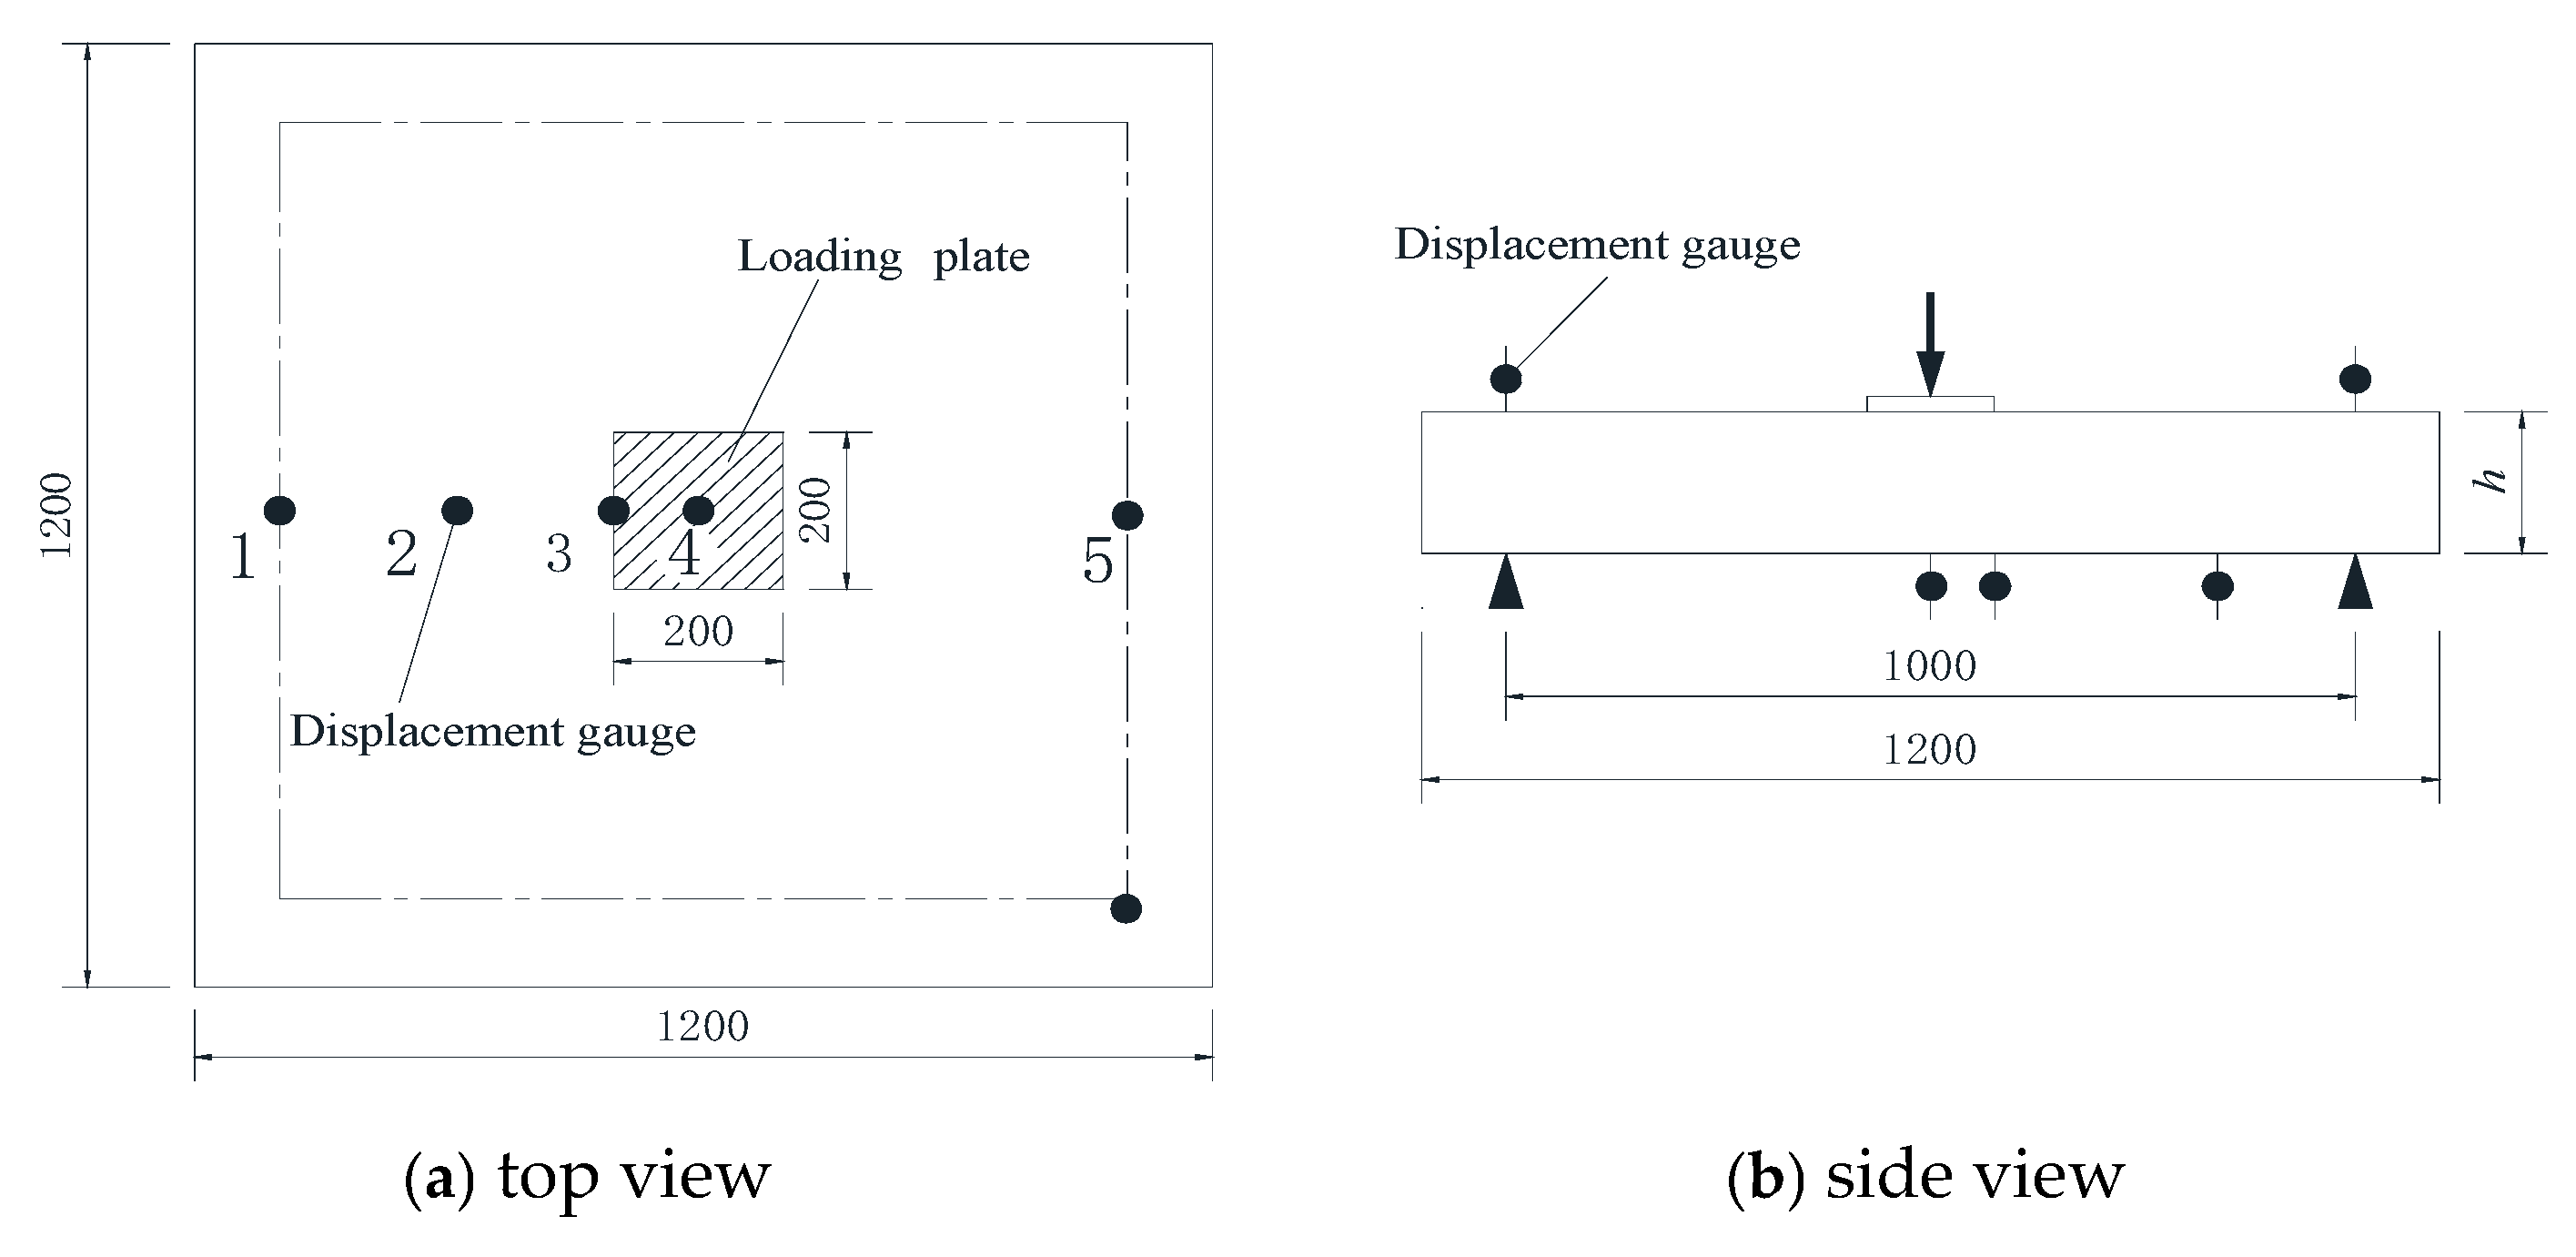
2.2. Loading and Instrumentation

A three-dimensional steel frame was constructed and equipped for testing, as illustrated in Figure 1. The boundary conditions consisted of two adjacent sides being fixed hinged, while the other two adjacent sides were configured as sliding hinged. The hinged–sliding support configuration used in this study was selected to simulate realistic support conditions representative of simply supported slab spans in bridge decks. Although global support conditions can influence flexural behavior, prior research has shown that for centrally applied loads, the punching shear failure is primarily governed by local mechanisms near the load point [61,62]. While support conditions can slightly affect deformation patterns, they do not significantly influence the ultimate punching shear capacity when the applied load is sufficiently distant from the slab boundaries. Therefore, the adopted boundary setup provides a valid approximation for assessing the punching behavior under concentrated loads.
The slabs underwent testing under a central patch load, which was applied via a square steel plate measuring 200 mm on each side and 50 mm in thickness. This load was positioned at the geometric center of the loading plate using a 1000 kN hydraulic jack. The loading procedure was executed as follows: a vertical load of 5 kN per step was applied to the slab until the first crack was detected. Subsequently, as the relevant strain data began to exhibit nonlinearity, the load decreased to 2.5 kN per step. Each loading increment was maintained for 180 s, during which data were collected after the load had stabilized.
In structural engineering, it is well understood that the dimensions of the loaded area can significantly affect shear stress distribution and, consequently, the behavior of slabs under load. When considering a loaded area of 200 × 200 mm, it is plausible that reducing the size of this area could lead to a more pronounced effect on punching shear. Smaller loading areas tend to concentrate forces over a smaller region, potentially increasing local stress levels and leading to the earlier onset of punching shear. However, the current study aimed to investigate the punching shear behavior of deck slabs of bridges so that the loaded area is represented by the wheel footprint, which cannot be less than 200 mm by 200 mm.
The 200 mm × 200 mm steel plate was used to apply the patch load in this study to simulate the contact area of a truck wheel load, consistent with AASHTO LRFD specifications [63] for bridge deck design. Similar loading configurations have been widely adopted in related experimental investigations of UHPC and bridge slab behavior [33,34,37,54]. A spherical or point load would not accurately represent the pressure distribution from vehicle tires and would introduce stress concentrations uncharacteristic of real-world traffic loading.
For each slab, five LVDTs with a measuring length of 100 mm were employed to measure the vertical displacements. The configuration of the displacement measurement locations is illustrated in Figure 2, with the points positioned at the mid-span of the slab (point 4), the edge of the loading plate (measuring point 3), the quarter of the slab (point 2), and at the fixed support and sliding support points (points 1 and 5). Furthermore, strain gauges with lengths of 60 mm and 6 mm were employed and positioned at various locations to measure the normal strain developed at the concrete bottom surface and the longitudinal tensile steel bars in both directions. The layout of the strain measurement points for the concrete slab’s bottom surface and the internal reinforcing steel bars is illustrated in Figure 3. During the loading procedure, the cracks on the bottom surface were monitored using a gauge. The width of each crack, along with its associated load value, was indicated at the locations of the cracks with a marker pen.

2.3. Test Results and Discussion for Slabs of PHASE I
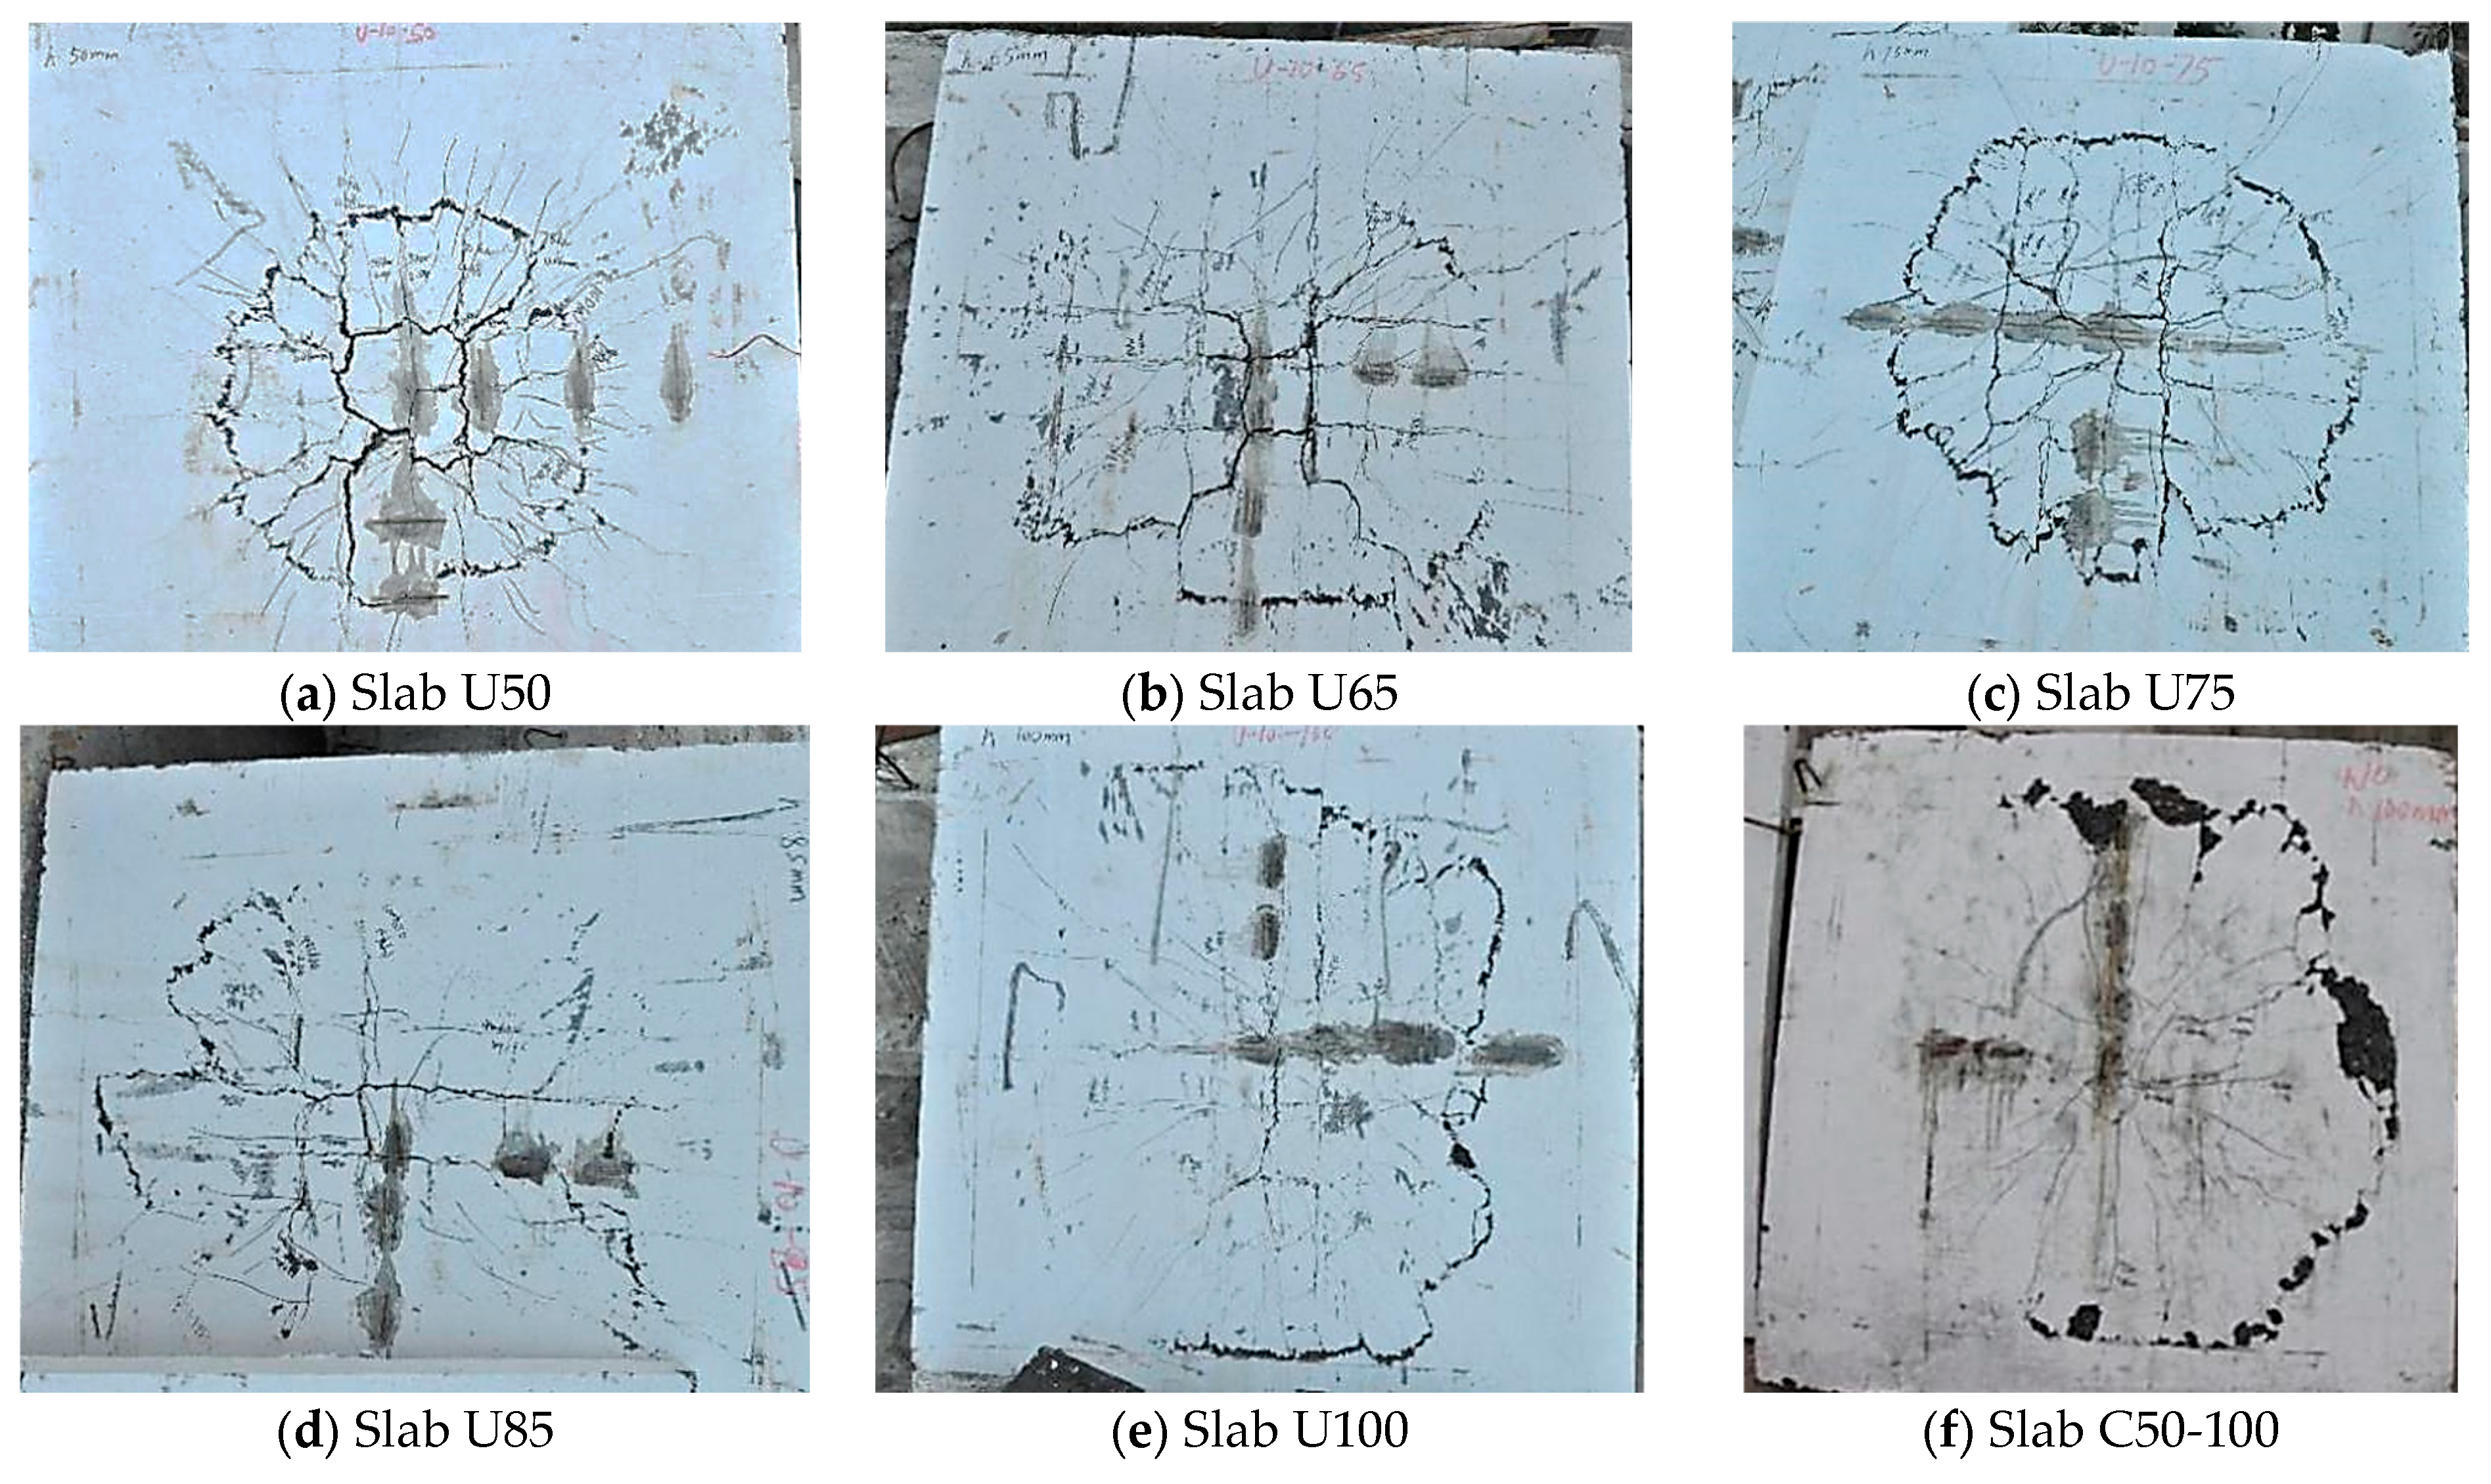
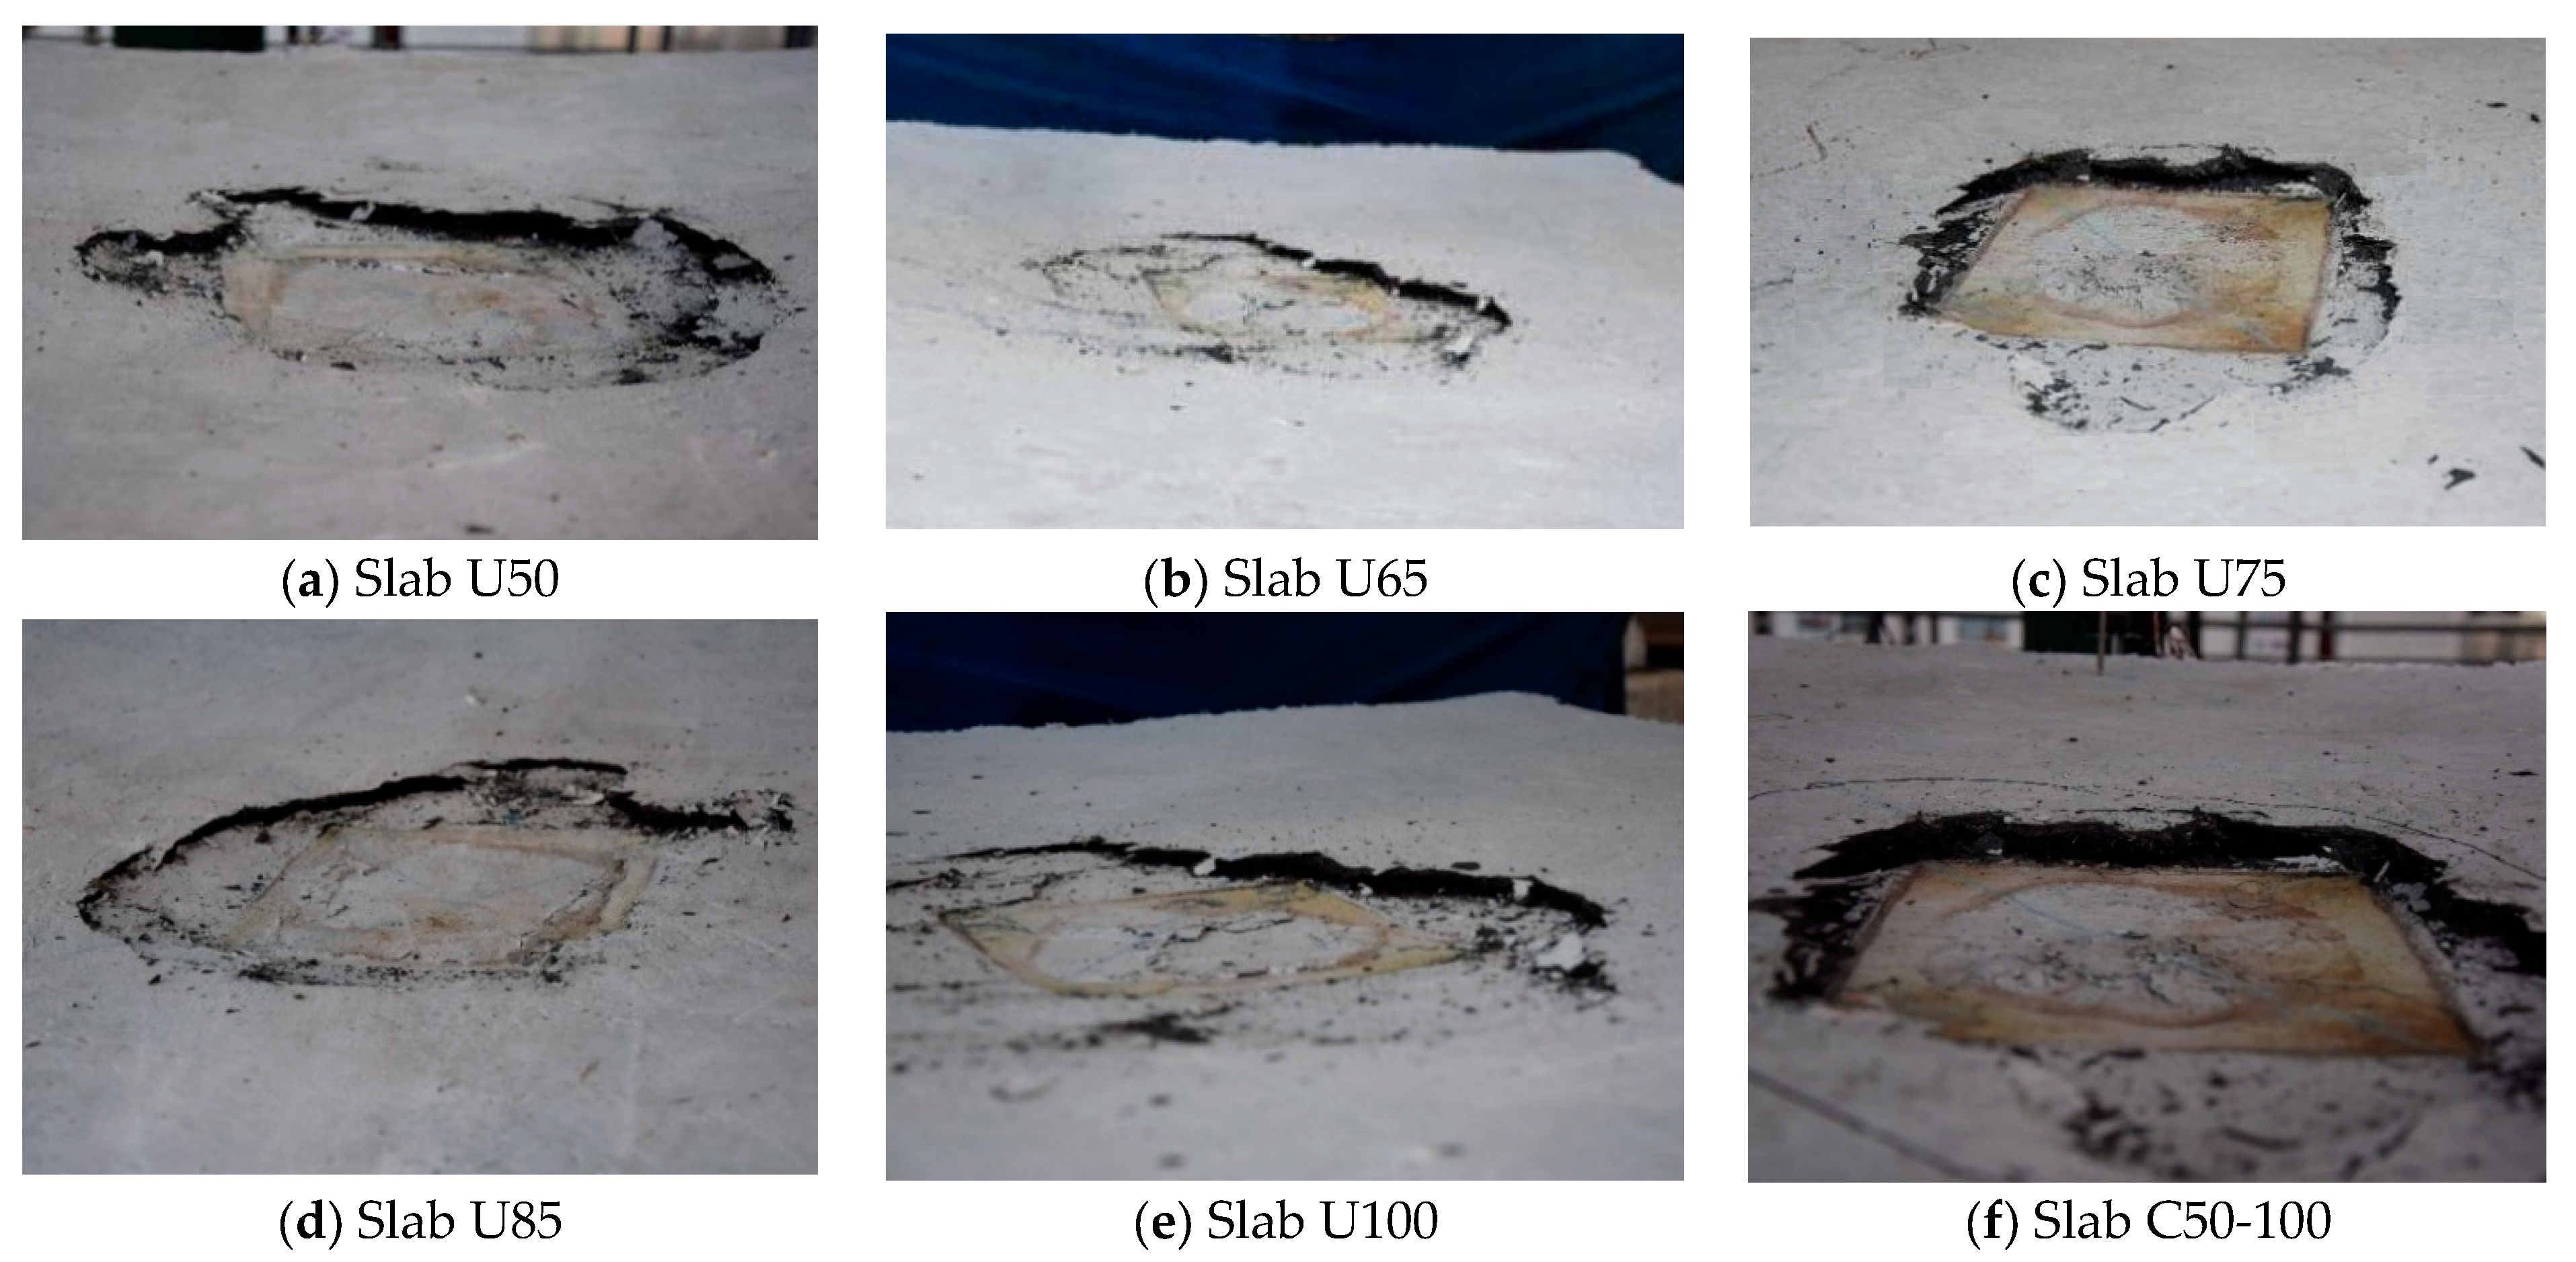
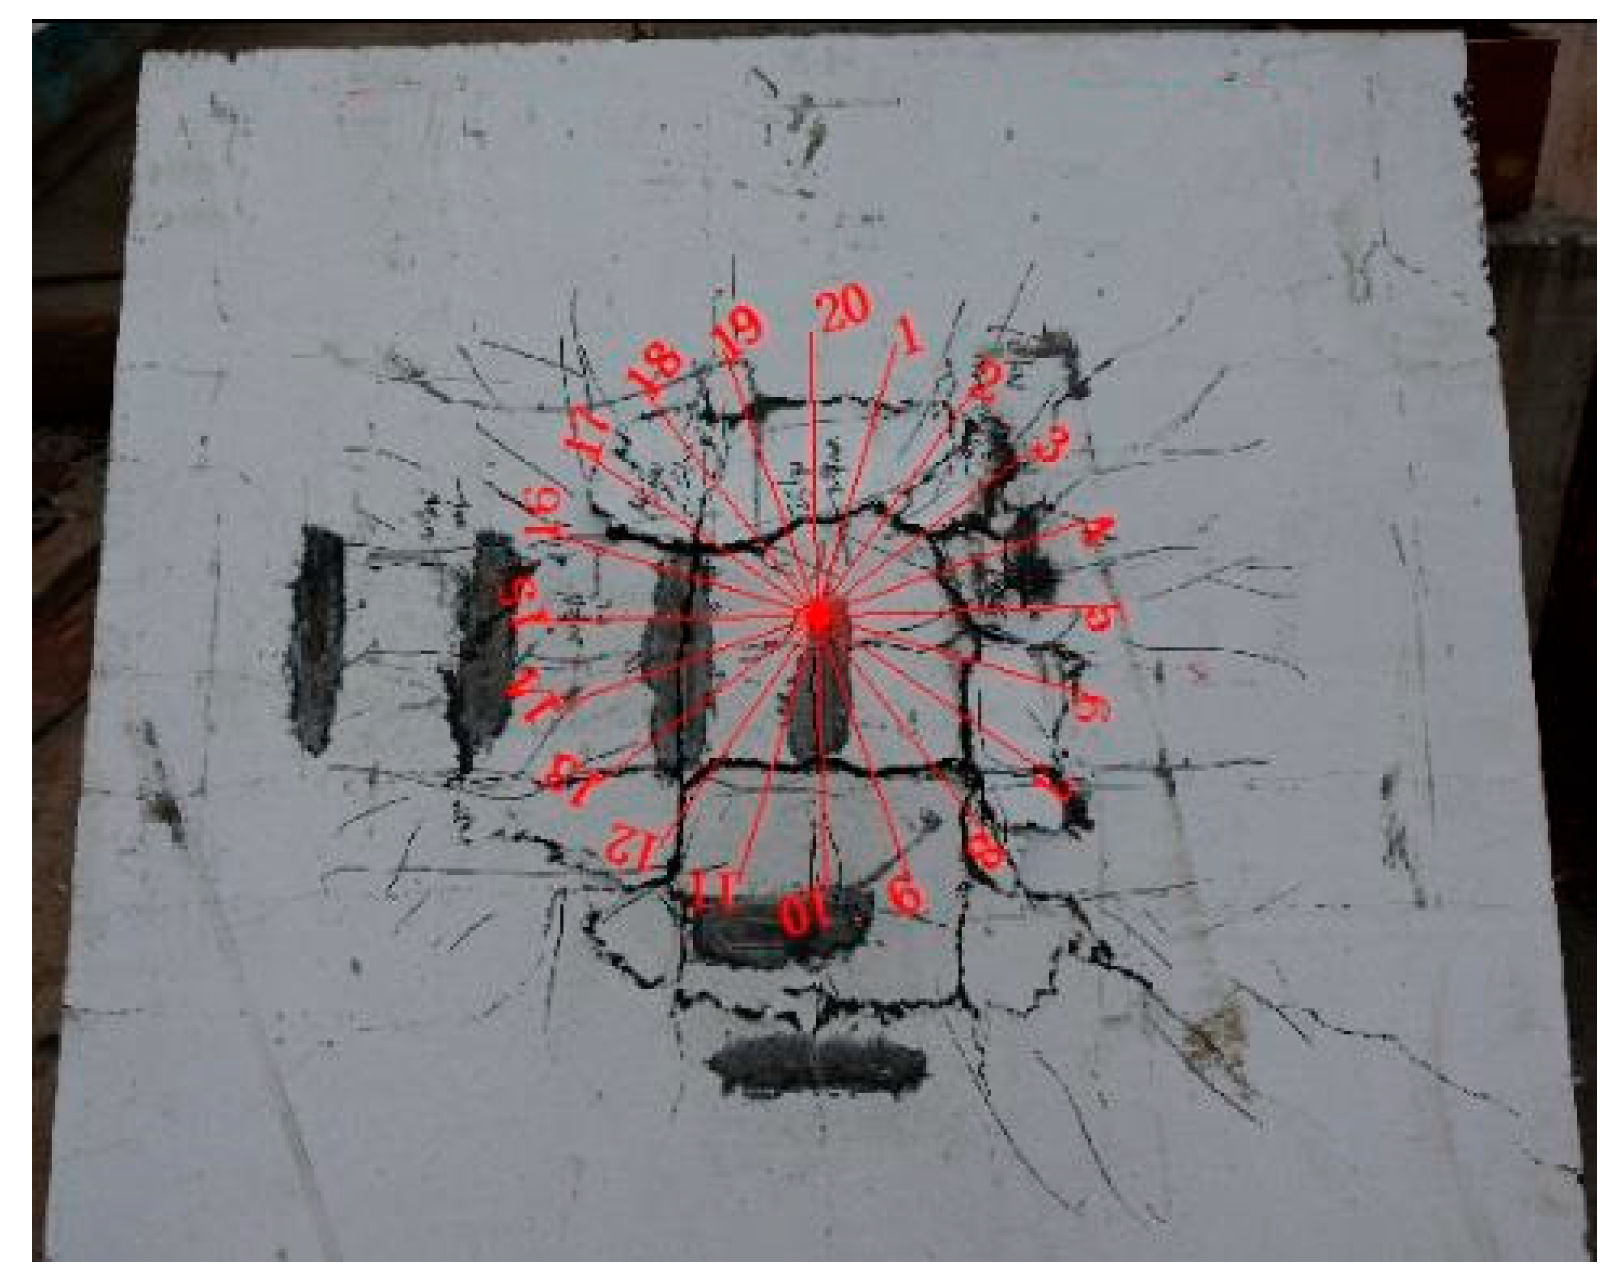
2.3.1. Failure Mode

During the initial loading phase, each slab exhibited radial flexural cracks, and as the load increased, tangential cracks resulting from punching shear stress became apparent. In certain instances, these cracks were observed before the complete failure of the slabs, all of which ultimately yielded to punching shear, as illustrated in Figure 4 and Figure 5. The failure zone associated with punching shear is typically characterized by the shearing off of a concrete section of the slab, forming a shape similar to a truncated cone or pyramid. The larger base of this truncated shape is located in the tension side, while the smaller base is found on the compression side under the concentrated patch load. As depicted in Figure 4, the final configuration of the cracks on the bottom surface looks like a nearly circular closed form, indicative of a truncated cone. Furthermore, the widths of the major cracks, which accompanied the flexural cracks, decreased as the thickness of the slab increased.
Concerning the widths of the cracks, it was observed that the initial significant crack measured 0.01 mm at the onset of cracking across all slabs, although the associated load increased with the thickness of the slab. Continued loading led to the development of various flexural cracks. As the slab thickness increased, the failure area on the bottom of the slab expanded, resulting in a larger perimeter of the base truncated cone. The final recorded crack widths indicated that with greater slab thickness, the crack width at failure was reduced, even though the failure load increased. The recorded crack widths were 1 mm, 0.7 mm, 0.5 mm, 0.5 mm, 0.4 mm, and 0.6 mm for slabs U50, U65, U75, U85, U100, and C50-100, respectively.
Although both specimens, U100 and C50-100, had a thickness of 100 mm, the crack width on the bottom surface and the concave depth of the punching shear cone for specimen U100 were less than those observed in specimen C50-100. This indicates that including steel fibers can significantly enhance the punching shear performance.

2.3.2. Load–Deflection Relationship

The previously discussed Figure 2 illustrates the deflection measurements taken at various locations across all slabs. However, the focus here is on comparing the central mid-span deflections of all slabs throughout the entire loading process. Figure 6 presents the relationship between the central mid-span deflection and the central patch load for each slab. Increasing slab thickness leads to enhanced flexural stiffness and greater sustained load capacity. Consequently, at the same loading level, the recorded deflection decreases as the slab thickness increases. It can be observed that flexural behavior predominates during the initial stage of the loading phase; however, as the load increases, punching shear failure becomes the controlling one for all slabs, as indicated by the abrupt decline in the curves following the peak load. This observation reinforces the notion that the failure mode is primarily attributed to brittle cracking rather than a plastic mechanism. Furthermore, the ultimate capacity of the specimens increases with an increase in slab thickness.
Before cracking occurs, the load–deflection curve typically exhibits a linear or slightly nonlinear behavior, reflecting elastic deformations. After cracking initiates, the load–deflection curve often becomes steeper, indicating an increase in strain for a given increase in load. This change signifies that the material is approaching its failure point and that further load increases will lead to more rapid deterioration of structural integrity. During the average load range, the material experiences a transition phase where micro-cracking may begin to occur. This phase is characterized by a gradual change in curvature on the deformation curve, indicating that the material is not yet at its ultimate capacity but is experiencing significant internal stress redistribution. As loads approach critical levels, deviations from linearity become more pronounced due to plastic deformations and microstructural changes.
The first cracking load Pcr and the ultimate load Pu, along with their corresponding central deflections for each slab, are presented in Table 3. It is apparent that as the thickness of the UHPC slabs increases from 50 mm to 100 mm, the first crack load Pcr and the ultimate load Pu increase by factors of 5.17 and 2.05, respectively. Moreover, the ratio of Pcr to Pu rises from 0.10 to 0.24, indicating that the flexural capacity enhances at a more significant rate compared to the punching shear capacity. This observation suggests the presence of a critical thickness at which UHPC slabs shift from failure due to punching shear to failure due to flexure. Additionally, for specimen U100, made from UHPC, the cracking load Pcr and the ultimate load Pu are 29.17% and 38.71% higher than those of specimen C50-100, which is made from conventional concrete, respectively.

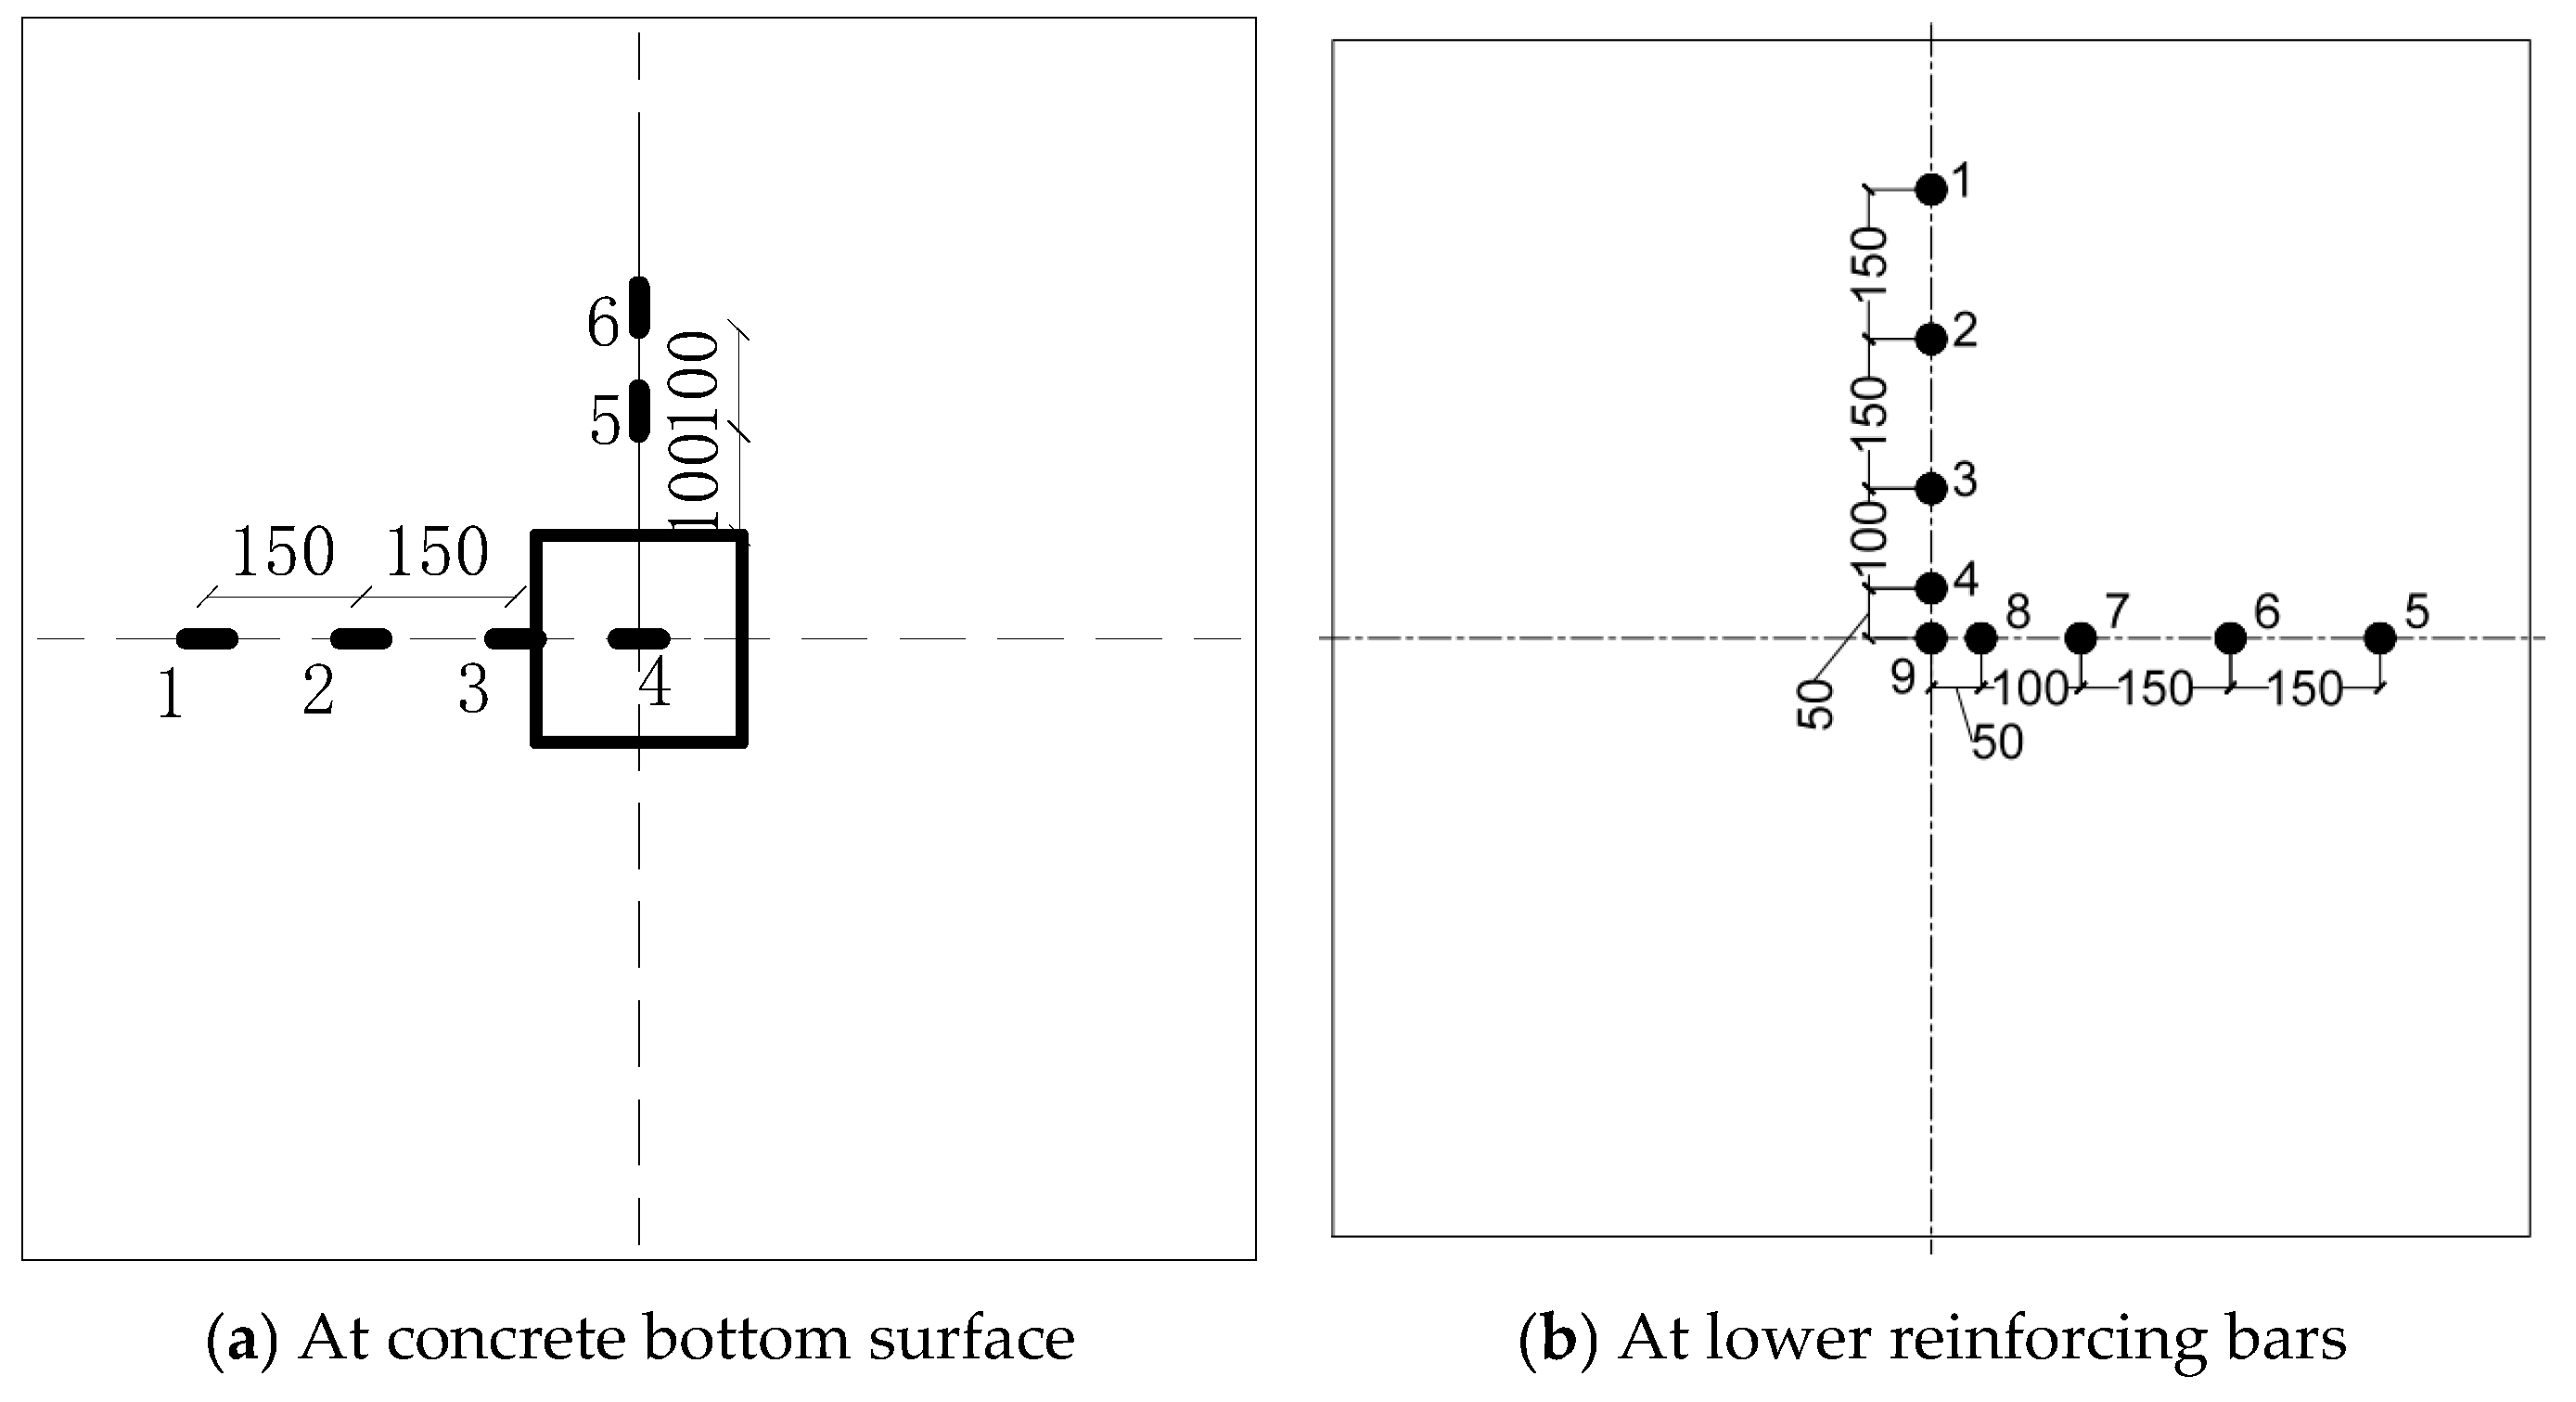
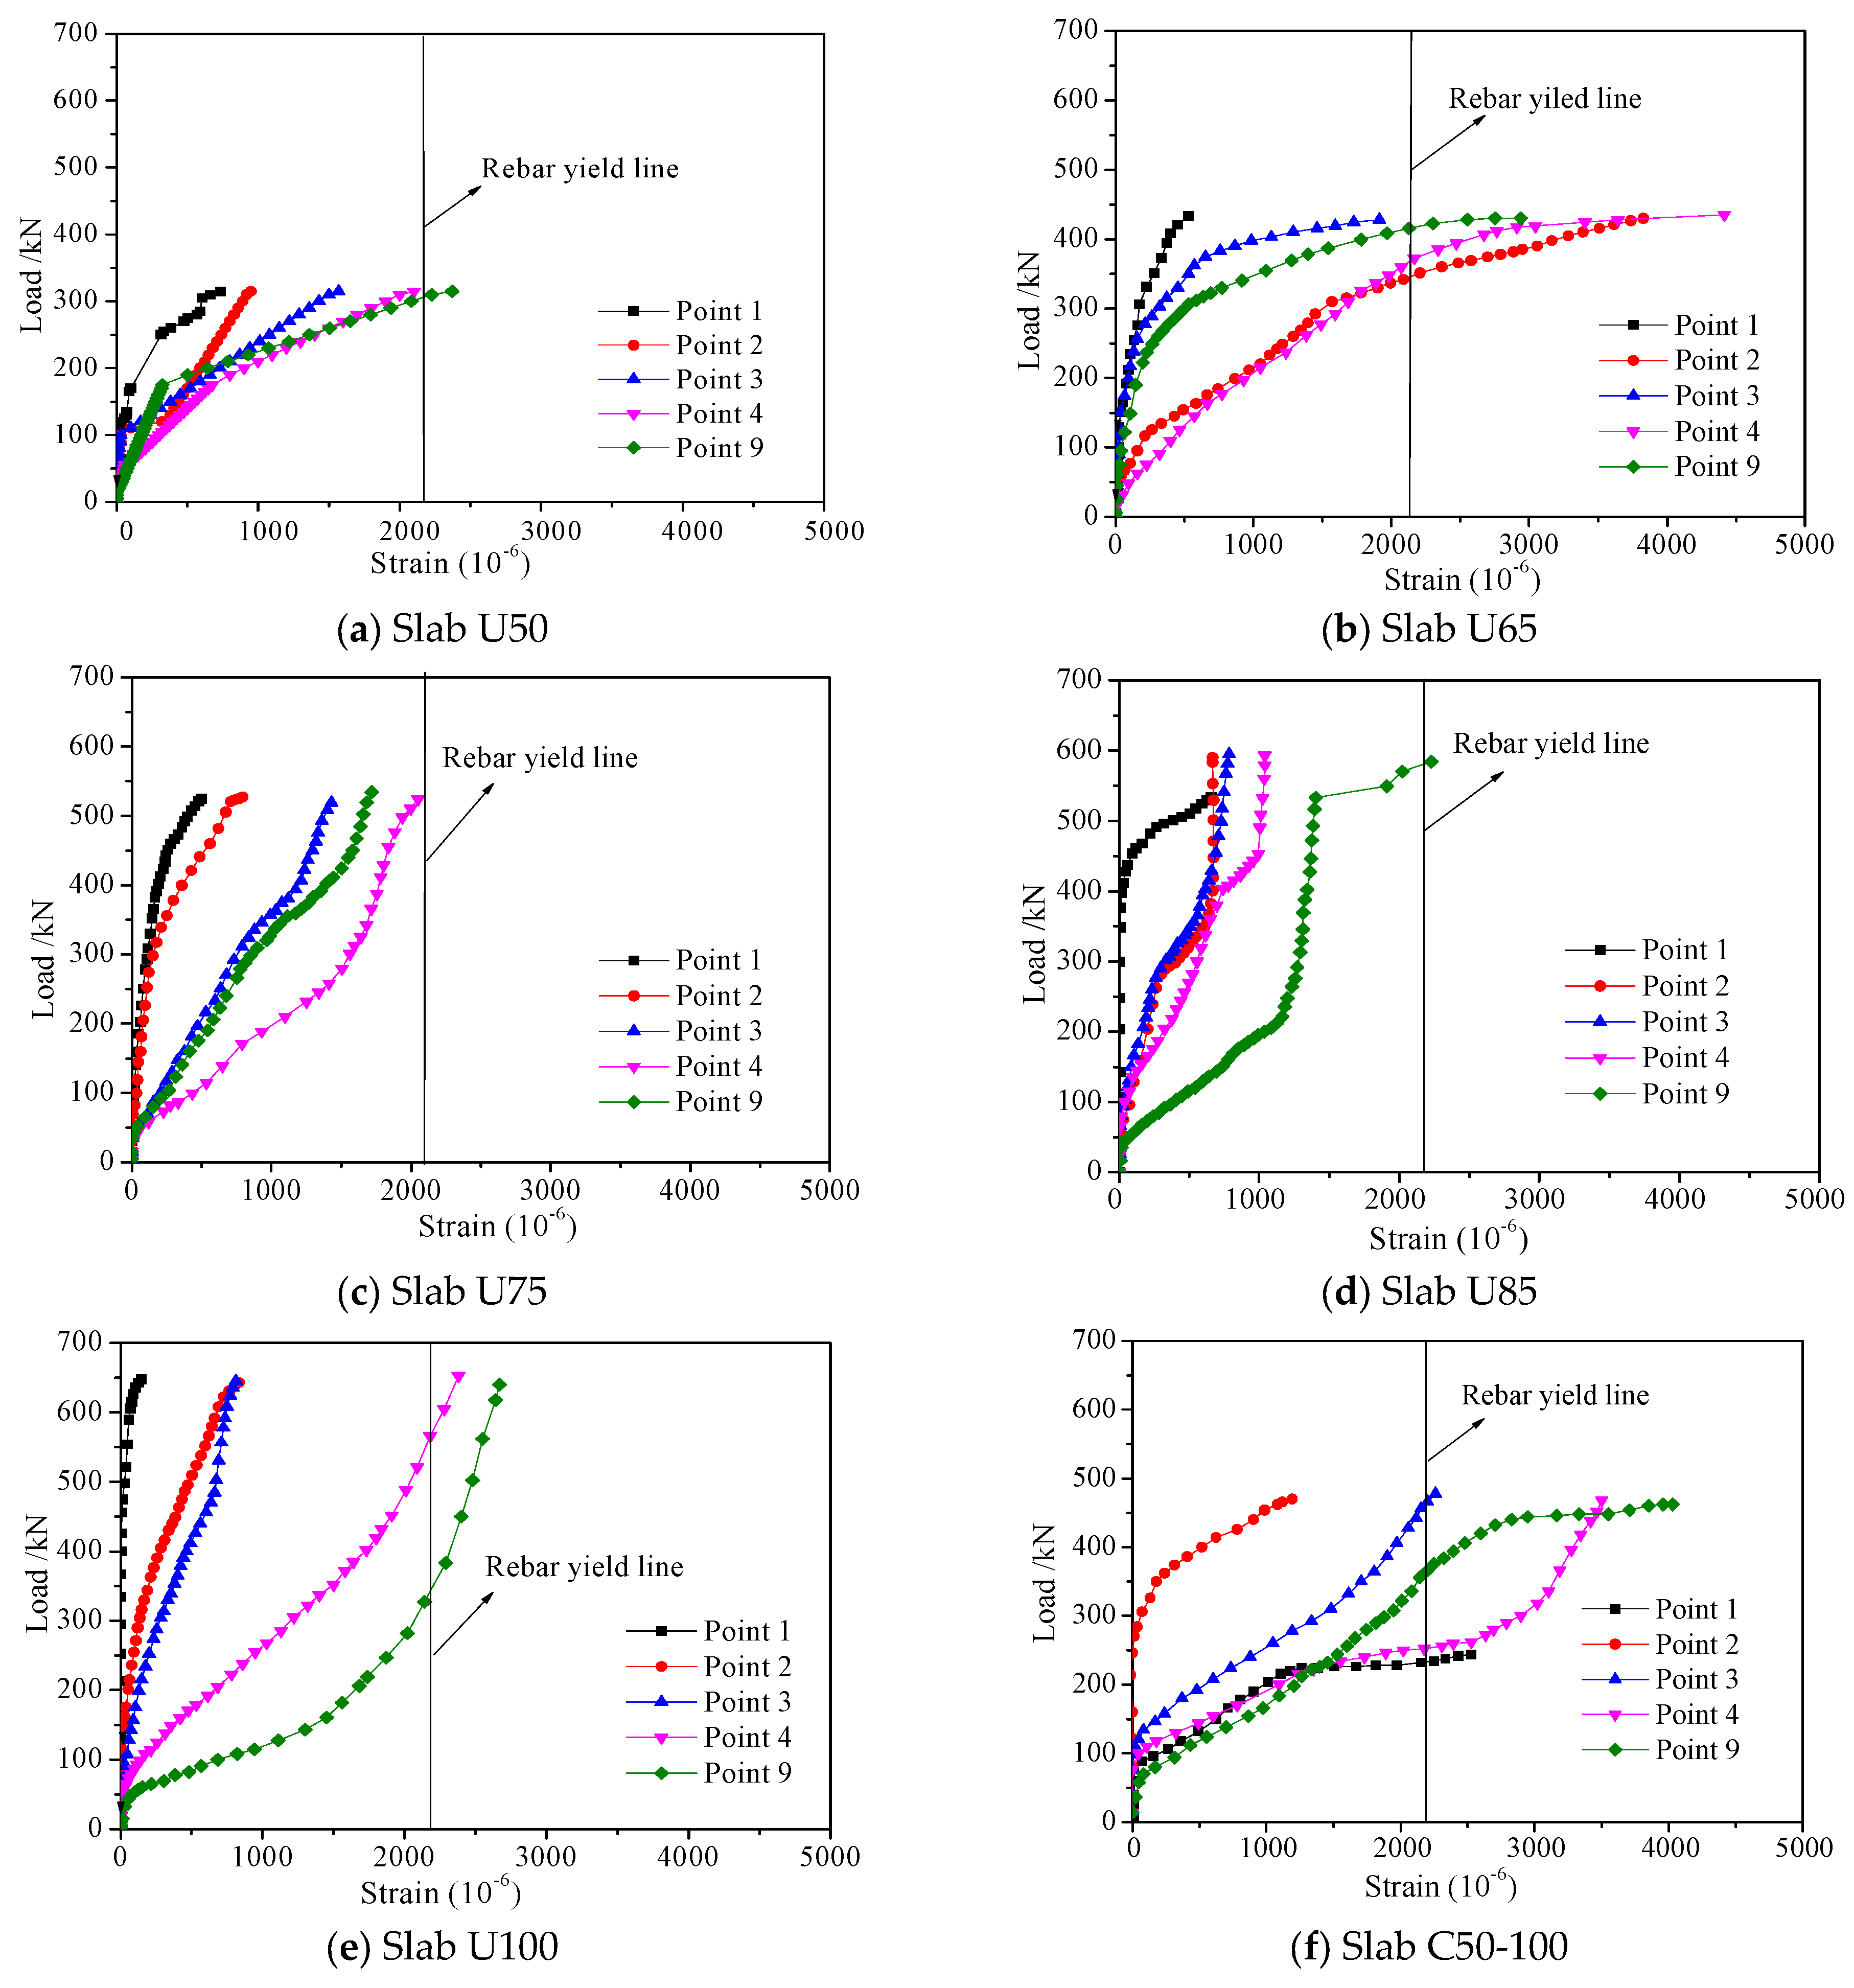
2.3.3. Load–Reinforcing Steel Bar Strains Relationships

Figure 7 illustrates the progression of tensile strains under loading at various locations across all slabs in Phase I. Given the symmetrical arrangement of measurement points, as shown in Figure 3b, the analysis focuses on the results from points No.1 to No.4 and the central point No.9. The relationships presented in Figure 7 indicate that as loading continues, there is an increase in the tensile normal strain developed in the reinforcing steel bars. Initially, the strain in these bars is zero before the cracking of the specimens, with the tensile stress predominantly resisted by the bottom UHPC. Upon the onset of failure in the specimens, only a few bars in specimens U65 and U100 experienced yielding, while the remaining bars in other specimens remained unyielded. Notably, nearly all steel bars at the center of the slabs (Point 9) reached their yielding point. As the thickness of the slab increased, the strain at point No. 9 correspondingly rose, indicating a more pronounced bending effect. In comparison to the conventional concrete slab C50-100, which lacks steel fiber, the load was transferred to the rebar following slab cracking, resulting in a more evident brittle characteristic of punching failure and a greater number of yielded bars. Furthermore, the reinforcing steel bars in slab C50-100 began to carry the load earlier than the corresponding bars in slab U100, and at the same loading level, the strains developed in the reinforcing bars of slab C50-100 were greater than those observed in slab U100.
It is important to note that in most UHPC slabs, the reinforcing bars did not yield before failure, which is consistent with the expected behavior in punching shear failure, where the failure often precedes the yielding of flexural reinforcement due to the brittle nature of the mechanism [9,30]. This outcome suggests limited redistribution capacity and reduced ductility, particularly when the fiber content or reinforcement ratio is not sufficiently high. The brittle punching failure observed here aligns with prior studies indicating that UHPC slabs, despite their high compressive and tensile strengths, may fail without full utilization of the reinforcement unless measures such as increased fiber dosage or reinforcement are incorporated [30,54].

2.4. Analysis of Flexural Capacity and Critical Thickness

The test results indicate that as the thickness of the UHPC slab increases, the rate of enhancement in flexural capacity significantly surpasses that of punching shear capacity. Consequently, there exists a critical thickness at which the failure mode transitions from punching shear failure to flexural failure. This critical thickness holds considerable engineering importance in mitigating the risk of brittle failure in bridge decks. This paper examines how the flexural capacity of UHPC slabs varies with thickness and subsequently compares it to the alterations in punching shear capacity. Therefore, the point at which flexural capacity and punching shear capacity intersect can be identified, with the corresponding thickness representing the critical thickness.

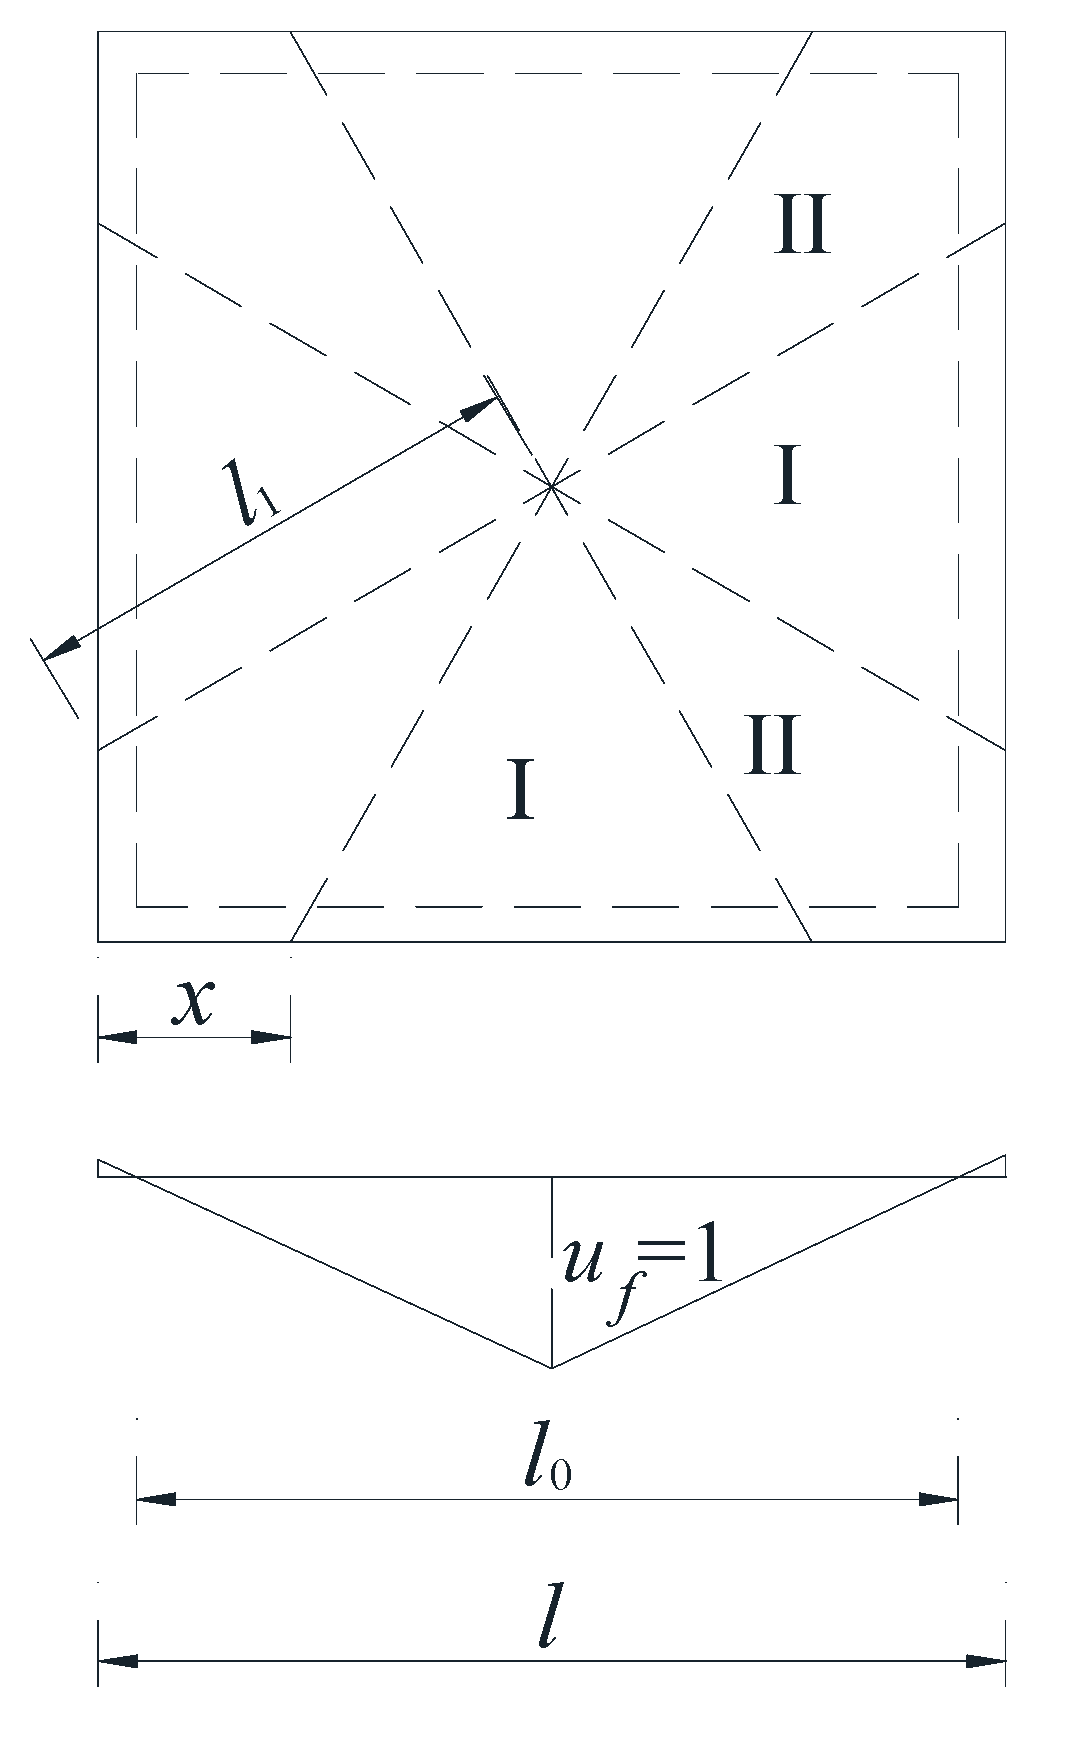
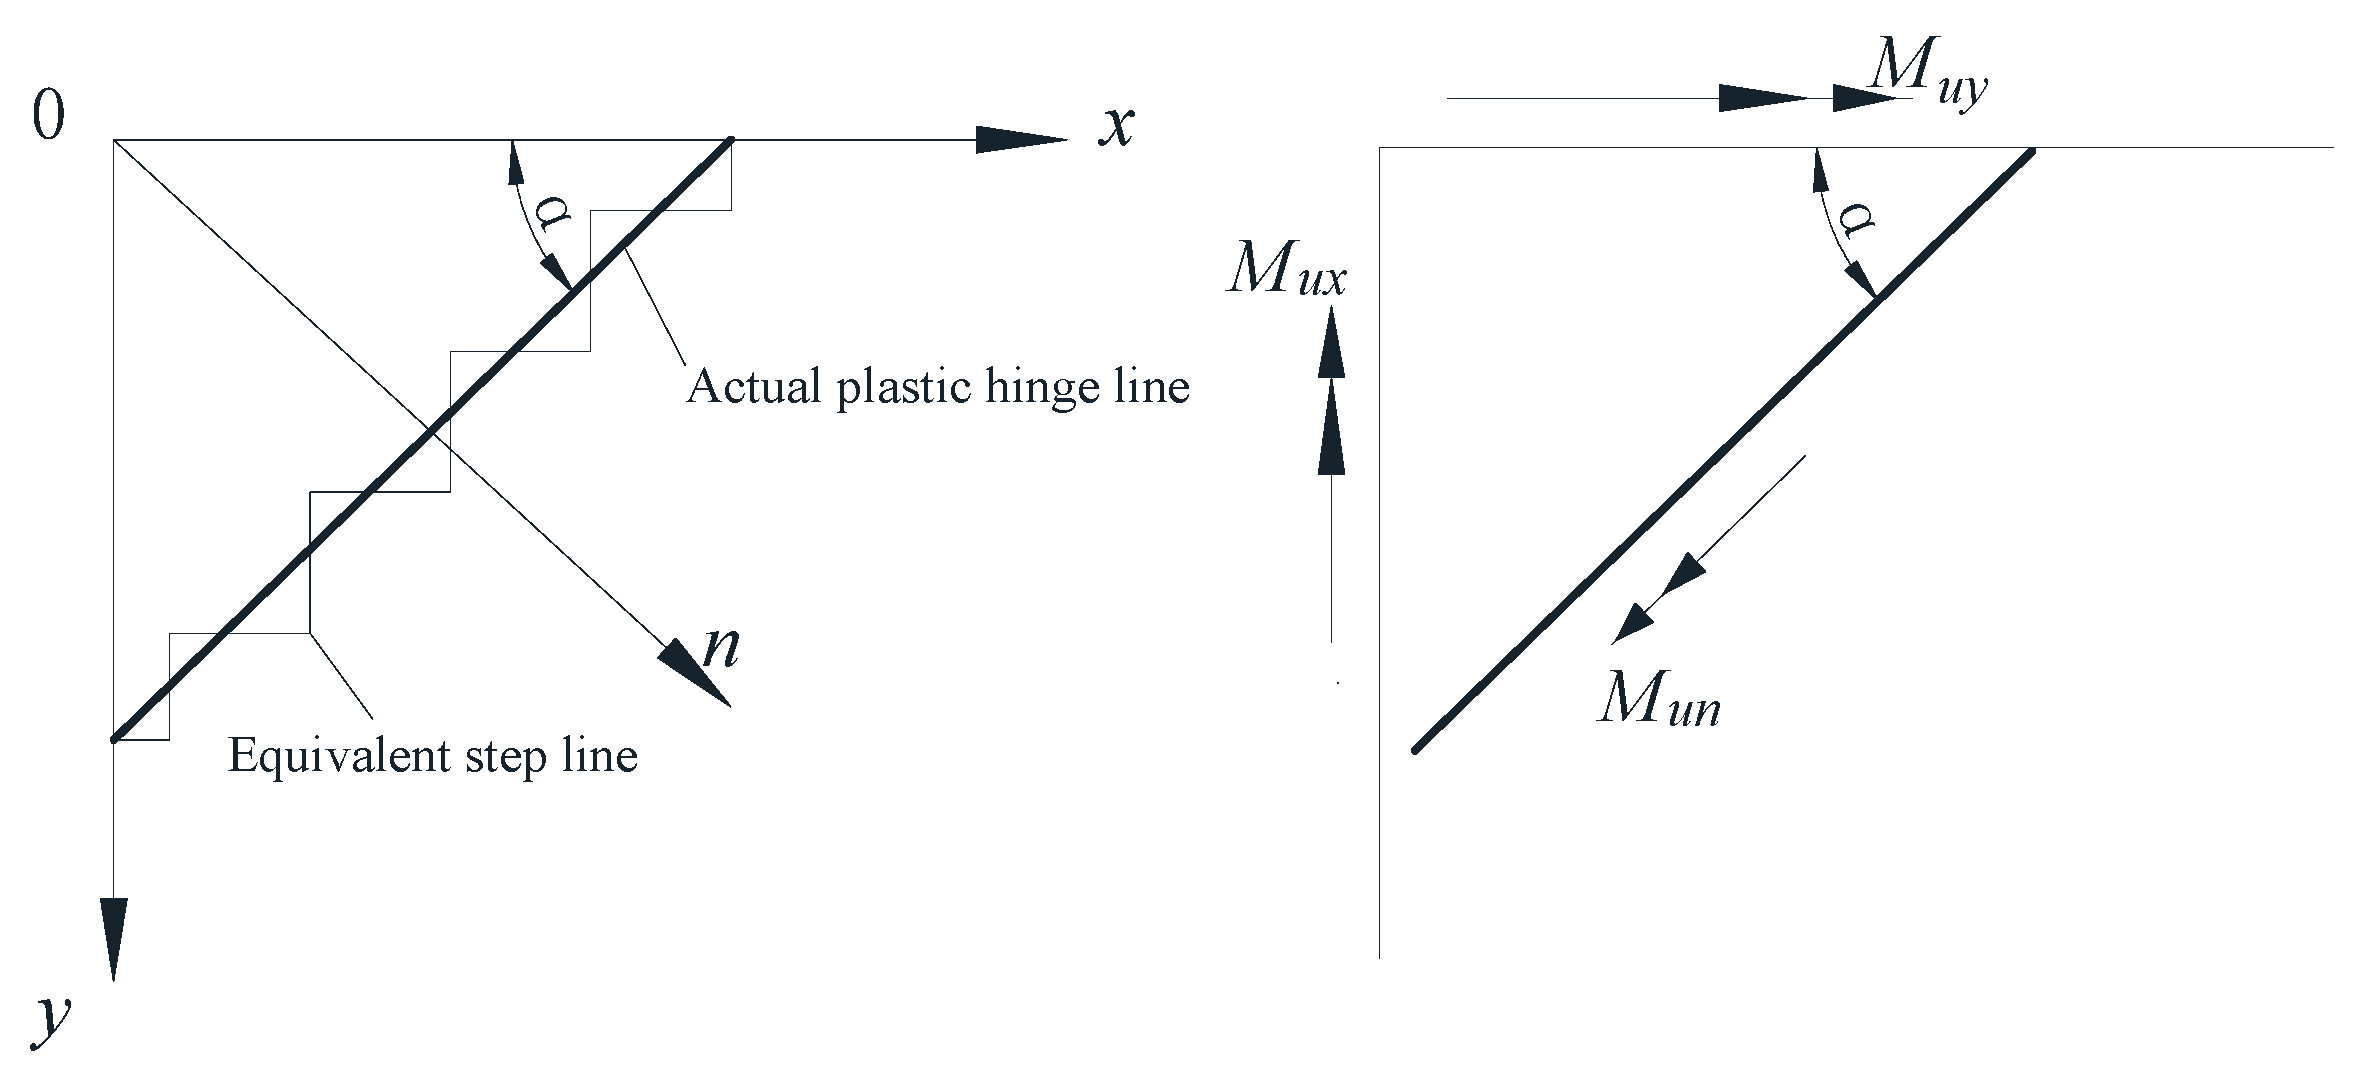
2.4.1. Calculation of Flexural Capacity

The flexural failure of concrete slabs manifests as plastic hinge failure, and the flexural capacity of Mfu can be determined using yield line theory [1], as illustrated in Figure 8. In this context, θ1 represents the relative rotation angle between plate I and the loading center, while θ2 denotes the relative rotation angle between plate I and plate II. These angles can be calculated using the following equations:
θ 1 = 1 l 0 / 2 = 2 l 0
θ 2 = 1 l 1 [ l 2 x l 0 + l l 0 x l x ]
Given that the spacing of the reinforcing bars is uniform in both directions, and the effective depth of the slab is defined as h0 = (hox + hoy)/2, it can be reasonably assumed that Mux = Muy = Mfu, where Mux and Muy denote the bending moments of the unit plate along the X and Y directions, respectively. In cases where the plastic hinge line is not perpendicular to the X and Y axes, the actual plastic hinge line may be approximated by a stepped triangular shape within a limited range [64], as illustrated in Figure 9. Then,
Mun = Muxcos2α + Muysin2α = Mfu
According to the principle of virtual work, Ff uf = ∑Munθili
Therefore, the flexural capacity of Ff is: F f × 1 = 4 M u n × 2 l 0 × 0 + 8 M u n × 1 l 1 [ l 2 x l 0 + l l 0 x l x ] × l 1
F f = 8 M u n × [ l 2 x l 0 + l l 0 x l x ]
The first-order derivative of Equation (4) is:
d F f d x = 8 M u n l 0 × [ l l + x ( l 1 ) ( l x ) 2 2 ]
dF f / d   x = 0 ,   then   x = l 2 2 l
By substituting x = l 2 2 l into Equation (4), Ff can be obtained:
F f = 16 M f u l l 0 ( 2 1 )
The flexural capacity of each specimen, as derived from Equation (7), can be evaluated and compared with the punching shear capacity, as presented in Table 4. It is evident that as the thickness increases, both the flexural capacity (Ff) and the punching shear capacity (Fu) rise correspondingly. This observation suggests that the ultimate punching shear capacity is a function of both flexural capacity and oblique cone punching capacity, indicating that the factors influencing flexural capacity similarly impact punching shear capacity. When comparing specimen U100 with the C50-100 slabs, it is noted that the punching shear capacity and flexural capacity of the C50-100 are 465 kN and 540.7 kN, respectively, which are lower than those of specimen U100 by 38.7% and 20.5%, respectively. This highlights a significant difference in punching shear performance between the UHPC slab and the conventional concrete slab, where steel fiber plays a crucial role in enhancing punching shear performance.

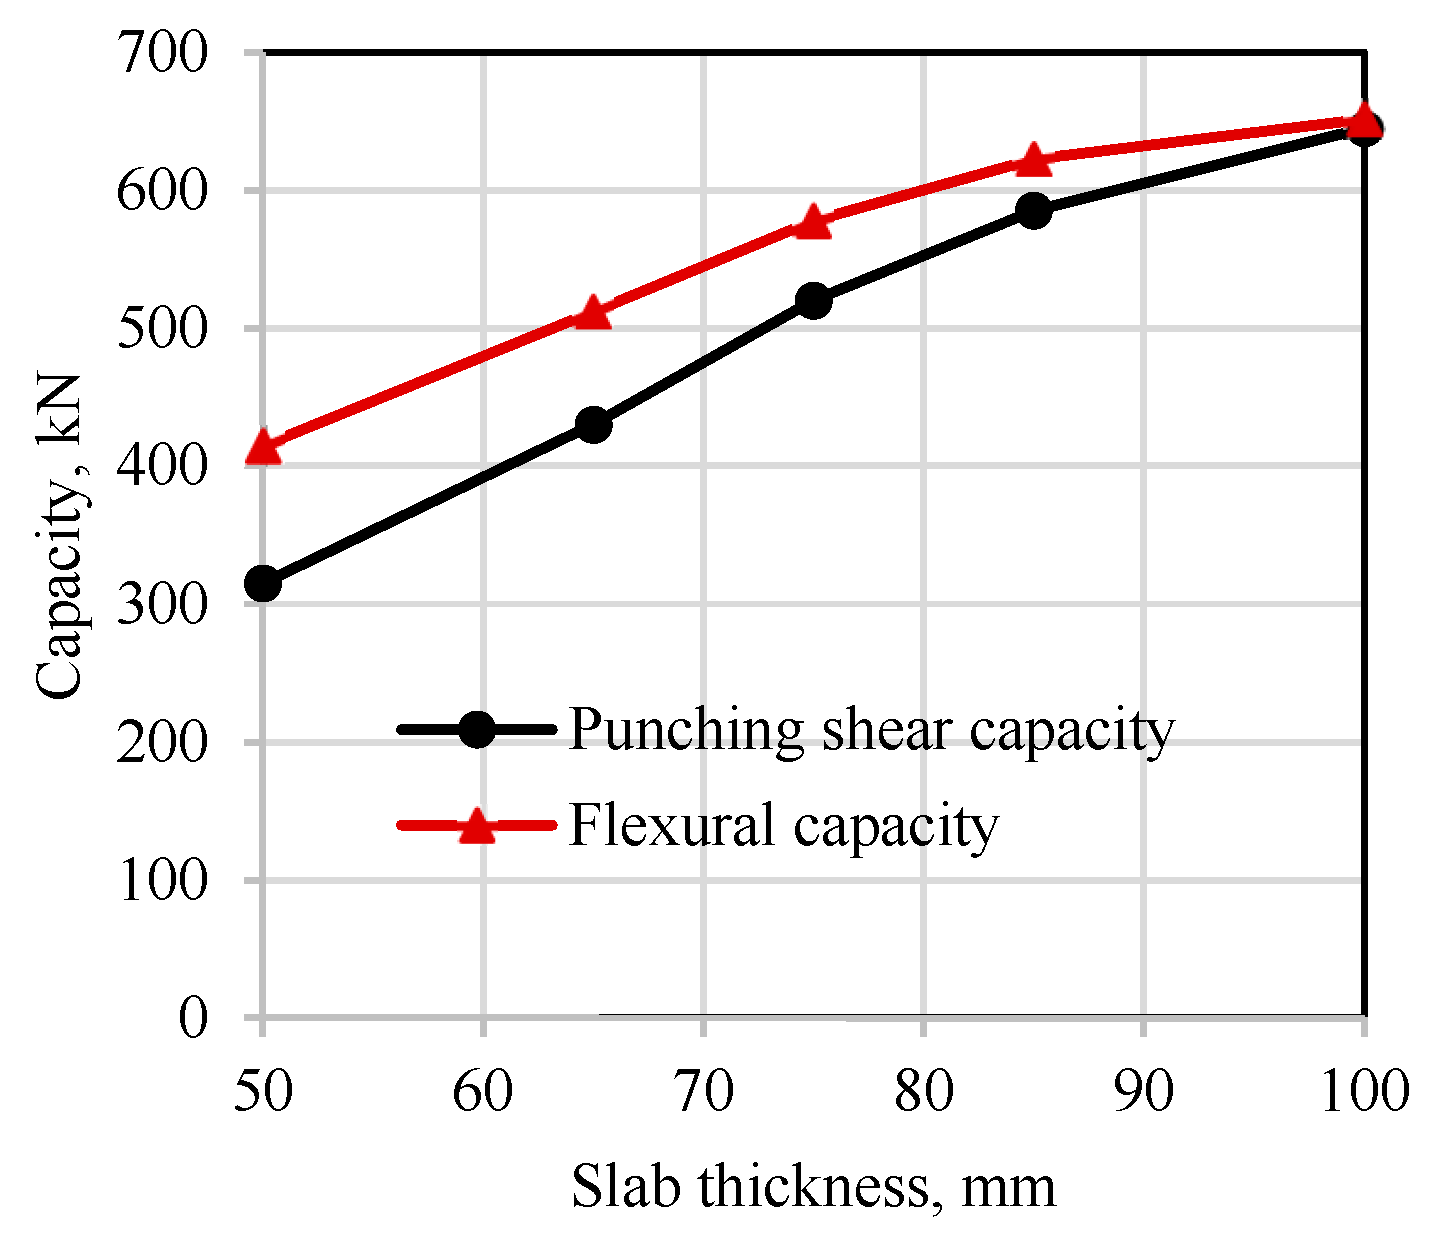
2.4.2. Analysis of Critical Thickness

As illustrated in Table 4, an increase in slab thickness leads to varying degrees of enhancement in both the punching shear capacity and flexural capacity of UHPC slabs. The ratio of Fu/Ff consistently rises, indicating that the rate of increase in punching shear capacity surpasses that of flexural capacity. Figure 10 depicts the relationship between slab thickness and the changes in punching shear and flexural capacities. The punching shear capacity for all specimens remains lower than the flexural capacity, suggesting that the predominant failure mode is punching shear failure, which aligns with the experimental findings. For a specimen thickness of 75 mm, the rate of increase in both capacities begins to decline. However, the increase in punching shear capacity remains more pronounced than that of flexural capacity. This trend becomes even more apparent at a thickness of 85 mm. At a thickness of 100 mm, the punching shear capacity nearly matches the flexural capacity, with their ratio approaching 0.99. Based on this observed trend, it can be anticipated that the punching shear capacity of the UHPC slab will exceed the flexural bending capacity when the thickness exceeds 100 mm. Consequently, to mitigate the risk of punching shear failure in UHPC slabs, it is recommended that the slab thickness be maintained at a minimum of 100 mm.
The transition from flexure to punching shear in a slab during failure is a critical aspect of structural engineering, particularly in the analysis of reinforced concrete slabs. This transition is characterized by a significant change in the mode of failure, which directly influences stress redistribution within the slab. Initially, under applied loads, the slab behaves primarily in flexure. In this phase, tensile stresses develop at the bottom of the slab while compressive stresses occur at the top. The distribution of these stresses follows a parabolic profile typical of flexural behavior. As loading continues and reaches critical levels, localized regions, often around concentrated load areas, begin to experience higher stress concentrations. When the applied load exceeds the flexural capacity of the slab, it leads to cracking and eventual failure due to punching shear. This transition signifies that the slab can no longer sustain loads through bending alone; instead, it must transfer loads through shear mechanisms.

3. The Effect of Governing Parameters on Punching Shear Behavior of UHPC Slabs (Phase II)

While this study focused on isolating the influence of key parameters on punching shear behavior, it is worth noting that several studies have identified potential interaction effects among slab thickness, fiber content, and reinforcement ratio. For example, Nguyen-Minh et al. [42] found that increasing fiber volume had diminishing returns when the reinforcement ratio was already high. Similarly, Zhou et al. [43] and Wu et al. [33] reported that the influence of fiber content was more pronounced in thinner slabs. These findings highlight the need for multi-variable statistical models to more accurately capture the coupled behavior in UHPC slab design. Future studies. The following subsection explains the individual effects of key parameters on the tested UHPC slab response.

3.1. Specimen Design and Test Results

To better understand the punching shear performance of Ultra-High-Performance Concrete (UHPC) slabs, specimens have been constructed to examine the influence of key parameters on the punching shear behavior. These parameters include the reinforcement ratio, steel fiber content, and the substitution rate of granite powder, as detailed in Table 5. All specimens maintain constant dimensions, featuring a thickness of 50 mm and a plan size of 1200 mm × 1200 mm. The fabrication and curing processes, boundary conditions, arrangement of measurement points, and loading procedures are consistent with those employed in the previous tests conducted during Phase I. Additionally, the material properties of all slab specimens and the corresponding test results are compiled in Table 5.

3.2. Analysis of the Effect of Key Parameters on Punching Shear Strength

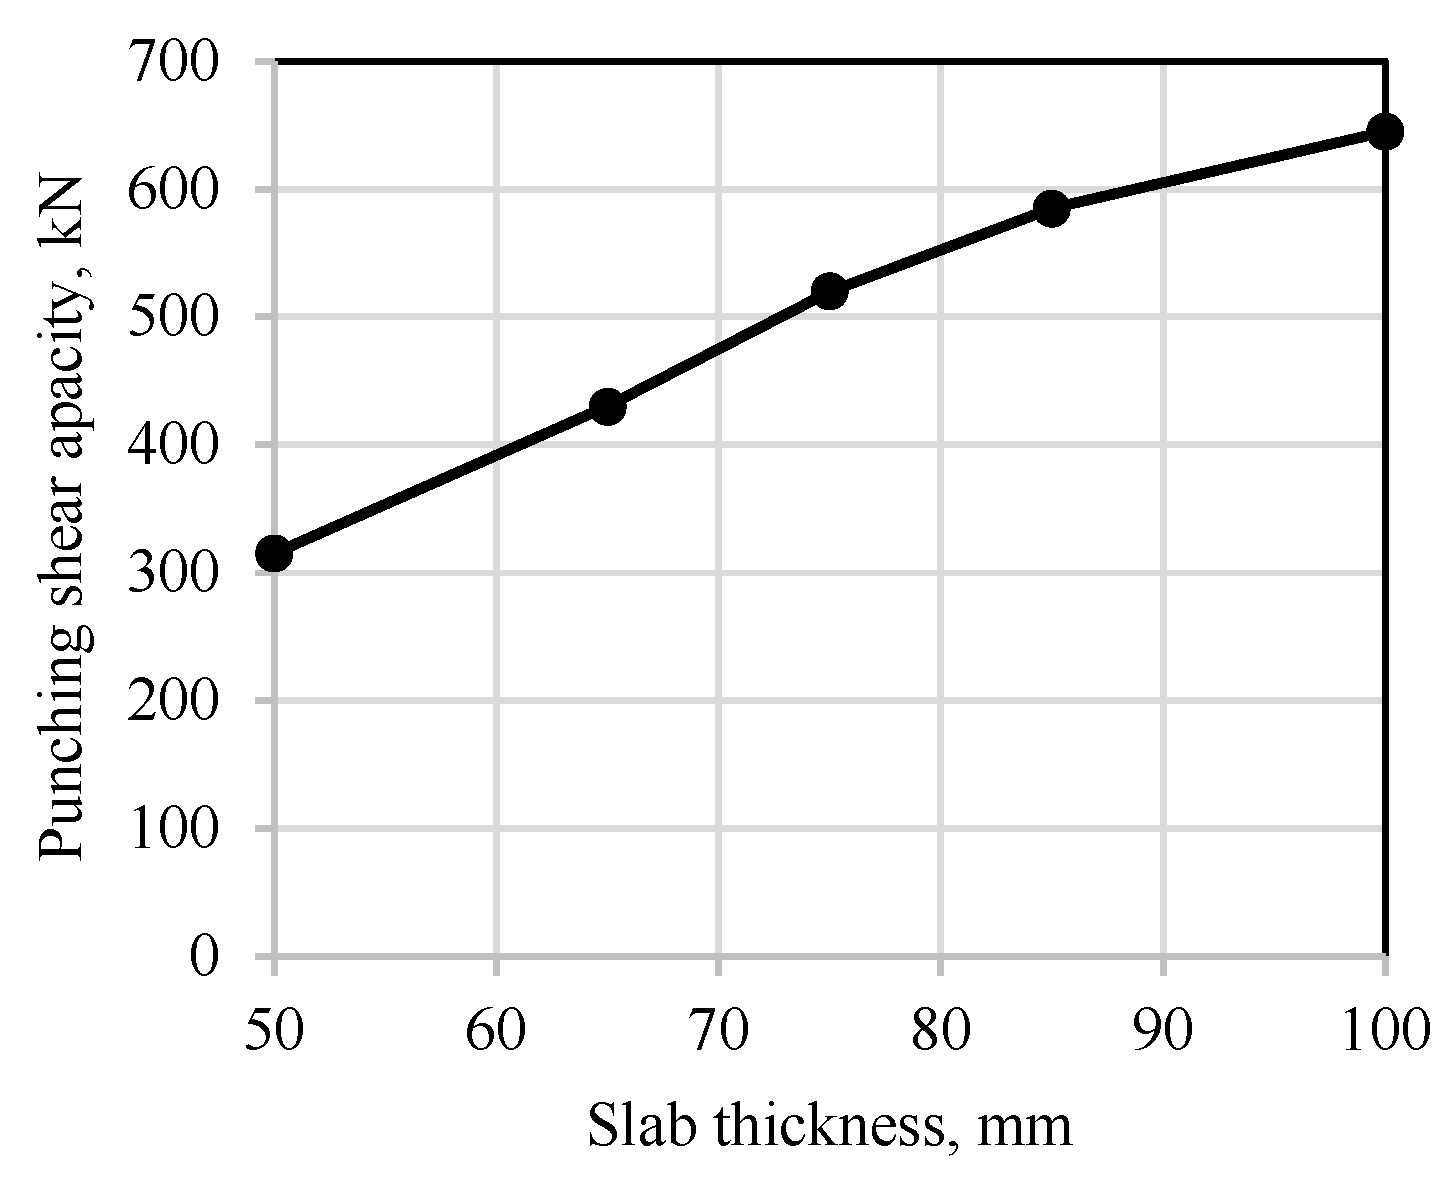
3.2.1. Effect of Slab Thickness (Phase I)

The effect of slab thickness can be derived from the test results of the slabs in Phase I, as illustrated in Figure 11. The results indicate that the punching shear capacity exhibits an almost linear increase with the increase in slab thickness. Specifically, as the slab thickness rises from 50 mm to 65 mm, 75 mm, 85 mm, and 100 mm, the ultimate capacity experiences an increase of 36.51%, 65.08%, 85.71%, and 104.76%, respectively. Consequently, in practical design applications, one effective strategy to mitigate the risk of punching shear failure in UHPC slabs is to enhance the slab thickness. However, it is noteworthy that the slope of the curve decreases when the thickness is increased from 85 mm to 100 mm, suggesting a reduction in the rate of improvement. Furthermore, the test results indicate that increasing the slab thickness significantly enhances the first cracking load.
While the analytical models employed in this study assume uniform fiber distribution, it is recognized that local fiber clustering or agglomeration may still occur despite careful mixing procedures. Such non-uniformity can lead to localized reductions in fiber bridging efficiency, particularly in critical regions subjected to punching shear. Fiber-poor zones may act as weak points where crack propagation is less restrained, potentially resulting in lower actual capacities than predicted by uniform distribution models. Conversely, regions with favorable fiber orientation or concentration may experience enhanced toughness. Although not explicitly modeled here, future analytical approaches may benefit from incorporating stochastic parameters or distribution factors that account for the probabilistic nature of fiber orientation and dispersion.

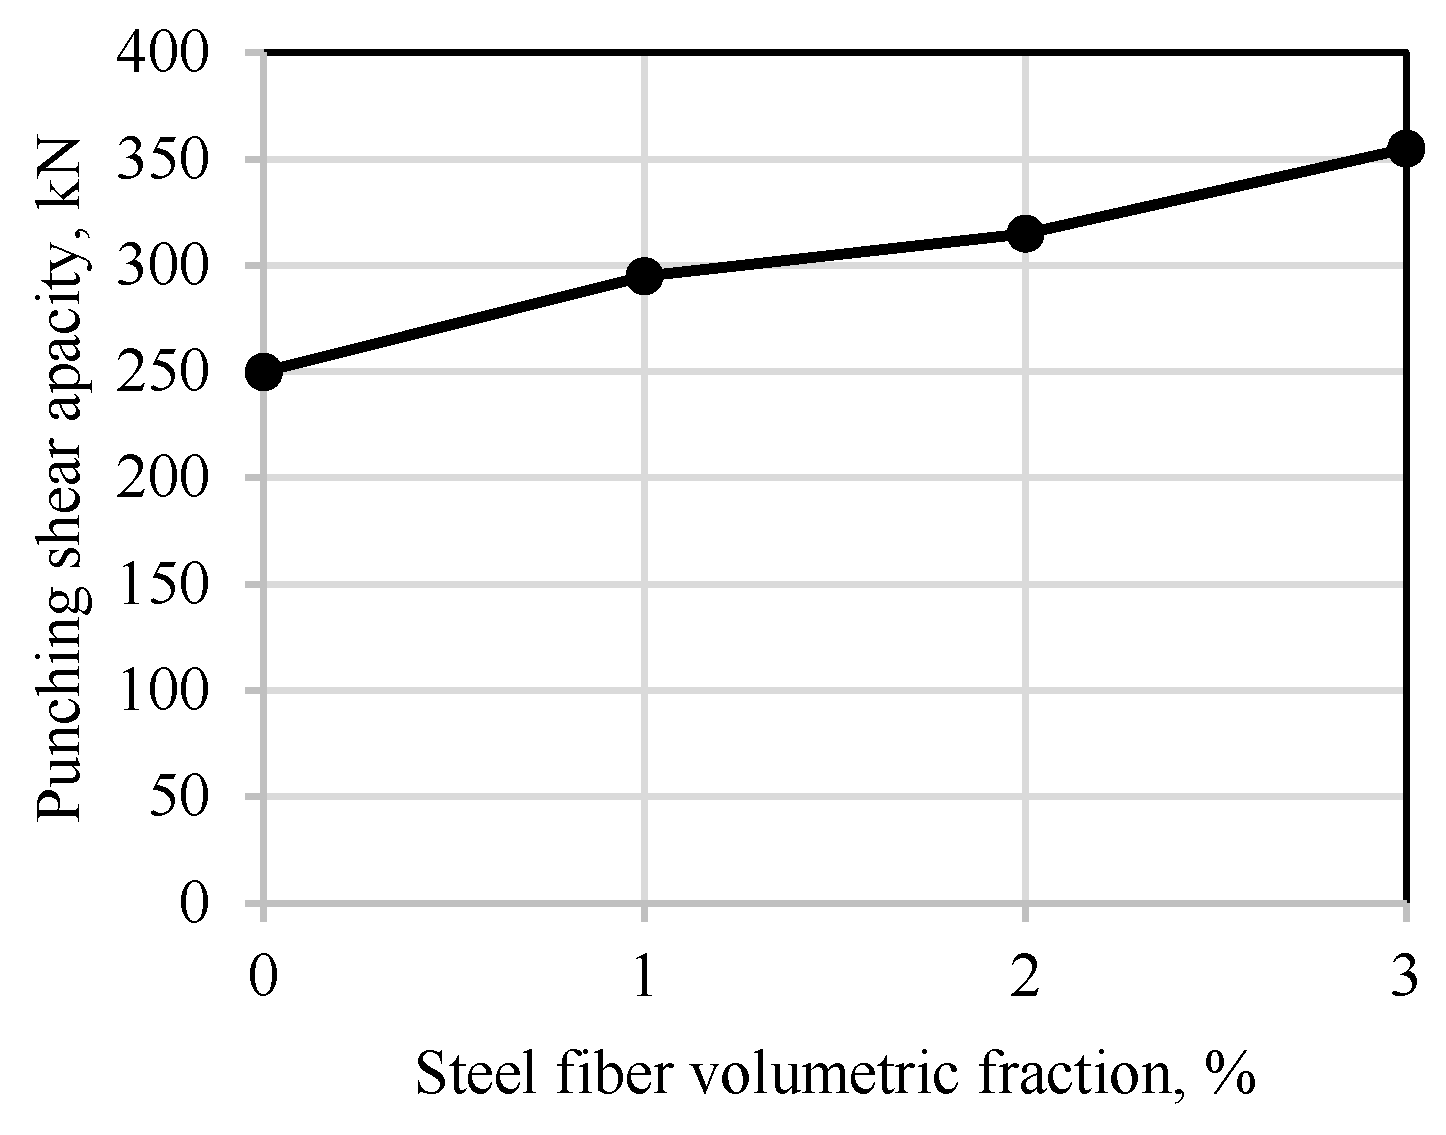
3.2.2. Effect of Steel Fiber Content (Phase II)

The relationship between the content of steel fibers and the resulting punching shear capacity of all slab specimens of Phase II is depicted in Figure 12. It is evident that the punching shear capacity significantly increases with higher steel fiber content. Specifically, as the steel fiber content rises from 0% to 1%, 2%, and 3%, the corresponding punching shear capacities increase by 18%, 26%, and 42%, respectively. This indicates that steel fiber is crucial in enhancing the punching shear capacity of UHPC slabs. Notably, the increase in punching shear capacity when the steel fiber content rises from 1% to 2% is 20 kN, while the increase from 2% to 3% is 40 kN, demonstrating that the latter improvement is twice that of the former. This suggests that a higher volume fraction of steel fibers results in a greater number of fibers at the fracture interface, leading to a more robust bridging effect and, consequently, a higher punching shear capacity. Furthermore, the first cracking loads for the four specimens were recorded at 15 kN, 25 kN, 35 kN, and 40 kN, reflecting improvements of 67%, 133%, and 167%, respectively. This indicates that the presence of steel fibers has a more pronounced effect on the first cracking load than on the ultimate capacity. It is worth mentioning that the UHPC slab without steel fiber (U0R35) experienced failure due to the splitting of the concrete cover, a consequence of the brittle nature of UHPC and its limited tensile strength.
Following a complete failure in punching, a visual examination indicated that the predominant mode of failure for the steel fibers was pull-out, attributed to their straight ends. Closely spaced cracks formed perpendicular to the flexural cracks, illustrating the capacity of fiber-reinforced UHPC to redistribute stress through multiple micro-cracks until fiber pull-out occurs. Upon failure, the fibers under significant stress began to pull out from the matrix at a specific cross-section, which was identified as the weakest point, while remaining intact at another location. This phenomenon was linked to the concentration of maximum strain exceeding the strain capacity of the concrete matrix.

3.2.3. Effect of Reinforcement Ratio (Phase II)

The relationship between the reinforcement ratio and the associated punching shear capacity for slab specimens of Phase II is depicted in Figure 13. The results indicate a linear increase in punching shear capacity as the reinforcement ratio rises. Specifically, as the reinforcement ratio increased from 0% to 1.34%, and then to 3.5%, the corresponding punching shear capacities increased by 33% and 75%, respectively. This trend suggests that a higher reinforcement ratio results in a greater number of reinforcing bars intersecting the punching cone, thereby enhancing the punching shear capacity. Furthermore, the first cracking loads for the three specimens are recorded at 22 kN, 25 kN, and 35 kN, reflecting improvements of 14% and 59%. Thus, an increase in the reinforcement ratio can enhance the integrity of the slab, resulting in an improvement in the initial crack load; however, this effect is not significantly pronounced.

3.2.4. Effect of Granite Powder Instead of Silica Fume (Phase II)

To decrease the material costs associated with ultra-high-performance concrete (UHPC), granite powder was utilized to replace 10% of the silica fume in all specimens except for U2R35. As an inert material, the introduction of granite powder in place of reactive silica fume primarily impacts the strength of the UHPC matrix. When comparing the punching shear capacities of specimens UT50 and U2R35, which are 315 kN and 321 kN, respectively, it is observed that the former is only 1.87% lower than the latter, indicating a minimal effect. Consequently, in terms of punching shear performance, using waste granite powder can be deemed a viable substitute for a portion of silica fume, thereby facilitating cost reduction and promoting environmental sustainability.

4. Calculation Method of Punching Shear Capacity

The punching shear capacity of a UHPC slab can be understood as the result of the punching shear strength of each component multiplied by the failure area. Consequently, to ascertain the punching shear capacity, it is essential to first examine the punching shear angle and the failure range to establish the perimeter of the punching shear section. Following this, by taking into account the contribution of each component to the overall punching shear capacity, a method for calculating the punching shear capacity of UHPC slabs can be developed.

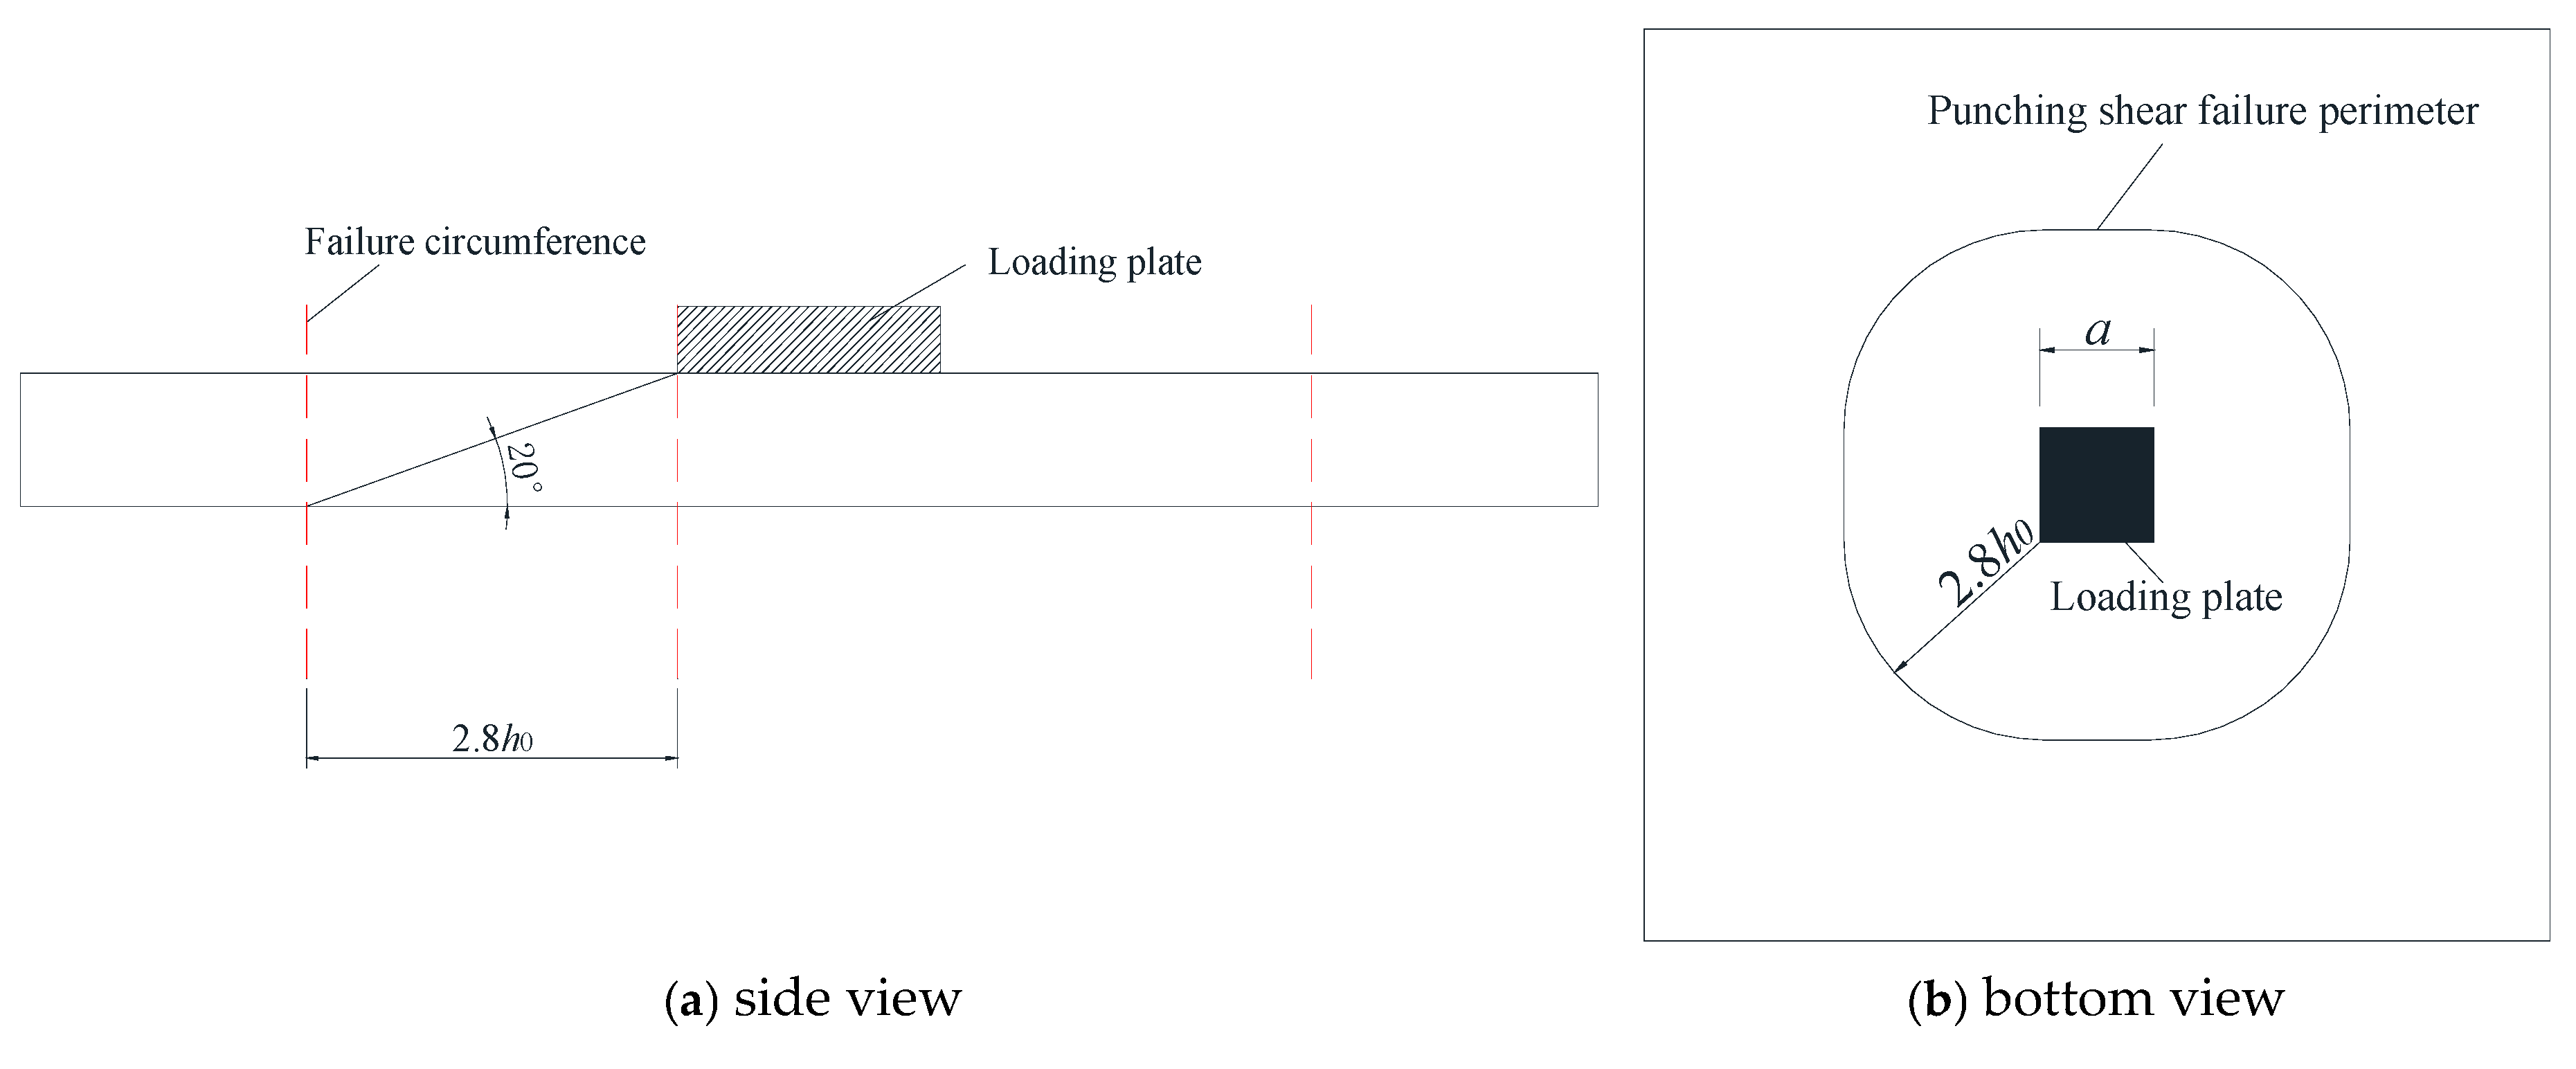
4.1. Determination of Punching Shear Angle and Failure Perimeter

To determine the punching shear angle, it is assumed that the failure shape of the slab’s bottom resembles a circle, with the center point on the bottom surface designated as the center of the failure circle. Subsequently, concentric circles are constructed with an arbitrary radius, and these circles are evenly divided into multiple segments. To partition the circle, a minimum of two perpendicular diameters must be drawn. Consequently, for enhanced precision, each quarter should be subdivided into segments. An increase in the number of segments leads to greater accuracy in the results. Therefore, it has been determined that each quarter will be divided into five segments to ensure precise and practical measurements. As a result, the circle was divided into 20 segments. Based on the failure mode observed in the specimens, the distance from the center point to the intersection of the primary crack and the division lines is selected as the radius of the failure circle, as illustrated in Figure 14. Following the identification of the punching shear failure radius, it is important to note that the punching cone reaches the top surface. By taking into account the dimensions of the loading area, the punching shear angle for each specimen can be calculated. Each specimen is evaluated using the aforementioned method, and the resulting punching shear failure radius and punching shear angle for each specimen are presented in Table 6.
The theoretical range of punching shear failure is circular, with the failure trace represented as a complete circle. However, in practice, the actual range of punching shear failure does not form a perfect circle; instead, the failure trace consists of a combination of circular and square lines. To simplify the calculation method, the average punching shear angle is assumed to be 20°. Consequently, the distance from the punching shear failure section to the edge of the loading plate is determined to be 2.8h0, where h0 denotes the effective thickness of the slab. The failure trace is illustrated in Figure 15.
So, the circumference of the failure zone can be calculated as follows
um = 4a + 5.6πh0
where a is the length of the loading plate, and h0 is the effective thickness of the slab.
Although a fixed punching shear angle of 20° was adopted in this study based on average experimental observations, it is acknowledged that some variability exists (typically within 15–25°). While future stochastic modeling could quantify this variability’s influence on calculated capacity, it is important to recognize that empirical models such as the one employed here are calibrated to match experimental results. As such, any change in the punching shear angle would necessitate recalibration of the associated model parameters to preserve accuracy, thus limiting the practical impact of angle variation alone [61].

4.2. Comparison of Punching Shear Capacity

Regarding the materials used in the UHPC slab, the punching shear capacity is influenced by the UHPC matrix, reinforcing bars, and steel fibers. Thus, the experimental punching shear capacity is validated with different models [65,66,67,68,69]. Below, detailed descriptions of the adopted models are presented, followed by a comparison with the experimental results. Al-Quraishi [65] proposed a method for calculating punching shear capacity represented by Equation (9).
Vp = 0.35 [βh (vfc + vρ + vfte) umf h0]
where βh is the size effect factor, βh = 125/(h0)0.87, and h0 is the effective thickness of the slab. vfc is the shear resistance of the compression zone above the top of the inclined crack, vfc = 0.12(fc)0.35, and fc is the cylinder compressive strength (MPa). vρ is the shear strength carried by the dowel and membrane actions, vρ = (100ρ)0.21, and ρ is the tensile reinforcing steel bars ratio. vfte is the full fiber efficiency of tensile strength along the inclined shear cracks, and its value is recommended as 3.9 MPa. umf is the modified critical failure perimeter, umf = um (1-λF), um is the reference critical failure perimeter = 4a + 5πh0, λ is the non-dimensional factor constant value (0.45), F is the fiber factor, F = (lf/df) Vf, lf and df are the length and diameter of fiber (mm), respectively, and Vf is the steel fiber volume fraction.
Fang et al. [66] proposed Equation (10) for calculating the punching shear capacity of UHPC slabs, V p .
V p = β ρ f t o 1 + β f λ f u p h e i = 1 4 0.75 1 + λ i
where βρ is a coefficient to consider the effect of longitudinal reinforcement on shear capacity, taken greater than 1.0, βρ = (100ρ)0.20. βf is the influence coefficient of steel fibers on punching shear resistance of UHPC slabs, taken as 0.6. fto is the initial cracking strength of UHPC slab (MPa), λf is the characteristic value of steel fiber content, λf = lf.Vf/df, lf is the length of steel fiber (mm), Vf is the volumetric percentage of steel fibers, df is the diameter of steel fiber (mm), up is the effective perimeter of the effective punching shear (mm), u p = u + 4 3 h e , u is the column perimeter (mm), he is the effective slab thickness (mm), and λi is the shear span to depth ratio at the ith side, which should range between 3 and 7.
According to Association Francaise de Genie Civil, AFGC [67], the punching shear resistance of UHPC slabs can be calculated by Equation (11).
V u = v c b o d
where v c   is the punching shear stress at failure (MPa), v c = 0.8 0.67 f s p K , f s p is the splitting tensile strength of concrete (MPa), K is a constant taken as 1.36, b o is the perimeter of the critical section for punching shear taken as d/2 from the face of the column (mm), b o = U + π d , and U is the column perimeter (mm).
The Japan Society of Civil Engineers, JSCE [68], proposed the following Equations to calculate the punching shear resistance of UHPC slabs:
V p d = V p c + V p f
V p c = β d β ρ β r f p c u p d
V p f = f v u p d
f p c = 0.2 f c 3 1.2
β d = 1000 d 4 1.5
β ρ = 100 ρ 3 1.5
β r = 1 + 1 1 + 0.25 u p d
where u p is the effective perimeter for resisting punching shear in the slab—that is, the sum of the perimeter of the bearing area of the concentrated load or reaction and πd (mm)—d is the effective depth (mm), ρ is the reinforcement ratio, β d   is a coefficient to consider the effect of the effective depth on shear capacity, β ρ is a coefficient to consider the effect of longitudinal reinforcement on shear capacity, β r is a coefficient, V p d is the punching shear capacity (N), V p c is the punching shear strength excluding the effect of steel fibers (N), V p f is the punching shear strength provided by steel fibers (N), f p c is the shear stress at failure (MPa), f c is the concrete cylinder compressive strength (MPa), f v is the tensile yield strength of concrete in the direction orthogonal to the diagonal crack direction, and f v = 0 when f v is smaller than 1.5 MPa.
Harris and Roberts-Wollmann [69] proposed Equation (19) for estimating the concrete breakout strength of UHPC slab.
V c = c 1 k 1 f t 3 h + c 2 c 2 d
V c is the concrete breakout strength (N), k 1 is an empirical constant taken as 0.38, c 1 is a conversion factor for the imperial to metric unit system taken as 5.04, h is the slab thickness (mm), c is the loading plate dimensions (mm), f t is the split cylinder tensile strength (MPa), and d is the effective depth (mm).
Table 7 summarizes the experimental punching shear strength alongside the values derived from various models for all slabs. The majority of the results from the selected models were conservative when compared to the experimental findings, although a few instances exhibited excessive conservatism. Conversely, certain results from the models developed by Harris and Roberts-Wollmann [69] demonstrated a lack of conservatism. A comparison of the different outcomes indicates that the model proposed by JSCE [68] yielded the most reasonable conservative results. This can be attributed to the fact that the JSCE model considered all the critical parameters influencing punching shear behavior, as detailed in Table 8. On the other hand, the model proposed by Harris and Roberts-Wollmann [69] showed the least conservative results, plus some unconservative results owing to the simplicity of the model and ignoring the governing key parameters.
As shown in Table 7, the ratio of experimental-to-predicted punching shear capacity varies significantly among the models. The JSCE model exhibited the most consistent and conservative performance, with an average experimental-to-theoretical strength ratio of 1.58 and the lowest coefficient of variation (COV = 0.111), indicating high reliability across varied test conditions. In contrast, the AFGC model, while conservative, had a higher average ratio of 2.20 and a greater COV of 0.194, suggesting more scatter in its predictions. The Al-Quraishi and Fang et al. models yielded similar mean ratios (2.09 and 2.06, respectively), but with higher variability (COVs of 0.189 and 0.223). The Harris and Wollmann model produced the lowest average ratio of 1.23, indicating closer alignment in some cases, but with a higher COV (0.250), reflecting less consistency.
These results confirm that while all models tend to be conservative in predicting the punching strength of UHPC slabs, their reliability varies. The JSCE model emerges as the most robust under the tested conditions. However, the observed scatter in the other models highlights the need for further calibration or model development tailored specifically to UHPC systems with diverse parameters. The results summarized in Table 8 highlight the urgent need for more effort to have a unified model for calculating the punching shear resistance of UHPC slabs, considering all key parameters.
The theoretical models applied in this study were originally developed by other researchers based on their respective experimental datasets. In this research, these models were employed in their original form to objectively evaluate their predictive accuracy when applied to UHPC slabs with varied parameters. This comparative analysis allows for the identification of the most reliable model and serves as a basis for assessing the need for model recalibration or the development of new formulations tailored to UHPC systems. Among the evaluated models, the JSCE approach exhibited the most consistent and conservative agreement with the experimental results, indicating its suitability for UHPC applications under the tested conditions.
It should be noted that the developed models, including the JSCE model, were validated against experimental data with fiber volume fractions up to 3.5% and reinforcement ratios up to 3.5%. Extrapolation to higher values should be approached with caution. Although the JSCE model includes terms for fiber and reinforcement content, the nonlinear and possibly threshold-based behavior at extreme levels remains underexplored. As suggested in the literature [1,9,30,54], punching shear is predominantly governed by concrete matrix strength and failure mechanisms, with reinforcement primarily facilitating flexural cracking and crack distribution. Further validation is needed to ensure reliability under extreme parameter combinations
Several key factors warrant critical discussion when analyzing the discrepancies between calculation models and experimental data for punching shear in UHPC slabs.
  • Material Properties: UHPC exhibits unique mechanical properties, including higher compressive strength and ductility compared to conventional concrete. If the models do not adequately account for these enhanced material characteristics, particularly in terms of tensile strength and strain capacity, this can lead to an underestimation of the punching shear strength.
  • Geometric Considerations: The geometry of the slab, including thickness, reinforcement layout, and support conditions, can significantly influence shear behavior. Models that simplify these geometric parameters may fail to capture critical stress distribution effects that are present in actual slab scenarios.
  • Loading Conditions: The nature of loading, whether it is static or dynamic, can affect the performance of UHPC slabs. Models that do not incorporate factors such as load duration or impact effects may not accurately reflect the true behavior under real-world conditions.
  • Crack Propagation and Ductility: The ability of UHPC to sustain loads post-cracking is a vital aspect that many models may overlook. Discrepancies often arise when models assume brittle failure modes instead of recognizing the progressive failure characteristics inherent in UHPC.
  • Experimental Variability: Variations in experimental setup, including differences in specimen preparation and testing protocols, can lead to inconsistencies between calculated and observed results. It is crucial to ensure that experimental conditions closely mimic those assumed in theoretical models.
  • Model Calibration: Many calculation models rely on empirical coefficients or calibration against specific datasets. If these coefficients are derived from a limited range of tests or do not encompass the full spectrum of UHPC behaviors, they may lead to conservative estimates of punching shear capacity. In conclusion, a thorough investigation into these factors is necessary to reconcile differences between calculated and experimental data for punching shear in UHPC slabs. By addressing these discrepancies through refined modeling techniques and comprehensive experimental validation, we can enhance the reliability of predictive models for structural applications.
Table 7. Comparison between the experimental punching shear strength and that obtained using different models for all slabs.
Slab No.VExp
(kN)
(2)
Theoretical Punching Capacity (kN)Experimental Strength/Theoretical Strength
Al-Quraishi
[65] (3)
Fang et al. [66] (4)AFGC [67]
(5)
JSCE [68]
(6)
Harris and Wollmann [69] (7)(2)/(3)(2)/(4)(2)/(5)(2)/(6)(2)/(7)
U50315153.39134.37122.18185.32259.962.052.342.581.701.21
U65430185.69196.56183.59268.57305.892.322.192.341.601.41
U75520207.34251.51227.54327.14338.442.512.072.291.591.54
U85585229.12344.32273.91388.37372.162.551.702.141.511.57
U100645262.02510.89347.97484.98424.622.461.261.851.331.52
U0R35250152.89109.69107.49182.99228.711.642.282.331.371.09
U1R35295153.61101.46128.79186.31274.021.922.912.291.581.08
U2R0180119.58115.05135.75104.15288.831.511.561.331.730.62
U2R13240147.16110.89122.18163.09259.961.632.161.961.470.92
U3R35355153.39167.28122.18185.32259.962.312.122.911.921.37
Average 2.0902.0592.2021.5801.233
Standard deviation0.3950.4590.4270.1750.309
Coefficient of variation, COV0.1890.2230.1940.1110.250
VExp is the experimental punching strength.
Table 8. Summary of the adopted parameters for the models considered.
MethodSize EffectUHPCFibersPunching Parameters
f c fto f s p ρ lfdfVfTypea/dCritical Shear Perimeter from the Face of the Column
Al-Quraishi [65] Straight steel1.25d
Fang et al. [66] Straight steel1.73d
AFGC [67] 0.5d
JSCE [68] Various0.5d
Harris and Wollmann [69] 1.5d
fto is the initial cracking strength of the UHPC slab (MPa), f s p is the splitting tensile strength of concrete (MPa), ρ is the reinforcement ratio, lf is the length of steel fiber (mm), df is the diameter of steel fiber (mm), and Vf is the volumetric percentage of steel fibers.

5. Conclusions

Based on the test results of the UHPC slabs, considering the specified dimensions and the tested parameters, the following conclusions can be drawn.
(1)
The failure mode of Ultra-High-Performance Concrete (UHPC) slabs looks like that of traditional concrete slabs, characterized by a jagged conical indentation on the top surface and nearly circular closed cracks on the bottom surface. Thanks to the reinforcing properties of steel fibers, UHPC slabs exhibit superior punching shear performance compared to conventional concrete slabs, particularly in failure mode, crack propagation, and ultimate load-carrying capacity.
(2)
The punching shear capacity increases linearly with the thickness of the slab, and this increase occurs at a rate that surpasses that of flexural capacity. A critical thickness that delineates punching shear failure from flexural failure is advised to be no less than 100 mm. Furthermore, an increase in thickness significantly enhances the load at which the first crack occurs.
(3)
The punching shear capacity increases with the increase of steel fiber volume fraction, with a more pronounced rise in the first cracking load.
(4)
The punching shear capacity significantly improves with a higher reinforcement ratio; however, the increase in the load at which the first crack occurs is minimal.
(5)
The punching shear capacity of UHPC slabs experiences a mere reduction of 1.87% when granite powder is utilized to replace 10% of the mass of silica fume.
(6)
A method for calculating the failure perimeter at the bottom surface has been proposed. This information can be a valuable reference for future research and engineering applications.
(7)
The test did not exhibit any flexural failure mode; therefore, the critical thickness value proposed in this paper requires validation through additional tests involving greater thickness. It is also recommended that further investigations be conducted into the interaction between punching shear and bending, as well as the effects of dynamic loading.
(8)
Among the available prediction models, the JSCE approach provided the most balanced and conservatively accurate estimation of punching shear capacity, effectively incorporating the combined effects of slab thickness, reinforcement ratio, and fiber content, thus highlighting its potential as a reliable reference for future design recommendations.
(9)
Although serviceability was not the primary focus of this study, a serviceability limit of Span/800 may be adopted for UHPC bridge deck slabs under general vehicular loading. This serviceability limit is specified in the 2020 AASHTO LRFD Bridge Design Specifications for concrete bridge deck slabs. These limits are intended to ensure user comfort, durability of wearing surfaces, and protection of structural and non-structural components from excessive deformation. Excessive deflections can cause surface cracking, loss of bond, and premature deterioration of overlays.
(10)
Although mechanical test results indicated minimal performance reduction when substituting 10% of silica fume with granite powder, no SEM (Scanning Electron Microscopy) analysis was conducted in this study to investigate potential changes in the microstructure. Future research should include SEM and related microstructural analyses to better understand the interaction between granite powder and the cementitious matrix, and to validate its long-term implications for durability and performance.
(11)
Although each configuration was tested using a single specimen, experimental repeatability was supported by strict standardization of material preparation, curing, instrumentation, and loading protocols. This approach is common in UHPC and structural slab research, where cost and scale limit extensive repetition. Nonetheless, for increased statistical robustness and validation of variability, future work should include multiple specimens per test configuration.

Author Contributions

Data curation, J.L. and B.C.; Formal analysis, J.L., B.C. and H.M.A.; Investigation, J.L., B.C., H.M.A. and K.S.; Methodology, J.L.; Project administration, J.L.; Validation, J.L. and B.C.; Visualization, J.L. and B.C.; Writing—original draft, J.L. and B.C.; Writing—review and editing, H.M.A. and K.S. All authors have read and agreed to the published version of the manuscript.

Funding

This work was financially supported by the Key Program of National Natural Science Foundation of China (Grant No. U1305245) and the Program of Study Abroad for Young Scholars sponsored by the China Scholarship Council.

Data Availability Statement

Data will be made available on request.

Conflicts of Interest

The authors declare that they have no known competing financial interests or personal relationships that could have appeared to influence the work reported in this paper.

References

  1. Wight, J.K.; American Concrete Institute (Eds.) Building Code Requirements for Structural Concrete (ACI 318-19) and Commentary (ACI 318R-19): An ACI Standard; ACI: Farmington Hills, MI, USA, 2019. [Google Scholar]
  2. BS 8110-1; Structural Use of Concrete, Part 1: Code of Practice for Design and Construction. British Standards Institution: London, UK, 2002.
  3. Standard CANA23.3-24; Design of Concrete Structures for Buildings. Canadian Standards Association (CSA): Rexdale, ON, Canada, 2004.
  4. CCES01-2004; Chinese Civil Engineering Society. Guide to Durability Design and Construction of Concrete Structures, 2005 ed. Chinese Building Industrial Publishing: Beijing, China, 2005.
  5. EC 2-1-1; Eurocode 2: Design of Concrete Structures—Part 1: General Rules and Rules for Buildings, The European Standard. European Committee for Standardization (CEN): Brussels, Belgium, 2004.
  6. ECP 203-2018; Egyptian Code for Design and Construction of Reinforced Concrete Structures. Housing and Building National Research Center: Cairo, Egypt, 2018.
  7. Subramanian, N. Evaluation and enhancing the punching shear resistance of flat slabs using HSC. Ind. Concr. J. 2005, 79, 31–37. [Google Scholar]
  8. Elsanadedy, H.M.; Al-Salloum, Y.A.; Alsayed, S.H. Prediction of punching shear strength of HSC interior slab-column connections. KSCE J. Civ. Eng. 2013, 17, 473–485. [Google Scholar] [CrossRef]
  9. Marzouk, H.; Hussein, A. Experimental investigation on the behavior of high-strength concrete slabs. ACI Struct. J. 1992, 88, 701–713. [Google Scholar]
  10. Hassanli, R.; Youssf, O.; El-Naqeeb, M.H.; Yekrangnia, M.; Elchalakani, M.; Ghanbari-Ghazijahani, T.; Bazli, M. Investigation of punching shear performance in concrete slabs reinforced with GFRP and synthetic fibers: An experimental study. Eng. Struct. 2024, 311, 118215. [Google Scholar] [CrossRef]
  11. Afefy, H.M.; El-Tony, E.M. Punching shear resistance of strengthened reinforced concrete interior slab-column connections using ultra-high-performance strain-hardening cementitious composite material. Adv. Struct. Eng. 2019, 22, 1799–1816. [Google Scholar] [CrossRef]
  12. Afefy, H.M.; El-Tony, E.M. Retrofitting of Interior Slab-to-Column Connections for Punching Shear Using Different Techniques. ASCE J. Perform. Const. Facil. 2019, 33, 04018088. [Google Scholar] [CrossRef]
  13. Bartolac, M.; Damjanovic, D.; Duvnjak, I. Punching strength of flat slabs with and without shear reinforcement. Građevinar 2015, 67, 771–786. [Google Scholar]
  14. Hamoda, A.; Sennah, K.; Abadel, A.; Emara, M. Strengthening of Interior Circular Column-slab Region Incorporating Combinations of Bonded UHPECC Layer, CFRP Sheets, and Threaded Steel Bolts. Structures 2024, 69, 107545. [Google Scholar] [CrossRef]
  15. Elbakry, H.M.; Allam, S.M. Punching strengthening of two-way slabs using external steel plates. Alex. Eng. J. 2015, 54, 1207–1218. [Google Scholar] [CrossRef]
  16. Najmi, A.S.; Marahlah, R.H. Swimmer bars as shear reinforcement in reinforced concrete flat slabs. Int. J. Eng. Adv. Technol. (IJEAT) 2015, 4, 113–117. [Google Scholar]
  17. Faria, D.M.; Einpaul, J.; Ramos, A.M.; Ruiz, M.F.; Muttoni, A. On the efficiency of flat slabs strengthening against punching using externally bonded fiber reinforced polymers. Constr. Build. Mater. 2014, 73, 366–377. [Google Scholar] [CrossRef]
  18. Ferreira, M.P.; Melo, G.S.; Regan, P.E.; Vollum, R.L. Punching of reinforced concrete flat slabs with double-headed shear reinforcement. ACI Struct. J. 2014, 111, 363–374. [Google Scholar]
  19. AL-Nasra, M.; Duweib, I.; Najmi, A. The use of pyramid swimmer bars as punching shear reinforcement in reinforced concrete flat slabs. J. Civil. Eng. Res. 2013, 3, 75–80. [Google Scholar]
  20. Khaleel, G.I.; Shaaban, I.G.; Elsayed, K.M.; Makhlouf, M.H. Strengthening of reinforced concrete slab-column connection subjected to punching shear with FRP systems. IACSIT Int. J. Eng. Technol. 2013, 5, 657–661. [Google Scholar] [CrossRef]
  21. Meisami, M.H.; Mostofinejad, D.; Nakamura, H. Punching shear strengthening of two-way flat slabs using CFRP rods. Compos. Struct. 2013, 99, 112–122. [Google Scholar] [CrossRef]
  22. Park, H.G.; Kim, Y.N.; Song, J.G. Lattice shear reinforcement for enhancement of slab-column connections. J. Struct. Eng. 2012, 137, 425–437. [Google Scholar] [CrossRef]
  23. Soudki, K.; El-Sayed, A.K.; Vanzwol, T. Strengthening of concrete slab-column connections using CFRP strips. J. KSU—Eng. Sci. 2012, 24, 25–33. [Google Scholar] [CrossRef]
  24. Tassinari, L.; Lips, S.; Muttoni, A.; Ruiz, M.F. Applications of Bent-up Bars as Shear and Integrity Reinforcement in R/C Slabs. In Proceedings of the Fib Symposium Prague 2011, Session 2B-5: Construction Technology, 2011, Prague, Czech Republic, 8–10 June 2011; 2011; pp. 631–634. Available online: https://infoscience.epfl.ch/server/api/core/bitstreams/8b6e811c-f1dc-4e19-856f-1dba636dd7f9/content (accessed on 21 April 2025).
  25. Ruiz, M.F.; Muttoni, A.; Kunz, J. Strengthening of flat slabs against punching shear using post-installed shear reinforcement. ACI Struct. J. 2010, 107, 434–442. [Google Scholar]
  26. Esfahani, M.R.; Kianoush, M.R.; Moradi, A.R. Punching shear strength of interior slab-column connections strengthened with carbon fiber reinforced polymer sheets. Eng. Struct. 2009, 31, 1535–1542. [Google Scholar] [CrossRef]
  27. Sissakis, K.; Sheikh, S. Strengthening concrete slabs for punching shear with carbon fiber-reinforced polymer laminates. ACI Struct. J. 2007, 104, 49–59. [Google Scholar]
  28. Binici, B.; Bayrak, O. Upgrading of slab-column connections using fiber reinforced polymers. Eng. Struct. 2005, 27, 97–107. [Google Scholar] [CrossRef]
  29. Chen, C.; Li, C. Punching shear strength of reinforced concrete slabs strengthened with glass fiber-reinforced polymer laminates. ACI Strut. J. 2005, 102, 535–542. [Google Scholar]
  30. Cheng, M.Y.; Parra-Montesinos, G.J. Evaluation of steel fiber reinforcement for punching shear resistance in slab–column connections-part I: Monotonically increased load. ACI Struct. J. 2010, 107, 101–109. [Google Scholar]
  31. Harajli, M.H.; Soudki, K.A. Shear strengthening of interior slab-column connections using carbon fiber-reinforced polymer sheets. J. Comp. Const. 2003, 7, 145–153. [Google Scholar] [CrossRef]
  32. Oliveira, D.R.; Melo, G.S.; Regan, P.E. Punching strengths of flat plates with vertical or inclined stirrups. ACI Struct. J. 2000, 97, 485–491. [Google Scholar]
  33. Wu, X.; Yu, S.; Xue, S.; Kang, T.H.-K.; Hwang, H.-J. Punching shear strength of UHPFRC-RC composite flat plates. Eng. Struct. 2019, 184, 278–286. [Google Scholar] [CrossRef]
  34. Bastien-Masse, M.; Brühwiler, E. Experimental investigation on punching resistance of R-UHPFRC–RC composite slabs. Mater. Struct. 2016, 49, 1573–1590. [Google Scholar] [CrossRef]
  35. Al-Obaidi, S.; Davolio, M.; Dicembre, S.; Galdo, M.D.; Monte, F.L.; Ferrara, L. Flexural performance of pre-cracked UHPC slabs exposed to aggressive environments. Constr. Build. Mater. 2025, 466, 140315. [Google Scholar] [CrossRef]
  36. Moreillon, L. Shear Strength of Structural Elements in High-Performance Fiber Reinforced Concrete (HPFRC). Ph.D Thesis, School of Engineering and Architecture, Fribourg, Switzerland, 2013; p. 480. [Google Scholar]
  37. Zohrevand, P.; Yang, X.; Jiao, X.; Mirmiran, A. Punching Shear Enhancement of Flat Slabs with Partial Use of Ultrahigh-Performance Concrete. J. Mater. Civ. Eng. 2015, 27, 04014255. [Google Scholar] [CrossRef]
  38. De Sousa, A.M.D.; Lantsoght, E.O.L.; Genikomsou, A.S.; Krahl, P.A.; El Debs, M.K. Behavior and punching capacity of flat slabs with the rational use of UHPFRC: NLFEA and analytical predictions. Eng. Struct. 2021, 244, 112774. [Google Scholar] [CrossRef]
  39. Cakmak, F.; Menkulasi, F.; Dogu, M. Punching shear capacity of non-prestressed UHPFRC flat Plates: Evaluation of existing methods. Eng. Struct. 2023, 280, 115662. [Google Scholar] [CrossRef]
  40. Richard, P.; Cheyrezy, M. Composition of reactive powder concretes. Cem. Concr. Res. 1995, 25, 15011511. [Google Scholar] [CrossRef]
  41. Nguyen, T.N.; Nguyen, T.T.; Pansuk, W. Experimental study of the punching shear behavior of high-performance steel fiber reinforced concrete slabs considering casting directions. Eng. Struct. 2017, 131, 564–573. [Google Scholar] [CrossRef]
  42. Nguyen-Minh, L.; Rovnak, M.; Tran-Quoc, T. Punching shear capacity of interior SFRC slab-column connections. J. Struct. Eng. 2012, 138, 613–624. [Google Scholar] [CrossRef]
  43. Zhou, Y.; Shou, H.; Li, C.; Jiang, Y.; Tian, X. Punching shear behavior of ultra-high-performance fiber-reinforced concrete and normal strength concrete composite flat slabs. Eng. Struct. 2025, 322, 119123. [Google Scholar] [CrossRef]
  44. Gouveia, N.D.; Lapi, M.; Orlando, M.; Faria, D.M.V.; Ramos, A.M.P. Experimental and theoretical evaluation of punching strength of steel fiber reinforced concrete slabs. Struct. Concr. 2018, 19, 217–229. [Google Scholar] [CrossRef]
  45. Sine, A.; Pimentel, M.; Nunes, S. Experimental investigation on punching shear behaviour of RC-(R) UHPFRC composite flat slabs without transverse reinforcement. Eng. Struct. 2022, 255, 113951. [Google Scholar] [CrossRef]
  46. Chen, J.; Fang, Z.; Fang, C.; Tan, X. Flexural performance of UHPC two-way slab reinforced with FRP bars. Eng. Struct. 2025, 322, 119158. [Google Scholar] [CrossRef]
  47. Ahmed, M.S.; Sennah, K.; Afefy, H.M. Structural Behavior of Full-Depth Deck Panels Having Developed Closure Strips Reinforced with GFRP Bars and Filled with UHPFRC. J. Comp. Sci. 2024, 8, 468. [Google Scholar]
  48. Ahmed, M.S.; Sennah, K.; Afefy, H.M. Fatigue and Ultimate Strength Evaluation of GFRP-Reinforced, Laterally Restrained, Full-Depth Precast Deck Panels with Developed UHPFRC Filled Transverse Closure Strips. Appl. Sci. 2024, 14, 19. [Google Scholar]
  49. Semendary, A.A.; Walsh, K.K.; Steinberg, E.P. Early-age behaviour of an adjacent prestressed concrete box-beam bridge containing UHPC shear keys with transverse dowels. J. Bridge. Eng. 2017, 22, 04017007. [Google Scholar] [CrossRef]
  50. Haber, Z.B.; Graybeal, B.A. Lap-spliced rebar connections with UHPC closures. J. Bridge Eng. 2018, 23, 04018028. [Google Scholar] [CrossRef]
  51. Honarvar, E.; Sritharan, S.; Matthews Rouse, J.; Aaleti, S. Bridge decks with precast UHPC waffle panels: A field evaluation and design optimization. J. Bridge Eng. 2016, 21, 04015030. [Google Scholar] [CrossRef]
  52. Youm, H.S.; Hong, S.G. Evaluation for Punching Shear Strength of Slab-Column Connections with Ultra High Performance Fibre-Reinforced Concrete Overlay. Int. J. Struct. Construct. Eng. 2018, 12, 56–61. [Google Scholar]
  53. Federal Highway Administration. Highway Statistics 2019. 2020. Available online: https://www.fhwa.dot.gov/policyinformation/statistics/2019/ (accessed on 1 May 2025).
  54. Lampropoulos, A.; Tsioulou, O.; Mina, A.; Nicolaides, D.; Petrou, M.F. Punching shear and flexural performance of ultra-high performance fiber reinforced concrete (UHPFRC) slabs. Eng. Struct. 2023, 281, 115808. [Google Scholar] [CrossRef]
  55. Saleem, M.A.; Mirmiran, A.; Mackie, K. Ultra-High-Performance Concrete Bridge Deck Reinforced with High Strength Steel. ACI Struct. J. 2011, 108, 601–609. [Google Scholar]
  56. Joh, C.; Hwang, H.; Kim, B. Punching shear and flexural strengths of ultra-high-performance concrete slabs. High Perform. Struct. Mater. IV 2008, 97, 97–106. [Google Scholar]
  57. Ricker, M.; Häusler, F.; Randl, N. Punching strength of flat plates reinforced with UHPC and double-headed studs. Eng. Struct. 2017, 136, 345–354. [Google Scholar] [CrossRef]
  58. Yanhai, W.; Yanbin, H.; Youhua, Y. Investigation on RPC200 mechanical performance. J. Fuzhou Univ. (Nat. Sci.) 2003, 31, 598–602. [Google Scholar]
  59. Graybeal, B.A. Material Property Characterization of Ultra-High Performance Concrete; FHWA-HRT-06-103; Federal Highway Administration: McLean, VA, USA, 2006. [Google Scholar]
  60. Peng, G.; Wu, J.; Shi, C.; Hu, X. Effect of thermal curing regimes on the mechanical properties and durability of UHPC: A state-of-the-art review. Structures 2025, 74, 108667. [Google Scholar] [CrossRef]
  61. Muttoni, A. Punching shear strength of reinforced concrete slabs without transverse reinforcement. ACI Struct. J. 2008, 105, 440–450. [Google Scholar]
  62. fib Bulletin No. 81. Punching Shear of Structural Concrete Slabs. International Federation for Structural Concrete (Fib). 2017. Available online: https://www.fib-international.org/publications/fib-bulletins/punching-shear-of-structural-concrete-slabs-400-detail.html (accessed on 21 April 2025).
  63. AASHTO. AASHTO LRFD Bridge Design Specifications; American Association of State Highway and Transportation Officials AASHTO: Washington, DC, USA, 2020. [Google Scholar]
  64. Xujian, L. Research on the Mechanical Behavior of Steel Fiber Reinforced High-Strength Concrete Slabs Subjected to Punching Shear; Zhejiang University: Hangzhou, China, 1999. [Google Scholar]
  65. Al-Quraishi, A. Punching Shear Behavior of UHPC Flat Slabs. Doctoral Thesis, University of Kassel, Kassel, Germany, 2014. Available online: https://kobra.uni-kassel.de/handle/123456789/2014092546088 (accessed on 21 April 2025).
  66. Fang, Z.; Chen, J.; Cao, Q. Experimental study on punching shear behavior of UHPFRC two-way slabs. China J. Highway Transport. 2021, 34, 91. (In Chinese) [Google Scholar]
  67. AFGC. Ultra-High-Performance Fiber-Reinforced Concrete Recommendations; Association Francaise de Genie Civil: Paris, France, 2013. [Google Scholar]
  68. JSCE. JSCE82: Recommendations for Design and Construction of High-Performance Fiber Reinforced Cement Composites with Multiple Fine Cracks (HPFRCC); Japan Society of Civil Engineers: Tokyo, Japan, 2008. [Google Scholar]
  69. Harris, D.; Roberts-Wollmann, C. Characterization of Punching Shear Capacity of Thin Ultra-high-Performance Concrete Slabs. Virginia Tech. 2005. Available online: https://vtechworks.lib.vt.edu/items/9e8ff6a2-8475-4a97-bcad-7ea25f386bc3 (accessed on 21 April 2025).
Figure 1. Test setup.
Buildings 15 01656 g001
Figure 2. Arrangement of the displacement measure point.
Buildings 15 01656 g002
Figure 3. Arrangement of strain measure point.
Buildings 15 01656 g003
Figure 4. Failure modes of all slab specimens of Phase I at the lower surface.
Buildings 15 01656 g004
Figure 5. Failure modes of all slab specimens of Phase I under patch loading.
Buildings 15 01656 g005
Figure 6. Load–central deflection curves of all slabs of Phase I.
Buildings 15 01656 g006
Figure 7. Load–tensile strain curve of lower reinforcement for all slabs of Phase I.
Buildings 15 01656 g007
Figure 8. Plastic hinge failure mechanism.
Buildings 15 01656 g008
Figure 9. Plastic hinge line skews with rebar.
Buildings 15 01656 g009
Figure 10. Growth rate of punching shear capacity and flexural capacity with increasing thickness.
Buildings 15 01656 g010
Figure 11. Effect of slab thickness (Phase I).
Buildings 15 01656 g011
Figure 12. Effect of steel fiber contents (Phase II).
Buildings 15 01656 g012
Figure 13. Effect of reinforcement ratios (Phase II).
Buildings 15 01656 g013
Figure 14. Determination of the punching shear failure radius.
Buildings 15 01656 g014
Figure 15. The actual punching shear range at the bottom surface.
Buildings 15 01656 g015
Table 1. Details of specimens for all slabs of Phase I and Phase II.
Phase No.Slab No.Concrete TypeSlab Thickness (mm)Reinforcements Ratio (%)Substitution Rate of Granite Powder (%)Steel Fiber Volumetric Fraction (%)
Phase IU50UHPC503.5002
U65UHPC652.4502
U75UHPC752.0402
U85UHPC851.7502
U100UHPC1001.4402
C50-100NSC1001.4402
Phase IIU0R35UHPC503.50100
U1R35UHPC503.50101
U2R0UHPC500102
U2R13UHPC501.34102
U3R35UHPC503.50103
Table 2. Mixing proportion of UHPC (kg/m3).
MaterialsCementSilica FumeGranite PowderFine SandWater ReducerWaterSteel Fiber Content
Mixing proportion10.270.031.20.0250.182% *
* Slabs of Phase I only; this ratio varies for slabs of Phase II.
Table 3. Feature loads and deflections of specimens of Phase I.
Slab No.The First Crack Load Pcr (kN)Mid-Span Deflection Corresponding to Pcr (mm)Ultimate Load Pu (kN)Mid-Span Deflection Corresponding to Pu (mm)Pcr/Pu
U50301.7531533.310.10
U65401.6343041.680.10
U75752.5952033.50.14
U85802.3358529.670.14
U1001551.6364525.450.24
C50-1001201.5146514.450.26
Table 4. Comparison between punching shear capacity and flexural capacity of all slabs of Phase I.
Slab No.Mfu (kN.m)Ff (kN)Fu (kN)Fu/Ff
U5052.63414.473150.76
U6565.00511.904300.84
U7573.37577.785200.90
U8579.02622.345850.94
U10082.73651.526450.99
C50-10068.66540.704650.86
Mfu = flexural capacity of the slab; Ff = failure flexural load based on yield line theory; Fu = punching failure load based on experimental test.
Table 5. Details and results of slab specimens of Phase II.
Specimen No.Reinforcement
Ratio (%)
Substitution Rate of Granite Powder (%)Steel Fiber Volumetric Fraction (%)Cubic Compressive Strength (MPa)Elastic Modulus
(MPa)
Bending Strength
(MPa)
The first Crack Load
(kN)
Ultimate Load (kN)
U503.5002103.5635.3116.1035315
U0R353.50100110.2736.4718.2215250
U1R353.50101124.7738.3721.8325295
U2R00102127.4539.8623.0122180
U2R1341.34102120.3438.3320.7125240
U3R353.50103---40355
Table 6. Calculation of punching shear angle for slabs of Phase II.
Specimen No.Punching Shear Failure Radius (mm)Slab Thickness (mm)Punching Shear Angle (°)
U50153.95018
U0R35137.45020
U1R35123.85022
U2R0186.65015
U2R134107.25025
Disclaimer/Publisher’s Note: The statements, opinions and data contained in all publications are solely those of the individual author(s) and contributor(s) and not of MDPI and/or the editor(s). MDPI and/or the editor(s) disclaim responsibility for any injury to people or property resulting from any ideas, methods, instructions or products referred to in the content.

