Article

Simulation Method for Complex Constraints and the Necessity of Joints in an Early-Age, Large-Volume Concrete Slab—A Case Study of Complex Column Grids and Wall Constraints

1
School of Materials Science and Engineering, Tongji University, Shanghai 201804, China
2
Shanghai Urban Construction Municipal Engineering (Group) Co., Ltd., Shanghai 201324, China
*
Author to whom correspondence should be addressed.
Buildings 2025, 15(10), 1647; https://doi.org/10.3390/buildings15101647
Submission received: 21 April 2025 / Revised: 6 May 2025 / Accepted: 13 May 2025 / Published: 14 May 2025
(This article belongs to the Special Issue Trends and Prospects in Cementitious Material)

Abstract

In modern engineering and construction, mass concrete structures impose stringent requirements on crack control. However, there exists a conflict between design and construction: design primarily addresses the structural performance needs during service phases, while construction must confront the challenges of early-stage performance. It is, therefore, essential to investigate the complex constraints affecting mass concrete structures during their early stages. In this paper, a spring foundation was employed to simulate the intricate constraints on mass concrete footings at early ages, with parametric analyses systematically exploring the influence of spring constant values. The study reveals that excessively large spring constants overestimate constraint effects, leading to amplified stress calculations, while overly small constants underestimate actual constraints, resulting in diminished computed stresses. Building on these findings, this work establishes a quantitative relationship between spring constants and stress responses. Notably, a spring constant table incorporating various constraint scenarios was compiled to provide engineering recommendations. The goal was to reconcile the conflict between early-age and in-service performance through precise constraint modeling, offering theoretical foundations for selecting rational constraint parameters. This approach resolves critical issues in bottom slab design optimization and construction control, particularly addressing abnormal stress distributions and crack control challenges stemming from complex constraints.

1. Introduction

Massive concrete structures play an important role in modern engineering construction; however, the design and construction of such structures face great challenges and require high crack control, and the high requirements for crack control in container-type structures stem from their special functions and usage environments [1,2,3]. For example, solid waste treatment ponds must ensure that no leakage occurs at the bottom to prevent the pollution of the surrounding environment by hazardous substances; immersed tube tunnels, as part of the transportation infrastructure, similarly, need to maintain structural integrity to ensure their long-term reliable operation [4]. However, in contrast to these stringent requirements, the design and construction of mass concrete structures face conflicting problems.
The early-age cracking of mass concrete has long been a challenging issue in the field of engineering construction. Owing to its large dimensions, mass concrete releases a significant amount of heat during the hydration process [5,6,7], which, in turn, induces substantial deformation. The transfer and dissipation of heat within the concrete are restricted, particularly in the central region, where heat cannot be readily dissipated [8,9]. This results in a highly non-uniform distribution of heat within the concrete. The uneven distribution of heat leads to mutual constraints among the internal units of the concrete, creating an internal constraint effect and thereby generating stress. Meanwhile, mass concrete is typically employed as critical continuous structural elements such as slabs and foundations. The strong external constraints imposed by the surrounding components further complicate the stress distribution, making the development path and morphology of cracks more unpredictable [1,5]. Given the high strength of external constraints, significant stress is easily generated during deformation. When the stress reaches the tensile limit of the concrete, cracks are likely to form [10]. Therefore, the influence of external constraints on the formation of concrete cracks is substantial, and their underlying mechanisms should not be overlooked.
The deformation of mass concrete is the fundamental cause of stress generation. Research on the shrinkage and hydration heat expansion [11] of mass concrete has already reached a relatively mature stage. However, external constraints are significant factors that further amplify stress and promote the development of microcracks. These constraints have a substantial impact on the timing of crack appearance, crack distribution, and crack width. Kambiz Raoufi [12] conducted laboratory-scale and large-scale full-scale tests under different constraint conditions. The results indicated that in base-constrained specimens, when the proportion of the constrained area is high, the maximum crack width is relatively small, but the number of cracks is greater. Conversely, when the proportion of the constrained area is low, cracks tend to appear earlier and form a dominant crack [12]. Similarly, the American Concrete Institute (ACI) Committee has also highlighted the importance of external constraints in mass concrete specifications, noting that the stress distribution and cracking patterns under continuous, intermittent, or end constraints are significantly different [13]. For example, in actual engineering applications, such as underground composite walls, different connection methods can lead to markedly different cracking behaviors. In numerical calculations of early-age concrete properties, even if the volumetric deformation (shrinkage, creep, and thermal deformation) is the same, stronger boundary constraints can generate greater tensile stress, thereby increasing the risk of cracking [14]. Assuming the worst-case scenario of end constraints may overestimate the width of early-age thermal cracks [15]. Foundation constraints, as a common type of continuous large-scale external constraint, have been extensively studied, particularly with regard to their effect on the shrinkage of concrete walls. Research has focused on concrete walls with continuous foundation constraints to control cracking caused by volume changes, such as crack formation and width [16], the distribution of constraints in walls with different length-to-height ratios, and the distribution of constraint degrees in cylindrical reinforced concrete water tank wall segments [13]. It is evident that to accurately assess the risk of early-age cracking, the external constraint conditions must be precisely and quantitatively described.
Currently, the established methods for reducing early-age cracking in mass concrete mainly include the addition of admixtures [17,18] to reduce concrete shrinkage, the external insulation of mass concrete to minimize temperature differences between the interior and exterior [19], and the use of construction techniques such as post-poured strips or segmented casting to allow partial concrete to deform sufficiently and thereby mitigate crack development. Among these methods, the use of post-poured strips is the most common and widely adopted. The post-poured strip method involves dividing mass concrete into multiple sections and retaining a strip-shaped gap between adjacent sections to delay pouring until the previously poured sections have fully developed deformation. By the end of the 20th century, this construction method had already been incorporated into the national standard of China, in the “Code for Design of Concrete Structures” (GBJ 10-89) [20]. However, the construction method of post-poured strips often encounters contradictions between design and implementation in practical engineering. While design institutes strictly arrange post-poured strips according to specifications to ensure structural safety, construction processes face challenges including schedule delays (requiring 60-day curing periods), difficulties in construction joint cleaning, and component stiffness reduction. This contradiction originates from the complexity of early-age cracking in mass concrete, particularly the difficulty in predicting cracking behavior under complex restraint conditions.
Existing research lacks discussion on reasonable modeling methods for column grid-wall composite constraints in super-large-scale projects. This paper proposes substituting actual complex column grid restraints with spring foundations. By simulating the elastic interaction between complex restraints and structures, the conventional solid modeling of rigid column grids is transformed into a spring-supported system with quantifiable stiffness. The core principle lies in using equivalent spring stiffness to reflect the reaction forces and displacement responses of upper structures subjected to complex base restraints. This method resembles soil springs but demonstrates broader applicability. Unlike soil springs that primarily simulate local elastic resistance at soil-structure interfaces [21,22], spring foundations not only encompass vertical bearing capacity but also comprehensively characterize horizontal interaction forces under complex constraints through adjustable spring stiffness parameters, thereby simplifying the spatial coupling constraints of complex column grids in computational models. The spring foundation method significantly outperforms traditional solid column grid modeling in computational efficiency by avoiding tedious node degree-of-freedom coupling calculations, making it suitable for the equivalent substitution of complex constraints.
The paper first elucidates the principle of spring foundations and the determination method of spring coefficients, subsequently providing a reference table of spring parameters for columns of different dimensions calculated through this methodology. Through the modeling of complexly restrained slabs and by adjusting spring coefficients in different directions, stress variations at different positions under changing spring coefficients were analyzed. Finally, taking the base slab project of Shanghai Laogang Eco-Environmental Protection Base as an example, a simplified model using spring foundations to substitute complex constraints was established through the weak thermo-mechanical coupling method. The mechanical behaviors of the slab with post-poured strips and reinforced strips were comparatively analyzed. Combining numerical simulations with field data, the necessity of joints was verified and theoretical support for schedule optimization was provided.
Innovations of this study include: (1) establishing a simulation system using spring foundations to replace actual constraints; (2) compiling a spring parameter reference table for columns of various dimensions; and (3) investigating influence patterns of multiple parameter groups. The research provides solutions for the design and construction of mass concrete slabs under complex constraints, while offering numerical simulation technical support for similar projects.

2. Methods for Simulating Values in Complex Constraint Situations

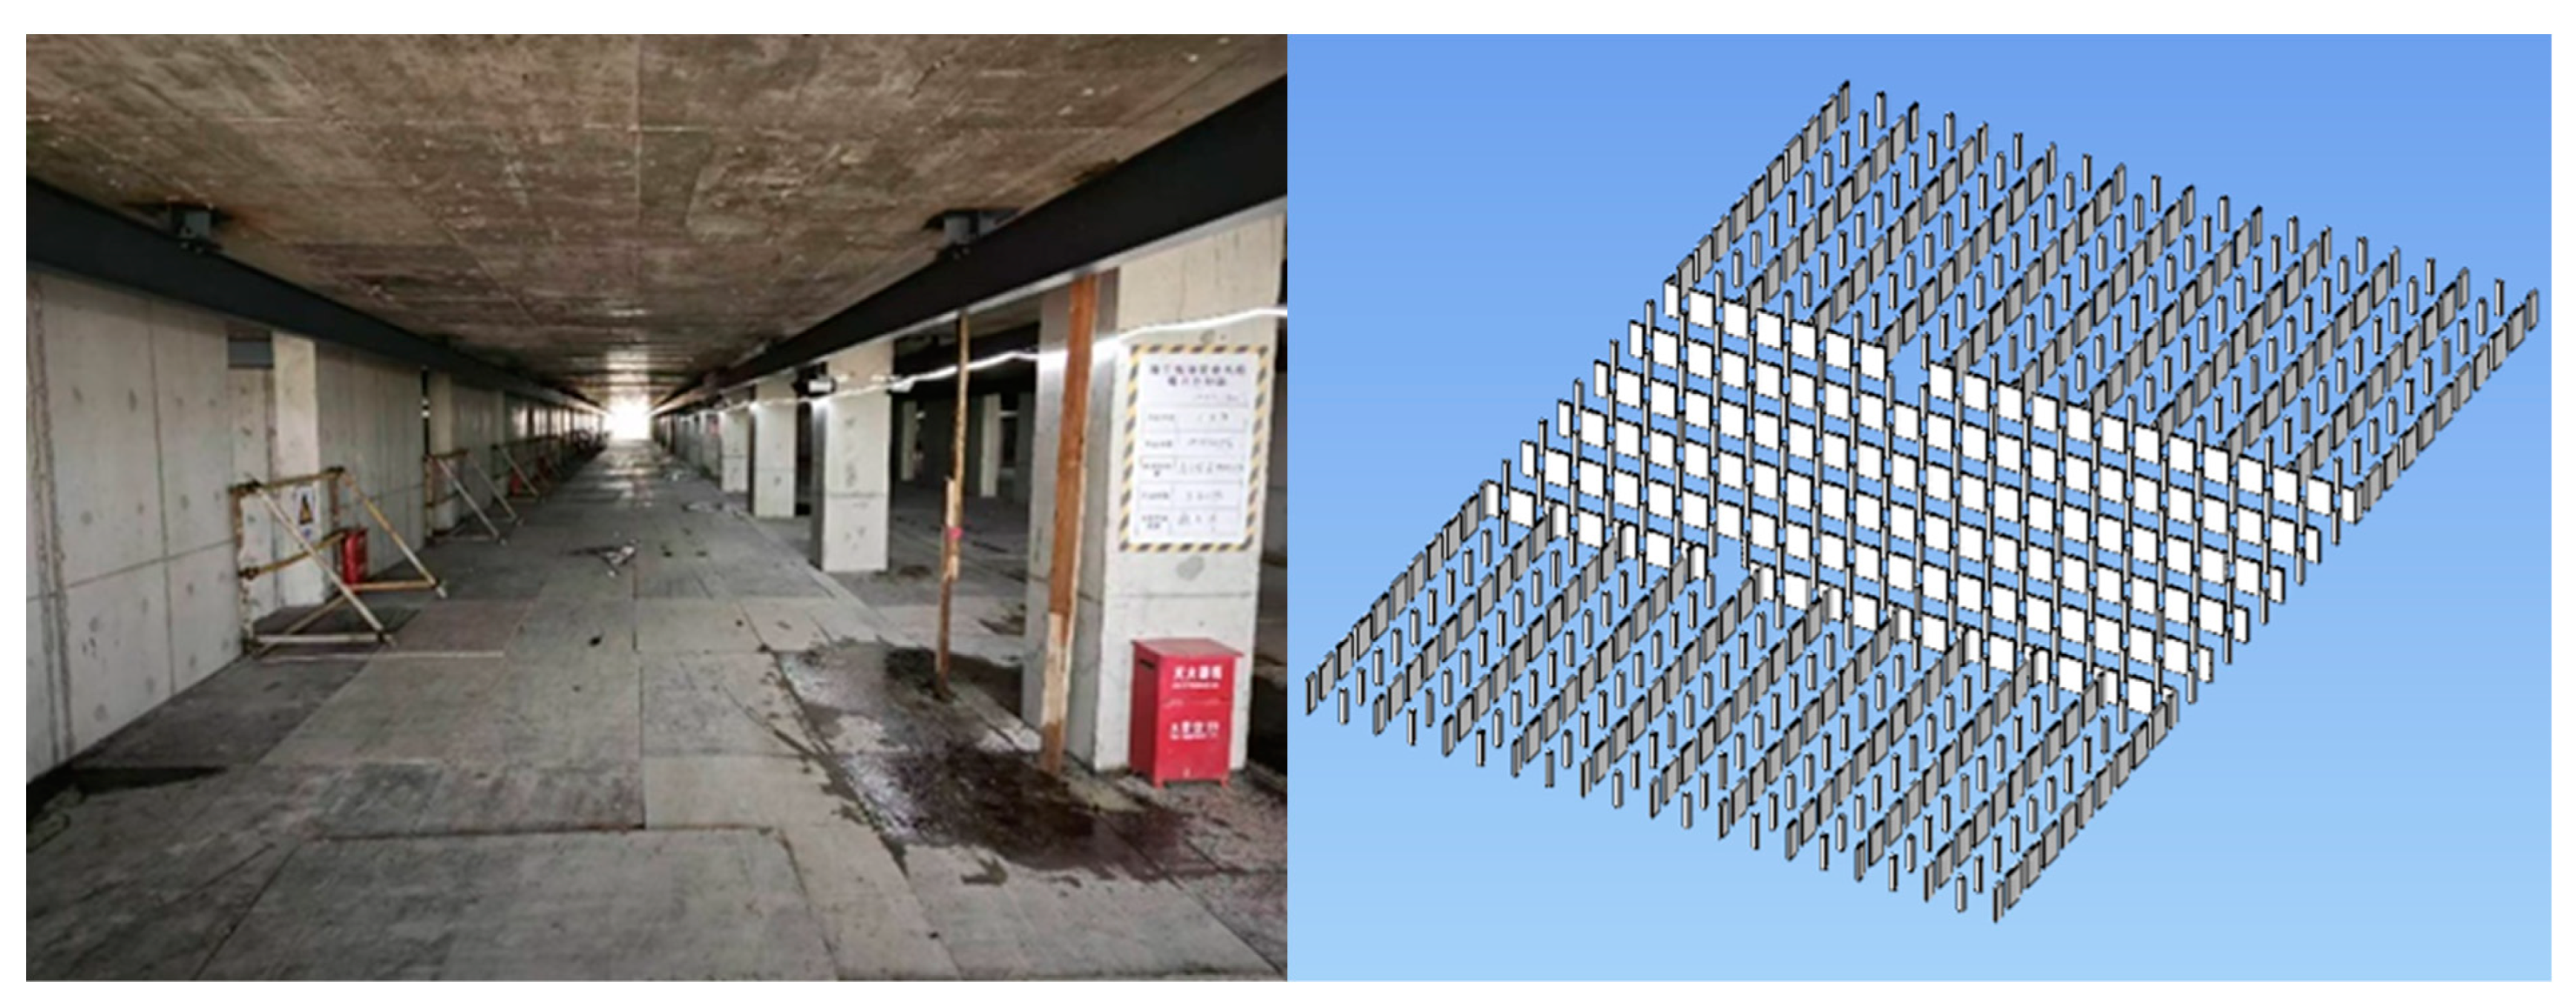
2.1. Complex Constraint Situations

The complex constraints studied in this paper refer to the intricate column grids and walls beneath large-volume concrete slabs, where columns and walls are closely spaced with small intervals, as depicted in Figure 1. The complex constraints studied in this paper refer to the complex column network and wall constraints under the mass concrete footing, with a small column spacing and dense distribution of wall spacing, as shown in Figure 1 (5 m between columns and 5 m between columns and walls—this figure is only used as a schematic to illustrate the complexity of the constraints).
As shown in Figure 1, this type of complex constraint consumes a large amount of computational resources if studied by solid modeling, so this study expected to simulate the constraints using a spring foundation and set the faces of the columns or walls under the base plate connecting with the base plate as spring constraints instead of using solid modeling, which can greatly reduce the model complexity and computational burden. The details of the spring foundation are introduced in Section 2.2.

2.2. Theoretical Basis for the Spring Foundation

A spring foundation is an engineering model that simulates the force response of an object. Spring foundations can be used to model complex constraint relationships between objects when studying forces, deformations, or vibrations.
The basic principle of spring foundations is to use the elastic properties of springs to approximate the forces applied to an object according to Hooke’s law, which states that the force is proportional to the deformation. This model assumes a linear elastic relationship whereby the deformation (deflection) of the spring is proportional to the applied external force and the restoring force is in the opposite direction of the deformation. When studying the behavior of an object under complex constraints, the object can be connected to other structures or constraints with a spring foundation. This simplifies the complex constraint relationship to that of a spring, thus facilitating numerical simulation and analysis. The spring foundation is characterized by its simplicity and adjustability, which enables the deformation of the object under force to be simulated and thus numerically analyzed accordingly.
The equation for the spring foundation is as follows:
F A = k A u u 0 ,
The breakdown of the equation components is as follows:
F A denotes the force applied per unit area by the spring foundation support;
k A represents the spring constant; and
u u 0 indicates the change in displacement.

2.3. Methods for Determining the Spring Constant

The fundamental principle for calculating spring stiffness involves modeling the constraints from the bottom column or wall as a spring. The specific spring coefficient is determined by Young’s modulus, dimensions, and other relevant parameters of the supporting column or wall. This is achieved by simulating a column or wall with fixed boundary conditions (where the bottom surface is subjected to rigid constraints, as illustrated in Figure 2), applying an imposed displacement at its top surface, and calculating the resulting stress values on the constrained surface under this displacement condition. The spring stiffness is then derived from the ratio of stress magnitude to displacement magnitude, as expressed in Equation (2).
k A = F A x ,
where k A refers to the spring constant, F A refers to the restraining surface stress, and x is the magnitude of the forced displacement.
For mass concrete, the side lengths of the base plate columns usually vary within a small range—usually between tens of centimeters and several meters; the most common side lengths are approximately 50 cm to 2 m, while the heights also vary from several meters to a dozen meters.

2.3.1. X-Direction, Y-Direction Spring Constant

We calculated the values of the spring constant for the base plate column constraints at different heights and sizes, as shown in Table 1, applied a 1 mm forced displacement to the upper surface of the column in contact with the base plate, and then calculated the ratio of the stress on the contact surface to the size of the forced displacement using the software COMSOL Multiphysics 6.3 to obtain the results of the spring constant values. Given the limited variability in side lengths, the results can represent typical engineering practices.

2.3.2. Z-Direction Spring Constant

For columns and walls, from z to the base plate downward, we believe that it is not possible to move, and for the z upward spring coefficient value of the factors affecting the more complex ones, subject to the actual situation on the site, the situation of the reinforcement in the column, and many other factors, the use of the above calculation method is not applicable. The complete concrete restraint is simplified as a spring bearing, the spring coefficient is the modulus of elasticity of concrete, and the order of magnitude is 1010 N/m3. The soft ground restraint is simplified as a spring bearing, the spring coefficient is the vertical spring stiffness of the soil, and the order of magnitude of the bed coefficient of the soil layer in the Shanghai area is 107 N/m. Therefore, the value of the spring coefficient of the z upward movement was taken in the range of 107 N/m to 1010 N/m.

3. The Impact of Spring Constant Values on Simulation Results

The theoretical method of determining the spring constant is described in Section 2.3, but the actual spring constant value is not always in accordance with the calculation results in actual projects due to the construction conditions, construction quality, reinforcement arrangement, and other factors. A model is established in this section to explore the effect on the stress calculation results when the spring constant changes. It is worth noting that the models established are different due to the different construction requirements in different environments. According to the construction requirements in this study, the established models have a smaller spacing and a larger number of columns in the base plate.

3.1. Geometric Model and Boundary Conditions

We established a model of a 4.75 m × 4.75 m × 0.25 m bottom slab, featuring 16 square constraint positions on the bottom, each with a side length of 0.5 m, height of 5 m, and spaced 0.75 m from one another, to simulate the column constraints. The specific details are shown in Figure 3.
The bottom slab was modeled as an elastic material with a Young’s modulus of 25 GPa and a Poisson’s ratio of 0.2.
The contraction part was used to simulate the early-stage plastic shrinkage of the base slab, while the expansion part was used to simulate the early-stage expansion of the base slab caused by hydration and exothermic reactions. In both cases, the stress conditions of the base slab were calculated, including the stress at the top center, bottom center, and the maximum stress value of the base slab. Based on the typical value of the thermal expansion coefficient of concrete, α = 1.0 × 10⁻⁵/°C, when mass concrete experiences a temperature difference of up to 50 °C during early-age hydration and heat release, the theoretical value of thermal expansion strain can reach ε = αΔT = 5.0 × 10⁻⁴ in magnitude. For plastic shrinkage strain, practical engineering conditions, influenced by curing conditions and environmental factors, may result in strains of the order of 1.0 × 10⁻⁴. In this study, the baseline values for expansion and contraction strains were set at 1.0 × 10⁻³ in magnitude. This parameter treatment is primarily based on two considerations: (1) amplifying the strain magnitude enhances the visualization of computational results, facilitating the observation of deformation trends and (2) establishing a clear magnitude difference helps to more distinctly reveal the structural response patterns under thermal expansion and contraction deformation. This approach has been validated through parameter sensitivity analysis, ensuring that it does not alter the interaction mechanisms among the physical quantities.
The spring coefficients were set for the initial bottom, with the x and y direction spring coefficients taking the value of 2.7 × 10⁷ N/m, according to Table 1 in Section 2.3, and the z-direction spring coefficient taking the middle of the empirical range of 109 N/m in Section 2.3.

3.2. Stress Conditions During Floor Slab Contraction

Three different values of the spring constant in the z direction were used, and six different spring constants in the x and y directions were used for each value because the side lengths of the columns in the x and y directions in this model are the same, so the values of the spring constants in the x and y directions are the same, and the computational results are shown in Table 2.
Analysis of the computational results in the table reveals that when the z-direction spring coefficient was held constant, the stresses at the center of the upper surface, the center of the lower surface, and the maximum stress value of the base slab all exhibited an increasing trend as the x-direction and y-direction spring coefficients increased. However, as the z-direction spring coefficient decreased, the situation became more complex: the stress at the center of the upper surface of the base slab decreased sharply, while the stress at the center of the lower surface shows an increasing trend. This phenomenon may occur because the magnitude of the z-direction spring coefficient influences the deflection of the base slab’s deformation, thereby affecting the stress values at the centers of the upper and lower surfaces.

3.3. Stress Conditions During Expansion of the Floor Slab

Consistent with the calculation conditions during contraction, the stress calculation during expansion was modeled with three z-direction spring constant values; six x- and y-direction spring constants were used for each value, and the calculation results are shown in Table 3.
Similar to the contraction scenario in Table 2, when the z-direction spring coefficient was held constant, the stresses at the center of the upper surface, the center of the lower surface, and the maximum stress value of the base slab all exhibited an increasing trend as the x-direction and y-direction spring coefficients increased. Due to the presence of complex constraints, expansion induced compression at the center of the base slab, resulting in negative pressure values. Moreover, an excessively large z-direction spring coefficient can influence the deflection of the base slab’s deformation, thereby significantly affecting the stress value at the center of the upper surface.

3.4. Summary of the Impact of Spring Constant Magnitude

According to the contraction and expansion strain results, as shown in the tables, as the constraint constant increases by orders of magnitude, the corresponding stress also increases by the same order of magnitude, but the upper limit of the increase in the spring constant is a fixed constraint, so there is a maximum value of the stress, so with an increase in the spring constant, the increase in the magnitude of the stress decreases.

4. Calculated Results in Actual Engineering and Comparison of Two Scenarios With and Without Floor Joints

The calculations in this section are based on a real-world engineering case: the Shanghai Laogang Ecological Environmental Protection Base, currently the largest solid waste treatment center in Asia, located in Shanghai. The primary construction components of this project include an industrial solid waste landfill site, a hazardous waste landfill site, regional environmental engineering infrastructure, temporary storage and pre-treatment workshops, mechanical maintenance workshops and warehouses, integrated retention ponds, wastewater treatment stations, leachate regulation ponds, testing centers, security and metering facilities, and a comprehensive administrative building. The total site area spans 102,386.8 square meters. Engineering renderings and construction site photographs are presented in Figure 4, where annotations illustrate the zoning configurations of floor slabs during different construction phases. The base slabs in various zones are exceptionally large-scale, typically spanning tens of meters in dimension. Given the stringent leakage resistance requirements for concrete structures in solid waste treatment applications, this project imposes extremely high construction specifications for early-age concrete base slabs.
This paper takes the early-age period of a large bottom slab within a specific pouring area of the hazardous waste landfill as an example. This study aimed to validate the accuracy of using the spring foundation to calculate stress under complex constraints for the early-age period of large-volume slabs. Additionally, the stress conditions with and without bottom slab joints were calculated, and the necessity of these joints in slab design was investigated.

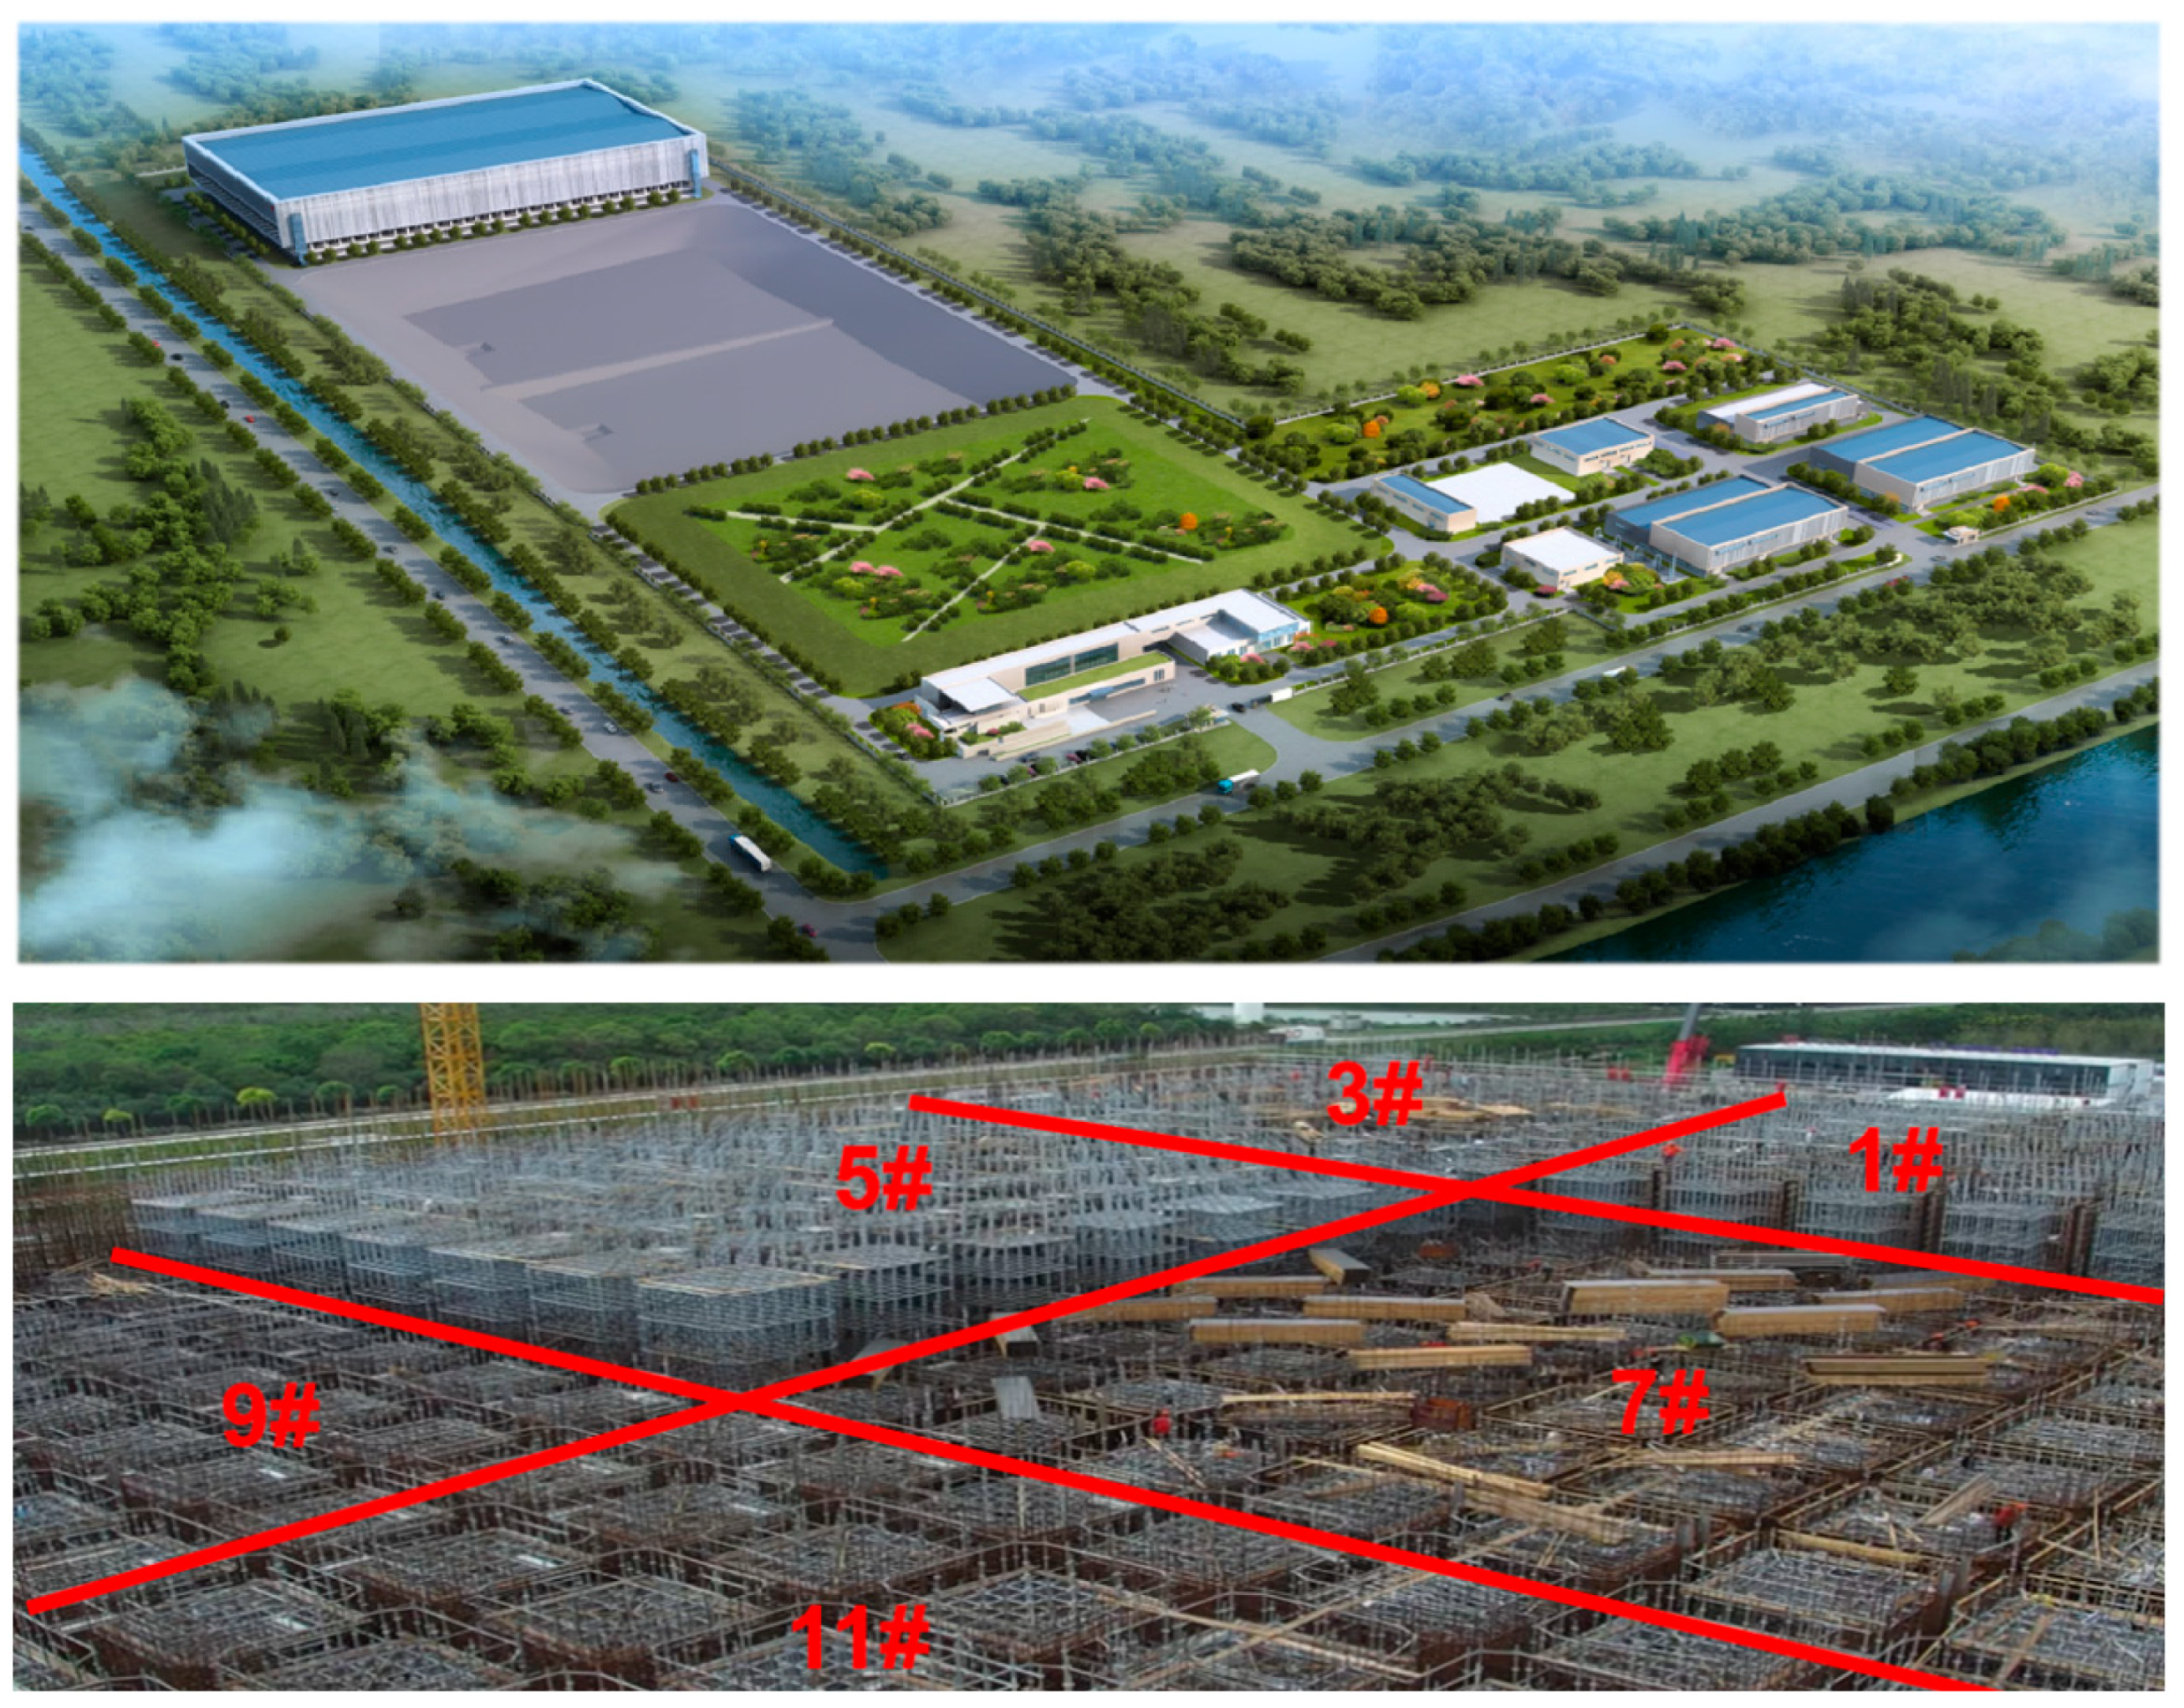
4.1. The Model of the Engineering Project

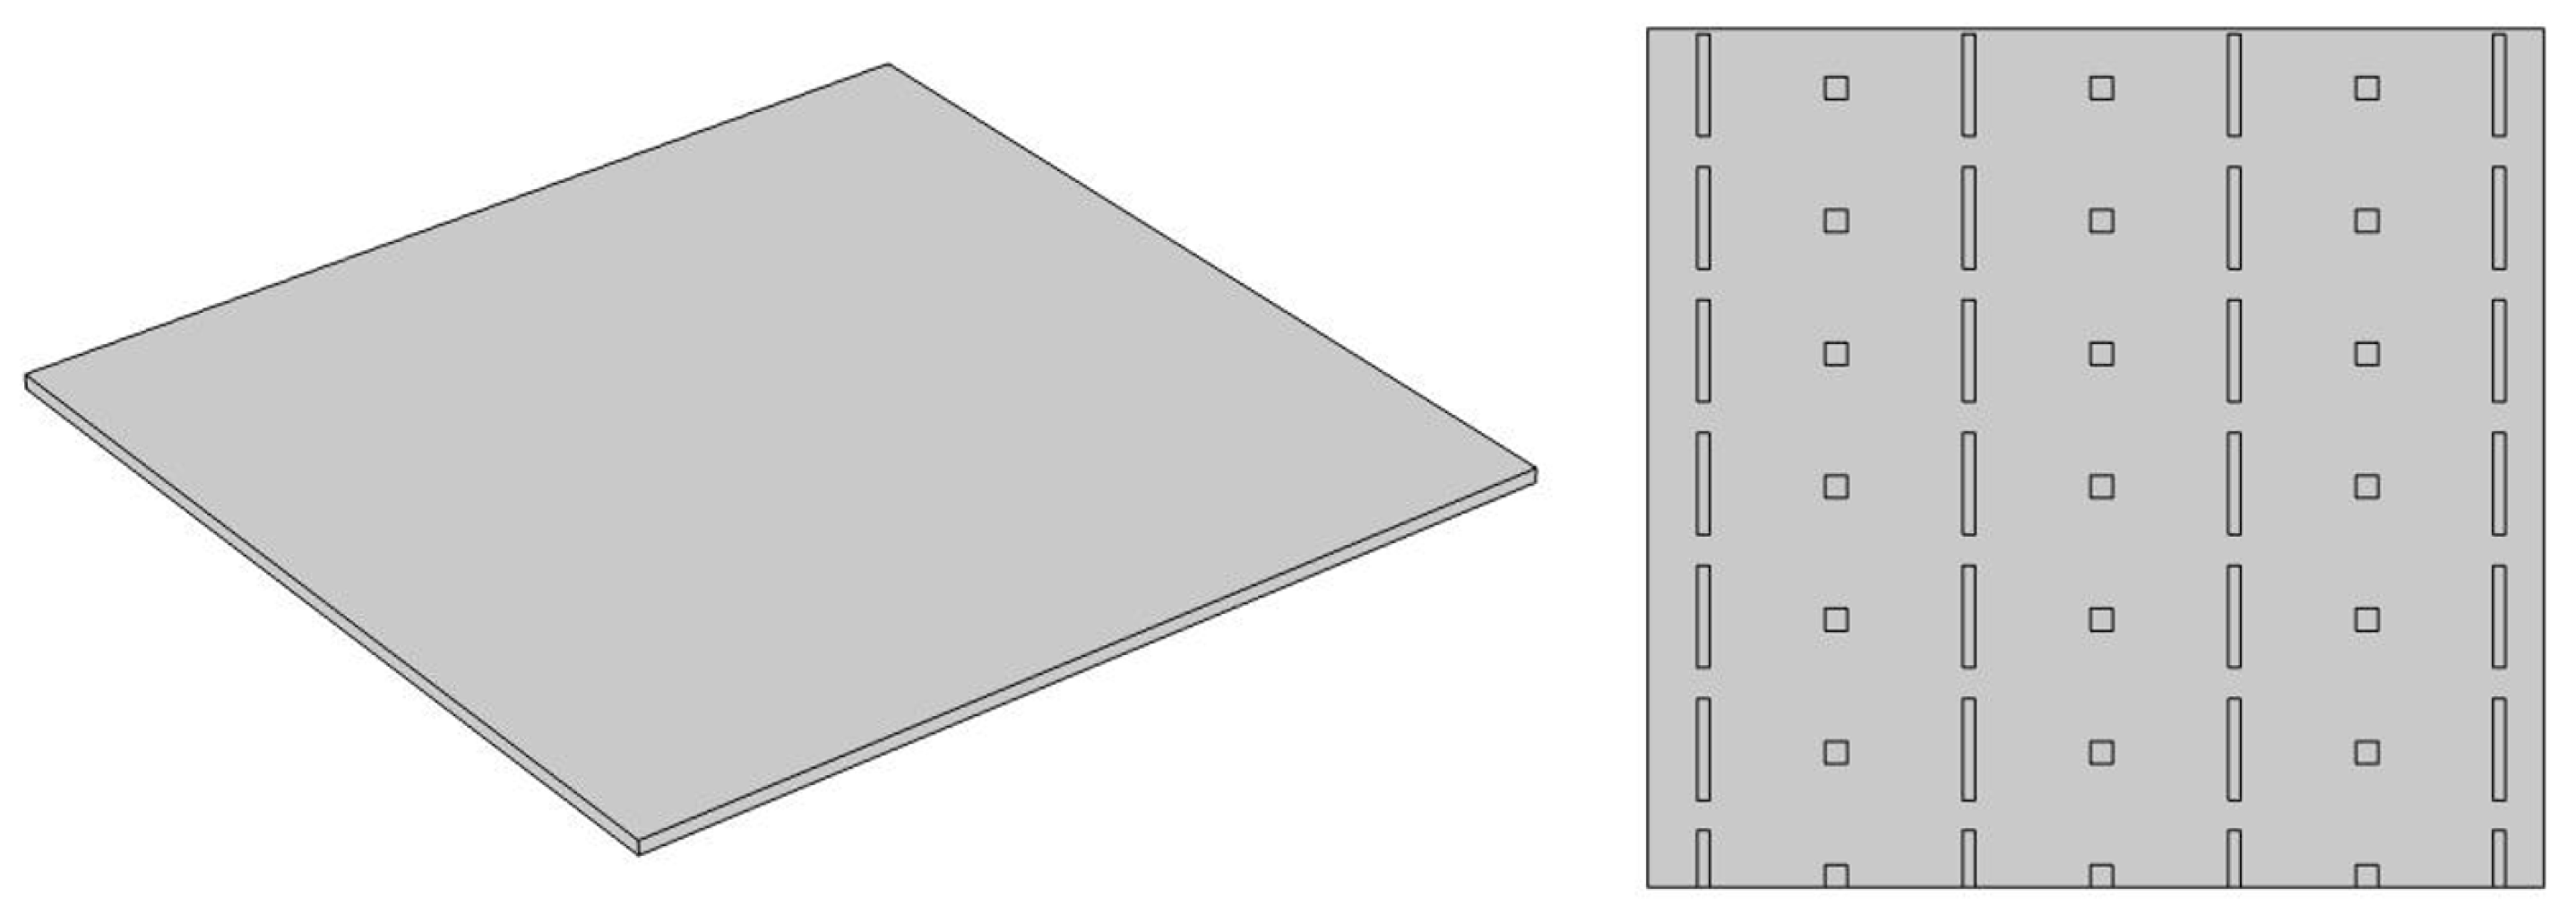
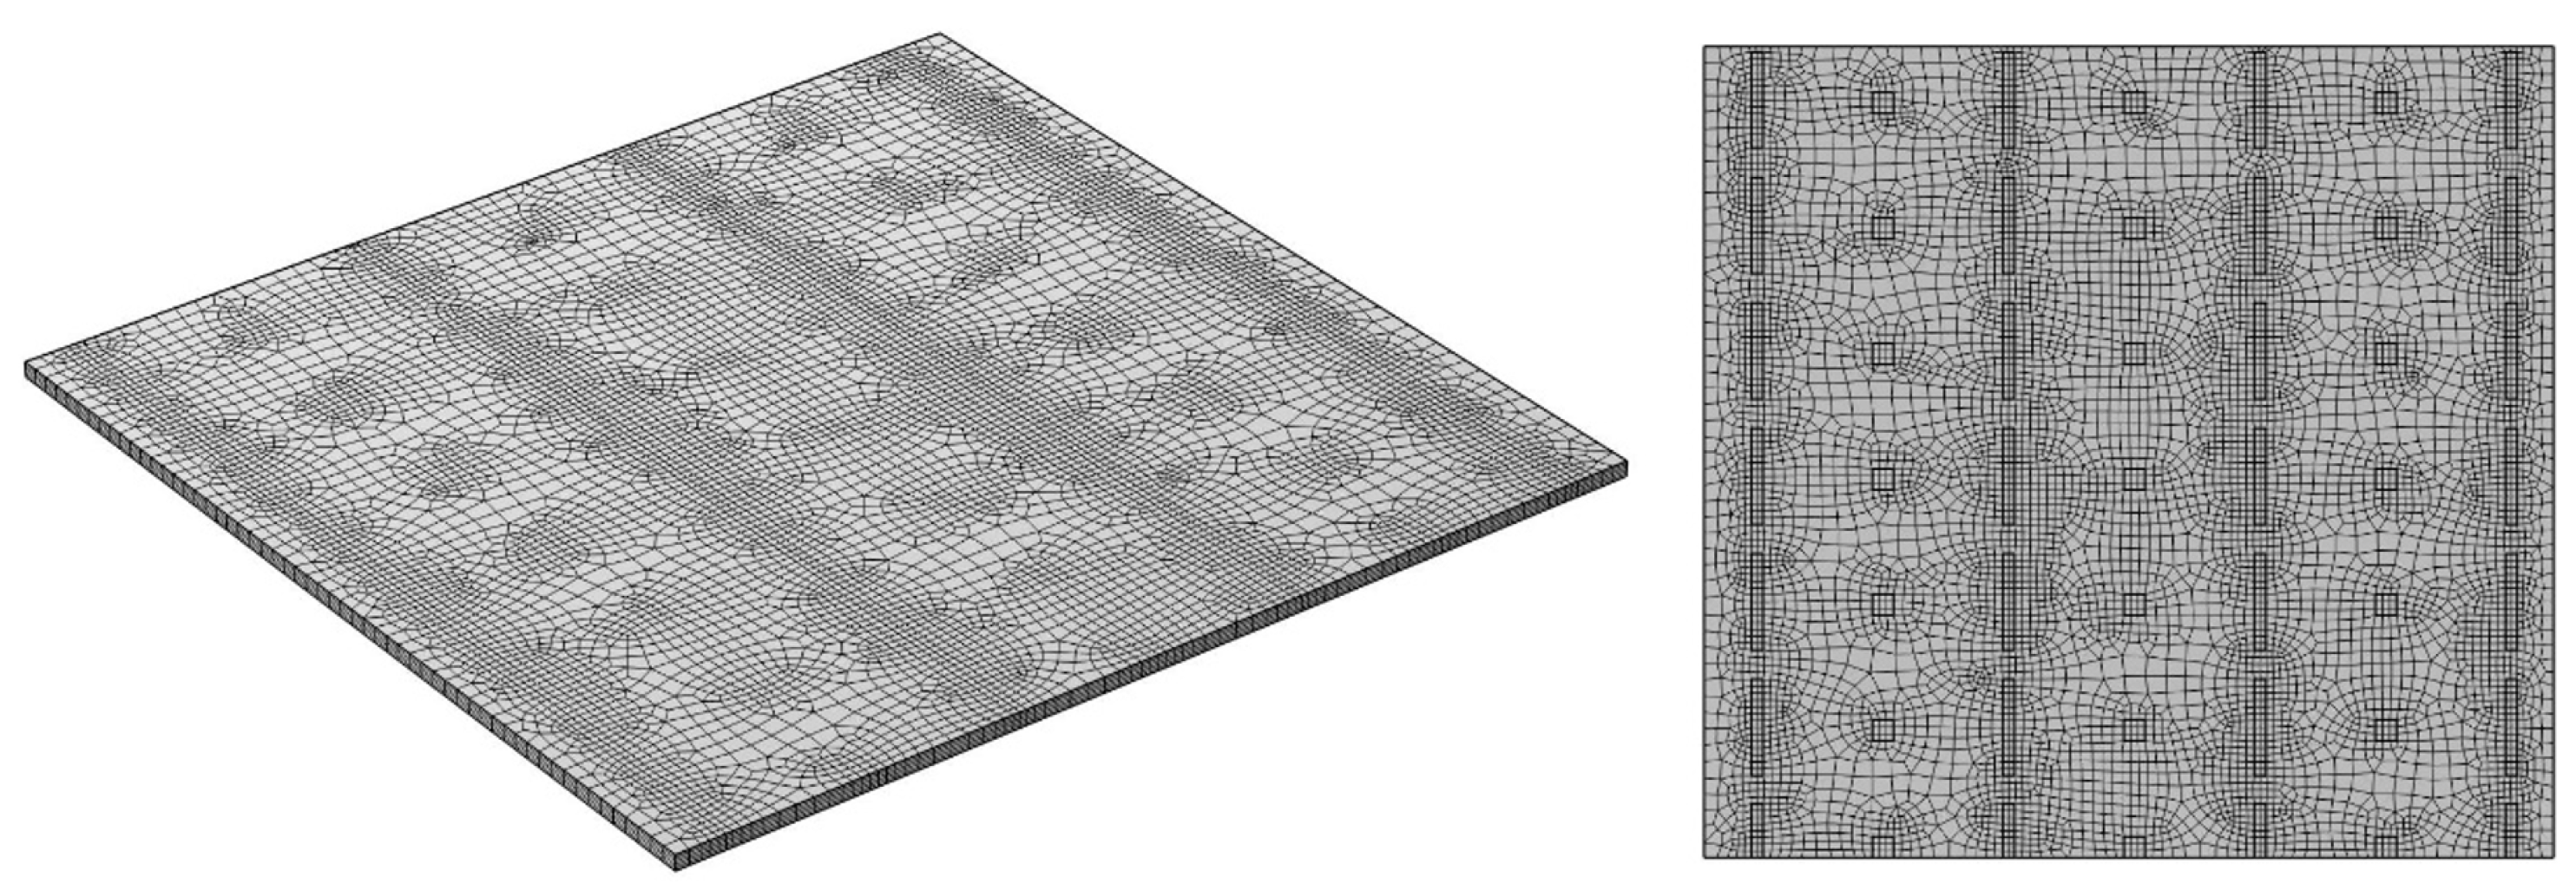
4.1.1. Geometric Model

The dimensions of the slab are 36 m in length, 35 m in width, and 0.55 m in height. The slab is supported at its base by walls and columns. The columns have dimensions of 0.9 m in length, 0.9 m in width, and 5 m in height. The walls are 4.1 m in length, 0.5 m in width, and 5 m in height. The support is provided at the bottom by walls and columns, as illustrated in Figure 5.
The mesh is depicted in Figure 6 and is divided into five layers in the thickness direction.

4.1.2. Constitutive Model

Concrete is a commonly used construction material, and its constitutive model is used to describe the deformation and stress response of concrete under stress. Commonly used constitutive models include elastic models, plastic models, and combinations of constitutive models. In this case, we chose to use the elastic principal model because we only needed to be informed of the stress situation, and there was no plastic damage stage involved.
The intrinsic model equation is the generalized Hooke’s law:
σ i j = C i j k l ε k l ,
where σ i j represents the engineering stress, ε k l represents the engineering strain, and C i j k l denotes the elastic tensor.

4.1.3. Boundary Conditions

According to the size of the bottom wall column of the actual project, see Table 1 in Section 2.3, which displays a length of 0.9 m, width of 0.9 m, and height of 5 m columns to take the xy-direction spring coefficient of 4.24 × 10⁷ N/m. The z-direction spring coefficient, according to the ground investigation report, uses the shear modulus method to determine the 109 N/m.
The drying shrinkage and thermal expansion of hydration of concrete at early ages are considered simultaneously in practical engineering. The drying shrinkage model is based on the European specification for early age concrete shrinkage modeling (Eurocode 2: Design of concrete structures—Part 1-1: General rules and rules for buildings) [23].
For the thermal boundary conditions, the temperature data were analyzed and fit by defining the heat source and heat flux boundary conditions.
The change in the temperature of the concrete with age can be expressed by the following equation:
T t = T m ( 1 e m t ) ,
where T m represents the maximum adiabatic temperature increase of the concrete, and m is an empirical constant related to the cementitious material, which takes a value of 1 in this paper.
To obtain the rate of heat release, we differentiated T t with respect to t:
d T t d t = T m × m × e m t ,
Therefore, the rate of heat release during concrete hydration is
( c × d × T m × m × e m t 86400 ) W / m 3 ,
where c represents the specific heat capacity; d represents the density; Tm denotes the maximum adiabatic temperature increase; m is an empirical parameter; t signifies days; and only numerical values are enclosed in parentheses.

4.1.4. Material Parameters

The material physical parameters used in the simulation of this section are shown in Table 4.

4.1.5. Model Parameters

There was no temperature sensor set in the floor slab. However, in the solid waste treatment pool casting set up, temperature measurement points were included. Because the solid waste treatment pool and the floor slab concrete ratio are the same, the temperature monitoring information of the solid waste treatment pool was used to obtain the corresponding model parameters. The final results are shown in Table 5.
t represents time, measured in days. The initial temperature for calculations is 20 °C.

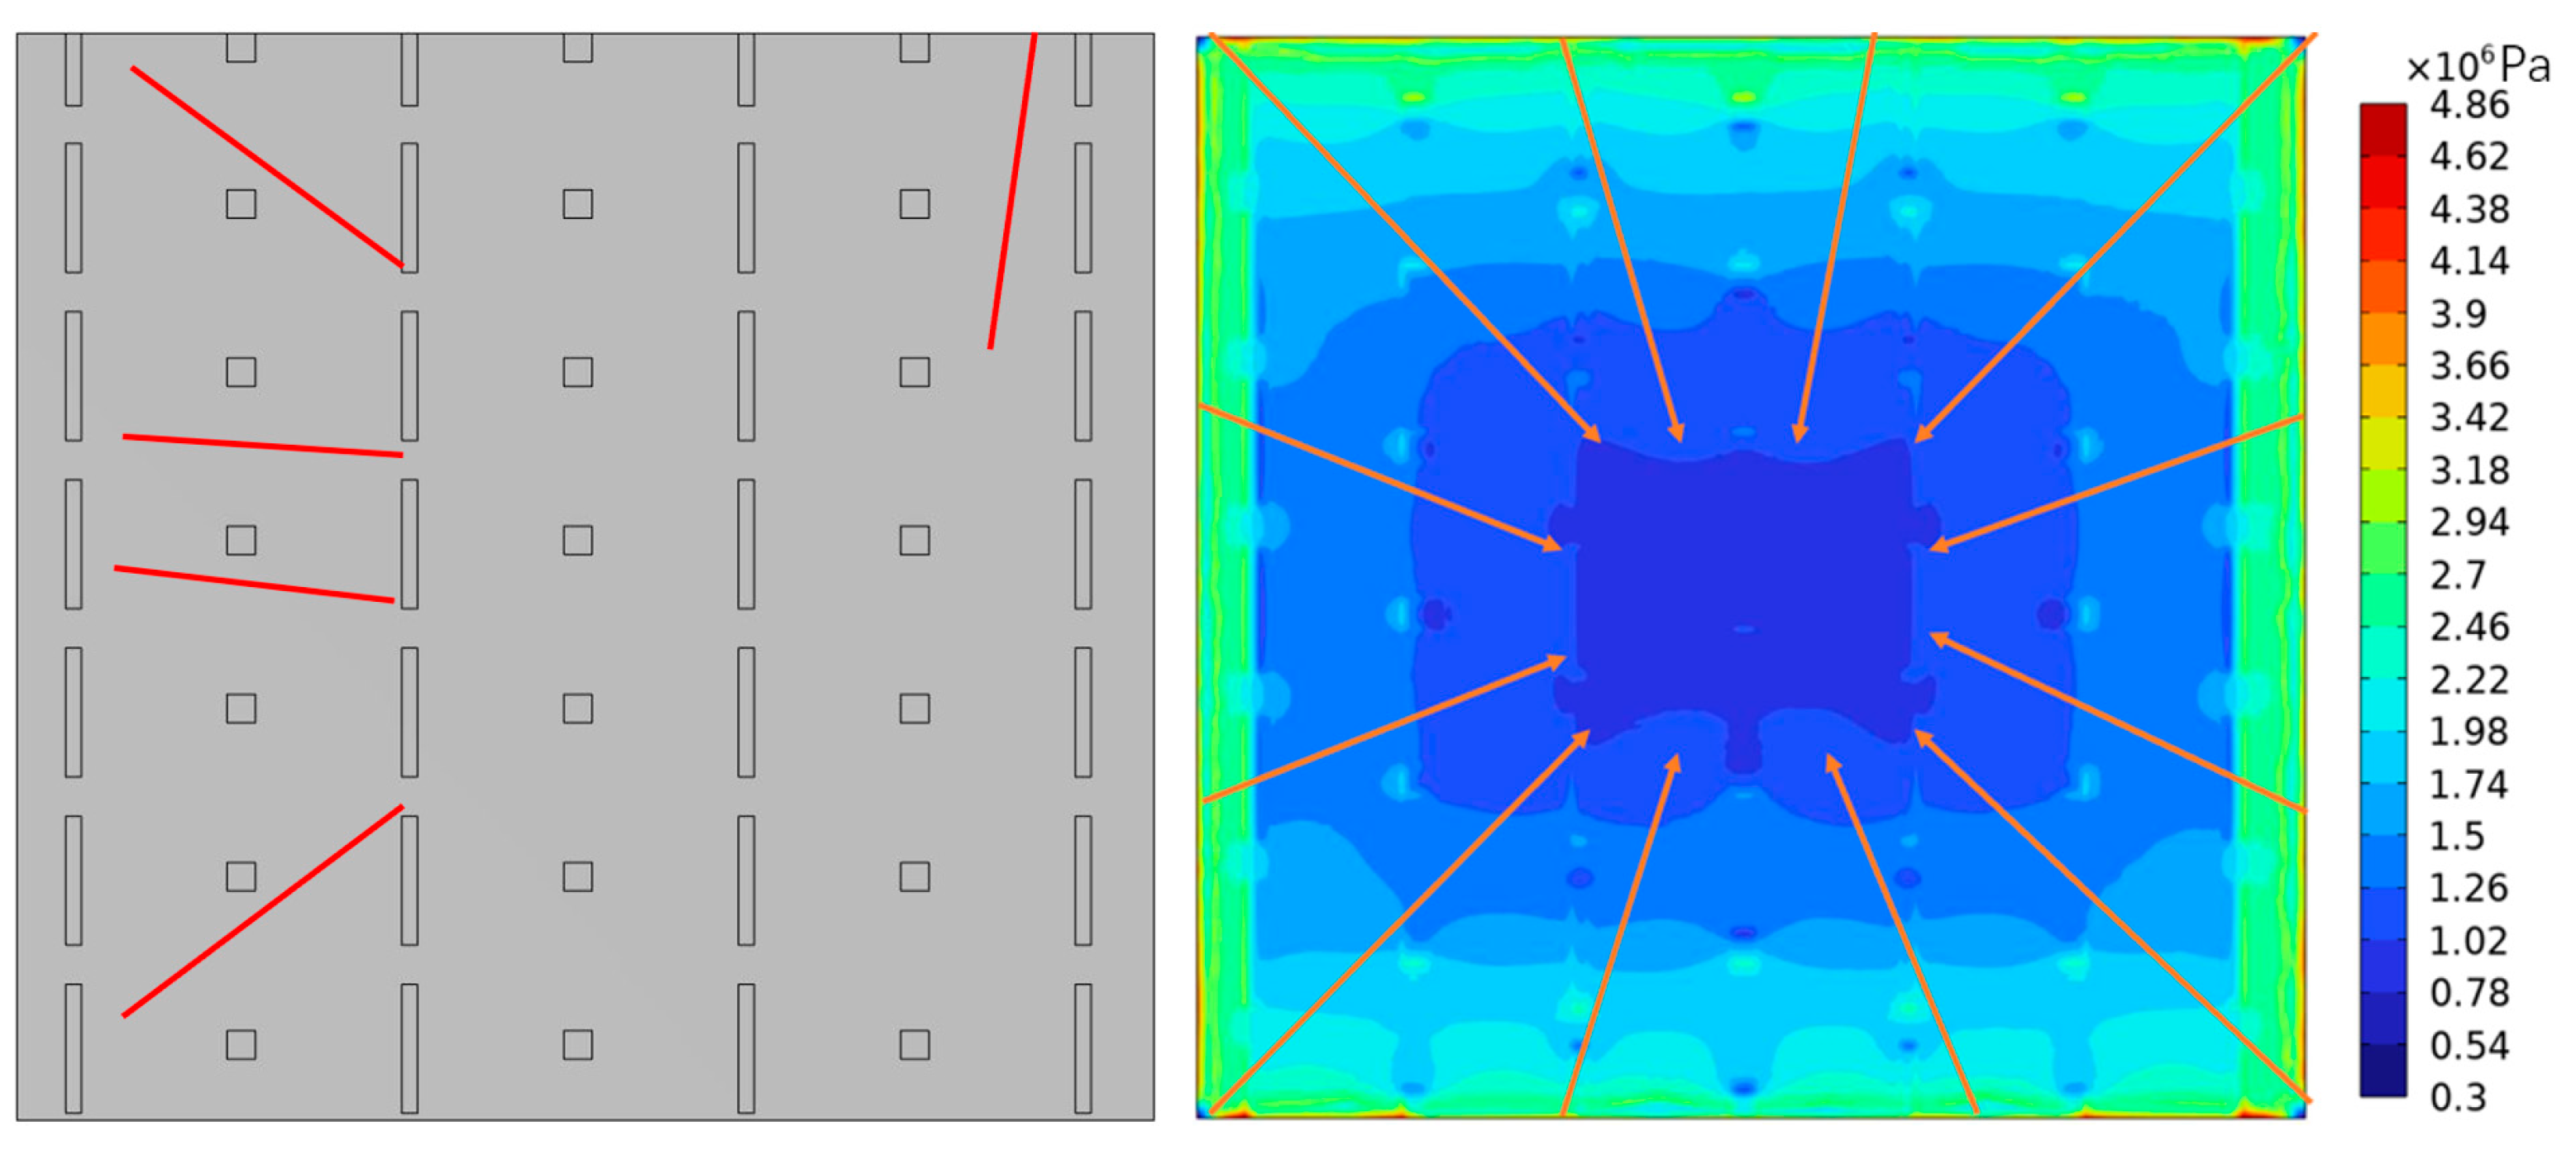
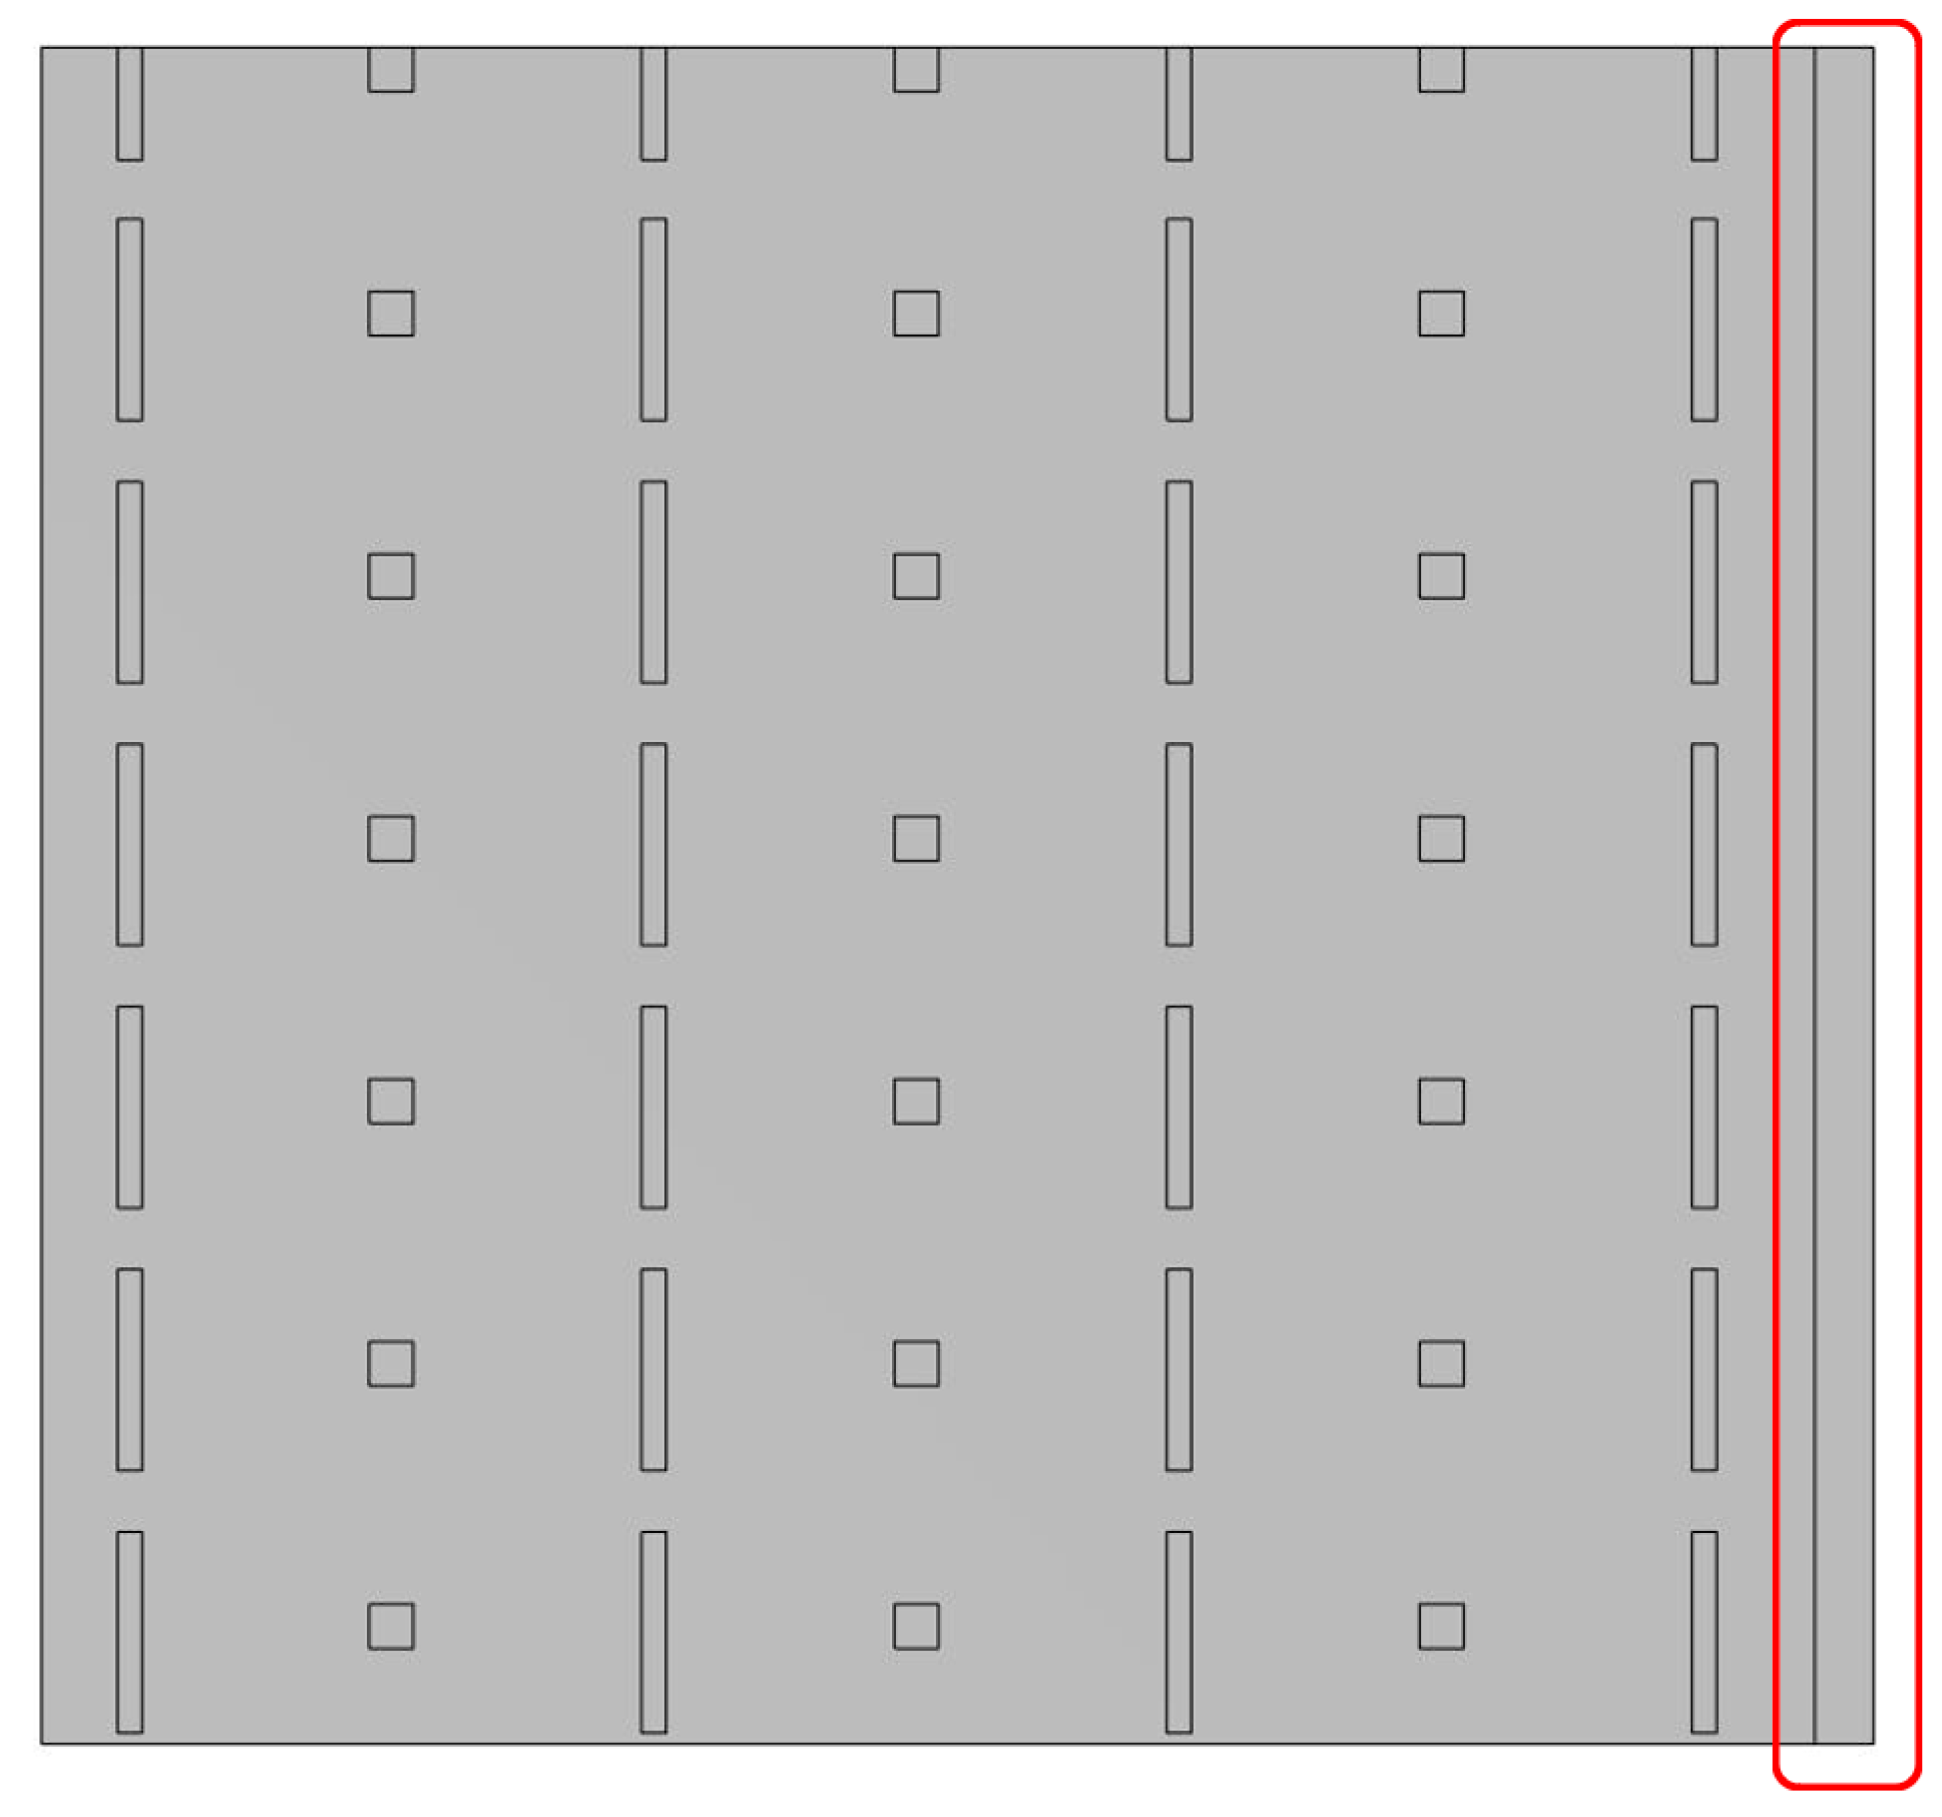
4.2. Early-Age Stress Conditions of the Floor Slab Divided by Post-Poured Strips

The bottom slab was constructed with no restraint on all sides during the construction of the backing zone, and restraint of the columns and walls existed only at the bottom. These boundary conditions are based on observations of actual constraints and were also applied in the finite element model.
Normally, the crack development direction is the gradient direction of principal stress reduction. To verify the validity of the calculation results, we compared the crack location and direction at the bottom of the bottom plate constructed by the post-poured strips method in the field and the simulated stress situation in this paper, as shown in Figure 7. The specific cracking conditions on site are shown in Figure 8.
The calculation results reveal that when post-poured strips were employed in this project’s base slab construction, the early-age stress distribution exhibited a radial pattern—lowest at the center and highest at the edges—with maximum principal stress reaching nearly 5 MPa. Such high stress levels would likely cause slab cracking, which was indeed confirmed by field observations as cracking occurred in slabs constructed using the post-poured strip method.
A comparison between actual crack patterns and simulated stress distributions shows that both the locations and orientations of cracks at the slab bottom closely align with the directions of stress reduction in the computational results. This correlation confirms the agreement between the calculations and actual conditions (in engineering practice, crack propagation typically follows the direction of stress reduction).

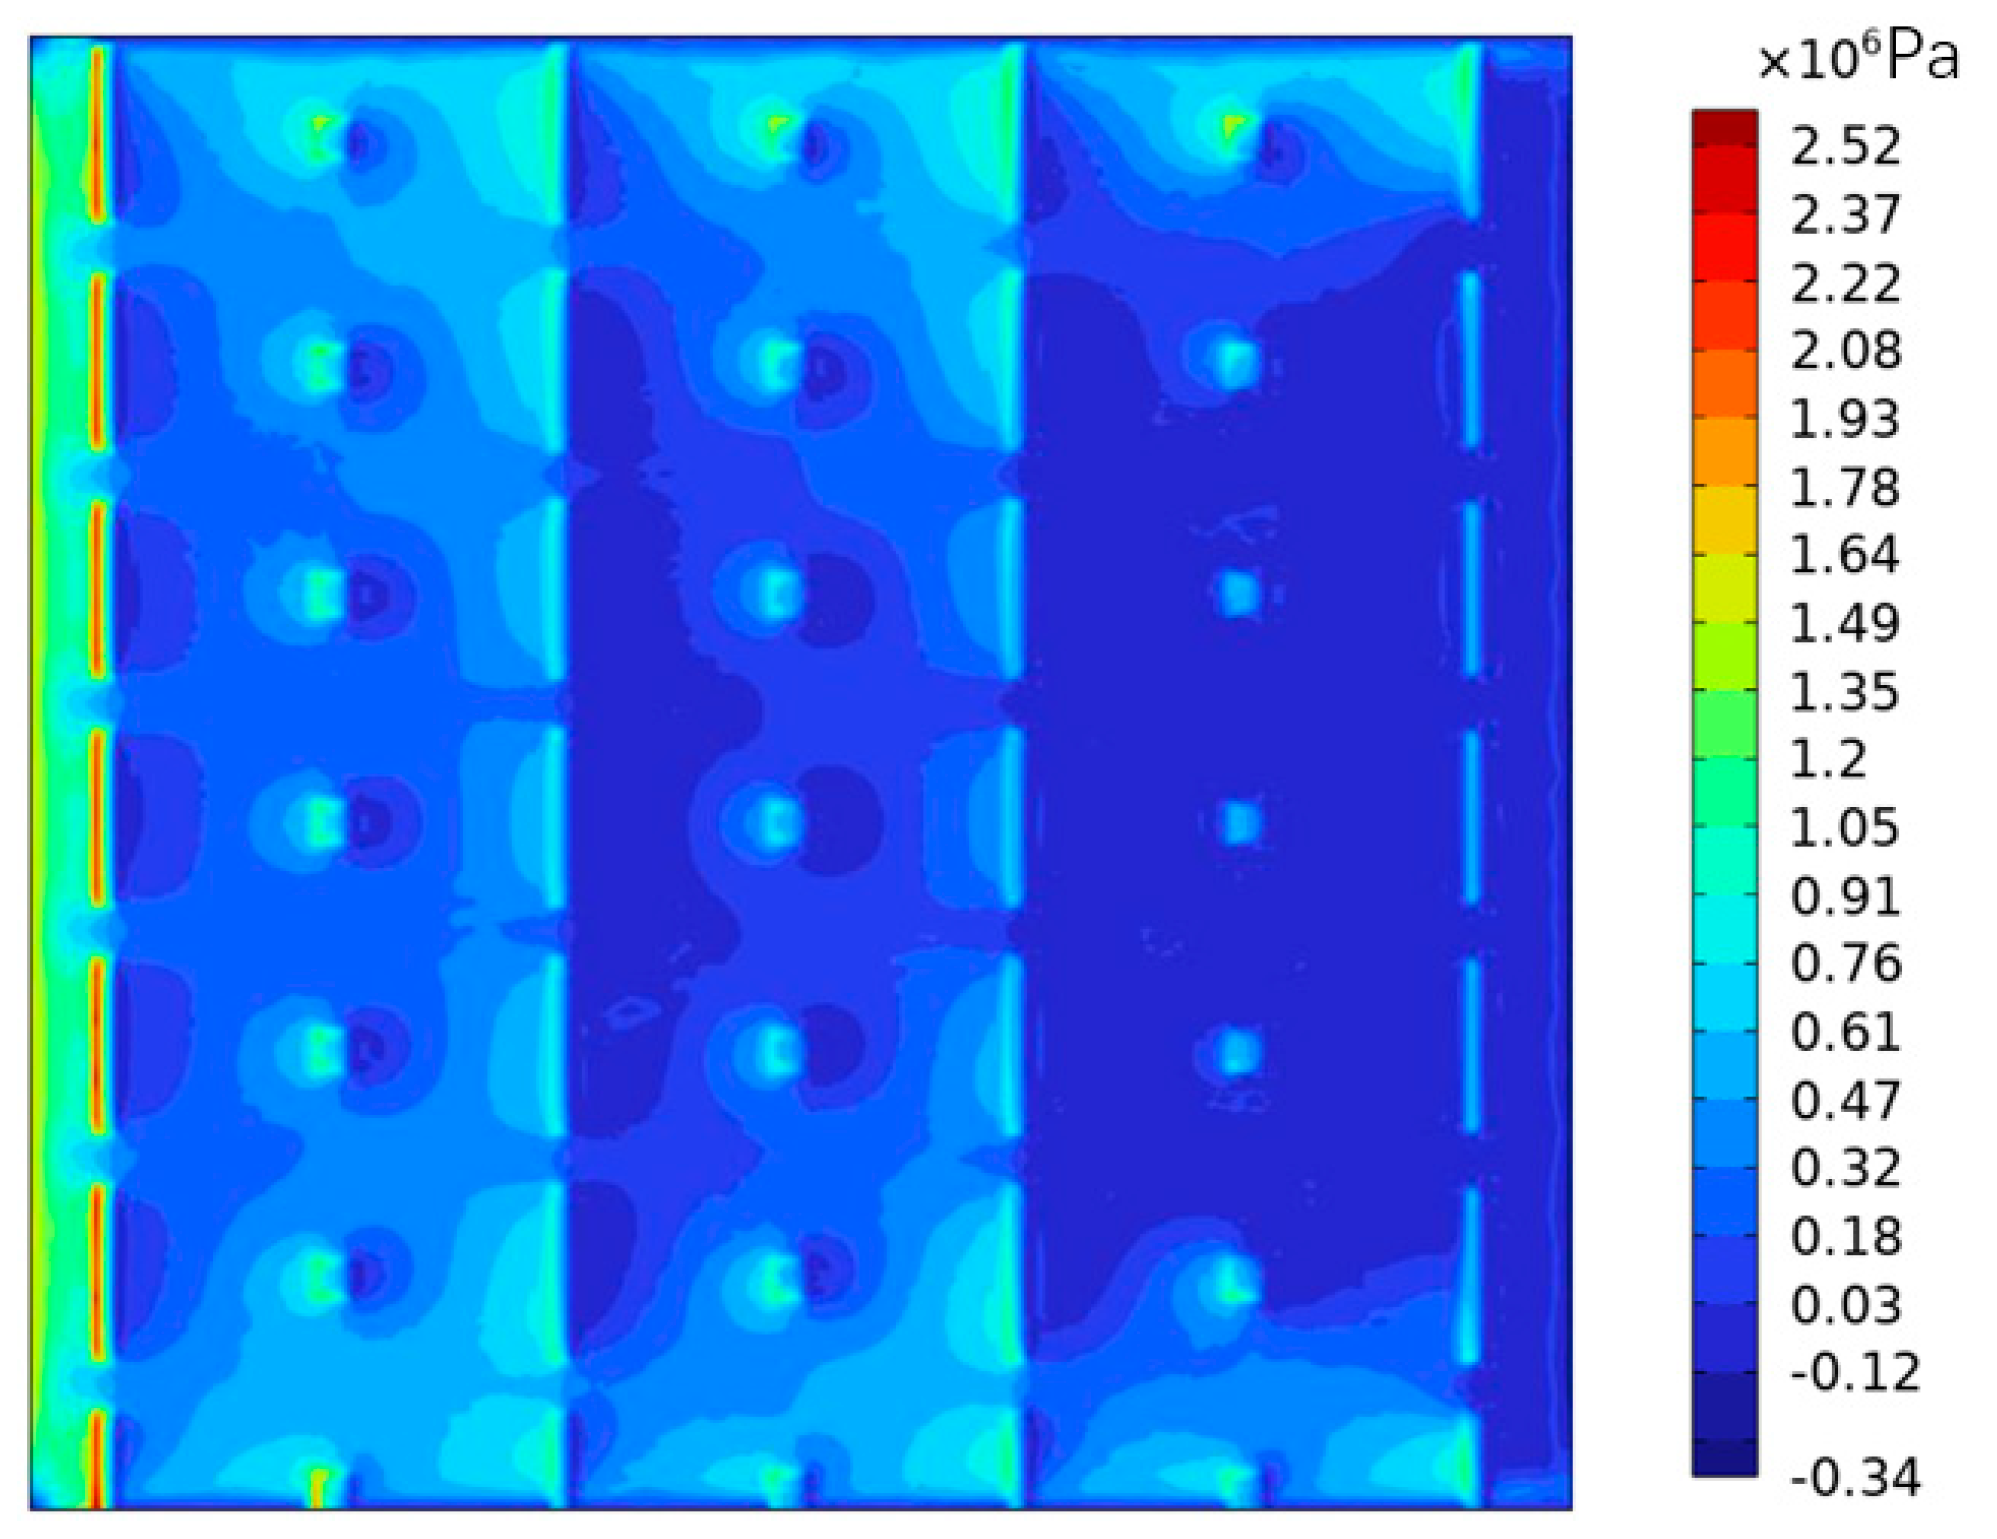
4.3. Early-Age Stress Conditions of the Floor Slab Divided by Reinforcement Strips

The construction method of the reinforcement strip involves first pouring concrete with higher strength than the base slab at the reinforcement strip location. After the reinforcement strip concrete achieves initial setting, the entire base slab is then poured. As shown in Figure 9, the red frame indicates the reinforcement strip. At this stage, one side of the base slab is subjected to the restraining effect from the reinforcement strip. The construction approach for reinforcement strips differs significantly from that of post-poured strips, which consequently leads to variations in base-slab stress distribution between the reinforcement strip solution and the post-poured strip solution.
The stress distribution of the base slab corresponding to the construction method using reinforcement strips is shown in Figure 10.
The calculation results indicate that when the reinforcement strip method was employed in this project’s base slab construction, the lowest stresses occurred in sections connected to the reinforcement strip, while the highest stresses were observed in areas farther away from it. The maximum principal stress reached approximately 2.5 MPa, which is below the concrete’s tensile strength, thereby preventing slab cracking. This outcome was confirmed by field observations, as no cracking occurred in slabs constructed using the reinforcement band method.
Stress analysis further demonstrated that the stresses at the bottom of the slab constructed with reinforcement bands were significantly lower than those in the slabs built using the post-poured strip method. Specifically, the maximum stress in the reinforcement band approach was only 50% of that observed in the post-pouring strip method.

5. Conclusions and Discussion

5.1. Conclusions

This study comprehensively demonstrates the feasibility and practical value of employing spring foundations to simulate complex constraint conditions in bottom slab design, offering an accurate and efficient numerical approach. A systematic method for determining spring constants has been established, providing engineers with a reliable tool for constraint assessment. Furthermore, the research validates reinforcement strips as a viable alternative to post-poured strips, ensuring structural integrity while optimizing construction timelines. The main conclusions are as follows:
  • Feasibility of spring foundation simulation for complex constraints: This study validates the use of spring foundations to simulate the behavior of the bottom slab under complex constraint conditions. The spring foundation proves to be an effective means of simulating boundary constraints and stress situations, providing accurate numerical simulation for the behavior of the bottom slab under complex constraint conditions;
  • Establishment of the spring foundation constraint values method: We have successfully developed a method for determining the spring constant that can be utilized for engineering estimation. This method offers a convenient and viable solution for simulating constraints, providing designers and practitioners with a straightforward approach for accurate constraint assessments in bottom slab design;
  • Validation of the feasibility of reinforcement strips as an alternative to post-poured strips: Through the calculations presented in this paper, the use of reinforcement strips as an alternative to post-poured strips proves to be notably feasible in practical engineering scenarios, especially under the complex constraints of intricate column networks and walls. The calculation results conclusively demonstrate that compared to the post-poured strip method, the reinforcement strip approach can reduce the maximum stress value in complexly constrained base slabs by approximately 50%. This solution not only ensures the structural integrity and stability of the base slab, but also effectively shortens the construction period;
  • Engineering guidance and widespread application: This conclusion offers reliable guidance for engineering practices and suggests a viable alternative for similar projects. This achievement holds promise for widespread application in practical engineering, enhancing project efficiency, reducing costs, and ensuring the stability and reliability of structures.

5.2. Discussion

While the spring foundation model offers advantages in computational simplicity and efficiency for simulating complex constraint conditions, it still exhibits several critical limitations. These include the oversimplified assumptions of spring stiffness that fail to accurately capture nonlinear constraint behaviors, insufficient consideration of stiffness degradation under dynamic and long-term loading, limited capability in modeling multiphysics coupling (e.g., fluid-structure interaction, thermal stresses), and poor adaptability to non-uniform constraints or large-deformation scenarios. These shortcomings compromise the model’s accuracy and reliability in complex engineering applications, necessitating theoretical advancements and interdisciplinary integration for improvement.
Future research should prioritize high-precision modeling and practical engineering applications. Key directions include developing nonlinear spring models to simulate soil plasticity, integrating data-driven approaches for parameter optimization, incorporating multiphysics coupling techniques (e.g., fluid-structure interaction, discrete element methods) to enhance simulation capabilities in complex environments, and formulating time-varying stiffness models to account for long-term loading effects. Additionally, intelligent optimization technologies (e.g., digital twins, machine learning) and experimental validation (e.g., centrifuge tests, field monitoring) will facilitate the standardization and broader engineering adoption of spring models. These advancements will enable more efficient and precise simulations of complex constraints, particularly in seismic analysis and non-uniform foundation treatments, ultimately improving structural design and performance.

Author Contributions

Conceptualization, W.L.; Methodology, W.L. and W.J.; Validation, Z.L. and H.Z.; Writing—original draft, W.L.; Writing—review & editing, C.F. All authors have read and agreed to the published version of the manuscript.

Funding

This research was funded by Natural Science Foundation of China grant number 52178240.

Data Availability Statement

The original contributions presented in the study are included in the article, further inquiries can be directed to the corresponding author.

Conflicts of Interest

Authors Zhiyi Li and Hao Zhang were employed by the company Shanghai Urban Construction Municipal Engineering (Group) Co., Ltd. The remaining authors declare that the research was conducted in the absence of any commercial or financial relationships that could be construed as a potential conflict of interest.

References

  1. Ouyang, J.; Chen, X.; Huangfu, Z.; Lu, C.; Huang, D.; Li, Y. Application of distributed temperature sensing for cracking control of mass concrete. Constr. Build. Mater. 2019, 197, 778–791. [Google Scholar] [CrossRef]
  2. Lee, C. Assessment of radiological safety of Wolsung site at site boundary considering crack impact. Prog. Nucl. Energ. 2010, 52, 374–378. [Google Scholar] [CrossRef]
  3. Trávníček, P.; Junga, P.; Kudělka, J.; Kotek, L. Prevention of an atmospheric storage tank bund failure. J. Loss Prevent. Proc. 2021, 70, 104438. [Google Scholar] [CrossRef]
  4. Jiang, W.; Liu, X.; Yuan, Y.; Wang, S.; Su, Q.; Taerwe, L. Towards early-age performance control in precast concrete immersed tunnels. Struct. Concr. 2015, 16, 558–571. [Google Scholar] [CrossRef]
  5. Singh, M.P.; Sen, S.; Pathak, H.; Dogra, A.B. Early age cracking relevant to mass concrete dam structures during the construction schedule. Constr. Build. Mater. 2024, 411, 134739. [Google Scholar] [CrossRef]
  6. Deng, G.; Li, W.; He, Y.; Zhang, K.; Wang, X.; Cui, J.; Li, M.; Zhang, M. Long term properties of Nano-engineered temperature self-controlled concrete served for mass concrete structure. Constr. Build. Mater. 2024, 452, 139034. [Google Scholar] [CrossRef]
  7. Sun, S.; Zhang, Y.; Lv, Y.; Xu, X.; Wang, Z.; Liu, Z. Research on Temperature Control of Mass Concrete for Multi-Tower Cable-Stayed Bridge Cap during Construction. Buildings 2024, 14, 3112. [Google Scholar] [CrossRef]
  8. Khan, I.; Yong, G. Role of supplementary cementiteous materials in mitigating heat of hydration in mass concrete elements. Constr. Build. Mater. 2024, 431, 136482. [Google Scholar] [CrossRef]
  9. Lyu, C.; Xu, M.; Lu, X.; Tian, B.; Chen, B.; Xiong, B.; Cheng, B. Research on thermal- humidity -force coupling characteristics of mass concrete structures under temperature control. Constr. Build. Mater. 2023, 398, 132540. [Google Scholar] [CrossRef]
  10. Yang, K.; Zhang, W.; Chen, R.; Duan, M.; Shangguan, H. Simulation Analysis of Temperature Field and Stress Field of Mass Concrete Under Different Construction Temperatures. Buildings 2025, 15, 370. [Google Scholar] [CrossRef]
  11. Zhang, G.; Li, G. Effects of mineral admixtures and additional gypsum on the expansion performance of sulphoaluminate expansive agent at simulation of mass concrete environment. Constr. Build. Mater. 2016, 113, 970–978. [Google Scholar] [CrossRef]
  12. Raoufi, K. Restrained Shrinkage Cracking of Concrete: The Influence of Damage Localization. Ph.D. Thesis, Purdue University, West Lafayette, IN, USA, 2011. [Google Scholar]
  13. Boggs, H.L.; Bonikowsky, D.A.; Bradshaw, R.A., Jr.; Cannon, R.W.; Chraibi, A.F.; Cope, J.L.; Diaz, L.H.; Dolen, T.P.; Hammons, M.I.; Hansen, K.D.; et al. Effect of restraint, volume change, and reinforcement on cracking of mass concrete. Aci Man. Concr. Pract. 2002, 87, 271–295. [Google Scholar]
  14. Yoo, D.; Min, K.; Lee, J.; Yoon, Y.-S. Shrinkage and cracking of restrained ultra-high-performance fiber-reinforced concrete slabs at early age. Constr. Build. Mater. 2014, 73, 357–365. [Google Scholar] [CrossRef]
  15. Kheder, G.F. A mathematical model for the prediction of volume change cracking in end-restrained concrete members. Mater. Struct. 1997, 30, 174–181. [Google Scholar] [CrossRef]
  16. Kianoush, M.R.; Acarcan, M.; Ziari, A. Behavior of base restrained reinforced concrete walls under volumetric change. Eng. Struct. 2008, 30, 1526–1534. [Google Scholar] [CrossRef]
  17. Saeed, M.K.; Rahman, M.; Alfawzan, M.; Basha, S.; Dahish, H.A. Recycling of date kernel powder (DKP) in mass concrete for mitigating heat generation and risk of cracking at an early age. Constr. Build. Mater. 2023, 376, 131033. [Google Scholar] [CrossRef]
  18. Orozco, C.; Babel, S.; Tangtermsirikul, S.; Sugiyama, T. Comparison of environmental impacts of fly ash and slag as cement replacement materials for mass concrete and the impact of transportation. Sustain. Mater. Technol. 2023, 39, e00796. [Google Scholar] [CrossRef]
  19. Zhu, J.; Wang, Z. Experimental modeling and quantitative evaluation of mitigating cracks in early-age mass concrete by regulating heat transfer. J. Build. Eng. 2024, 96, 110641. [Google Scholar] [CrossRef]
  20. GBJ10-89; Code for Design of Concrete Structures. Inspection and Quarantine of the People’s Republic of China: Beijing, China, 1989.
  21. Wu, J.; Pu, L.; Zhai, C. A Review of Static and Dynamic p-y Curve Models for Pile Foundations. Buildings 2024, 14, 1507. [Google Scholar] [CrossRef]
  22. Zhao, W.; Yang, Q.; Liu, J.; Wu, W. Influence analysis of the selection of foundation model on fatigue stress evaluation results of cement concrete pavement-based on GPR and FWD. Constr. Build. Mater. 2022, 347, 128586. [Google Scholar] [CrossRef]
  23. EN 1992-1-1; Eurocode 2: Design of Concrete Structures-Part 1–1: General Rules and Rules for Buildings. British Standard Institution: London, UK, 2005; Volume 668, pp. 659–668.
Figure 1. Schematic diagram of the complex column network and wall.
Buildings 15 01647 g001
Figure 2. Schematic diagram of columns and walls at the bottom of the base plate (left: top view, right: elevation view).
Buildings 15 01647 g002
Figure 3. Floor model (left), schematic diagram of bottom constraint locations (right).
Buildings 15 01647 g003
Figure 4. Engineering rendering and construction site image. (The red lines are used to demarcate different casting areas. 1# refers to Casting Area No.1, and so on).
Buildings 15 01647 g004
Figure 5. Geometric model of the floor slab.
Buildings 15 01647 g005
Figure 6. Floor slab mesh division.
Buildings 15 01647 g006
Figure 7. On-site crack locations (left), stress contour calculation results, and their gradient directions (right). (In the left figure, the red lines represent the actual locations of the cracks; in the right figure, the arrows indicate the direction of stress reduction.)
Buildings 15 01647 g007
Figure 8. On-site localized cracking.
Buildings 15 01647 g008
Figure 9. Schematic location of the reinforcement zone. (The red frame indicates the reinforcement strip.)
Buildings 15 01647 g009
Figure 10. Contour of the stress calculation for the floor slab using reinforcement strips.
Buildings 15 01647 g010
Table 1. Spring constants that correspond to columns of different dimensions and heights (Unit: N/m).
Column Side Length/Height3 m3.5 m4 m4.5 m5 m5.5 m6 m
500 mm × 500 mm6.13 × 1073.95 × 1072.7 × 1071.95 × 1071.46 × 1071.12 × 1078.9 × 106
700 mm × 700 mm1.15 × 1087.39 × 1075.04 × 1073.59 × 1072.66 × 1072.04 × 1071.59 × 107
900 mm × 900 mm1.81 × 1081.16 × 1087.92 × 1075.75 × 1074.24 × 1073.23 × 1072.45 × 107
1100 mm × 1100 mm2.66 × 1081.72 × 1081.17 × 1088.38 × 1076.18 × 1074.74 × 1073.66 × 107
1300 mm × 1300 mm3.59 × 1082.34 × 1081.60 × 1081.14 × 1088.47 × 1076.44 × 1075.01 × 107
1500 mm × 1500 mm4.53 × 1082.97 × 1082.08 × 1081.47 × 1081.09 × 1088.41 × 1076.45 × 107
Table 2. Influence of different spring constants on the stress magnitude of the floor slab during contraction.
Z-Axis Spring
Constant
XY-Axis Spring
Constant
Center of the Top
Surface
Center of the Bottom
Surface
Maximum Stress Value
109 N/m32.70 × 106 N/m35.2 kPa6.3 kPa25 kPa
2.70 × 10⁷ N/m352 kPa63 kPa258 kPa
2.70 × 10⁸ N/m3511 kPa617 kPa2.52 MPa
2.70 × 10⁹ N/m34.15 MPa5.09 MPa20.4 MPa
2.70 × 10¹⁰ N/m314.4 MPa19.1 MPa71.1 MPa
Fixed Constraint21.4 MPa28.3 MPa142 MPa
108 N/m32.70 × 106 N/m30.29 Pa12.9 kPa28 kPa
2.70 × 10⁷ N/m32.98 Pa128 kPa283 kPa
2.70 × 10⁸ N/m328 Pa1.24 MPa2.736 MPa
2.70 × 10⁹ N/m3209 Pa9.11 MPa19.9 MPa
2.70 × 10¹⁰ N/m3534 Pa24.7 MPa53.7 MPa
Fixed Constraint583 Pa30.2 MPa90.4 MPa
107 N/m32.70 × 106 N/m30.47 Pa21 kPa30.5 kPa
2.70 × 10⁷ N/m34.75 Pa210 kPa304 kPa
2.70 × 10⁸ N/m344 Pa1.99 MPa2.88 MPa
2.70 × 10⁹ N/m358 Pa11.7 MPa14.4 MPa
2.70 × 10¹⁰ N/m3107 Pa28.2 MPa42.1 MPa
Fixed Constraint159 Pa31 MPa73 MPa
Table 3. The influence of different spring constants on the stress magnitude of the floor slab during expansion.
Z-Axis Spring
Constant
XY-Axis Spring
Constant
Center of the Top
Surface
Center of the Bottom
Surface
Maximum Stress Value
109 N/m32.70 × 106 N/m3−0.16 Pa−0.96 Pa12.4 kPa
2.70 × 10⁷ N/m3−1.61 Pa−9.59 Pa124 kPa
2.70 × 10⁸ N/m3−15.9 Pa−93 Pa1.21 MPa
2.70 × 10⁹ N/m3−141 Pa−776 Pa9.7 MPa
2.70 × 10¹⁰ N/m3−718 Pa−2827 Pa32.5 MPa
Fixed Constraint−1426 Pa−2924 Pa123 MPa
108 N/m32.70 × 106 N/m31.3 kPa−0.87 Pa13.1 kPa
2.70 × 10⁷ N/m313.4 kPa−8.79 Pa130 kPa
2.70 × 10⁸ N/m3129 kPa−84 Pa1.25 MPa
2.70 × 10⁹ N/m3949 kPa−606 Pa9.23 MPa
2.70 × 10¹⁰ N/m32.46 MPa−1475 Pa26.4 MPa
Fixed Constraint2.64 MPa−1059 Pa100 MPa
107 N/m32.70 × 106 N/m39.5 kPa−0.8 Pa13 kPa
2.70 × 10⁷ N/m395 kPa−7.99 Pa13.3 kPa
2.70 × 10⁸ N/m3903 kPa−75 Pa1.26 MPa
2.70 × 10⁹ N/m35.9 MPa−451 Pa8.5 MPa
2.70 × 10¹⁰ N/m312.7 MPa−582 Pa22.4 MPa
Fixed Constraint13.8 MPa−168 Pa96.7 MPa
Table 4. Material parameters and their values.
Material ParametersValues
Density2400 kg/m3
Constant of Thermal Expansion10−6/K
Young’s Modulus25 GPa
Poisson’s Ratio0.20
Thermal Conductivity1.8 W/(m·K)
Specific Heat Capacity880 J/(kg·K)
Adiabatic Temperature Rise50 °C
Table 5. Model parameters and their values.
ParametersValues
Concrete Hydration Heat Release Rate 1750 e t   W / m 3
Surface Heat Exchange Constant 8   W / K m 2
Disclaimer/Publisher’s Note: The statements, opinions and data contained in all publications are solely those of the individual author(s) and contributor(s) and not of MDPI and/or the editor(s). MDPI and/or the editor(s) disclaim responsibility for any injury to people or property resulting from any ideas, methods, instructions or products referred to in the content.

