Article

Capillary Water Absorption Characteristics of Steel Fiber-Reinforced Concrete

Key Laboratory of Advanced Civil Engineering Materials, Ministry of Education, School of Materials Science and Engineering, Tongji University, Shanghai 201804, China
*
Authors to whom correspondence should be addressed.
Buildings 2025, 15(9), 1542; https://doi.org/10.3390/buildings15091542
Submission received: 10 March 2025 / Revised: 28 April 2025 / Accepted: 28 April 2025 / Published: 2 May 2025
(This article belongs to the Special Issue Trends and Prospects in Cementitious Material)

Abstract

The water absorption behavior of concrete is a critical indicator of its durability, and a comprehensive understanding of water transport characteristics can significantly enhance concrete performance. This study investigates the capillary water absorption properties of steel fiber-reinforced concrete across various strength grades by combining mercury intrusion porosimetry (MIP) and 1H low-field nuclear magnetic resonance (1H low-field NMR) techniques. Key findings reveal that the capillary water absorption of steel fiber-reinforced concretes occurs in the following two distinct stages: an initial rapid absorption phase (0 min to 6 h) and a subsequent slow absorption phase (1 day to 12 days). Modifications to the concrete matrix composition substantially reduce capillary water absorption rates, with ultra-high-performance concrete (UHPC) exhibiting exceptionally low absorption levels (the cumulative capillary water absorption of UHPC accounts for only 4.5–5.7% of that of C30 concrete). Additionally, for higher-strength concrete and extended absorption durations, the capillary water absorption rate deviates from the linear relationship with the square root of time. This deviation is attributed to the interaction of gel pore water with unhydrated cement particles, generating more hydration products, which refine the pore structure, reduce capillary pore connectivity, and increase pore tortuosity. Furthermore, steel fibers influence water transport through the following two primary mechanisms: interfacial interactions between the fibers and the matrix and a physical blocking effect that impedes water movement.

1. Introduction

Concrete is the most widely used civil engineering material globally, playing a vital role in a broad range of applications, including buildings, roads, high-speed railways, tunnels, bridges, water infrastructure, and nuclear power plants [1]. Despite its importance, concrete structures often face significant durability issues, leading to relatively short service lifespans, typically only a few decades. As a result, demolition and reconstruction become not only costly but also counterproductive to the goals of green, low-carbon, and sustainable development in civil engineering. The presence and movement of water are key factors contributing to the degradation of concrete durability. Water acts as a primary carrier for harmful ions, such as chloride, sulfate, and magnesium ions, which can infiltrate and damage the interior of concrete [2]. Additionally, water is a critical agent in the physical and biological deterioration of concrete structures. For instance, its presence is essential for physical damage mechanisms, like drying shrinkage cracking and freeze–thaw cycles [3]; it also facilitates biological deterioration (including microbial growth and erosion) [4,5].
In concrete, water transmission primarily occurs through the following three mechanisms: capillary water absorption, permeation, and diffusion [6]. Capillary absorption takes place when water first contacts the unsaturated surface pores, then moves inward through the surface tension of the liquid. Permeation occurs when the concrete is fully saturated with water, and the movement of water is driven by seepage pressure. Diffusion happens within the unsaturated concrete, where water molecules or ions migrate from areas of higher concentration to areas of lower concentration, depending on the gradient inside and outside the concrete. In practical engineering, concrete structures are typically in an unsaturated state, making capillary water absorption the primary mode of water transmission. A thorough understanding of capillary water absorption is critical for enhancing concrete durability and extending the service life of concrete structures.
Several studies have examined the factors influencing capillary water absorption in concrete, including damage [7], curing conditions [8,9], loading effects [10], and the use of recycled aggregates [11]. Additionally, theoretical models have been developed to describe both one-dimensional and two-dimensional capillary water absorption behavior in concrete [12]. In recent years, the advent of ultra-high-performance concrete (UHPC) has garnered widespread attention, particularly with respect to its durability [13]. Due to its exceptionally high density and extremely low permeability, the capillary water absorption rate of UHPC is theoretically expected to be lower than that of conventional concrete. However, research on the capillary water absorption behavior of UHPC remains relatively limited, with existing studies primarily focusing on the optimization of material composition. In terms of research methodologies, traditional permeability testers for concrete and mortar are unable to accurately characterize the true permeability grade of UHPC. Methods based on electrical parameters and ionic diffusion coefficients are considered effective for evaluating the permeability of concrete with a low water-to-binder ratio; however, the incorporation of steel fibers causes interference in the testing signals of these methods, rendering them incapable of accurately reflecting the water absorption performance of UHPC. Although gas permeability methods are theoretically feasible, their vacuum testing conditions are prone to environmental fluctuations, potentially impacting the reliability of the results [14]. The capillary water absorption test is considered a superior research approach, as it can more accurately and authentically reflect the water absorption behavior of UHPC. It is well-established that incorporating steel fibers into concrete can significantly enhance its mechanical properties [15,16,17]. This improvement is attributed to the ability of steel fibers to inhibit crack propagation and alter the crack growth patterns within the concrete [18] and to the uniform distribution of steel fibers within the matrix, which helps reduce microscopic defects and enhance the adhesion between the steel fibers and the matrix [19]. Given these effects, it is reasonable to expect that steel fibers may also influence the capillary water absorption behavior of concrete. However, to date, no research has been conducted to explore the relationship between the capillary water absorption performance of concrete and the presence of steel fibers. Moreover, the influence and underlying mechanisms of steel fibers on capillary water absorption in concretes remain largely unexplored.
In light of this, this paper investigates the capillary water absorption behavior of concrete with different strength grades incorporating steel fibers. It examines the influence and underlying mechanisms of the steel fiber dosage on capillary water absorption. The findings aim to provide both theoretical insights and practical guidance for reducing the water absorption behavior and enhancing the durability of steel fiber-reinforced concrete.

2. Materials and Methods

2.1. Raw Materials

The raw materials used for preparing C30, C60, and C80 concrete are as follows: Portland cement (Conch, Wuhu, China), fly ash (Mingchuan, Guiyang, China), ground granulated blast-furnace slag (GGBFS) (Baotian, Shanghai, China); natural river sand with a fineness modulus of 2.3; continuously graded crushed stones with particle sizes ranging from 5 mm to 20 mm; laboratory-synthesized polycarboxylate superplasticizer (PCE) in powder form, with a water reduction rate of 30%; and tap water as the mixing water. The steel fibers (Yanpan, Shanghai, China) used are straight-type, with a length of 15 mm and a diameter of 0.2 mm.
For the preparation of UHPC, silica fume (South Wollastonite, Xinyu, China) was added, and no coarse aggregates were used. The fine aggregates consist of quartz sands, with particle sizes ranging from 0.12 mm to 0.18 mm and 0.21 mm to 0.3 mm, in a 1:1 mass ratio. All other raw materials are the same as those used for C30, C60, and C80 concrete mixes.
The chemical composition of Portland cement, fly ash, GGBFS, and silica fume are given in Table 1.

2.2. Mix Proportions

The concrete was prepared based on the mix proportions outlined in Table 2 and mechanically mixed. The fresh concrete was then poured into molds with dimensions of 100 mm × 100 mm × 100 mm and compacted using a vibrating table. The specimens were demolded 24 h after casting and placed in a standard curing room (temperature 20 ± 2 °C, relative humidity > 95%) to cure for 28 days.

2.3. Compressive Strength

The compressive strength of the concrete at 28 days was measured using an automatic compression testing machine (DY-2008DFX, Dongyi, Wuxi, China), following the procedure outlined in the Chinese standard GB/T 50081-2019 [20]. The loading rate was set at 0.8 MPa/s. To ensure accuracy and reliability, the reported compressive strength for each test was the average value obtained from three individual specimens. The results are presented in Table 3.

2.4. Capillary Water Absorption

In accordance with ASTM C 1585-13 [21], the following procedure was conducted after the curing period. The surfaces of the specimens were cleaned, and the specimens were dried in a forced-air oven at 60 °C until reaching a constant weight. Once dried, the specimens were cooled to room temperature, and all surfaces except the test surface were sealed with epoxy resin. After the epoxy resin had fully cured, the initial mass of each specimen (m0) was measured to an accuracy of 0.1 g. The specimens were then placed in a water tank on a stainless steel mesh rack, with tap water maintained at a level 2 ± 1 mm above the bottom of the specimens. The laboratory conditions were controlled at a temperature of 20 ± 1 °C and a relative humidity of 65 ± 5%. During the first hour, water on the bottom of each specimen was wiped off every 10 min using a wrung-out wet towel, and the mass (mi) was promptly measured and recorded. After the first hour, the specimens were weighed hourly until the 6th hour. Following this, the specimens were weighed once daily until their mass stabilized. The capillary water absorption test setup is illustrated in Figure 1.
The cumulative capillary water absorption per unit cross-sectional area of a specimen at a given time under capillary action can be calculated using Equation (1):
I = m ρ w A c
where I is cumulative capillary water absorption per unit cross-sectional area at a given time (cm), m is cumulative mass of water absorbed by the specimen at a given time (g), ρ w is density of water (g/cm3), and A c is the cross-sectional area of the specimen (cm2).

2.5. Calculation of Capillary Water Absorption Rate

The capillary water absorption of cement-based materials is defined as the movement of water in unsaturated pores, where the pores are not fully saturated with water. The driving forces for capillary water absorption under unsaturated conditions include gravitational potential energy, pressure potential energy (capillary tension), and other contributing factors. The behavior of capillary water absorption can be derived using Darcy’s law for seepage, the continuity equation, and fundamental differential equations [22], as expressed in Equations (2)–(4):
u = K θ F = K θ Ψ
θ t = u x
u t = K θ Ψ
where u is unsaturated water flow velocity (m/s), F is capillary force (Pa), θ is water content (%), K is hydraulic conductivity (cm/s), and Ψ is capillary potential (Pa).
If the hydraulic diffusivity D is defined as shown in Equation (5), Equation (4) can be rewritten as Equation (6), where x represents the distance:
D θ = K ( θ ) d Ψ d θ
θ t = x ( D θ θ x )
Define θ = f(ψ) and ψ = xt−0.5, and introducing the boundary conditions: θ = θs for ψ = 0 (where the surface in contact with water is saturated) and θ = θd for ψ→∞ (representing a uniformly unsaturated semi-infinite medium), the solution of Equation (6) gives the cumulative capillary water absorption I per unit area at time t. The capillary water absorption S can then be determined based on the measured value of I using Equation (7):
I = S t + b
where I is cumulative capillary water absorption per unit cross-sectional area of the concrete (cm), t is water absorption time (s1/2), S is capillary water absorption rate (cm/s1/2), and b is intercept on the y-axis.

2.6. Determination of Microstructural Characteristics by Scanning Electron Microscopy

Specimens were prepared using cement paste to investigate the microstructural characteristics at the interface between the paste and steel fibers (Gemini SEM 300, Carl ZEISS AG, Oberkochen, Germany). First, the specimens were cured for 28 days and then sliced into 5–8 mm thick sections using a precision diamond saw. The slices were soaked in alcohol to halt the hydration process, followed by vacuum drying for 24 h. Subsequently, the samples underwent vacuum sputter coating with gold to enhance the quality of microstructural observation.

2.7. Determination of Pore Structure by Mercury Intrusion Porosimetry

For the mercury intrusion porosimetry (MIP) test, the specimens were prepared using paste with the same cementitious material composition and water-to-binder ratio as the corresponding concrete. The specimens were cured under standard conditions until the testing age and then soaked in alcohol to halt the hydration process. To prepare the samples for testing, a core sampling method was employed to extract small cube blocks with side lengths of less than 1 cm. These blocks were dried to a constant weight to ensure the removal of internal water.
The MIP analysis was performed using a high-performance, fully automatic mercury intrusion porosimeter (AutoPore IV 9620, Micromeritics, Norcross, GA, USA). All procedures and operations for the MIP test followed the guidelines of the Chinese Standard GB/T 21650.1-2008 [23].

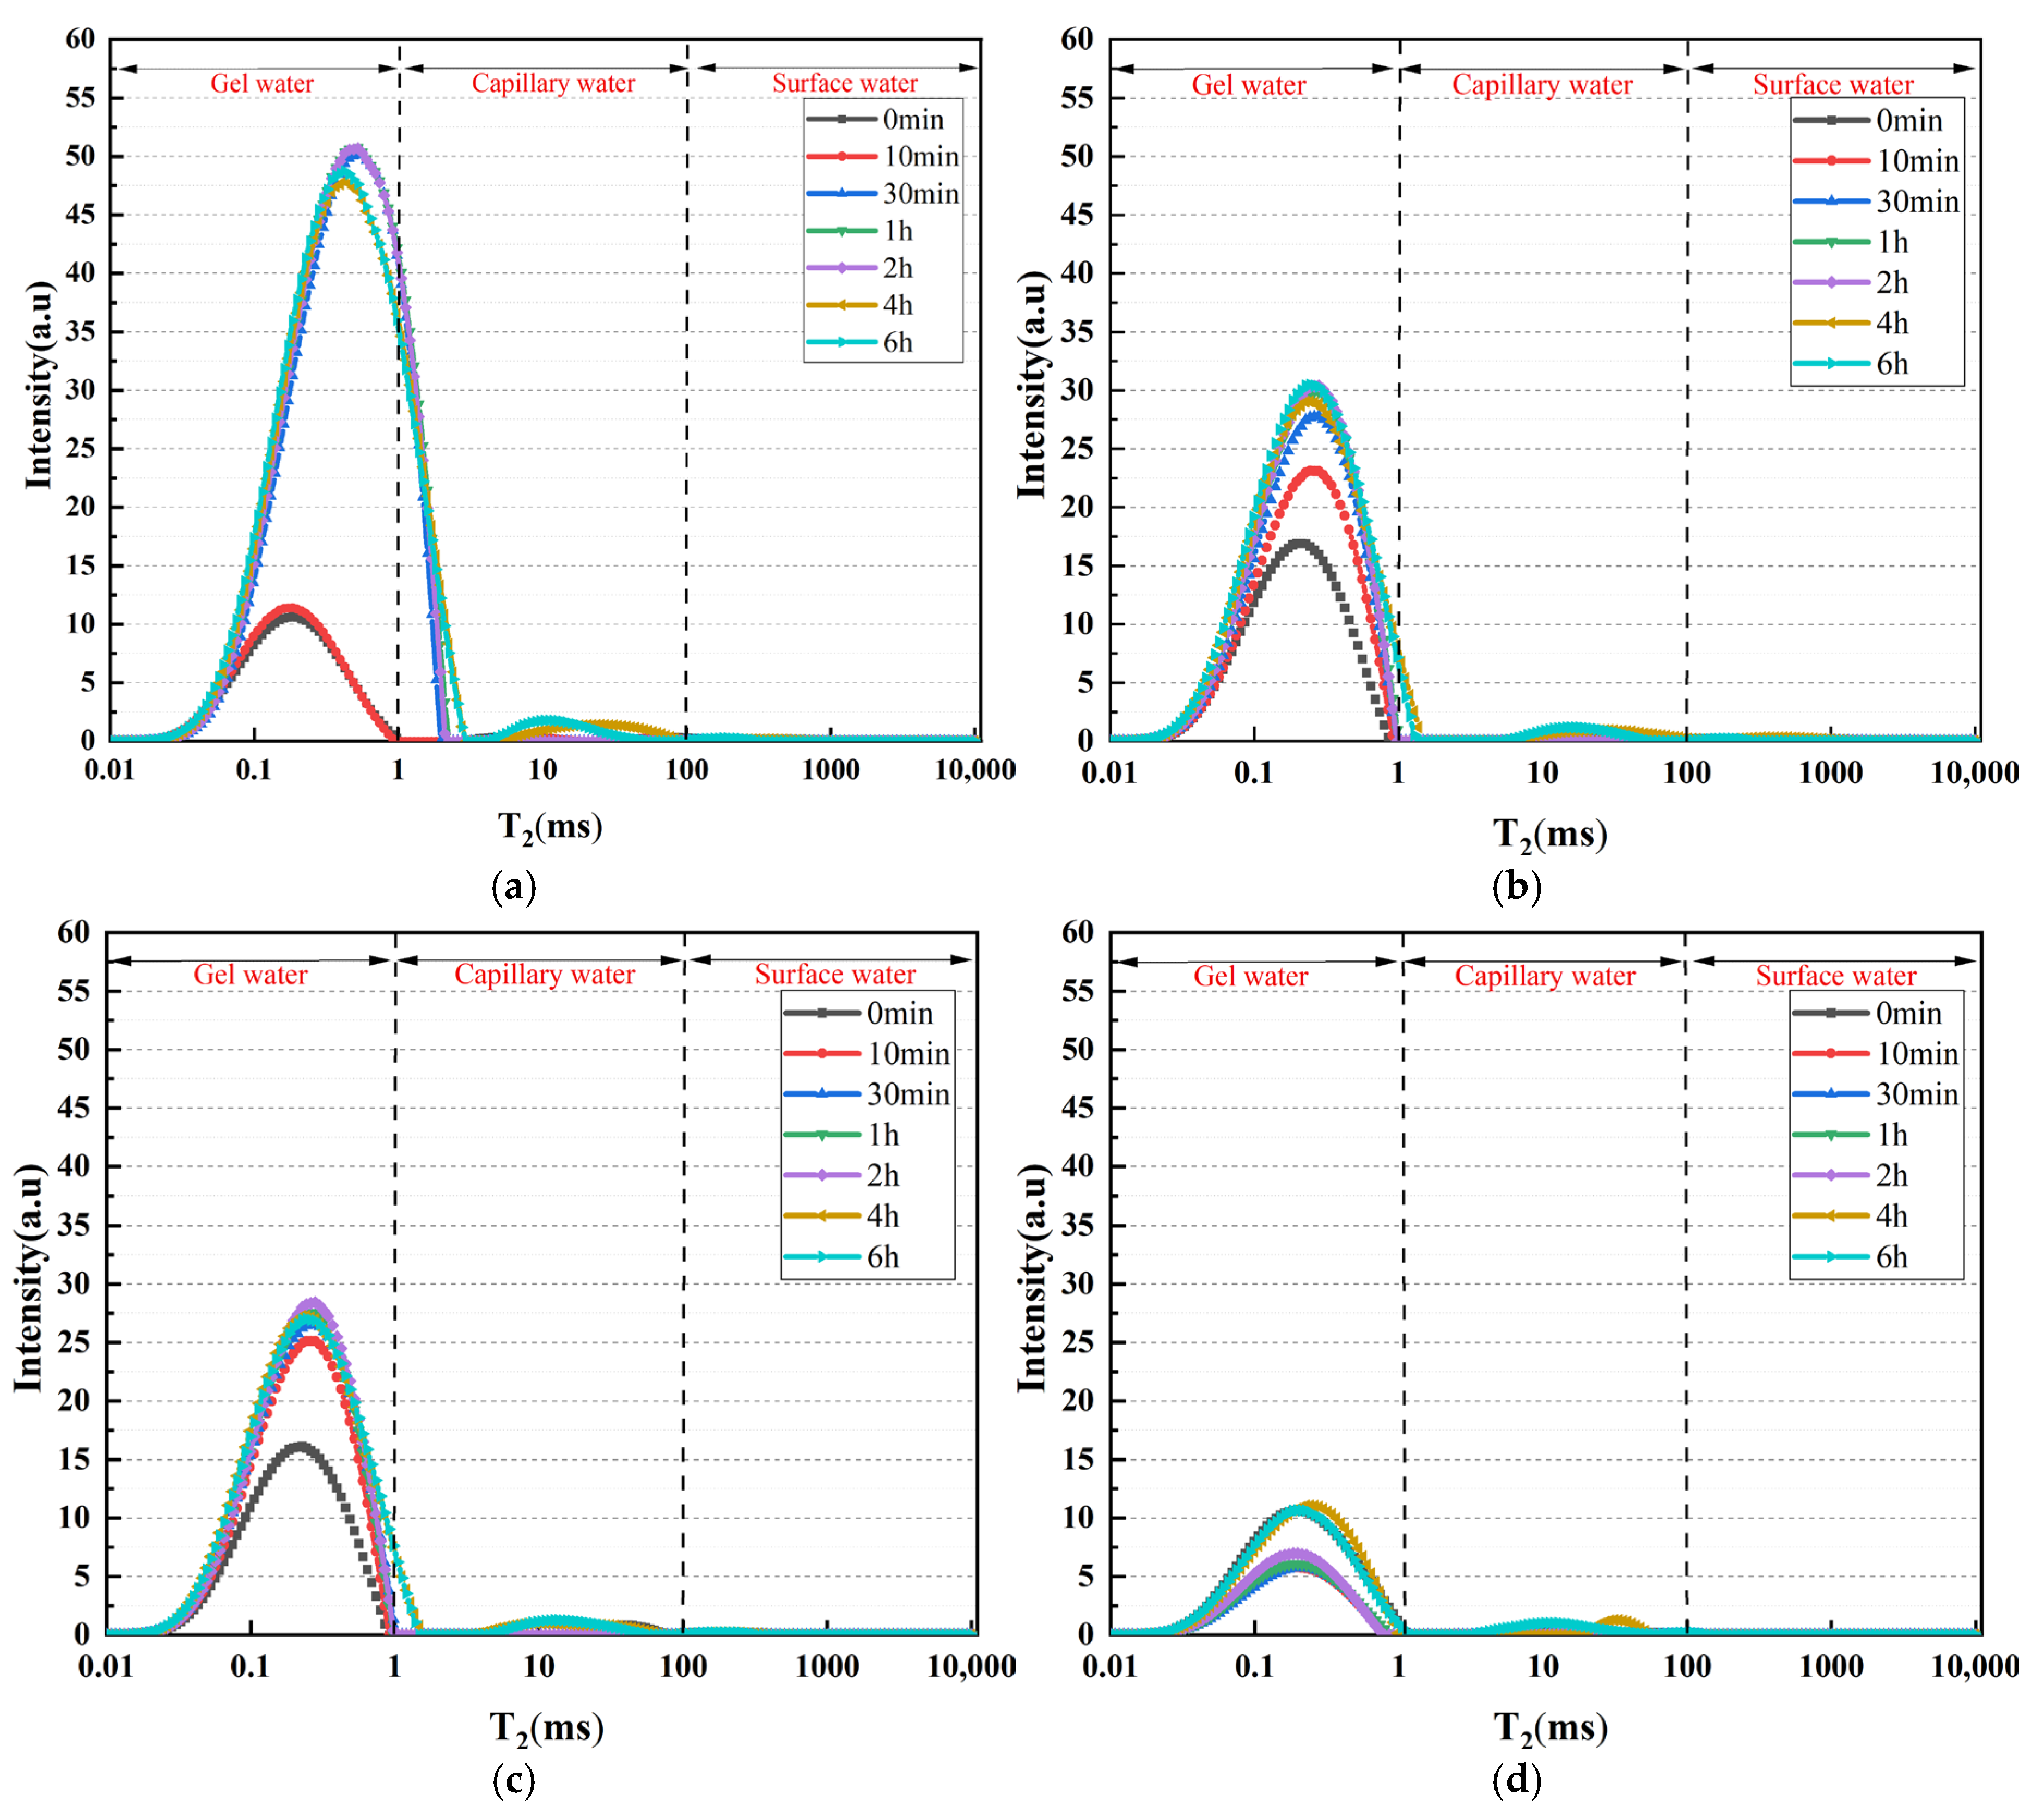
2.8. Determination of Internal Water Migration Using 1H Low-Field Nuclear Magnetic Resonance

The internal water migration process in concrete was analyzed using the 1H low-field nuclear magnetic resonance (1H low-field NMR) system (PQ-001, Niumag, Suzhou, China). The T2 relaxation time was employed to characterize the distribution of water content within the concrete. The measurement range for the T2 relaxation time was 0.01–10,000.00 ms [24].
The test utilized paste specimens prepared with the same cementitious material composition and water-to-binder ratio as the concrete. Cylindrical specimens, 20 mm in diameter and 20 mm in height, were fabricated. After reaching the specified curing age, the specimens were soaked in alcohol to halt hydration and then dried to a constant weight to remove internal water. Following the drying process, the specimens were cooled to room temperature and immediately tested to determine the initial water distribution in their dry state, corresponding to 0 min of capillary water absorption. The specimens were subsequently subjected to capillary water absorption testing. At predetermined intervals, the specimens were removed from the test setup, their surfaces gently wiped with a damp cloth, and then, analyzed using the 1H NMR system. The test intervals were set at 10 min, 30 min, 1 h, 2 h, 4 h, and 6 h.

3. Results

3.1. Cumulative Capillary Water Absorption

Figure 2 illustrates the variation in cumulative capillary water absorption over time for concrete of different strength grades. The results demonstrate that for all strength grades, cumulative capillary water absorption increases over time, with a rapid rate of absorption in the early stages that gradually slows down later. By the 12th day, the absorption curve levels off, indicating that cumulative capillary water absorption no longer increases significantly, even with further time extension. To ensure accuracy, the test period was extended to 15 days, confirming that the cumulative capillary water absorption remained stable beyond the 12th day.
Based on the observed trends, the capillary water absorption process can be divided into two distinct stages. The first stage, occurring within the initial 6 h, is the rapid absorption stage, where more than 30.4% of the total capillary water absorption is achieved. This stage is the primary contributor to overall absorption in the capillary pores. The second stage, spanning from 1 day to 12 days, is characterized by a slower absorption rate, with cumulative capillary water absorption showing a gradual upward trend before stabilizing.
At any given time, cumulative capillary water absorption decreases with increasing concrete strength grades, following the trend C30 > C60 > C80 > UHPC. Higher strength grades exhibit lower capillary water absorption due to enhanced compactness. In particular, UHPC, which lacks coarse aggregates and has an ultra-low water–binder ratio, demonstrates superior compactness, resulting in significantly reduced capillary water absorption.
The capillary water absorption of concrete stabilizes after a certain period. Among the C30 concrete, C30-2 exhibited the highest cumulative capillary water absorption, reaching 0.83 cm. In the C60 concrete, C60-3 reached the highest value of 0.23 cm. Similarly, in C80 concrete, C80-3 showed the highest value at 0.13 cm. For UHPC, the cumulative capillary water absorption decreases overall with the increase in steel fiber content, and the cumulative capillary water absorption of UHPC accounts for only 4.5–5.7% of that of C30 concrete. This remarkable difference is primarily attributed to the intrinsic material characteristics of UHPC. Compared to normal-strength concrete, high-strength concrete, and high-performance concrete, UHPC eliminates coarse aggregates and adopts the principle of dense packing, resulting in a more compact matrix and a significant reduction in microscopic defects. Moreover, during the mixing process of steel fibers and the matrix, UHPC effectively minimizes defects in the interfacial transition zone, forming a more tightly bonded structure between the steel fibers and the matrix. This tightly integrated structure effectively impedes water transport through fine pores. Consequently, the cumulative capillary water absorption of UHPC is substantially lower than that of the other three types of concrete.

3.2. Capillary Water Absorption Rate in Concrete

The capillary water absorption rate of concrete provides a direct and quantitative assessment of its water absorption behavior, making it a crucial indicator for evaluating the durability and service life of concrete. Based on the two distinct stages of capillary water absorption identified in Section 3.1, the capillary water absorption rate is categorized into the initial and secondary stages. The initial capillary water absorption rate is defined as the slope of the I-T1/2 fitting line during the rapid absorption phase, spanning from 0 min to 6 h. The secondary capillary water absorption rate corresponds to the slope of the I-T1/2 fitting line during the slower absorption phase, which extends from 1 day to 12 days. This distinction allows for a more comprehensive evaluation of concrete’s water absorption performance, aiding in the prediction of its long-term durability under various conditions.

3.2.1. The Initial Capillary Water Absorption Rate

The fitting results of I-T1/2 for the first 6 h of concrete with varying strength grades are presented in Figure 3. From these results, the initial capillary water absorption rates and the corresponding correlation coefficients (R2) for different concrete types are obtained. Among the various strength grades, C30 concrete exhibits a significantly higher initial capillary water absorption rate. This can be attributed to its lower content of cementitious materials, relatively high water-to-binder ratio, and insufficient filling of the pores between coarse and fine aggregates. Such lower compactness results in stronger capillary permeability, enabling rapid water transmission. As the composition of cementitious materials improves and the water-to-binder ratio decreases, the initial capillary water absorption rates for C60 and C80 concretes show a noticeable decline. However, these rates remain comparatively high due to the presence of coarse aggregates, which lead to a large number of defects in the interfacial transition zone. In contrast, UHPC demonstrates an exceptionally low initial capillary water absorption rate. This can be primarily attributed to the incorporation of silica fume with its fine particle size, a reduced water-to-binder ratio of 0.17, and the absence of coarse aggregates. These factors collectively enhance the compactness of UHPC, significantly reduce pore connectivity, and make water transmission through the fine pore network highly challenging. Consequently, the unidirectional capillary water absorption rate of UHPC is markedly lower than that of C30 concrete.
When comparing the R2 values of the fitting lines for I-T1/2, it is evident that C30, C60, and C80 concretes exhibit strong linear correlations, with R2 ≥ 0.964. However, the fitting degree for UHPC is relatively lower, with R2 values ranging between 0.743 and 0.931. This discrepancy is indicative of “abnormal water absorption behavior”, which may arise from the unique pore structure and reduced permeability of UHPC. This phenomenon will be discussed in greater detail in the subsequent sections.

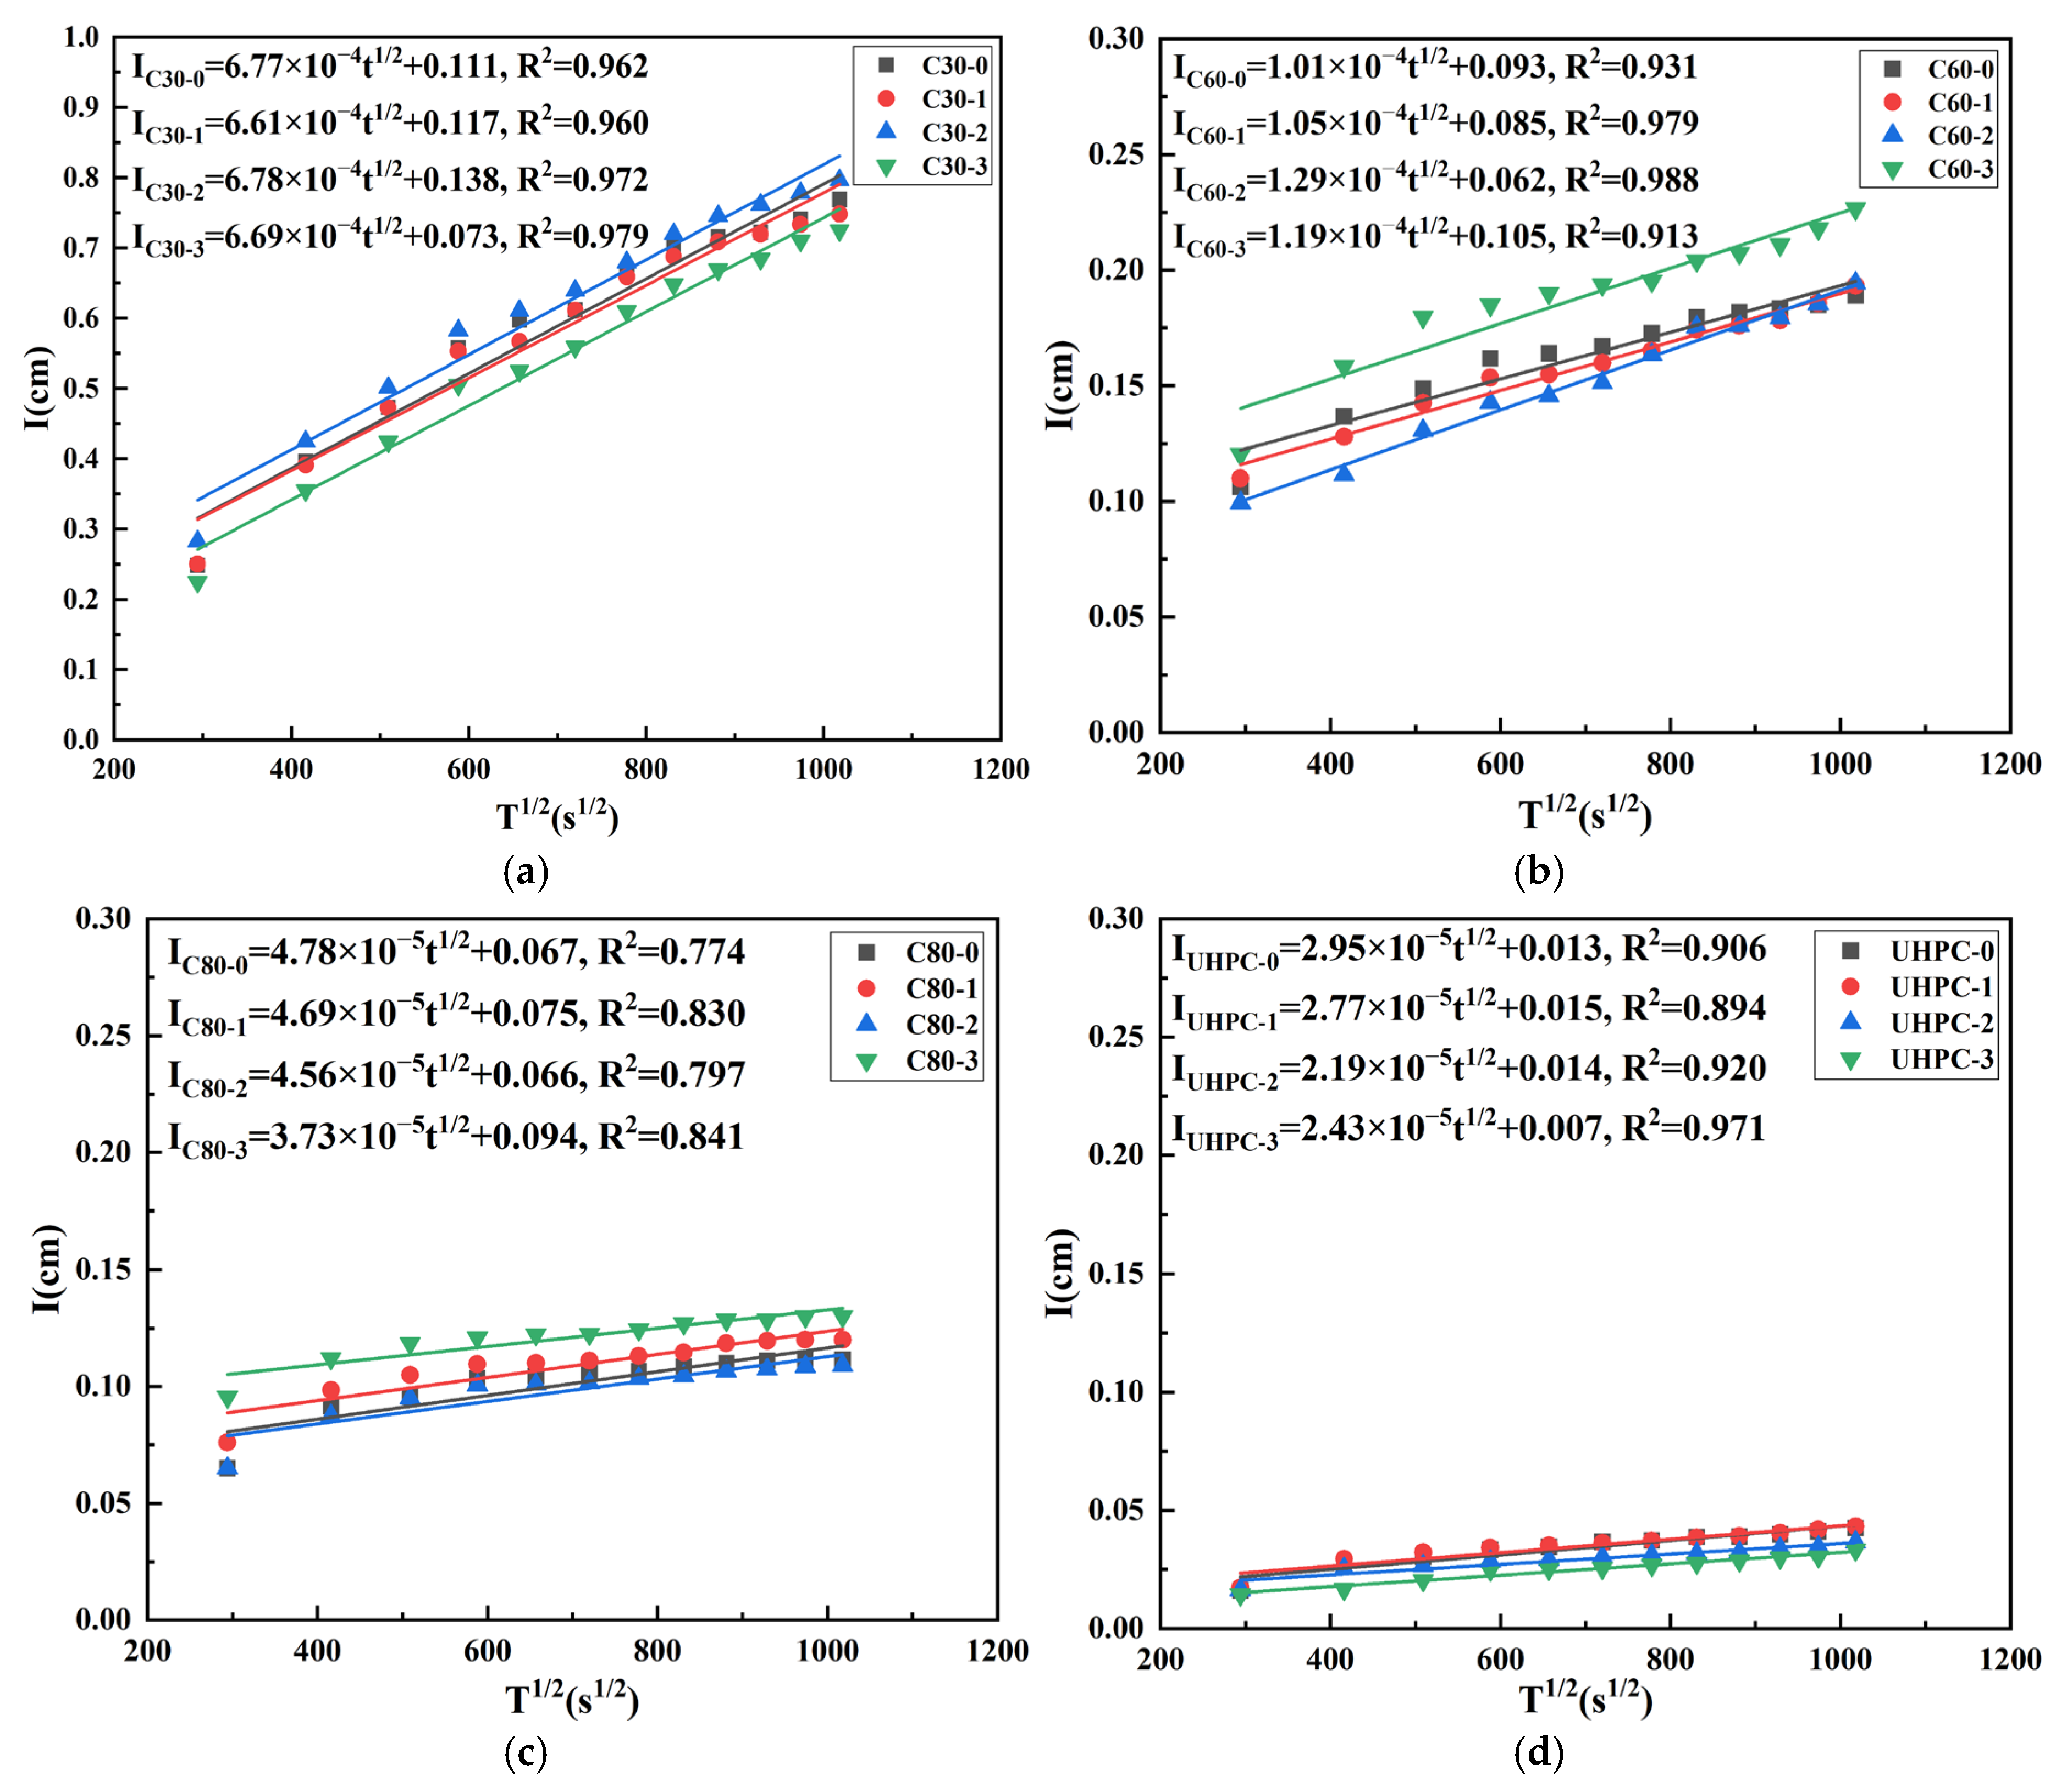
3.2.2. The Secondary Capillary Water Absorption Rate

Figure 4 illustrates the fitting results of the I-T1/2 curves for concrete with different strength grades over the period from 1 day to 12 days. A detailed comparison of the capillary water absorption rates for these concretes is provided in Table 4.
When comparing the results with those in Figure 3, it is evident that the secondary capillary water absorption rates for all strength grades are significantly lower than the initial capillary water absorption rates. Specifically, the secondary capillary water absorption rate of C30 concrete is approximately 30% lower than its initial rate. For C60 and C80 concretes, the secondary capillary water rates are around 75% lower than their respective initial rates. In the case of UHPC, the secondary capillary water absorption rate is approximately 50% lower than its initial rate. A clear trend emerges; as the strength grade increases, its secondary capillary water absorption rate decreases, mirroring the trend observed in the initial capillary water absorption rates.
Both the initial and secondary capillary water absorption rates serve as valuable indicators of water absorption behavior and, by extension, its durability. These rates also provide indirect insights into the mechanical properties of concrete, making them critical metrics in durability evaluation. Notably, the initial capillary water absorption rate exhibits a better fitting degree than the secondary rate, suggesting that it offers a more accurate representation of concrete’s water absorption performance. Furthermore, the shorter testing duration for the initial rate reduces the influence of environmental and human factors, making it a more practical and reliable parameter for real-world engineering applications. Consequently, it is recommended that the initial capillary water absorption rate be prioritized as a primary evaluation criterion for concrete performance in future projects.

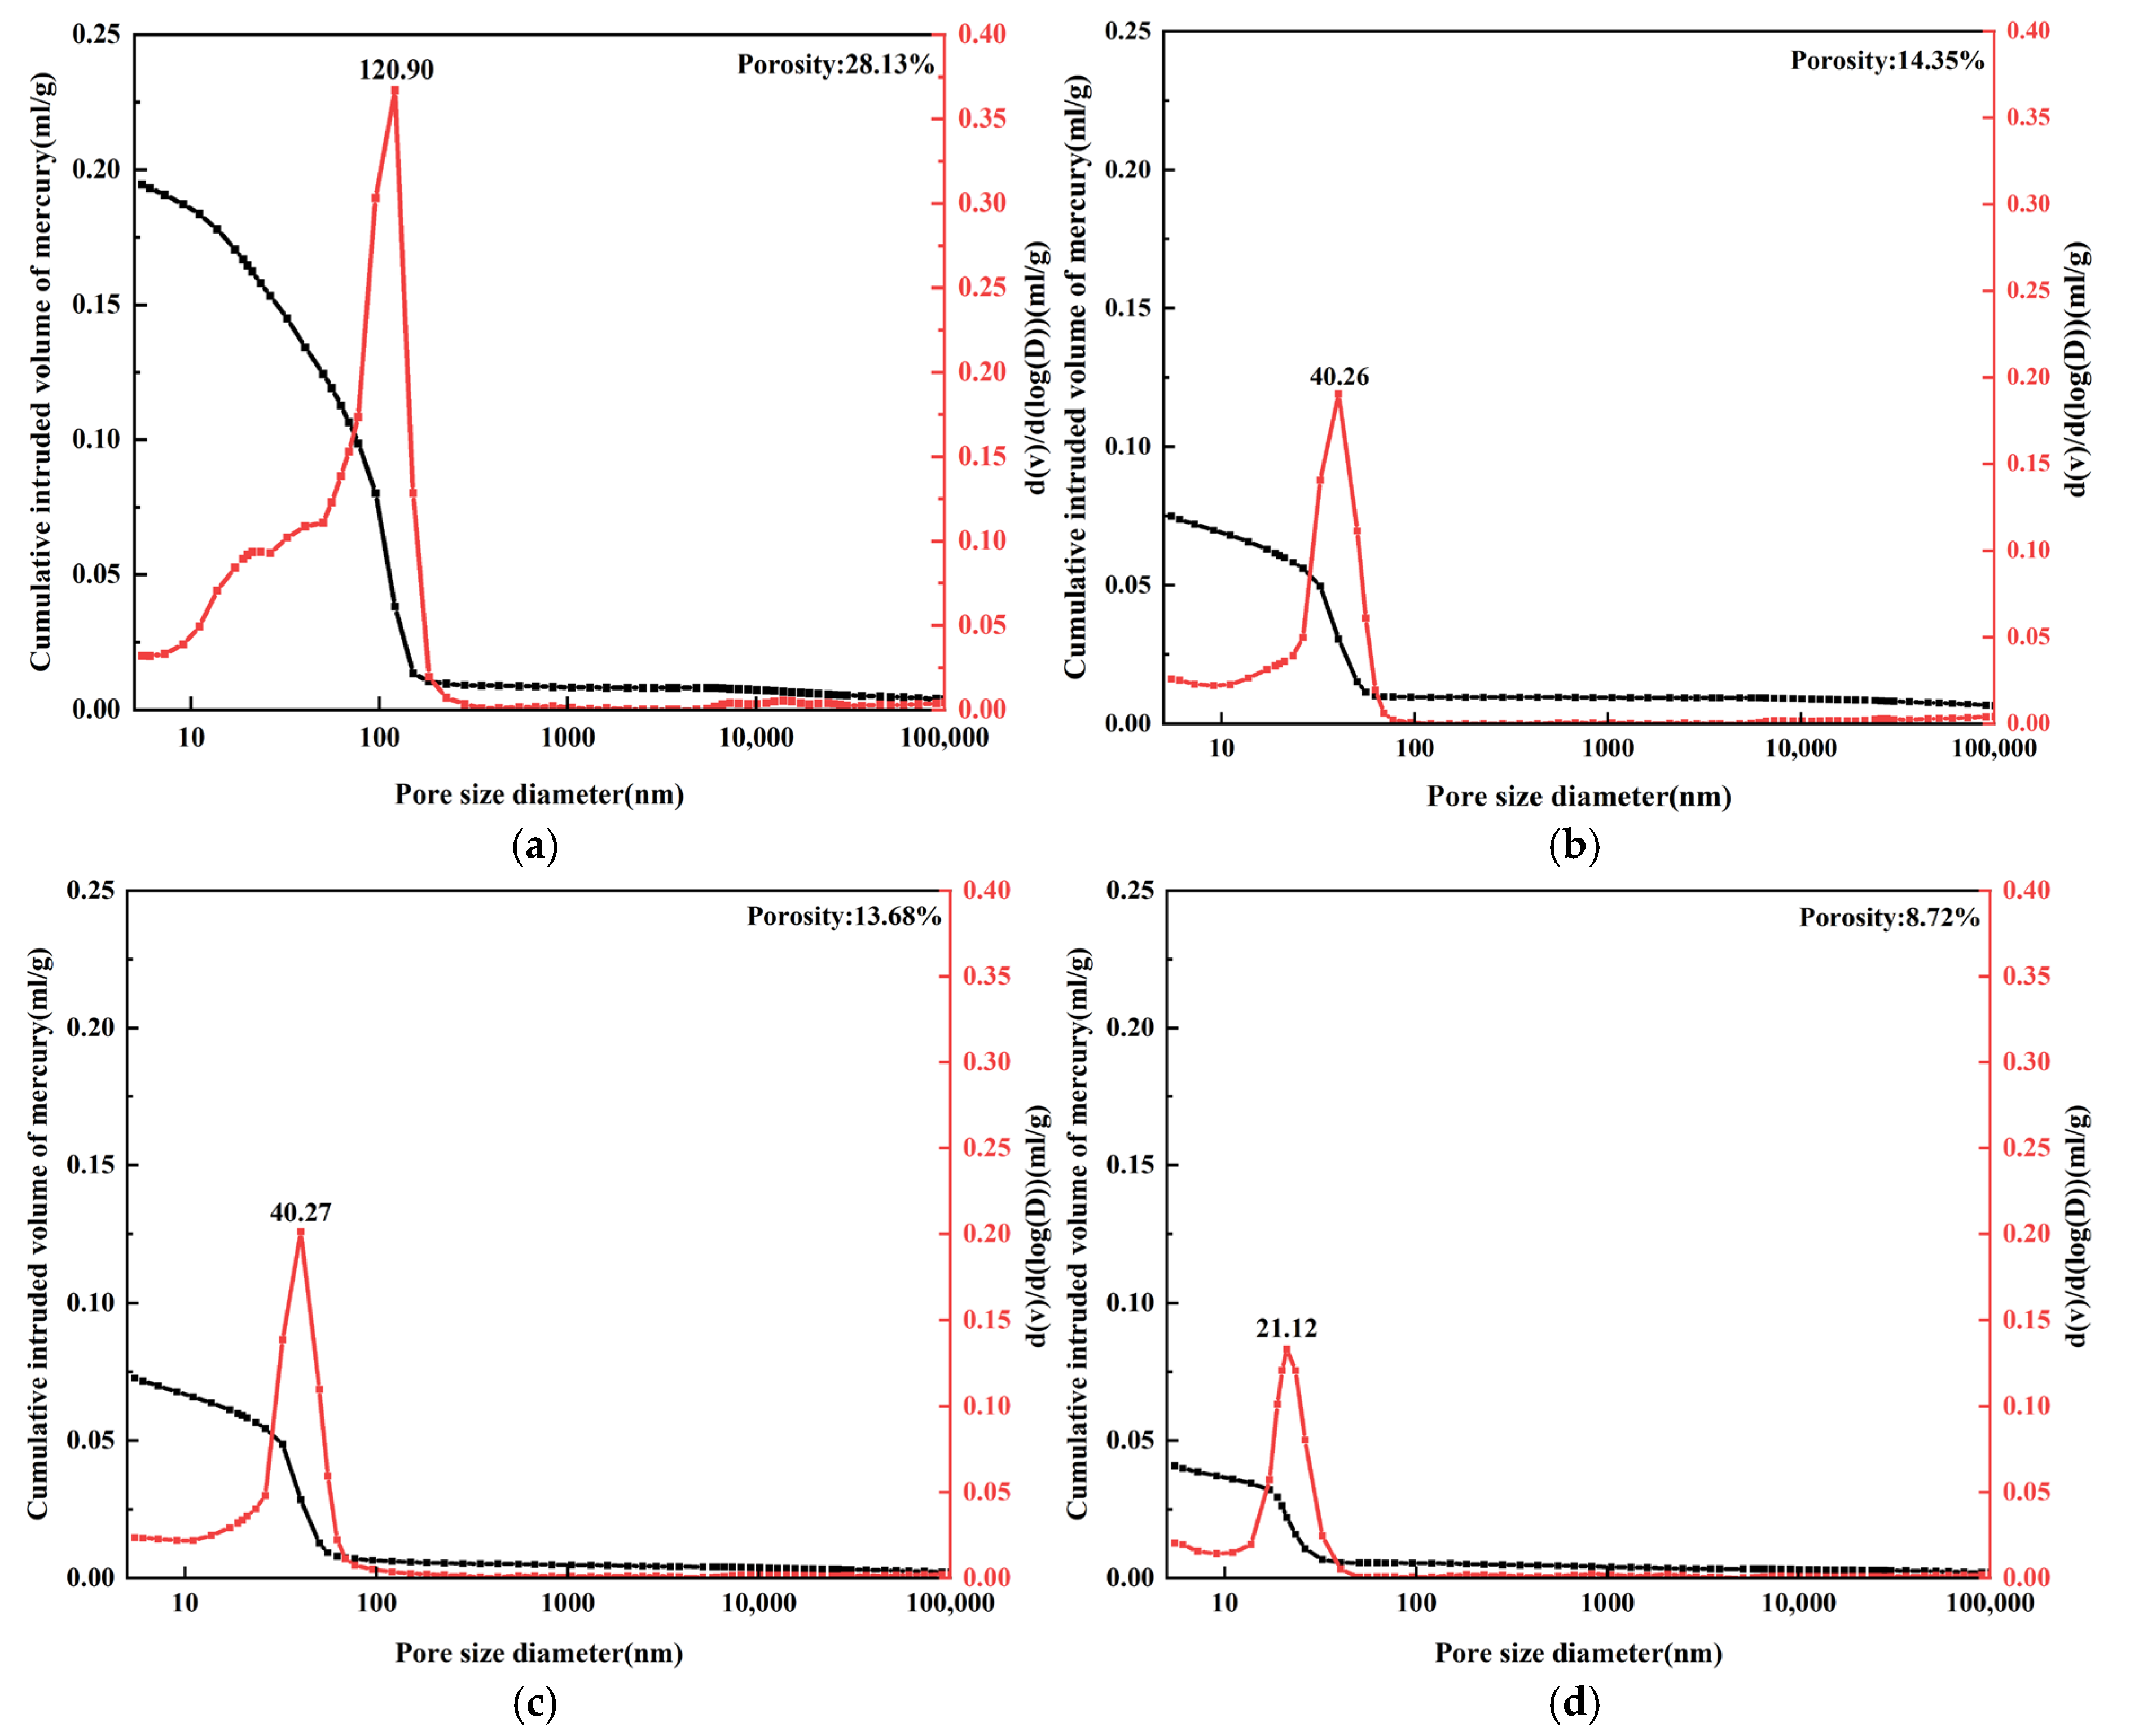
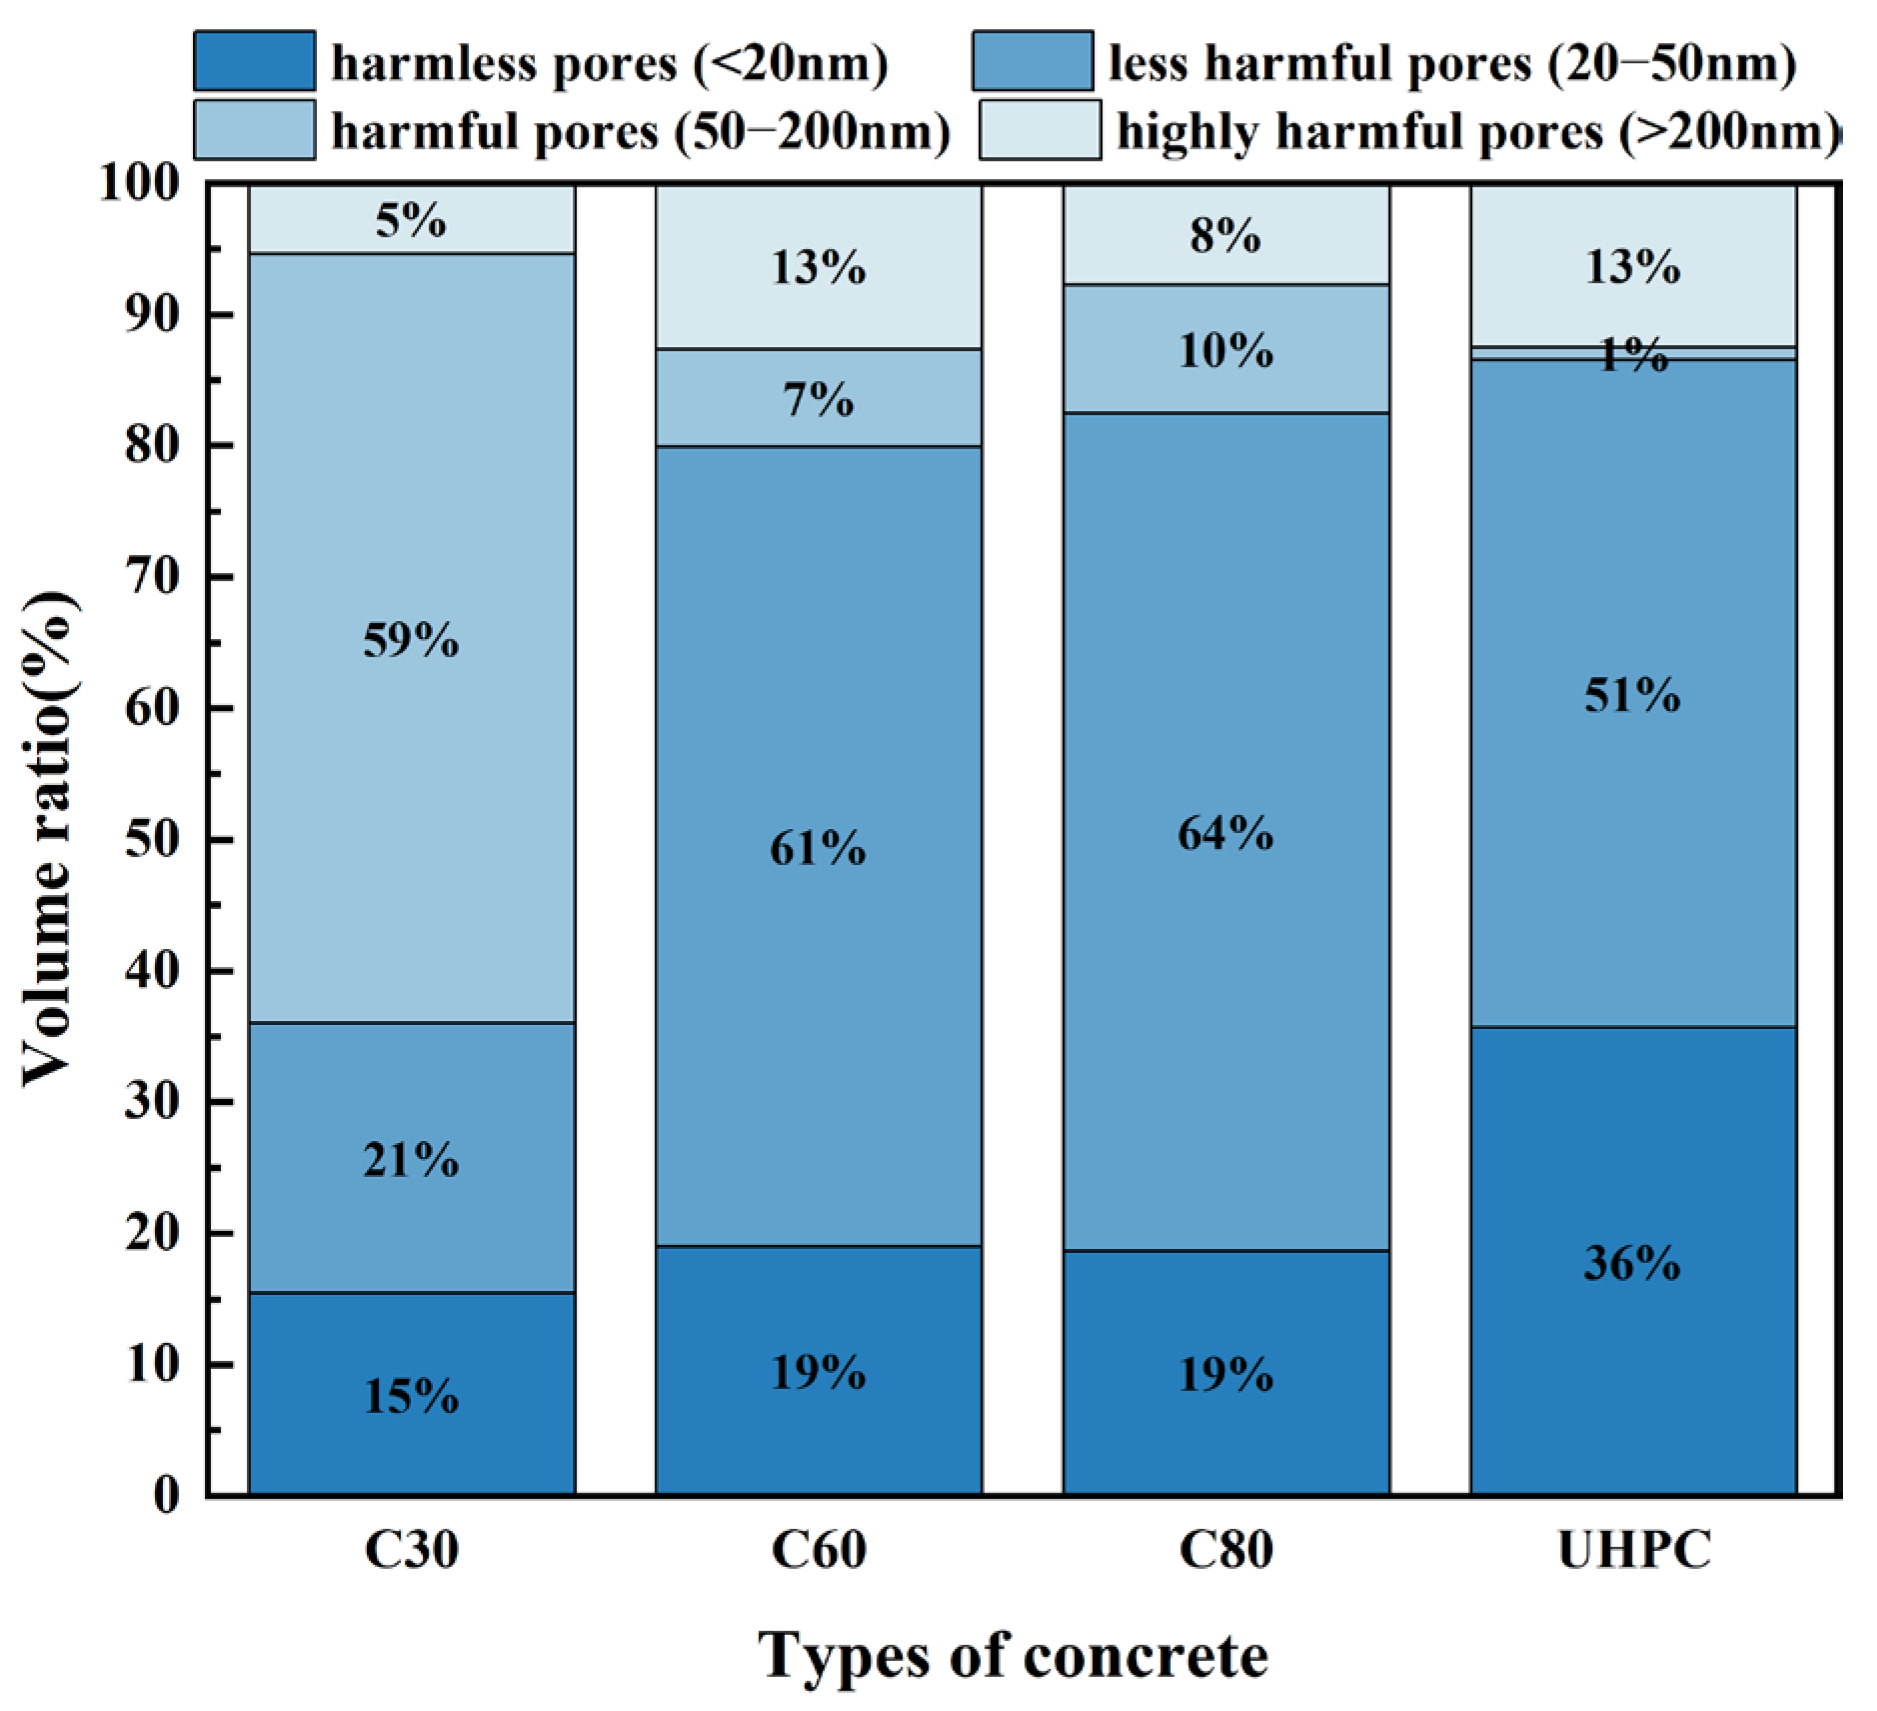
3.3. Pore Structure Characteristics

Concrete is a porous material, and its internal pore structure plays a pivotal role in determining its water absorption capacity and overall durability. The pore structure primarily pertains to the characteristics of the cementitious matrix within the concrete, encompassing factors such as porosity, pore size distribution, and pore connectivity. Lower porosity, reduced prevalence of large capillary pores, and weaker pore connectivity generally result in decreased water absorption, thereby enhancing the durability of the concrete. Capillary pores in concrete can be categorized into four groups based on their size and impact on concrete performance: harmless pores (<20 nm), less harmful pores (20–50 nm), harmful pores (50–200 nm), and highly harmful pores (>200 nm) [25]. Among these, an increase in harmful and highly harmful pores significantly raises the water absorption rate of the concrete.
Figure 5 presents the integral and differential pore size distribution curves of the cement paste corresponding to concretes of varying strength grades. From the data, it can be observed that the porosity and most probable pore size decrease as the concrete strength grade increases; C30 concrete exhibits a porosity of 28.13% and a most probable pore size of 120.9 nm, C60 concrete shows a porosity of 14.35% and a most probable pore size of 40.26 nm, C80 concrete has a porosity of 13.68% and a most probable pore size of 40.27 nm, and UHPC demonstrates the lowest porosity at 8.72% and a most probable pore size of 21.12 nm. These results illustrate that adjustments in cementitious material composition and reductions in the water–binder ratio lead to lower porosity, finer pores, and reduced pore connectivity, which enhances concrete density.
By categorizing pore sizes, a clearer understanding of the internal pore structure of concrete emerges. Figure 6 compares the percentage distributions of pore sizes across different strength grades. It reveals that with improved material composition and reduced water–binder ratios, the proportion of harmless pores in concrete across different strength grades increases from 15% to 36%, while the proportion of harmful and severely harmful pores decreases from 64% to 13%. These changes are highly significant. This transition indicates improved concrete density, where most internal pores are isolated, aligning with the trends observed in the capillary water absorption test. These results confirm that refining the pore structure effectively diminishes the capillary water absorption effect.
A comparison of MIP and capillary water absorption results further highlights these effects. Although the porosity of C30 concrete is 19.41% higher than that of UHPC, its capillary water absorption rate exceeds that of UHPC by over 93%. Similarly, while C60 concrete and C80 concrete have nearly identical porosity and most probable pore sizes, the capillary water absorption rate of C80 concrete is 42% lower than that of C60 concrete. This disparity is attributed to the fact that C80 concrete contains a higher proportion of less harmful pores and fewer highly harmful pores. In the case of UHPC, its pore structure is optimized using the principle of closest particle packing, achieved by incorporating ultra-fine silica fume into the cementitious material. This approach fills particle gaps, reducing porosity, pore size, harmful pores, and highly harmful pores. Consequently, UHPC exhibits the smallest capillary water absorption rate among the tested concrete grades.

4. Discussions

4.1. Water Transport Process and Mechanism

As discussed earlier, water from the external environment enters concrete through interconnected pores, moving from the surface to the interior. Water within concrete exists in the following three primary forms: free water, adsorbed water, and chemically bound water. Free water refers to water that is freely present in the concrete pores, with an unstable content and weak binding forces. Adsorbed water is water that adheres to the surface of solid particles or within the pores, forming a thin water film. Chemically bound water, on the other hand, is water that chemically combines with cementitious materials, becoming part of the hydration products’ structure. Each of these water types plays a vital role in the hydration process and the overall properties of the concrete. Chemically bound water is essential for cement hydration, adsorbed water ensures proper diffusion of cement particles and facilitates the completion of the hydration reaction, and free water provides the necessary external conditions for the other two forms to perform their functions. These forms of water can also transform into one another, depending on the environment and the concrete’s internal conditions [26].
To further investigate the process and mechanisms of water transmission in concrete, low-field NMR technology was used to measure water distribution within samples. A study [27] identified specific T2 values corresponding to different water forms based on their distribution characteristics. These are categorized as gel water (0.01–1 ms), capillary water (1–100 ms), and surface water (which includes water in mesopores, macropores, and cracks) (100–10,000 ms). Building on these findings, the T2 value distribution of specimens, after undergoing capillary water absorption over a specified period, was classified. The results are illustrated in Figure 7.
By analyzing the T2 distribution, the water distribution in the specimens can be deduced. Under completely dry conditions, only one characteristic peak is observed, located in the 0.01–1 ms range. This indicates that, at this stage, the water present in the specimens is entirely gel water, with no capillary water or surface water. As the water absorption time increases, the T2 curve develops two distinct characteristic peaks. The first peak, which remains the dominant feature, corresponds to the relaxation signal of gel water (0.01–1 ms), while the second peak, smaller in intensity, corresponds to the relaxation signal of capillary water (1–100 ms). The higher intensity of the first peak indicates that, upon contact with water, the unhydrated cement particles in the gel pores primarily store water through capillary absorption. At this point, the absorbed water has not yet participated in the hydration reaction.
As the water absorption process continues, a portion of the absorbed water begins to react with the unhydrated cement particles, forming hydration products that fill the pores. This results in a decrease in porosity and a refinement of the pore structure, making it more difficult for water to penetrate further. Consequently, the T2 signal intensity of the gel water first increases as water is absorbed then gradually decreases as the hydration process progresses, and the pore structure becomes denser.
Comparing the T2 signal intensities of specimens with different strength grades during the water absorption process reveals significant differences. C30 concrete exhibited the highest T2 signal intensity, indicating greater water absorption, while C60 and C80 concrete showed comparatively lower T2 signal intensities, with C80 concrete being slightly lower than C60 concrete. UHPC demonstrated an extremely low T2 signal intensity, reflecting minimal water absorption. This suggests that, under identical capillary water absorption conditions, C30 concrete absorbs significantly more water; whereas, UHPC absorbs very little. These differences are primarily attributed to the influence of the water–binder ratio and the composition of the cementitious materials on the pore structure. A lower water–binder ratio and the use of densely packed cementitious materials lead to reduced porosity, fewer capillary channels, and a more challenging capillary water absorption process.
Figure 8 presents the pore size distribution of cement paste specimens corresponding to different concrete strength grades, as determined using mercury intrusion porosimetry, at the point when the characteristic peaks of gel water and capillary water significantly decline (at 6 h of capillary water absorption). In comparison with Figure 6, the pore structure of the specimens undergoes varying degrees of refinement after 6 h of water absorption. Specifically, the proportion of harmful pores in the C30 concrete decreases by approximately 42.5%, while the proportion of harmless pores in the other three strength grades increases by 19.4–31.5%. This indicates that the water absorption process refines larger pores in low-strength concrete and smaller pores in high-strength concrete.

4.2. Explanation of the Abnormal Water Absorption Phenomenon

Capillary water absorption in concrete is influenced not only by the characteristics of its pore structure but also by the physical and chemical processes occurring within the material. Traditional unsaturated transport models, such as those used in soil studies, are insufficient to fully explain the capillary water absorption behavior of cement-based materials. In particular, these models fail to account for the nonlinear relationship between the capillary water absorption rate and time in concrete. This discrepancy arises because these models do not consider factors such as the ongoing hydration of unhydrated cement particles [28], the leaching of Ca (OH)2 [29], and the non-uniform distribution of water within the material [30]. These factors can result in changes to the pore structure or lead to pore blockage, which affects the water absorption behavior.
Among these factors, the continuous hydration of unhydrated cement particles is the primary influencing factor. Rucker et al. [31] demonstrated that the water transport process in unsaturated concrete is determined by the combined effects of capillary forces and the viscous flow resistance of water. This theory provides a better understanding of the abnormal water absorption behavior observed in concrete. The influence of capillary forces and viscous resistance on water transport within concrete can be described by the following equations. First, the capillary force Pσ in a cylindrical pore with a radius R is given by:
P σ = 2 σ cos σ R
where σ is the surface tension of the liquid (N·m−1), α is the liquid wetting angle (°), and R is the radius of the capillary pore (mm).
The viscous resistance Pη is described by:
P η = 8 η R 2 x d x d t
where η is the dynamic viscosity of the liquid (Pa·s), and d x d t represents the rate of change in the distance x (mm), as the liquid moves through the capillary.
Finally, when the effects of gravity are neglected, the capillary penetration depth x can be expressed as:
x = R σ cos α 2 η t
Water transport behavior in concrete is influenced by the interplay between pore size and water movement dynamics. In larger pores, the viscous resistance to liquid flow is lower, allowing for a faster capillary water absorption rate. When concrete is dry, the capillary pores are devoid of water, and the larger pores are the first to absorb water due to their lower resistance, as described by Equation (10). Upon contact with water, these larger capillary pores rapidly fill, increasing the water content in the surrounding gel pores. As water enters the gel pores, it triggers the hydration of the cementitious material, leading to the formation of additional C-S-H. This process fills smaller pores, alters the pore structure, reduces the connectivity of the capillary network, and increases pore tortuosity. These changes collectively disrupt the linearity of the capillary water absorption rate, a phenomenon noticeable after 6 h of water absorption [32] and particularly pronounced in UHPC.
Figure 9 illustrates that, as the water absorption process continues, the number of gel pores diminishes, and the water entering them decreases. Simultaneously, water begins to ascend along the walls of larger capillary pores. When these larger pores reach partial saturation, water is drawn into smaller capillary pores due to their higher capillary forces. This shift facilitates the transfer of water from larger to smaller pores within the specimen. As this process advances, large pores continue to absorb water at a decreasing rate until dynamic equilibrium is achieved. For pores smaller than gel pores, water transport occurs in the form of vapor due to the inability of liquid water to penetrate these microstructures.
The blocking effect of C-S-H in concrete varies depending on the type of concrete and is primarily influenced by factors such as the expansion capacity of C-S-H (determined by its quantity, morphology, and structure), the type and content of mineral admixtures, the water-to-binder ratio, the curing age, and the material’s ability to accommodate the expanding C-S-H—referred to as the surplus capacity. Materials with higher porosity exhibit a greater surplus capacity to accommodate the expansion of C-S-H. Consequently, the pore structure of such concrete is less affected by C-S-H expansion. In these cases, the water transmission paths remain relatively unaffected, allowing the capillary water absorption rate to maintain a strong linear correlation with time. Conversely, in concretes with lower porosity, the expansion of C-S-H significantly alters the pore structure, restricting water movement and disrupting the linear relationship between capillary water absorption and time [33].

4.3. Influence of Steel Fibers on the Capillary Water Absorption

The impact of steel fiber content on the capillary water absorption rate varies depending on the strength grade of the concrete. For C30 concrete, steel fiber content significantly influences the initial capillary water absorption rate; whereas, in C60 concrete, its effect is more pronounced on the secondary capillary water absorption rate. In C80 concrete, the influence of steel fibers on both the initial and secondary capillary absorption rates is relatively minor. For UHPC, where the matrix already exhibits an extremely low capillary water absorption rate, the impact of steel fiber content is negligible.
The effect of steel fibers on water transmission in concrete arises primarily from the interface between the fibers and the matrix, as well as the blocking action of the fibers [34]. At the interface, the bonding conditions play a crucial role. If the interface is dominated by hydrated cementitious material, and its hydration products adhere firmly to the fiber surface, it minimizes defects and blocks water transmission pathways. Conversely, if unhydrated cement particles are prevalent at the interface, capillary transport may occur through the gaps and defects between the fibers and the matrix, as shown in Figure 10. Simultaneously, the steel fibers act as physical barriers, obstructing capillary channels in the matrix, reducing pore connectivity, and thereby hindering water transport. This influence is also illustrated in Figure 11. These two mechanisms interact and impose mutual constraints on water transport, leading to complex macroscopic effects. Depending on the content and distribution of steel fibers, the capillary water absorption rate may increase due to interface defects or decrease as a result of blocked capillary channels, as demonstrated in Figure 2. To address these variations, adjustments to steel fiber content, improvements in fiber dispersion, and modifications to the composition of cementitious materials can be implemented.
The microstructural characteristics of the interfaces between steel fibers and concrete matrices of different strength grades are presented in Figure 12. Observations reveal that the transition zone at the interface is particularly prominent in the C30 concrete matrix, with a significant presence of pores in the matrix. In contrast, the interfaces in C60 and C80 concrete matrices exhibit tighter adhesion, with refined hydration product particles on the surface of steel fibers. Notably, the UHPC matrix demonstrates exceptional bonding performance at the steel fiber interface, with almost no apparent transition zone. A uniform and dense adhesive layer forms on the surface of the steel fibers, and the matrix structure becomes significantly more compact. These findings suggest that a highly dense matrix can substantially enhance the interfacial interactions between steel fibers and the matrix, thereby improving the overall performance of the material.

5. Conclusions

This study examines the capillary water absorption behavior in concrete of different strength grades, offering valuable insights into the pore structure and mechanisms of water migration in concrete. The main conclusions are as follows:
  • The capillary water absorption process in concrete occurs in two distinct stages. The initial stage (0 min to 6 h) is characterized by rapid water absorption, while the secondary stage (1 day to 12 days) involves a slower rate of water absorption. Over time, the cumulative capillary water absorption rate decreases and eventually stabilizes.
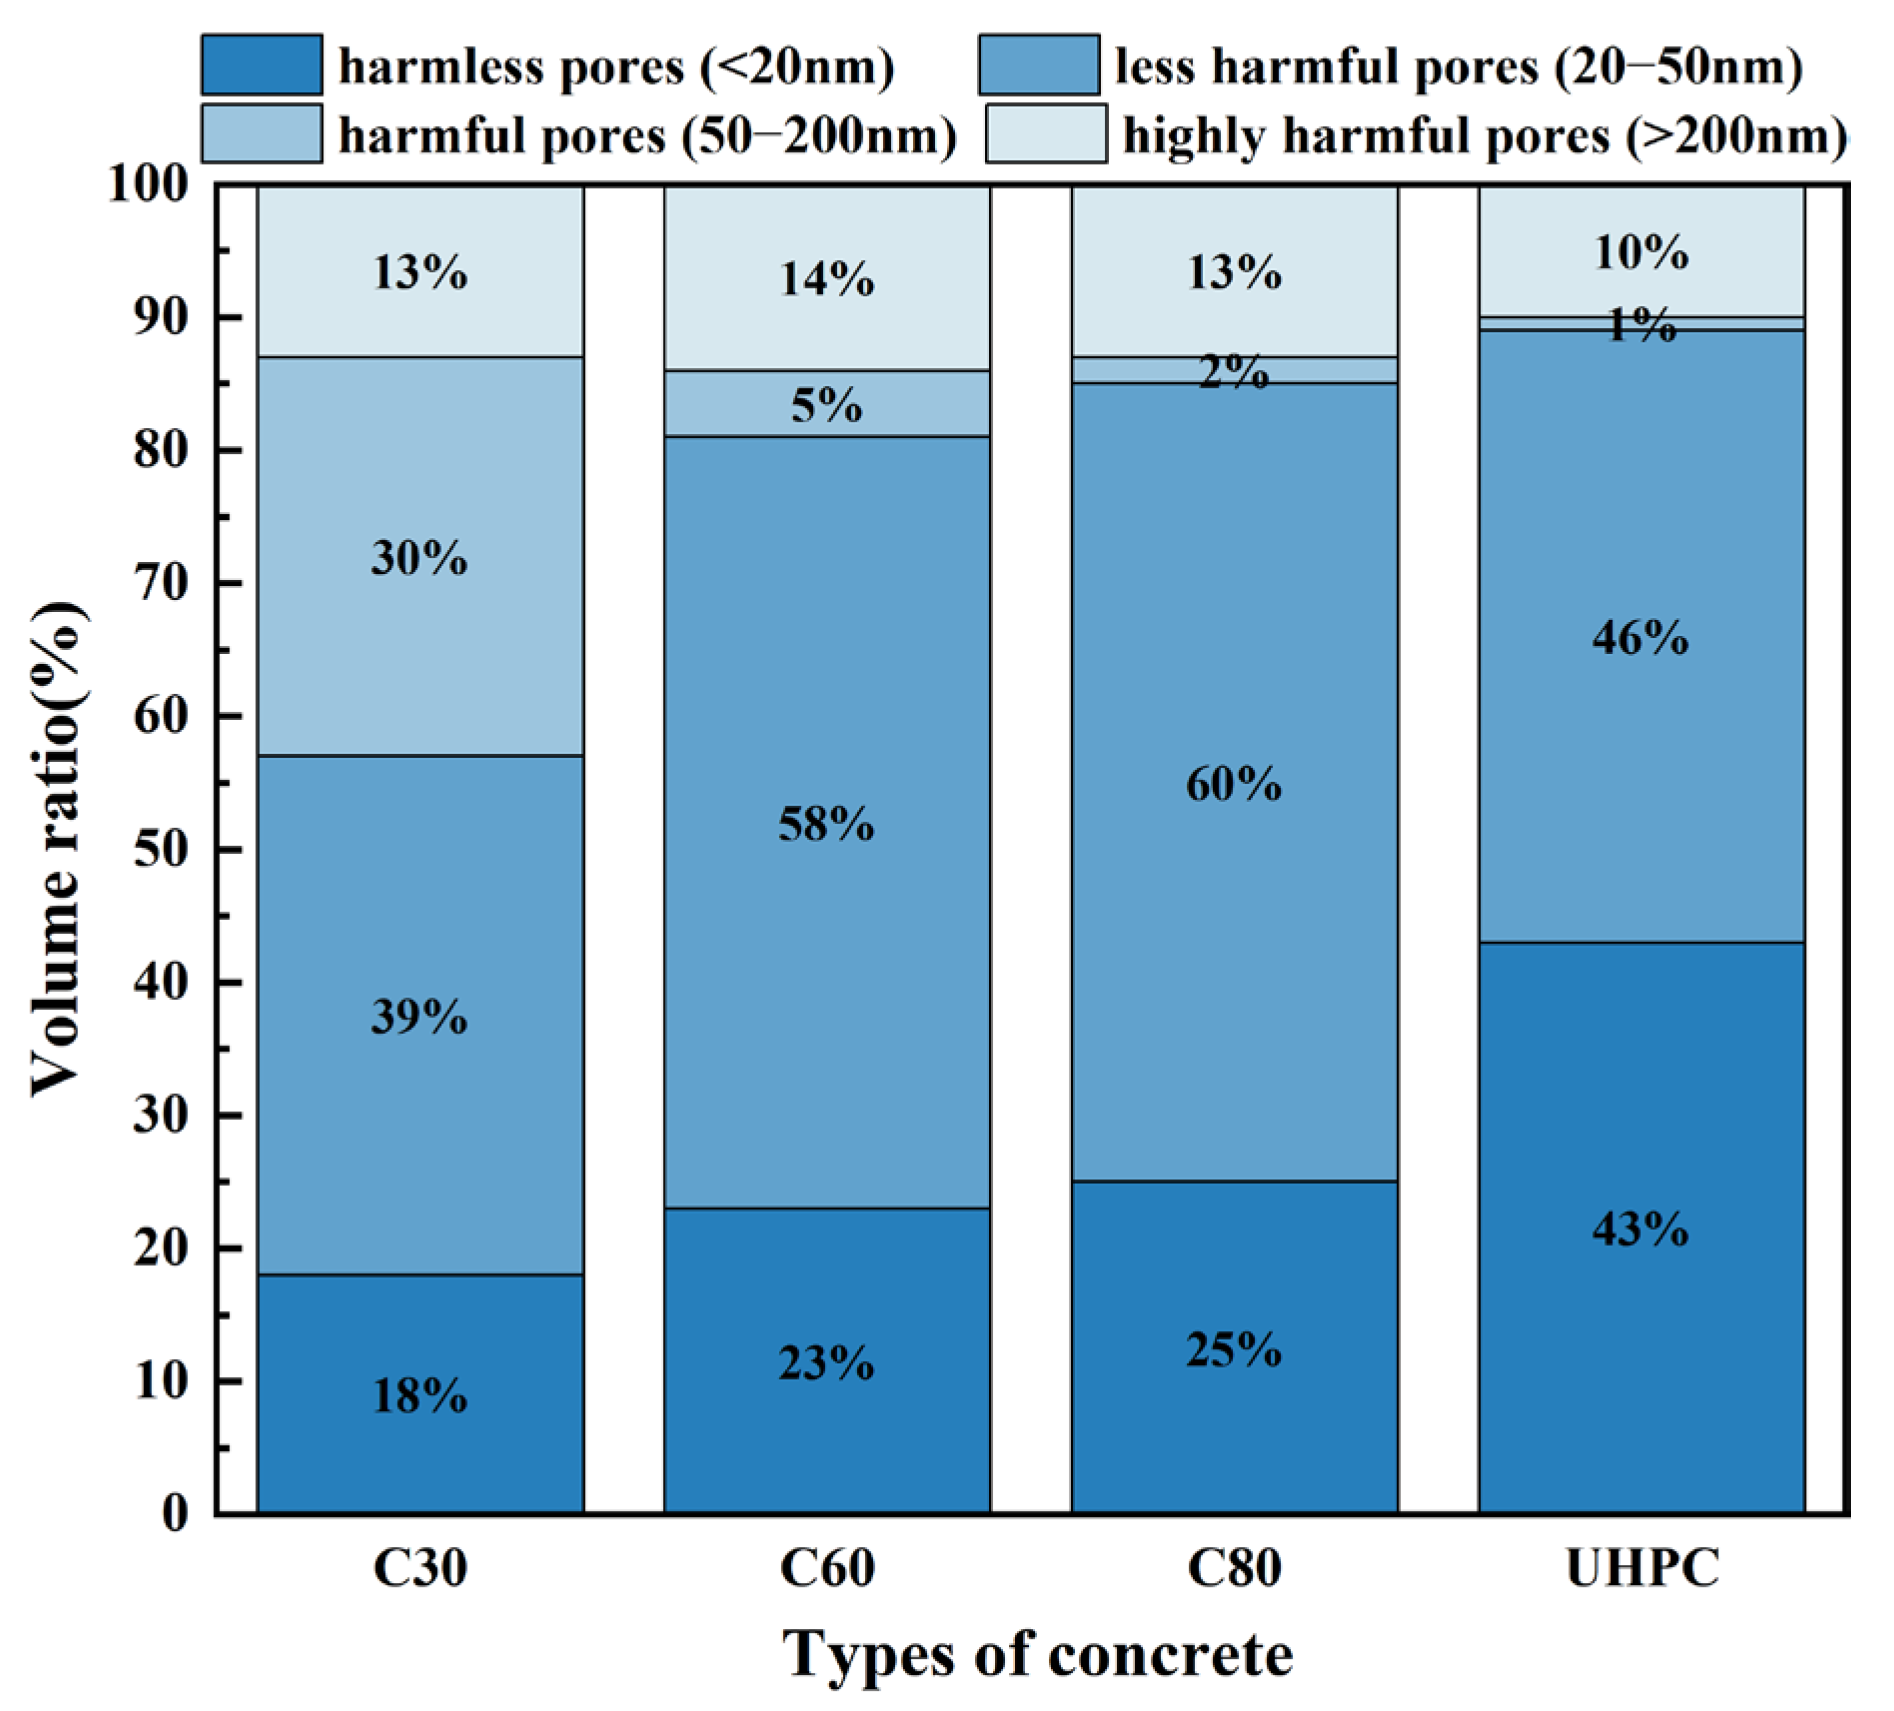
  • Significant differences in capillary water absorption rates are observed among the various types of concrete, primarily due to differences in their compactness. Lower strength grades, like C30, exhibit higher porosity, including a greater proportion of harmful pores, which enhances water transmission pathways and pore connectivity. By reducing the water–binder ratio and optimizing the composition of cementitious materials, the compactness of concrete improves, leading to reduced porosity and a lower proportion of harmful pores, thereby decreasing capillary water absorption.
  • 1H low-field NMR analysis reveals that external water initially enters larger capillary pores through capillary absorption, filling gel pores near these capillary pores. Over time, as larger capillary pores reach partial saturation, water begins to migrate into smaller capillary pores. Larger capillary pores continue to absorb water at a diminished rate until a dynamic equilibrium is achieved. For pores smaller than gel pores, water migrates predominantly in the form of water vapor.
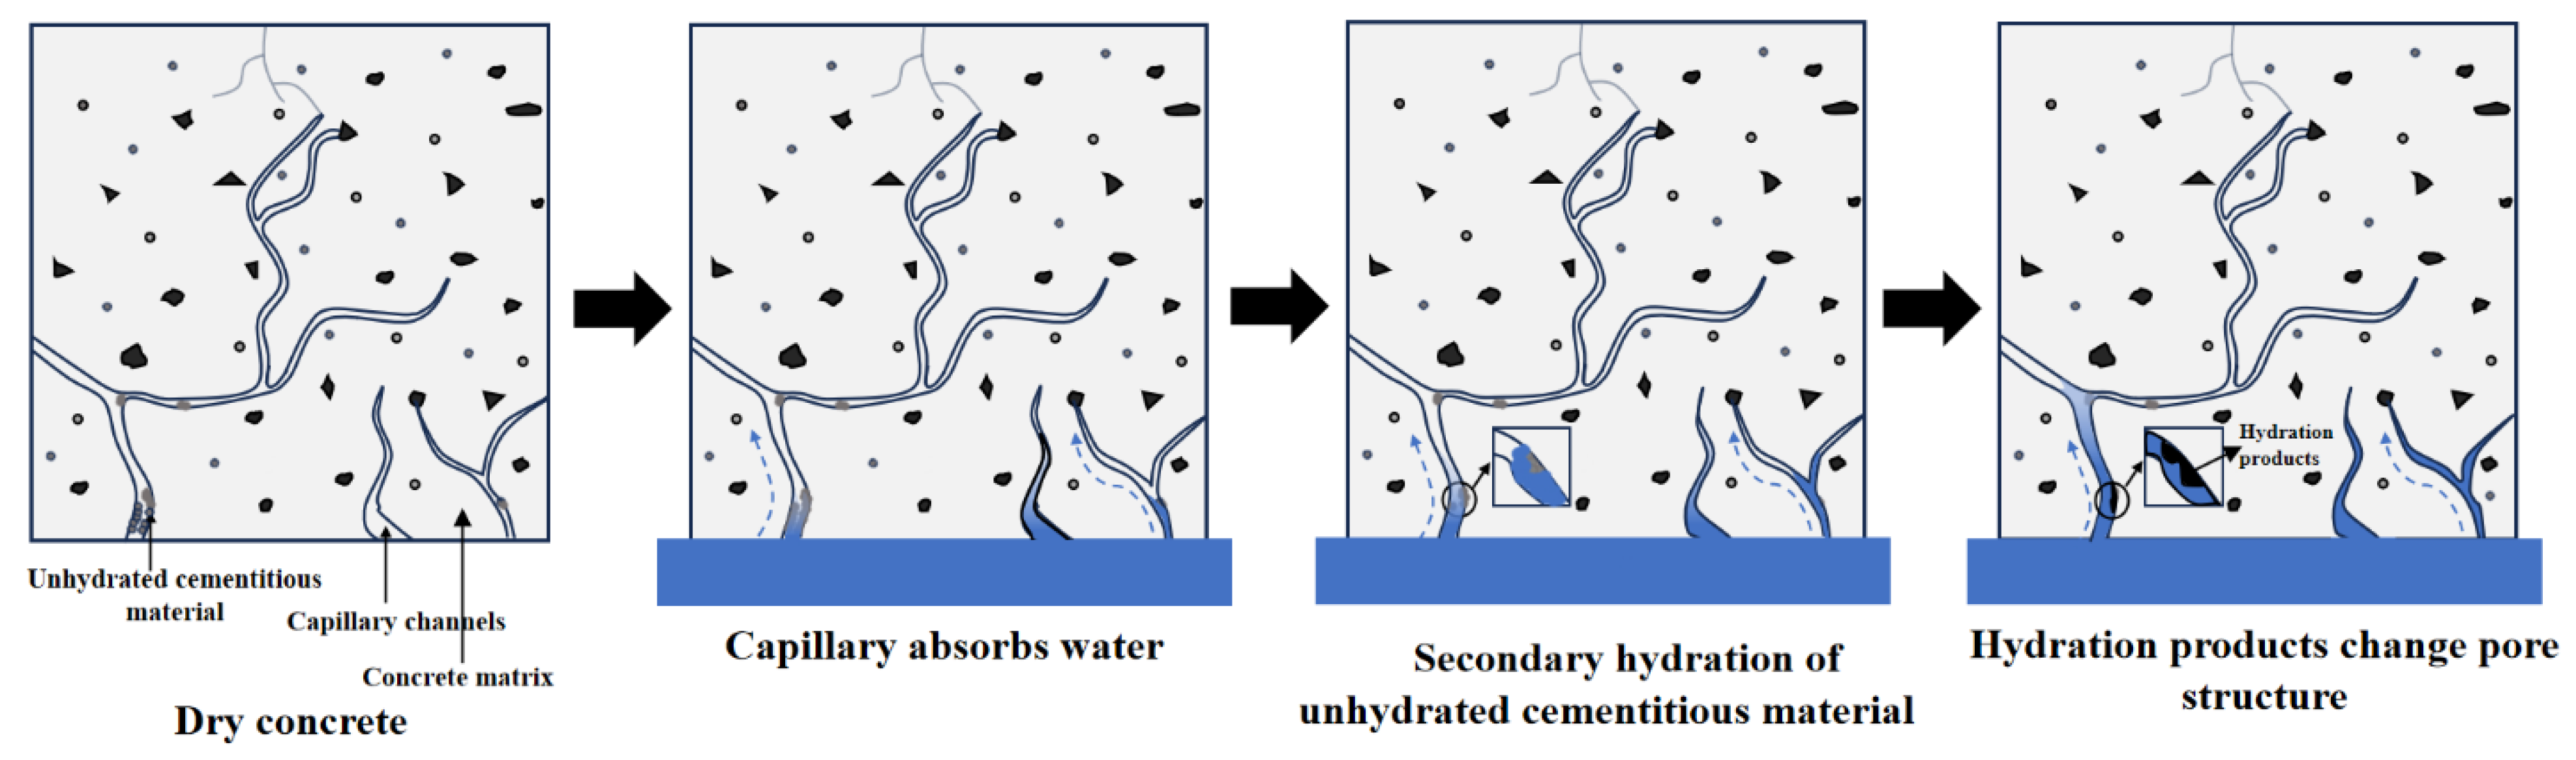
  • Over extended periods, the capillary water absorption rate deviates from a linear relationship. This phenomenon is mainly attributed to water entering the concrete and reacting with unhydrated cement particles, producing additional C-S-H. The formation of C-S-H fills smaller pores, altering the internal pore structure, reducing pore connectivity, and increasing pore tortuosity. This phenomenon, termed the “C-S-H blocking effect”, plays a key role in reducing water absorption rates.
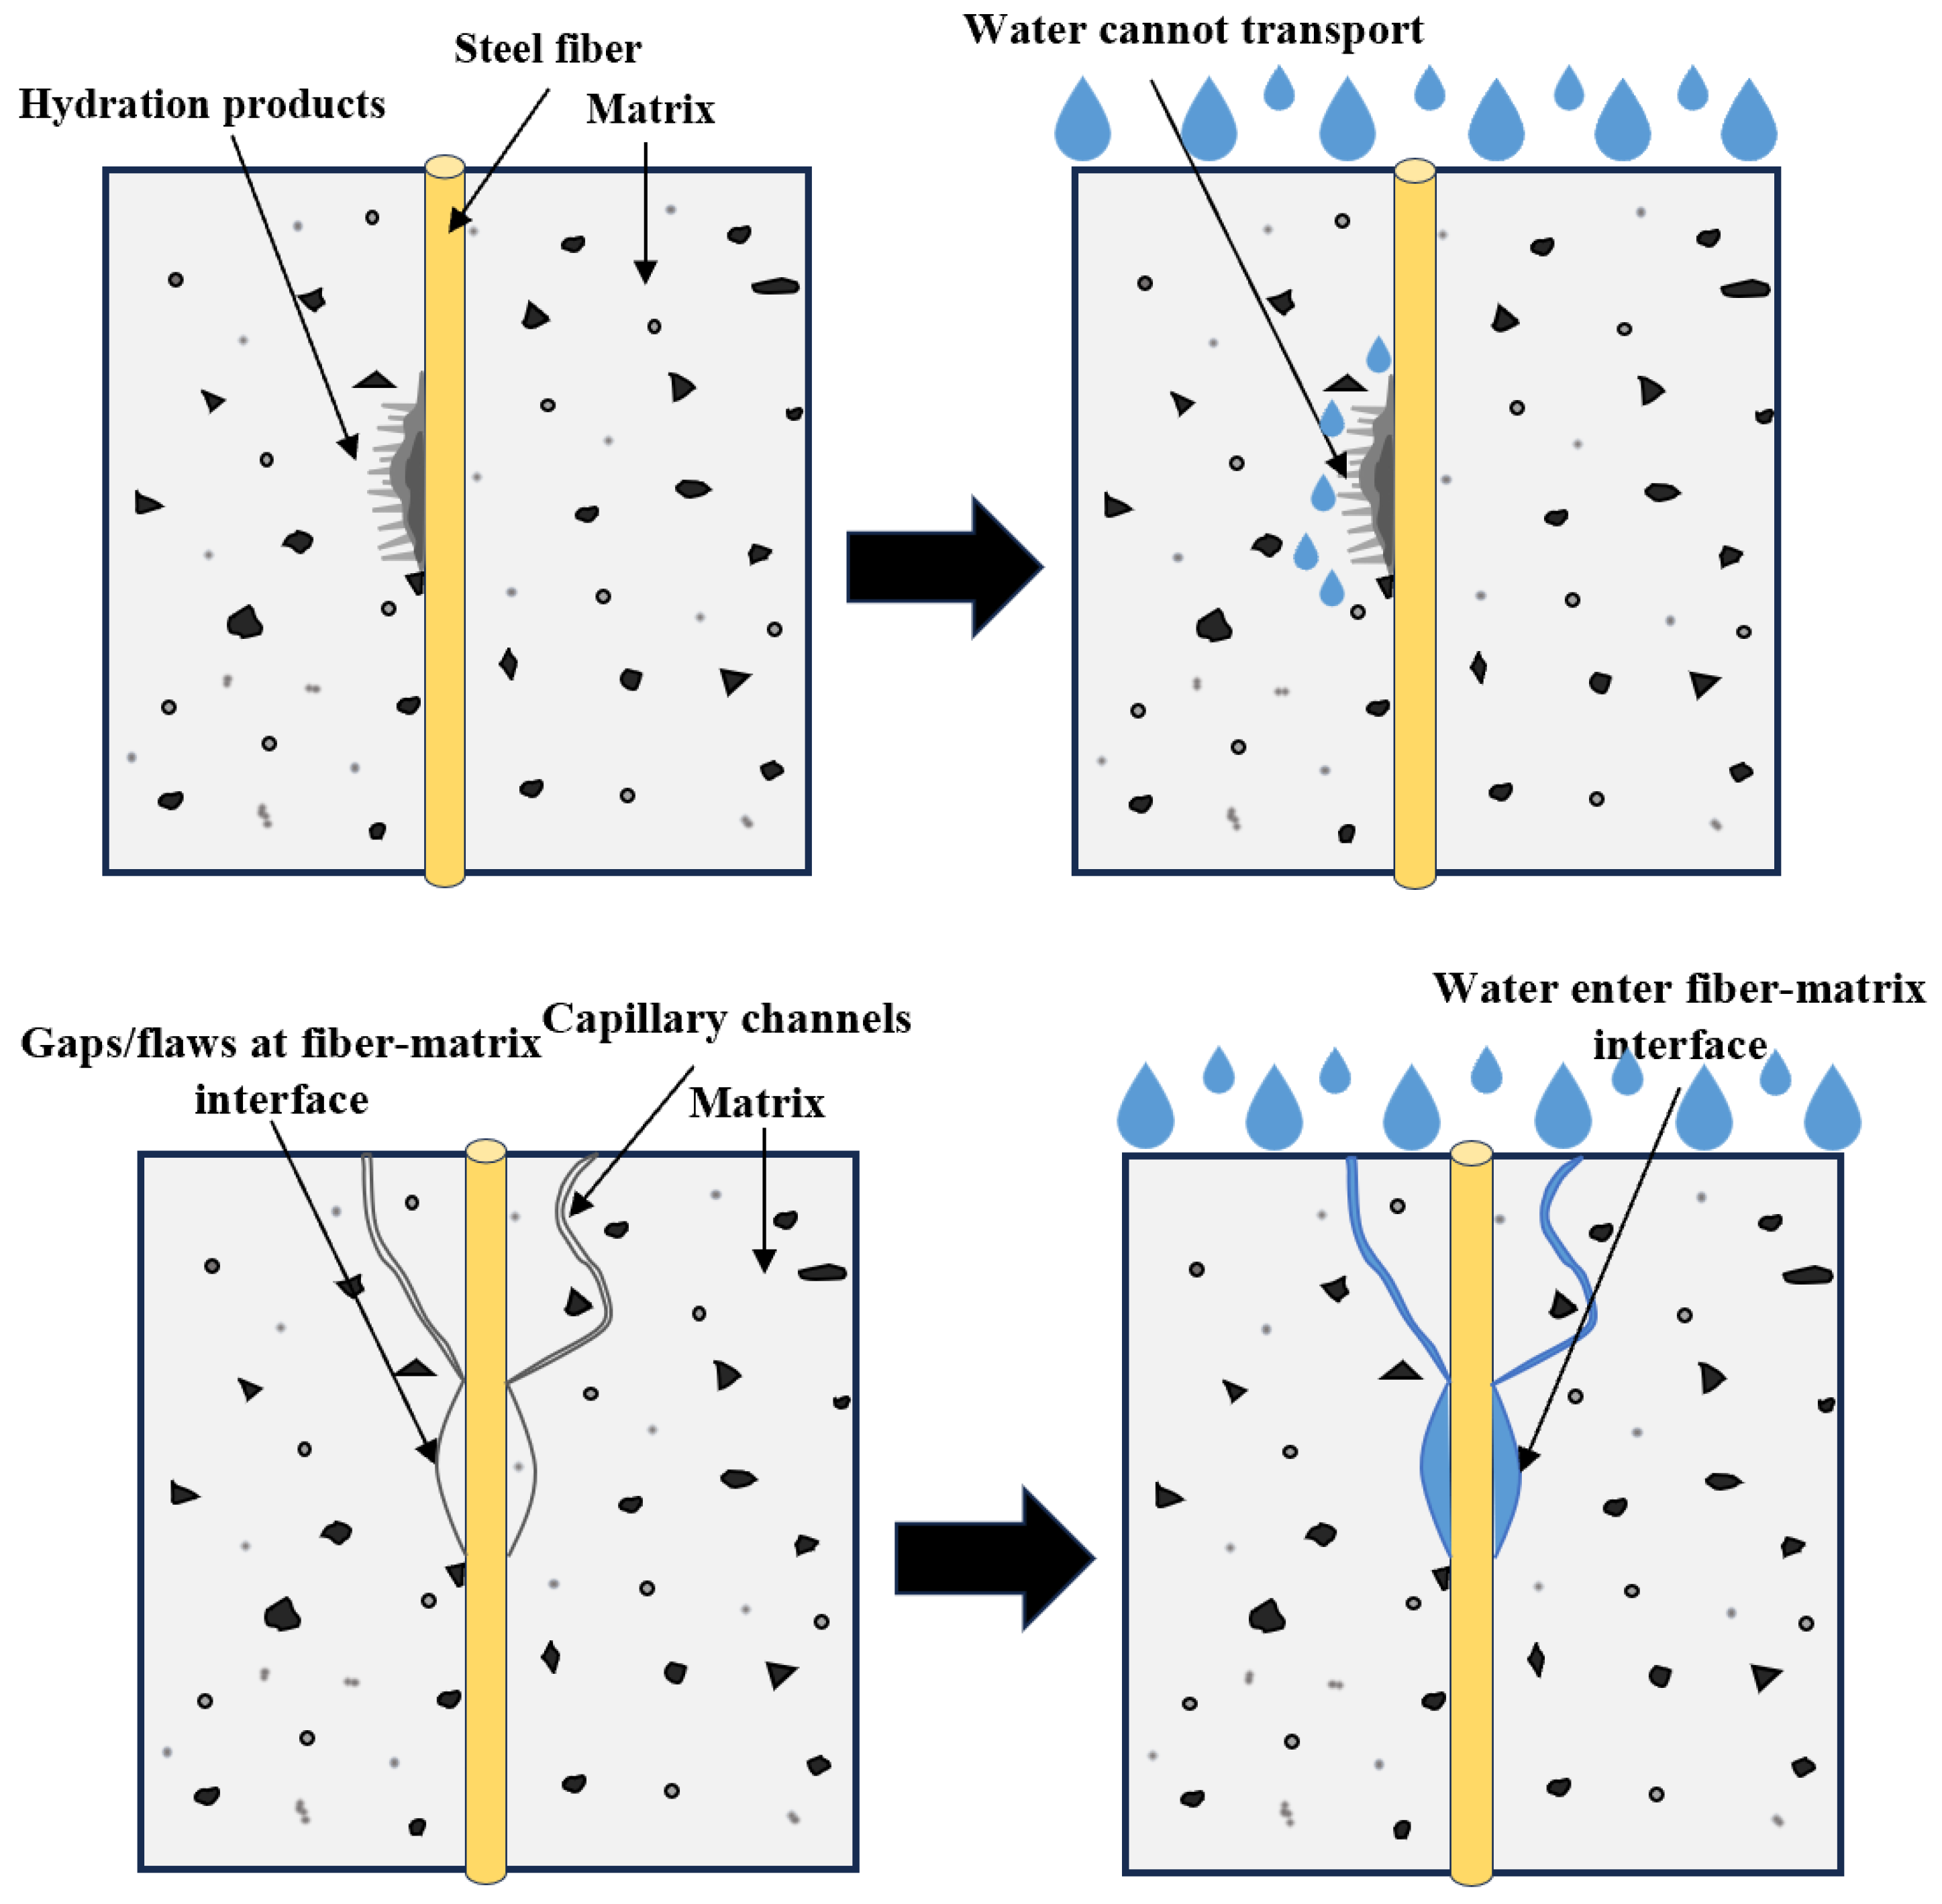
  • Steel fibers influence water migration in concrete primarily through the following two mechanisms: the interfacial effect between steel fibers and the matrix and the blocking effect of steel fibers. These effects collectively determine the extent to which steel fibers affect the capillary water absorption rate of concrete.
  • This study systematically investigates the effects and mechanisms of varying steel fiber contents on the capillary water absorption behavior of concrete. However, the dynamic transport process of water within the material’s microstructure was not directly monitored in real time. Future research should aim to integrate advanced, non-destructive evaluation methods capable of providing sufficient spatio-temporal resolution to track water movement dynamically. Coupling such experimental approaches with refined theoretical modeling will be crucial for fully elucidating the kinetic mechanisms underlying the water absorption process.

Author Contributions

F.N.: conceptualization, investigation, methodology, data curation, writing—original draft, and writing—review and editing. Q.S.: investigation and methodology. S.Z.: investigation, and methodology. H.Y.: investigation, project administration, and data curation. Z.S.: formal analysis, data curation, funding acquisition, and writing—review and editing. J.Y.: supervision, resources, and writing—review and editing. All authors have read and agreed to the published version of the manuscript.

Funding

This research was funded by the National Natural Science Foundation of China, grant no. 52408284, grant 52402033, and no. 52278272; the Postdoctoral Fellowship Program of CPSF, grant no. GZB20240532; the China Postdoctoral Science Foundation, grant no. 2024M76242; the Science and Technology Commission of Shanghai Municipality, grant no. 23DZ1203500; and the Expert Workstation Project of the Science and Technology Department of Yunnan Province, grant no. 202105AF150243. The authors also acknowledge the Experimental Center of Materials Science and Engineering in Tongji University.

Data Availability Statement

The data presented in this study are available upon request from the corresponding author. The data are not publicly available due to continuing research.

Conflicts of Interest

The authors declare no conflicts of interest.

References

  1. Monteiro, P.; Miller, S.A.; Horvath, A. Towards sustainable concrete. Natu. Mater. 2017, 16, 698–699. [Google Scholar] [CrossRef] [PubMed]
  2. Tian, Y.; Zhang, G.; Ye, H.; Zeng, Q.; Zhang, Z.; Tian, Z.; Jin, X.; Jin, N.; Chen, Z.; Wang, J. Corrosion of steel rebar in concrete induced by chloride ions under natural environments. Constr. Build. Mater. 2023, 369, 130504. [Google Scholar] [CrossRef]
  3. Gan, L.; Zou, Z.; Zhang, Z.; Zhang, H.; Gu, H. Investigation on the evolution of concrete pore structure under freeze-thaw and fatigue loads. J. Build. Eng. 2024, 97, 110914. [Google Scholar] [CrossRef]
  4. Qiu, H.; Liang, C.; Tu, B.; Liu, L.; Zhang, F. Study on mechanical properties of cemented backfill with different mineral admixtures. Constr. Build. Mater. 2023, 367, 130251. [Google Scholar] [CrossRef]
  5. Liu, Z.; Gan, L.; Rong, H. Durability of concrete exposed to laboratory-simulated marine microbe-induced corrosion. Constr. Build. Mater. 2023, 400, 132563. [Google Scholar] [CrossRef]
  6. Castro, J. Moisture Transport in Cement Based Materials: Application to Transport Tests and Internal Curing. Ph.D. Thesis, Purdue University, West Lafayette, IN, USA, 2011. [Google Scholar]
  7. Singla, A.; Šavija, B.; Sluys, L.J.; Rodríguez, R.C. Modelling of capillary water absorption in sound and cracked concrete using a dual-lattice approach: Computational aspects. Constr. Build. Mater. 2022, 320, 125826. [Google Scholar] [CrossRef]
  8. Wang, X.; Sun, M.; Guo, S. Water absorption characteristics of cement-based materials based on the chemical reaction. Constr. Build. Mater. 2019, 220, 607–614. [Google Scholar] [CrossRef]
  9. Liu, B.; Luo, G.; Xie, Y. Effect of curing conditions on the permeability of concrete with high volume mineral admixtures. Constr. Build. Mater. 2018, 167, 359–371. [Google Scholar] [CrossRef]
  10. Fang, J.; Jiang, C.; Gu, X. Moisture transports in high-cycle compressive fatigue-damaged concrete. Constr. Build. Mater. 2023, 409, 133994. [Google Scholar] [CrossRef]
  11. Bahmani, H.; Mostafaei, H.; Santos, P.; Chamasemani, N. Enhancing the Mechanical Properties of Ultra-High-Performance Concrete (UHPC) Through Silica Sand Replacement with Steel Slag. Buildings 2024, 14, 3520. [Google Scholar] [CrossRef]
  12. Wang, L.; Yin, H.; Zou, K. Mesoscopic method for simulating the two-dimensional capillary water absorption process of concrete. Chin. J. Comput. Mech. 2024, 7, 1–8. (In Chinese) [Google Scholar]
  13. Zhang, H.; Chen, W.; He, B.; Zhu, X.; Jiang, Z. Compressive behaviour and microstructure of geopolymer mortar subjected to cryogenic freeze-thaw cycle: Effects of cycles and polypropylene fiber. Cem. Concr. Compos. 2024, 149, 105505. [Google Scholar] [CrossRef]
  14. Multon, S.; Verdier, J.; Cagnon, H.; Nehme, A.; Sogbossi, H. Numerical analysis of concrete permeability measurements in laboratory and in field. Cem. Concr. Res. 2024, 178, 107455. [Google Scholar] [CrossRef]
  15. Du, W.; Yu, F.; Qiu, L.; Guo, Y.; Wang, J. Effect of Steel Fibers on Tensile Properties of Ultra-High-Performance Concrete: A Review. Material. 2024, 17, 1108. [Google Scholar] [CrossRef]
  16. Mu, R.; Chen, J.; Chen, X.; Diao, C.; Wang, X. Effect of the orientation of steel fiber on the strength of ultra-high-performance concrete (UHPC). Constr. Build. Mater. 2023, 406, 133431. [Google Scholar] [CrossRef]
  17. He, B.; Zhu, X.; Zhang, H.; Sun, D.; Banthia, N.; Jiang, Z. Nano-engineering steel fiber for UHPC: Implication for varying cryogenic and elevated exposure. Cem. Concr. Compos. 2025, 156, 105851. [Google Scholar] [CrossRef]
  18. Yu, L.; Liu, Y.; Liu, Y. Advanced monitoring of damage behavior and 3D visualization of fiber distribution in assessing crack resistance mechanisms in steel fiber-reinforced concrete. J. Build. Eng. 2024, 97, 110980. [Google Scholar] [CrossRef]
  19. Filazi, A.; Tortuk, S.; Pul, M. Determination of optimum blast furnace slag ash and hemp fiber ratio in cement mortars. Structures 2023, 57, 105024. [Google Scholar] [CrossRef]
  20. GB/T 50081-2019; Standard for Test Methods of Concrete Physical and Mechanical Properties. Inspection and Quarantine of the People’s Republic of China: Beijing, China, 2019.
  21. ASTM International. 1585; Standard Test Method for Measurement of Rate of Absorption of Water by Hydraulic-Cement Concretes. ASTM International: West Conshohocken, PA, USA, 2004.
  22. Stephen, W. Flow in porous media I: A theoretical derivation of Darcy’s law. Trans. Por. Med. 1986, 1, 3–25. [Google Scholar]
  23. GB/T 21650.1-2008; Pore Size Distribution and Porosity of Solid Materials by Mercury Porosimetry and Gas Adsorption. Part 1: Mercury Porosimetry. Inspection and Quarantine of the People’s Republic of China: Beijing, China, 2008.
  24. Hu, Z.; Wyrzykowski, M.; Scrivener, K.; Lura, P. A novel method to predict internal relative humidity in cementitious materials by 1H NMR. Cem. Concr. Res. 2018, 104, 80–93. [Google Scholar] [CrossRef]
  25. De, K.S.; Mukherjee, A. A multiscale model including the effect of pores, aggregates and their interfaces for moisture diffusion in concrete. Cem. Concr. Compos. 2020, 111, 103595. [Google Scholar] [CrossRef]
  26. Hwang, W.; Ann, K.Y. Determination of rust formation to cracking at the steel-concrete interface by corrosion of steel in concrete. Constr. Build. Mater. 2023, 367, 130215. [Google Scholar] [CrossRef]
  27. Liu, H.; Sun, Z.; Yang, J.; Ji, Y. A novel method for semi-quantitative analysis of hydration degree of cement by 1H low-field NMR. Cem. Concr. Res. 2021, 141, 106329. [Google Scholar] [CrossRef]
  28. Villagrán-Zaccardi, Y.A.; Alderete, N.M.; Benítez, A.; Carrasco, M.F.; Corallo, P.; López, R.; Rios, C. Relationship between sorptivity coefficients of concrete as calculated from the evolution of water uptake versus t0.5 or t0.25. Constr. Build. Mater. 2022, 342, 128084. [Google Scholar] [CrossRef]
  29. Srimook, P.; Ogawa, K.; Maruyama, I. Meso-scale Modeling of Anomalous Moisture Transport in Concrete Considering Microstructural Change of Cement-based Material. J. Adv. Concr. Technol. 2024, 22, 344–371. [Google Scholar] [CrossRef]
  30. Pradhan, B.; Nagesh, M.; Bhattacharjee, B. Prediction of the hydraulic diffusivity from pore size distribution of concrete. Cem. Concr. Res. 2004, 35, 1724–1733. [Google Scholar] [CrossRef]
  31. Rucker-Gramm, P.; Beddoe, E. Effect of moisture content of concrete on water uptake. Cem. Concr. Res. 2009, 40, 102–108. [Google Scholar] [CrossRef]
  32. Fischer, N.; Haerdtl, R.; McDonald, J.P. Observation of the redistribution of nanoscale water filled porosity in cement based materials during wetting. Cem. Concr. Res. 2015, 68, 148–155. [Google Scholar] [CrossRef]
  33. Jennings, H.; Kropp, J.; Scrivener, K. The Modelling of Microstructure and its Potential for Studying Transport Properties and Durability; Springer: Dordrecht, The Netherlands, 1996; pp. 54–78. [Google Scholar]
  34. Prayuda, H.; Monika, F.; Cahyati, M.; Saleh, F. Self Fiber Compacting Concrete (SFCC) Properties Incorporated with Silica Fume and Fiber. Civ. Eng. J. 2020, 29, 52–60. [Google Scholar]
Figure 1. Illustration of the capillary water absorption test setup.
Buildings 15 01542 g001
Figure 2. Time evolution of cumulative capillary water absorption for concrete with different strength grades: (a) C30, (b) C60, (c) C80, and (d) UHPC.
Buildings 15 01542 g002
Figure 3. Linear fits to the cumulative capillary water absorption (I) versus square root of time (T1/2) data from the initial 6 h of testing. Results are shown for concrete specimens with different strength grades: (a) C30, (b) C60, (c) C80, and (d) UHPC.
Buildings 15 01542 g003aBuildings 15 01542 g003b
Figure 4. Linear fits to the cumulative capillary water absorption (I) versus square root of time (T1/2) data from 1 day to 12 days. Results are shown for concrete specimens with different strength grades: (a) C30, (b) C60, (c) C80, and (d) UHPC.
Buildings 15 01542 g004
Figure 5. Integral and differential curves of the pore size distribution: (a) C30, (b) C60, (c) C80, (d) UHPC.
Buildings 15 01542 g005
Figure 6. Pore size distribution in concrete of different strength grades.
Buildings 15 01542 g006
Figure 7. Distribution of NMR T2 of specimens after capillary water absorption: (a) C30, (b) C60, (c) C80, (d) UHPC.
Buildings 15 01542 g007
Figure 8. Pore size distribution of paste specimens after 6 h of capillary water absorption.
Buildings 15 01542 g008
Figure 9. Illustration of the capillary water absorption mechanism.
Buildings 15 01542 g009
Figure 10. Depiction of the interface interaction between steel fibers and concrete matrix.
Buildings 15 01542 g010
Figure 11. Depiction of the blocking effect of steel fibers on capillary water transport.
Buildings 15 01542 g011
Figure 12. SEM images of the interfaces between steel fibers and the matrix: (a) C30, (b) C60, (c) C80, (d) UHPC.
Buildings 15 01542 g012
Table 1. Chemical composition of Portland cement, fly ash, GGBFS, and silica fume (wt.%).
Raw MaterialSiO2CaOAl2O3Fe2O3SO3MgOK2OTiO2Na2O
Cement17.0065.054.953.722.930.960.690.280.11
Fly ash45.692.9442.202.720.520.310.532.040.13
GGBFS29.9844.4014.500.502.186.200.250.800.34
Silica fume84.921.040.633.440.891.182.5800.97
Table 2. Mix ratio of concrete (kg/m3).
MixturesCementFly AshGGBFSSilica FumeFine
Aggregate
Coarse
Aggregate
PCESteel
Fiber
Water
C30-0350///80010450.0170190
C30-1350///80010450.01720190
C30-2350///80010450.01740190
C30-3350///80010450.01760190
C60-035060100/73010000.0200160
C60-135060100/73010000.02020160
C60-235060100/73010000.02040160
C60-335060100/73010000.02060160
C80-038070120/7209920.0220148
C80-138070120/7209920.02220148
C80-238070120/7209920.02240148
C80-338070120/7209920.02260148
UHPC-07001001001001000/0.0600170
UHPC-17001001001001000/0.06080170
UHPC-27001001001001000/0.060160170
UHPC-37001001001001000/0.060240170
Table 3. 28-day compressive strength of concrete across various strength grades.
Concrete Strength GradeCompressive Strength (MPa)
Concrete-0Concrete-1Concrete-2Concrete-3
C3032.535.339.140.8
C6062.064.566.368.4
C8084.186.388.692.2
UHPC108.7115.5122.7128.3
Table 4. Comparison of capillary water absorption for concrete with different strength grades.
Concrete Strength GradeSpecimen NumberThe Initial Water Absorption (cm/s1/2)The Secondary Water Absorption (cm/s1/2)
C30C30-09.82 × 10−46.77 × 10−4
C30-19.98 × 10−46.61 × 10−4
C30-21.16 × 10−36.78 × 10−4
C30-38.82 × 10−46.69 × 10−4
C60C60-04.19 × 10−41.01 × 10−4
C60-14.12 × 10−41.05 × 10−4
C60-24.08 × 10−41.29 × 10−4
C60-34.59 × 10−41.19 × 10−4
C80C80-02.36 × 10−44.78 × 10−5
C80-12.88 × 10−44.69 × 10−5
C80-22.25 × 10−44.56 × 10−5
C80-33.23 × 10−43.73 × 10−5
UHPCUHPC-07.17 × 10−52.95 × 10−5
UHPC-13.65 × 10−52.77 × 10−5
UHPC-24.74 × 10−52.19 × 10−5
UHPC-35.69 × 10−52.43 × 10−5
Disclaimer/Publisher’s Note: The statements, opinions and data contained in all publications are solely those of the individual author(s) and contributor(s) and not of MDPI and/or the editor(s). MDPI and/or the editor(s) disclaim responsibility for any injury to people or property resulting from any ideas, methods, instructions or products referred to in the content.

