Article

Experimental and Analytical Study on the Flexural Performance of Layered ECC–Concrete Composite Beams

1
GuangXi Beitou Highway Construction and Investment Group Co., Ltd., Nanning, China
2
College of Civil Science and Engineering, Yangzhou University, Yangzhou 225127, China
3
School of Transportation, Southeast University, Nanjing 211189, China
*
Authors to whom correspondence should be addressed.
Buildings 2025, 15(10), 1592; https://doi.org/10.3390/buildings15101592
Submission received: 20 March 2025 / Revised: 30 April 2025 / Accepted: 2 May 2025 / Published: 8 May 2025
(This article belongs to the Special Issue UHPC Materials: Structural and Mechanical Analysis in Buildings)

Abstract

:
Engineered Cementitious Composite (ECC) has emerged as a promising solution with which to address the longstanding challenge of cracking in the tensile zone of reinforced concrete beams. This study conducts an experimental and analytical exploration of the flexural performance of ECC-concrete composite beams reinforced with hot-rolled ribbed steel bars. Sixteen beams, featuring diverse reinforcement ratios and ECC layer thicknesses, underwent rigorous testing through a four-point bending setup. The experimental findings underscore a substantial improvement in crack resistance and flexural bearing capacity of ECC-concrete composite beams reinforced with steel bars. Building on these results, a theoretical model was formulated to predict the moment-deflection responses of ECC-concrete composite beams incorporating steel bars. Furthermore, practical and simplified methods were introduced to predict flexural bearing capacity and effective moment of inertia, as well as anticipate failure modes, offering a user-friendly approach for engineering applications. Validation of the proposed approaches was achieved through simulation results, demonstrating a high degree of accuracy when compared with the experimental outcomes. Moreover, the average crack width at serviceability limit states of composite beams was sensitive to specimen size and the yield strength of steel bars, and a size effect was also observed for ductility expressed as deflection.

1. Introduction

The inherent low tensile strength and limited ductility of normal concrete contribute to the development of small cracks in reinforced concrete (RC) structures under modest loads. When subjected to a combination of loads and environmental factors, these small cracks can progress into larger ones, giving rise to various durability challenges, including steel bar corrosion and compromised impermeability [1,2,3]. To address these issues, researchers have explored high-performance fiber-reinforced cementitious composites, and among them, Engineered Cementitious Composite (ECC) has emerged, with their notable properties [4] and the use of layered sections of normal weight and lightweight concrete mixtures in structural beams being able to reduce their self-weight [5]. ECC distinguishes itself through its ability to exhibit multiple micro-cracks and strain-hardening characteristics [6,7]. By achieving a meticulous balance between fiber and matrix, ECC can attain an ultimate tensile strain ranging from 3 to 7% while maintaining a tensile strength exceeding 4 MPa [8,9,10]. These significant tensile properties of ECC are crucial for improving its structural performance in terms of its deformation and load-bearing capacities. Experimental tests have demonstrated that micro-cracks in ECC are densely distributed, with a maximum width of less than 100 μm [11,12]. This is a marked departure from the fewer and larger cracks typically found in conventional concrete, resulting in improved durability and ductility.
Typical Poly Vinyl Alcohol (PVA)–ECC material contains about 2% PVA fibers. It has been estimated that for the same fiber volume fraction, the cost per meter of ECC is higher than that of conventional concrete and glass/steel-fiber-reinforced concrete [13]. To achieve a better economy, ECC should be used partially as a layer in the tensile zone of RC beams to fully leverage its advantages. The application of a small layer of ECC on the tensile side of RC beams has been proven to effectively improve the durability of both concrete and steel reinforcement [14,15,16]. It was found that the ECC layer can control crack widths to approximately 0.05 mm at serviceability limit states and 0.2 mm at the ultimate limit states, thereby preventing the migration of aggressive substances into the concrete.
Several experimental studies have been conducted to further investigate the bending performance of ECC–concrete composite beams. These studies consistently demonstrate that substituting ECC for traditional concrete in the tensile zone of RC beams slightly enhances the flexural bearing capacity and deformation ability [17] but significantly reduces the crack width before the yielding of the tensile reinforcement bar [18,19,20]. Therefore, the integration of ECC in the tensile zone offers a promising avenue to enhance the durability of composite beams due to the noticeable improvement in waterproofing and corrosion resistance [21]. Theoretical and numerical investigations have complemented these experiments, providing valuable insights into the flexural performance of ECC–concrete composite beams [22,23,24]. Notably, analyses have indicated that the flexural performance of ECC–concrete composite beams is mainly affected by three key parameters: the thickness of the ECC layer, the tensile reinforcement ratio, and the tensile reinforcement strength [23]. However, these studies often employed low-yield-strength steel bars, such as 335 MPa or 400 MPa, in small-sized sections (e.g., 80 mm × 120 mm or 150 mm × 200 mm). Fewer studies have explored the flexural performance of large-sized ECC–concrete composite beams, particularly those reinforced with high-yield-strength steel bars. The previous experimental investigations on the flexural performance of RC beams demonstrate that the specimen dimensions have no significant effect on the flexural capacity [25], but have a significant impact on the displacement ductility coefficient [26]. Moreover, given the direct relationship between the steel stress and crack width in flexural RC beams [27], the crack width and midspan deflection of RC beams reinforced with high-yield-strength steel bars were larger than those of the control RC beams reinforced with low-yield-strength steel bars [28]. Therefore, evaluating the performance of large-sized ECC–concrete composite beams reinforced with high-yield-strength steel bars becomes crucial. Additionally, the analytical techniques used for assessing bending performance and the development of simplified calculation formulas for the bending bearing capacity and effective moment of inertia warrant attention. An important consideration for the durability of composite beams is the potential occurrence of local delamination between the concrete and ECC layers, as observed in cases with a 25 mm ECC layer [29]. In these instances, the ECC–concrete interface was precisely at the centroid of the longitudinal reinforcement. To address this, it is essential to determine the appropriate thickness of the ECC layer to fully cover the longitudinal reinforcement and ensure the composite beam’s long-term durability. This study aims to address these gaps in understanding, offering a comprehensive evaluation of the flexural performance of large-sized ECC–concrete composite beams reinforced with high-yield-strength steel bars, accompanied by analytical techniques and simplified calculation formulas.
In the existing body of ECC studies, PVA fibers from Kuraray Co., Ltd., have been predominantly utilized, which showcase a notable tensile strain capacity of 3–7%. However, these imported PVA fibers are relatively expensive and can be challenging to procure compared to locally sourced PVA fibers. In response to this, an ECC with local ingredients, including domestic PVA fibers and fly ash, was developed [30]. The cost-effective ECC exhibits a tensile strain capacity exceeding 3%, with a tensile strength of 5 MPa and a compressive strength of 30 MPa. This improvement opens avenues for optimizing design strategies to enhance the bending performance while concurrently reducing costs. However, despite the promising attributes of this cost-effective ECC, there remains a gap in research on its structural behavior. Further investigations into the structural characteristics and performance of this cost-effective PVA-ECC are essential to providing a comprehensive understanding of its applicability and advantages in various structural applications.
This study focuses on the flexural performance of full-scale steel-reinforced composite beams with an ECC layer at their tensile sides from both experimental and analytical perspectives. In particular, this study has four objectives: (1) to experimentally investigate the effects of various parameters, including the longitudinal reinforcement ratio and the ECC layer thickness, on the flexural performance of the full-scale composite beams reinforced with high-yield-strength steel bars; (2) to develop a theoretical model to predict the moment–deflection responses of composite beams; (3) to propose simplified methods for predicting the flexural bearing capacity, the effective moment of inertia and the failure mode of ECC–concrete composite beams; and (4) to evaluate the effect of specimen size on the flexural performance of steel-reinforced composite beams.
In this study, sixteen beams were meticulously prepared to systematically investigate the influences of various parameters on the flexural performance of ECC–concrete composite beams. These beams were specifically reinforced with high-yield-strength steel bars (500 MPa). The experimental outcomes underwent a comprehensive analysis to delineate crucial aspects such as the failure mode, strain distribution across the beam depth at the midspan section, moment–deflection curves, cracking moment, ultimate moment, crack propagation patterns, crack width, and ductility. Furthermore, the research put forward an analytical model designed to predict the moment–deflection responses of ECC–concrete composite beams. Additionally, simplified methods were introduced for predicting the flexural bearing capacity, the effective moment of inertia, and the failure mode of ECC–concrete composite beams. The dependability and accuracy of both the theoretical model and the simplified methods were validated through a rigorous comparison with the experimental results.

2. Experimental Program

2.1. Specimen Preparation

A total of sixteen simply supported RC beams with a 440 mm or 400 mm depth (h), 200 mm width (b), and 3200 mm length were fabricated and subjected to four-point bending tests, as shown in Figure 1. The investigated variables included the thickness of the ECC layer, the reinforcement ratio, and the cover thickness of rebar. The details of all test beams are presented in Table 1. For each beam specimen, the first two characters of the notation “RC” are an abbreviation for reinforced concrete, the third character “E” represents the incorporation of ECC, the first two numbers “16” or “25” correspond to the diameter of the longitudinal steel bar, the third number “2” or “3” represents the number of the longitudinal steel bar, and the fourth number indicates the type of clear cover for rebar and the type of ECC layer thickness (1-clear cover of 30 mm and ECC layer with the same centroid as the tensile reinforcement, 2-clear cover of 50 mm and ECC layer with the same centroid as the tensile reinforcement, 3-clear cover of 50 mm and ECC layer without the same centroid as the tensile reinforcement).
Among the sixteen beams, four were RC control beams, and the remaining twelve were ECC–concrete composite beams. The ECC layer was positioned in the tension zone of beams during testing. In addition, 500 MPa steel bars with diameters of 16 mm and 25 mm were used as tensile reinforcement and two 400 MPa steel bars with a diameter of 12 mm were used in the compressive zone as erection bars. The stirrups were 400 MPa steel bars of 8 mm in diameter, and were spaced 50 mm, 80 mm, or 150 mm center-to-center to avoid shear failure prior to flexural failure. Two clear concrete covers for rebar were used in test beams: 30 mm for four beams with a depth of 400 mm and 50 mm for the remaining twelve beams with a depth of 440 mm. Except for the beams RCE16-2-3, RCE16-3-3, RCE25-2-3 and RCE25-3-3, the ECC layer had the same centroid as the tensile reinforcement, which was proven to be an effective method to improve the bond between ECC and steel reinforcement [15]. For the beams RCE16-2-3, RCE16-3-3, RCE25-2-3, and RCE25-3-3, the distance from the top surface of the ECC layer to the outer edge of the tensile reinforcement was set equal to the rebar diameter, which was to ensure a good bond between the ECC and tensile reinforcement.
For the casting of the ECC–concrete composite specimens, the layered pouring method was adopted, where the ECC was poured into the mold first and vibrated, and then plain concrete was poured on top of the ECC layer and vibrated.

2.2. Materials Properties
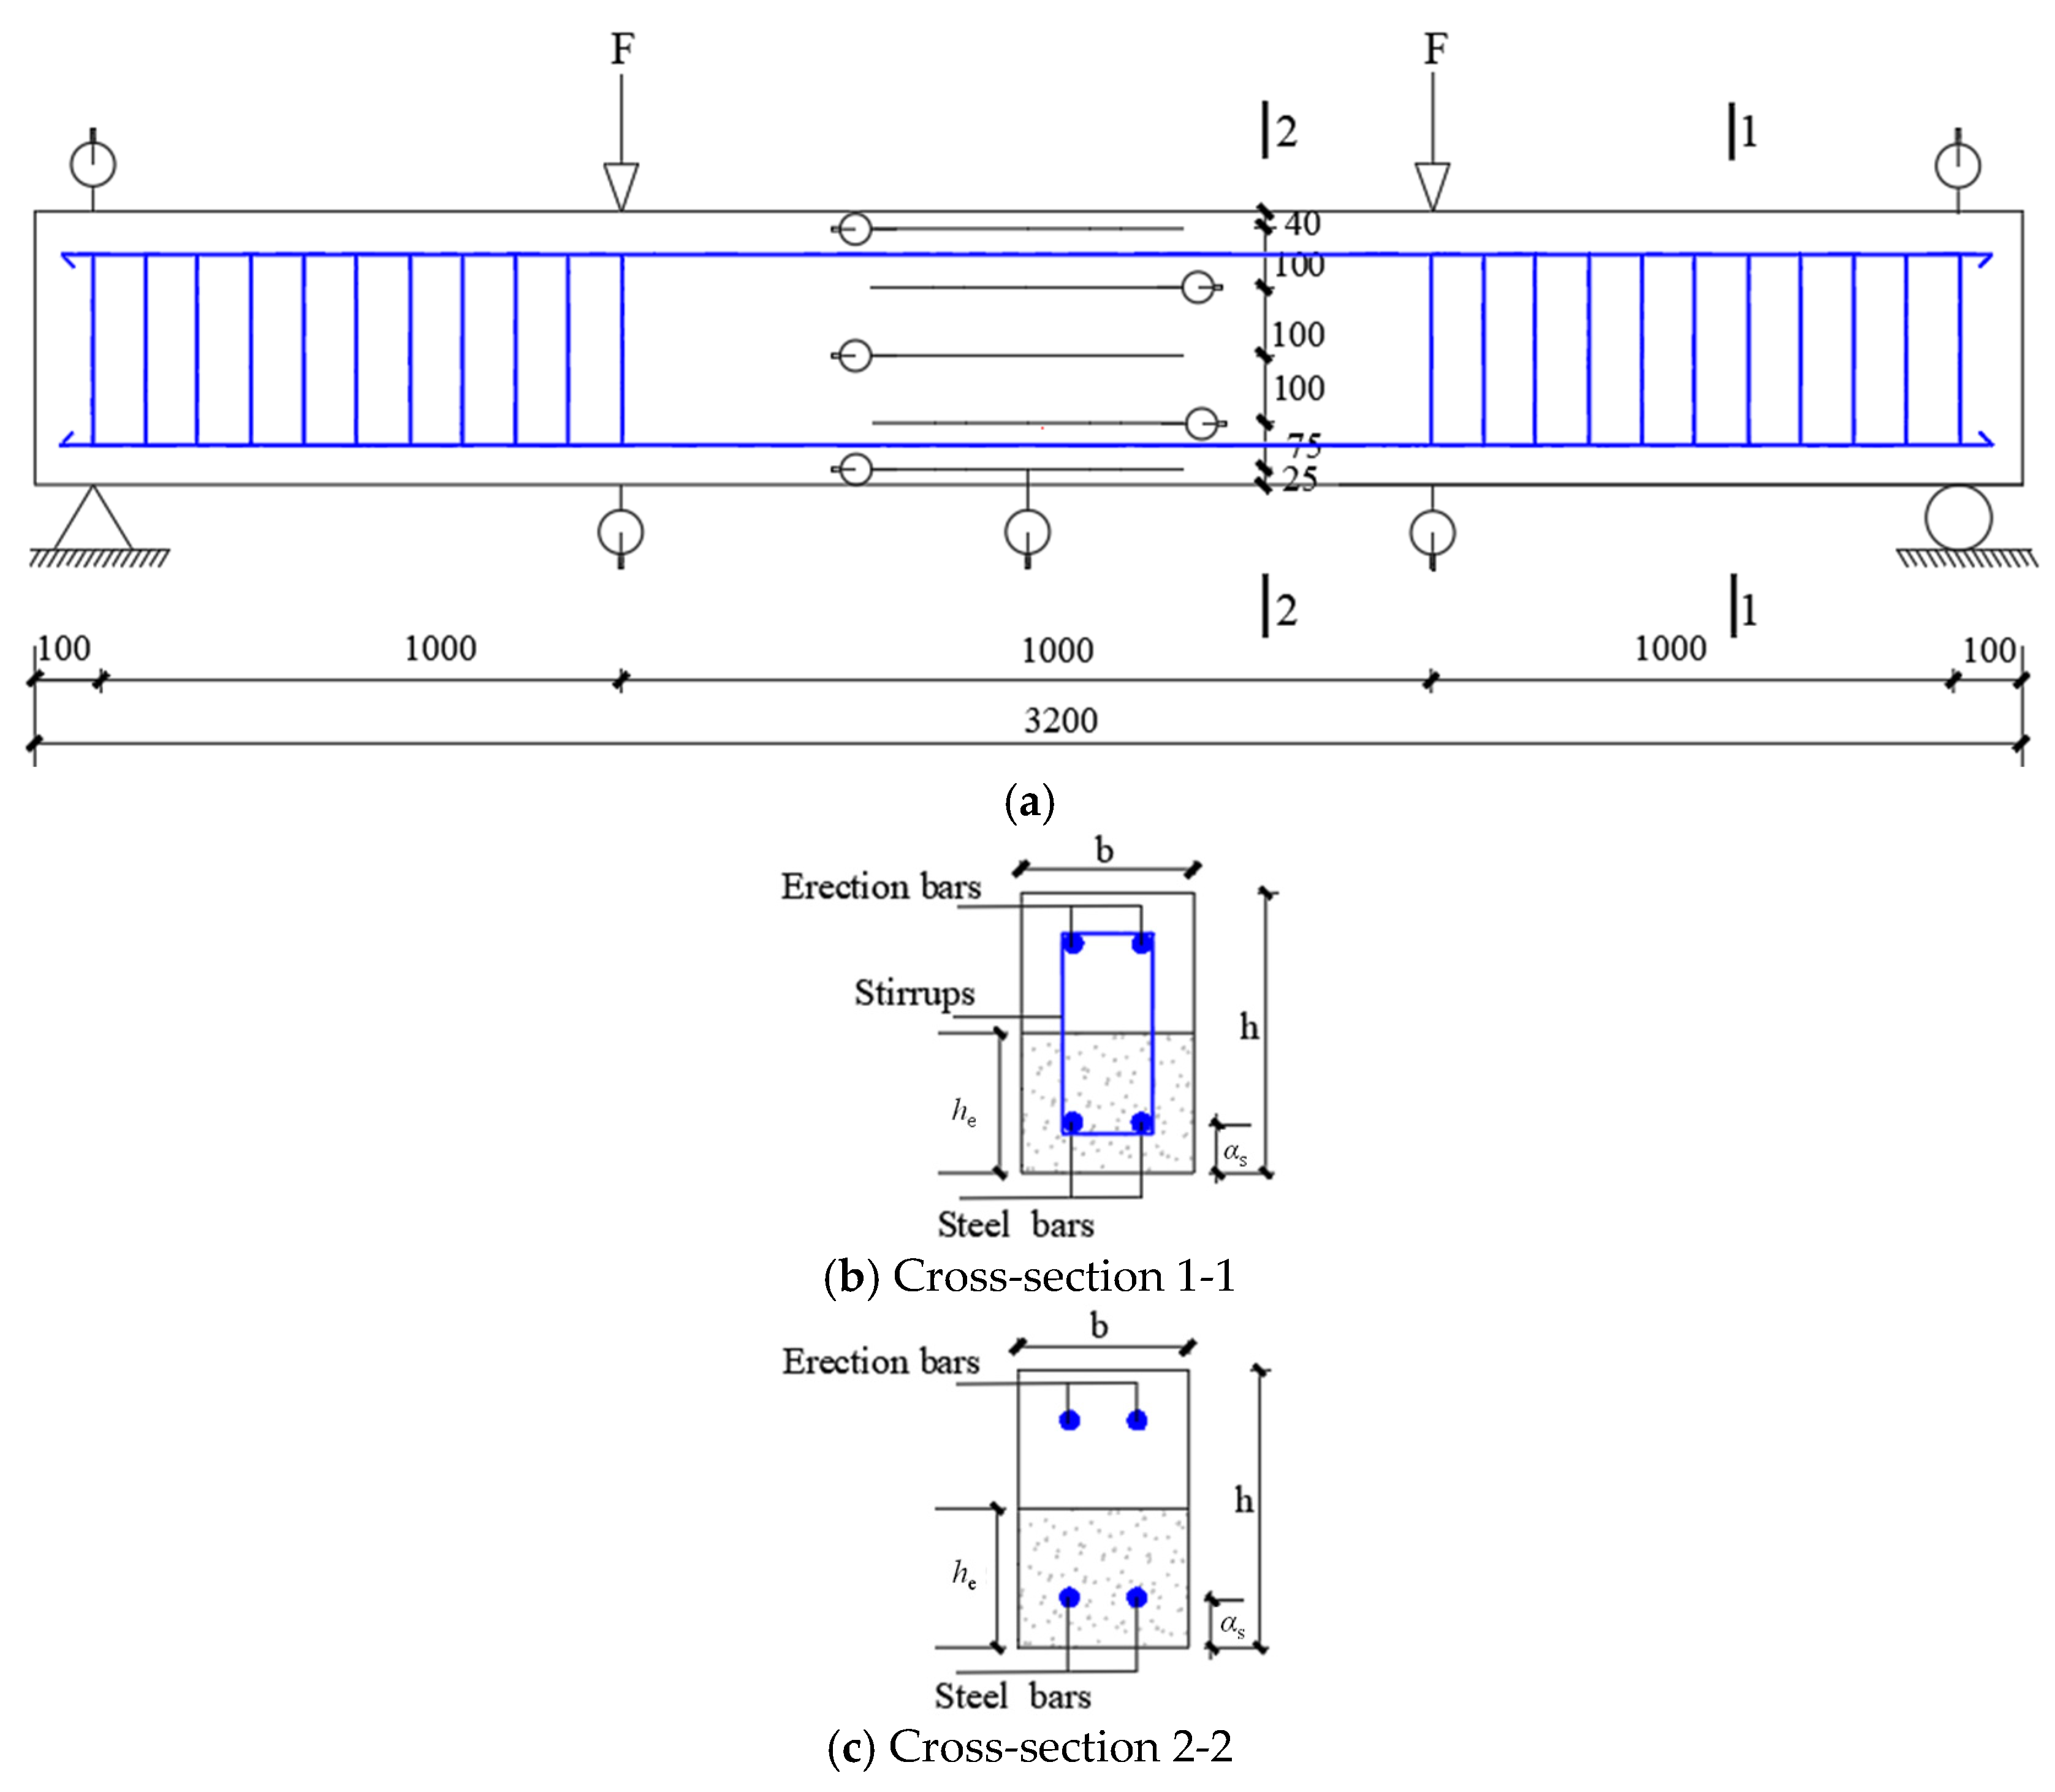
In this work, ECC was made from Portland cement, fly ash, silica fume, quartz sand, PVA fiber, water, and a High-Range Water Reducer. The mass ratio of cement, fly ash, silica fume, sand, and water was 1.0:3.0:1:0.36:0.35, and 2% (by volume) PVA fiber was added. The domestic PVA fiber employed in this study had a length of 12 mm, a diameter of 26 μm, and a nominal strength of 1560 MPa. Three ECC rectangular flat plates with dimensions of 160 mm × 40 mm × 15 mm were fabricated, and uniaxial tension tests were then conducted under displacement control at a rate of 0.2 mm/min. As shown in Figure 2, the tensile strain was measured by means of an extensometer with a 50 mm gauge length. Figure 2 illustrates the tensile stress–strain curves of the PVA-ECC. According to the results, the average initial cracking strength and ultimate tensile strength of the ECC were 3.09 MPa and 4.26 MPa, respectively, with an average initial cracking strain of 0.22 × 10⁻³ and an ultimate tensile strain of 2.69%. Three prismatic specimens with dimensions of 40 mm × 40 mm × 160 mm and three 70.7 mm × 70.7 mm × 70.7 mm ECC cubes were also prepared and tested in compression. The prism compressive strength of the PVA-ECC was 47.6 MPa, and the corresponding strain was 0.0058. The cubic compressive strength of the PVA-ECC was 56.1 MPa.
The design strength grade of concrete was C50, which has a similar compressive strength to that of the PVA-ECC (56.1 MPa). The mix proportion of concrete used in this study was cement: water: sand: coarse aggregate: water reducer = 1.0:0.35:1.36:2.26:0.0027. Three 150 mm × 150 mm × 150 mm concrete cubes were cast and cured under the same environmental conditions as the beam specimens. The average cubic compressive strength was measured as 53.8 MPa. Then, according to the Chinese National Standard GB50010-2010 [27], the axial compressive strength, tensile strength, and ultimate tensile strain were calculated as 34.8 MPa, 2.72 MPa, and 112 × 10−6, respectively. Table 2 presents the mechanical properties of the steel reinforcement, where fy, fu, and E are the yield strength, ultimate strength, and elastic modulus, respectively.

2.3. Test Setup

Each beam was loaded under four-point bending with a span of 3000 mm between the supports, and loading was symmetrically applied at 1000 mm from the supports with an oil hydraulic jack through a steel spreader beam (Figure 3). The load was applied in a force-controlled manner according to the standard for the testing of concrete structures GBT 50152-2012 [31] until the specimen failed, and it was measured with a load cell. Each load level was retained for about 5 min before observing crack development and measuring the crack width and deflection. Five displacement transducers were employed to monitor the midspan deflection of the beam. Five dial indicators with a gauge length of 200 mm were installed along the beam height to measure the average strain at the midspan cross-section (Figure 1). To detect the strains in tensile longitudinal steel bars, three electrical resistance strain gauges were bonded on the surface of the tensile steel reinforcement in the constant moment zone with a spacing of 300 mm. At each load level, the beam was carefully inspected to detect the cracks and record the trajectory of crack growth. The deflection, strains, and crack width were also measured at each load level.

3. Experimental Results

3.1. Failure Modes

In this study, all the RC beams were designed to fail by concrete crushing along with steel yielding. All tested specimens exhibited a typical flexural failure, characterized by the crushing of concrete in the compression zone after the yielding of steel. One example (e.g., the specimen RCE25-2-1) of the flexural failure mode is shown in Figure 4. For the composite beams, the first visible crack appeared in the ECC layer within the midspan region. As the load increased, the crack width increased slowly while the existing crack propagated progressively towards the compressive zone. Concurrently, new tiny cracks formed in the ECC layer around the midspan region. At higher loads, new tiny cracks continued to form in the ECC layer, while the cracks propagated into the concrete layer and kept on propagating towards the compressive zone. Approaching the maximum load, the crack width rapidly increased and the concrete in the compressive zone was crushed.

3.2. Strain Development

The development of strain distribution along the height of the composite beams RCE25-2-2 and RCE25-2-3 is shown in Figure 5. The other composite beams tested in this study had similar strain distribution development, so their results are not described in this paper. Figure 5 demonstrates that the plane section of the composite beams remained plane after loading, which indicates the continuity of strain at the interface between the concrete and ECC layers. This finding confirmed that there was a satisfactory bonding performance at the interface and ruled out the occurrence of delamination between the concrete and ECC layers. This observation is consistent with the findings of other researchers [19,20].
Figure 6 shows the load–strain curves of steel reinforcement in the constant moment region for specimens RC16-3, RCE16-3-2, RCE16-3-3, RC25-2, RCE25-2-2, and RCE25-2-3. The figure shows that the maximum strain values were all larger than 6000 με at failure, indicating that the tensile reinforcements in these beams yielded at failure. It also shows that prior to cracking, the reinforcement strain of the composite beam was similar to that of the corresponding RC control beam under the same load. After cracking, the tensile reinforcement strain of RC beams was evidently larger than that of the composite beams with the same steel reinforcement under the same load, and the tensile reinforcement strain of the composite beams slightly reduced with the increase in the thickness of the ECC layer (RCE16-3-2 with respect to RCE16-3-3, RCE25-2-2 with respect to RCE25-2-3). This indicates that the use of an ECC layer in the tensile zone of RC beams contributed to the tensile resistance to some extent.

3.3. Moment-Deflection Curves

Figure 7 shows the moment–deflection curves at the midspan section of some specimens. Each moment–deflection curve can be divided into three stages: elastic stage, crack development stage, and failure stage. Table 3 summarizes the test results of the beams in this study, including the cracking deflection, yield deflection, and ultimate deflection. Additionally, the corresponding experimental moments of these beams are presented in Table 4. The effects of varied parameters on the moment–deflection responses are discussed in the following paragraphs.
Figure 7a–d present the effect of using an ECC layer in the tensile zone on the moment–deflection behavior. Irrespective of the thickness of the ECC layer, the composite beams had a similar flexural stiffness to the corresponding RC control beams before the yielding of the steel reinforcement. This indicates that the use of an ECC layer in the tension zone has no evident effect on the pre-yielding flexural stiffness. Similar observations were obtained by other researchers [19,20] through experimental studies on small-sized composite beams. On average, the cracking moment of composite beams was 10.1% higher than that of the RC control beams, while the ECC layer thickness had no significant effect on the cracking moment of composite beams. Compared with the RC control beams, the composite beams achieved an improvement of 17.8% and 17.0% in the yield and ultimate moments, respectively, as shown in Table 4. Compared with the corresponding RC control beams, the yield moment of composite beams RCE16-2-2, RCE16-3-2, RCE25-2-2, and RCE25-3-2 increased by 38.7%, 18.9%, 12.4%, and 10.7%, respectively, while that of composite beams RCE16-2-3, RCE16-3-3, RCE25-2-3 and RCE25-3-3 increased by 31.4%, 11.0%, 10.0% and 9.2%, respectively. Compared with the corresponding RC control beams, the ultimate moments of composite beams RCE16-2-2, RCE16-3-2, RCE25-2-2, and RCE25-3-2 were enhanced by 36.4%, 22.3%, 14.7%, and 8.8%, respectively, while the ultimate moment enhancement of composite beams RCE16-2-3, RCE16-3-3, RCE25-2-3, and RCE25-3-3 was 25.0%, 10.1%, 11.6%, and 7.3%, respectively. This indicates that as the thickness of the ECC layer increased, the composite beams achieved a higher yield and ultimate moments.
A comparison of the yield and ultimate deflections was also conducted for beams with different ECC layer thicknesses. As shown in Table 3, the yield deflection (fly) of the composite beams was much higher than that of the corresponding RC control beams. This difference was possibly due to the multiple micro-cracking behaviors of the ECC that delayed the yielding of the tensile steel reinforcement. However, the ultimate deflections (flu) of the composite beams were smaller than those of their corresponding RC control beams. For composite beams with the same ECC layer thickness, the ultimate deflection increased with a decrease in the reinforcement ratio. These observations can be explained from the following two perspectives. For the composite beams experiencing a flexural failure, the superior ability of the ECC to withstand tensile stress reduces the demand for tensile resistance provided by steel reinforcement, thereby reducing the tensile strain of steel reinforcement. And, for the composite beams with the same ECC layer thickness, when they suffered a flexural failure, the larger the steel reinforcement ratio, the smaller the tensile strain of the steel bars at failure. Due to the reduced tensile strain of steel reinforcement and the constant ultimate compressive strain of concrete, the ultimate curvature decreases, and the ultimate deflection consequently decreases accordingly.
Figure 7e presents the effect of increasing the reinforcement ratio on the moment-deflection behavior of composite beams. Regardless of the reinforcement ratio, the composite beams had a similar precracking stiffness, indicating that the reinforcement ratio has no effect on the gross moment of inertia (Ig) of the composite beams. However, the amount of tensile reinforcement had an obvious effect on the postcracking behavior of the beams. The beams with larger reinforcement ratios exhibited a higher bending stiffness, yield moment, and ultimate moment. For the composite beams with steel bars 16 mm in diameter, increasing the reinforcement ratio (RCE16-3-1~3 with respect to RCE16-2-1~3, respectively) caused the yield and ultimate moments to increase by 23.9% and 22.0%, respectively, with standard deviations of 3.8% and 2.6%, as shown in Table 3. On the other hand, increasing the reinforcement ratio among the composite beams with steel bars 25 mm in diameter (RCE25-3-1~3 with respect to RCE25-2-1~3, respectively) increased the yield and ultimate moments by 35.4% and 33.9%, respectively, with standard deviations of 3.6% and 5.3%.

3.4. Ductility and Energy Dissipation Capacity

For traditional steel–RC structures, ductility describes the ability to sustain the inelastic deformation without a significant reduction in the load-bearing capacity prior to failure, and is defined as the ratio of the final deformation at the ultimate state to that at the yielding of steel reinforcement. The ductility index of RC beams is usually expressed in terms of the midspan deflection. The ductility index values were calculated from the yield and ultimate deflections listed in Table 3. The results showed that the ductility index of composite beams was 17.1–33.2% lower than that of the corresponding RC control beams. Therefore, the use of ECC in the tensile zone around longitudinal reinforcement is ineffective at improving the ductility of RC beams. For composite specimens with the same steel reinforcement ratio, the ductility index value slightly reduced as the ECC layer thickness increased by 30.6% to 46.7%. For specimens with the same ECC layer thickness, the ductility index value reduced by 31.7–35.9% as the reinforcement ratio increased from 1.33% to 2.11%, while it decreased by 20.2–24.5% as the reinforcement ratio increased from 0.537% to 0.852%.
The energy dissipation capacity is a crucial characteristic for structural elements [19]. Both the elastic (Ee) and total (Et) energy dissipation capacities can be obtained by calculating their respective areas under the moment–deflection curve, where Ee = (Mcrfcr)/2 + (Mcr + My) (flyfcr)/2, and Et = Ee + (My + Mu) (flufly)/2. The energy dissipation capacity of the beams was determined using the cracking, yield and ultimate deflections listed in Table 3, along with the corresponding experimental moments of the beams (fabricated in this study) listed in Table 4. Compared with their RC counterparts, the elastic energy dissipation capacity of the composite beams increased by 19.4–72.9%, while the total energy dissipation capacity of the composite beams was not enhanced. For composite specimens with the same reinforcement ratio, both Ee and Et showed no significant changes as the ECC layer thickness increased by 30.6–46.7%.

3.5. Crack Propagation

The first crack observed in all test beams in this study initiated at midspan. After the first cracking, multiple cracks were observed in the pure bending region. For beams RC16-2 and RC16-3, approximately seven cracks spread in the pure bending region at load levels of 93 kN and 154 kN, respectively. After that, the crack width rapidly increased and no new cracks appeared in the pure bending region. However, for composite beams RCE16-2-2, RCE16-2-3, RCE16-3-2 and RCE16-3-3, which had the same reinforcement details as RC16-2 and RC16-3, respectively, new cracks kept forming in the ECC layer. Specimen RCE16-2-3 exhibited the best multiple cracking ability, with more than fifteen cracks in the ECC layer and eight cracks in the concrete layer in the pure bending region at the yielding of the tensile reinforcement. After that, the dominant flexural cracks formed, while new micro-cracks continued to appear in the ECC layer in the pure bending region.
For beams RC25-2 and RC25-3, approximately eight cracks spread in the pure bending region at load levels of 142 kN and 176 kN, respectively. After that, the crack width rapidly increased, while the number of cracks in the pure bending region remained unchanged. However, new cracks kept forming in the ECC layer of composite specimens RCE25-2-2, RCE25-2-3 RCE25-3-2 and RCE25-3-3, which had the same reinforcement details as RC25-2 and RC25-3, respectively. Specimen RCE25-3-3 exhibited the best multiple cracking ability, with over twelve cracks in the ECC layer and six cracks in the concrete layer in the pure bending region at the yielding of the steel bar. After that, the number of cracks in the ECC layer in the pure bending region continued to increase, and the crack width also increased rapidly. It was also observed that wide cracks in the concrete layer diffused into multiple fine cracks in the ECC layer, as illustrated in Figure 8.
The crack patterns at the yielding of some composite beams and their corresponding control RC beams are shown in Figure 9. The values below the beam indicate the distance to the left edge of the beam, and the number on the right indicates the distance to the bottom edge of the beam. When no new crack appeared in the pure bending region, the average crack spacing of specimens RC25-2 and RC25-3 was around 171.7 mm and 151.4 mm, respectively. However, the average crack spacing of specimen RCE25-3-3 continued to decrease during the whole loading process, and was less than 90 mm at yielding. The average crack spacing was slightly larger for specimen RCE25-2-3, which had an identical ECC layer with RCE25-3-3 but a relatively lower reinforcement ratio, indicating that a higher reinforcement ratio led to a slightly closer crack spacing in concrete–ECC composite beams. The same phenomenon was also found in the comparison of the crack spacing of RCE25-2-2 and RCE25-3-2. For composite beam RCE25-2-1, which had the same ECC layer as RCE25-3-1 but a lower reinforcement ratio, its crack spacing was also greater than that of RCE25-3-1.
As is well known, the crack width can affect the permeability and corrosion of concrete structures. The average crack width development curves are shown in Figure 10. For concrete beams RC16-3, the average crack width reached 0.1 mm and 0.2 mm at 0.45Mu and 0.81 Mu, respectively. For composite specimens with the same reinforcement details as RC16-3, the average crack width remained below 0.1 mm before 0.75Mu. As the steel approached yielding stress, the crack width rapidly increased, exceeding 0.20 mm. For concrete beams RC25-3, the average crack width reached 0.1 mm and 0.2 mm at 0.65Mu and 0.86Mu, respectively. For composite specimens with the same reinforcement details as RC25-3 (RCE25-3-2 and RCE25-3-3), the average crack width remained below 0.1 mm before 0.89Mu. As the steel yielded, the crack width was approximately 0.20 mm. The development of cracks in composite beams with the same reinforcement details as RC25-2 was similar to that of composite beams RCE25-3-2 and RCE25-3-3, except that the crack width was slightly larger. The results indicate that the use of ECC instead of concrete in the tensile zone of RC beams can significantly reduce the crack width. For ECC–concrete composite beams with small sections, the crack width could be controlled around 0.05 mm at serviceability limit states [29], and was smaller than that in composite beams with relatively large sections. This inconsistency might be related to different specimen scales and the reinforcement strength in the composite beams. It can also be observed from Figure 9 that the thickness of the ECC layer within the range of 0.20h to 0.32h had no significant effect on the crack width of composite beams.

4. Section Analysis of Composite Beams

The analytical model for the moment–curvature relationship of a typical cross-section in ECC–concrete composite beams is based on the method suggested by Li et al. [32], which focused on concrete–basalt FRC beams. To apply the same algorithm to ECC–concrete composite beams, the form of the stress–strain relationship in the beam section is taken as that of ECC or concrete, respectively, according to the location along the beam depth. In the analysis of ECC–concrete composite beams, several assumptions about the failure criteria and constitutive models of ECC, concrete and steel bars were shown, as follows:
(1)
The tensile stress–strain relationship of ECC can be expressed as follows [15]:
σ e t = f e t c   ε e t c / ε e t ,                                                                       0 ε e t ε e t c f e t c + f e t u f e t c ε e t ε e t c ε e t u ε e t c ,       ε e t c <   ε e t ε c t u
where εet, σet, fetc, εetc, fetu, and εetu refer to the tensile strain, tensile stress, cracking tensile stress, cracking tensile strain, ultimate tensile stress, and ultimate tensile strain of ECC, respectively.
(2)
The stress–strain relationship of concrete in compression and tension is applicable to concrete with a cubic compressive strength ranging from 20 to 80 MPa [27]. The compressive stress–strain relationship can be expressed as follows:
σ c c = f c c 1 1 ε c c ε c 0 n ,       ε c c ε c 0 f c c ,                                                                     ε c o < ε c c ε c u
n = 2 f c u , k 50 / 60 2
ε c 0 = 0.002 + 0.5 f c u , k 50 × 10 5 0.002
ε c u = 0.0033 f c u , k 50 × 10 5 0.0033
where σcc, εcc, fcc, εc0, εcu and fcu,k refer to the compressive stress, compressive strain, compressive strength, compressive strain at peak stress (fcc), ultimate compressive strain and cube compressive strength of concrete, respectively; and n refers to a coefficient related to the compressive constitutive model of concrete.
The tensile constitutive model can be expressed as follows:
σ c t = f c t u   ε c t / ε c t u ,       ε c t ε c t u 0 ,                                       ε c t > ε c t u
where σct, εct, fctu and εctu refer to the tensile stress, tensile strain, ultimate uniaxial tensile stress and corresponding strain of concrete.
(3)
The stress–strain relationship of steel bars is simplified as a bilinear model, as shown in Equation (7).
σ s = E s ε s ,           ε s ε s y f s y ,                   ε s y < ε s ε s u
where σs, εs, fsy, εsy, εsu, and Es refer to the tensile stress, tensile strain, yield strength, yield strain, ultimate tension strain and elastic modulus of steel bars, respectively.
(4)
The failure criterion of concrete was that the maximum compressive strain reached the ultimate compressive strain εcu. The failure criteria for ECC and steel bars were that the tensile strain reached the ultimate tensile strain εetu and εsu, respectively.
Based on the constitutive models and failure criteria of the materials mentioned above, as well as several assumptions including the plane section assumption, compatible deformation between the steel reinforcement and matrix, and an adequate bond between the concrete and ECC, an algorithm was applied in the analysis of the flexural behavior of ECC–concrete composite beams. To begin the procedure, the compressive strain at the top of the section (εccs) was assigned. The distance (hc) between the neutral axis and the bottom was obtained from the force equilibrium equation of this section based on the assumed constitutive relationships. The sectional curvature φ was calculated from εccs/(hhc) and the corresponding moment was obtained by integrating the moment contribution of each small block about the bottom edge of the section. Repeating the calculation with different values of εccs ranging from 0 to εcu, the moment–curvature relationship of the steel-reinforced ECC–concrete composite beam was determined. Subsequently, the deflection f at midspan was calculated as follows.
f = S φ l 0 2
where S refers to a coefficient related to the loading and supporting conditions; l0 refers to the effective span.
Figure 11 shows comparisons of the experimental and predicted moment–deflection curves for beams RCE25-2-2, RCE25-2-3, RCE25-3-2 and RCE25-3-3. The predicted moment–mid span deflection curves aligned well with the experimental results. The results for 15 steel-reinforced composite beams with an ECC layer in the tensile zone were also collected from the available literature to check the verification of the theoretical model with the experimental results. Table 4 summarizes the comparison results obtained from the numerical analysis and experimental testing, including the cracking moment Mcr, yielding moment My, ultimate moment Mu and ductility index value μ. Table 5 provides detailed information about these beams. It can be seen that the predicted moments were in good agreement with the experimental results in all cases. Although the predicted ductility index values were close to the experimental ones in most cases, the predicted ductility index values of the small composite beams with a depth of 120 mm and a relative pure bending length of 0.2 (the ratio of pure bending length to span length) were generally much lower than the experimental values. The results revealed that the composite beams with a reduced cross-sectional height and shorter pure bending length demonstrated enhanced ductility index values. This phenomenon is consistent with the previous research results on reinforced concrete beams [26,33]. This indicates that no size effect was shown for the flexural strength of composite beams, while the ductility of composite beams might have a size effect. However, due to few studies on this issue, it is necessary to conduct more in-depth research on effect of size effect on the ductility of ECC–concrete composite beams with steel bars.

5. Simplified Methods for Predicting Flexural Capacity, Failure Mode and Deflection

Based on the specifications in the Chinese code for the design of concrete structures GB50010-2010 [27], the strain-hardening characteristics of ECC, and the flexural behavior of composite beams, the following six basic assumptions have been made in the derivation of the ultimate moment equation for ECC–concrete composite beams suffering flexural failure.
(1) The plane section before bending remains plane after bending; (2) The tensile stress of the ECC after first cracking is assumed to be fetc by neglecting the strain-hardening behavior; (3) The contribution of concrete in the tensile zone is ignored after cracking; (4) The actual stress distribution in the compression zone is replaced by an equivalent rectangular stress block that yields the same compression resultant force at the same location of application. (5) The steel stress reaches its yield strength; (6) A perfect bond between the concrete and ECC is considered, as observed in the present experiment.
For a singly reinforced rectangular ECC–concrete composite beam, the strain distribution, actual stress distribution, and simplified stress distribution at failure are illustrated in Figure 12, where xn refers to the depth of the compressive zone; αc and βc represent the equivalent rectangular compressive stress factor and equivalent rectangular compressive zone factor, respectively; αcfcc and x denote the stress and depth of the equivalent rectangular stress block, respectively, of which x = βcxn; Cc is the resultant compressive force above the neutral axis; yc is the distance from the point of application of Cc to the outside compressive fiber of the beam; αs is the distance of the centroid of longitudinal tension reinforcement to the concrete tensile edge; and he is the thickness of the ECC layer.
The equilibrium equations of force and moment can be obtained.
α c f c c b x = f e t c b h e + A s f s y M u = α c f c c b x h 0 x / 2 f e t c b h e h e / 2 α s
For concrete grades less than C50, the values of αc and βc are approximately 0.969 and 0.824, respectively, in the case of εcu = 0.0033 and εc0 = 0.002. For concrete grade C80, the values of αc and βc are approximately 0.940 and 0.740, respectively. When the concrete strength is between 50 and 80 MPa, the values of αc and βc are calculated using the linear interpolation method [34].
Equation (9) is not applicable to composite beams subjected to compressive failure. Similar to RC beams, the balanced depth of the compressive zone needs to be determined as a quantitative governing parameter to judge whether compressive failure mode occurs in composite beams. Based on the condition that εccs reaches εcu simultaneously as εs reaches εsy, the relative depth of the limiting compression zone ξb can be calculated using Equation (10).
ξ b = x b h 0 = β c x n b h 0 = β c ε c u ε c u + ε s y = β c 1 + f s y E s ε c u
If the relative depth of the compression zone ξ = x/h0 satisfies ξ < ξb, tensile or flexural failure occurs; if ξ satisfies ξ > ξb, compressive failure takes place. It can be observed from Equation (10) that ξb for the composite beam depends only on the ultimate compressive strain of concrete, the yielding strength and the elastic modulus of steel bar, which aligns with the behavior of the RC beam.
In the design of the RC beam, the minimum reinforcement ratio is specified to prevent the steel reinforcement from fracturing before the concrete crushes. When insufficient steel area is designed for RC beams, once a crack appears in the beam, the crack will suddenly open and the stress in the steel bar will rise sharply, which may lead to the tensile fracture of the steel bar before the concrete in the compression zone reaches its maximum bearing capacity. Meanwhile, for the ECC–concrete composite beam, since the contribution of ECC in the tensile zone should still be considered even after cracking due to its unique cracking behavior, the tensile stress in the steel bar will not increase sharply even at the cracked point. Therefore, in the design of the ECC–concrete composite beam, the minimum limited reinforcement ratio can be determined by Equation (11), which is derived from the equation applicable to RC beams specified in [27].
ρ min = 0.45 f e t c / f s y 0.2 %
Table 6 provides a comparison of the experimental and predicted ultimate moments, as well as a comparison of the experimental and predicted failure modes. The results indicate that the predicted ultimate moments and failure modes are consistent with the experimental results. Therefore, the calculation model proposed above can effectively predict the ultimate moment and failure mode of ECC–concrete composite beams.
The moment–midspan deflection curves of beams RCE25-2-2, RCE25-2-3, RCE25-3-2 and RCE25-3-3 were predicted using the ACI318 code [35], as shown in Figure 11. The ACI code recommends using Equation (12) to calculate the effective moment of inertia (Ie) for a cracked section. Equation (13) is adopted in calculating the cracking moments of the tested beams and the modulus of rupture is predicted using Equation (14). In general, the ACI model provided reasonable deflection values for the concrete–ECC composite beams under the serviceability conditions.
I e = M c r M a 3 I g + 1 M c r M a 3 I c r
M c r = f r I g y t
f r = 0.62 f c

6. Discussion and Conclusions

6.1. Discussion

In this study, the flexural performance of full-scale steel-reinforced composite beams with an ECC layer at their tensile side was investigated. A theoretical model was developed to predict the moment–deflection responses of composite beams. Additionally, simplified methods for predicting the flexural bearing capacity, effective moment of inertia, and failure mode of ECC–concrete composite beams were proposed, and the effect of size on the flexural performance of steel-reinforced composite beams was evaluated. It should be noted that this study primarily investigated the mechanical performance of ECC–concrete composite beams. Future research directions should emphasize a comprehensive evaluation of the carbon reduction benefits, economic viability, and environmental impacts associated with domestically produced ECC materials. The integration of machine learning (ML) techniques into the study of size effects holds significant potential to advance traditional methodologies. While classical approaches rely heavily on theoretical assumptions and localized empirical data, ML offers a data-driven framework to uncover complex, nonlinear relationships between structural dimensions and mechanical responses. By leveraging large datasets from simulations or multiscale experiments, ML models could identify hidden patterns in size-dependent behaviors (e.g., crack localization, load capacity degradation) that conventional analytical methods may overlook. Furthermore, ML-enabled sensitivity analysis could quantify the influence of material heterogeneity, interfacial properties (e.g., in ECC-concrete composites), and geometric scaling on failure mechanisms, enhancing the predictive accuracy for structures across scales. Challenges remain in ensuring physical interpretability and minimizing data biases, but the synergy of physics-based models and ML algorithms could ultimately yield robust, generalizable tools for optimizing structural designs while accounting for size effects. For future studies, it is suggested that ML methods are used to fully consider the size effects.
For the theoretical analysis, although the theoretical model adopts the concrete stress-strain formula (Equation (2)) specified in the Chinese GB50010-2010 code [27], it is noteworthy that when the coefficient n in Equation (2) is taken as 2, this formula can be rewritten as follows:
σ c c = f c c 2 ε c c ε c 0 ε c c ε c 0 2 ,       ε c c ε c 0 f c c ,                                                                   ε c o < ε c c ε c u
When the concrete compressive strength (fcc) in Equation (15) is taken as the cylinder compressive strength (fc′) of concrete, the stress–strain relationship for concrete in compression is consistent with the constitutive model of concrete in compression recommended in the CEB-FIP Code [36]. Therefore, the same algorithm can be applied to the numerical technique, which adopts the constitutive model of concrete in compression recommended in the CEB-FIP code [36]. For the CEB-FIP code, εc0 = 0.002, εcu = 0.0035.
Both the ACI318 code [35] and the Chinese GB 50010-2010 code [27] adopt similar methods to predict the bending capacity of RC beams. However, these two codes have made different provisions regarding the rectangular stress block hypothesis for the stress distribution in compressive concrete. Considering the rectangular stress block hypothesis for the stress distribution in compressive concrete specified in the ACI318 code [35], Equation (9) can be rewritten as follows:
α 1 f c b x = f e t c b h e + A s f s y M u = α 1 f c b x h 0 - x / 2 f e t c b h e h e / 2 α s
where, α1 = 0.85. And Equation (10) can be written as follows:
ξ b = β 1 1 + f s y E s ε c u
β 1 = 0.85 0.05 f c 28 7 0.65
For the ACI code, εcu = 0.003.
Both the method developed in this paper and the method proposed by Ge et al. [20] adopt the concrete stress–strain formula (Equation (2)) specified in the Chinese GB 50010-2010 code [27]. The difference between the two methods lies in the fact that they adopt different stress–strain expressions for concrete in compression and are applicable to different ranges of concrete strength. For the method proposed by Ge et al. [20], the coefficient n in Equation (2) is taken as 2, indicating that it is applicable to beams with a cubic concrete compressive strength not exceeding 50 MPa. However, the approach proposed in this paper directly substitutes the parameter n into the integral, indicating that it is applicable to beams with a cubic concrete compressive strength ranging from 20 MPa to 80 MPa (which corresponds to the limits for the cubic concrete compressive strength specified in the Chinese Code for Design of Concrete Structures GB 50010-2010). For beams with a cubic concrete compressive strength not exceeding 50 MPa, the calculation results obtained from the two methods are essentially consistent. For the five composite beams analyzed in the literature [20], a comparative analysis of the characteristic moments (including the cracking, yielding, and ultimate moments) derived from the two methods revealed a less than 5% discrepancy in the predicted results.
The analytical model developed in this paper for predicting the flexural behavior of steel-reinforced ECC–concrete beams is based on assumptions that are consistent with those applicable to RC beam cross-sections: namely, the plane section assumption, a perfect bond between reinforcing bars and surrounding ECC, and a perfect bond between normal concrete and ECC. While the perfect bond assumption and plane section hypothesis provide great convenience for developing the analytical model, these simplifications exhibit limitations in accurately capturing the actual structural performance of ECC–concrete composite beams, particularly at the ECC–concrete interface.

6.2. Conclusions

(1)
This study comprehensively explored the bending performance of ECC–concrete composite beams reinforced with hot-rolled ribbed steel bars. The findings revealed that the longitudinal tensile reinforcement ratio significantly impacted the bending performance, whereas varying the ECC layer thickness within the range of 0.20h~0.32h (h denotes the beam depth) had a relatively small effect on the bending performance of the tested composite beams. Importantly, an adequate ECC layer thickness prevented delamination between the concrete and ECC layers.
(2)
Similar failure modes were identified in ECC–concrete composite beams and corresponding control RC beams. The application of ECC in the tensile zone markedly improved the bending bearing capacity and reduced the crack width. Multiple fine cracks with widths less than 0.2 mm appeared in composite beams before the longitudinal tensile reinforcement yield, with an increased reinforcement ratio enhancing crack control. The average crack width at the serviceability limit states of the composite beams was sensitive to the specimen size and steel strength, with the composite beams with high-yield-strength steel bars and large-sized sections exhibiting a larger average crack width at serviceability limit states.
(3)
An analytical cross-sectional model, grounded in the equilibrium conditions of the internal force and bending moment, was proposed. It successfully predicted the moment–deflection response of ECC–concrete composite beams, accommodating concrete grades within the range of C20 to C80. The model’s predictions aligned with the experimental results, affirming its accuracy in simulating moment–deflection responses. Interestingly, a size effect was shown for ductility expressed in terms of deflection, showing that the predicted ductility index values of the small composite beams with a depth of 120 mm and a relative pure bending length of 0.2 (the ratio of pure bending length to span length) were generally much lower than the experimental values, while the bearing capacity was not affected by the size effect.
(4)
This study introduced a simplified method for predicting the flexural bearing capacity and failure mode of ECC–concrete composite beams. This method demonstrated good agreement with the experimental results. Under serviceability conditions, the ACI 318 code provided reasonable midspan deflection values for composite beams failing in flexure. The proposed simplified methods have practical utility for real-world applications.

Author Contributions

Methodology, C.X.; Investigation, C.G. and J.J.; writing—original draft preparation, C.G. and J.J.; writing—review and editing, Z.L. and X.G.; supervision, Z.L. and X.G.; funding acquisition, C.G., Z.L. and X.G. All authors have read and agreed to the published version of the manuscript.

Funding

This research was funded by [the National Natural Science Foundation of China] grant number [51308489], [the Natural Science Foundation of Jiangsu Province] grant number [BK20231334], [the List of Key Science and Technology projects in the transportation industry of China] grant number [2021-MS4-100], and [Qing Lan Project of Yangzhou University].

Data Availability Statement

The original contributions presented in the study are included in the article, further inquiries can be directed to the corresponding author.

Conflicts of Interest

Chong Gui was employed by GuangXi Beitou Highway Construction and Investment Group Co., Ltd. The remaining authors declare that the research was conducted in the absence of any commercial or financial relationships that could be construed as a potential conflict of interest.

References

  1. Qin, F.J.; Wei, X.Y.; Lu, Y.F.; Zhang, Z.; Di, J.; Yin, Z. Flexural behaviour of high strength engineered cementitious composites (ECC)-reinforced concrete composite beams. Case Stud. Constr. Mater. 2023, 18, e02002. [Google Scholar] [CrossRef]
  2. Wang, R.; Hu, Z.; Li, Y. Review on the deterioration and approaches to enhance the durability of concrete in the freeze-thaw environment. Constr. Build. Mater. 2022, 321, 126371. [Google Scholar] [CrossRef]
  3. Atsbha, T.G.; Zhutovsky, S. The effect of external curing methods on the development of mechanical and durability-related properties of normal-strength concrete. Constr. Build. Mater. 2022, 324, 126706. [Google Scholar] [CrossRef]
  4. Kang, S.T.; Choi, J.I.; Koh, K.T.; Lee, K.S.; Lee, B.Y. Hybrid effects of steel fiber and microfiber on the tensile behavior of ultra-high performance concrete. Compos. Struct. 2016, 145, 37–42. [Google Scholar] [CrossRef]
  5. Jahami, A.; Dayaa, L.; Assaad, J.J.; Baalbaki, O.; Khatib, J. Flexural strength of structural beams cast using combined normal-weight and lightweight concrete mixtures. Buildings 2024, 14, 3787. [Google Scholar] [CrossRef]
  6. Zhou, J.; Qian, S.; Ye, Q.; Copuroglu, O.; Breugel, K.; Li, V.C. Improved fiber distribution and mechanical properties of engineered cementitious composites by adjusting the mixing sequence. Cem. Concr. Compos. 2012, 34, 342–348. [Google Scholar] [CrossRef]
  7. Li, V.; Wang, S.X.; Wu, C. Tensile strain-hardening behavior of PVA-ECC. ACI Mater. J. 2001, 98, 483–492. [Google Scholar]
  8. Li, V. On engineered cementitious composites (ECC)—A review of the material and its application. J. Adv. Concr. Technol. 2003, 1, 215–230. [Google Scholar] [CrossRef]
  9. Kan, L.; Shi, R.; Zhu, J. Effect of fineness and calcium content of fly ash on the mechanical properties of Engineered Cementitious Composites (ECC). Constr. Build. Mater. 2019, 209, 476–484. [Google Scholar] [CrossRef]
  10. Arain, M.F.; Wang, M.; Chen, J.; Zhang, H. Study on PVA fiber surface modification for strain-hardening cementitious composites (PVA-SHCC). Constr. Build. Mater. 2019, 197, 107–116. [Google Scholar] [CrossRef]
  11. Wang, X.F.; Yang, Z.H.; Fang, C.; Han, N.; Zhu, G.; Tang, J.; Xing, F. Evaluation of the mechanical performance recovery of self-healing cementitious materials-its methods and future development: A review. Constr. Build. Mater. 2019, 212, 400–421. [Google Scholar] [CrossRef]
  12. Chen, Q.; Zhu, Z.; Ma, R.; Jiang, Z.; Zhang, Y.; Zhu, H. Insight into the mechanical performance of the UHPC repaired cementitious composite system after exposure to high temperatures. Materials 2021, 14, 4095. [Google Scholar] [CrossRef]
  13. Zhang, J.; Leung, C.K.Y.; Cheung, Y.N. Flexural performance of layered ECC-concrete composite beam. Compos. Sci. Technol. 2006, 66, 1501–1512. [Google Scholar] [CrossRef]
  14. Maalej, M.; Li, V.C. Engineered cementitious composites for effective FRP-strengthening of RC beams. Compos. Sci. Technol. 2005, 65, 1120–1128. [Google Scholar] [CrossRef]
  15. Maalej Li, V.C. Introduction of strain-hardening engineered cementitious composites in design of reinforced concrete flexural members for improved durability. ACI Struct. J. 1995, 92, 167–176. [Google Scholar]
  16. Maalej, M.; Ahmed, S.F.U.; Paramasivam, P. Corrosion durability and structural response of functionally-graded concrete beams. J. Adv. Concr. Technol. 2003, 1, 307–316. [Google Scholar] [CrossRef]
  17. Daugevicius, M.; Valivonis, J.; Skuturna, T.; Popov, V. RC Beams strengthened with HPFRCC: Experimental and numerical results. J. Civ. Eng. Manag. 2016, 22, 254–270. [Google Scholar] [CrossRef]
  18. Wang, N.; Xu, S.L. Flexural response of reinforced concrete beams strengthened with post-poured ultra high toughness cementitious composites layer. J. Cent. South Univ. 2011, 18, 932–939. [Google Scholar] [CrossRef]
  19. Qin, F.J.; Zhang, Z.G.; Yin, Z.W.; Di, J.; Xu, L.J.; Xu, X.Q. Use of high strength, high ductility engineered cementitious composites (ECC) to enhance the flexural performance of reinforced concrete beams. J. Build. Eng. 2020, 32, 101746. [Google Scholar] [CrossRef]
  20. Ge, W.J.; Ashour, A.F.; Ji, X.; Cai, C.; Cao, D.F. Flexural behavior of ECC-concrete composite beams reinforced with steel bars. Constr. Build. Mater. 2018, 159, 175–188. [Google Scholar] [CrossRef]
  21. Maalej, M.; Quek, S.T.; Ahmed, S.F.U.; Zhang, J.; Lin, V.W.J.; Leong, K.S. Review of potential structural applications of hybrid fiber Engineered Cementitious Composites. Constr. Build. Mater. 2012, 36, 216–227. [Google Scholar] [CrossRef]
  22. Xu, S.L.; Wang, N.; Li, Q.H. Experimental study on the flexural performance of concrete beam strengthened with ultra-high toughness cementitious composites. Chin. Civ. Eng. J. 2010, 43, 17–22. [Google Scholar]
  23. Zhang, X.F.; Xu, S.L.; Li, H.D. Theoretical analysis of flexural performance of plain concrete beams strengthened with ultra-high toughness cementitious composites. China Civ. Eng. J. 2010, 43, 51–62. [Google Scholar]
  24. Zhang, J.; Wang, Z.B.; Ju, X.C.; Shi, Z.J. Simulation of flexural performance of layered ECC-concrete composite beam with fracture mechanics model. Eng. Fract. Mech. 2014, 131, 419–438. [Google Scholar] [CrossRef]
  25. Alca, N.; Alexander, S.D.B.; Macgregor, J.G. Effect of size on flexural behavior of high-strength concrete beams. ACI Struct. J. 1997, 94, 59–67. [Google Scholar]
  26. Appa, R.G.; Vijayanand, I.; Eligehausen, R. Studies on ductility and evaluation of minimum flexural reinforcement in RC beams. Mater. Struct. 2008, 41, 759–771. [Google Scholar] [CrossRef]
  27. GB50010-2010; Code for Design of Concrete Structures. China Architecture & Building Press: Beijing, China, 2010.
  28. Li, Z.H.; Su, X.Z. Experimental Investigation on Flexural Behavior of 500 MPa Reinforced Concrete Beams with and without skin reinforcement. Appl. Mech. Mater. 2013, 368–370, 1668–1673. [Google Scholar] [CrossRef]
  29. Li, Q.H.; Xu, S.L. Experimental investigation and analysis on flexural performance of functionally graded composite beam crack-controlled by ultrahigh toughness cementitious composites. Sci. China Ser. E Technol. Sci. 2009, 52, 1648–1664. [Google Scholar] [CrossRef]
  30. Ma, H.; Qian, S.Z.; Zhang, Z.G.; Lin, Z.; Li, V.C. Tailoring Engineered Cementitious Composites with local ingredients. Constr. Build. Mater. 2015, 101, 584–595. [Google Scholar] [CrossRef]
  31. GBT 50152-2012; Standard for Test Method of Concrete Structures. China Architecture & Building Press: Beijing, China, 2012.
  32. Li, Z.H.; Wan, S.C.; Ma, C.F.; Guo, X. Flexural behaviour of concrete-basalt FRC beams with steel bars under concentrated load. Structures 2022, 39, 237–252. [Google Scholar] [CrossRef]
  33. Weiss, W.J.; Güler, K.; Shah, S.P. Localization and size-dependent response of reinforced concrete beams. ACI Struct. J. 2001, 98, 686–695. [Google Scholar]
  34. Ge, W.J.; Tang, R.; Wang, Y.; Zhang, Z.W.; Sun, C.; Yao, S.; Lu, W. Flexural performance of ECC-concrete composite beams strengthened with carbon fiber sheet. Results Eng. 2022, 13, 100334. [Google Scholar] [CrossRef]
  35. American Concrete Institute. Building Code Requirements for Structural Concrete (ACI 318-02) and Commentary (ACI 318R-02); ACI Committee 318: Farmington Hills, MI, USA, 2002. [Google Scholar]
  36. CEB-FIP Model Code 90. Model Code for Concrete Structures, Comite Euro-International du Beton, Bulletin No. 213/214; Thomas Telford Ltd.: London, UK, 1993.
Figure 1. Details of tested specimens.
Buildings 15 01592 g001
Figure 2. Tensile test of ECC: (a) test; and (b) stress–strain curves of specimens.
Buildings 15 01592 g002
Figure 3. The test apparatus and loading setup.
Buildings 15 01592 g003
Figure 4. Flexural failure mode for specimen RCE25-2-1.
Buildings 15 01592 g004
Figure 5. Strain distribution at midspan section of composite specimens.
Buildings 15 01592 g005
Figure 6. Strain responses of tensile steel bars in the constant moment region: (a) Specimens RC16-3, RCE16-3-2 and RCE16-3-3; (b) Specimens RC25-2, RCE25-2-2 and RCE25-2-3.
Buildings 15 01592 g006
Figure 7. Moment–deflection curves at midspan: (a) RC16-2 and RCE16-2; (b) RC16-3 and RCE16-3; (c) RC25-2 and RCE25-2; (d) RC25-3 and RCE25-3; (e) Comparison between composite beams with different reinforcement ratios.
Buildings 15 01592 g007
Figure 8. Crack diffusion behavior in composite beam.
Buildings 15 01592 g008
Figure 9. Crack patterns at yielding in pure bending zone of specimens suffering flexural failure.
Buildings 15 01592 g009
Figure 10. Average crack width growth curves: (a) beams RC16-3 and corresponding composite beams; (b) beams RC25-2 and corresponding composite beams; (c) beams RC25-3 and corresponding composite beams.
Buildings 15 01592 g010
Figure 11. Comparison of moment–deflection curves.
Buildings 15 01592 g011
Figure 12. The strain and stress distribution along the depth of the composite beam.
Buildings 15 01592 g012
Table 1. Details of tested specimens.
Specimen IDAsρ (%)Asvc (mm)b (mm)h (mm)hcr-ECC (mm)hcr-ECC/h
RC16-22B160.537A8@1505020044000
RC16-33B160.806A8@1505020044000
RC25-22B251.329A8@805020044000
RC25-33B251.993A8@505020044000
RCE16-2-12B160.568A8@15030200400920.23
RCE16-2-22B160.537A8@150502004401320.30
RCE16-2-32B160.537A8@15050200440900.20
RCE16-3-13B160.852A8@15030200400920.23
RCE16-3-23B160.806A8@150502004401320.30
RCE16-3-33B160.806A8@15050200440900.20
RCE25-2-12B251.405A8@80302004001010.25
RCE25-2-22B251.329A8@80502004401410.35
RCE25-2-32B251.329A8@80502004401080.27
RCE25-3-13B252.107A8@50302004001010.25
RCE25-3-23B251.993A8@50502004401410.35
RCE25-3-33B251.993A8@50502004401080.27
Note: A = HRB400 grade steel bar; B = HRB500 grade steel bar; As and Asv represent the tensile steel bars and stirrups, respectively; ρ is the tensile reinforcement ratio; he is the thickness of the ECC layer; c is the clear concrete cover for rebar.
Table 2. Mechanical properties of reinforcing steel bars.
Bar TypeDiameter (mm)fy (MPa)fu (MPa)E (GPa)
HRB4008409526198
HRB40012410511199
HRB50016560686200
HRB50025567596200
Table 3. Summary of the cracking, yield and ultimate deflections.
Specimenfcr (mm)fly (mm)flu (mm)Specimenfcr (mm)fly (mm)flu (mm)
RC16-20.489.0559.50RCE16-3-21.7012.3142.40
RC16-31.5310.4546.74RCE16-3-31.5812.5243.83
RC25-21.0913.0133.83RCE25-2-11.0515.0529.85
RC25-31.2312.9522.92RCE25-2-20.6613.7628.96
RCE16-2-11.3813.1758.86RCE25-2-30.9413.9129.90
RCE16-2-21.2512.4354.60RCE25-3-11.4715.3720.46
RCE16-2-31.2112.1556.32RCE25-3-21.4314.5619.64
RCE16-3-11.1012.8145.68RCE25-3-31.1514.5121.30
Note: fcr—cracking deflection, fly—yield deflection, flu—ultimate deflection.
Table 4. Comparison of experimental and predicted results of composite beams.
Specimen
ID
Mcr (kN·m)My (kN·m)Mu (kN·m)μ
Exp.Pre.P/EExp.Pre.P/EExp.Pre.P/EExp.Pre.P/E
RCE16-2-122.422.81.0290.191.41.0197.696.00.984.474.841.08
RCE16-2-225.526.41.04102.1104.91.03110.9111.11.004.394.701.07
RCE16-2-325.025.21.0196.797.71.01101.6102.81.014.644.931.06
RCE16-3-126.324.50.93115.5124.81.08116.4130.31.123.573.921.10
RCE16-3-232.330.80.95125.2140.31.12137.9147.21.073.443.651.06
RCE16-3-331.232.51.04116.9133.31.14124.2140.51.133.503.731.07
RCE25-2-131.829.30.92166.2183.51.10173.7187.71.081.982.121.07
RCE25-2-239.533.00.84190.5202.31.06202.4207.61.032.102.201.05
RCE25-2-337.032.50.88186.5197.51.06197.0202.91.032.152.301.07
RCE25-3-141.633.20.80231.8251.11.08243.1252.31.041.331.250.94
RCE25-3-244.737.50.84253.2274.51.08263.2276.31.051.351.310.97
RCE25-3-342.636.60.86249.6270.61.08259.6272.51.051.471.350.92
CBSA2 [20]4.14.11.0014.014.41.0318.815.30.81--
CBSA3 [20]4.03.10.7815.815.81.0019.416.90.87--
CBSE2 [20]3.74.11.1116.216.81.0419.517.60.905.323.810.72
CBSE3 [20]3.83.10.8217.918.21.0219.819.20.973.823.690.97
CBSF3 [20]3.73.10.8420.721.51.0423.322.40.96--
UHTCC50 [29]---- 4.14.61.124.64.91.073.203.251.02
UHTCC35 [29]---- 4.24.51.075.04.60.924.723.670.78
UHTCC25 [29]---- 4.04.31.084.44.41.006.593.920.59
UHTCC15 [29]---- 3.93.91.004.44.10.935.904.400.75
E-3-S-14 [19]17.514.50.8360.263.61.0666.567.81.023.424.071.19
E-6-S-14 [19]16.516.81.0261.668.11.1167.673.11.083.564.041.13
E-9-S-14 [19]15.717.41.1163.171.71.1471.077.51.094.023.950.98
E-12-S-14 [19]14.916.51.1166.774.51.1279.080.61.024.113.830.93
E-6-S-10 [19]13.513.51.0033.140.91.2445.045.01.005.674.340.77
E-6-S-18 [19]17.016.60.9896.0101.71.06100.2105.71.052.352.641.12
Average 0.94 1.07 1.01 0.98
COV 0.11 0.05 0.07 0.16
Table 5. Details of steel-reinforced composite beams tested in the literature.
Specimen
ID
b (mm)h (mm)l0 (mm)lm (mm)hcr-ECC (mm)lm/l0 (mm)
CBSA2 [20]1502001400400500.29
CBSA3 [20]15020014004001000.29
CBSE2 [20]1502001400400500.29
CBSE3 [20]15020014004001000.29
CBSF3 [20]15020014004001000.29
UHTCC50 [29]801202000400500.20
UHTCC35 [29]801202000400350.20
UHTCC25 [29]801202000400250.20
UHTCC15 [29]801202000400150.20
E-3-S-14 [19]2003001700500300.29
E-6-S-14 [19]2003001700500600.29
E-9-S-14 [19]2003001700500900.29
E-12-S-14 [19]20030017005001200.29
E-6-S-10 [19]2003001700500600.29
E-6-S-18 [19]2003001700500600.29
Note: lm is the pure bending length.
Table 6. Predicted and experimental results for composite beams.
Specimen
ID
Mu (kN·m)Failure ModeSpecimen
ID
Mu (kN·m)Failure Mode
Exp.Pre.P/EExp.Pre.Exp.Pre.P/EExp.Pre.
RCE16-2-197.694.10.96FFCBSE2 [20]19.517.50.90--F
RCE16-2-2110.9107.90.97FFCBSE3 [20]19.819.00.96--F
RCE16-2-3101.6100.50.99FFCBSF3 [20]23.322.20.95--F
RCE16-3-1116.4128.51.10FFUHTCC50 [29]4.64.81.04--F
RCE16-3-2137.9144.21.05FFUHTCC35 [29]5.04.50.90FF
RCE16-3-3124.2135.61.09FFUHTCC25 [29]4.44.30.98--F
RCE25-2-1173.7187.11.08FFUHTCC15 [29]4.44.00.91--F
RCE25-2-2202.4206.21.02FFE-3-S-14 [19]66.566.61.00FF
RCE25-2-3197.0201.61.02FFE-6-S-14 [19]67.670.91.05FF
RCE25-3-1243.1253.61.04FFE-9-S-14 [19]71.074.61.05FF
RCE25-3-2263.2277.21.05FFE-12-S-14 [19]79.077.60.98FF
RCE25-3-3259.6273.41.05FFE-6-S-10 [19]45.042.70.95FF
CBSA2 [20]18.815.10.81--FE-6-S-18 [19]100.2105.01.05FF
CBSA3 [20]19.416.70.86--F
Note: “F” refers to “flexural failure”.
Disclaimer/Publisher’s Note: The statements, opinions and data contained in all publications are solely those of the individual author(s) and contributor(s) and not of MDPI and/or the editor(s). MDPI and/or the editor(s) disclaim responsibility for any injury to people or property resulting from any ideas, methods, instructions or products referred to in the content.

