1. Introduction
Seismic response analysis is fundamental in structural engineering, ensuring the stability and resilience of buildings under seismic forces. Conventional methods such as Modal Response Spectrum Analysis (RSA) and Nonlinear Response History Analysis (NRHA) have been widely applied to predict structural behavior during seismic events [
1,
2,
3]. These approaches often rely on single-degree-of-freedom (SDOF) models, which often simplify complex multi-degree-of-freedom (MDOF) behavior, due to simplifications. Recent developments in seismic codes, such as ASCE/SEI 41-17, Eurocode 8, and TBEC-2018, emphasize the implementation of advanced dynamic analysis methods, including nonlinear time history analysis, to improve the accuracy of structural behavior assessment under seismic loading. These codes recommend the consideration of higher-mode effects and multi-modal responses, particularly in the design and retrofitting of complex structures [
4,
5,
6].
Recent study also emphasizes the importance of using real earthquake records that are compatible with recent code for seismic displacement analysis, particularly for SDOF systems [
7].
On the other hand, the dynamic analysis of multi-degree-of-freedom (MDOF) structures is more accurate compared with SDOF models since they are inherently higher-order vibration modes [
8,
9]. To improve predictive accuracy, nonlinear dynamic analysis techniques, including plastic failure surface models, have been explored to account for failure mechanisms in complex structural systems [
10,
11].
A key advancement in this domain is the hexagonal plastic failure surface model, which provides a more refined representation of seismic response characteristics in MDOF structures. This model, developed through limit analysis-based proportional loading and higher-mode response considerations, defines an internal safety zone, effectively capturing multi-mode interactions and plastic failure behavior under seismic loading [
8,
9]. While the hexagonal model has previously been validated through both theoretical and numerical studies [
10,
11], further investigations are needed to confirm its applicability across different structural configurations, where experimental verification remains limited.
While traditional methods, such as pushover analysis, typically assume single-mode behavior, studies have shown that including higher modes improves accuracy, particularly in structures where higher-order modes significantly influence the failure mechanism [
4,
12,
13]. Previous research has also proposed an improved lateral load distribution factor for pushover analysis by incorporating higher-mode effects [
14], which further enhance the precision of the procedures. Additionally, the emphasized integration of higher-mode effects revealed that modal pushover analysis and time history analysis are fundamental for structures subjected to near-fault or complex ground motions [
15,
16]. In fact, incorporating multi-modal considerations into seismic design has evidently improved the accuracy of response predictions, particularly for irregular and high-rise buildings [
12].
The role of higher-order mode consideration in seismic design has been a subject of ongoing debate. Previous studies argue that simplified models like pushover analysis, which often assume the response is dominated by the fundamental mode, sufficiently approximate seismic demands for design applications [
2,
17]. In structures with short periods, higher-mode effects have also been reported to have minimal impact on the seismic response [
18,
19]. These findings suggest that while higher-mode effects are important in some contexts, their inclusion may not always be critical in enhancing seismic predictions.
However, recent studies emphasize that the integration of multi-mode response is crucial for a more accurate representation of failure mechanisms, especially in complex multi-degree-of-freedom (MDOF) structures subjected to seismic loads [
12,
20]. Higher modes significantly affect the structural behavior of irregular or tall buildings, which cannot be fully captured by traditional methods like pushover analysis [
21,
22]. Multi-mode considerations are particularly important in structures subjected to complex ground motions or near-fault effects, where lower modes alone may fail to represent the true seismic response [
23,
24]. In fact, the inclusion of higher modes is reportedly leading to more precise predictions in seismic performance assessments, addressing the limitations of simplified methods that typically rely on single-mode behavior [
25,
26]. These findings reinforce the necessity of advanced methodologies, such as the hexagonal plastic collapse surface model, which accounts for multi-modal interactions and plastic failure under seismic loading.
This study develops the theoretical foundation of hexagonal analysis for multistory structures, implemented in Visual Basic 6.0, and assesses its validity by comparing experimental findings with numerical simulations using SAP2000. The findings offer insight into the failure mechanisms of two-story frames, highlighting the practical advantages of the hexagonal plastic collapse surface model in improving seismic response predictions while maintaining computational efficiency. The results contribute to refining simplified nonlinear dynamic analysis (SNDA) techniques and optimizing seismic performance evaluation for MDOF structures.
2. Methods
This section outlines the methodologies of the formation of hexagonal plastic failure surfaces for multistory structures, ensuring consistency between experimental and analytical results. The framework consists of vibration mode shape analysis, natural period and effective mass calculations, limit analysis under proportional loading, and the implementation of simplified nonlinear dynamic analysis (SNDA). The proposed methodology is validated by comparing the analytical predictions with experimental findings and numerical simulations in SAP2000.
2.1. Preliminary Analysis
2.1.1. Vibration Mode Shape
To define the first and second mode shapes, the frame stiffness distributions
is first determined by Equation (1) [
27]. Here,
represents the inter-story stiffness ratio,
is the story number, and
is the total number of stories. The first mode shape is obtained using an iterative mode convergence method based on the eigenvalue problem presented in Equation (2), following the standard eigenvalue approach in structural dynamics [
28].
Here,
is the natural angular frequency,
is the mass matrix,
is the stiffness matrix, and {u} is the mode shape vector. To isolate the first mode, the transformation
is applied repeatedly to an initial mode shape vector
. Each iteration amplifies the contribution of the fundamental mode, which corresponds to the lowest natural frequency:
An initial mode shape is assumed as a linearly increasing displacement shape with respect to story number, normalized such that the top story has a unit value:
Using this assumed shape, story shear forces are computed, followed by inter-story displacements based on previously defined story stiffness values. The resulting lateral displacements are then normalized by the displacement at the top story. This process is repeated until the mode shape converges.
The second mode shape is obtained using an iterative process that removes the influence of the first mode. First, the second mode shape is represented as a linear combination of the fundamental mode shapes, with each coefficient
indicating the contribution of the corresponding mode shape
to the overall vector shown in Equation (5).
Here, the coefficient is calculated by multiplying both sides of the expression by the transpose of the first mode:
Then, the new vector
is defined by subtracting the first mode component
from
, effectively isolating the second mode:
Orthogonalization is applied using the previously computed first mode shape, followed by shear force calculation, inter-story displacement computation, and normalization. This sequence is repeated until the second mode shape converges.
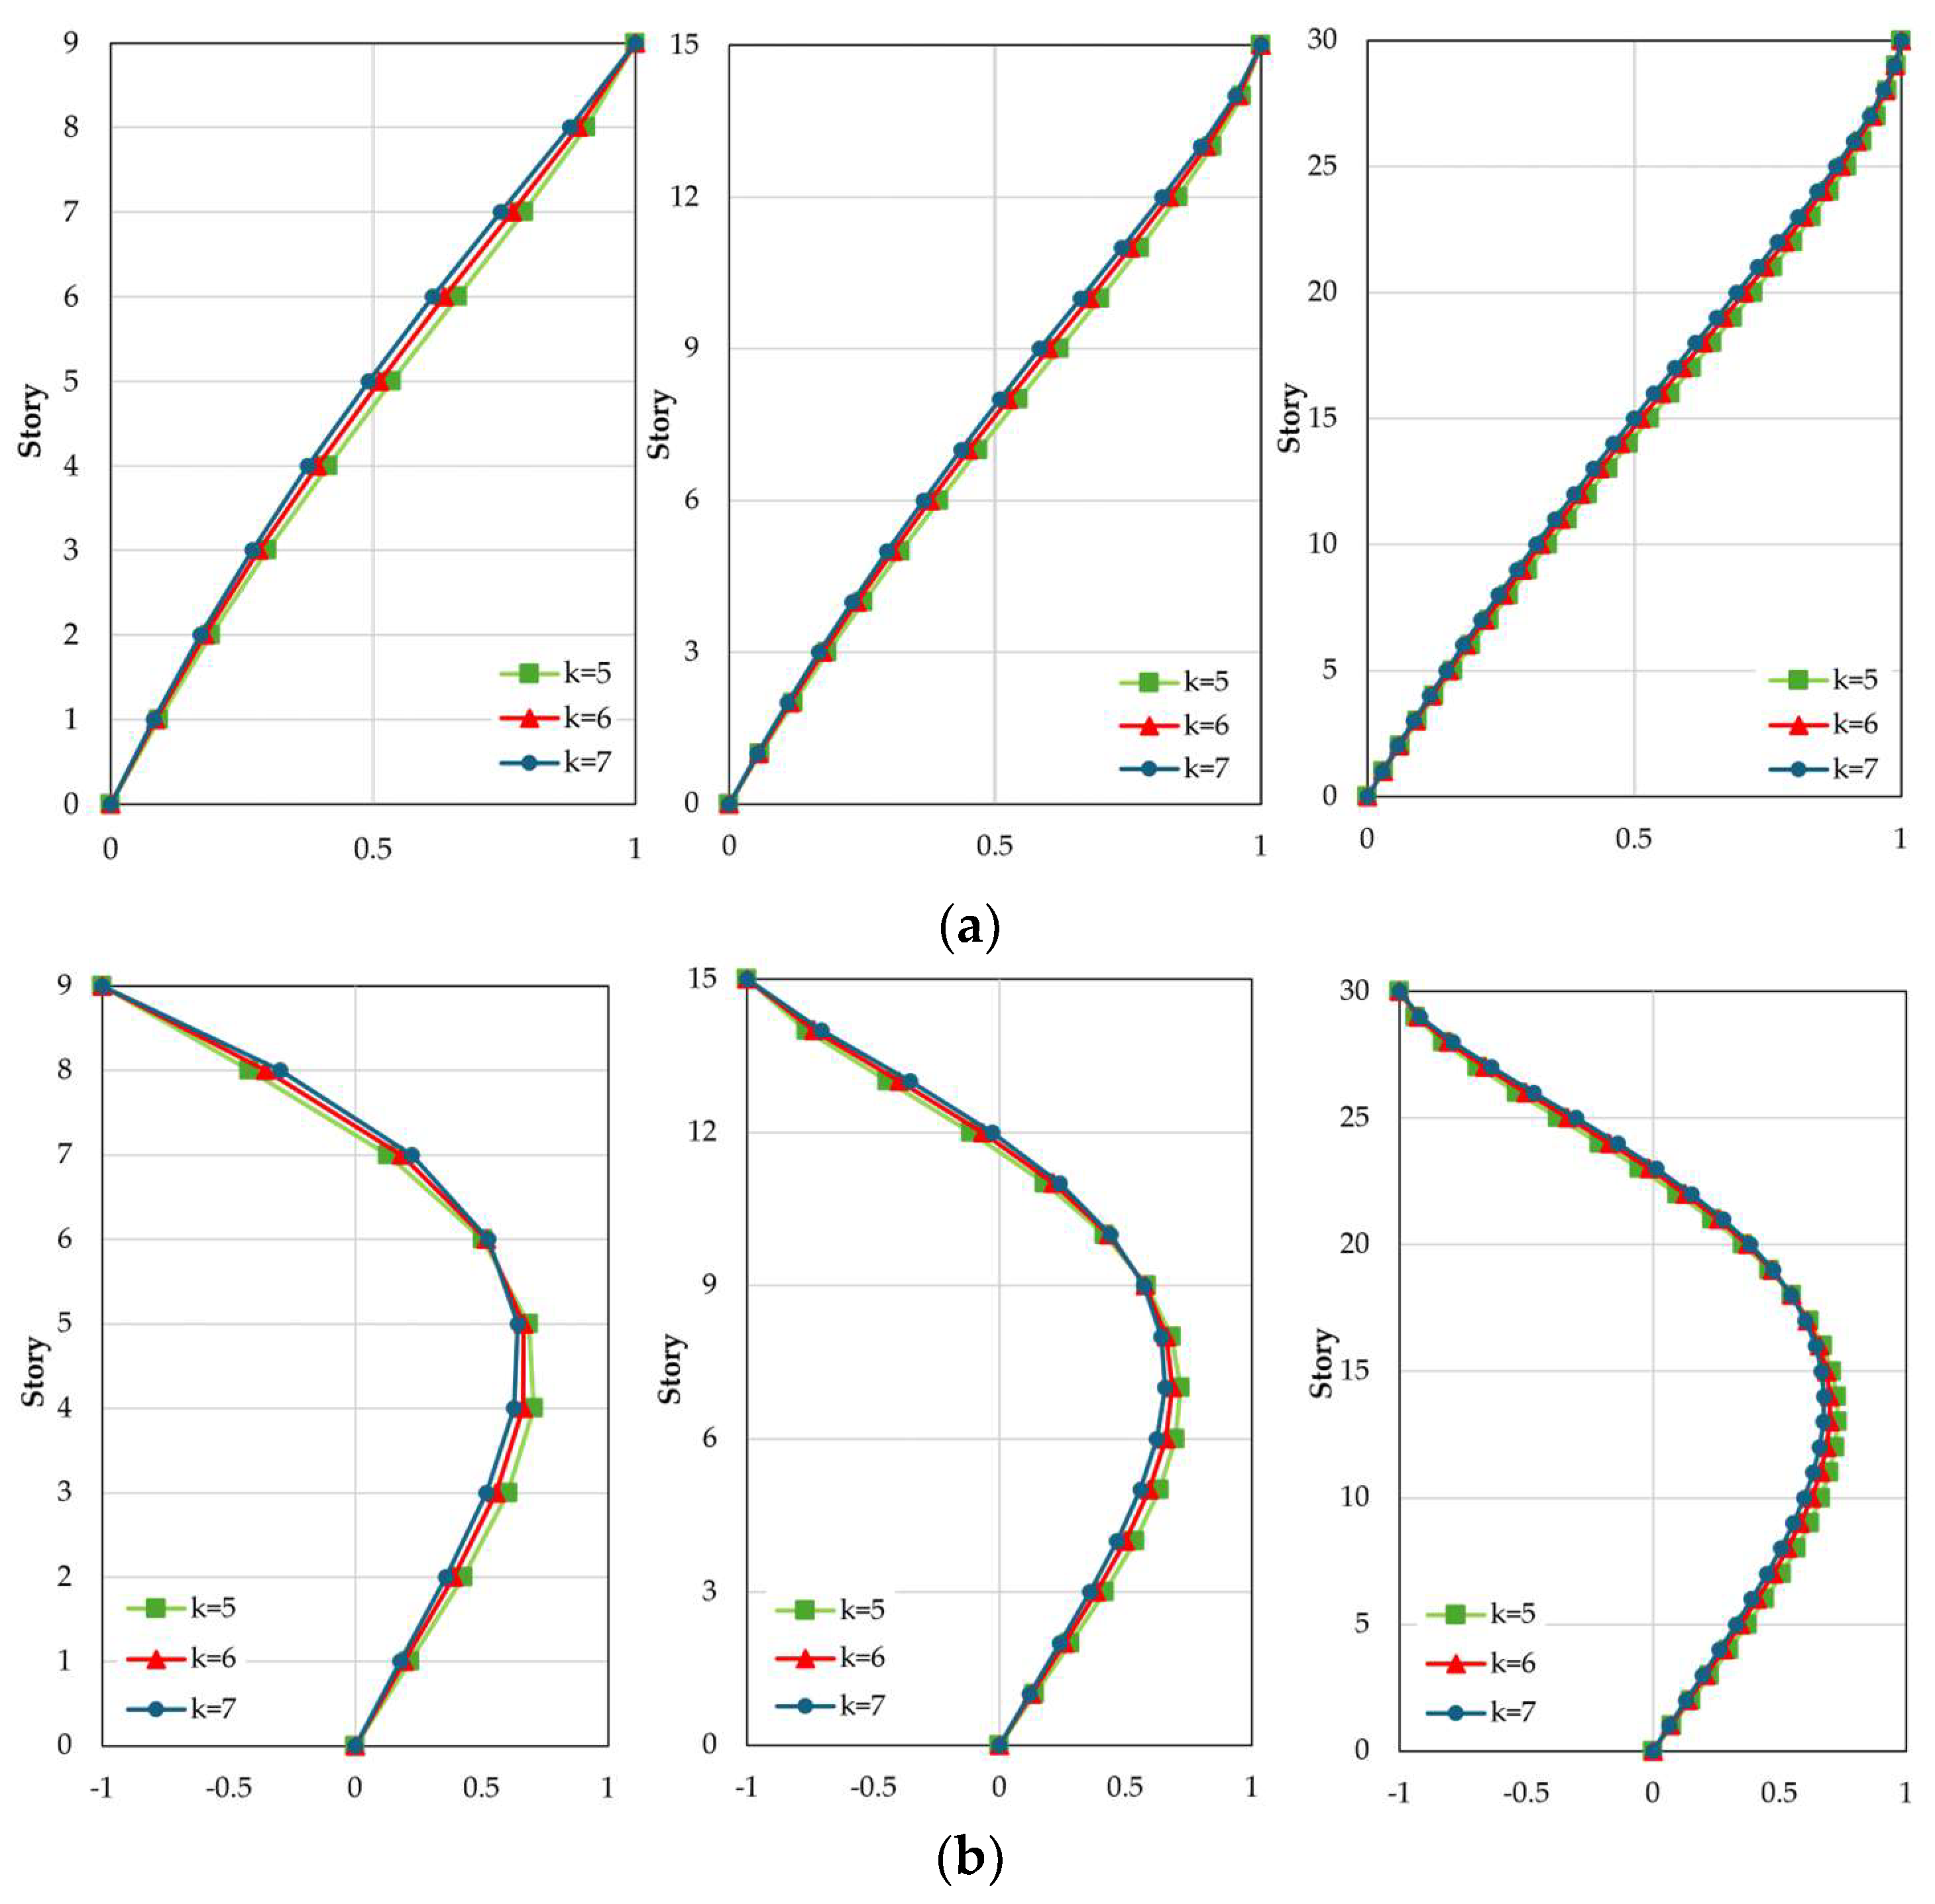
Then, assuming constant mass and height per story, different inter-story stiffness ratio values ( = 5, 6, 7) were considered in a comparative analysis conducted for 9-story, 15-story, and 30-story frames to assess the sensitivity of the assumed initial shape to changes in stiffness irregularity.
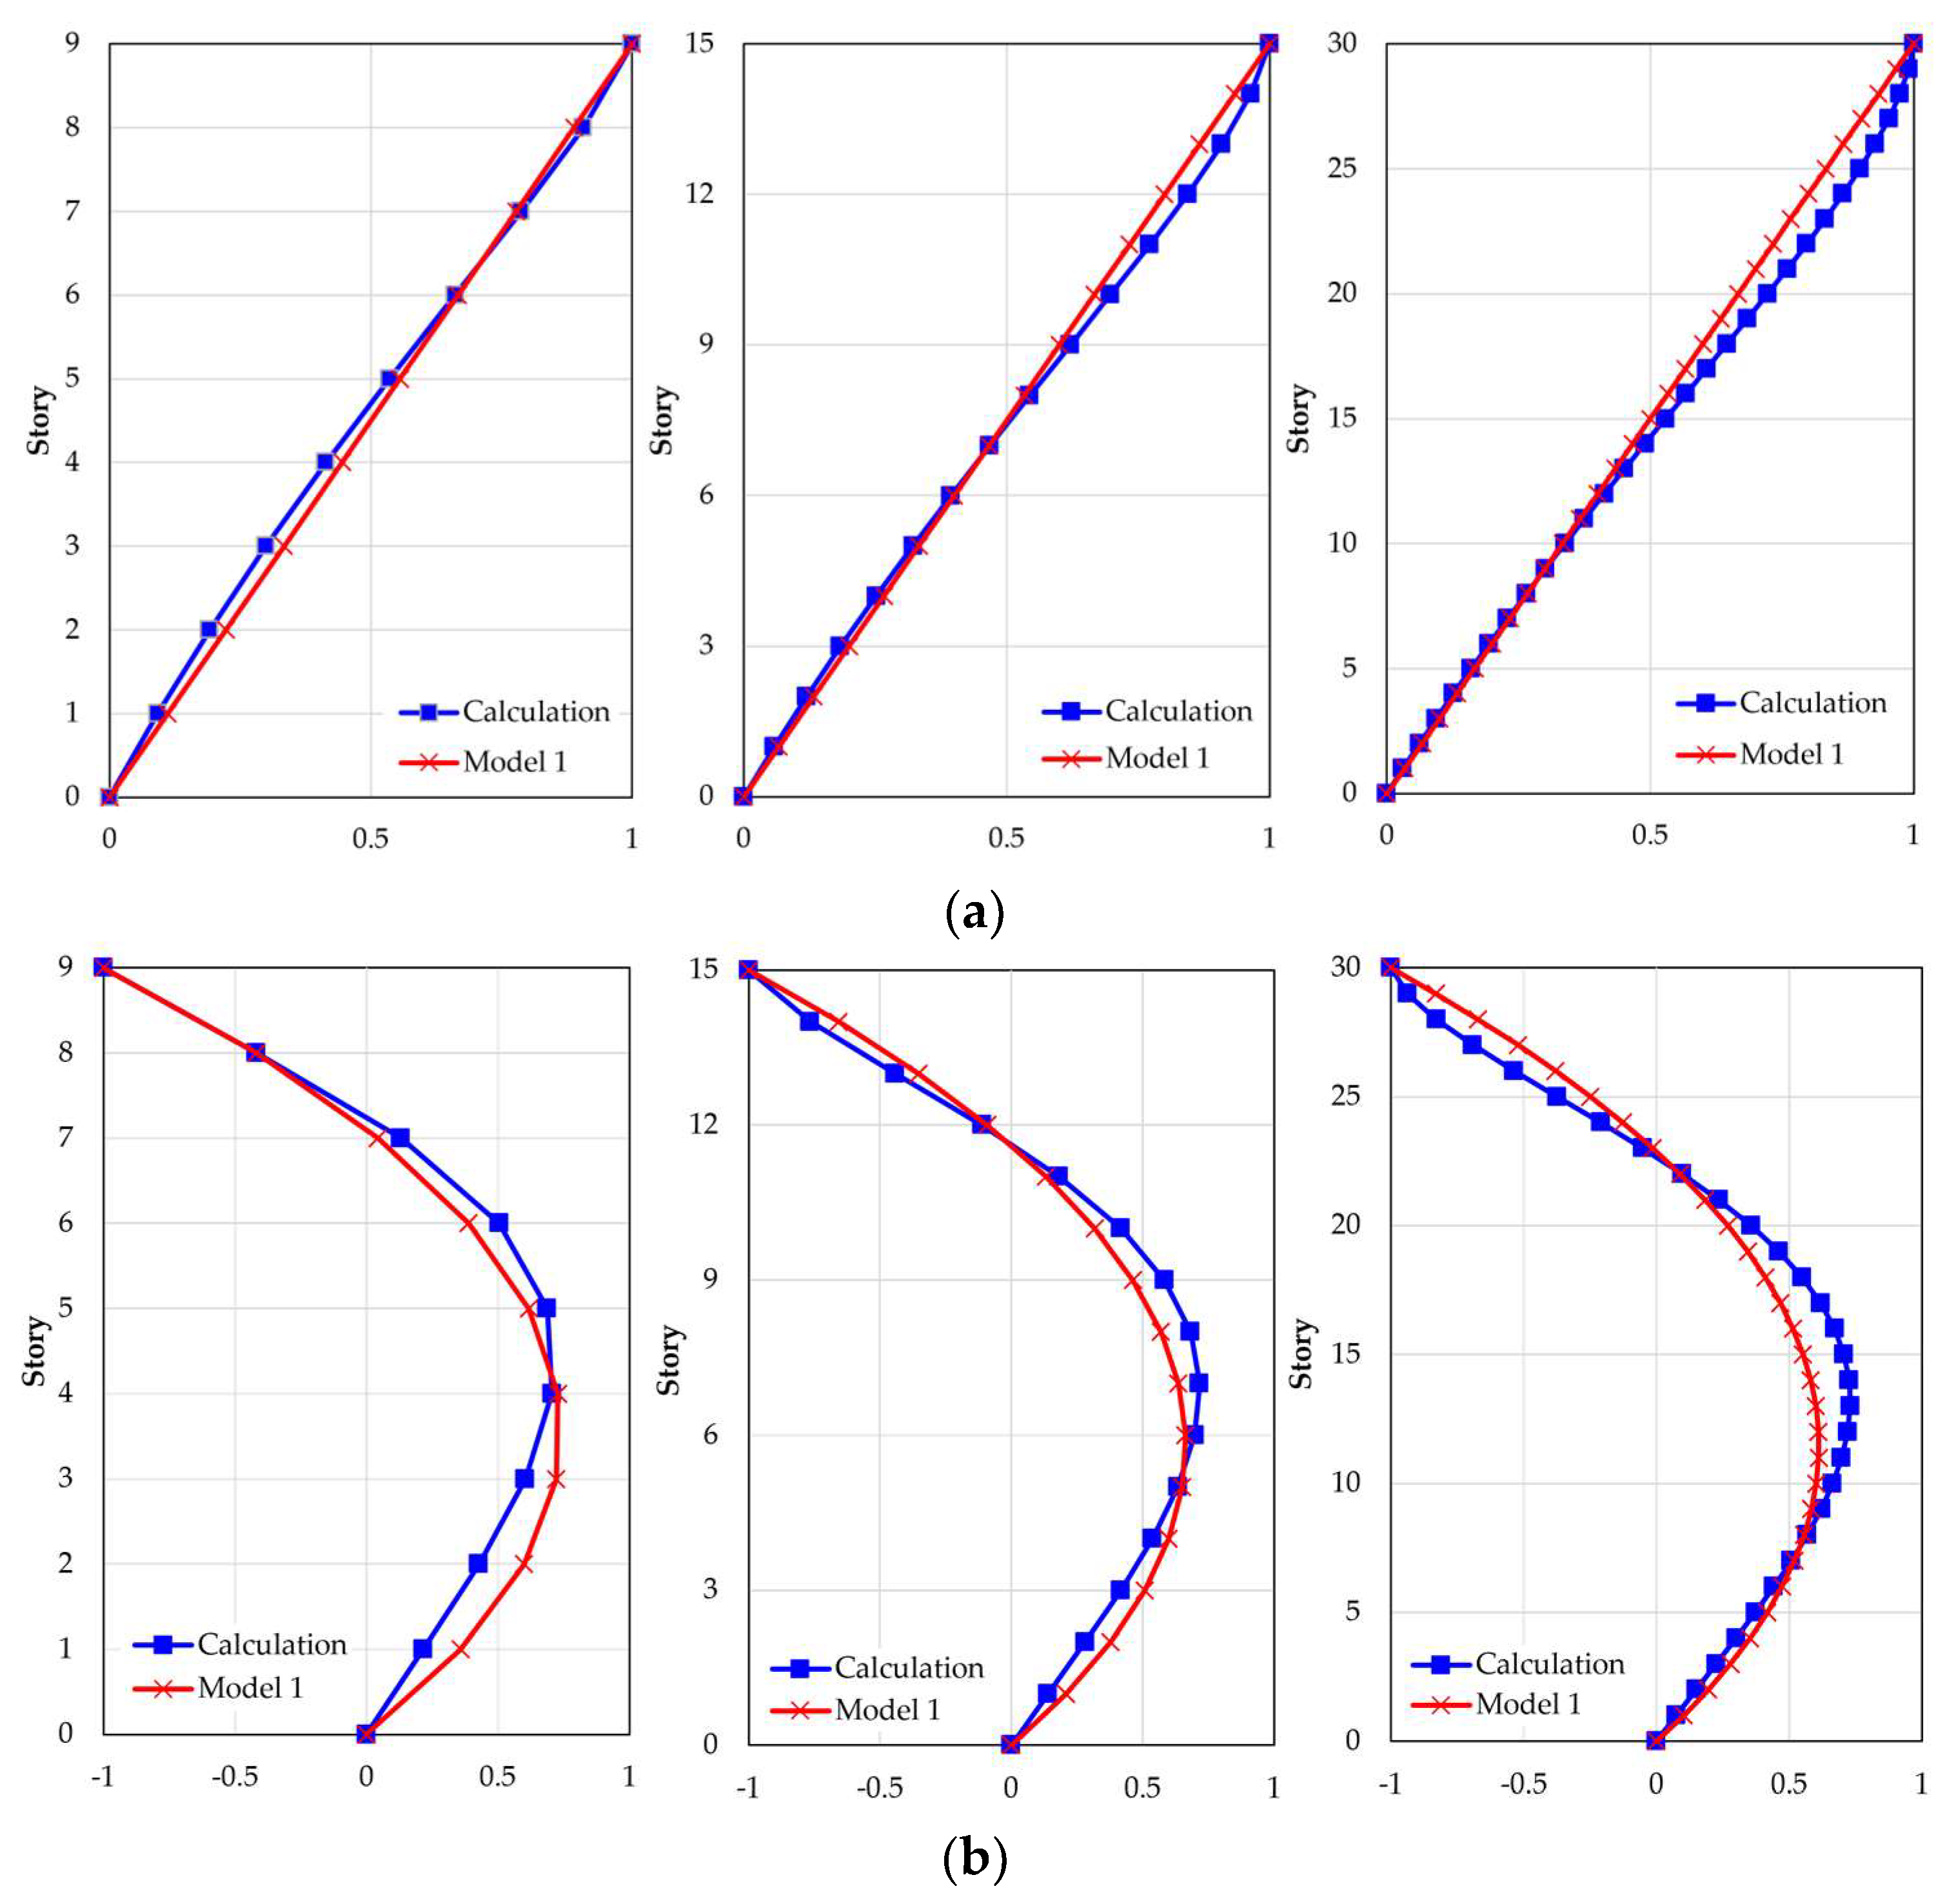
The results show that the first mode shape follows a linear distribution pattern, while the second mode shape displays a parabolic form, as shown in
Figure 1. To characterize both mode shapes, Equations (8) and (9) (referred to as Model 1 hereafter) are derived and validated as illustrated in
Figure 2. Here,
represents the total number of stories, and
denotes the mode shape for the i-th story and the j-th vibration mode.
2.1.2. Natural Period and Effective Mass
The first and second natural period
and effective masses
corresponding to the i-th vibration mode were then determined using Equations (10) and (11), respectively. Here,
represents the damping constant (set to
= 0.02),
is the i-th natural angular frequency,
is the mode shape vector for the i-th vibration mode, and
is the mass matrix.
represents the effective mass coefficient for the i-th vibration mode and is calculated using Equation (13), where
denotes the lumped mass at the i-th degree of freedom. The index
represents the total number of vibration modes considered in the analysis, where
spans from 1 to
.
The natural angular frequency, denoted as
, is computed using Equation (12), where
represents the mode shape for the i-th mode, while
and
are the stiffness and mass matrices, respectively.
2.1.3. Simplified Response Analysis Technique
Limit analysis with static proportional loading in three directions, considering up to the second vibration mode, is performed to identify critical failure mechanisms where multiple independent variables reach their maximum values simultaneously, as described by Turkstra’s rule [
29]. The collapse form at the minimum load is considered the true collapse mode, with the corresponding load defined as the collapse load. The three load distribution patterns are presented in Equations (14)–(16). Here,
multiplier is used to scale the load distribution vector
, {
} denotes the j-th load basis vector, while the value of the mode contribution ratio
is determined by (
), where
) corresponds to the acceleration response spectrum value for the j-th natural period.
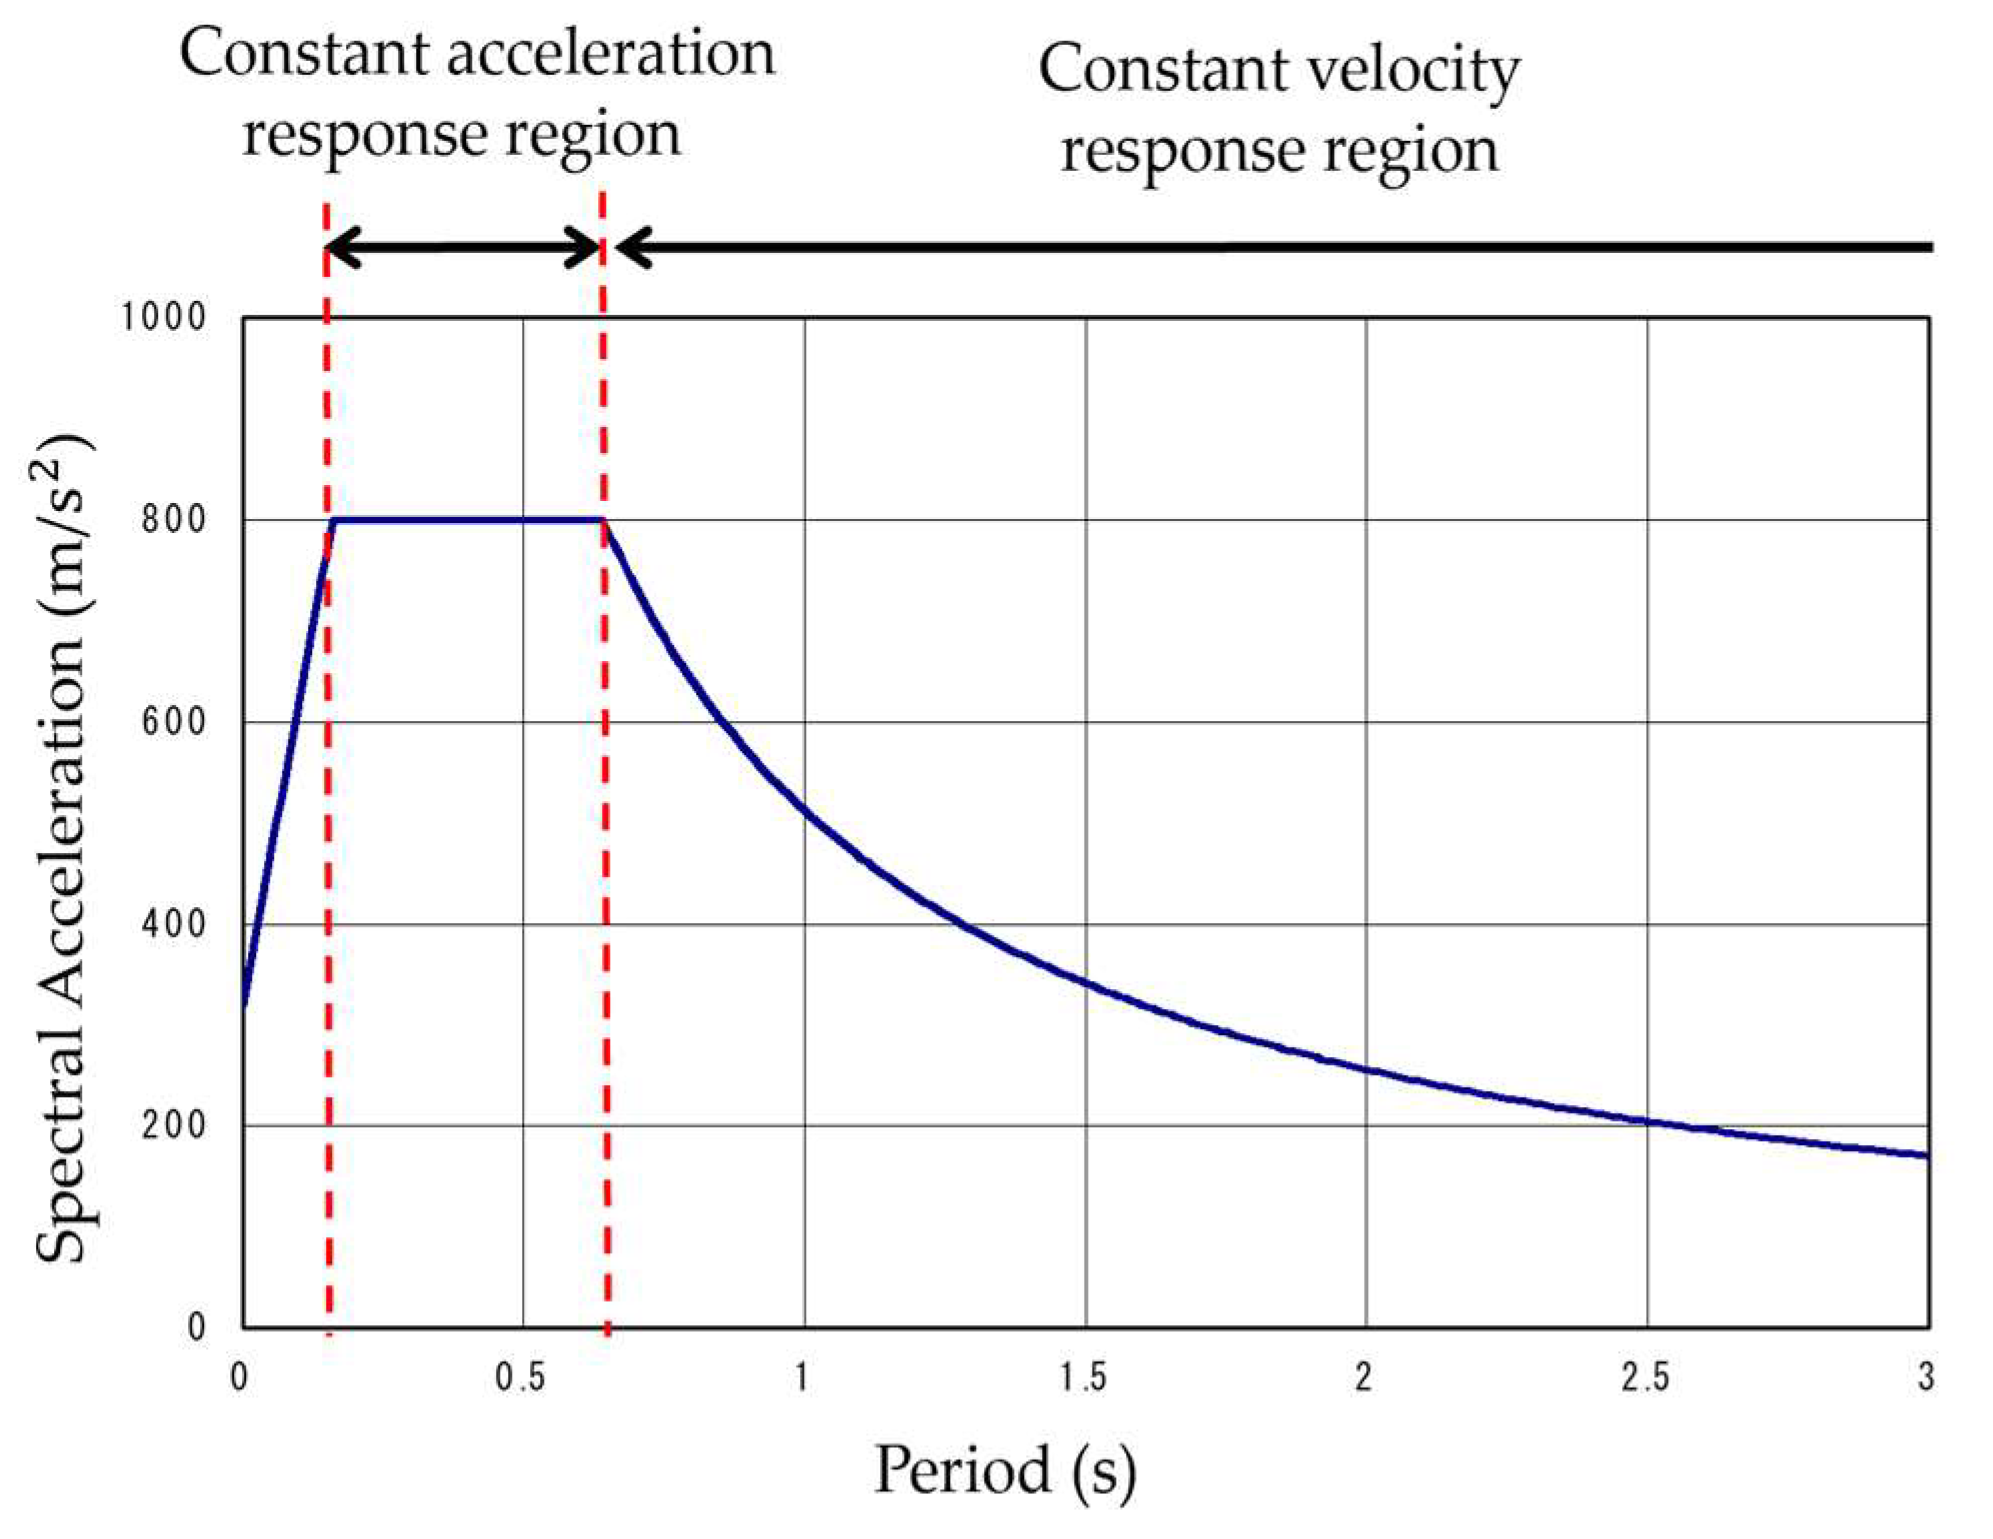
For low-rise frames with shorter natural periods, it is assumed that they fall within a region of constant acceleration response, as indicated by the design acceleration response spectrum curve in
Figure 3, where
. In contrast, for high-rise frames with longer natural periods, the velocity response is assumed to remain constant, with
equal to 1/(
).
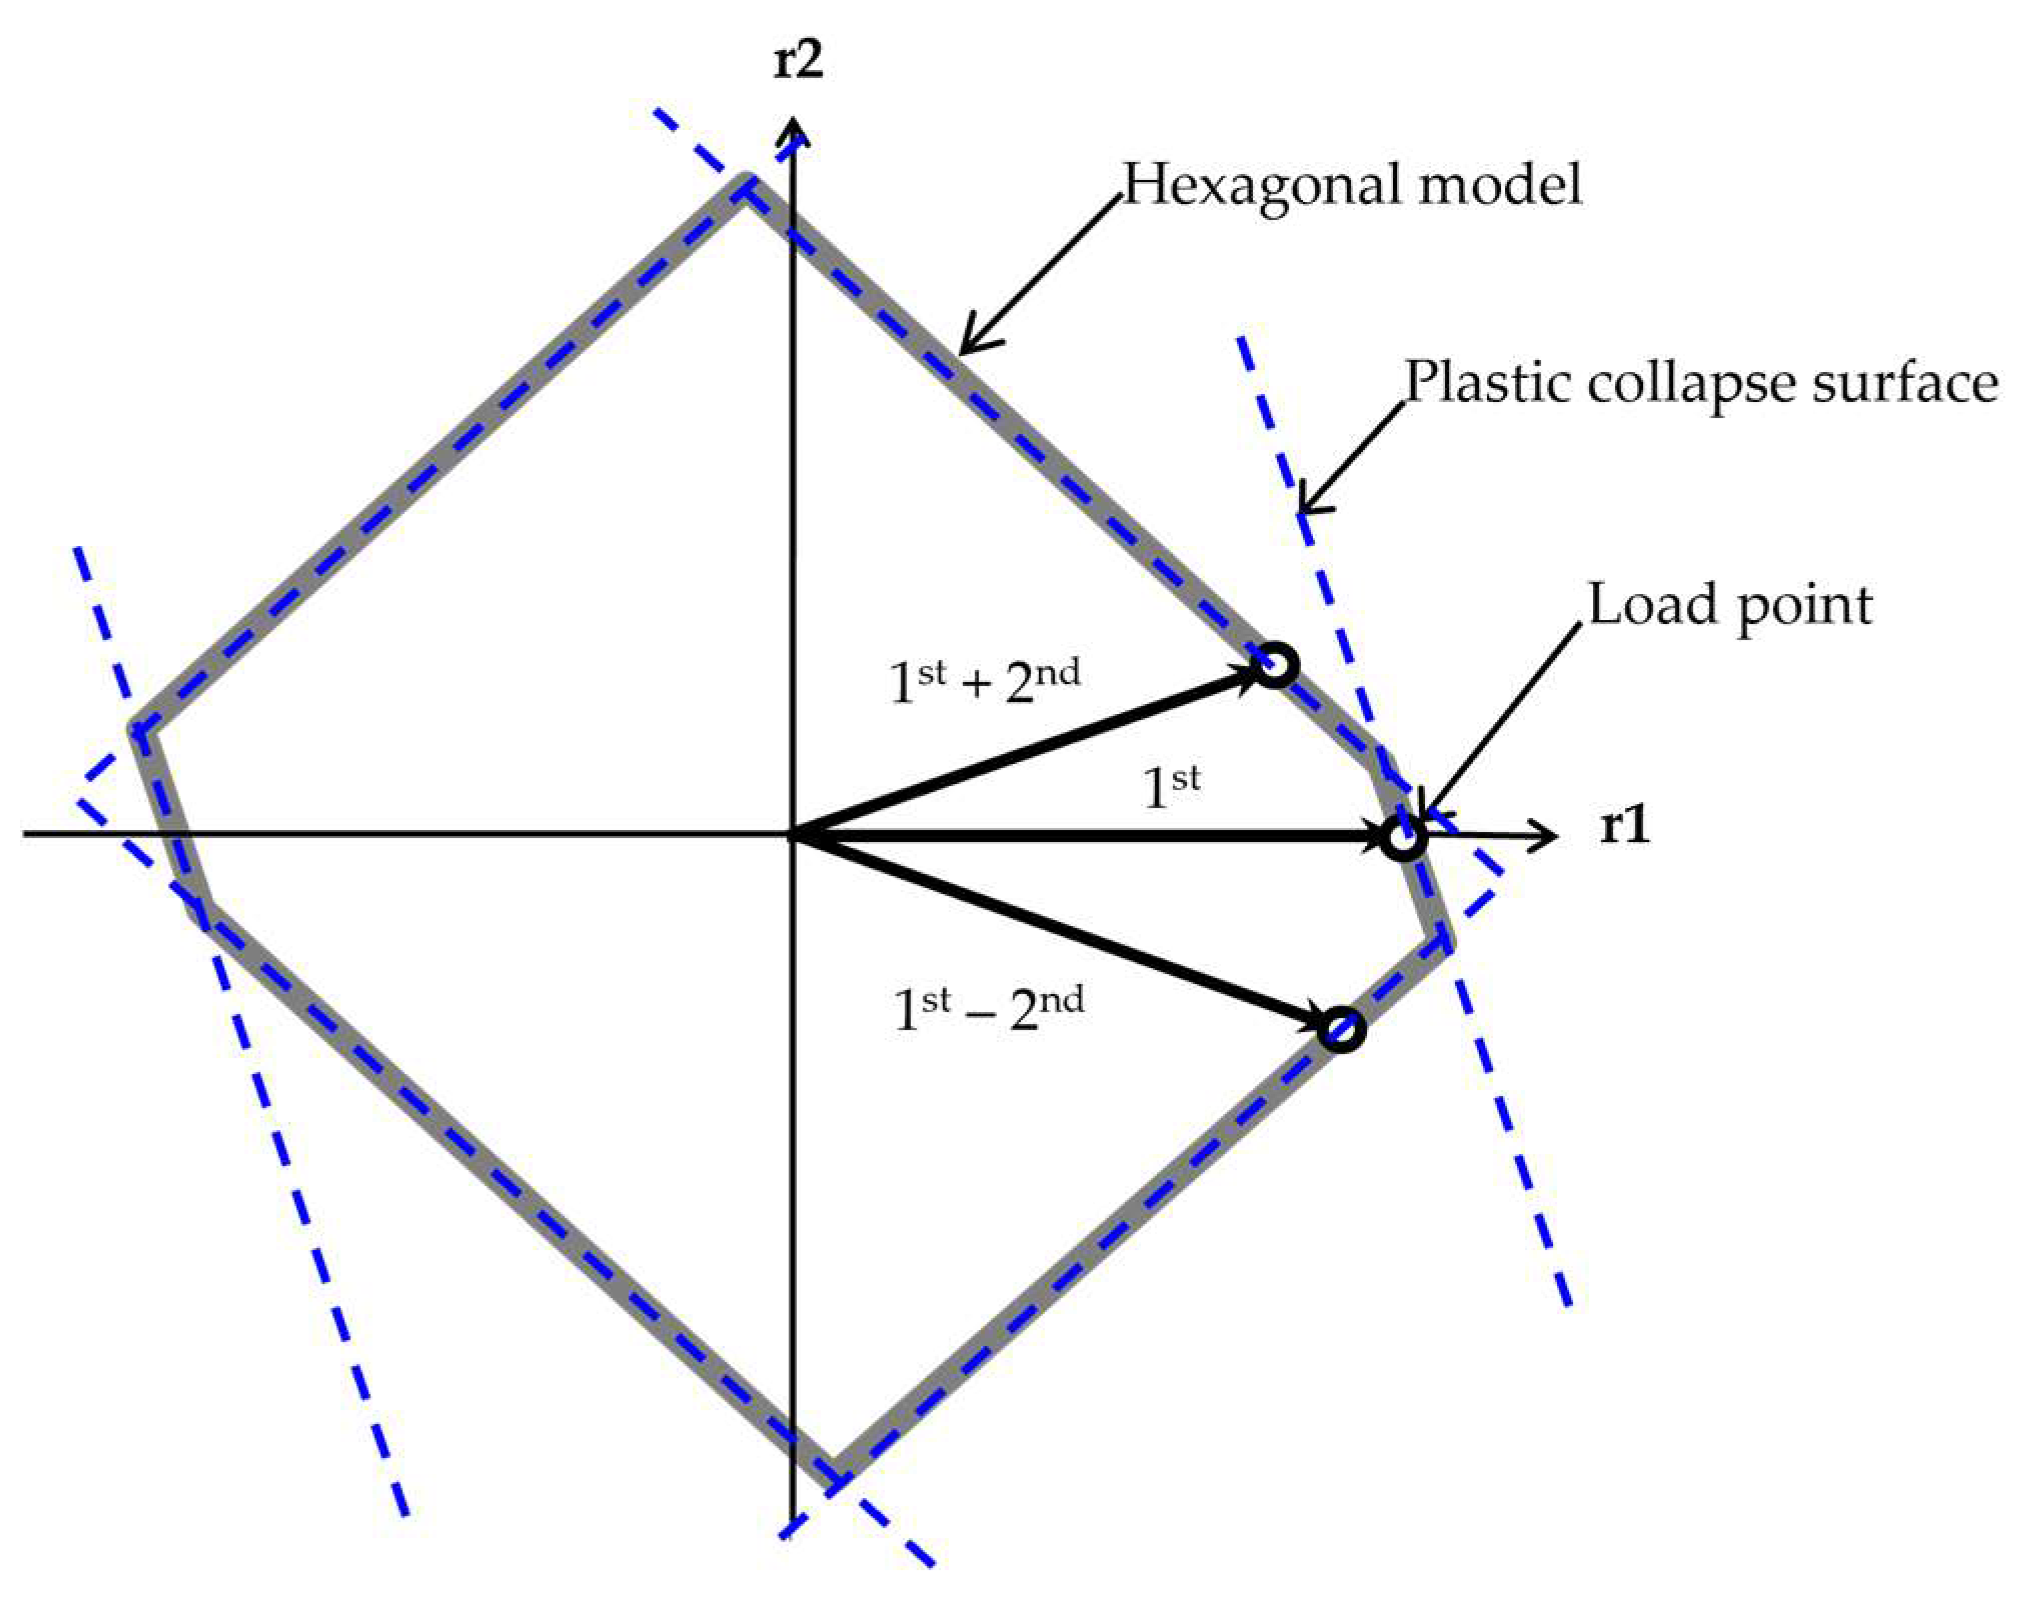
By analyzing the three load points from limit analysis with proportional loading in three directions, the failure surface model of the frame is developed, defining the safety region. When failure forms coincide, the safety region takes the shape of a parallelogram or parallel lines, ultimately forming a hexagonal configuration in the 2D mode restoring space. If a load point lies on the plastic collapse surface, the collapse mode of the frame is determined. Within this region, the frame remains stable under applied loads, with the inner zone designated as the safe region against plastic collapse. This relationship is expressed in the mode coordinate system as
. Here, a represents the vector of modal contribution factors, r is the modal restoring force vector, while
denotes the plastic collapse load.
Figure 4 illustrates the formation of a hexagonal plastic collapse surface model.
To calculate the partial mode displacement increment for the framework, its elastic–plastic restoring forces are monitored and updated within the partial mode restoring force space. The mode displacement increment is derived using the central difference method, as defined by Equation (17), where
represents the j-th mode displacement increment in mode coordinates,
is the j-th mode restoring force,
is the damping constant,
is the angular frequency for the j-th mode,
is the effective mass for the j-th mode,
is the ground acceleration, and Δt is the time increment.
Transformations between displacement and force coordinates from the normal to the modal coordinate system are applied using the normalized modal participation matrix [Φ], as defined in Equations (18) and (19). In these equations, {q} represents the modal displacement vector, {f} is the original restoring force vector, and {r} is the modal restoring force vector. Each load basis vector
corresponds to the lateral load pattern for each mode of vibration.
Once the mode displacement increments are determined, the modal restoring force increment can be computed using Equation (20), where
denotes the modal stiffness. Assuming the system is in an elastic state, the modal restoring forces can be written as in Equation (21).
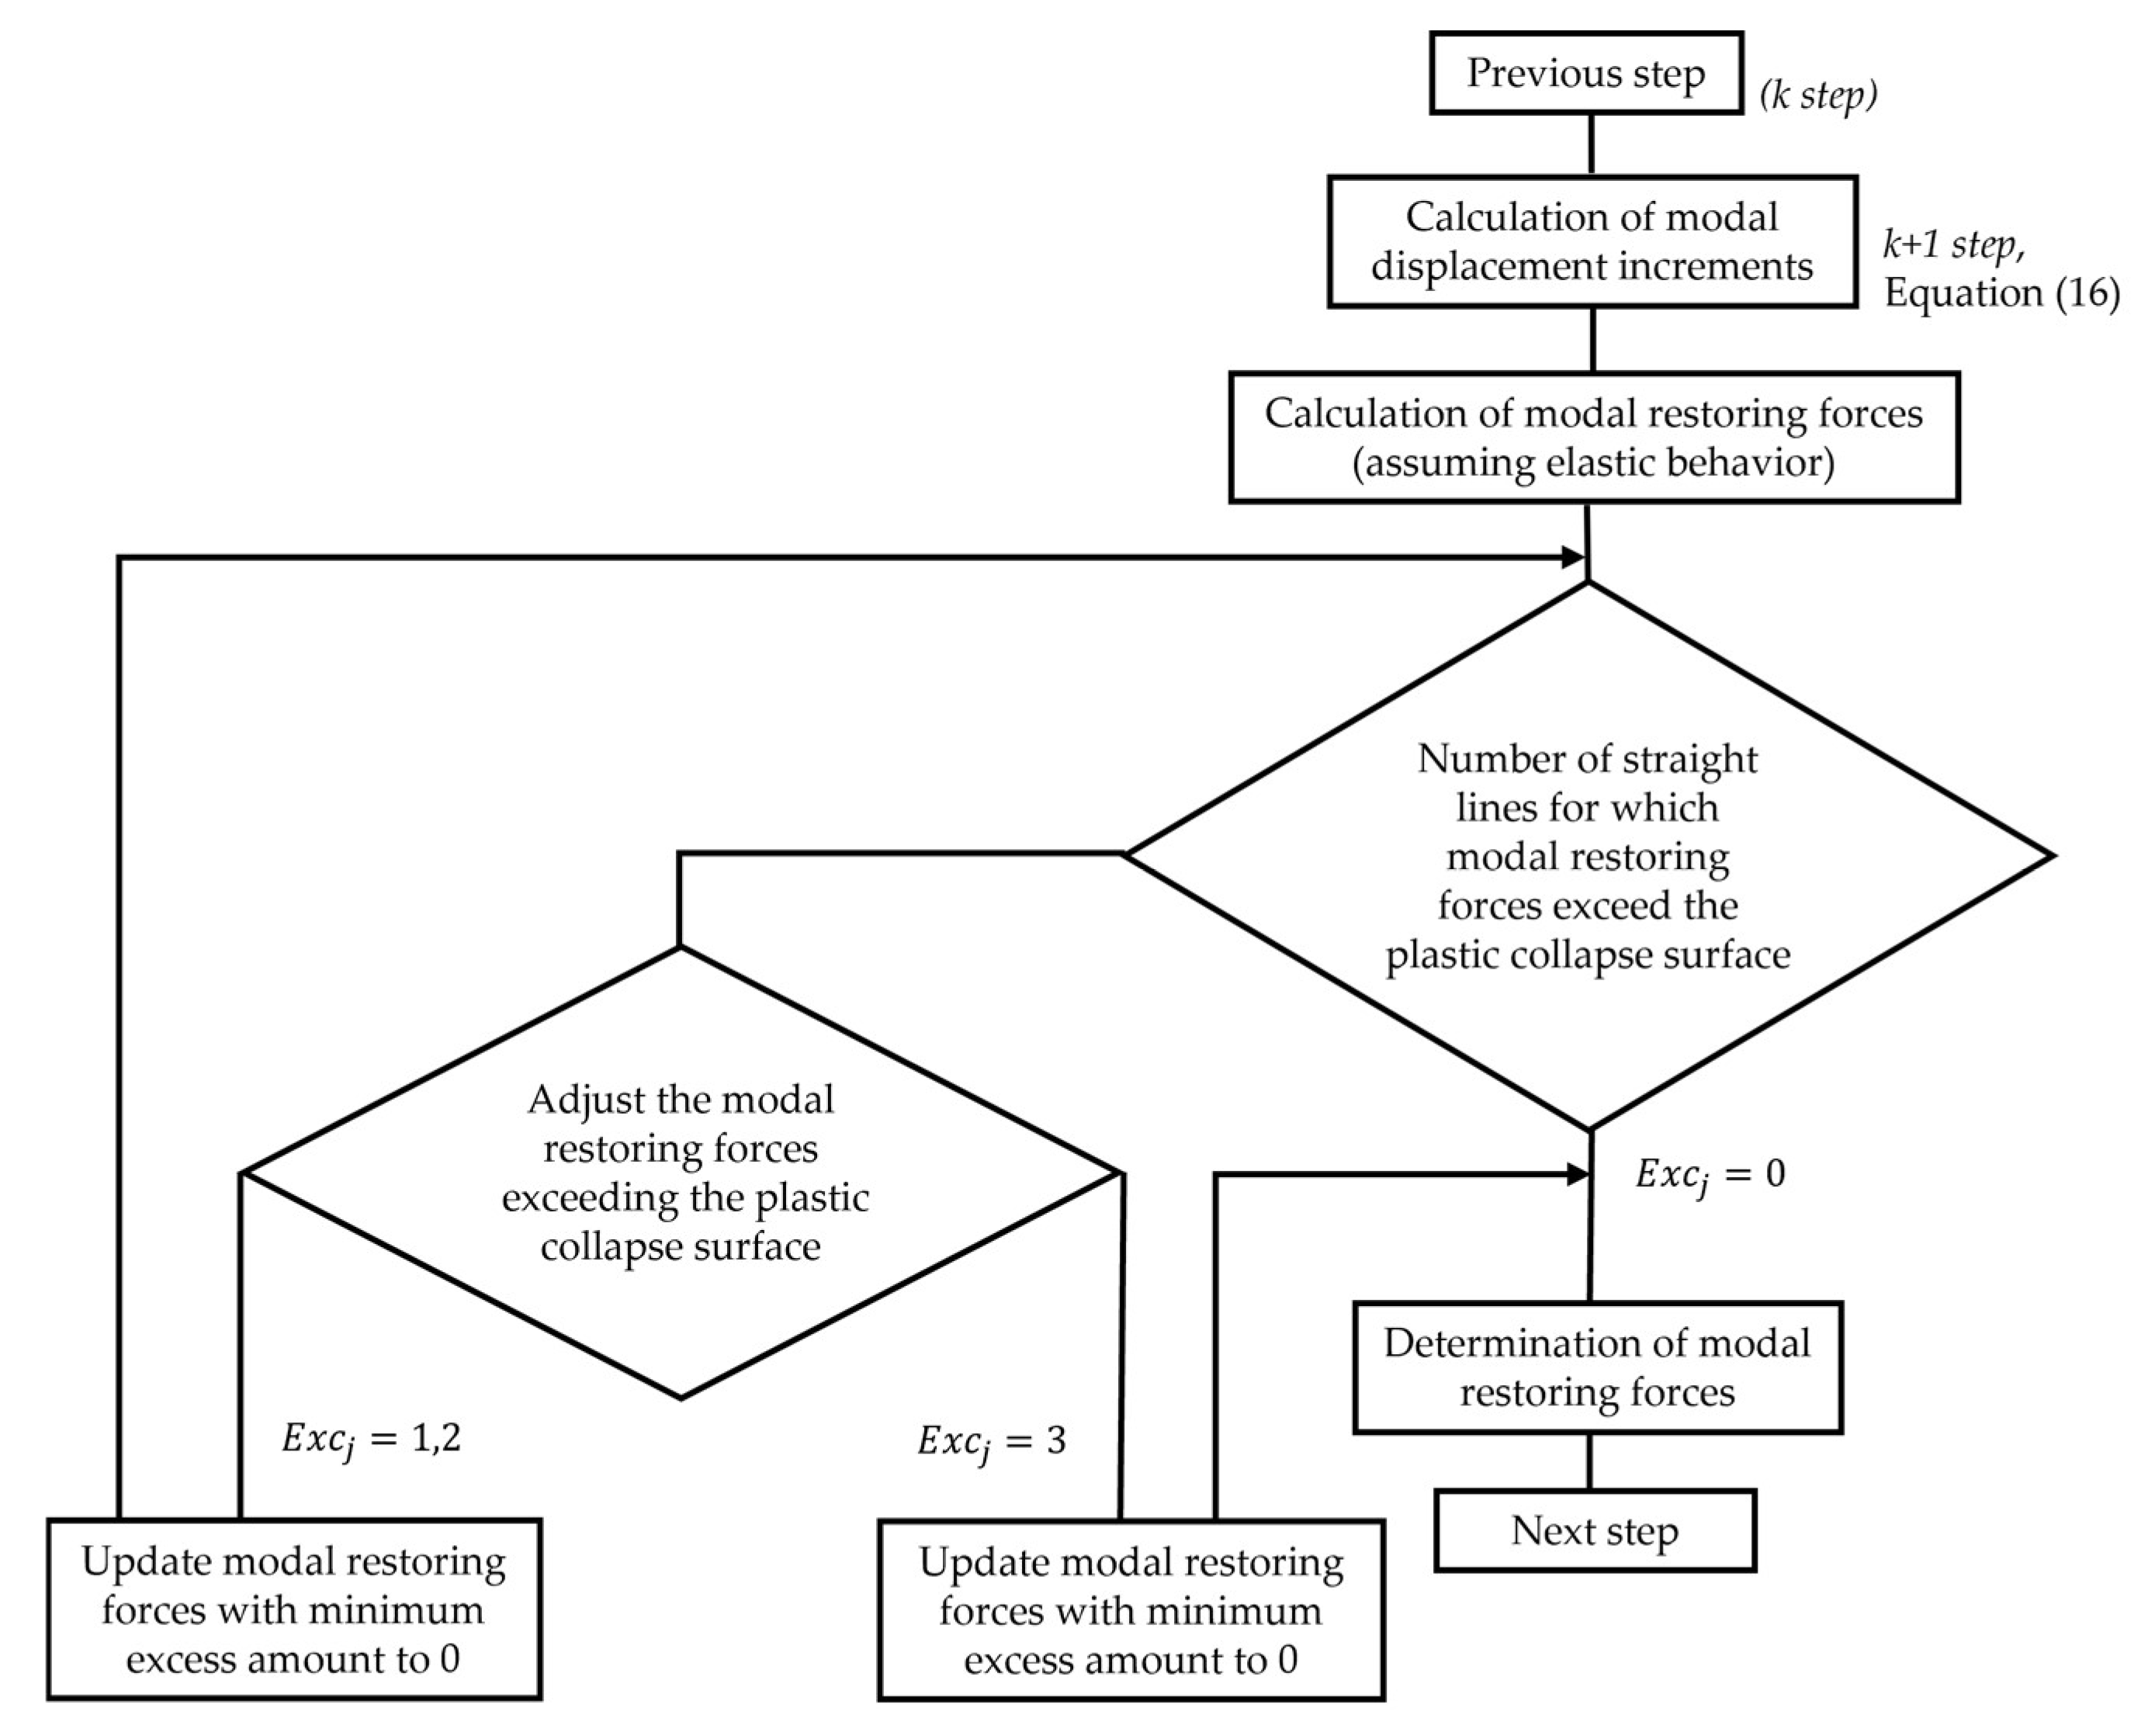
The position of the mode restoring force
relative to the hexagonal model, whether it falls within or beyond the boundary, is determined by Equation (22). Based on this, the excess coefficient
is subsequently calculated as follows:
: Inside the hexagonal model, ;
: Outside the hexagonal model, ;
: Outside the hexagonal model, .
When the load point lies within the hexagonal plastic collapse boundary, the modal restoring force is in an elastic state, whereby
. However, all the modal restoring force which exceeds the boundary lines are to be corrected using Equation (23) so that the mode restoring force
at time (
stays within the hexagonal surface model. The same operations are to be repeated until all the restoring forces end up within the boundary lines.
Figure 5 illustrates the process of updating modal restoring forces in simplified response analysis, with
representing the excess coefficient.
3. Evaluation of the Simplified Response Analysis Method
To assess the applicability of the proposed simplified response analysis, a comparative analysis was conducted. The primary objective was to validate its accuracy by comparing the results with detailed seismic response analysis performed using SAP2000 v23.
3.1. Simplified Response Analysis on a Multistory Frame
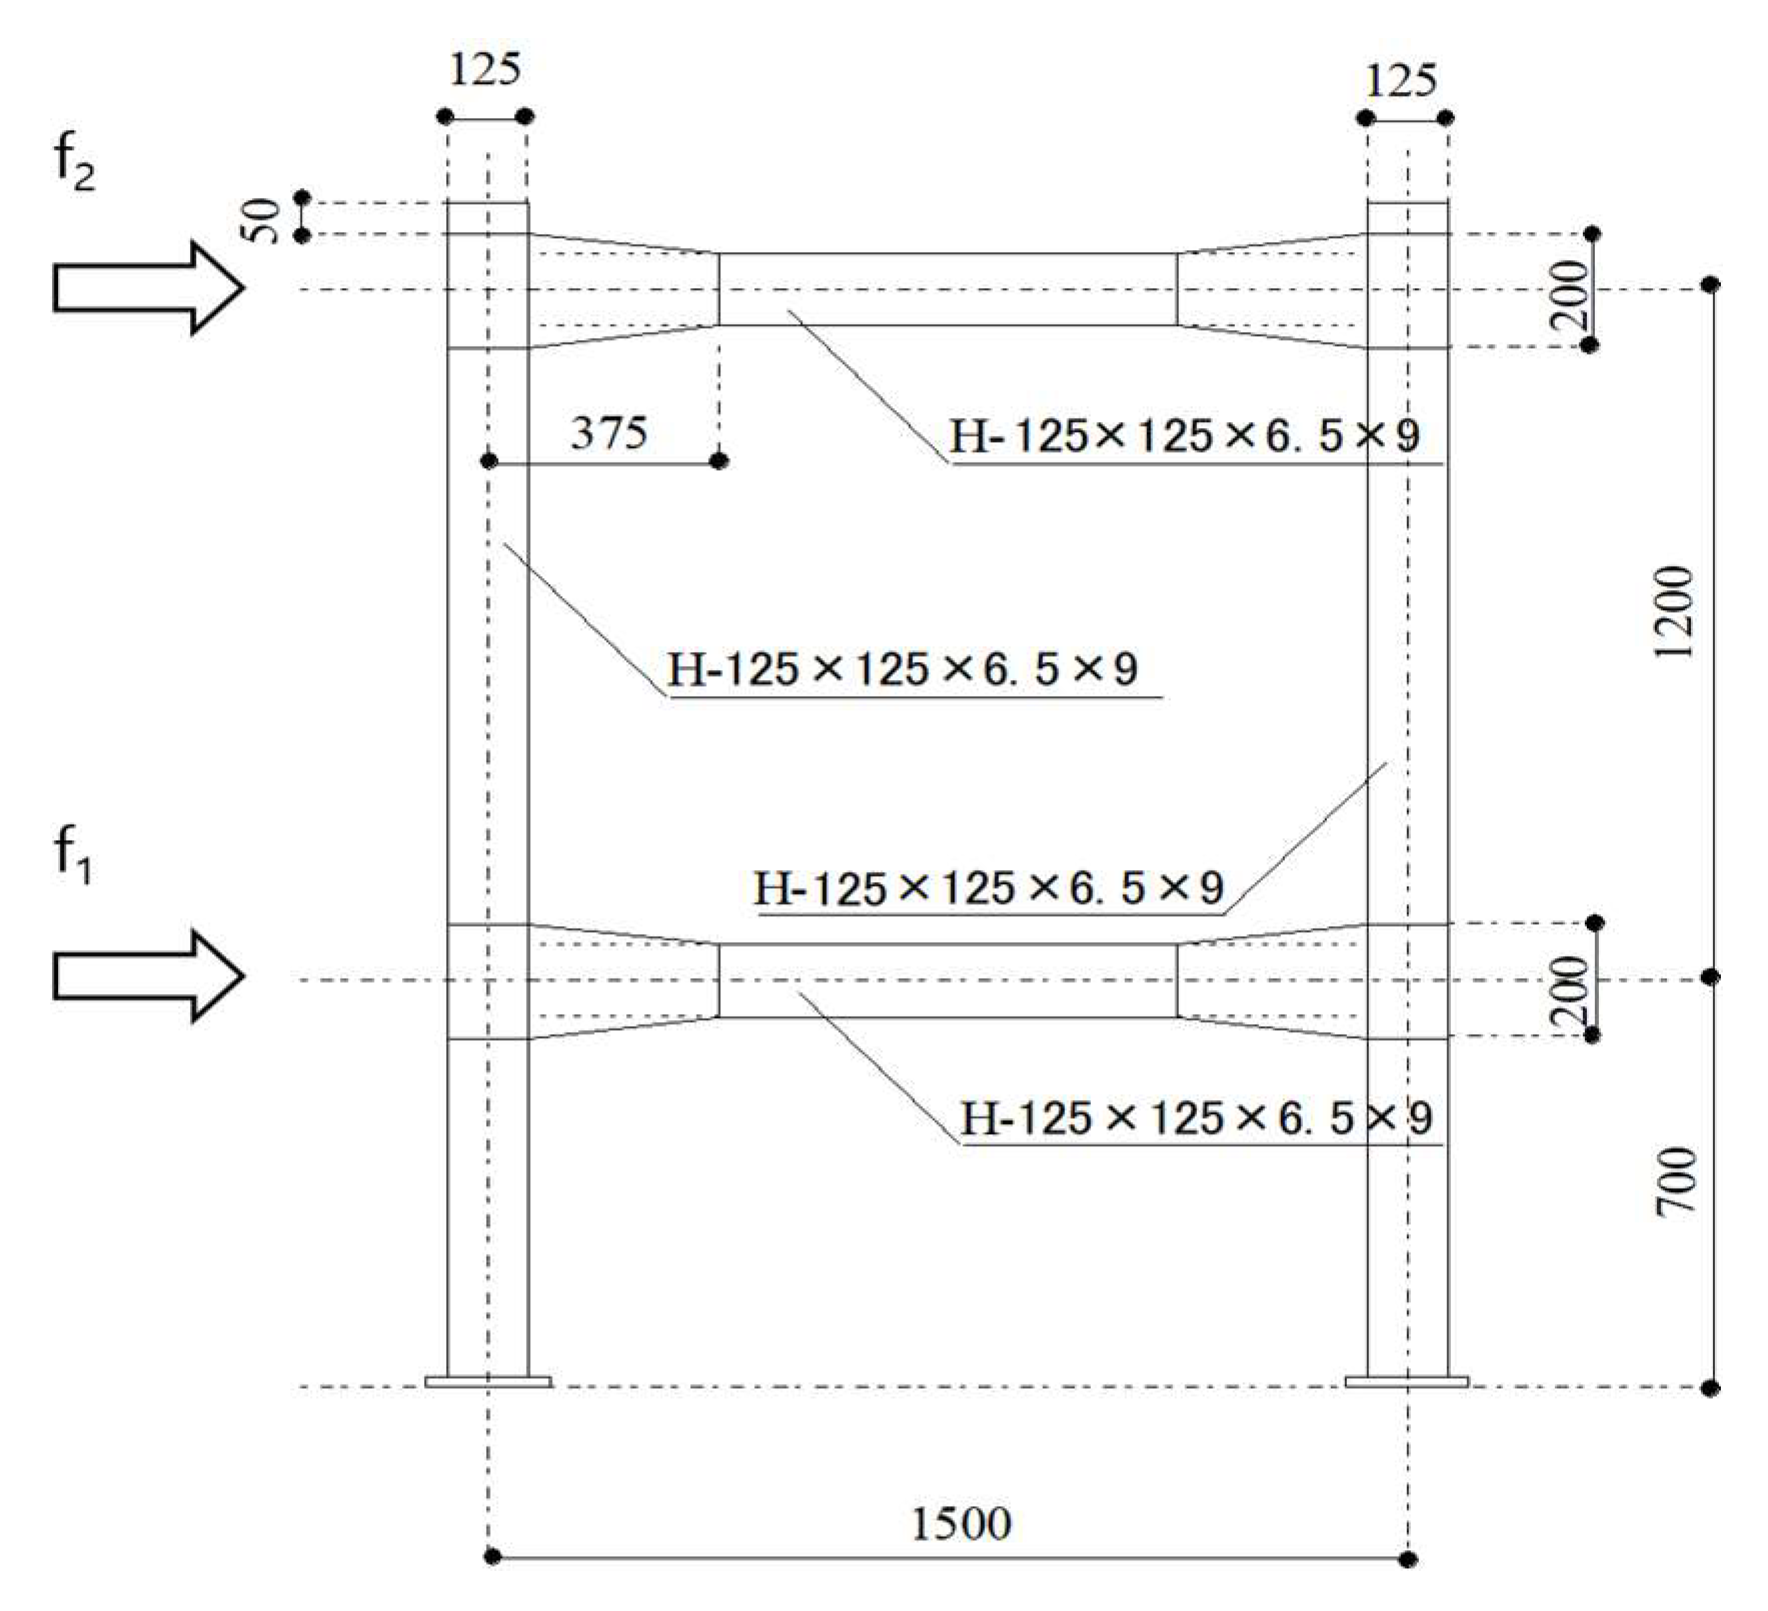
Description of the Test Frame
The test structure used in the seismic response experiment is a two-story one-span frame that utilizes SS400 steel with a yield strength of 348 N/mm
2, and the column-to-beam joints are considered rigid. Assuming each floor has a mass of 20,000 kg, the El Centro NS ground motion, with a peak ground acceleration of 10 m/s
2 and a duration of 10 s, is used as the input seismic excitation, with a response time also set to 10 s.
Figure 6 illustrates the two-story, one-bay frame test structure used in the seismic response test, providing the cross-sectional dimensions and measurements of its structural components, while
Table 1 presents the elastic properties of the test structure.
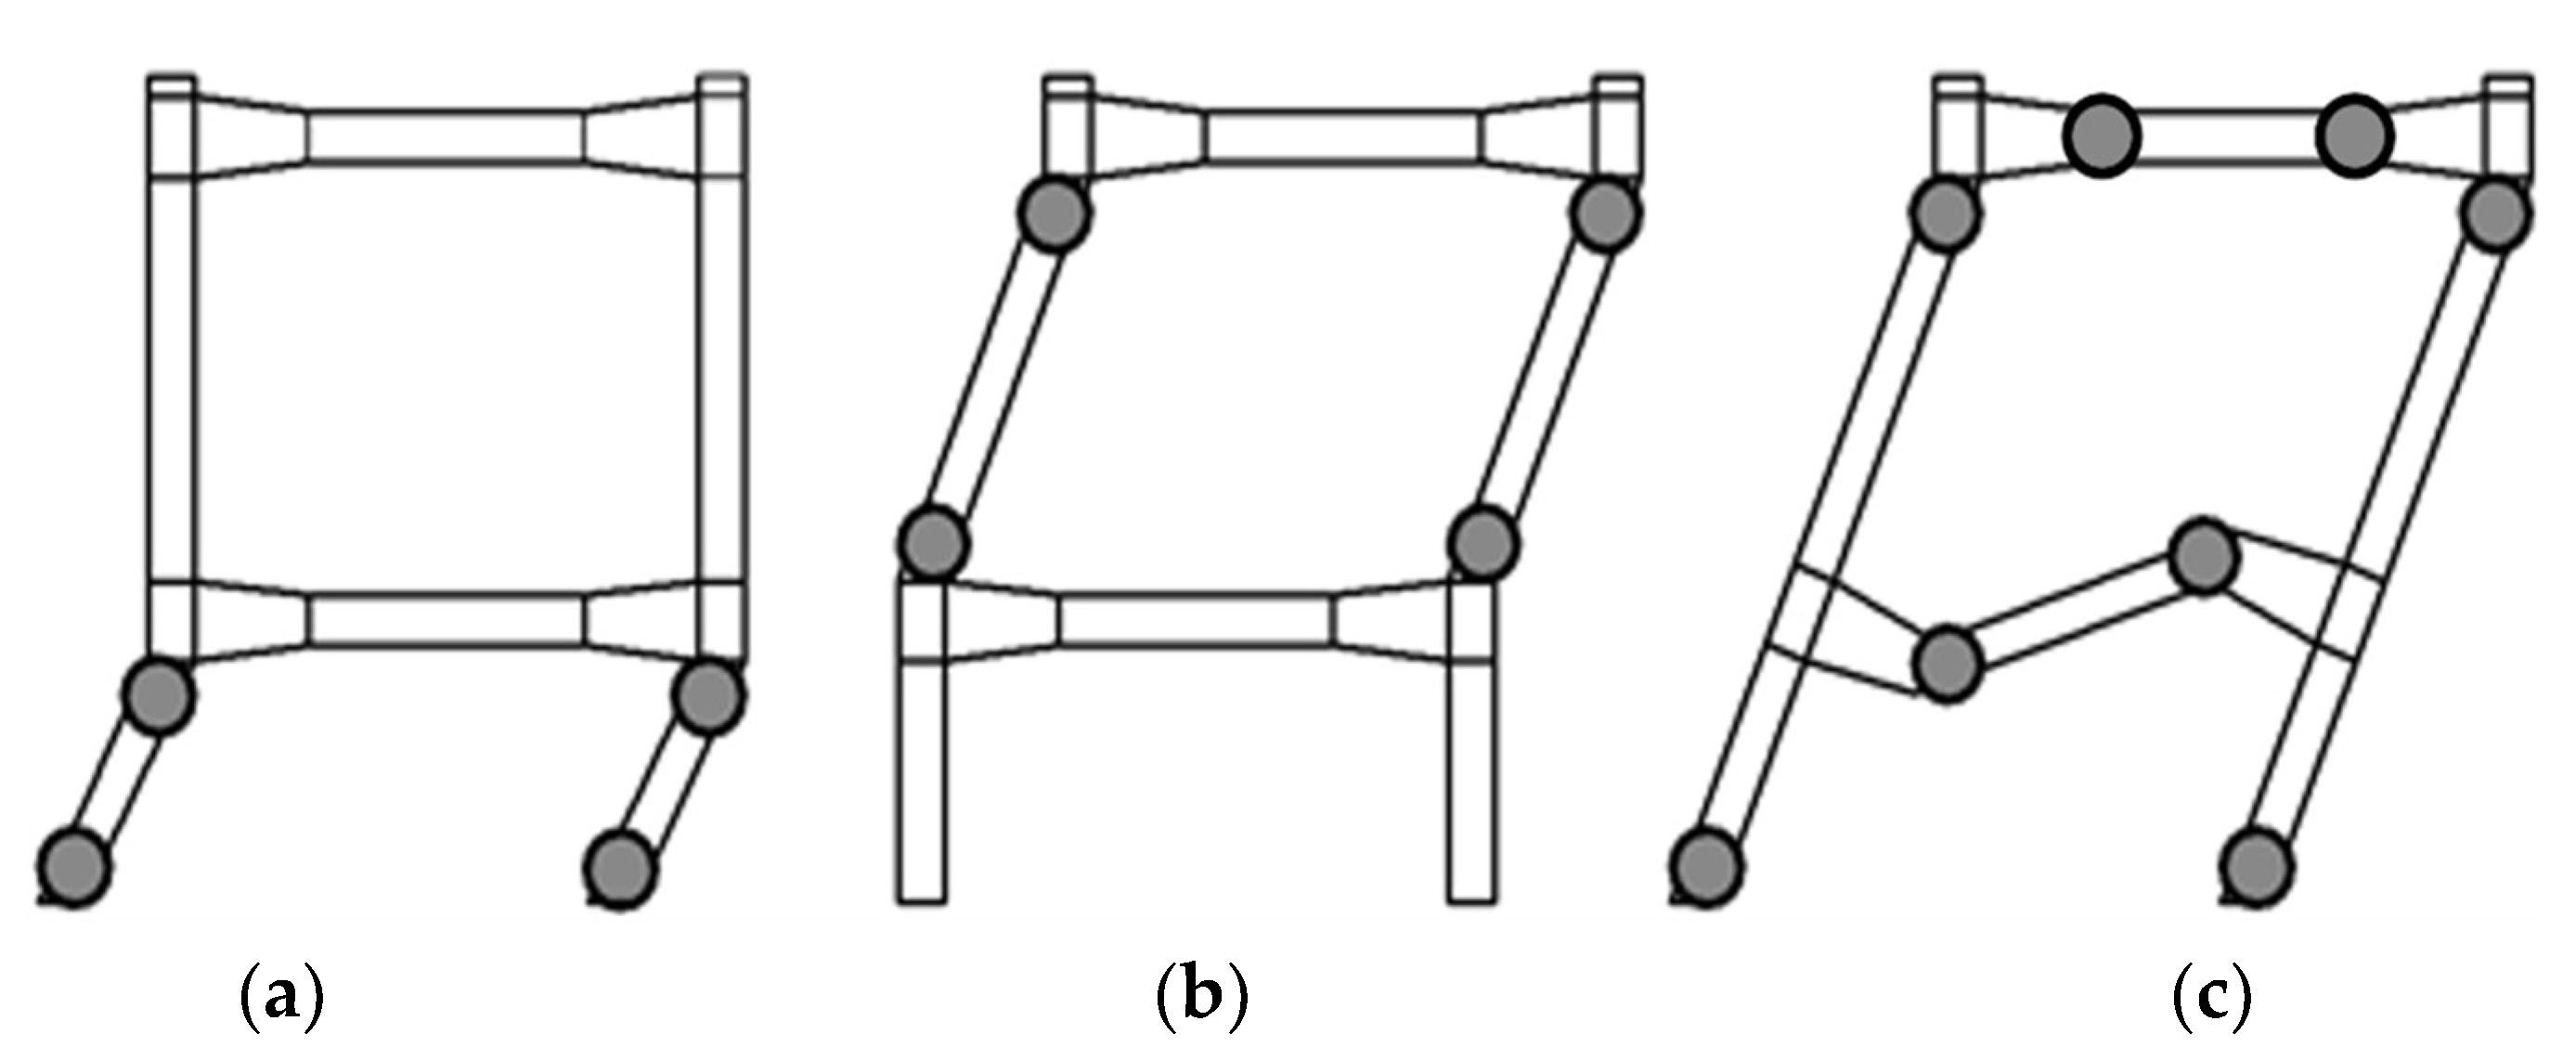
In the response analysis, the three collapse forms of the two-story frame are represented in
Figure 7, with corresponding virtual work equations as follows:
Single-story collapse: ;
Two-story collapse: ;
Total collapse: .
Here, represents the plastic moment capacity, denotes the lateral forces acting on the i-th story, and is the story drift angle.
The collapse form remains consistent, but the collapse surface in the secondary mode restoring space changes depending on mass distribution and vibration mode type. In the case where the story mass ratio (M1/M2) equals 1 (uniform load distribution), the acceleration response spectrum assumes constant acceleration response for both the first and second natural periods, which equates to = . Given that the ratio of the second effective mass to the first effective mass is , the resulting lateral load distribution patterns are as follows:
Primary load pattern: ;
Primary + secondary load pattern: ;
Primary − secondary load pattern: .
Here, represents the j-th mode shape vector corresponding to the i-th story.
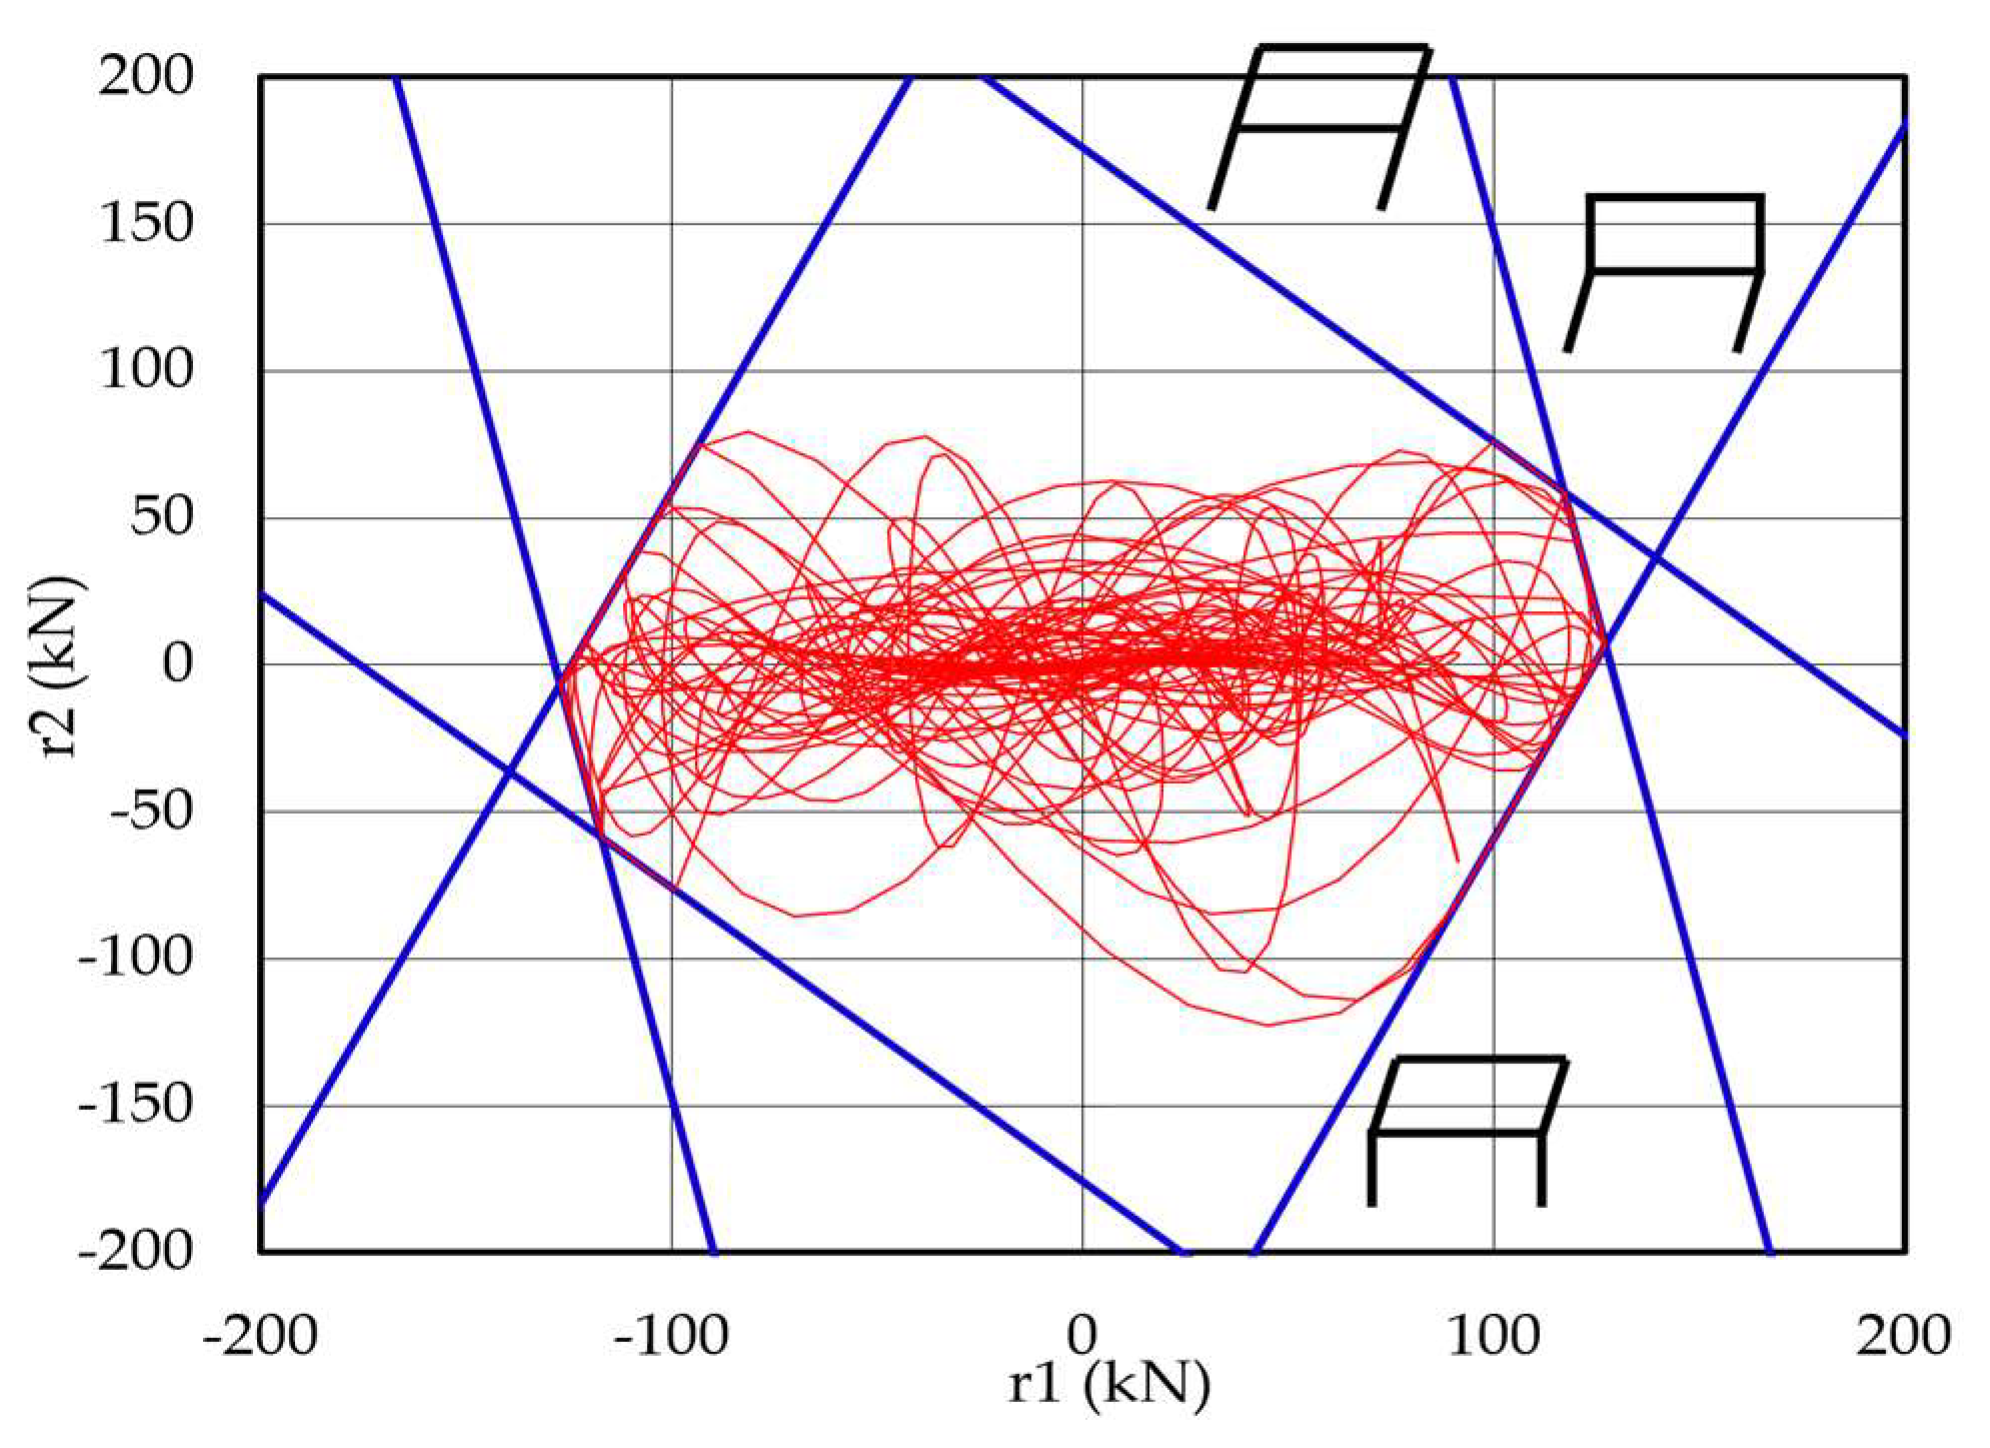
The limit analysis results indicate that the primary load pattern leads to the collapse of the first story, the primary + secondary load pattern results in the collapse of the second floor, and the primary + secondary load pattern leads to total collapse. The yield surfaces obtained from the limit analysis overlap, forming a hexagonal-shaped safe region, as shown in
Figure 8, along with its corresponding collapse forms. Additionally, the mode restoring force trajectory is presented.
4. Results
The results of the simplified response analysis using the hexagonal model were compared with data obtained from a detailed seismic response numerical experiment using SAP2000, to assess the accuracy and applicability of the method.
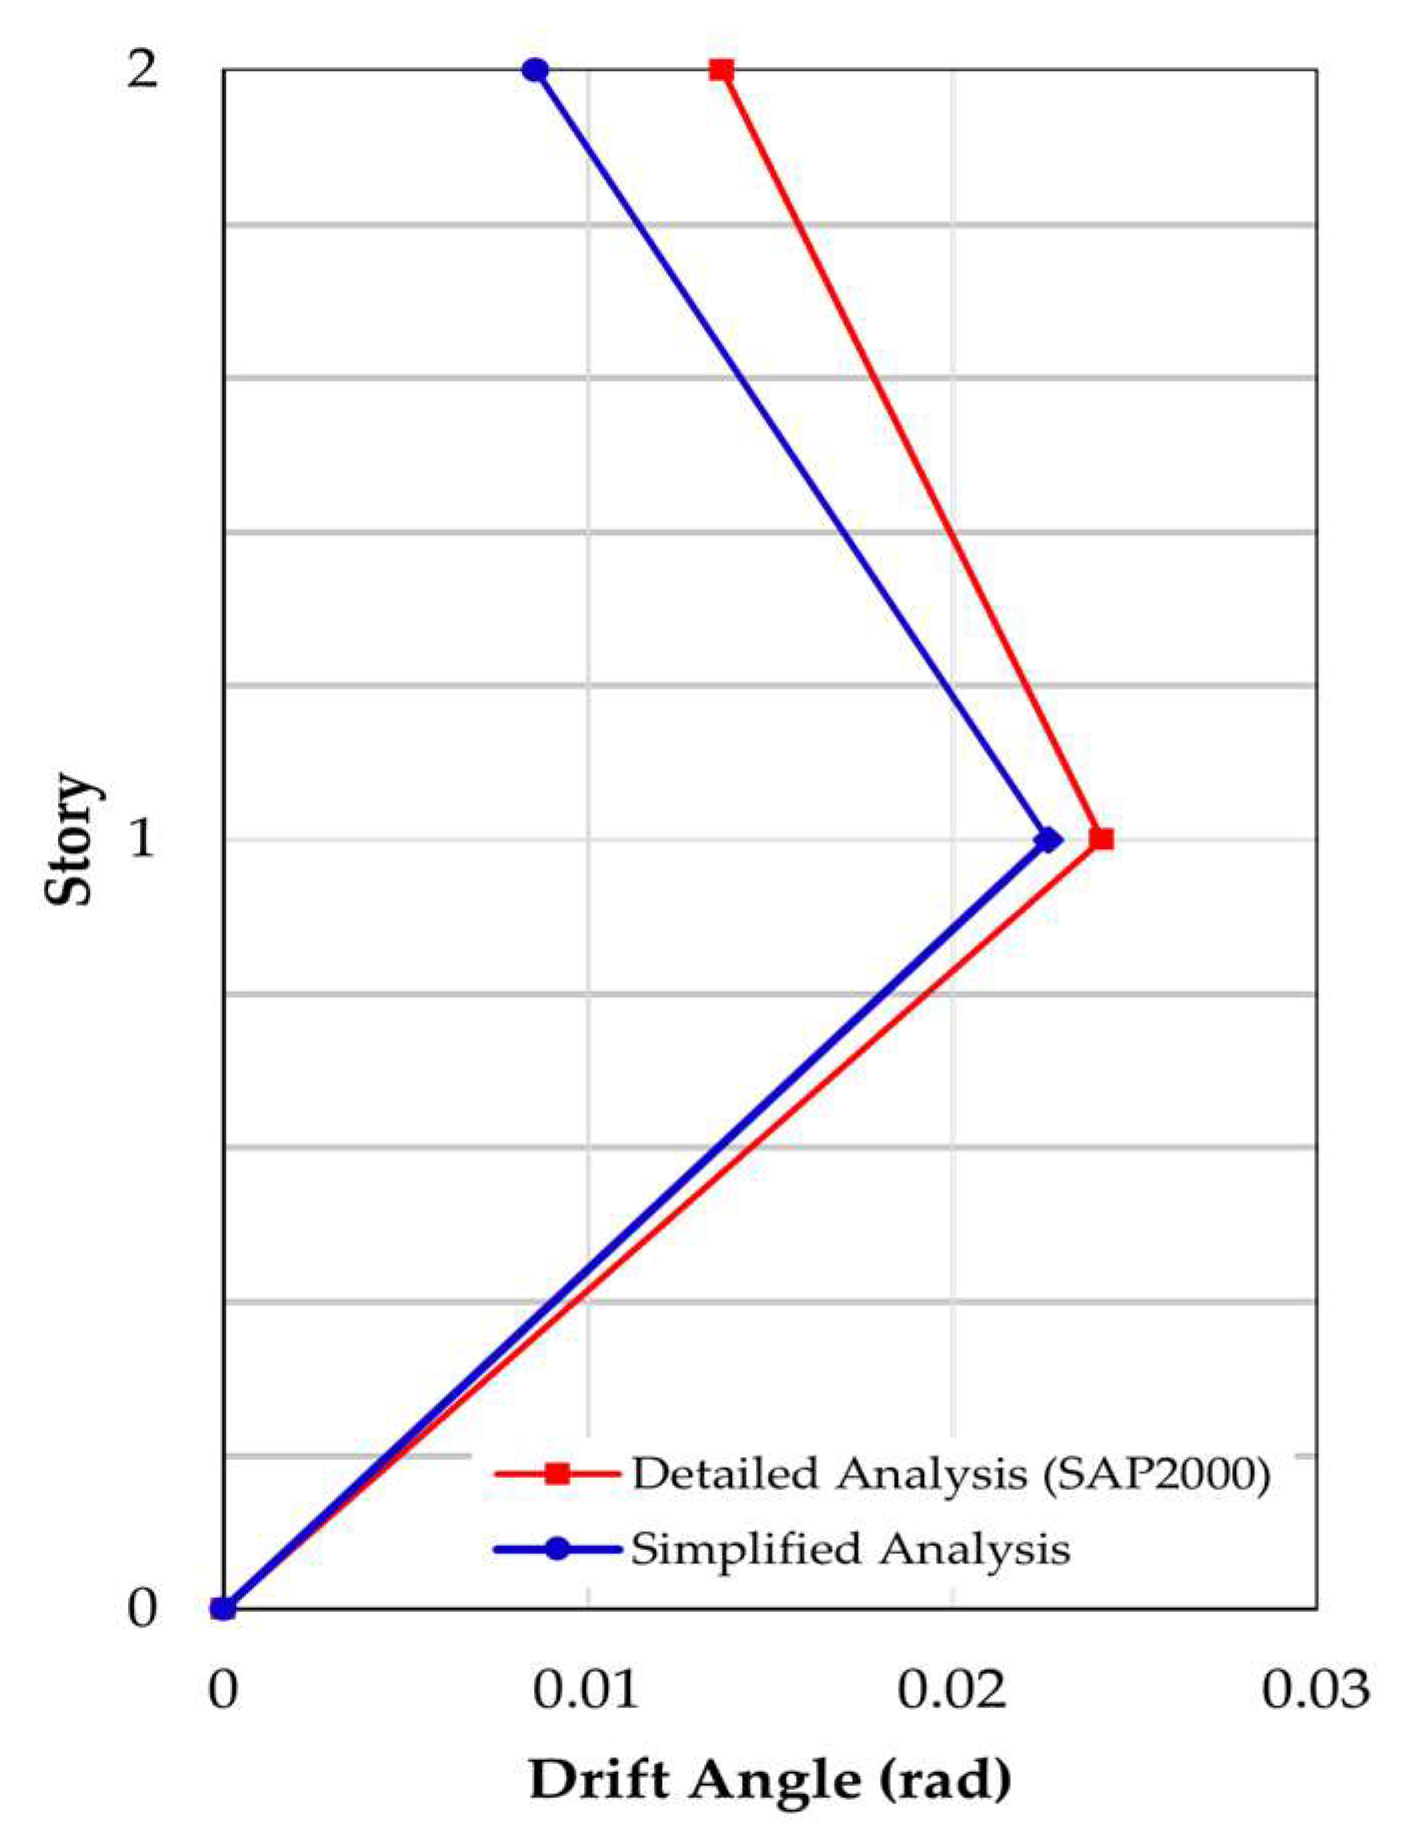
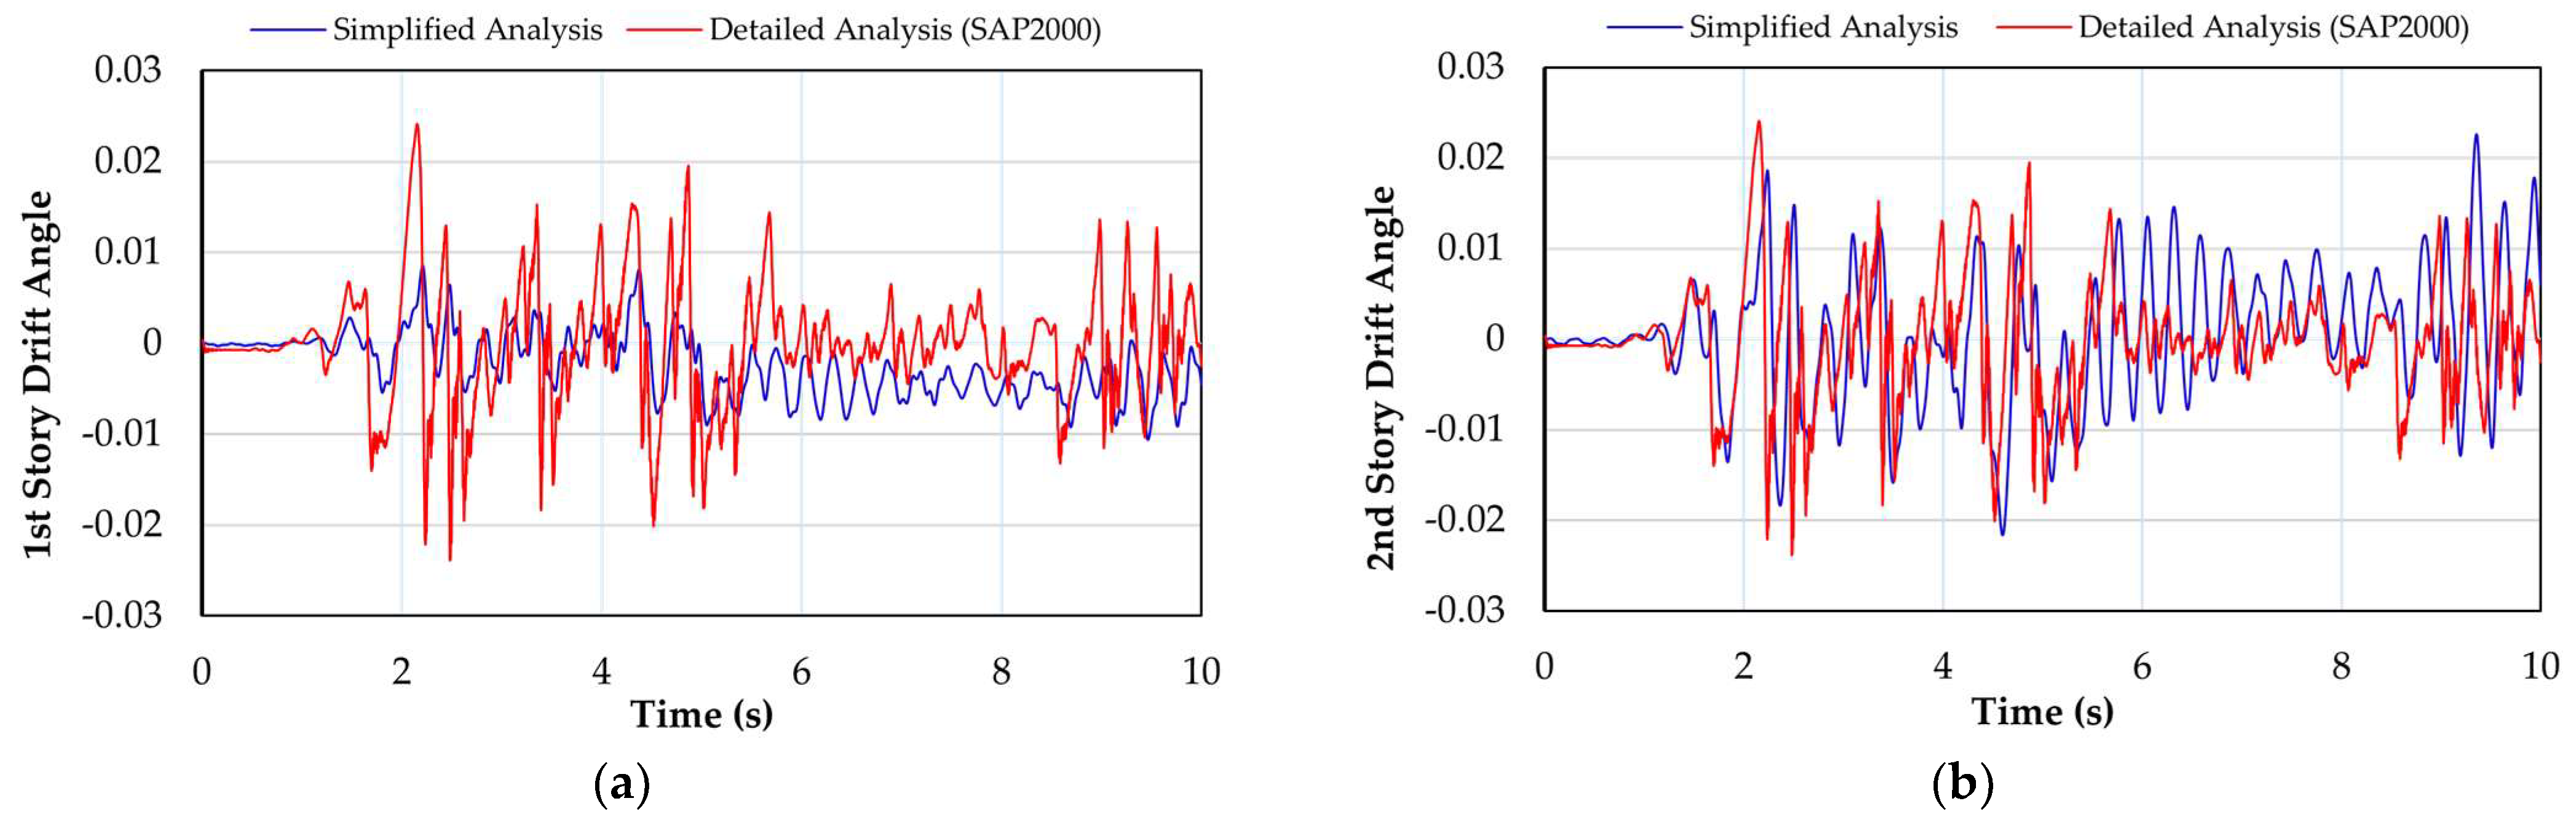
Figure 9 compares story drift, while
Figure 10 presents the time history of the story drift between the simplified analysis using the proposed simplified technique and SAP2000 nonlinear time–history analysis.
Story Drift and Time History Comparison
The comparison result of story drift shows that the simplified response analysis corresponds well with the collapse mechanism observed in the numerical experimental results. The results from both the simplified response analysis and the detailed experimental results closely match, confirming the method’s effectiveness in capturing the seismic behavior of the structure. However, simplified response analysis assumes elastic behavior within the safe region, resulting in slightly smaller response values compared to the experimental results.
The simplified response analysis successfully predicts the time of plasticization, which was observed at approximately 1.4 s in the hexagonal model. The comparison results show that the simplified response analysis predicts the time at which each story undergoes plasticization, and the results are in good agreement with the numerical experimental results.
5. Comparative Analysis Between Simplified and Detailed Response Analysis on Mid-Rise Frame
To examine the consistency of the proposed SNDA technique, a detailed seismic response analysis was performed using SAP2000 on a realistic multi-story framework comprising a total of a nine-story three-bay frame structure (
Figure 11).
5.1. Description of the Test Structure
The H-125 × 125 × 6.5 × 9.0 structural members of the modeled frame use SS400 steel, with a yield strength of 348 N/mm2. Assuming all the member joints are rigid, the height and mass of each story are kept constant.
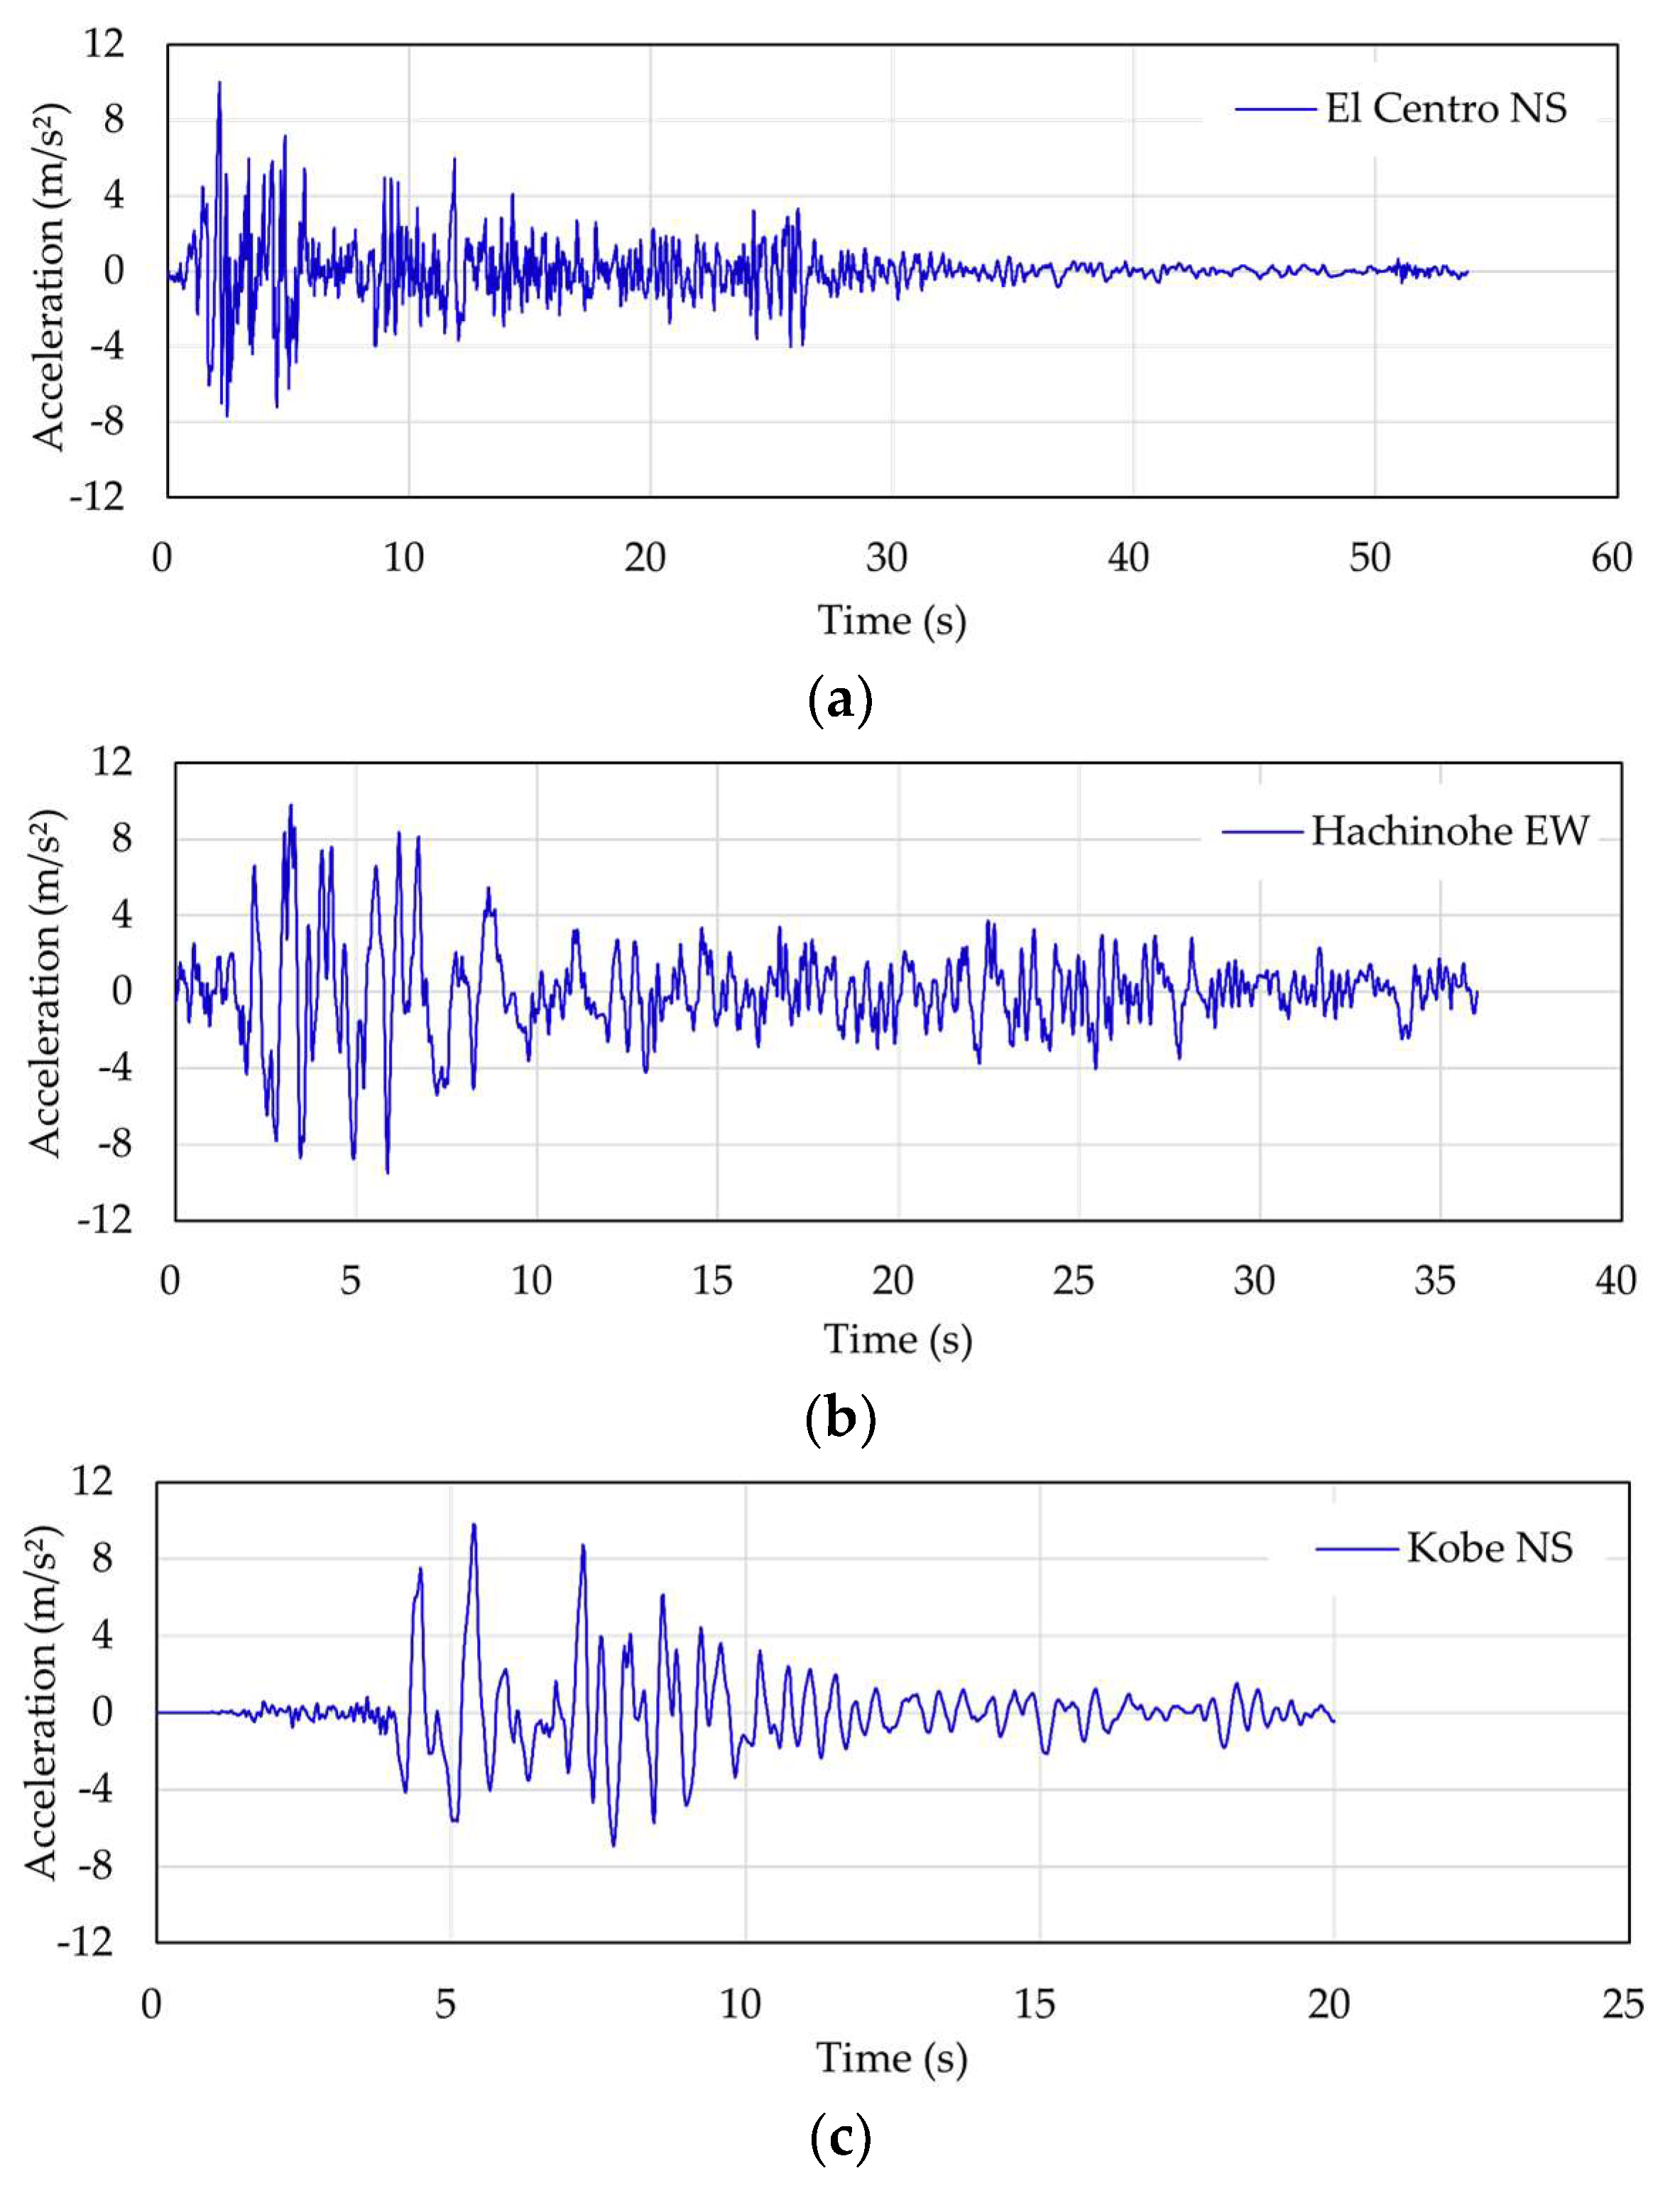
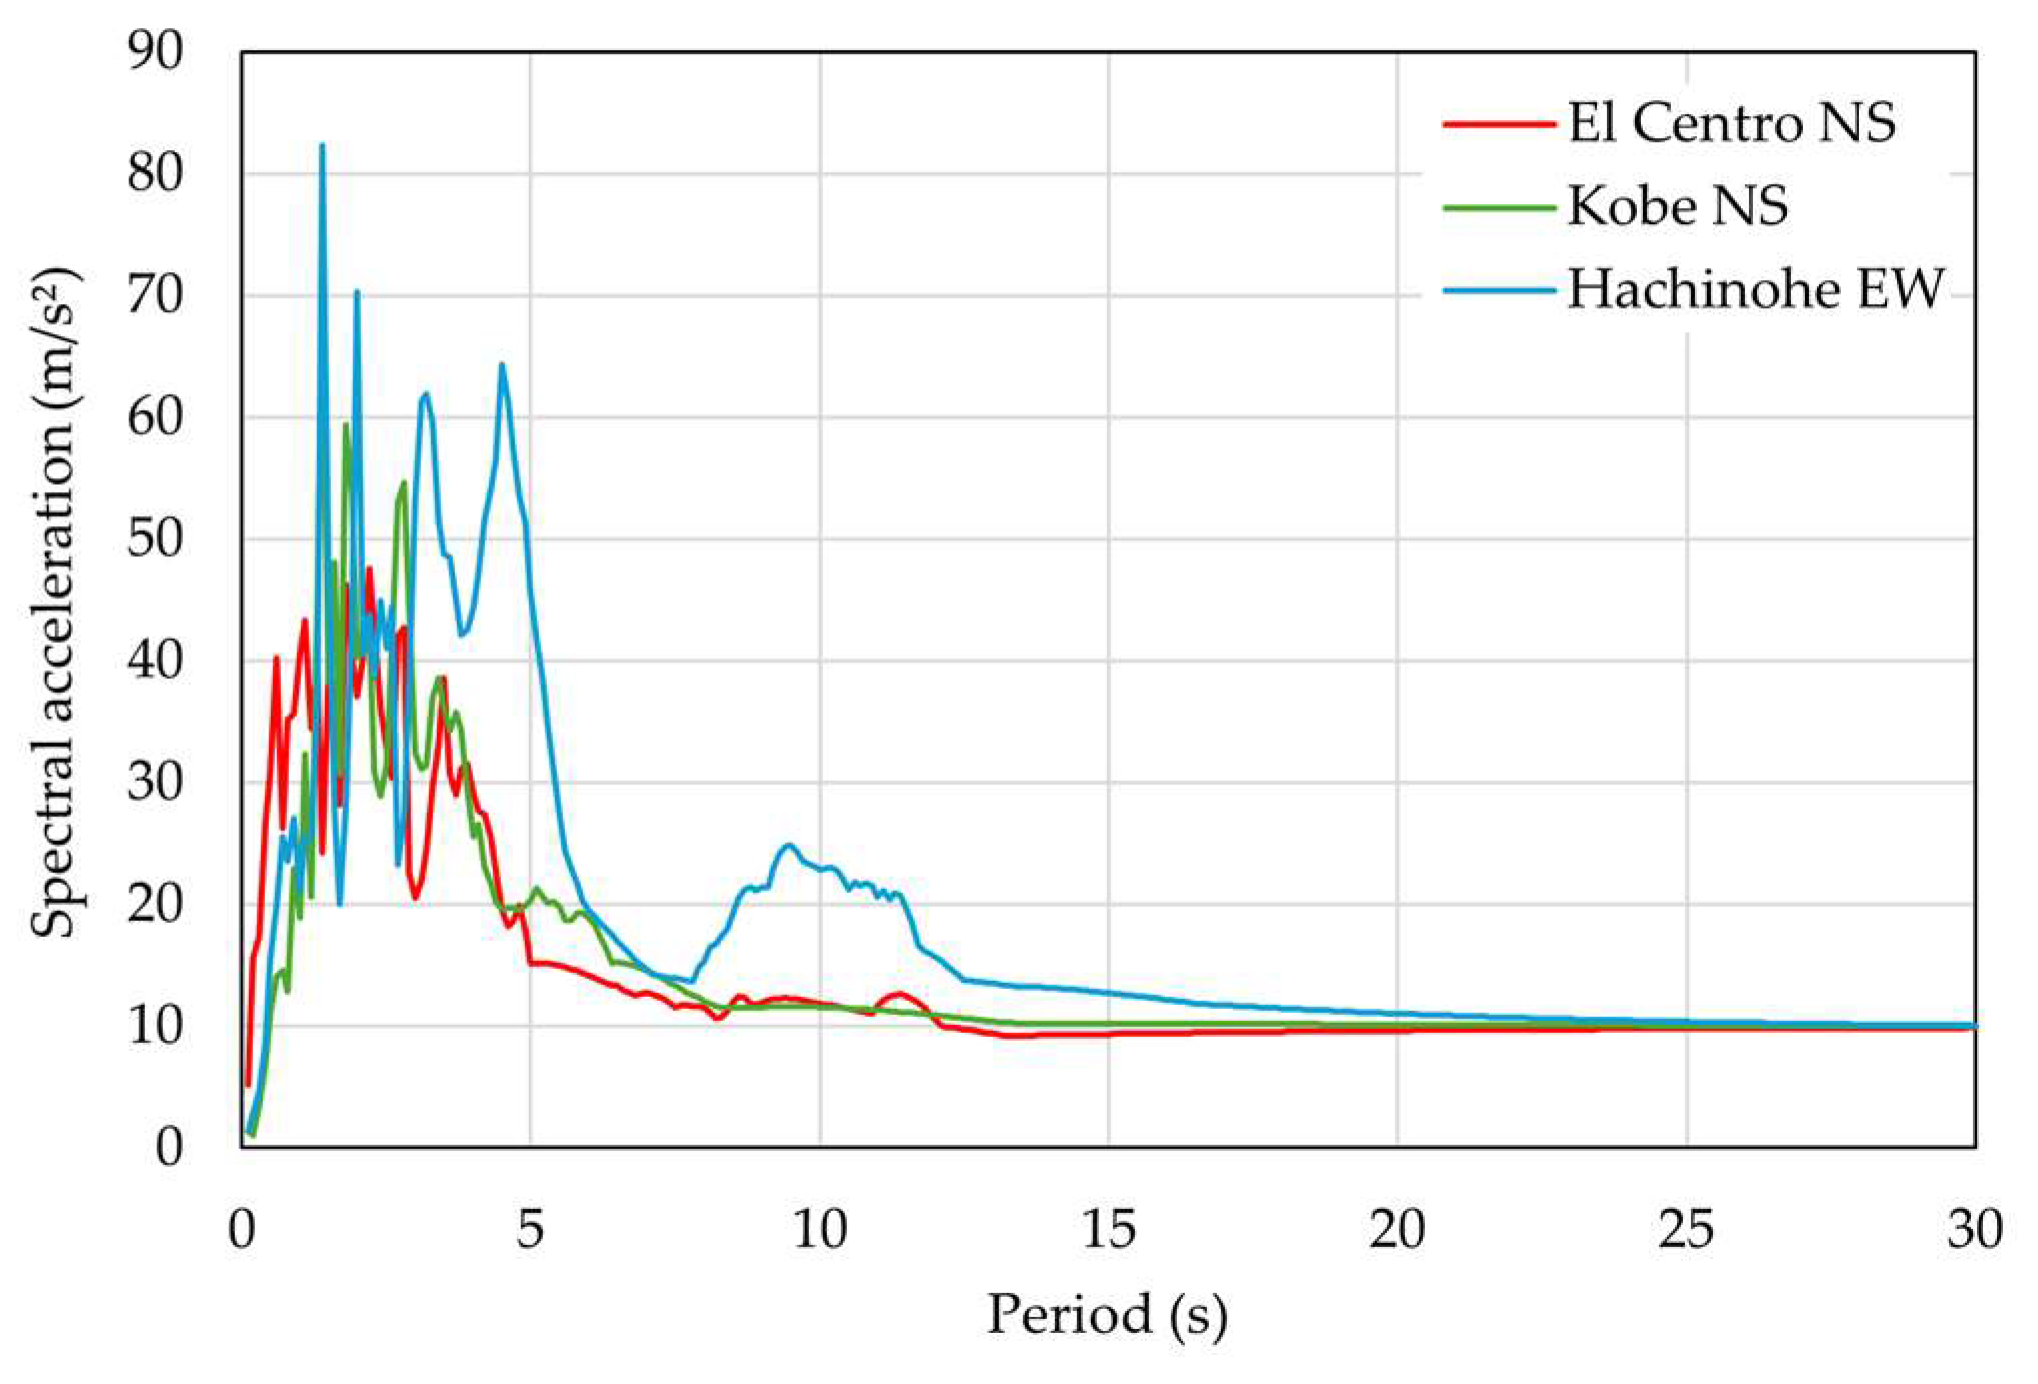
To investigate the effects of different ground motions with varying periods on the consistency of the SDNA method, three seismic waves were utilized, each with a different duration of ground motion: El Centro 1940 NS (53 s), Hachinohe 1968 EW (60 s), and Kobe 1995 NS (20 s).
Figure 12 illustrates the ground acceleration time history, while
Figure 13 shows the corresponding acceleration response spectra with a 2% damping ratio h.
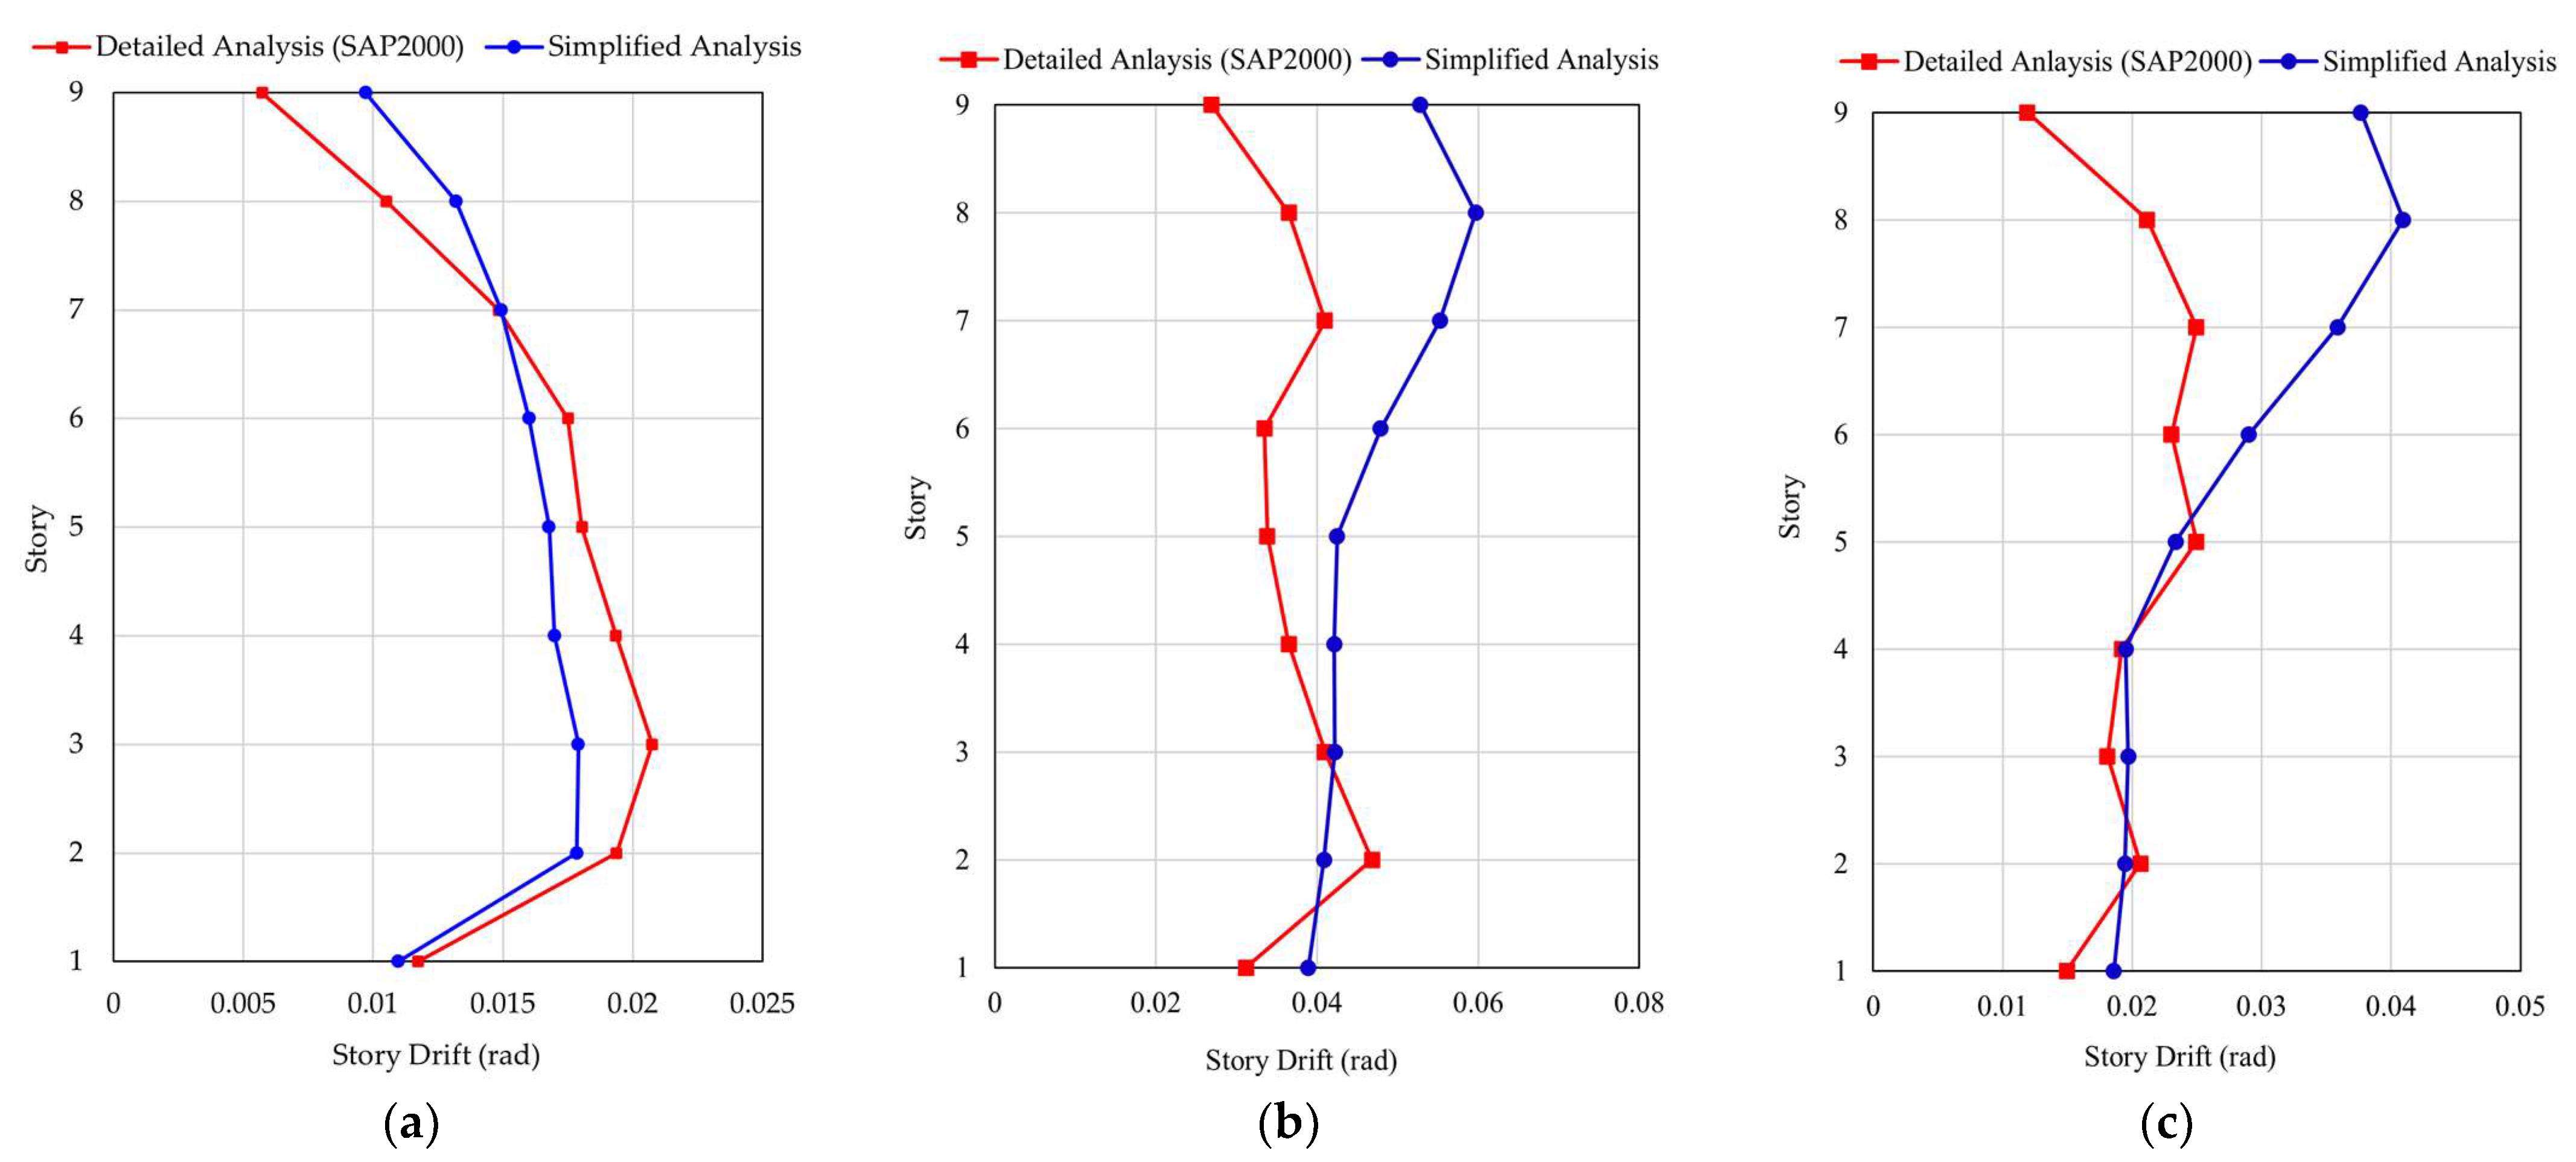
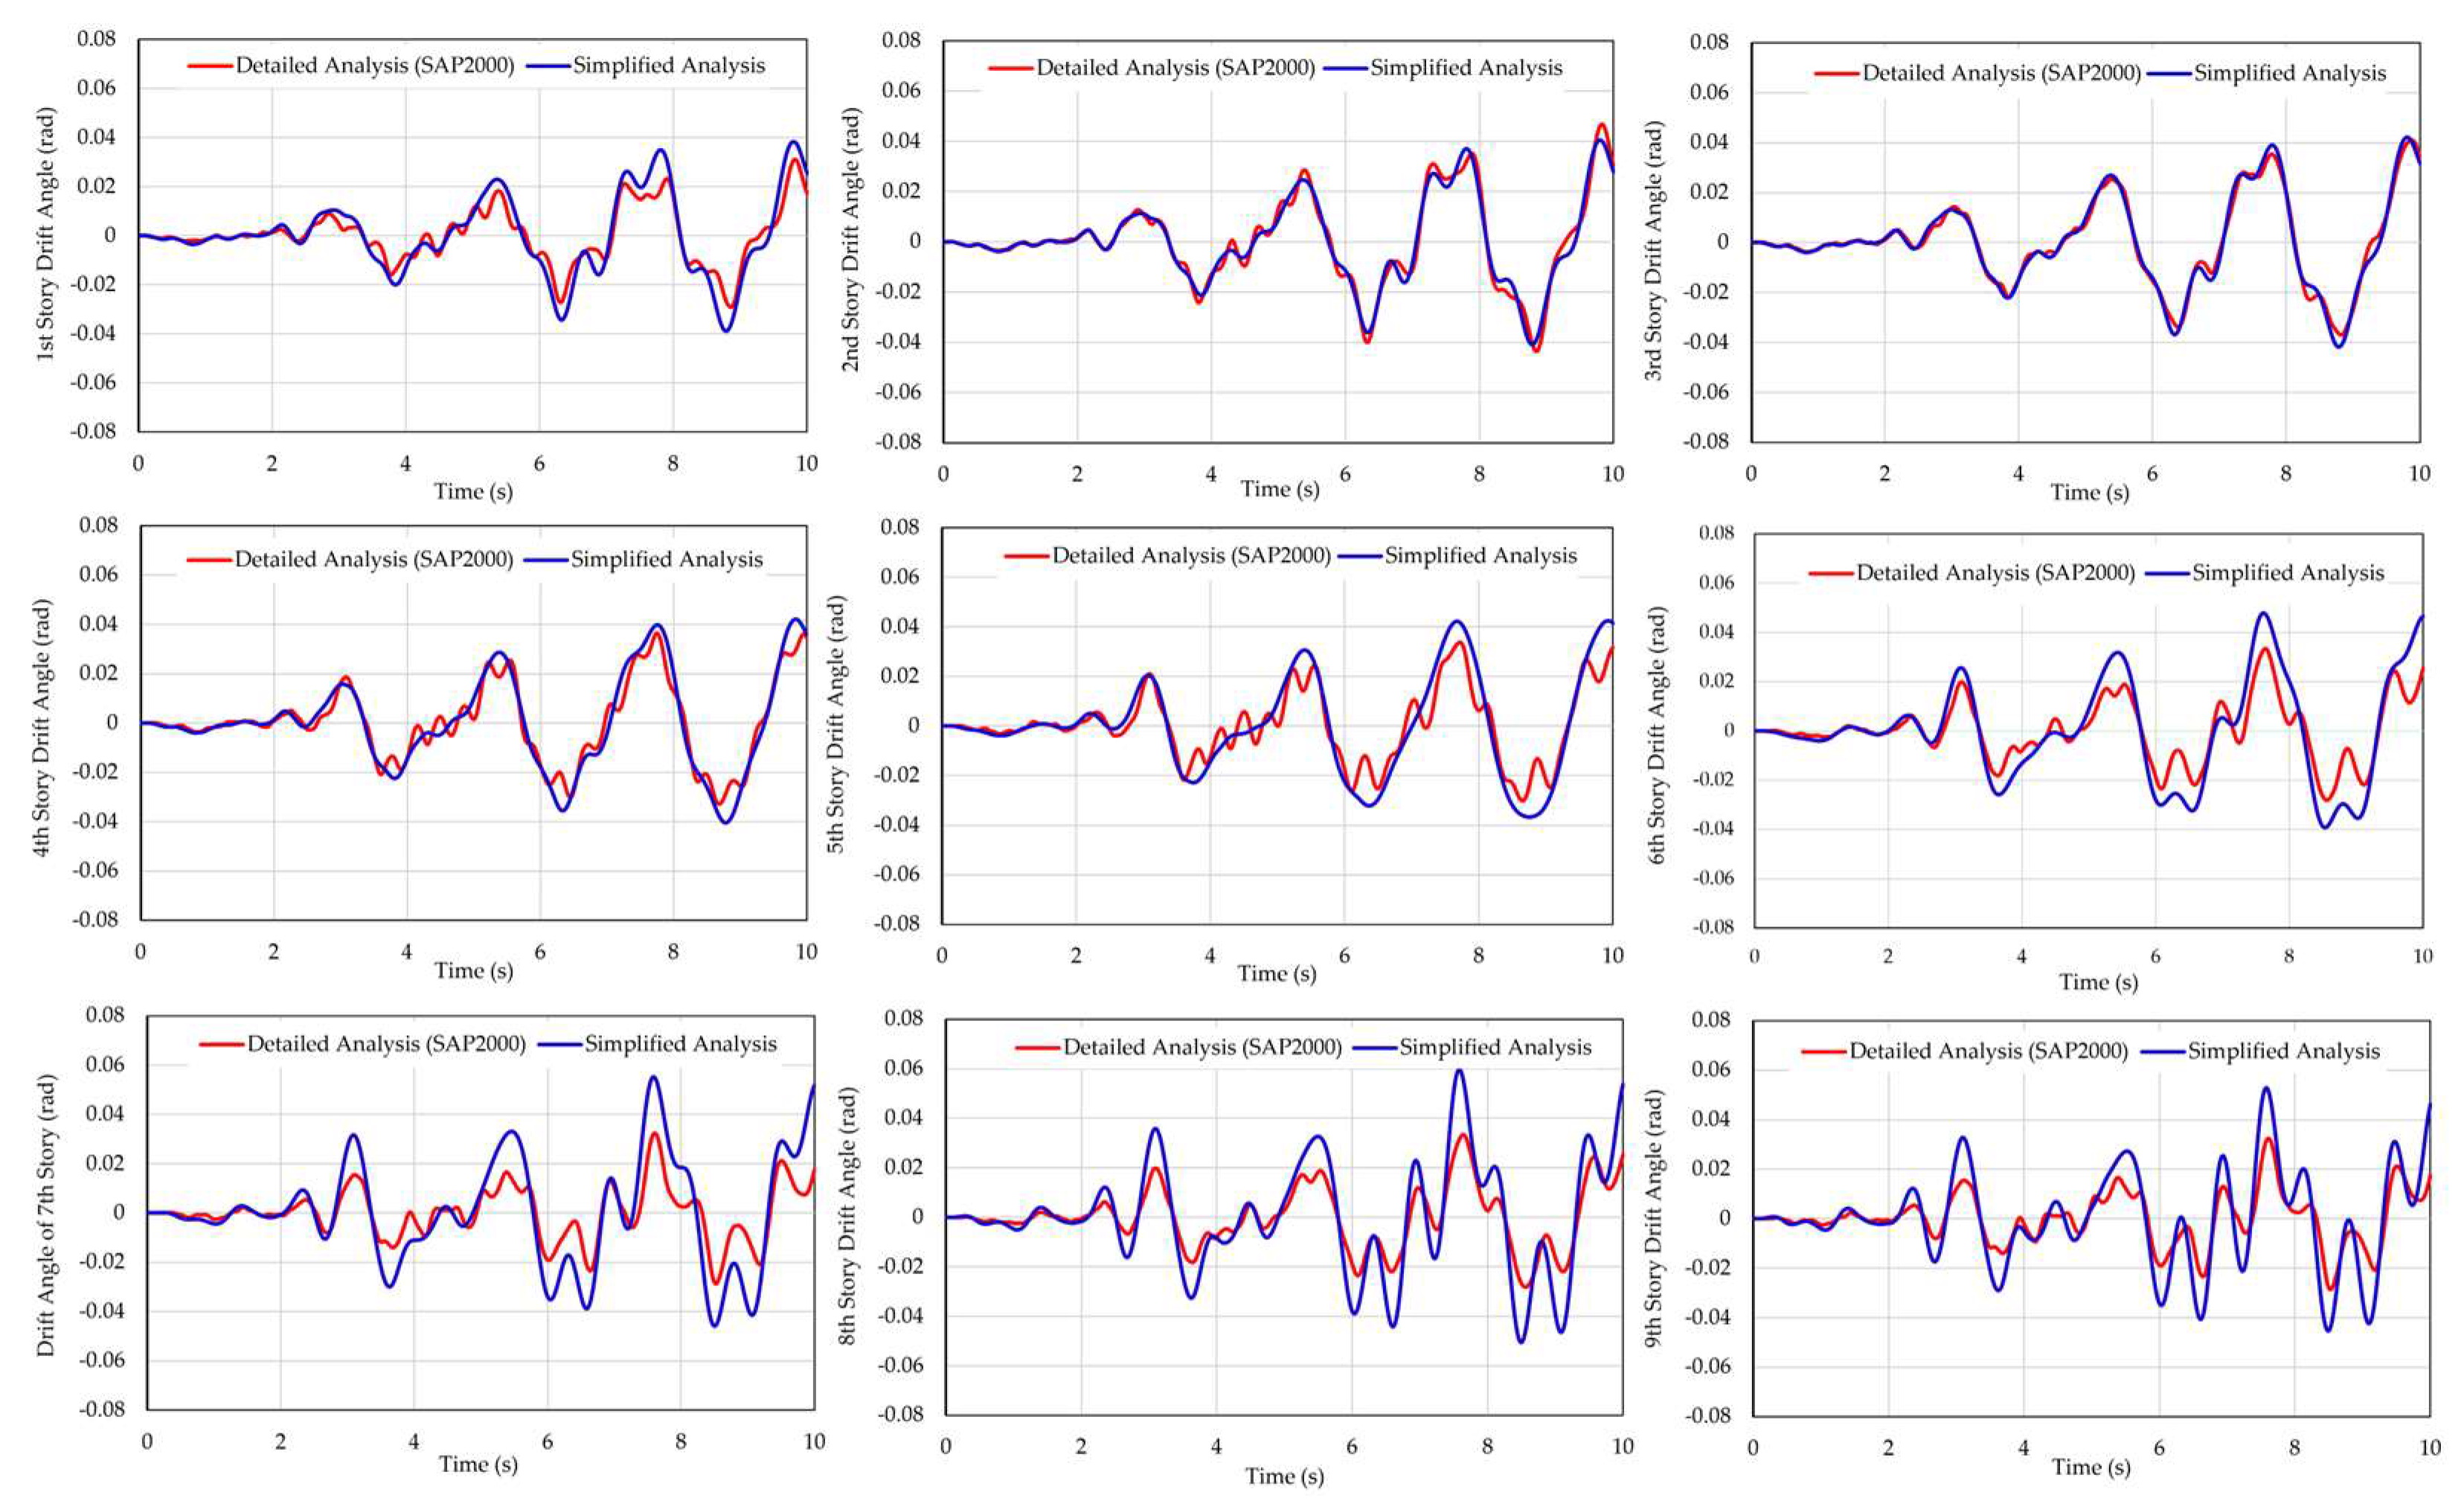
5.2. Results of the Story Drift and Time History Comparision
Figure 14 demonstrates the comparison between the maximum story drift in simplified and detailed response analyses, while the comparisons of the time history of story drift using the three ground motion inputs are illustrated in
Figure 15,
Figure 16 and
Figure 17. Overall, the simplified method demonstrated a good ability to capture the general seismic behavior of the structure. The global trends in dynamic response, including the timing and shape of the drift profiles, closely aligned with those from the detailed analysis. However, the simplified approach tended to slightly overestimate displacements, particularly in the upper stories.
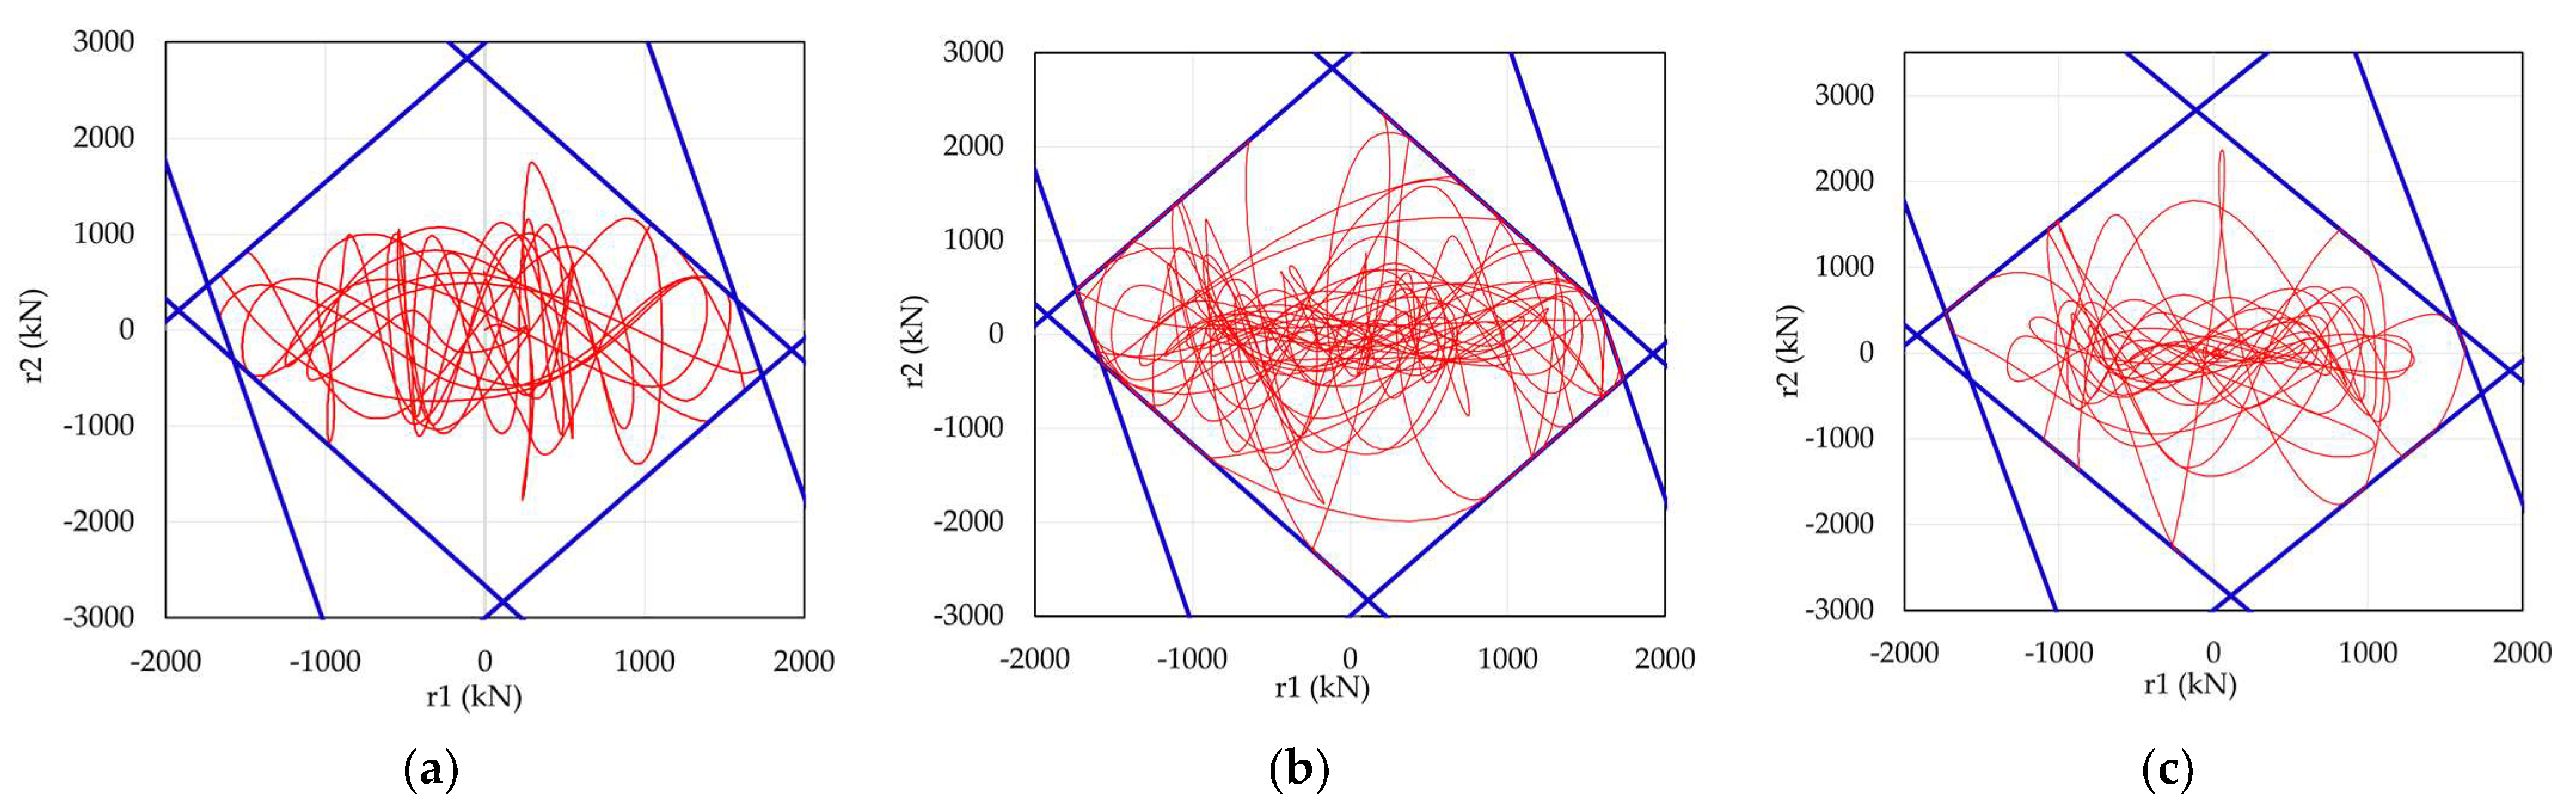
Figure 18 illustrates the variation in the restoring force trajectories under different ground motions input, plotted against the hexagonal model, which represents the plastic collapse surface derived from limit analysis. The space within the hexagonal yield surface defines the elastic domain—when the restoring force remains within this region, the structure is assumed to behave elastically. However, once the trajectory reaches or lies along any of the boundary lines, the structure yields and enters a plastic state.
Each line of the hexagonal model corresponds to one of the three load patterns discussed previously in
Section 2.1.3. Therefore, the specific boundary that the trajectory intersects provides insight into which load combination is contributing to the plastic deformation. By observing the points at which the trajectory touches or follows a particular edge, it becomes possible to identify the governing collapse mechanism of the frame.
6. Discussion
The results of this study provide valuable insights into the application of the hexagonal plastic collapse surface model for simplified seismic response analysis in multi-story structures. The comparison with detailed seismic response experiments using SAP2000 shows that the simplified response analysis method performs well, closely matching experimental data in terms of story drift and time history response. This alignment suggests that the hexagonal model offers a robust approximation for predicting seismic behavior, confirming its relevance in structural engineering applications.
Table 2 shows the comparison of story drift values obtained from the simplified and detailed analysis (SAP2000) under three different ground motions: El Centro NS, Hachinohe EW, and Kobe NS. The table also presents the absolute and percentage differences between the two methods at each story level, highlighting the accuracy and limitations of the simplified approach.
However, the simplified approach shows slight overestimation in terms of displacements, particularly in the upper stories. The overestimation is attributed to the assumption of fully elastic behavior within the defined safe region, without accounting for localized plastic deformations prior to the formation of a collapse mechanism.
The SNDA method presented in this study, which considers only the first two modes of vibration, is proven effective for low- to mid-rise structures, where higher modes have a minimal impact on the overall seismic response. This approach provides a computationally efficient and accurate means of capturing the initial seismic behavior and collapse mechanisms within its intended scope.
Table 3 presents the computation time required for each analysis method. SNDA significantly reduced the analysis time from approximately 2 h, required by the detailed SAP2000 analysis, to only 30 min, demonstrating its efficiency for preliminary seismic evaluations.
While the simplified approach may have limitations due to partial consideration of vibration modes, the response to shorter-period ground motion (El Centro NS) demonstrates that the method can provide accurate predictions, even when higher modes are neglected. This is because the simplified model captures the predominant energy in the lower modes, which are more influential for shorter-period motions. The overall deformation pattern, energy dissipation characteristics, and drift distribution are more reliably captured, although slight overestimations in upper-story displacements may still occur due to the assumption of elastic behavior up to the defined yield surface.
Moreover, for ground motions that exhibit a broader frequency range (Kobe NS), the simplified method demonstrated an increase in upper-story response discrepancies. Although relatively short in duration, the high-amplitude Kobe NS earthquake’s ground motion has significant energy concentrated in both low and high frequencies, which demonstrates a very complex frequency characteristic. The inconsistencies may result from the model’s limited ability to reflect higher-mode contributions, which is captured more precisely in the detailed SAP2000 simulations. The simplified model’s assumption of partial mode elastic behavior likely limits its precision when more complex, localized inelastic responses occur.
Additionally, the bilinear model in detailed analysis can better absorb and distribute seismic energy, leading to more restrained displacements. While SNDA captures overall collapse mechanisms and yielding sequences, the differences in hysteresis modeling can lead to overestimated drifts and understated energy dissipation, especially in complex seismic scenarios.
Furthermore, the material modeling differences between detailed and SDNA notably affect seismic response results. In SAP2000, a bilinear hysteresis model with post-yield stiffness is used, leading to limited strain hardening behavior in the plastic domain. This approach allows for a gradual transition from elastic to plastic behavior and more accurate energy dissipation during cyclic loading, leading to a more distributed and progressive yielding pattern across the structure. In contrast, SNDA employs a nonlinear yield surface model assuming perfectly plastic behavior once the yield surface is reached, without post-yield stiffness or hysteretic degradation. This idealization simplifies the modeling process but may lead to a more concentrated distribution of plasticity.
Despite these limitations, the simplified response analysis successfully predicted the timing of plasticization, which was observed in the comparative analysis results. This finding aligns well with the experimental results, showing that the method can provide reliable predictions in terms of when the structure reaches its plastic state. This result further reinforces the practicality of the model in real-world applications, where time-sensitive decision-making is often required during seismic events.
While the hexagonal model performs well in capturing the overall collapse mechanism, further refinement is needed to improve its accuracy in capturing localized plasticization. Ground motion like Kobe’s earthquake highlighted the importance of considering multi-mode vibration and nonlinear effects in the seismic design of structures. The earthquake’s behavior challenged the traditional single-mode assumption often used in early seismic design methods and reinforced the need for more accurate models that consider higher-mode effects, plastic deformation, and dynamic interaction between different structural components.
Based on the formation of hexagonal models, the SDNA method not only helps confirm whether the structural behavior aligns with the predicted collapse modes but also offers a practical way to interpret complex inelastic behavior under dynamic loading. The proposed analysis demonstrates that the simplified response approach can effectively trace and reflect the plastic response patterns observed in more detailed simulations.
7. Conclusions
This study demonstrates the effectiveness of the hexagonal plastic collapse surface model for seismic response analysis of multi-degree-of-freedom (MDOF) structures, providing a comprehensive approach to evaluating seismic performance in multistory frames. The simplified nonlinear dynamic analysis (SNDA) proposed herein integrates limit analysis with static proportional loading, enabling the definition of an internal safety zone within the mode restoring force space. By incorporating multiple vibration modes, the model enhances the accuracy of elastic–plastic behavior predictions under seismic conditions, especially for complex structural systems.
Previous studies have demonstrated the effectiveness of simplified models for seismic analysis, yet most of these models have been limited by assumptions of single-mode behavior or elastic responses. The approach presented in this study expands on these methods by incorporating higher vibration modes and allowing for multi-mode collapse mechanisms. This advancement addresses a critical gap in the analysis of MDOF structures, as the consideration of higher modes is essential for accurately modeling seismic responses, especially in buildings where higher-order modes significantly influence the response.
Comparative evaluations between experimental data and SAP2000 dynamic time-history analysis validate the model’s predictive capabilities, with results showing strong alignment in deformation response trends. The results of the comparative analysis showed that simplified response analysis tends to generate a slightly larger value compared to detailed analysis, mainly due to the simplified response analysis’s consideration of the partial vibration mode.
Although some discrepancies in the upper stories’ response were noted, the hexagonal model successfully predicted failure mechanisms and provided a practical, computationally efficient framework for collapse prediction. In principle, the comparative analysis justified the practicality of the proposed simplified seismic response analysis in addition to highlighting its possible advancement in effectively capturing higher modes of failure. By employing the simplified plastic collapse surface model, we compared the detailed results of the seismic response analysis at the member level, establishing that the elasto-plastic behavior of global displacement and resilience can be accurately traced. These findings are instrumental in the ongoing pursuit of innovative and reliable analysis methods for multi-story steel frame structures under seismic conditions.
These findings highlight the potential of the hexagonal plastic collapse surface model to improve seismic analysis for MDOF structures, offering a promising tool for optimizing structural design and resilience against seismic events. Further research should focus on expanding the model to address its limitations in presenting local failure mechanisms and interactions between multiple modes, particularly for structures with irregular geometry or complex characteristics. Future studies could also explore the hexagonal model’s applicability to irregular structures to evaluate its performance in capturing the unique seismic behaviors of various configurations. Moreover, the observed variations in story drift results indicate the potential for identifying the model’s limitations and enhancing its accuracy, notably with respect to various ground motion characteristics. Furthermore, the proposed method was validated using a widely recognized nonlinear analysis tool, and while the results may vary with other tools such as OpenSees and ETABS, future research could further strengthen the findings by comparing the performance of the method across a broader range of analysis platforms.


